Mixture Proportion Design Method of Steel Fiber Reinforced Recycled Coarse Aggregate Concrete


Abstract
1. Introduction
- The effect of RCA on concrete strength. RCA may lead to 20–25% decrease in compressive strength compared to NCA with the same mixture proportion [15,16,17,18]. The compressive strength of RCAC depends on the RCA properties and RCA replacement ratio [19,20]. All strength grades of RCA are suitable to produce low strength concrete (20 MPa), but, the production of medium (40 MPa) and high strength (60 MPa) concrete requires the RCA to have a source strength matching or exceeding the strength of the new concrete [3].
- The method to adjust the water content of RCAC. The water absorption and cement mortar of RCA can be reduced by surface modification or pre-soaking methods [7,21], both the pre-saturation method and the mixing water compensation method can be adopted to mix RCAC [22]. For the latter, a two-stage mixing approach divides the mixing process into two parts and proportionally splits the required water into two, this method has been found to improve the strength of RCAC [23,24]. However, the methods mentioned above only make some adjustments of water content in the batching process and do not provide the suitable calculation method for water content of RCAC.
- The equivalent mortar volume method [25]. This method considers RCA as a two-phase material including mortar and NCA. The mixture design principle is the quantity and quality of each phase of RCAC should achieve the same total mortar volume with NCAC, but the calculation process of the method is too complicated to be easily used by engineers. A new mixture design method was put forward by taking into account the higher porosity of RCAs, but now it’s only in conceptual and the RCA replacement ratio can’t reach 100% [26].
2. Materials and Methods
2.1. Materials
2.2. Mixture Proportion Method
- The purpose of the first part was the determination of the steel fiber content. Steel fibers have more significant effect on the flexural strength than compressive strength [33], hence, the volume fraction of steel fiber (Vf) can be determined by the flexural strength achieved. In order to ensure the workability of SFRCAC, for each increase in Vf of 0.5%, the water content is increased by 8 kg/m3 and the sand ratio by 3% [34]. To accurately determine the reinforcement effect of steel fibers on flexural strength, one mixture of the plain concrete without steel fibers made with the same mixture proportion corresponding to each Vf group of SFRCAC was also prepared. The mixture designs used in this part are listed in Table 4.
- The water-cement ratio (W/C) is the parameter influence concrete strength in mixture design. Previous research has shown that using the same W/C, the addition of the steel fiber does significantly improve the compressive strength of concrete after 28 days [35], but RCA may lead to 20–25% decreasing of compressive strength [15]. The properties and replacement ratio of RCA have significant effect on the strength of SFRCAC. The relation between compressive strength (fcu) and W/C was studied in this part; RCA replacement ratio (rg), which is the mass ratio of the RCA to the total coarse aggregate, was taken as 0%, 50% and 100%. Due to the differences in density of NCA and RCA, the quantity of aggregate and sand was increasing with the increase of W/C in the mixing process. The mixture designs used in this part are listed in Table 5.
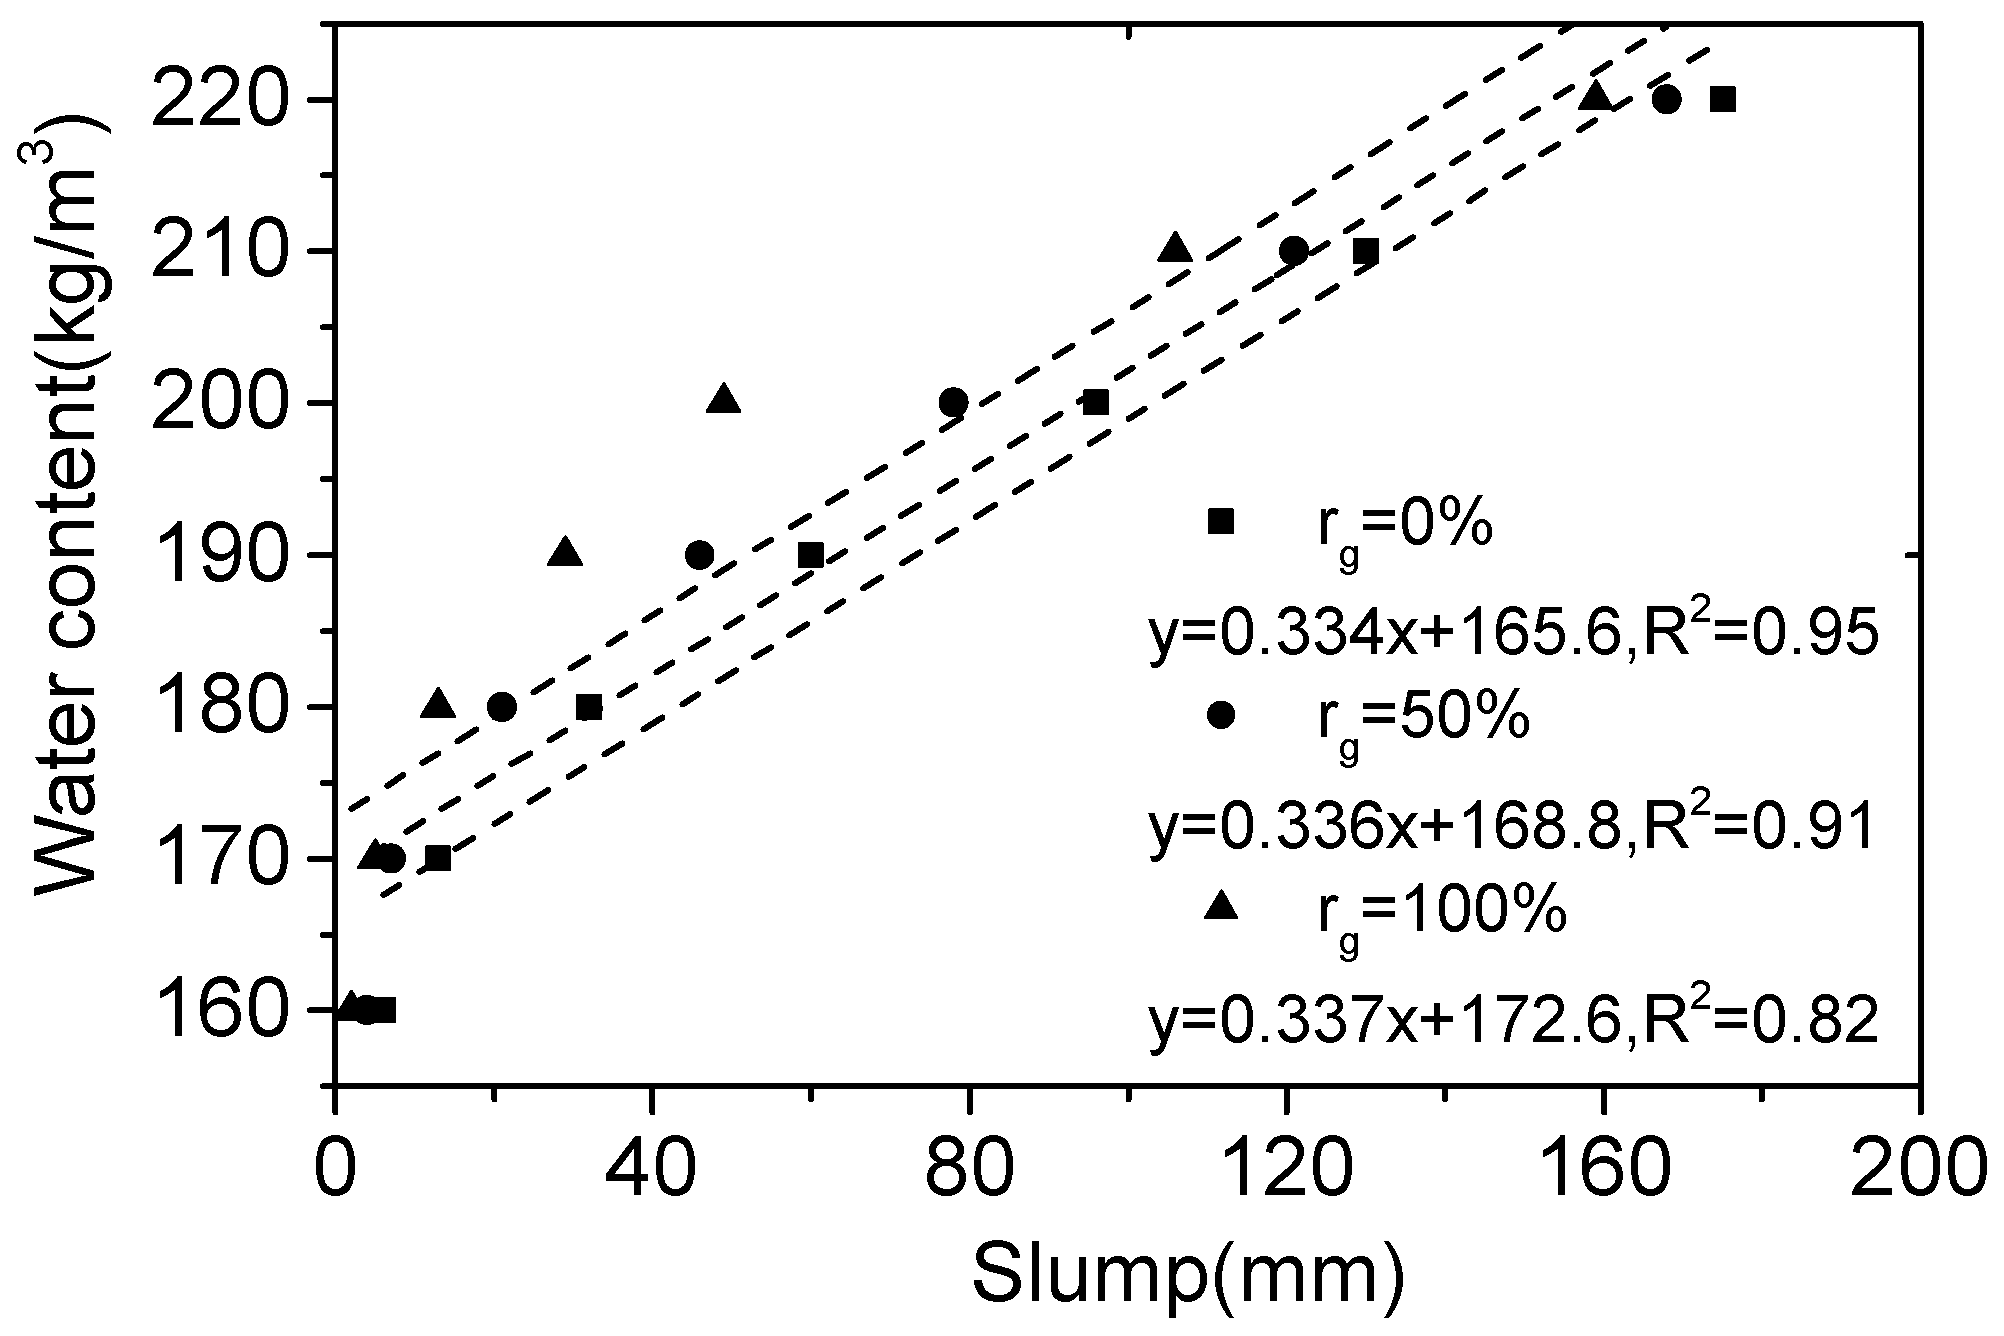
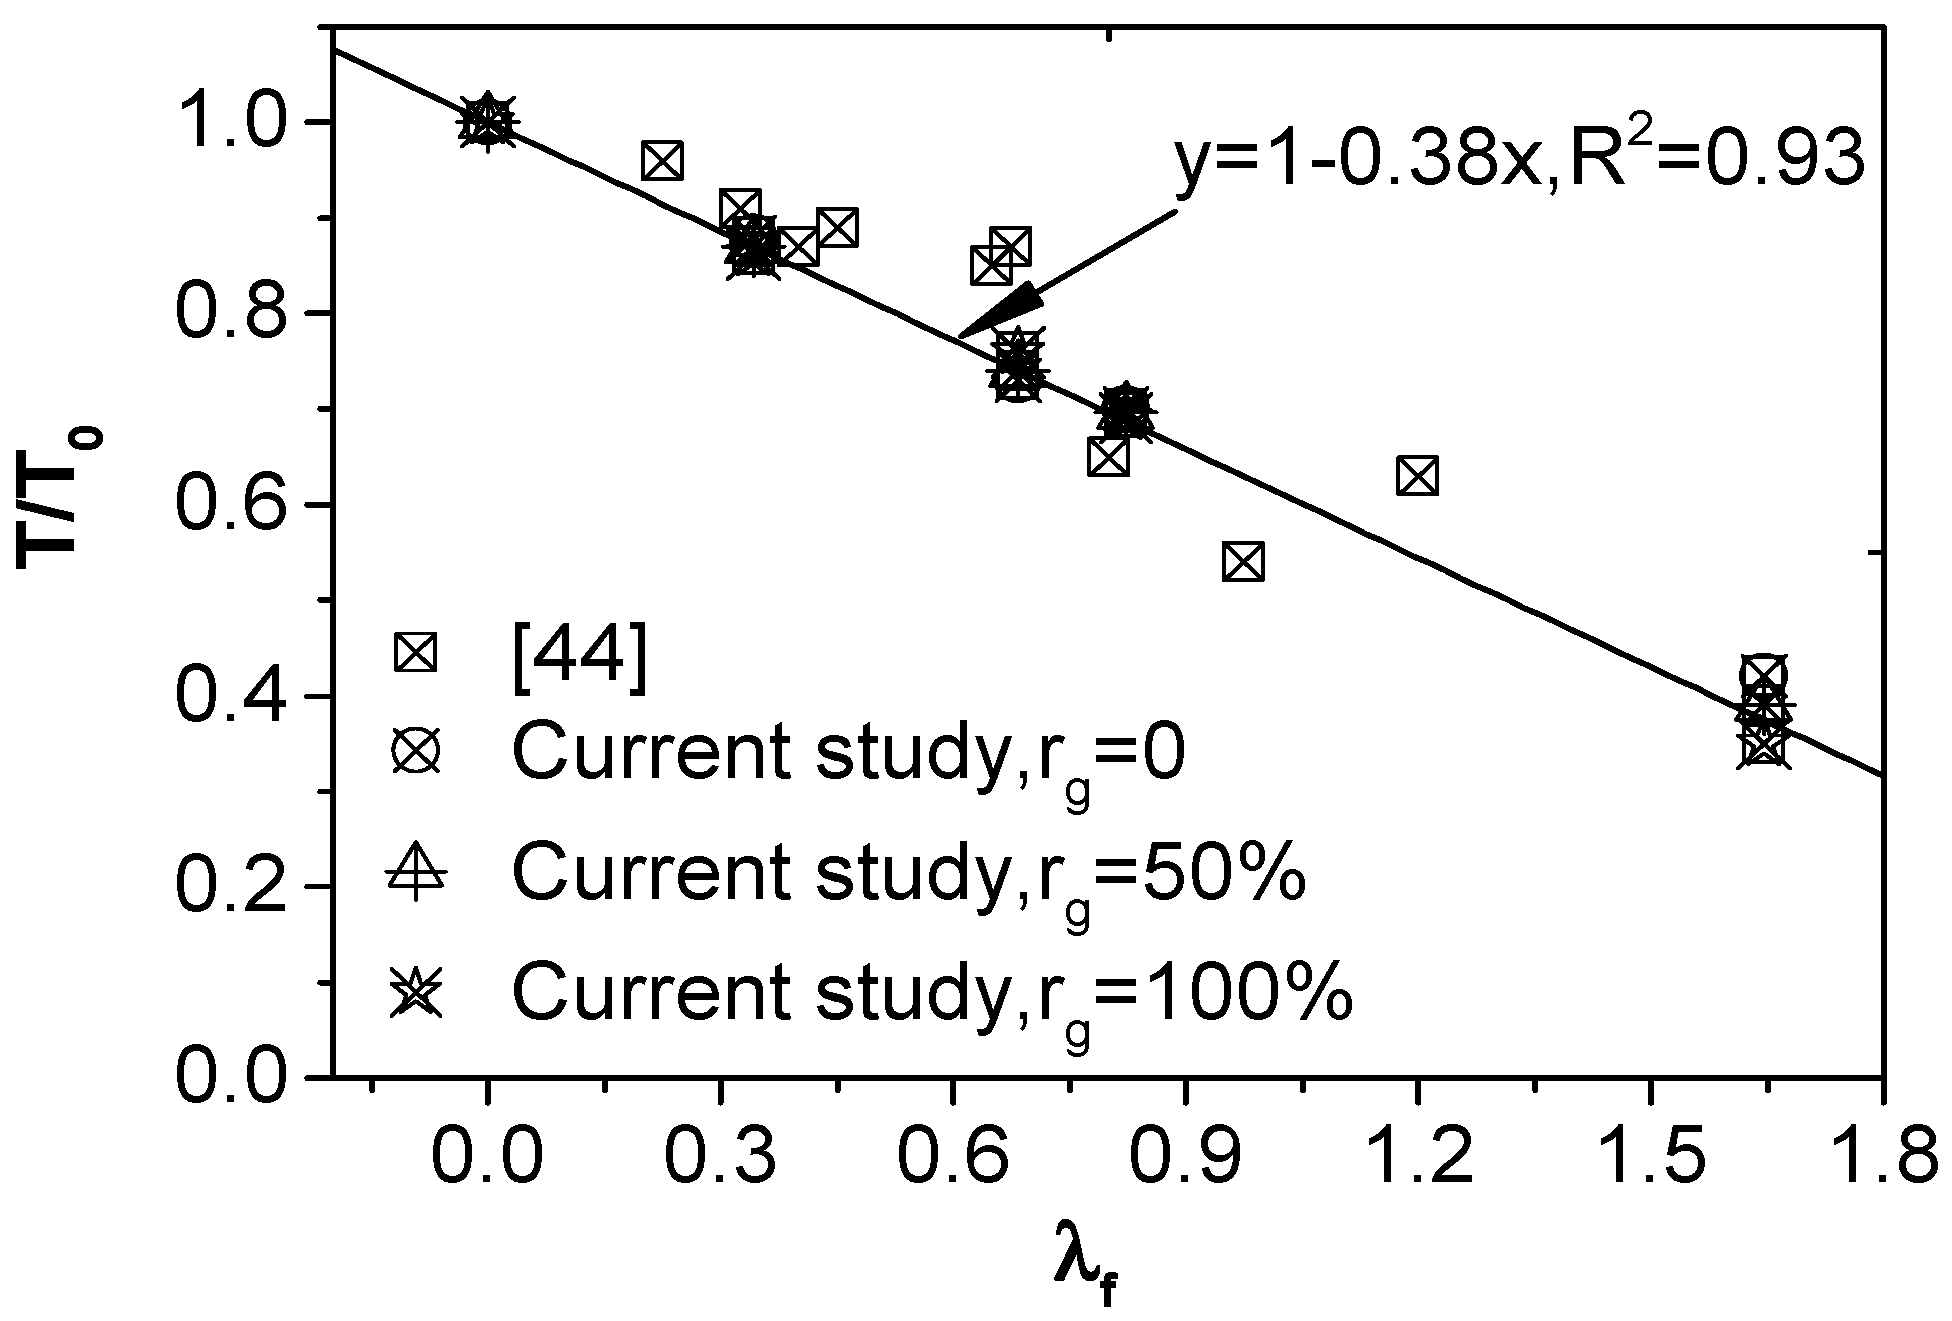
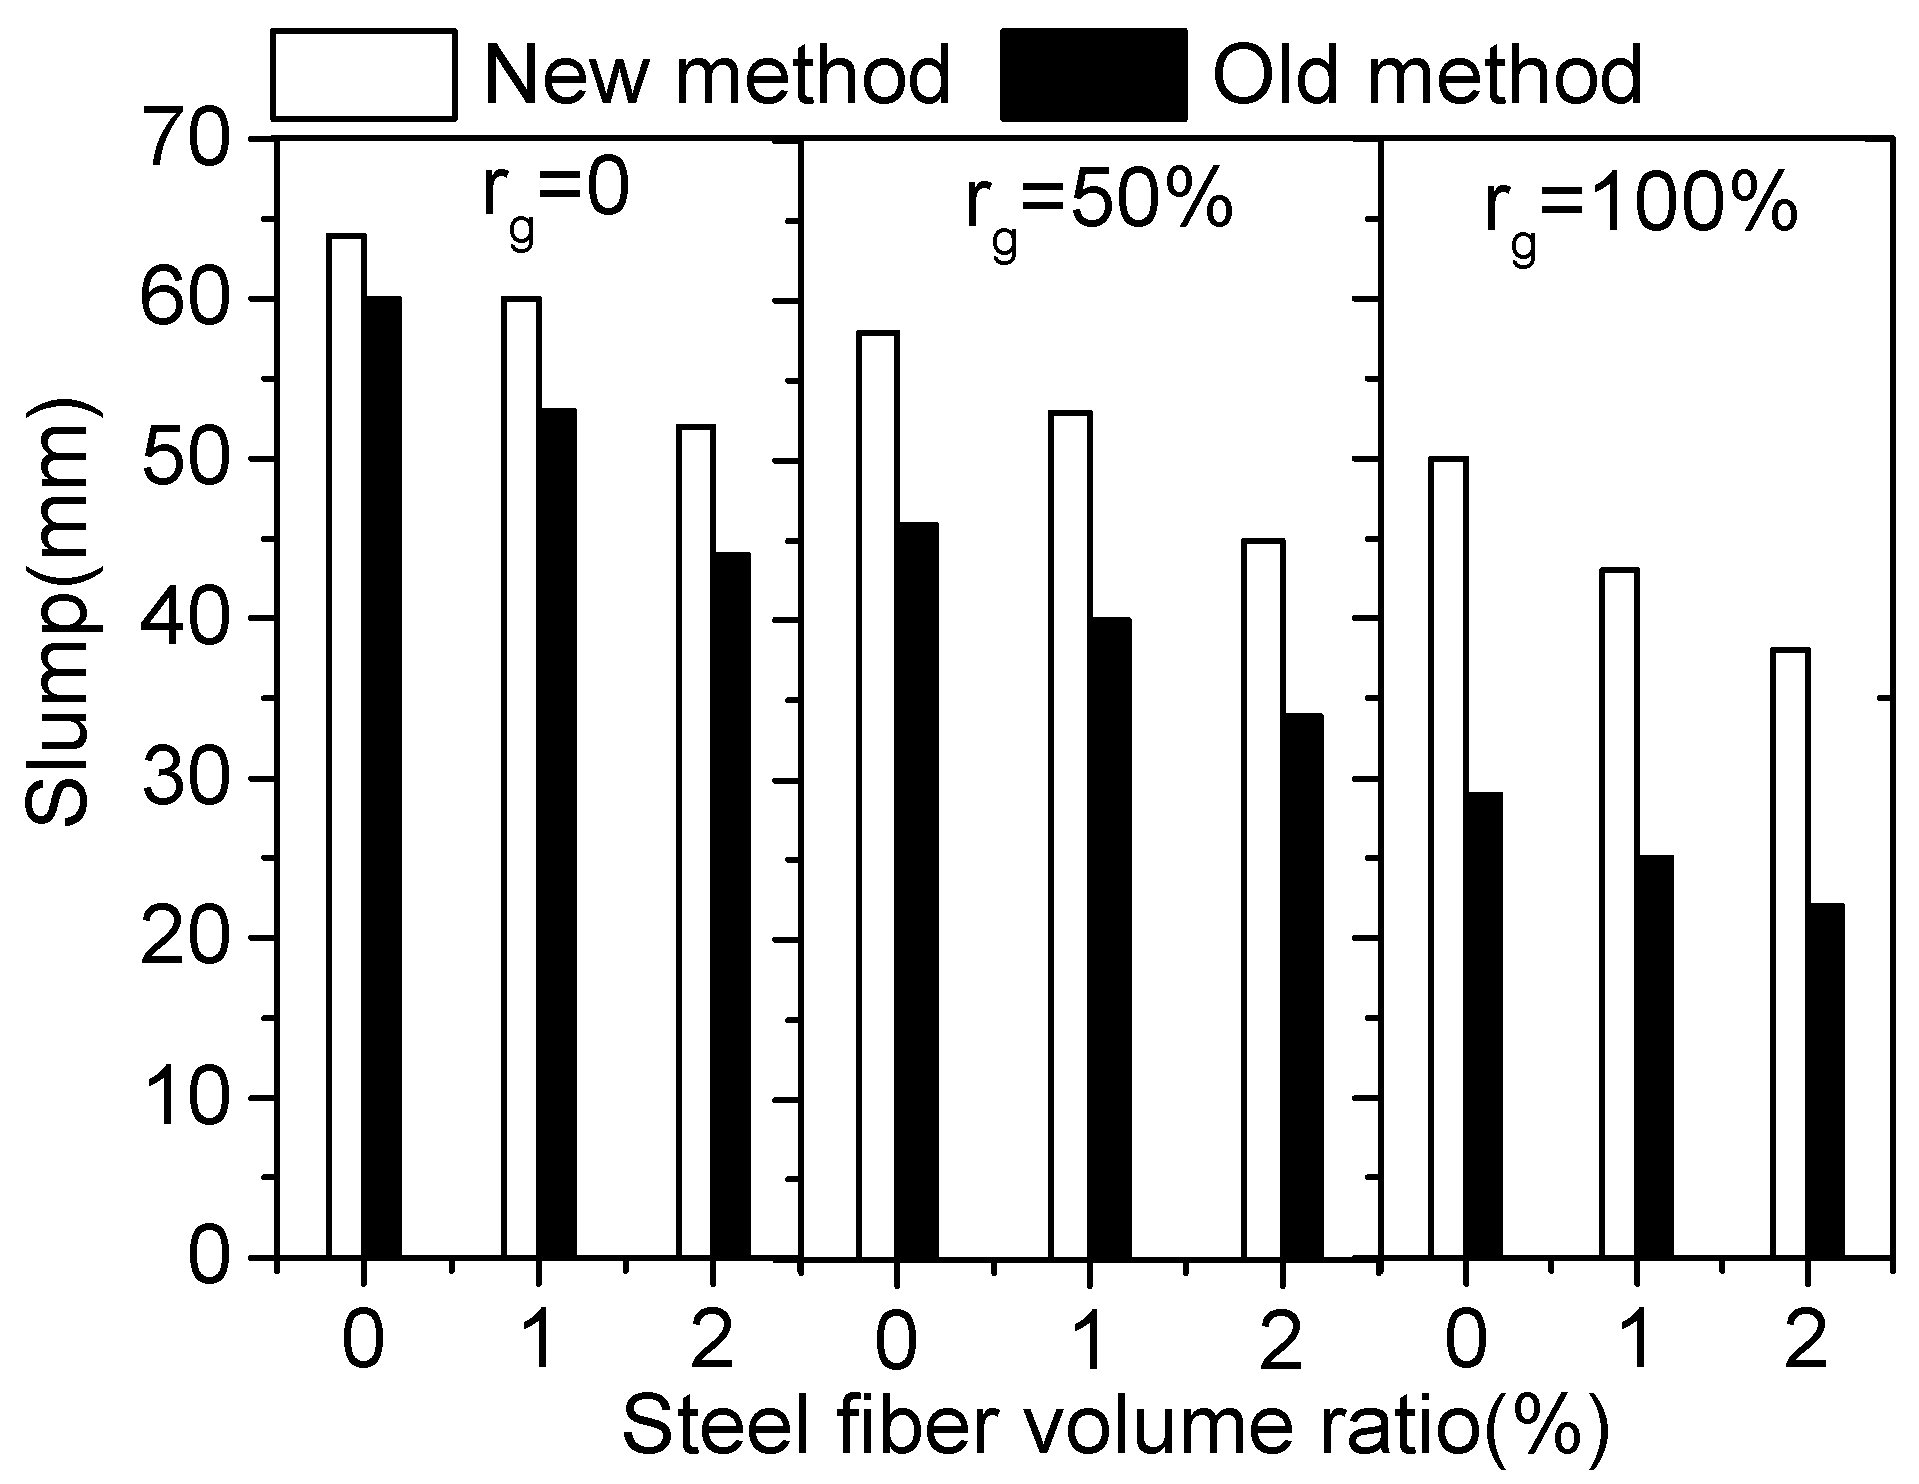
- Slump is an index reflecting the workability of concrete, which mainly was affected by the water content of concrete. The accurate determination for the water content of SFRCAC with different RCA and steel fibers to achieve target slump is the objective of this part. More water is required in the batching process to obtain the similar slump for RCAC as NCAC due to the higher water absorption of RCA [21,36,37]. The slump of concrete has been found to decrease with the increase of aspect ratio and volume fraction of steel fiber [38]. In this part, the several mixtures were made at each water content varying both rg and Vf, as shown in Table 6.
- The sand ratio (βs) is the mass ratio of sand to the total mass of aggregates (the mass sum of sand and coarse aggregate). Generally, βs is chosen according to the experience for ordinary concrete [33]. Now, there is no precise calculation formula of βs for SFRCAC. The determination of a reasonable sand ratio for SFRCAC was studied in this part. According to the principle that fine aggregate needs to fill the voids between coarse aggregates, the volume of sand required in SFRCAC should be the sum of voids caused by all coarse aggregates (including NCA and RCA) and the dispersal of steel fibers. Hence, a new calculation model of sand volume can be set up as follows:where, γ is the sand rich coefficient, it is the volume ratio between the fine aggregate and the void caused by coarse aggregate and steels fiber, the range of γ can be taken from 1.1 to 1.4 for NCAC [39], and can also be determined by tests; Pna is the void ratio of NCA, Pra is the void ratio of RCA, both Pna and Pra are the basic material properties of coarse aggregate and can be obtained by tests; Vf is the volume fraction of steel fibers used to represent the voids caused by steel fibers, because the void caused by steel fibers should be less than the volume of steel fibers in the common use range of 0–2% and rarely more than 4%. The sand content can be calculated by Equation (1), the values of other mixture design parameters in this part are consistent with the previous parts. Table 7 gives the mixture designs in this part.
2.3. Specimen Preparation and Test
3. Analysis and Discussion
3.1. Steel Fiber Content
3.2. Water-Cement Ratio
3.3. Water Content
3.3.1. Influence of Recycled Coarse Aggregate
3.3.2. Influence of Steel Fibers
3.4. Sand Ratio
4. Experimental Verification
- Determination of the steel fiber contentChecking whether steel fiber is necessary or not. An empirical formula between the flexural strength and compressive strength for normal concrete [46] is used here, ftm = 0.89 × ()0.5, where is cylinder compressive strength and .The predicted value of ftm = 0.89 × (0.8 × 40)0.5 = 5.03 MPa; since, ftm < 10 MPa (the desired flexural strength), it is necessary to add the steel fiber to obtain the desired flexural strength.
- Calculating the required content of steel fibers [Equation (5)]Since λf = Vflf/df, Vf = 0.63/34.2 = 1.84% for MF; Vf = 0.63/39.7 = 1.6% for WF; Vf = 0.63/82.3 = 0.76% for HF.
- Calculating the required W/C [Equations (6) and (8)]According to Equation (8), αa = 0.53 × (1 − 0.1 × rg) and αb = 0.2 × (1 + 0.2 × rg);αa = 0.53, αb = 0.2 for rg = 0; αa = 0.503, αb = 0.22 for rg = 50%; αa = 0.477, αb = 0.24 for rg = 100%.fcu,0 is the prepared strength, σ is the standard deviation of compressive strength. According to Chinese Standard [47], for the RCAC with fcu = 40 MPa, σ = 6 MPa, fcu,0 = 40 + 1.645 × 6 = 50 MPa.According to Equation (6), fcu,0/fce = αa × (C/W − αb), C/W = 1/(fcu,0/fce/αa + αb), from Table 1, fce = 45 MPa, then: W/C = 1/(50/45/0.53 + 0.2) = 0.43, for rg = 0; W/C = 1/(50/45/0.503 + 0.22) = 0.41, for rg = 50%; W/C = 1/(50/45/0.477 + 0.24) = 0.39, for rg = 100%.
- Calculating the required water content [Equations (10)–(12)]According to Equation (11), Kg = K × [1 + (ωra − ωna) × rg], K = 49.7. From Table 1, ωna = 1.4%, ωra = 4.85%. Kg = 49.7 × [1 + (0.0485 − 0.014) × rg], Kg = 49.7 for rg = 0; Kg = 50.6 for rg = 0; Kg = 51.4 for rg = 100%.According to Equation (12), T/T0 = 1 − 0.38λf, T0 = T/(1 − 0.38λf) = 50/(1 − 0.38 × 0.63) = 66 mm.According to Equation (10), mw = 3.33 × (0.1T + Kg), thenmw = 3.33 × (0.1 × 66 + 49.7) = 187.5 kg, for rg = 0; mw = 3.33 × (0.1 × 66 + 50.6) = 190.5 kg, for rg = 50%; mw = 3.33 × (0.1 × 66 + 51.4) = 193 kg, for rg = 100%.
- Calculating the required aggregate dosage [Equations (1)–(3)].rg = 50% and WF was taken as an example to explain the calculation.From Table 1, Pna = 44.3%, Pra = 50.3%, ρna = 2814 kg/m3, ρra = 2640 kg/m3; when rg = 50%, mna = mra, Vna = 0.938 × Vra;According to Step 1, Vf = 1.6% for WF; and then put these parameters in Equation (1),Vf = 1.4 × (0.443 × 0.938 × Vra + 0.503 × Vra + 0.016) = 1.286 × Vra + 0.0224.According to Steps 2 and 3, rg = 50%, W/C = 0.41, mw = 190.5 kg; therefore, mc = mw/(W/C) = 464.6 kg; Vw = mw/ρw = 0.1905 m3, Vc = mc/ρc = 464.5/3100 = 0.15 m3.According to Equation (2), Vc + Vw + Vs + Vna + Vra + Vf + α = 1; 0.15 + 0.1905 + (1.286 × Vra + 0.0224) + 0.938 × Vra + Vra + 0.016 + 0.02 = 1, Vra = 0.187, mra = Vra × ρra = 493.7 kg; Vs = 1.286 × Vra + 0.0224 = 0.263, ms = Vs × ρs = 672.3 kg.
5. Conclusions
- The flexural strength of RCAC can be improved by adding steel fibers. The characteristic coefficient of steel fiber can be calculated by Equation (5). Once the steel fiber type is chosen, the steel fiber volume fraction can be determined.
- The calculation model of water–cement ratio for normal concrete can also be used in recycled concrete, except that the parameter αa, αb, which are connected with the quality of coarse aggregate and the replacement ratio (rg), should be determined by test or calculated by Equations (6) and (7).
- The water content of SFRCAC is related to replacement ratio (rg) and characteristic coefficient of steel fiber (λf). According to the desired slump, the slump can be calculated by Equation (12). Then, the water content can be calculated by Equations (10) and (11).
- The sand ratio (βs) of SFRCAC is related to void fraction and apparent density of coarse aggregate, replacement ratio (rg) and characteristic coefficient of steel fiber (λf). The volume fraction of steel fiber (Vs) can be calculated by Equation (1). Based on the material property of aggregates and steel fiber used in the test, βs increases by a factor 2.4% when rg is increased by 50%, βs increases by a factor 0.7% when Vf is increased by 0.5%.
- Due to the apparent density of RCA being generally less than that of NCA, the mass of RCAC is greatly influenced by apparent density and replacement ratio (rg), the absolute volume method is recommended to be used to calculate the material component of the SFRCAC.
Author Contributions
Funding
Conflicts of Interest
References
- Marie, I.; Quiasrawi, H. Closed-loop recycling of recycled concrete aggregates. J. Clean. Prod. 2012, 37, 243–248. [Google Scholar] [CrossRef]
- Radonjanin, V.; Malešev, M.; Marinković, S.; Al Malty, A.E.S. Green recycled aggregate concrete. Constr. Build. Mater. 2013, 47, 1503–1511. [Google Scholar] [CrossRef]
- Zhang, W.; Ingham, J.M. Using Recycled Concrete Aggregates in New Zealand Ready-Mix Concrete Production. J. Mater. Civ. Eng. 2010, 22, 443–450. [Google Scholar] [CrossRef]
- Lim, W.F.; Chew, K.C.; Zayed, T.; Lee, Y.P.K.; Low, G.L.; Ting, S.K.; Ho, N.Y. Efficient Utilization of Recycled Concrete Aggregate in Structural Concrete. J. Mater. Civ. Eng. 2013, 25, 318–327. [Google Scholar]
- De Juan, M.S.; Gutiérrez, P.A. Study on the influence of attached mortar content on the properties of recycled concrete aggregate. Constr. Build. Mater. 2009, 23, 872–877. [Google Scholar] [CrossRef]
- Duan, Z.H.; Poon, C.S. Properties of recycled aggregate concrete made with recycled aggregates with different amounts of old adhered mortars. Mater. Des. 2014, 58, 19–29. [Google Scholar] [CrossRef]
- Tam, V.W.Y.; Gao, X.F.; Tam, C.M.; Chan, C.H. New approach in measuring water absorption of recycled aggregates. Constr. Build. Mater. 2008, 22, 364–369. [Google Scholar] [CrossRef]
- Medina, C.; Zhu, W.; Howind, T.; Sánchez De Rojas, M.I.; Frías, M. Influence of mixed recycled aggregate on the physical—Mechanical properties of recycled concrete. J. Clean. Prod. 2014, 68, 216–225. [Google Scholar] [CrossRef]
- Erdem, S.; Dawson, A.R.; Thom, N.H. Microstructure-linked strength properties and impact response of conventional and recycled concrete reinforced with steel and synthetic macro fibres. Constr. Build. Mater. 2011, 25, 4025–4036. [Google Scholar] [CrossRef]
- Gao, D.; Zhang, L.; Nokken, M. Mechanical behavior of recycled coarse aggregate concrete reinforced with steel fibers under direct shear. Cem. Concr. Compos. 2017, 79, 1–8. [Google Scholar] [CrossRef]
- Carneiro, J.A.; Lima, P.R.L.; Leite, M.B.; Toledo Filho, R.D. Compressive stress-strain behavior of steel fiber reinforced-recycled aggregate concrete. Cem. Concr. Compos. 2014, 46, 65–72. [Google Scholar] [CrossRef]
- Gao, D.; Zhang, L.; Nokken, M. Compressive behavior of steel fiber reinforced recycled coarse aggregate concrete designed with equivalent cubic compressive strength. Constr. Build. Mater. 2017, 141, 235–244. [Google Scholar] [CrossRef]
- Guo, Y.; Zhang, J.; Chen, G.; Xie, Z. Compressive behaviour of concrete structures incorporating recycled concrete aggregates, rubber crumb and reinforced with steel fibre, subjected to elevated temperatures. J. Clean. Prod. 2014, 72, 193–203. [Google Scholar] [CrossRef]
- Senaratne, S.; Gerace, D.; Mirza, O.; Tam, V.W.Y.; Kang, W. The costs and benefits of combining recycled aggregate with steel fibres as a sustainable, structural material. J. Clean. Prod. 2016, 112, 2318–2327. [Google Scholar] [CrossRef]
- Somna, R.; Jaturapitakkul, C.; Chalee, W.; Rattanachu, P. Effect of the Water to Binder Ratio and Ground Fly Ash on Properties of Recycled Aggregate Concrete. J. Mater. Civ. Eng. 2012, 24, 16–22. [Google Scholar] [CrossRef]
- Etxeberria, M.; Vázquez, E.; Marí, A.; Barra, M. Influence of amount of recycled coarse aggregates and production process on properties of recycled aggregate concrete. Cem. Concr. Res. 2007, 37, 735–742. [Google Scholar] [CrossRef]
- Meyer, C. The greening of the concrete industry. Cem. Concr. Compos. 2009, 31, 601–605. [Google Scholar] [CrossRef]
- Liang, Y.; Ye, Z.; Vernerey, F.; Xi, Y. Development of Processing Methods to Improve Strength of Concrete with 100% Recycled Coarse Aggregate. J. Mater. Civ. Eng. 2015. [Google Scholar] [CrossRef]
- Tam, C.T.; Akbarnezhad, A.; Zhang, M.H.; Ong, K.C.G. Effects of the Parent Concrete Properties and Crushing Procedure on the Properties of Coarse Recycled Concrete Aggregates. J. Mater. Civ. Eng. 2013, 25, 1795–1802. [Google Scholar]
- Butler, L.; West, J.S.; Tighe, S.L. Effect of recycled concrete coarse aggregate from multiple sources on the hardened properties of concrete with equivalent compressive strength. Constr. Build. Mater. 2013, 47, 1292–1301. [Google Scholar] [CrossRef]
- Cui, H.; Shi, X.; Memon, S.A.; Xing, F.; Tang, W. Experimental Study on the Influence of Water Absorption of Recycled Coarse Aggregates on Properties of the Resulting Concretes. J. Mater. Civ. Eng. 2015. [Google Scholar] [CrossRef]
- Ferreira, L.; de Brito, J.; Barra, M.; Abbas, A. Influence of the pre-saturation of recycled coarse concrete aggregates on concrete properties. Mag. Concr. Res. 2011, 63, 617–627. [Google Scholar] [CrossRef]
- Tam, V.; Tam, C.M.; Wang, Y. Optimization on proportion for recycled aggregate in concrete using two-stage mixing approach. Constr. Build. Mater. 2007, 21, 1928–1939. [Google Scholar] [CrossRef]
- Tam, V.; Gao, X.F.; Tam, C.M. Microstructural analysis of recycled aggregate concrete produced from two-stage mixing approach. Cem. Concr. Res. 2005, 35, 1195–1203. [Google Scholar] [CrossRef]
- Fathifazl, G.; Abbas, A.; Razaqpur, A.G.; Isgor, O.B.; Fournier, B.; Foo, S. New Mixture Proportioning Method for Concrete Made with Coarse Recycled Concrete Aggregate. J. Mater. Civ. Eng. 2009, 21, 601–611. [Google Scholar] [CrossRef]
- Pepe, M.; Toledo Filho, R.D.; Koenders, E.A.B.; Martinelli, E. A novel mix design methodology for Recycled Aggregate Concrete. Constr. Build. Mater. 2016, 122, 362–372. [Google Scholar] [CrossRef]
- ACI. Removal and Reuse of Hardened Concrete, ACI 555-R01; ACI: Farmington Hills, MI, USA, 2001. [Google Scholar]
- AQSIQ. Common Portland Cement, GB/175-2007; Standards Press of China: Beijing, China, 2007.
- ASTM. Standard Specification for Concrete Aggregates, C33/C33M-13; ASTM International: West Conshohocken, PA, USA, 2013. [Google Scholar]
- AQSIQ. Recycled Coarse Aggregate for Concrete, GB/T 25177; Standards Press of China: Beijing, China, 2010.
- AQSIQ. Pebble and Crushed Stone for Construction, GB/T 14685; Standards Press of China: Beijing, China, 2011.
- MOUHURD. Specification for Mix Proportion Design of Ordinary Concrete, JGJ 55-2011; China Construction Industry Press: Beijing, China, 2011. [Google Scholar]
- Karadelis, J.N.; Lin, Y. Flexural strengths and fibre efficiency of steel-fibre-reinforced, roller-compacted, polymer modified concrete. Constr. Build. Mater. 2015, 93, 498–505. [Google Scholar] [CrossRef]
- Gao, D.; Zhao, J.; Zhu, H. Design and Application of Steel Fiber Concrete; China Construction Industry Press: Beijing, China, 2002. [Google Scholar]
- Saidani, M.; Saraireh, D.; Gerges, M. Behaviour of different types of fibre reinforced concrete without admixture. Eng. Struct. 2016, 113, 328–334. [Google Scholar] [CrossRef]
- Kubissa, J.; Koper, M.; Koper, W.; Kubissa, W.; Koper, A. Water Demand of Concrete Recycled Aggregates. Procedia Eng. 2015, 108, 63–71. [Google Scholar] [CrossRef]
- Dhinakaran, G.; Kumar, P.S. Effect of Admixed Recycled Aggregate Concrete on Properties of Fresh and Hardened Concrete. J. Mater. Civ. Eng. 2012, 24, 494–498. [Google Scholar]
- Yazıcı, Ş.; İnan, G.; Tabak, V. Effect of aspect ratio and volume fraction of steel fiber on the mechanical properties of SFRC. Constr. Build. Mater. 2007, 21, 1250–1253. [Google Scholar] [CrossRef]
- Zhang, C.; Song, F.; Liu, F. Orial Handbooks of Building Construction; China Building Industry Press: Beijing, China, 2011. [Google Scholar]
- AQSIQ. Standard for Test Method of Mechanical Properties on Ordinary Concrete, GB/T50081; China Architecture & Building Press: Beijing, China, 2002.
- ASTM. Standard Test Method for Flexural Performance of Fiber-Reinforced Concrete (Using Beam with Third-Point Loading), C1609; ASTM International: West Conshohocken, PA, USA, 2012. [Google Scholar]
- Kim, H.; Kim, G.; Gucunski, N.; Nam, J.; Jeon, J. Assessment of flexural toughness and impact resistance of bundle-type polyamide fiber-reinforced concrete. Compos. Part B-Eng. 2015, 78, 431–446. [Google Scholar] [CrossRef]
- Zega, C.J.; Di Maio, A.A. Recycled Concretes Made with Waste Ready-Mix Concrete as Coarse Aggregate. J. Mater. Civ. Eng. 2011, 23, 281–286. [Google Scholar] [CrossRef]
- Tabsh, S.W.; Abdelfatah, A.S. Influence of recycled concrete aggregates on strength properties of concrete. Constr. Build. Mater. 2009, 23, 1163–1167. [Google Scholar] [CrossRef]
- Zhao, S.; Du, H.; Qian, X.; Li, C. Study on direct mix design method for steel fiber reinforced high-strength concrete. China Civ. Eng. J. 2008, 41, 1–6. [Google Scholar]
- CEB-FIP. Ceb-Fip Model Code 1990; Thomas Telford Ltd.: Lansanne, Switzerland, 1993. [Google Scholar]
- MOHURD. Technical Specification for Application of Recycled Aggregate, JGJ/T 240-2011; China Construction Industry Press: Beijing, China, 2011. [Google Scholar]


| Aggregate Type | Apparent Density (kg/m3) | Loose Packing Density (kg/m3) | Dry-Rodded Density (kg/m3) | Water Absorption (wt. %) | Crush Index (%) | Void Ratio (%) |
|---|---|---|---|---|---|---|
| RCA | 2640 | 1302 | 1412 | 4.85 | 17.7 | 50.3 |
| NCA | 2814 | 1568 | 1630 | 1.40 | 8.8 | 44.3 |
| Sand | 2556 | 1611 | 1486 | 0.56 | – | – |
| Steel Fiber Type | MF | WF | HF |
| Fiber photo |  |  |  |
| Mean length (lf)/mm | 32.3 | 30 | 62 |
| Mean diameter (df)/mm | 0.94 | 0.76 | 0.75 |
| Aspect ratio (lf/df) | 34.2 | 39.7 | 82.3 |
| Test Parameters | Material Parameters | Mixture Design Parameters | Assessment Criteria | ||||
|---|---|---|---|---|---|---|---|
| Steel Fiber Type | Vf | rg | W/C | mw | βs | ||
| Steel fiber content | MF/WF/HF | 0–2% | 0, 100% | 0.48 | 164–196 | 36% | fftm |
| Water-cement ratio | none | – | 0, 50%, 100% | 0.30–0.55 | 180 | 36% | fcu |
| Water content | MF/HF | 0–2% | 0, 50%, 100% | 0.40 | 160–220 | 36% | slump |
| Sand content | MF | 0–2% | 0, 50%, 100% | 0.40 | 190 | New method | fcu, slump |
| Specimen No. | Water | Cement | Sand | NCA | RCA | Steel Fiber | fftm/MPa |
|---|---|---|---|---|---|---|---|
| R0 | 164 | 342 | 721 | 1283 | 0 | 0 | 5.90 |
| R100 | 164 | 342 | 721 | 0 | 1283 | 0 | 4.46 |
| R0MF0.5 | 172 | 358 | 749 | 1171 | 0 | 39 | 6.67 |
| R0NF0.5-C | 172 | 358 | 749 | 1171 | 0 | 0 | 5.71 |
| R100MF0.5 | 172 | 358 | 749 | 0 | 1171 | 39 | 5.00 |
| R100NF0.5-C | 172 | 358 | 749 | 0 | 1171 | 0 | 4.79 |
| R0MF1.0 | 180 | 375 | 796 | 1099 | 0 | 78 | 7.28 |
| R0HF1.0 | 180 | 375 | 796 | 1099 | 0 | 78 | 16.25 |
| R0WF1.0 | 180 | 375 | 796 | 1099 | 0 | 78 | 8.13 |
| R0NF1.0-C | 180 | 375 | 796 | 1099 | 0 | 0 | 5.78 |
| R100MF1.0 | 180 | 375 | 796 | 0 | 1099 | 78 | 5.44 |
| R100HF1.0 | 180 | 375 | 796 | 0 | 1099 | 78 | 14.07 |
| R100WF1.0 | 180 | 375 | 796 | 0 | 1099 | 78 | 5.73 |
| R100NF1.0-C | 180 | 375 | 796 | 0 | 1099 | 0 | 4.79 |
| R0MF1.5 | 188 | 392 | 842 | 1029 | 0 | 117 | 8.76 |
| R0NF1.5-C | 188 | 392 | 842 | 1029 | 0 | 0 | 6.59 |
| R100MF1.5 | 188 | 392 | 842 | 0 | 1029 | 117 | 7.36 |
| R100NF1.5-C | 188 | 392 | 842 | 0 | 1029 | 0 | 5.53 |
| R0MF2.0 | 196 | 408 | 886 | 960 | 0 | 156 | 9.27 |
| R0NF2.0-C | 196 | 408 | 886 | 960 | 0 | 0 | 5.65 |
| R100MF 2.0 | 196 | 408 | 886 | 0 | 960 | 156 | 8.54 |
| R100NF2.0-C | 196 | 408 | 886 | 0 | 960 | 0 | 4.34 |
| Specimen No. | Water | Cement | Sand | NCA | RCA | fcu/MPa |
|---|---|---|---|---|---|---|
| W/C0.3R0 | 180 | 600 | 603 | 1073 | 0 | 75.2 |
| W/C 0.3R50 | 180 | 600 | 590 | 525 | 525 | 58.4 |
| W/C0.3R100 | 180 | 600 | 579 | 0 | 1030 | 55.3 |
| W/C0.35R0 | 180 | 514 | 630 | 1121 | 0 | 62.0 |
| W/C0.35R50 | 180 | 514 | 617 | 549 | 549 | 59.6 |
| W/C0.35R100 | 180 | 514 | 605 | 0 | 1076 | 55.9 |
| W/C0.4R0 | 180 | 450 | 650 | 1157 | 0 | 56.4 |
| W/C0.4R50 | 180 | 450 | 636 | 566 | 566 | 51.3 |
| W/C0.4R100 | 180 | 450 | 624 | 0 | 1111 | 49.2 |
| W/C0.45R0 | 180 | 400 | 666 | 1185 | 0 | 47.5 |
| W/C0.45R50 | 180 | 400 | 652 | 580 | 580 | 45.7 |
| W/C0.45R100 | 180 | 400 | 639 | 0 | 1138 | 41.6 |
| W/C0.5R0 | 180 | 360 | 678 | 1207 | 0 | 43.6 |
| W/C0.5R50 | 180 | 360 | 664 | 591 | 591 | 41.2 |
| W/C0.5R100 | 180 | 360 | 651 | 0 | 1160 | 37.4 |
| W/C0.55R0 | 180 | 327 | 689 | 1226 | 0 | 38.2 |
| W/C0.55R50 | 180 | 327 | 674 | 600 | 600 | 35.3 |
| W/C0.55R100 | 180 | 327 | 661 | 0 | 1177 | 34.2 |
| Specimen No. | Water | Cement | Sand | NCA | RCA | Steel Fiber | Slump/mm | fcu/MPa |
|---|---|---|---|---|---|---|---|---|
| W16R0 | 160 | 400 | 685 | 1210 | 0 | 0 | 6 | 47.8 |
| W16R50 | 160 | 400 | 671 | 597 | 597 | 0 | 4 | 45.5 |
| W16R100 | 160 | 400 | 658 | 0 | 1171 | 0 | 2 | 45.0 |
| W17R0 | 170 | 425 | 668 | 1187 | 0 | 0 | 13 | 51.9 |
| W17R50 | 170 | 425 | 654 | 582 | 582 | 0 | 7 | 48.2 |
| W17R100 | 170 | 425 | 642 | 0 | 1141 | 0 | 5 | 45.7 |
| W18R0 | 180 | 450 | 650 | 1157 | 0 | 0 | 32 | 56.4 |
| W18R50 | 180 | 450 | 636 | 566 | 566 | 0 | 21 | 51.3 |
| W18R100 | 180 | 450 | 624 | 0 | 1111 | 0 | 13 | 49.2 |
| W19R0 | 190 | 475 | 632 | 1126 | 0 | 0 | 60 | 49.6 |
| W19R0MF1.0 | 190 | 475 | 632 | 1126 | 0 | 78 | 53 | 48.9 |
| W19R0HF1.0 | 190 | 475 | 632 | 1126 | 0 | 78 | 42 | 50.6 |
| W19R0MF2.0 | 190 | 475 | 632 | 1126 | 0 | 156 | 44 | 51.0 |
| W19R0HF2.0 | 190 | 475 | 632 | 1126 | 0 | 156 | 25 | 52.2 |
| W19R50 | 190 | 475 | 619 | 551 | 551 | 0 | 46 | 48.1 |
| W19R50MF1.0 | 190 | 475 | 619 | 551 | 551 | 78 | 40 | 49.2 |
| W19R50HF1.0 | 190 | 475 | 619 | 551 | 551 | 78 | 32 | 50.5 |
| W19R50MF2.0 | 190 | 475 | 619 | 551 | 551 | 156 | 34 | 50.7 |
| W19R50HF2.0 | 190 | 475 | 619 | 551 | 551 | 156 | 18 | 50.2 |
| W19R100 | 190 | 475 | 607.3 | 0 | 1081 | 0 | 29 | 47.2 |
| W19R100MF1.0 | 190 | 475 | 607 | 0 | 1081 | 78 | 25 | 48.6 |
| W19R100HF1.0 | 190 | 475 | 607 | 0 | 1081 | 78 | 20 | 49.0 |
| W19R100MF2.0 | 190 | 475 | 607 | 0 | 1081 | 156 | 22 | 50.1 |
| W19R100HF2.0 | 190 | 475 | 607 | 0 | 1081 | 156 | 10 | 51.3 |
| W20R0 | 200 | 500 | 615 | 1094 | 0 | 0 | 96 | 50.2 |
| W20R50 | 200 | 500 | 602 | 536 | 536 | 0 | 78 | 48.7 |
| W20R100 | 200 | 500 | 590 | 0 | 1051 | 0 | 49 | 51.2 |
| W21R0 | 210 | 525 | 597 | 1063 | 0 | 0 | 130 | 47.4 |
| W21R50 | 210 | 525 | 585 | 521 | 521 | 0 | 121 | 46.4 |
| W21R100 | 210 | 525 | 574 | 0/0 | 1020 | 0 | 106 | 46.0 |
| W22R0 | 220 | 550 | 580 | 1032 | 0 | 0 | 175 | 47.2 |
| W22R50 | 220 | 550 | 568 | 505 | 505 | 0 | 168 | 44.5 |
| W22R100 | 220 | 550 | 557 | 0 | 991 | 0 | 159 | 42.8 |
| Specimen No. | Water | Cement | Sand | NCA | RCA | Steel Fiber | βs | Slump/mm | fcu/MPa |
|---|---|---|---|---|---|---|---|---|---|
| CR0MF0 | 190 | 475 | 622.8 | 1106 | 0 | 0 | 36 | 64 | 50.4 |
| CR50MF0 | 190 | 475 | 648.3 | 521 | 521 | 0 | 38.4 | 58 | 51.6 |
| CR100MF0 | 190 | 475 | 673.2 | 0 | 987.4 | 0 | 40.8 | 50 | 51.2 |
| CR0MF0.5 | 190 | 475 | 629 | 1085 | 0 | 39 | 36.7 | 60 | 50.9 |
| CR50MF0.5 | 190 | 475 | 655.7 | 511.7 | 511.7 | 39 | 39 | 57 | 51.1 |
| CR100MF0.5 | 190 | 475 | 678 | 0 | 968.2 | 39 | 41.2 | 48 | 51.5 |
| CR0MF1.0 | 190 | 475 | 634 | 1064 | 0 | 78 | 37.3 | 60 | 51.2 |
| CR50MF1.0 | 190 | 475 | 660 | 502 | 502 | 78 | 39.7 | 53 | 52.3 |
| CR100MF1.0 | 190 | 475 | 683.8 | 0 | 949.6 | 78 | 41.9 | 43 | 52.6 |
| CR0MF1.5 | 190 | 475 | 641 | 1044 | 0 | 117 | 38 | 55 | 53.3 |
| CR50MF1.5 | 190 | 475 | 667 | 492 | 492 | 117 | 40.4 | 50 | 52.1 |
| CR100MF1.5 | 190 | 475 | 689.1 | 0 | 931 | 117 | 42.5 | 40 | 52.9 |
| CR0MF2.0 | 190 | 475 | 647 | 1023 | 0 | 156 | 38.7 | 52 | 54.5 |
| CR50MF2.0 | 190 | 475 | 670.8 | 482.2 | 482.2 | 156 | 41 | 45 | 53.7 |
| CR100MF2.0 | 190 | 475 | 693.7 | 0 | 912.4 | 156 | 43.2 | 38 | 53.2 |
| Test Value | Specimen No. | ||||||||
|---|---|---|---|---|---|---|---|---|---|
| CR0MF | CR50MF | CR100MF | CR0WF | CR50WF | CR100WF | CR0HF | CR50HF | CR50HF | |
| W/C | 0.43 | 0.41 | 0.39 | 0.43 | 0.41 | 0.39 | 0.43 | 0.41 | 0.39 |
| Water (kg) /volume% | 187.5/ 18.75 | 190.5/ 19.05 | 193/ 19.3 | 187.5/ 18.75 | 190.5/ 19.05 | 193/ 19.3 | 187.5/ 18.75 | 190.5/ 19.05 | 193/ 19.3 |
| Cement (kg) /volume% | 436/ 14.1 | 464.6/ 15 | 494.9/ 15.7 | 436/ 14.1 | 464.6/ 15 | 494.9/ 15.7 | 436/ 14.1 | 464.6/ 15 | 494.9/ 15.7 |
| SFs (kg) /volume% | 143.5/ 1.84 | 143.5/ 1.84 | 143.5/ 1.84 | 124.8/ 1.6 | 124.8/ 1.6 | 124.8/ 1.6 | 59.3/ 0.76 | 59.3/ 0.76 | 59.3/ 0.76 |
| NCA (kg) /volume% | 1054.8/ 37.5 | 488.4/ 17.3 | 0/ 0 | 1064.8/ 37.8 | 493.7/ 17.5 | 0/ 0 | 1100/ 39.1 | 509/ 19.3 | 0/ 0 |
| Cement (kg) /volume% | 436/ 14.1 | 464.6/ 15 | 494.9/ 15.7 | 436/ 14.1 | 464.6/ 15 | 494.9/ 15.7 | 436/ 14.1 | 464.6/ 15 | 494.9/ 15.7 |
| RCA (kg) /volume% | 0/ 0 | 488.4/ 18.5 | 907.5/ 34.4 | 0/ 0 | 493.7/ 18.7 | 916.5/ 34.7 | 0/ 0 | 509/ 18.1 | 947.7/ 35.9 |
| Sand (kg) /volume% | 660.4/ 25.8 | 674/ 26.4 | 685.1/ 26.8 | 656.5/ 25.7 | 672/ 26.3 | 681.9/ 26.7 | 647.1/ 25.3 | 661.6/ 25.9 | 672.3/ 26.3 |
| βs/% | 38.5 | 40.8 | 43 | 38.1 | 40.5 | 42.7 | 37 | 39.4 | 41.5 |
| Slump (mm) | 56 | 60 | 52 | 55 | 53 | 52 | 60 | 62 | 56 |
| fcu (MPa) | 50.4 | 52.6 | 49.8 | 51 | 51.8 | 49.6 | 50.6 | 49.9 | 49 |
| fftm (MPa) | 12.3 | 12 | 10.6 | 11.8 | 11.3 | 10.2 | 10.9 | 12 | 12.5 |
© 2019 by the authors. Licensee MDPI, Basel, Switzerland. This article is an open access article distributed under the terms and conditions of the Creative Commons Attribution (CC BY) license (http://creativecommons.org/licenses/by/4.0/).
Share and Cite
Gao, D.; Zhang, L.; Nokken, M.; Zhao, J. Mixture Proportion Design Method of Steel Fiber Reinforced Recycled Coarse Aggregate Concrete. Materials 2019, 12, 375. https://doi.org/10.3390/ma12030375
Gao D, Zhang L, Nokken M, Zhao J. Mixture Proportion Design Method of Steel Fiber Reinforced Recycled Coarse Aggregate Concrete. Materials. 2019; 12(3):375. https://doi.org/10.3390/ma12030375
Chicago/Turabian StyleGao, Danying, Lijuan Zhang, Michelle Nokken, and Jun Zhao. 2019. "Mixture Proportion Design Method of Steel Fiber Reinforced Recycled Coarse Aggregate Concrete" Materials 12, no. 3: 375. https://doi.org/10.3390/ma12030375
APA StyleGao, D., Zhang, L., Nokken, M., & Zhao, J. (2019). Mixture Proportion Design Method of Steel Fiber Reinforced Recycled Coarse Aggregate Concrete. Materials, 12(3), 375. https://doi.org/10.3390/ma12030375