Article

Soil Recycling Geopolymers Fabricated from High Power Ultrasound Treated Soil Slurry in the Presence of Ammonia

by
Louis-Marly Kwedi-Nsah
1,
Yuta Watanabe
2 and
Takaomi Kobayashi
1,2,*
1
Department of Energy and Environment, Nagaoka University of Technology, 1603-1 Kamitomioka, Nagaoka, Niigata 940-2188, Japan
2
Department of Science and Technological Innovation, Nagaoka University of Technology, 1603-1 Kamitomioka, Nagaoka, Niigata 940-2188, Japan
*
Author to whom correspondence should be addressed.
Materials 2019, 12(22), 3804; https://doi.org/10.3390/ma12223804
Submission received: 15 September 2019 / Revised: 9 November 2019 / Accepted: 12 November 2019 / Published: 19 November 2019

Abstract

:
Soil slurry was recycled to prepare a geopolymer after treatment with high-power ultrasound (US) in the presence of NH3, HCl, and NaOH. Under 28 kHz US, 0.1 M NH3 additives effectively decarbonized the slurry, eliminating 72.2% of the carbon content from the original soil. The US-treated soils were used as raw materials for the geopolymer, as they contained Si and Al components in the range of 25–30 and 8–10 wt.%, respectively. The geopolymer was prepared with a Na2SiO4/NaOH aqueous solution at a ¼ weight ratio at 80 °C for 24 h. The resultant geopolymers from the NH3-treated soil showed the best compressive strength of 3 MPa after 1 day of curing, with a low carbon content, when NH3 was used as an additive as opposed to HCl and NaOH under 1200 US exposure.

1. Introduction

A geopolymer is a ceramic material that can be prepared at low temperatures in the presence of an alkaline activator [1]. The fact that ceramic blocks can be prepared at low temperatures is an advantage over other materials and has drawn the attention of researchers focused on developing sustainable materials that can be of value in the reuse of fly ash and other inorganics [2]. Since the interest in sustainability has risen in the construction sector [3], geopolymer research has recently seen significant growth. The pioneering research on geopolymers shows highly promising results relating to durability and fire resistance [4,5].
It is interesting to note that soil contains minerals, water, air, gases, organic matter, and microorganisms [6,7,8]. The mineral part is the largest component, with sand, silt, and clay comprising approximately 45%–50% of the total soil. Thus, soil is typically made up of SiO2, Al2O3, Fe2O3, and CaO constituents. The organic matter in soil is mainly derived from dead plants and animals, while at low percentage concentrations, the carbon parts are decomposed by microorganisms [9]. Generally, when soil has to be recycled, it must be sintered at high temperatures to remove such organic components [10,11,12,13,14]. As organic carbon parts are known to decrease the strength and stability of inorganic ceramic materials, less carbon content in soil is, therefore, an important factor to consider during soil recycling for the application of geopolymers [15].
So far, the ideal method of eliminating soil carbon remains to be discovered. Currently, the most prominent method is shaking the soil in water for several hours [16]. Usually, water or aqueous chemicals, such as acids, bases, surfactants, and chelating agents, are vital for the conventional washing method [17]. This technology is recognized as an important method for the elimination of hazardous contaminants and for washing heavy-metal-contaminated soils [18]. However, the drawback of this soil washing technique (with the addition of reagents in sequential washing steps) [19] is that the washing process can remove pollutants or unwanted compounds only from the surface of the soil particle [20,21].
Ultrasound (US), which is the vibration of sound waves above an audible frequency, causes remarkable mechanical soil dispersion. This is because the bubbles generated by US inside the reaction vessel oscillate/increase in size and then explode with a violent power, generating extreme sonochemical and sonophysical effects in aqueous soil [22,23]. It is known that both effects are applied in some technologies for surface cleaning, extracting, and micromixing [24,25,26,27]. For US soil washing, in addition to other factors, the effect of sonication power has been reported in several papers [24,25,26]. Sonication power is known to accelerate sequential extraction by US washing. Also, US waves can break down the particle size of soil and aggressively agitate a slurry solution.
Although excavated soil is used as a renewable material in the construction industry, the recycling rate, however, seems very low [28]. This is because these soils are usually categorized as waste [29]. From a financial perspective, soil displacement represents about 5%–16% of the capital cost of every project [30]. In South Korea [31,32], Canada [33], and Italy [34], for example, programs have been created to encourage the reuse of excavated soil. In Japan as well, due to the limitation of available natural resources and land space for landfills, reuse in construction fields is greatly encouraged [35]. Since these waste soils can be converted to other useful products, it is quite meaningful to study soil reuses.
As previously mentioned, soil clay is generally rich in Al2O3 and SiO2 components, allowing the possibility for soil to be reused as inorganic materials. Although the research is limited, one of the major possibilities of soil reuse is for the fabrication of geopolymers. An attempt was made by Singhi et al. to investigate soil–geopolymer incorporated with slag, fly ash, and a mixture of slag and fly ash [36,37]. The addition of nanoparticles of layered mineral silicates led to the flocculation of clay particles, which improved the rheological properties of geopolymer nanocomposites, suitable to be used in 3D printing applications [38,39]. In the present study, high-power US soil washing is performed, and the treated soil is used as a geopolymer source material.

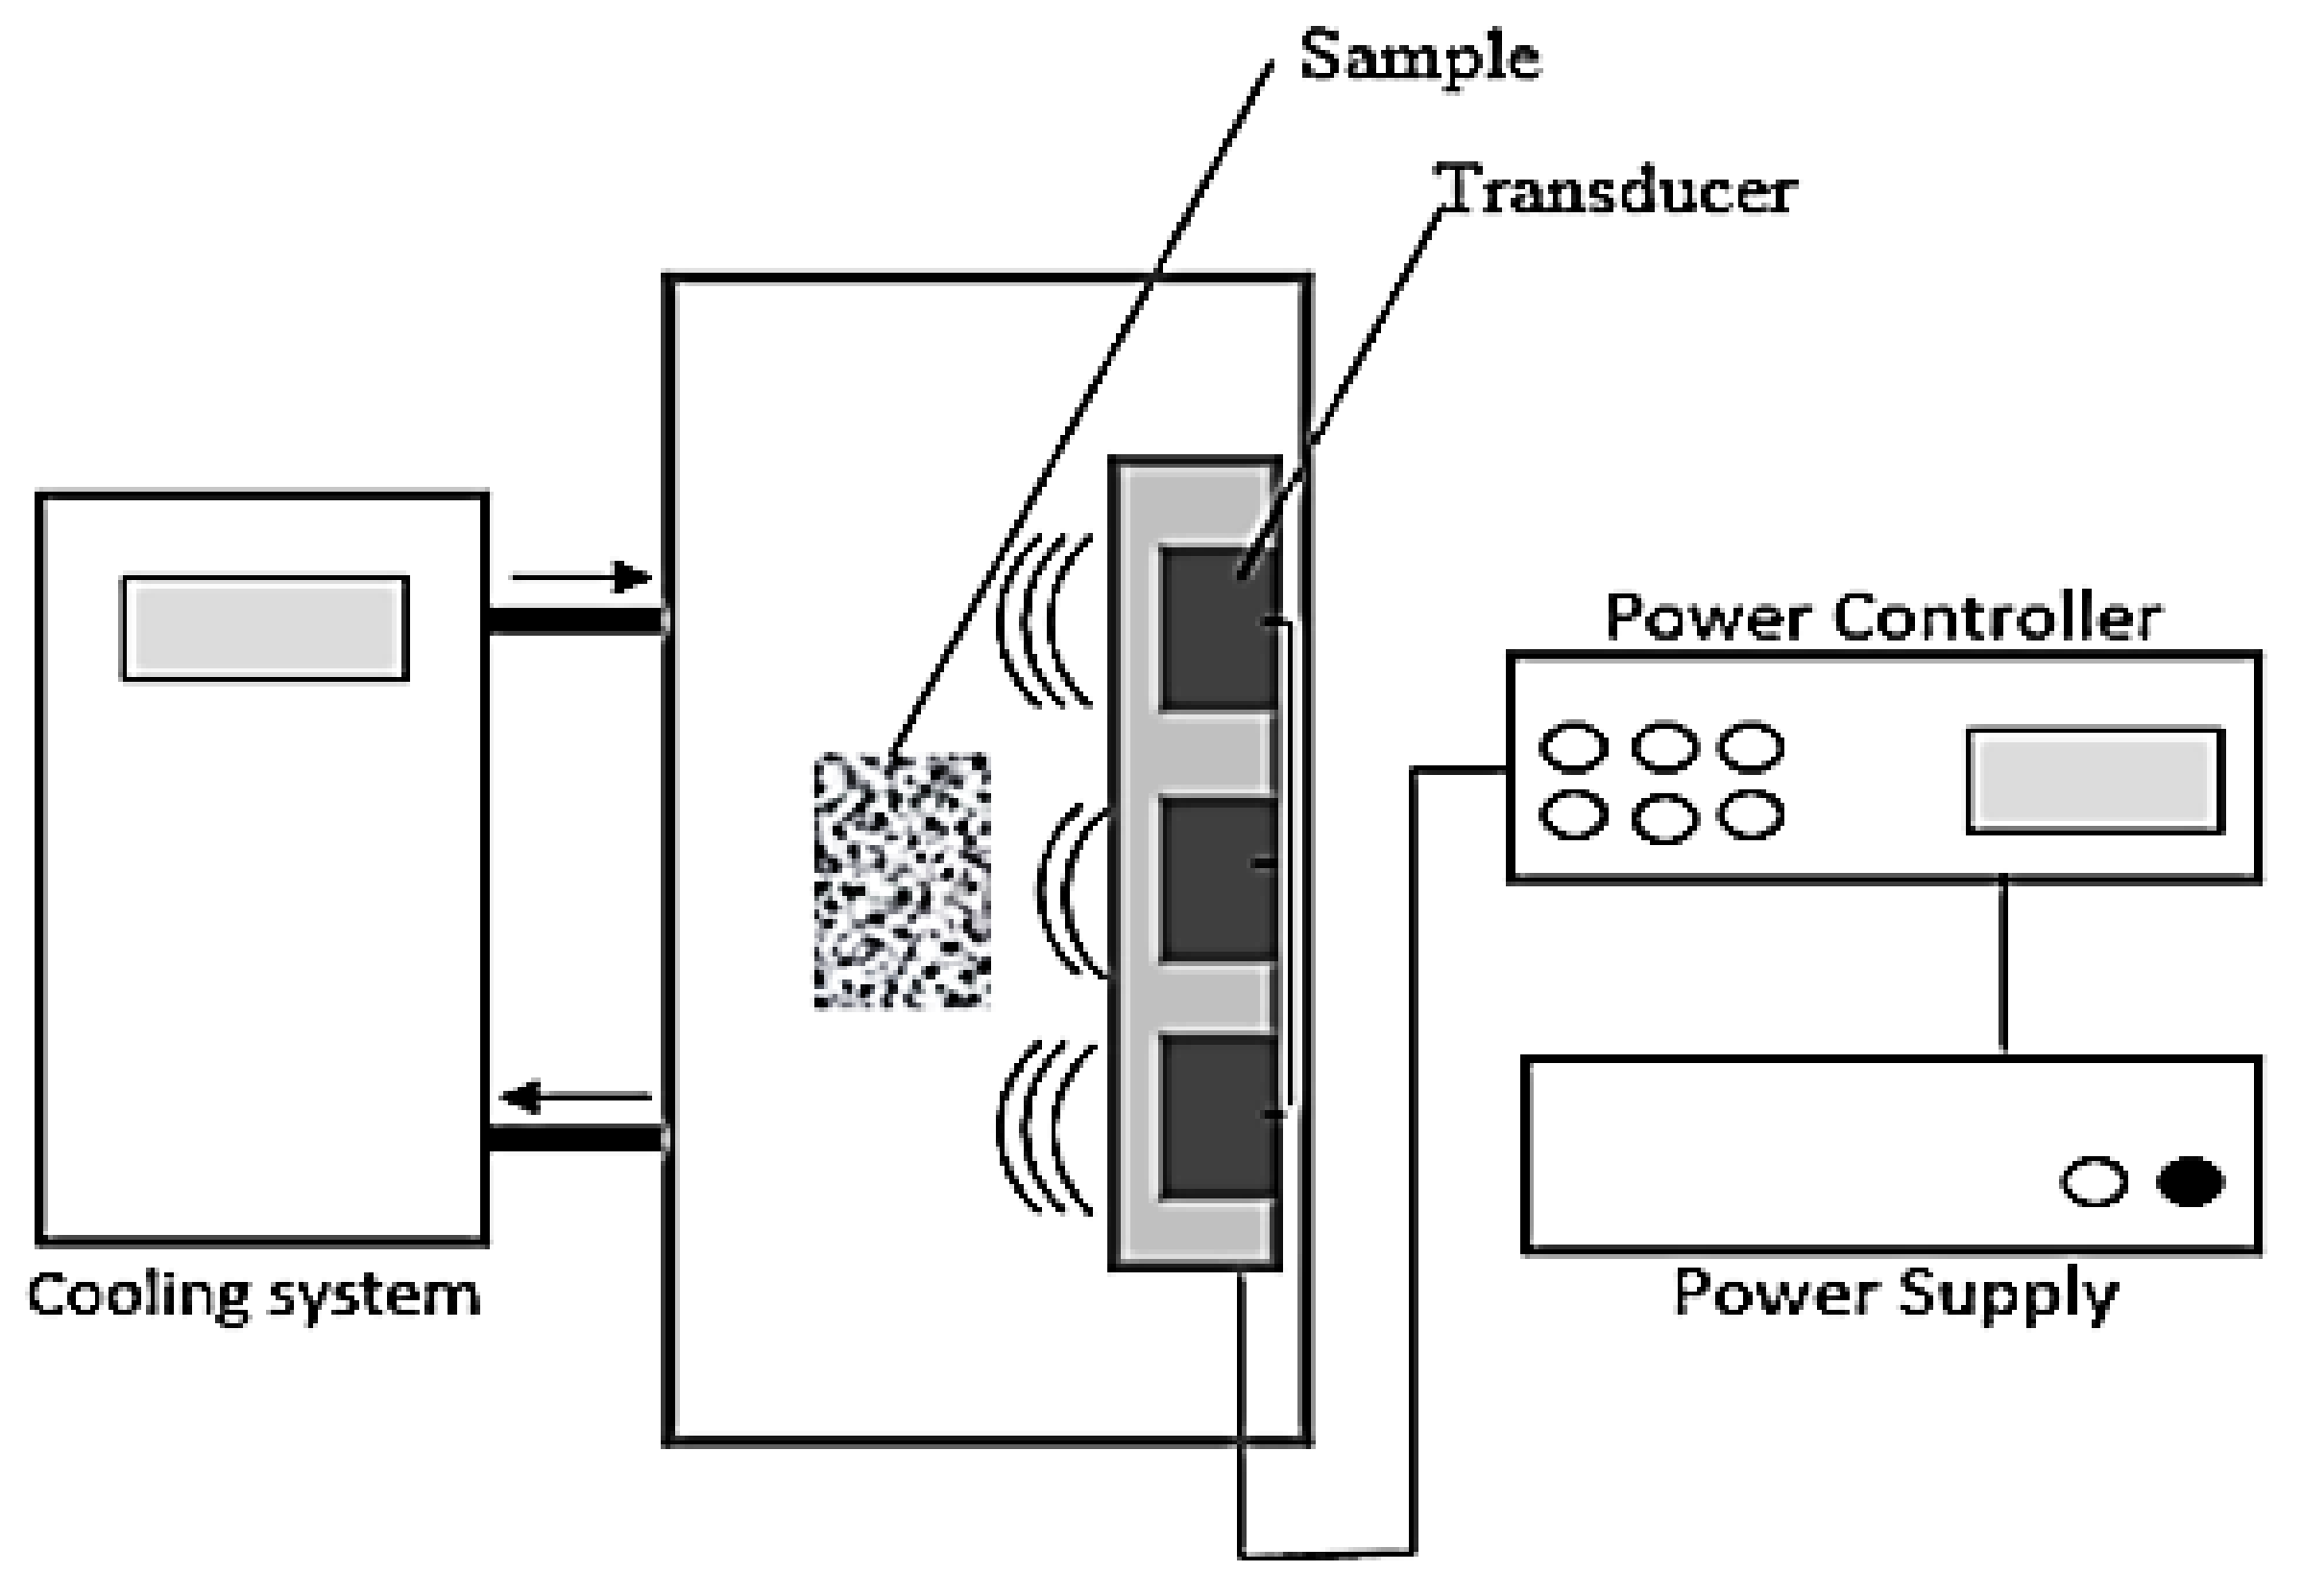
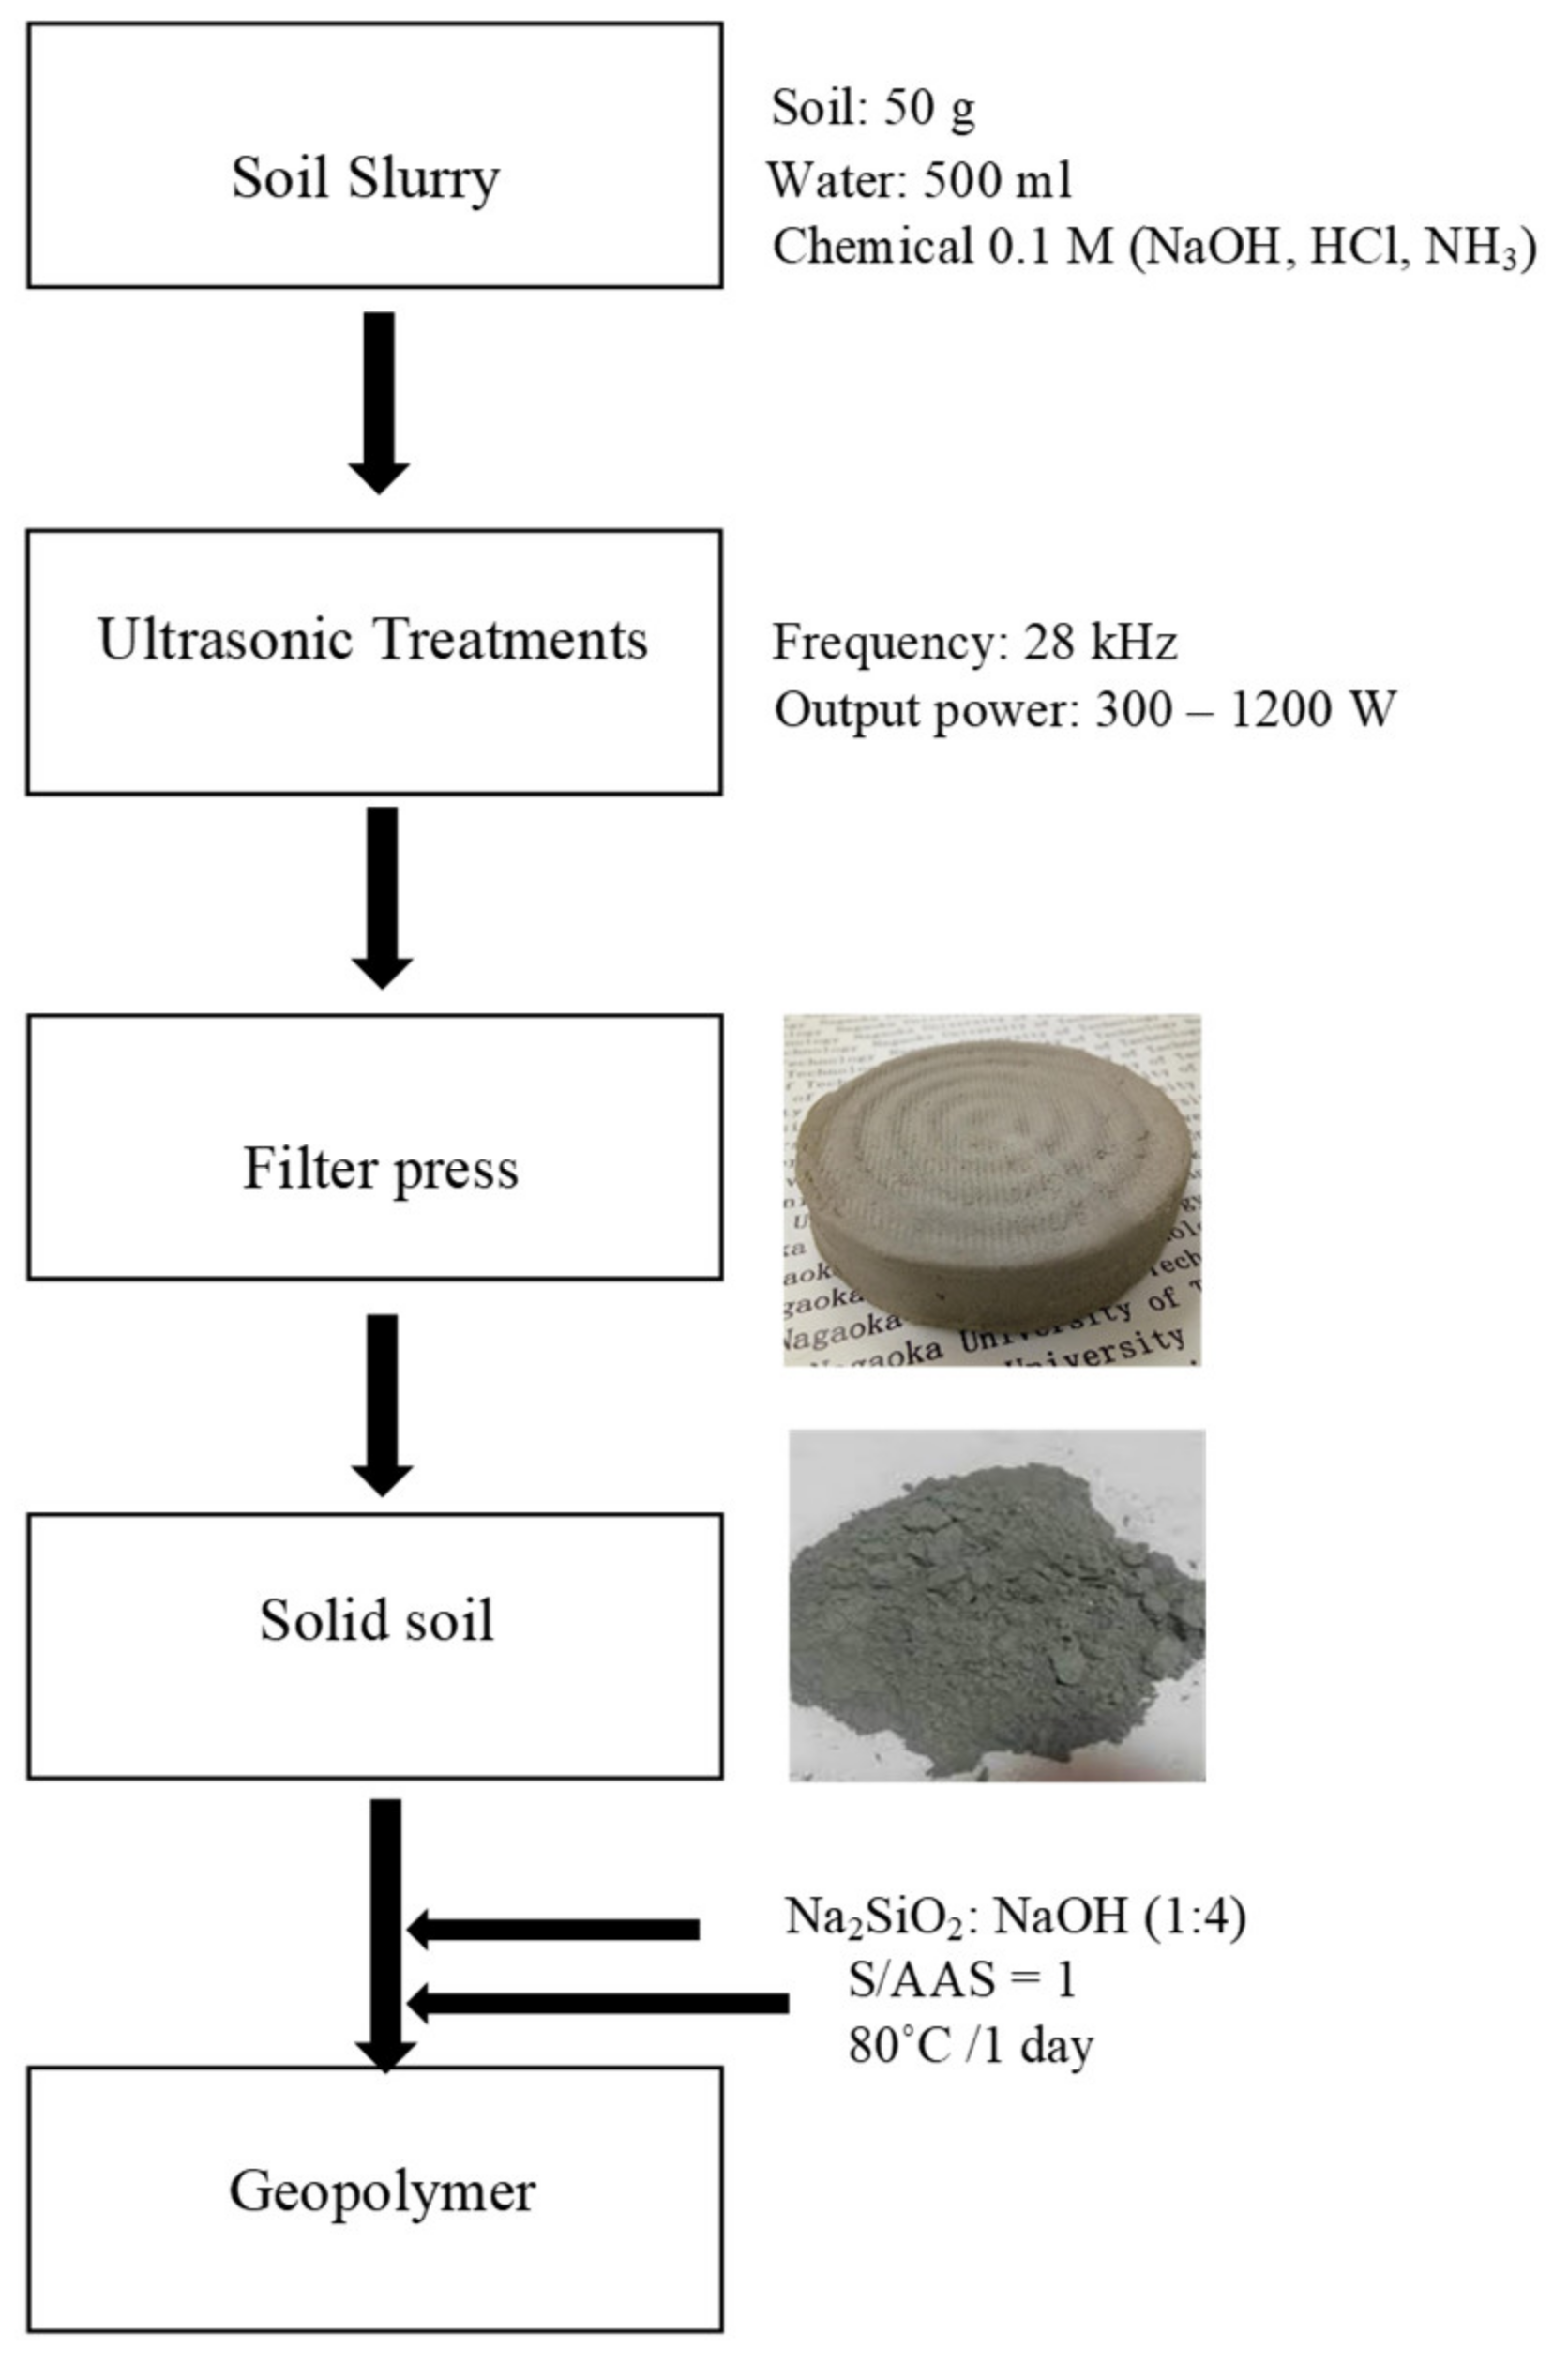
2. Materials and Methods

Waste soil was sampled from Niigata (Japan) and it was used for this study without further treatment. The soil sample which was classified as sludge (ρ = 1.3 g/cm3) was air-dried, ground, and passed through a 1.18 mm sieve before treatment. The experiment was carried out in a stainless-steel bath (10 cm length × 60 cm width × 50 cm depth) with a submersible stainless-steel rectangular container housing seven transducers (42 × 30 × 10 cm3). The US was generated with a resonance frequency of 28 kHz by a Honda electronic device (Dynashock WD 1200-28, Toyohashi, Japan) and 300–1200 W output power. For US washing of the excavated soil, the ratio of soil and washing liquid was set at 1:10 and the sample vessel was placed 5 cm from the transducer heads. The upper view of the US setup used for treatment was as shown in Figure 1.
The slurry sample was exposed to different ultrasonic intensity for a period of 60 min. During this study, 0.01–1 M aqueous solutions of HCl (acid), NaOH (strong base) and NH3 (weak base) were prepared and used as treatment additives. At the end of each US treatment, the slurry mixture was filter-pressed (Nihon-RokaSochi, Nagoya, Japan) with filter cloth (0.3 cm3/cm2.sec) for effective separation of the solid and liquid content. For the determination of soil components, the soil extracts were dried at 40 °C for 24 h. The dried extracts were then fused in pellets and the mineral content of the soil was analyzed by XRF (Rigaku ZSX Primu II, Rigaku Corp., Tokyo, Japan), Table 1 shows the effect of US on the soil chemical constituent when different additives were used for soil washing.
To evaluate the percentage efficiency of US to Carbon in soil (CIS) extraction, the following formula was used:
CIS = X R F   v a l u e   b e f o r e   U S X R F   v a l u e   a f t e r   U S X R F   v a l u e   b e f o r e   U S   × 100 .
After XRF analyses, the remaining solid extract was crushed and passed through a 0.25 mm sieve and fine soil powder was obtained. Considering the numerous generic information available on geopolymers, a rigorous trial-and-error method was adopted to fabricate soil-based geopolymer concrete similar to the technology currently used to manufacture fly ash-based geopolymer concrete. The fabrication of soil geopolymer was carried out step by step as shown in Figure 2.
An alkalis activator was prepared using 1 M aqueous Na2SiO3 with 10 M NaOH at a ratio of 1:4, meanwhile, the weight ratio of soil (S) and the alkali activator solution (AAS) was fixed at 1:1. The US treated soil powder was mixed with the AAS and then stirred for 60 s forming a paste. The paste was poured into a plastic mold (30 × 30 × 30 mm3) and cured in an oven (Avo 200NS, ASONE-Japan, Osaka, Japan) at 80 °C for 24 hr. After curing, the samples were crushed for further characterization. The X-ray Diffractometer (XRD) (Rigaku smart lab 3 kW, Tokyo, Japan) was used with Cu K α radiation at 40 kV and 30 mA. The sample was measured on a glass plate after crushing, with scanning angle 10–60 degrees and scanning speed were fixed at 2 ° /min. X-ray fluorescence analyzer (Rigaku ZSX primus, Tokyo, Japan) was used to analyze the composition of geopolymer samples. For this measurement, 10 mm diameter pellets were made using aluminum ring and a high pressing machine. To investigate the chemical bonding inside the geopolymer, the geopolymer powder after crushing was mixed with KBr at a concentration of 1.0–5.0 wt% after which a disk of the mixture was formed by a high press machine. FTIR (FT-IR-4100, JASCO, Tokyo, Japan) spectra were obtained with 20 scans from 400 to 4000 cm−1 at a resolution of 2.0 cm−1 in transparent mode. SEM (Desktop Scanning Electron Microscope, Hitachi TM3030 Plus, Tokyo, Japan) was used to see the microstructure in geopolymer. For this analysis, all the geopolymer samples were coated with a thin layer of gold on their surfaces after drying with a vacuum pump for 24 h. The compressive strength of geopolymer samples were measured with a testing machine (UH-F50A, SHIMAZU, Kyoto, Japan) and the ratio of compression were fixed to 0.5 mm/min.

3. Results and Discussion

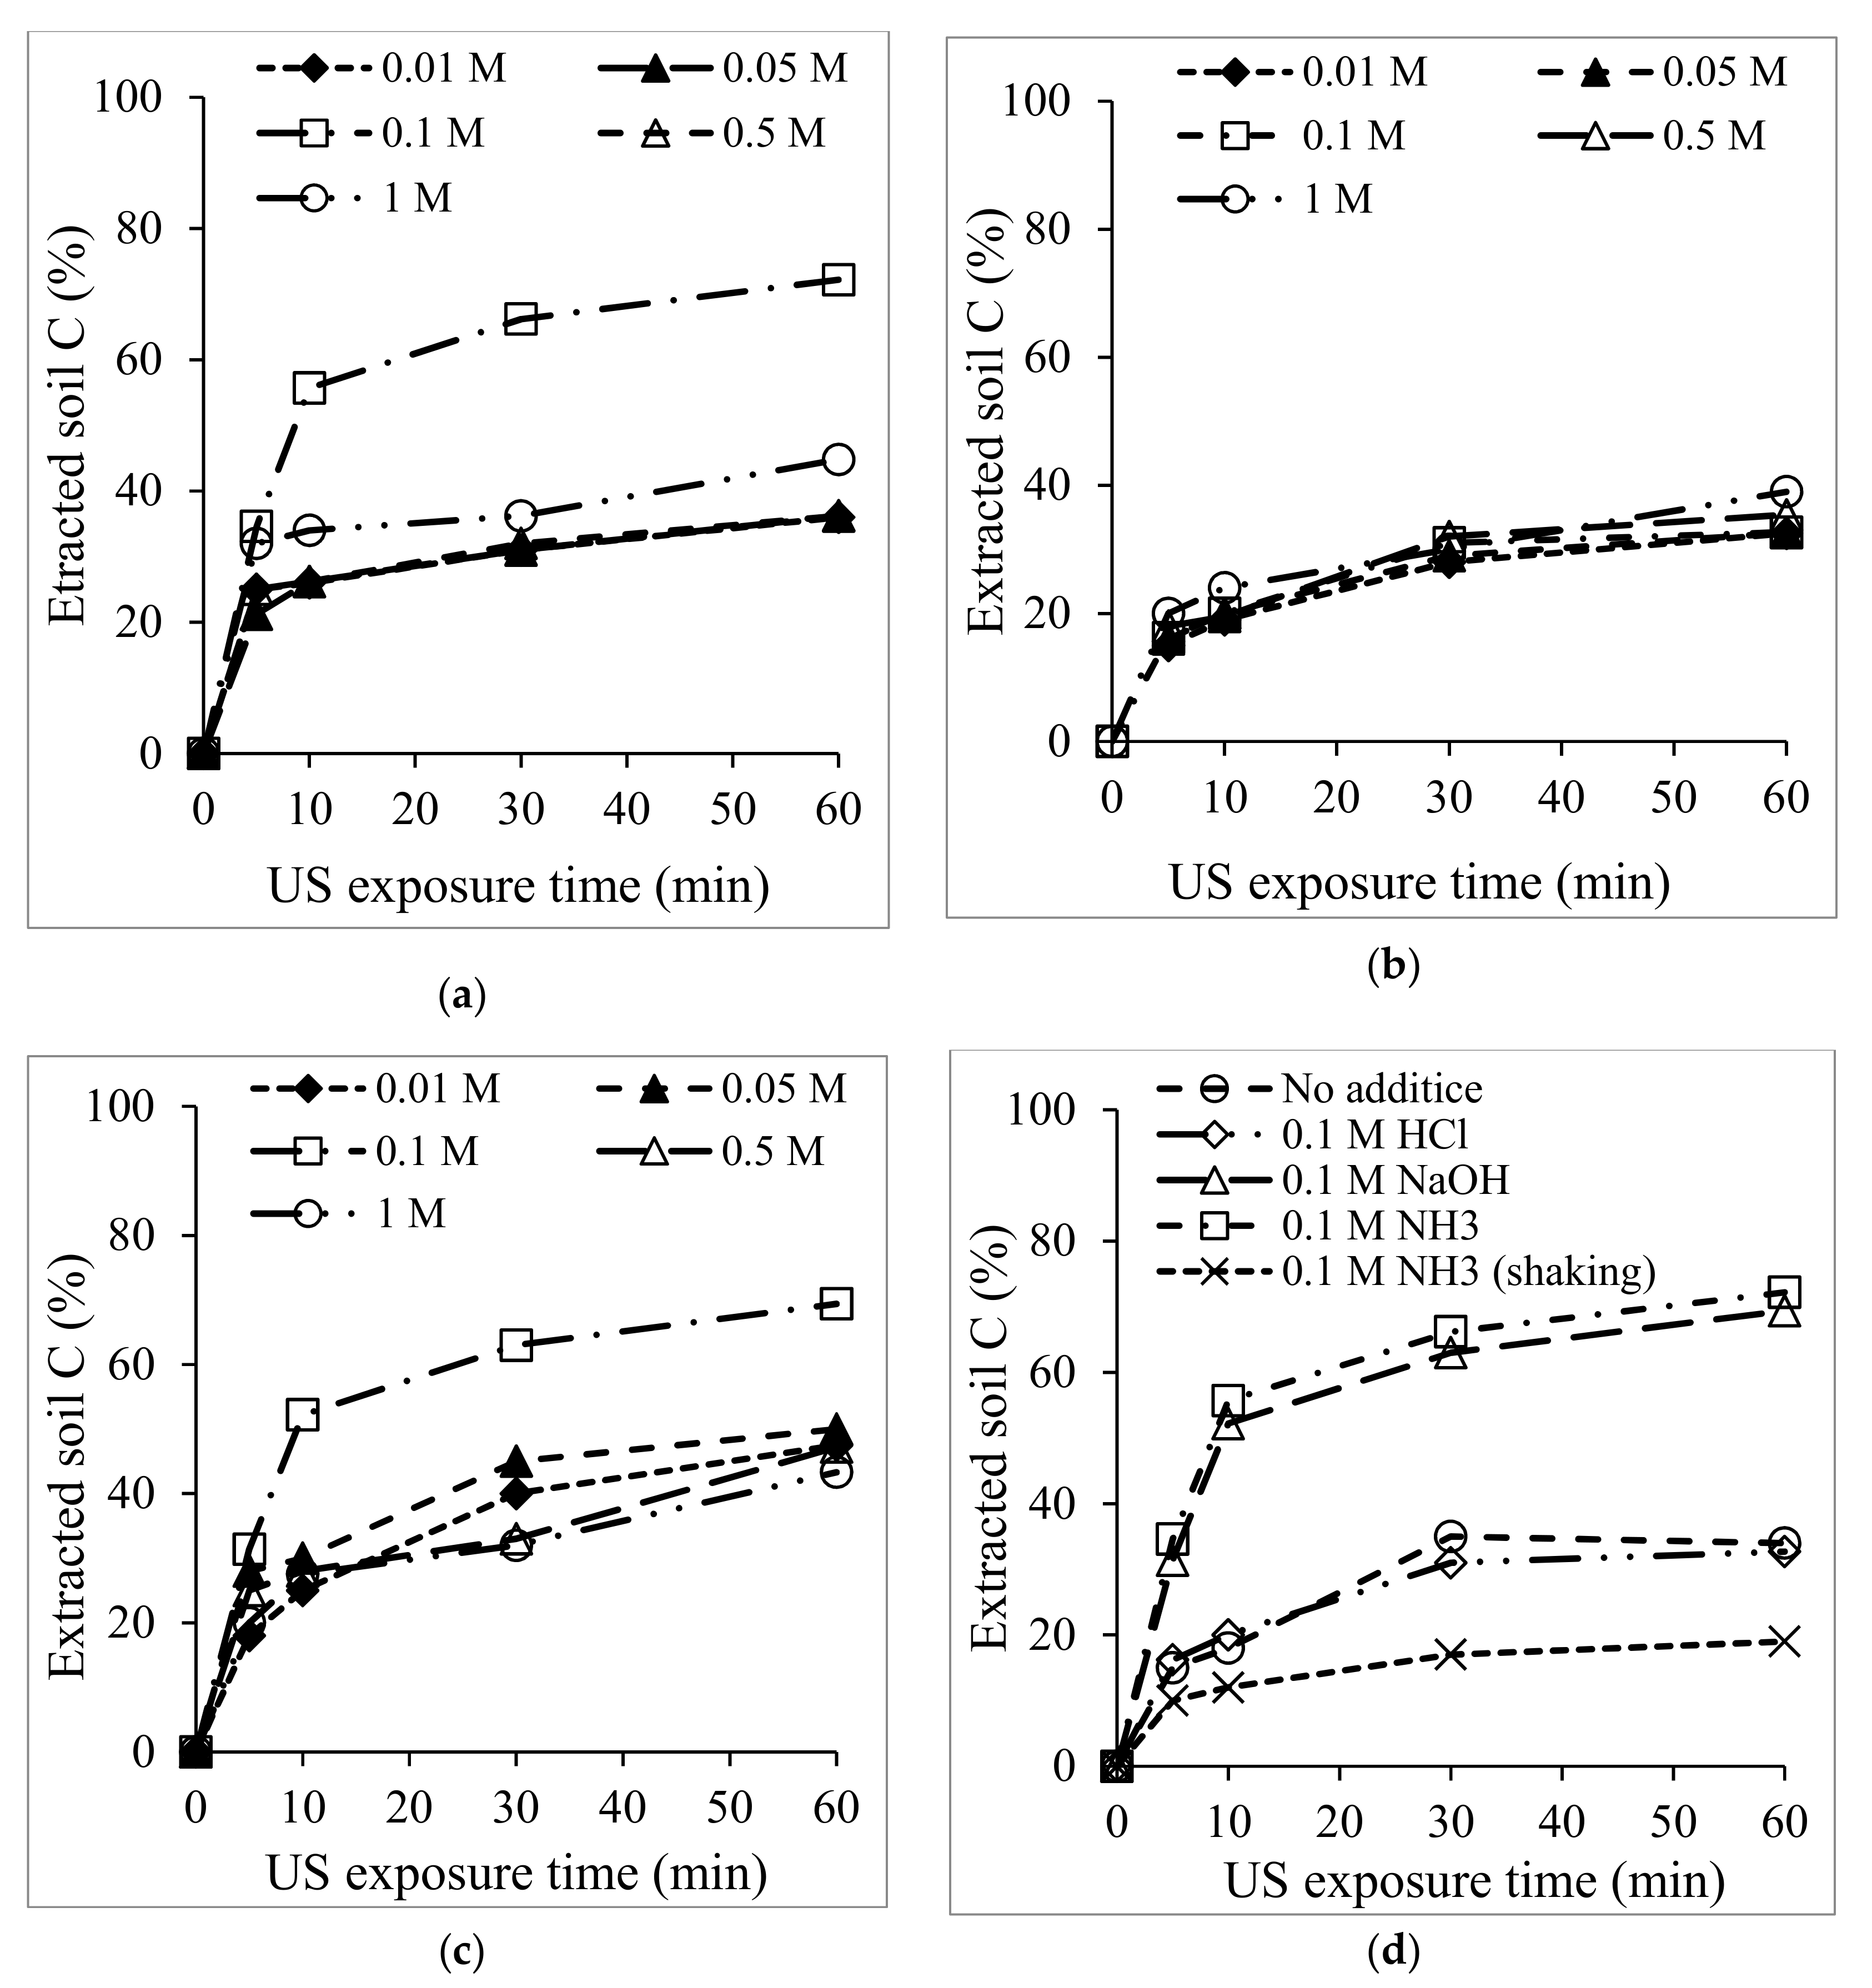
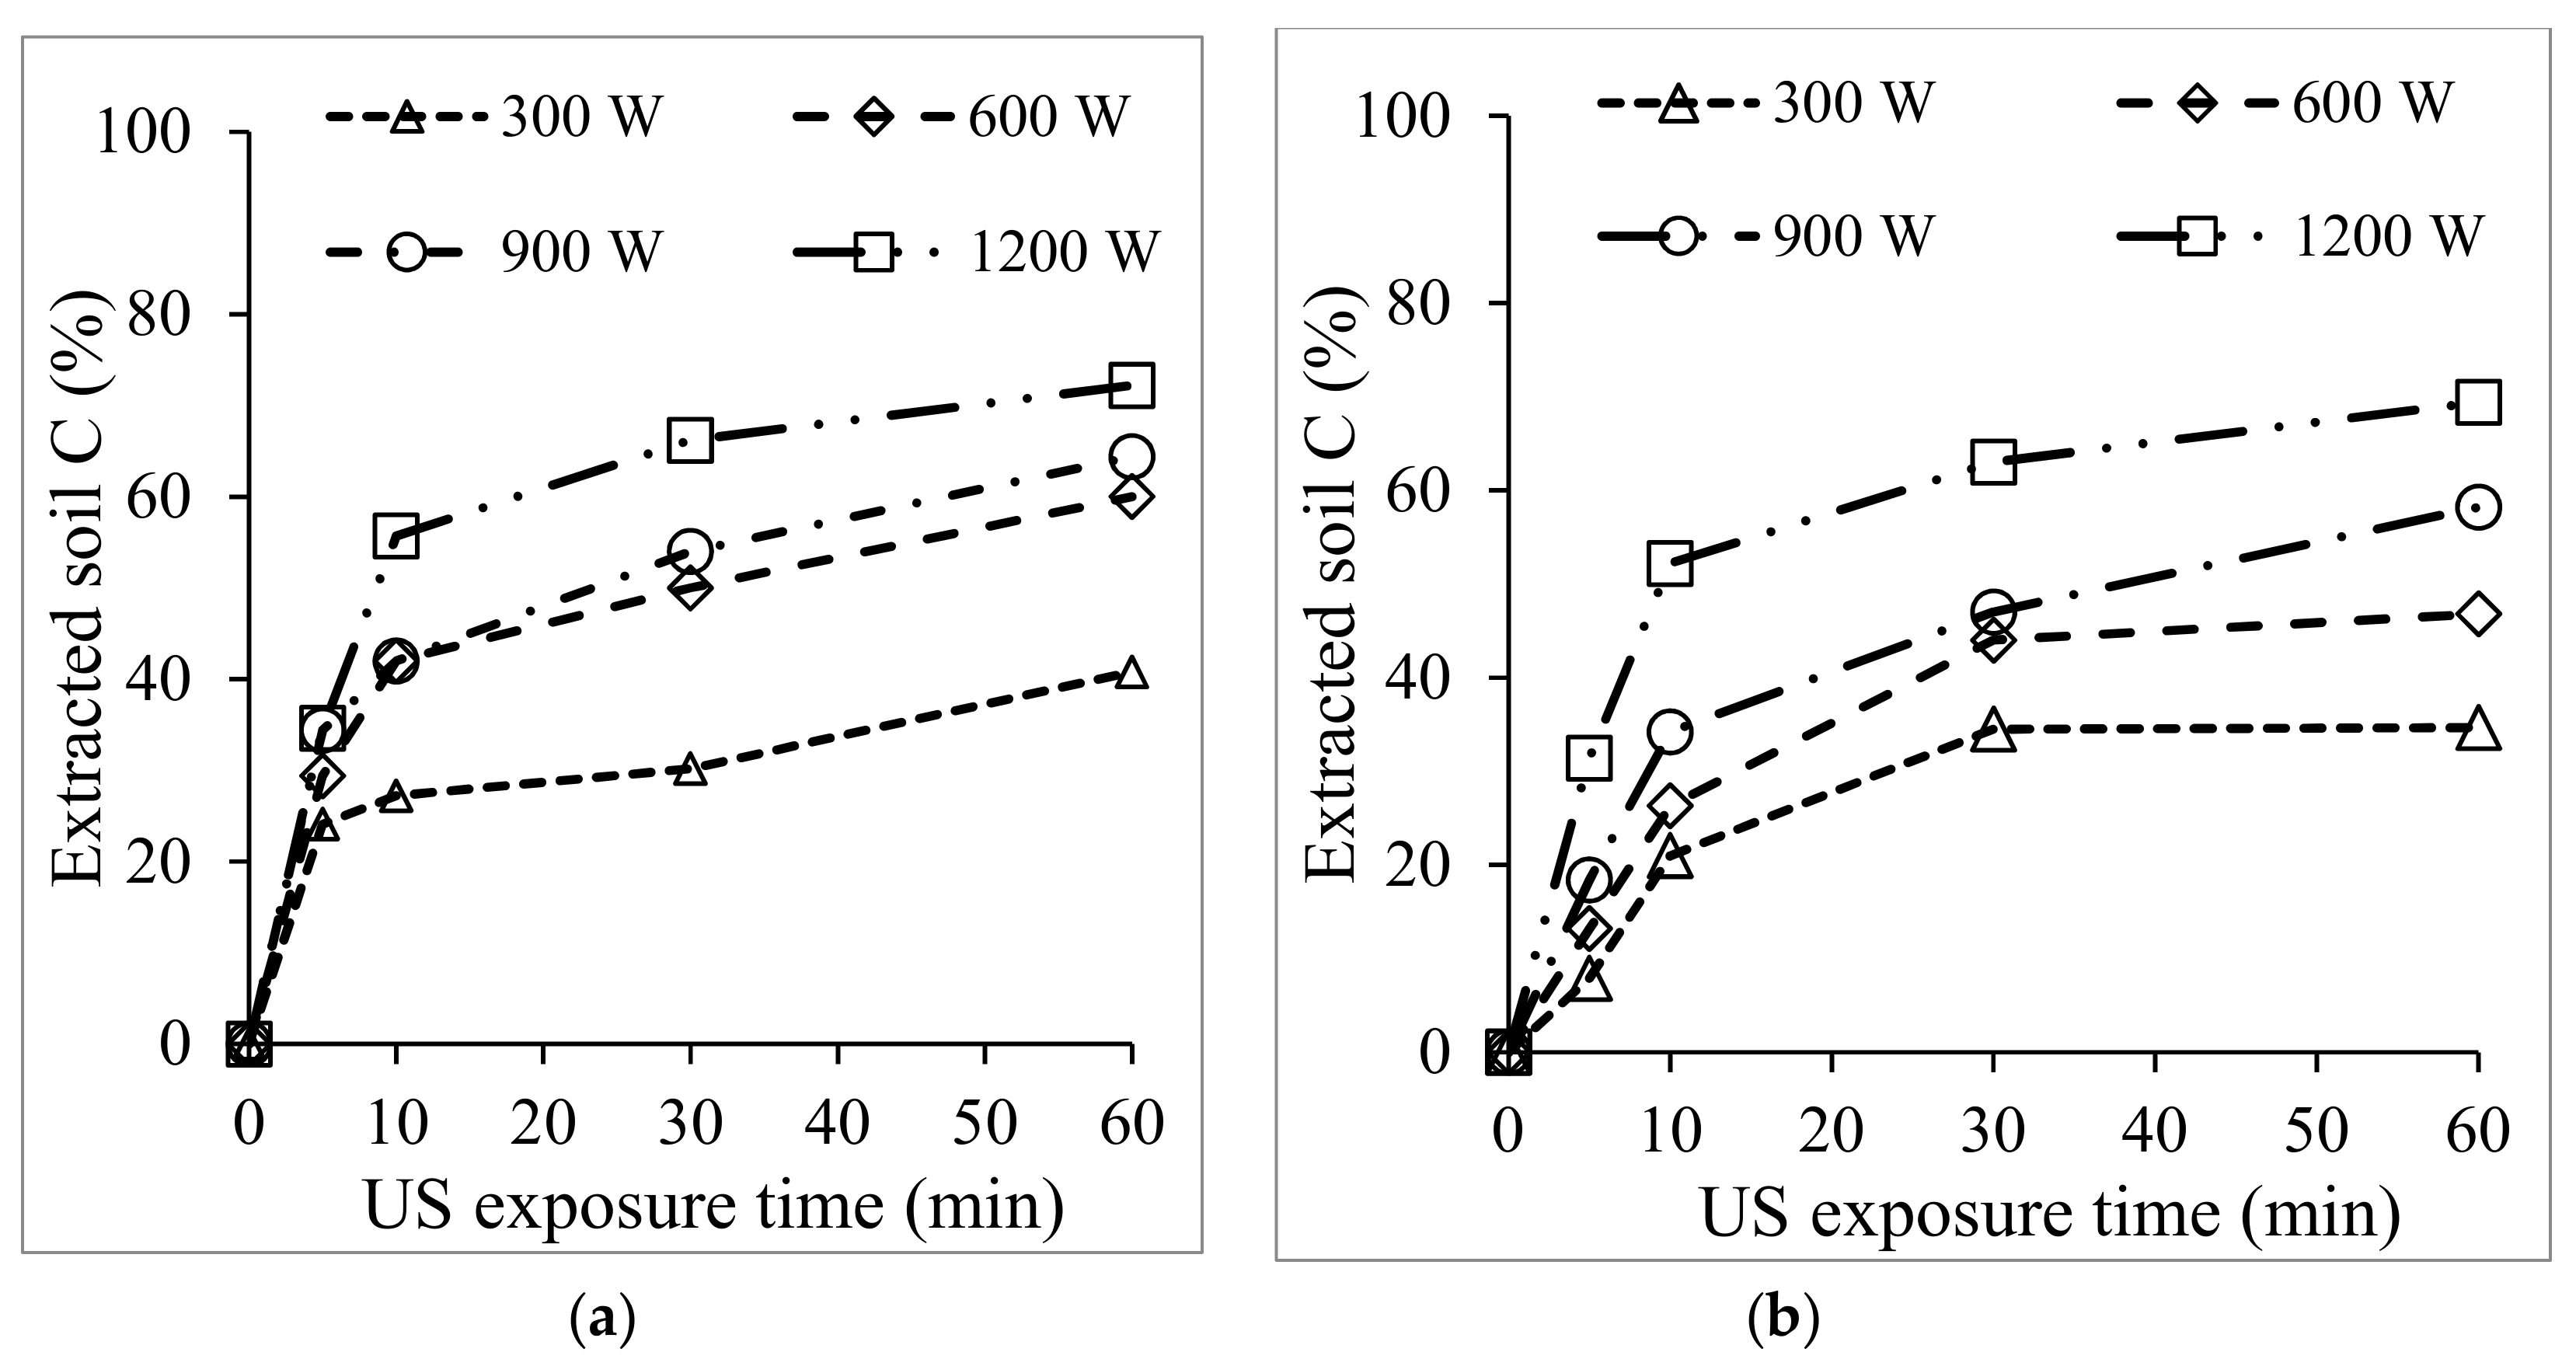
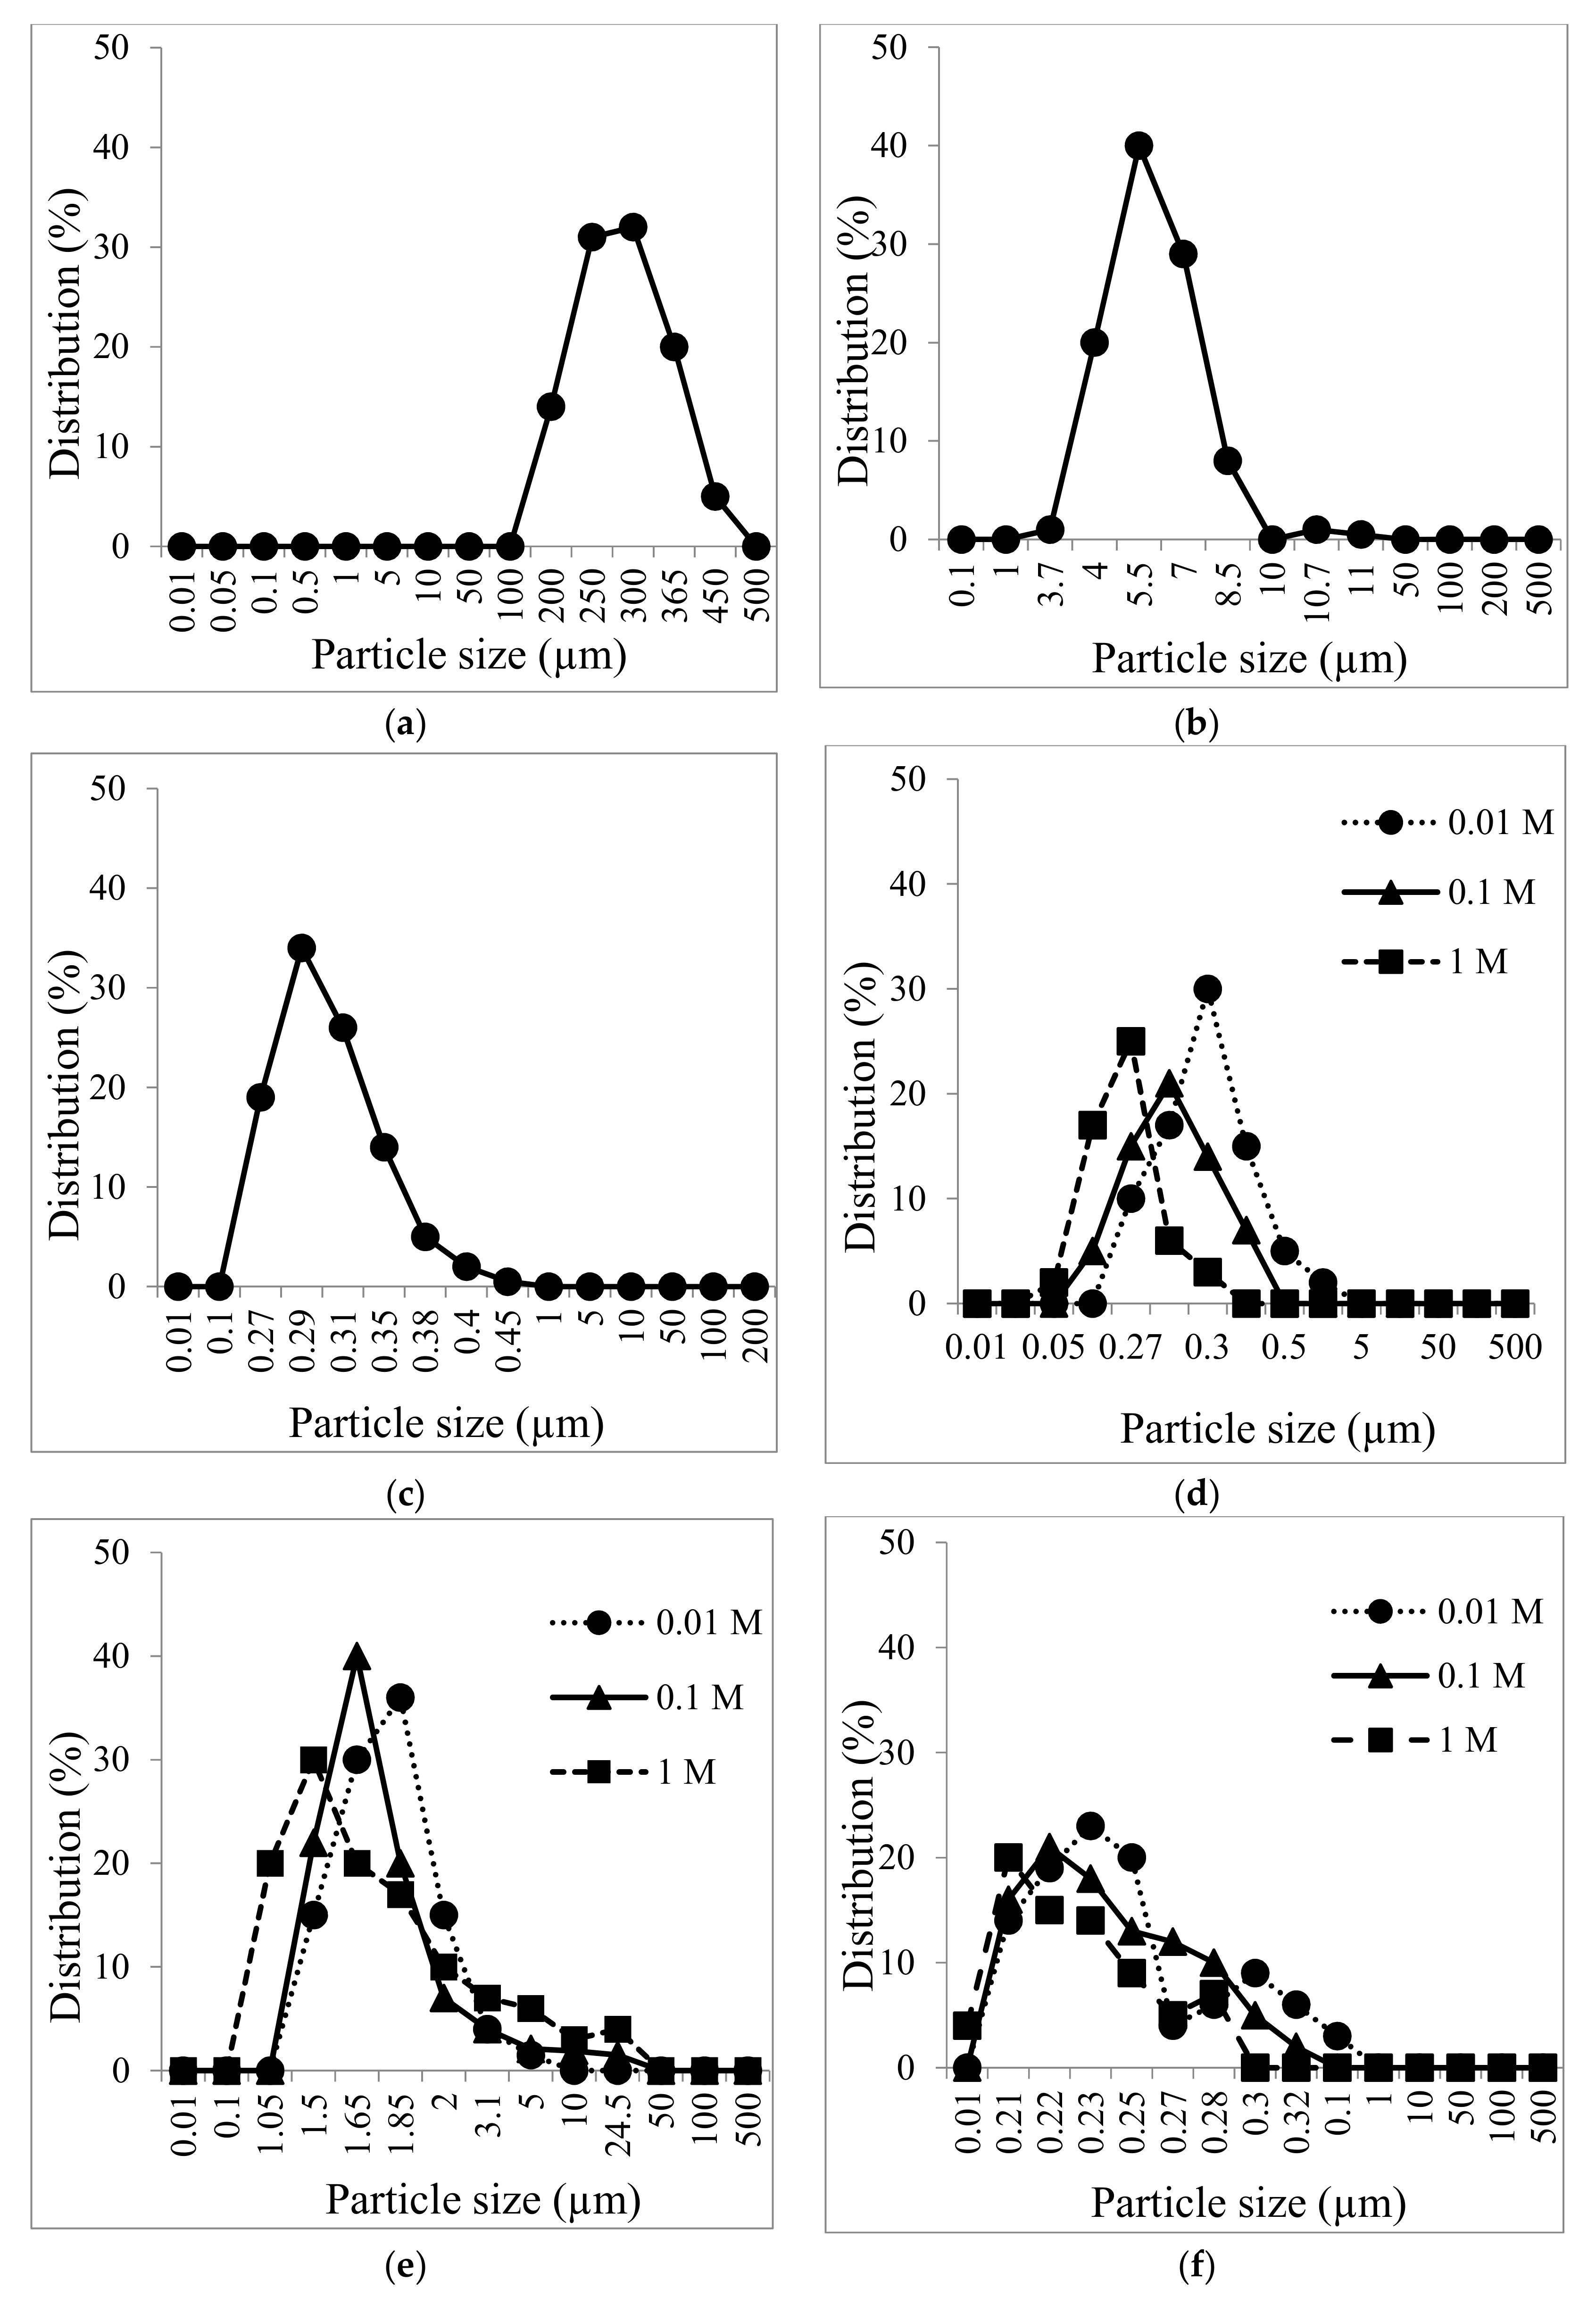
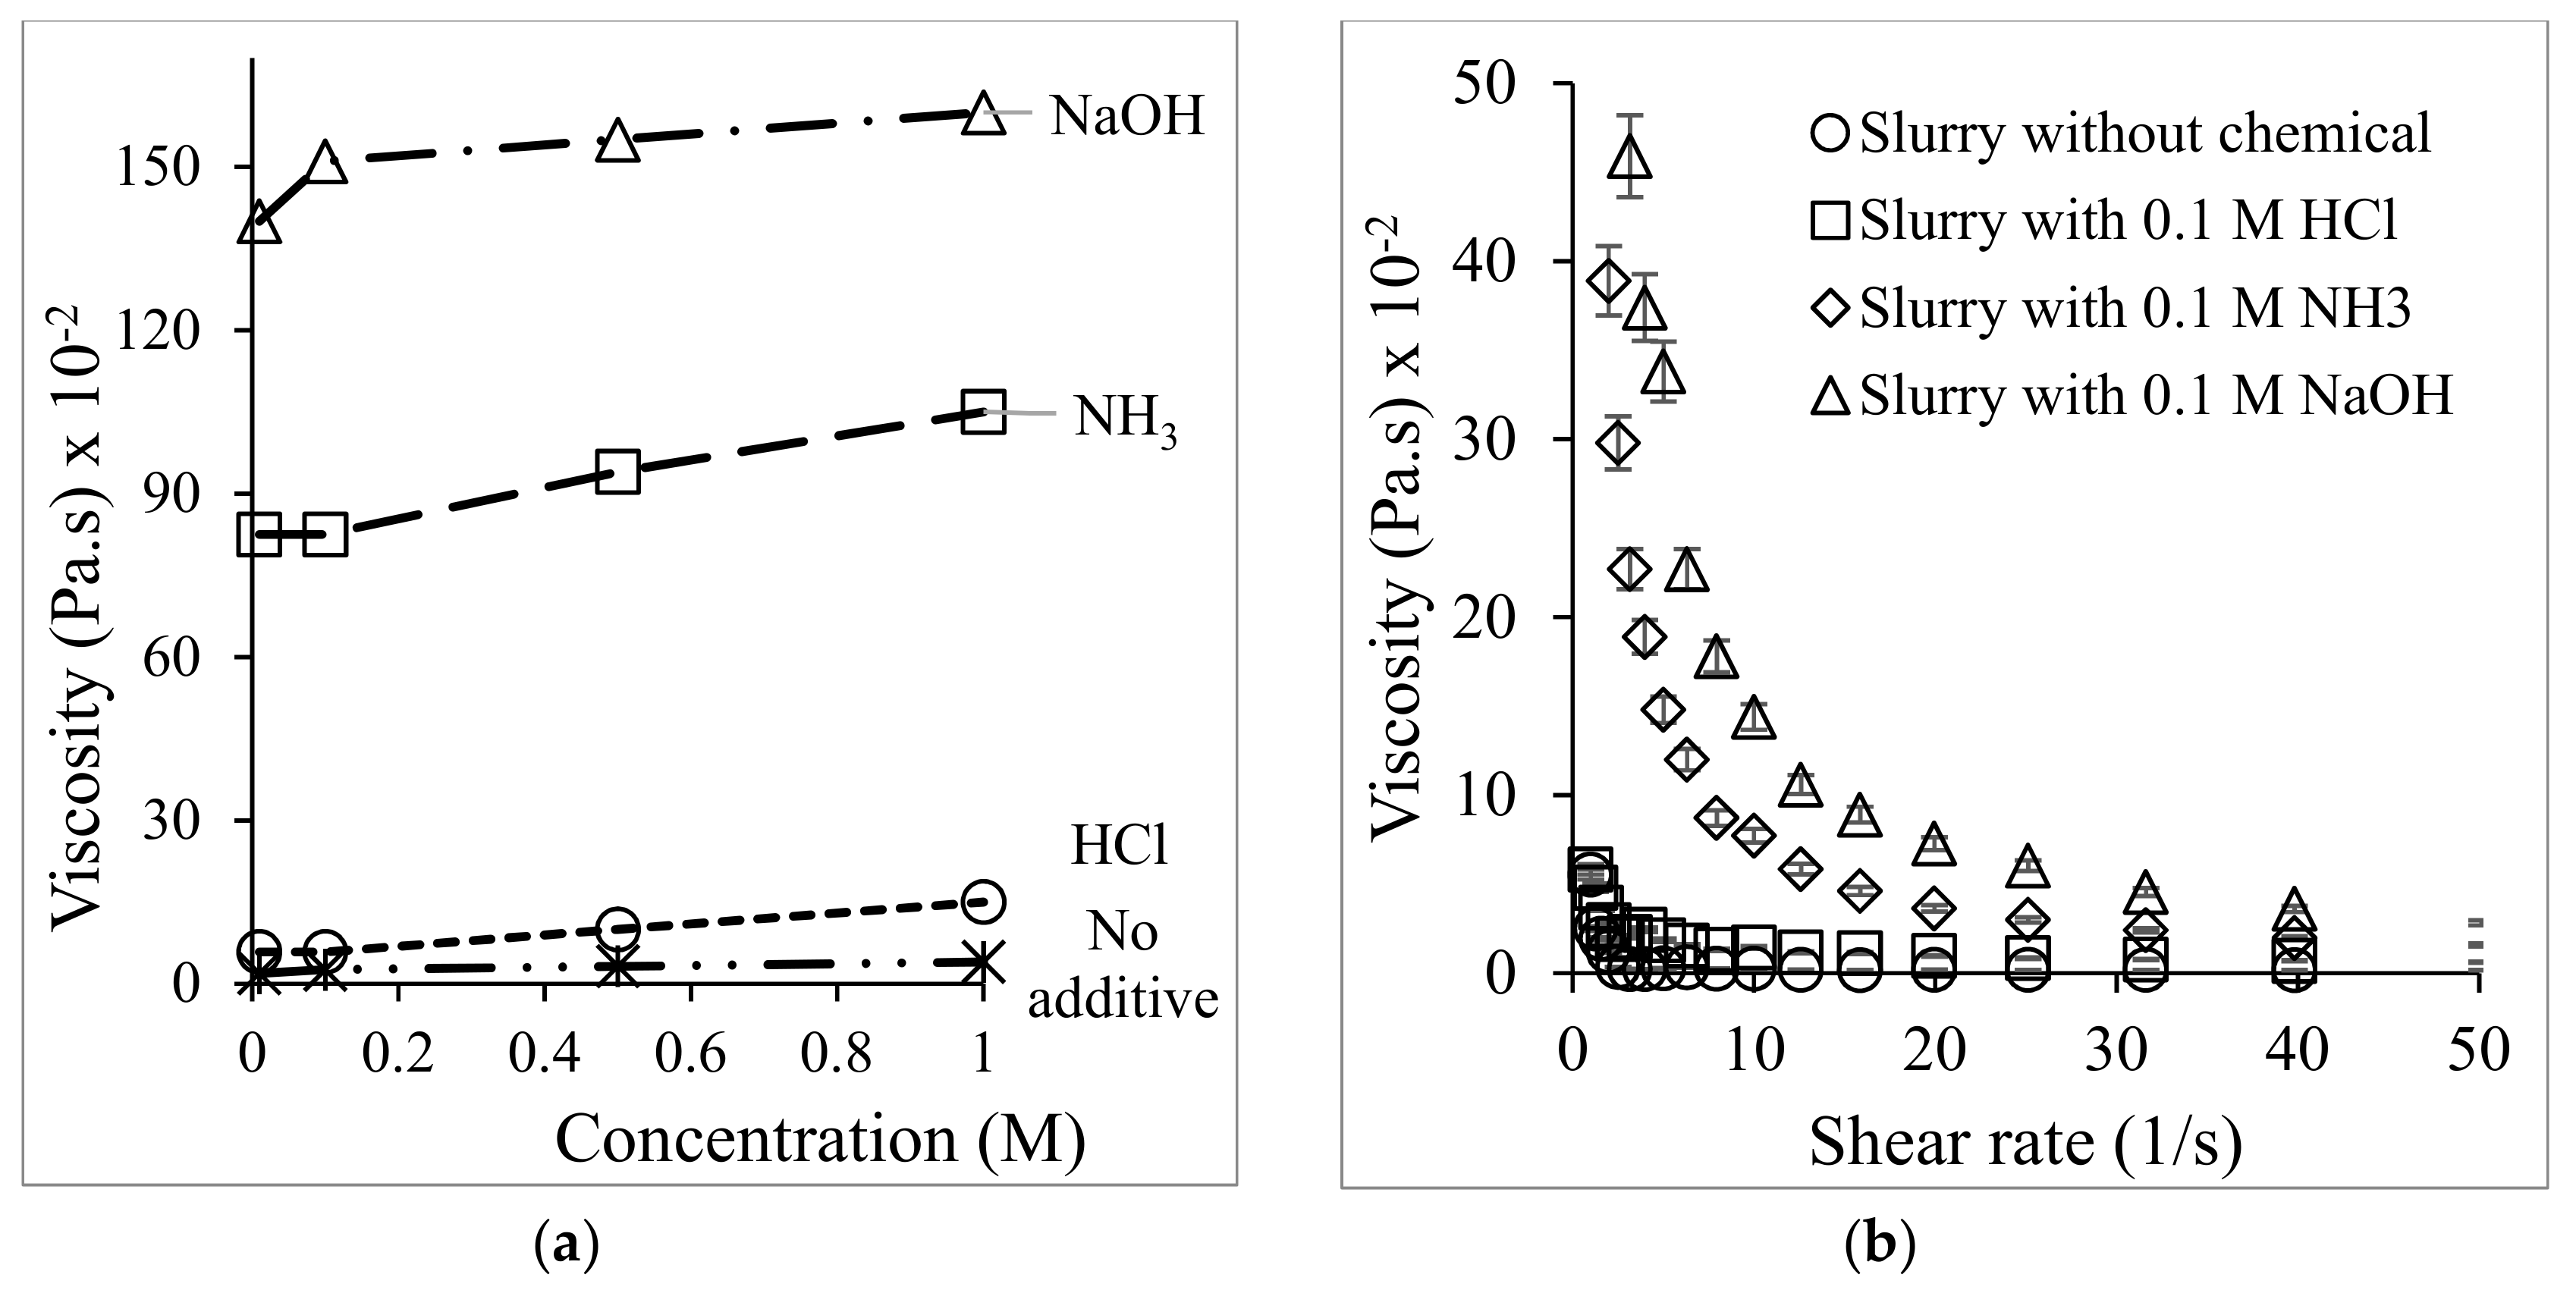
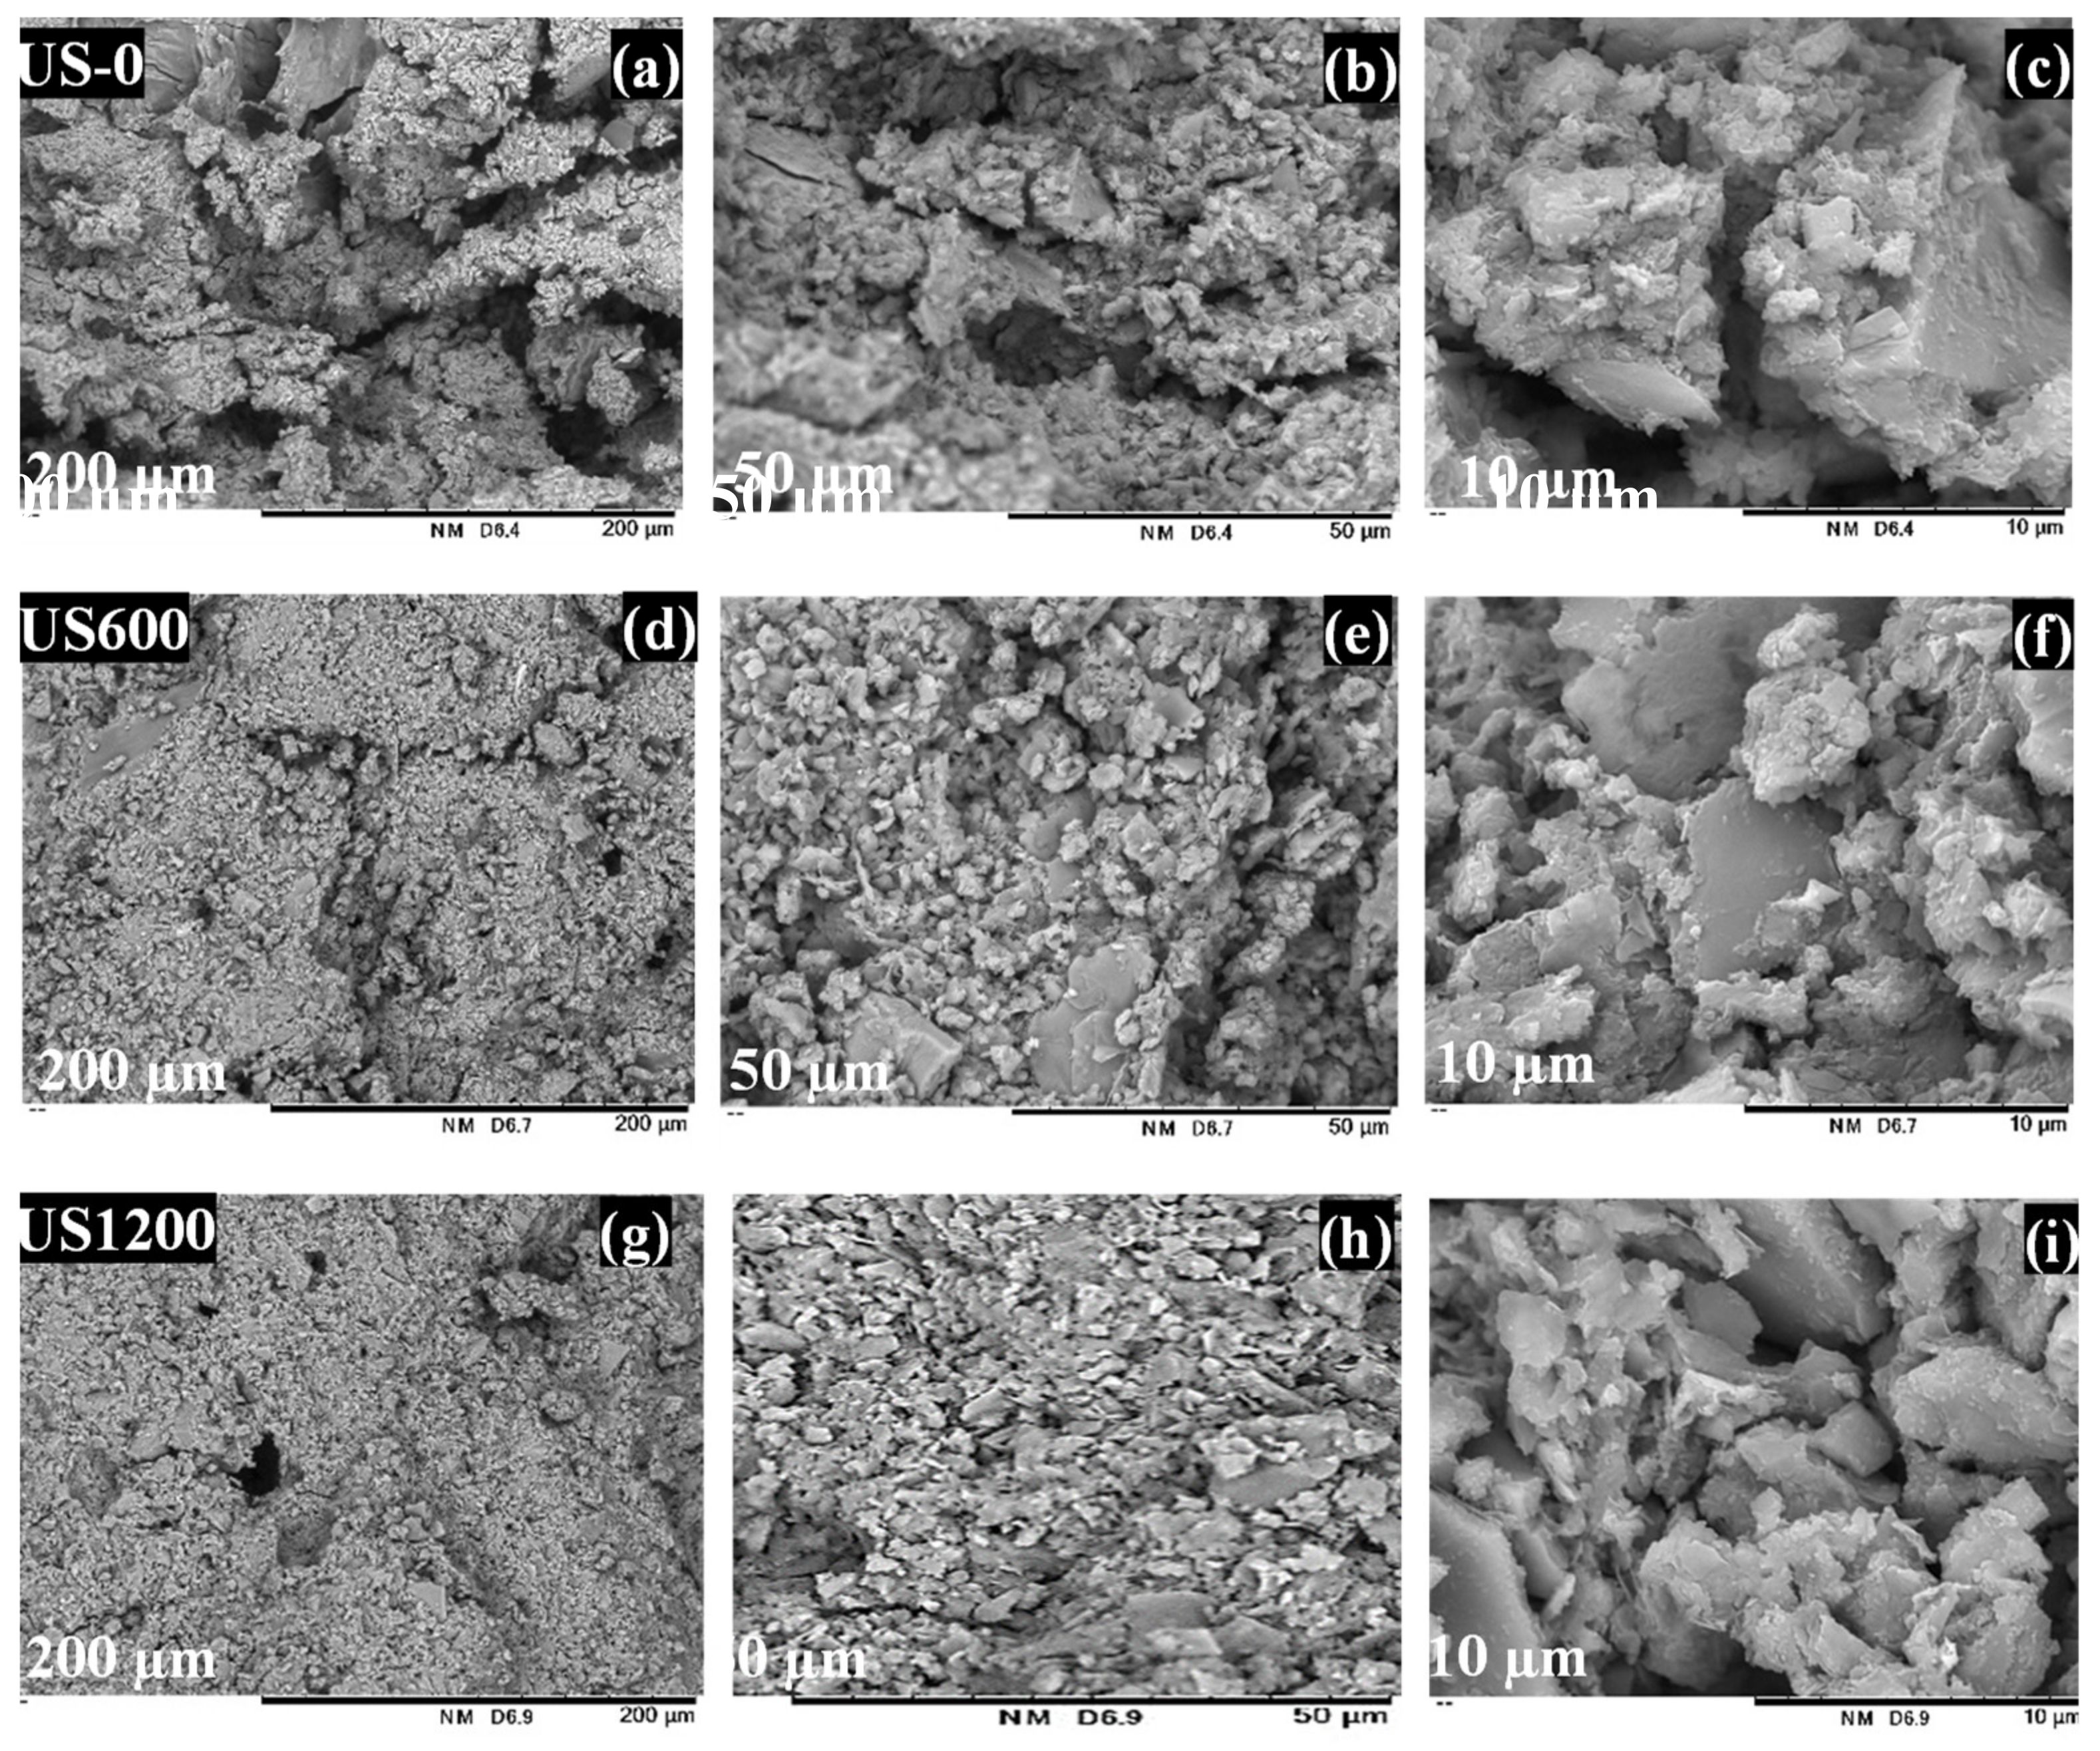
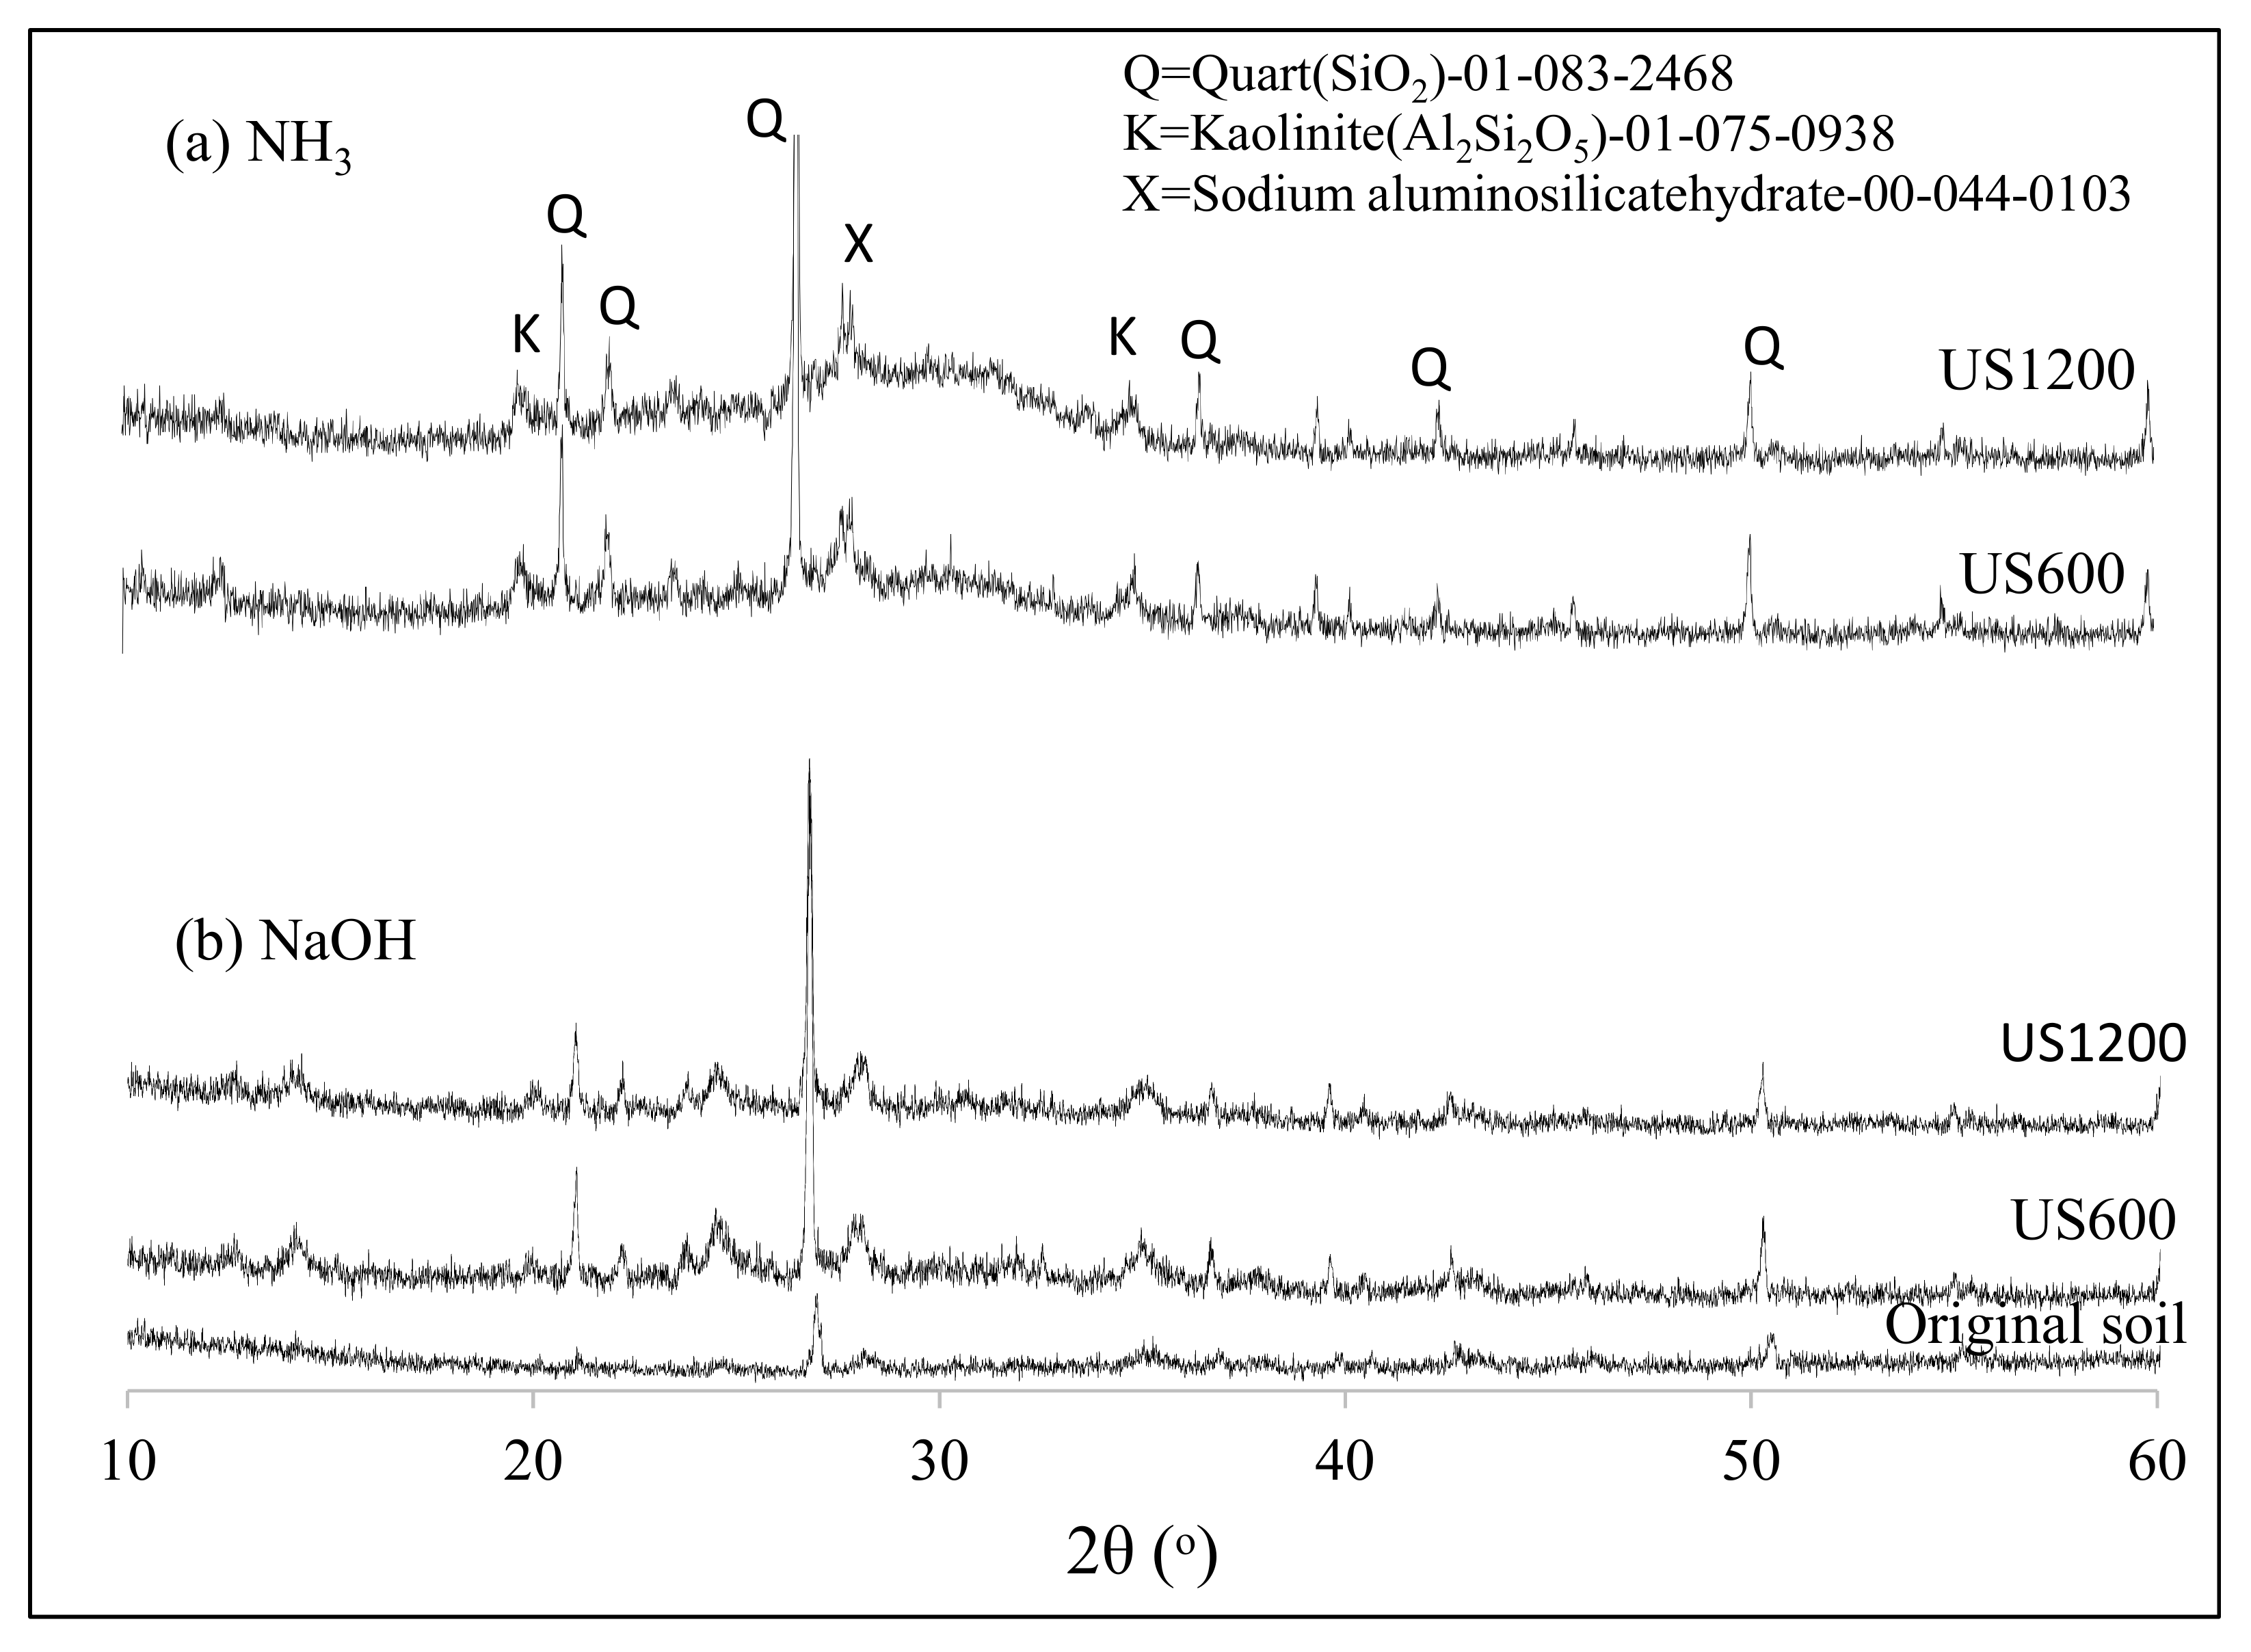
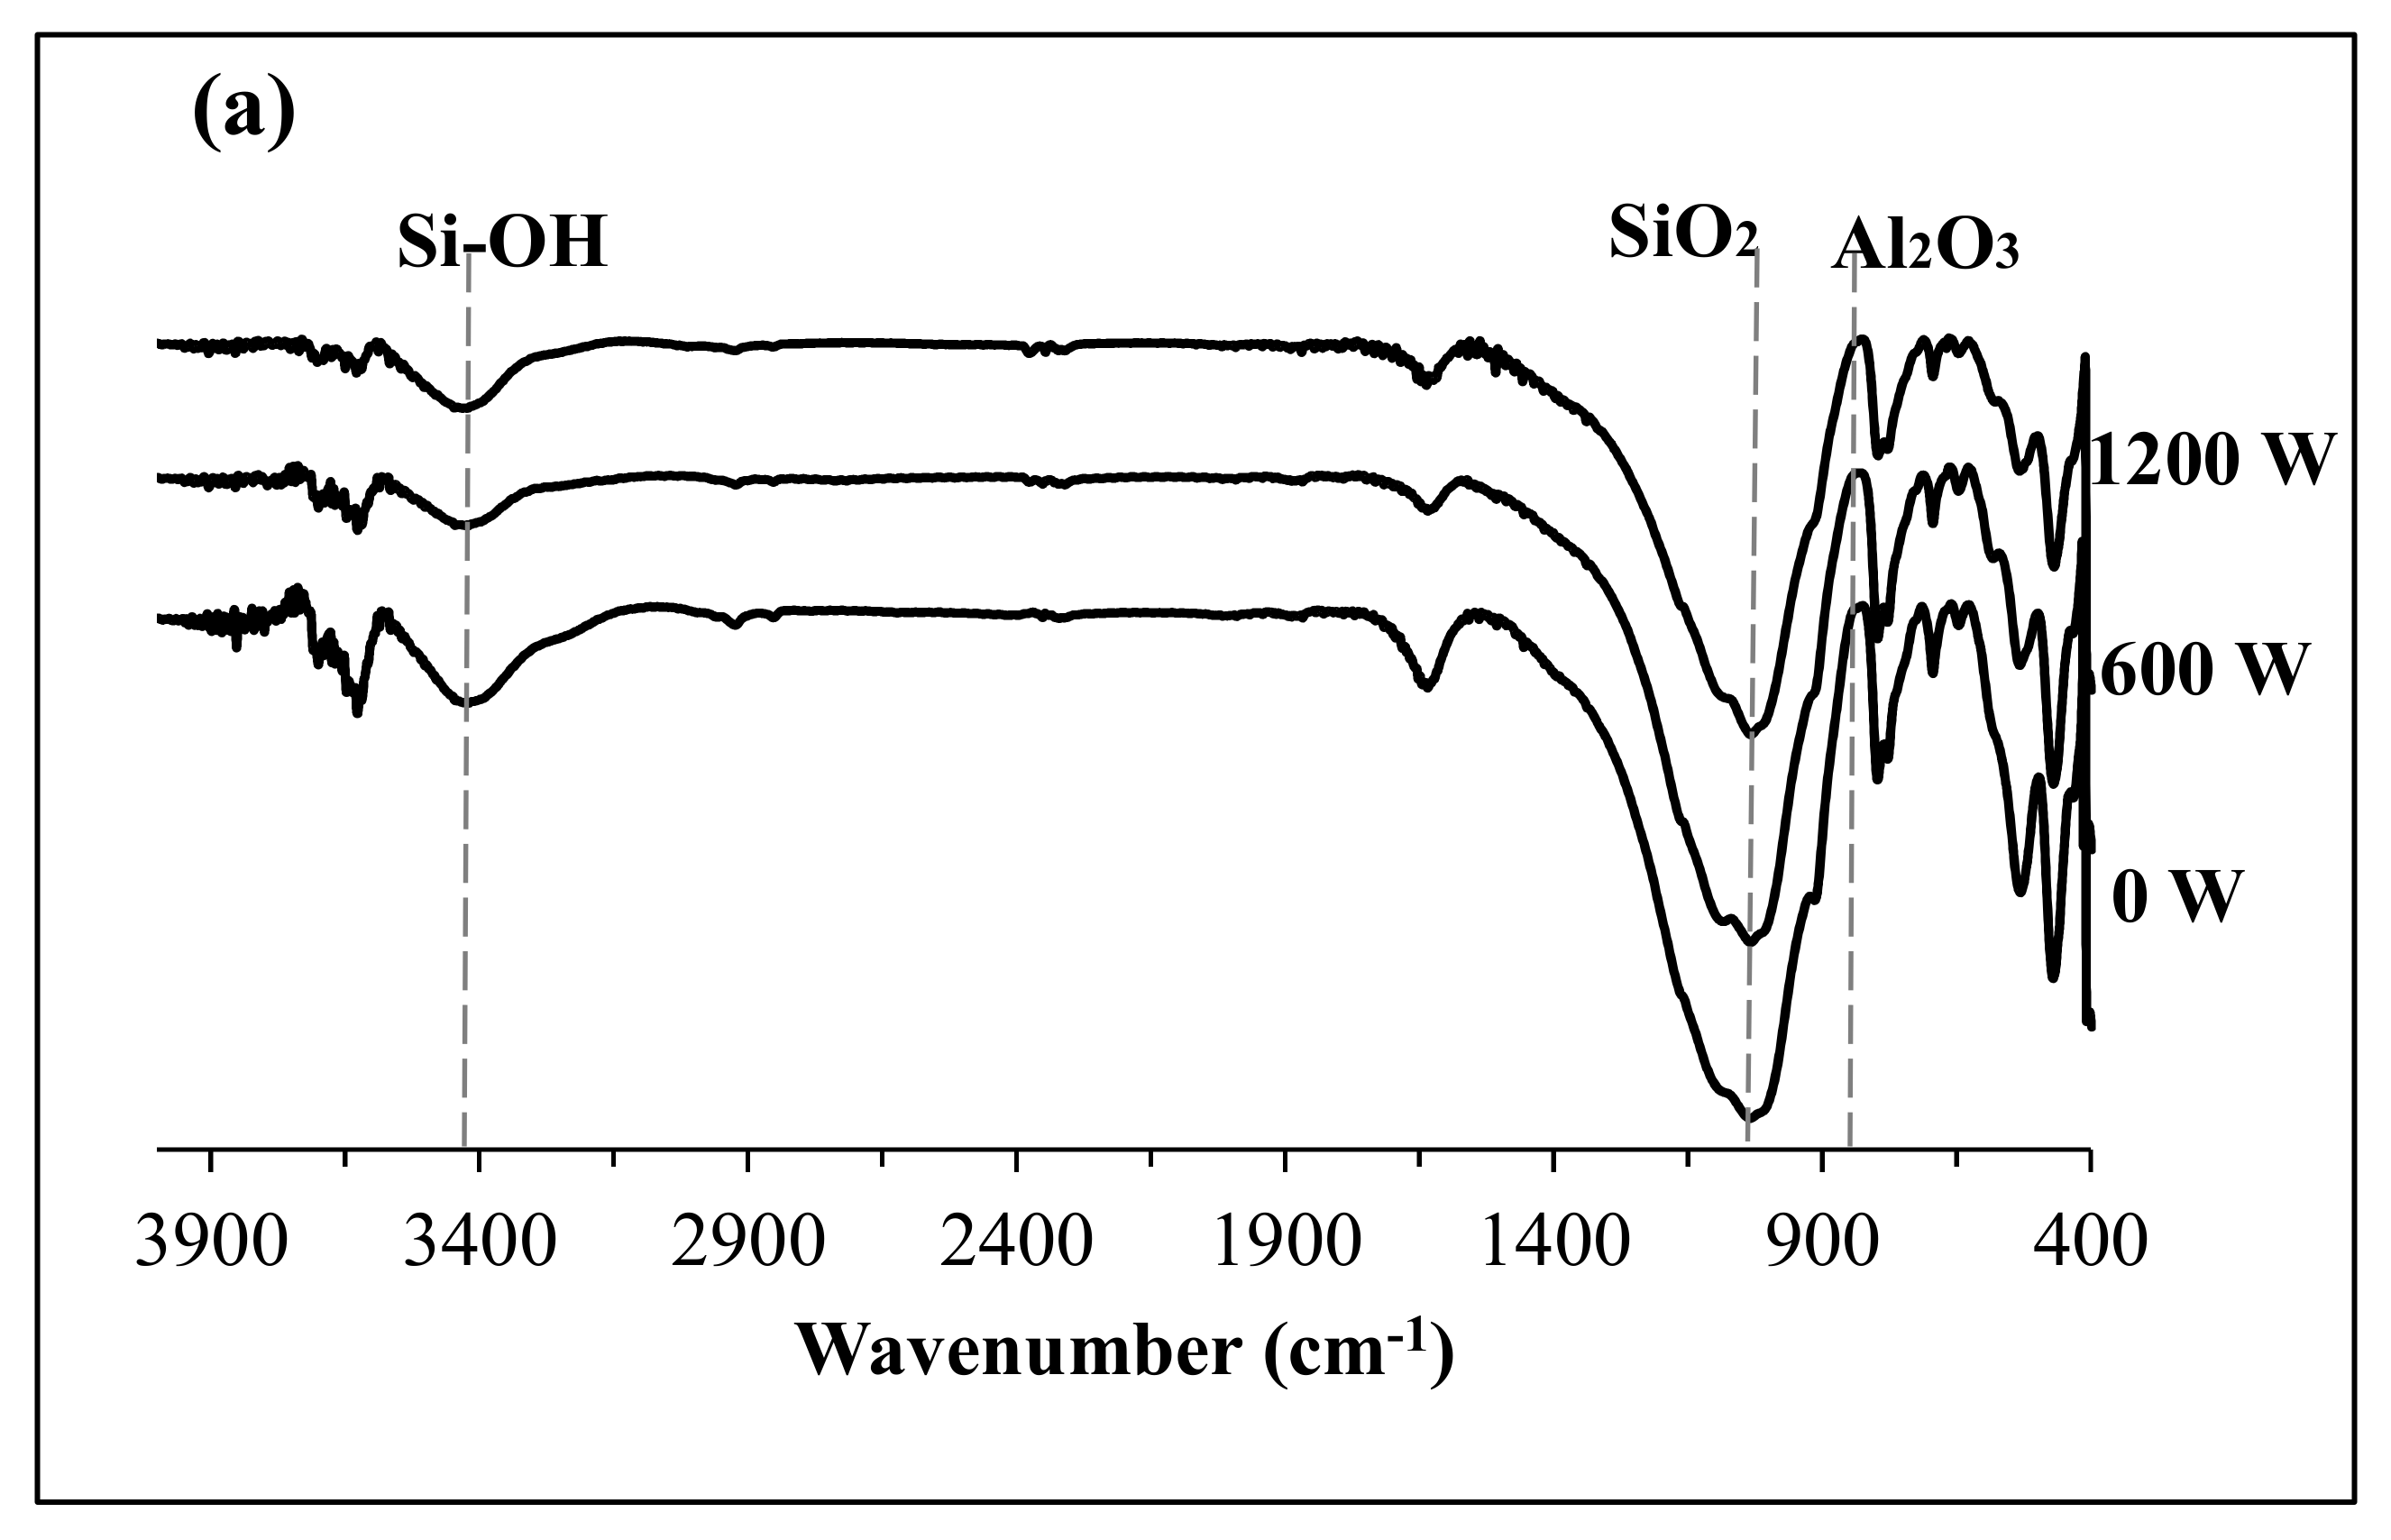
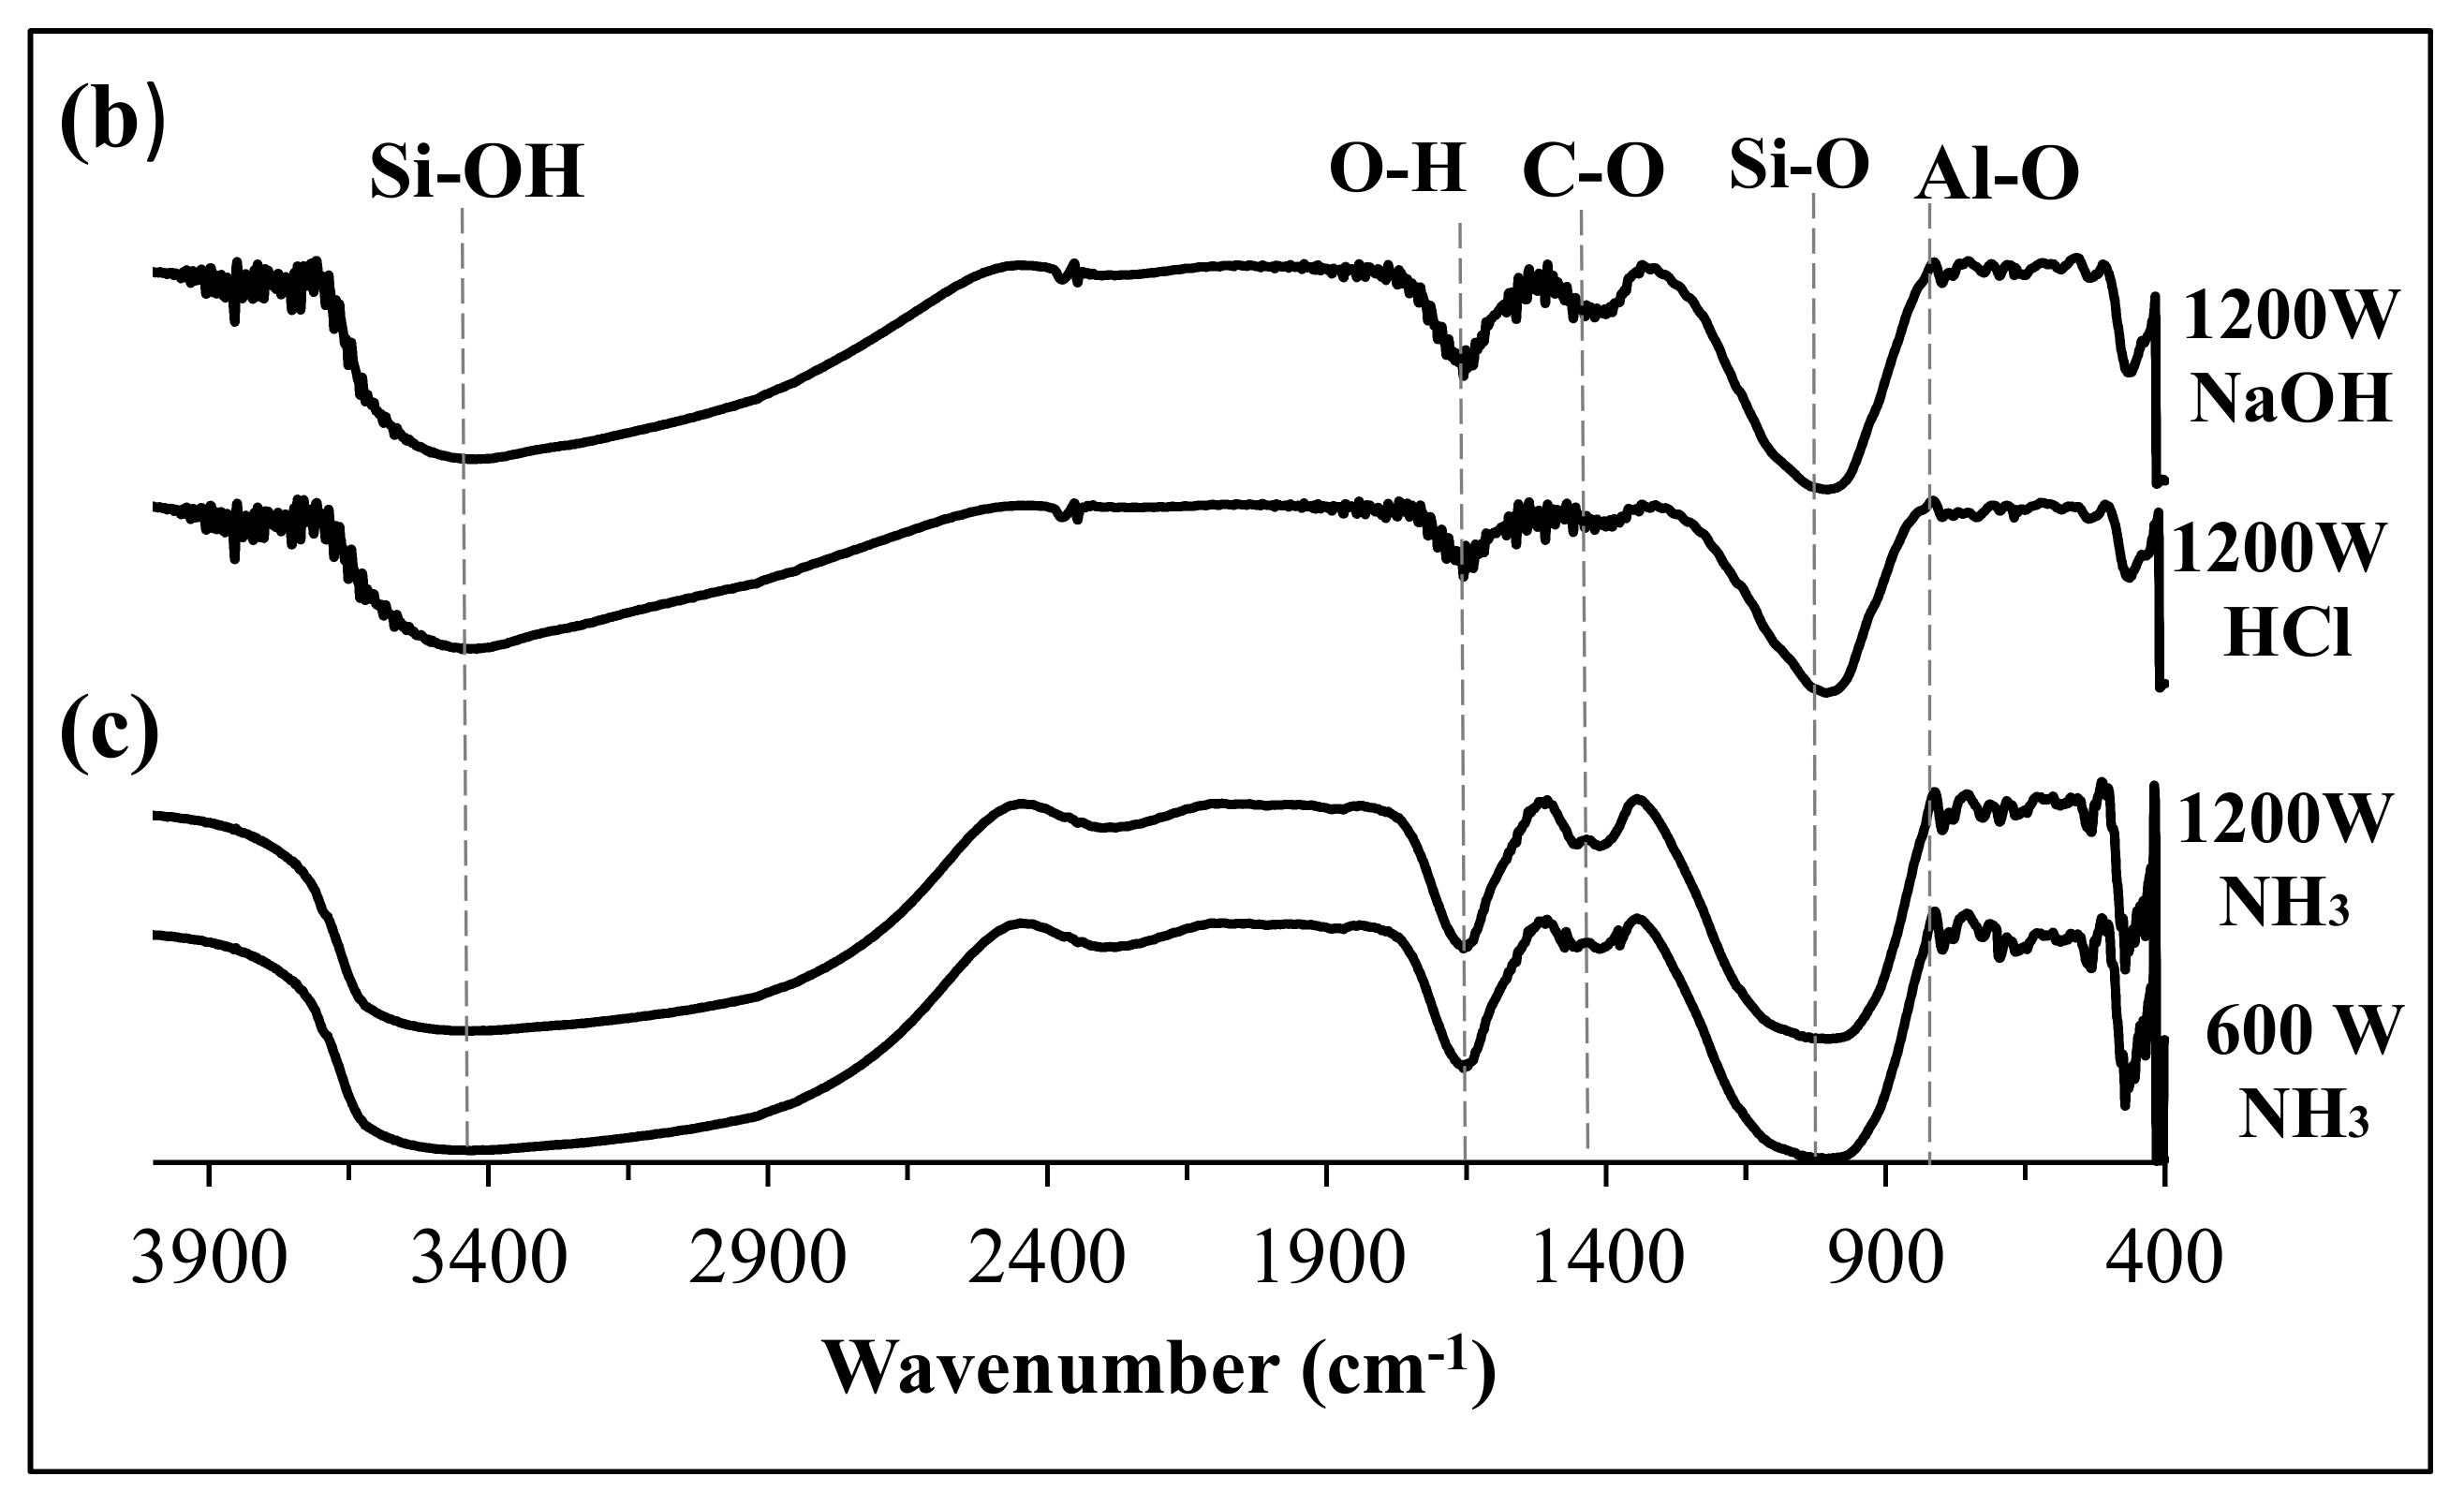
3.1. US Soil Washing in the Presence of Acid or Base

After US soil washing, the soil obtained after filter-press was dried and analyzed by XRD to determine the effect of sonication on the soil components. Figure 3 shows the XRD diffractograms of the US treated soil with different additive exposed to 1200 W US.
The X-ray powder diffraction patterns of the soils treated with HCl, NaOH, and NH3 were compared with that of non-treated soil. The particle mineralogy of the XRD pattern was compared, but no significant difference was observed between the samples. All the diffractograms consisted of quartz (Q), kaolinite (K), and alumina (Al), dominated by quartz peaks around 21 and 27° θ. When the soil was treated with additives, especially when NH3 was used, the peak intensity at 25° θ decreased. This indicated the dissolution of alumina. Little or no change was observed in the XRD data before and after treatment. Therefore, XRD analyses are not sufficient for carbon extraction determination. However, when the mineralogical content of the soil was analyzed by XRF, the results showed that US influenced the extraction of about 22% of soil carbon and altered the concentrations of silica and alumina, as shown in Table 1. The concentration of carbon extracted was deduced from the XRF data when different concentrations (0.01–1 M) of the chemical additives (HCl, NH3, and NaOH) were used for treatment. The result obtained was plotted as shown in Figure 4, and it was noticed that US treatment for carbon extraction (%) depended on the concentration of the washing solvent and the US washing time. In the case of NH3 (e.g., in Figure 4a, when 0.01–1 M NH3 was used), 72.2% of the carbon content was extracted with a 0.1 M concentration after 60 min of US exposure. The other concentrations of 0.01 M and 1 M of NH3 were not as effective.
HCl, on its part, had no influence regardless of the concentration, even after 60 min US exposure, as seen in Figure 4b. As another base, the effect of 0.001–1 M NaOH was investigated, as shown in Figure 4c. Here, the carbon extraction trend was very similar to that of NH3. In total, 69.4% of the carbon content was extracted when 0.1 M NaOH was used, which was slightly less than when NH3 was used. Overall, the NH3 and NaOH results proved the effectiveness of base additives for carbon extraction from soil under US at 1200 W. The possible reason more carbon was extracted when 0.1 M NH3 additives were used is that a weaker base tends to suspend organic matter [20].
It was noted that the amount of carbon extracted with 0.1 M HCl was similar to the amount of carbon extracted when no additive was used for treatment. Interestingly, when the 0.1 M concentration of NH3 was used without US, only 19% of the carbon was extracted. This means that the carbon extraction was influenced by US irradiation and not entirely by the additive effect. To confirm this, different US conditions were considered. A plot of the effect of US power from 300–1200 W is shown in Figure 5 below.
With both solvents, the amount of carbon extracted increased with the US exposure time. In Figure 5a, a slightly steady increase is seen under all the US conditions. But when NaOH was used, saturation was seen after 30 min of US exposure under 300 and 600 W. It is apparent that the amount of extracted C (%) was proportional to the intensity when US was exposed for 60 min. For a better understanding of the effect of US in relation to carbon extraction, the soil fraction was analyzed using a particle size analyzer after exposure to various US conditions. As is known, dispersion by reducing the sample particles is essential during US treatment [19,24], and Figure 6a–f shows us the particle size distribution obtained after exposure. The particle distribution shifted toward 5.5 μm and 0.29 μm for 600 W and 1200 W, respectively. The particle size decreased more when basic additives were used for treatments (d) and (f).
After US treatment, the slurry was observed to be more viscous than it was before exposure, which could be linked to particle breakage. The apparent viscosity of the slurry was measured at a 1s-1 shear rate as a function of the additive concentration in Figure 7a and a different shear rate in Figure 7b with a 0.1 M concentration of each additive. As seen in Figure 7b, the viscosity decreases when the shear rate increases from 1 to 1000 s−1, suggesting that the samples followed a pseudoplastic flow behavior. The viscosity curve of NH3- and NaOH-treated soils showed a thixotropic shear rate, especially in the NaOH cases. This might be because strong alkalis, such as NaOH, produce metal colloids for Si(OH)4 or Al(OH)3, meaning that the hydrogen interaction influenced the viscosity and the thixotropic behavior [37] in the base cases.
During this study, 0.1 M NH3 was considered the most effective surfactant for treatment. So far, no report exists emphasizing the adverse effects of NH3 on health at concentration levels found in the natural environment. Shinma et al. investigated the mechanisms between soil and alkali interactions [40]. It was seen that at higher concentrations, clay alkali interactions produced new compounds and also affected the clay structure, which led to soil swelling [41,42].

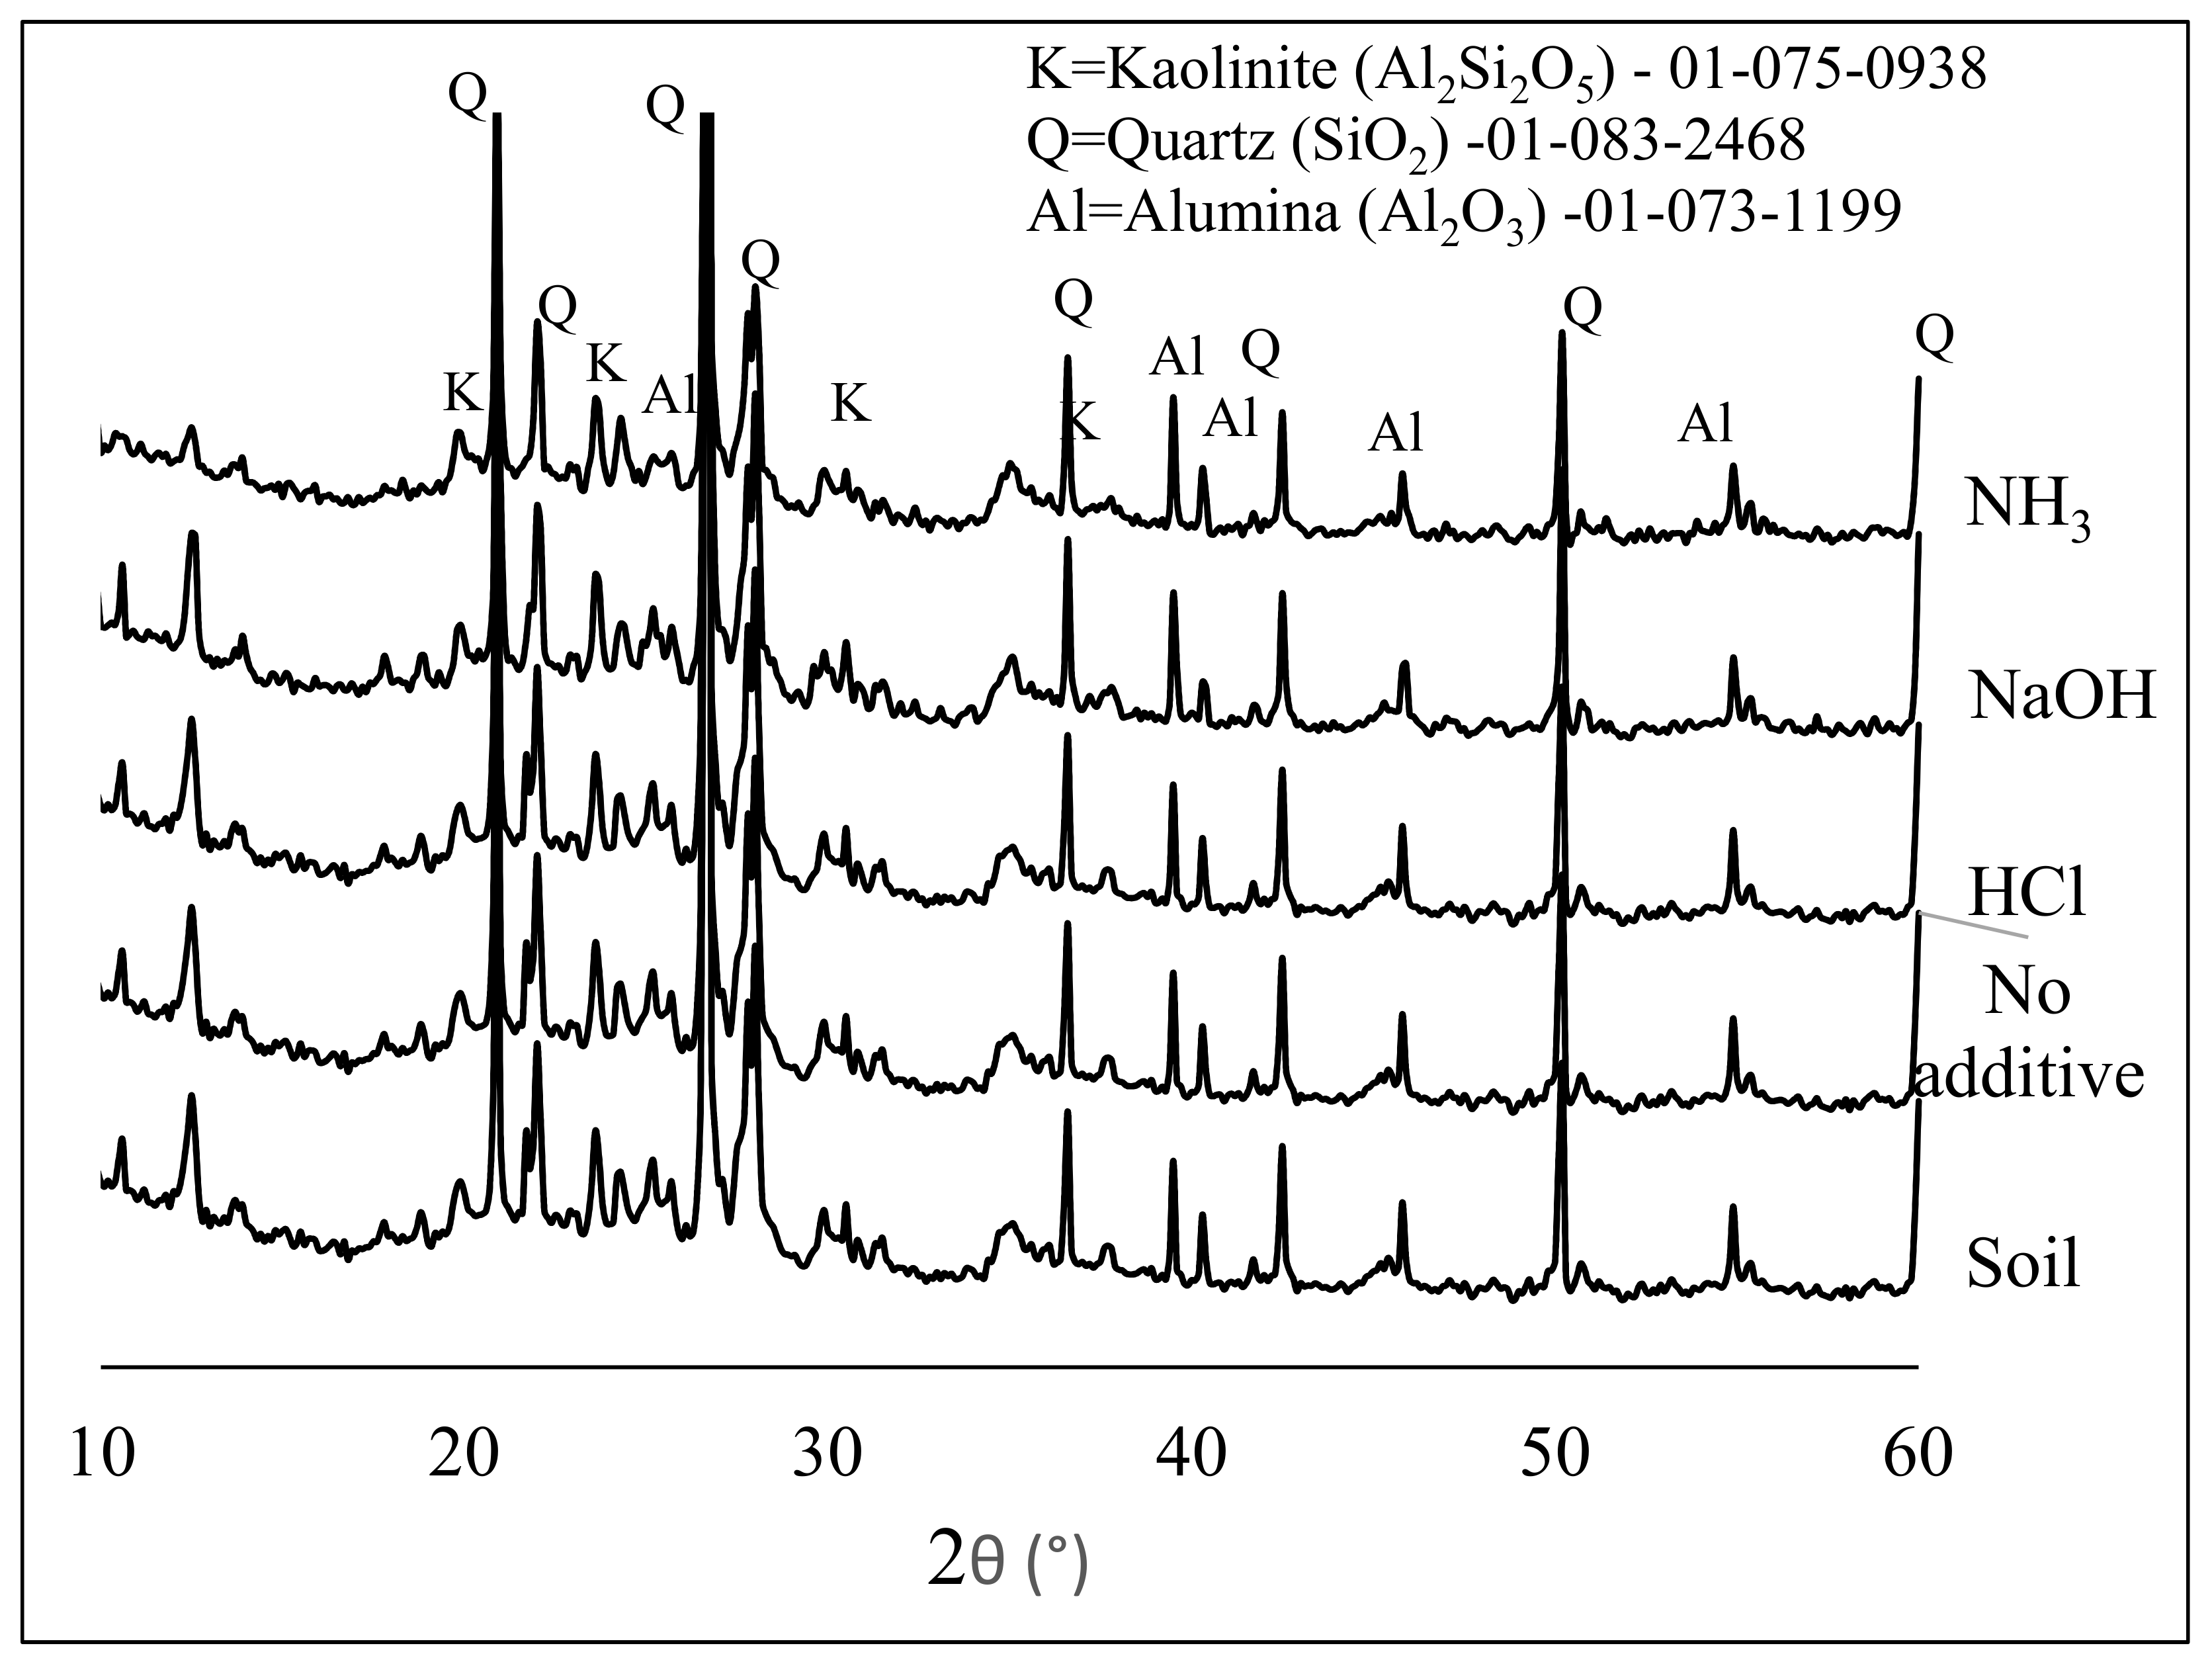
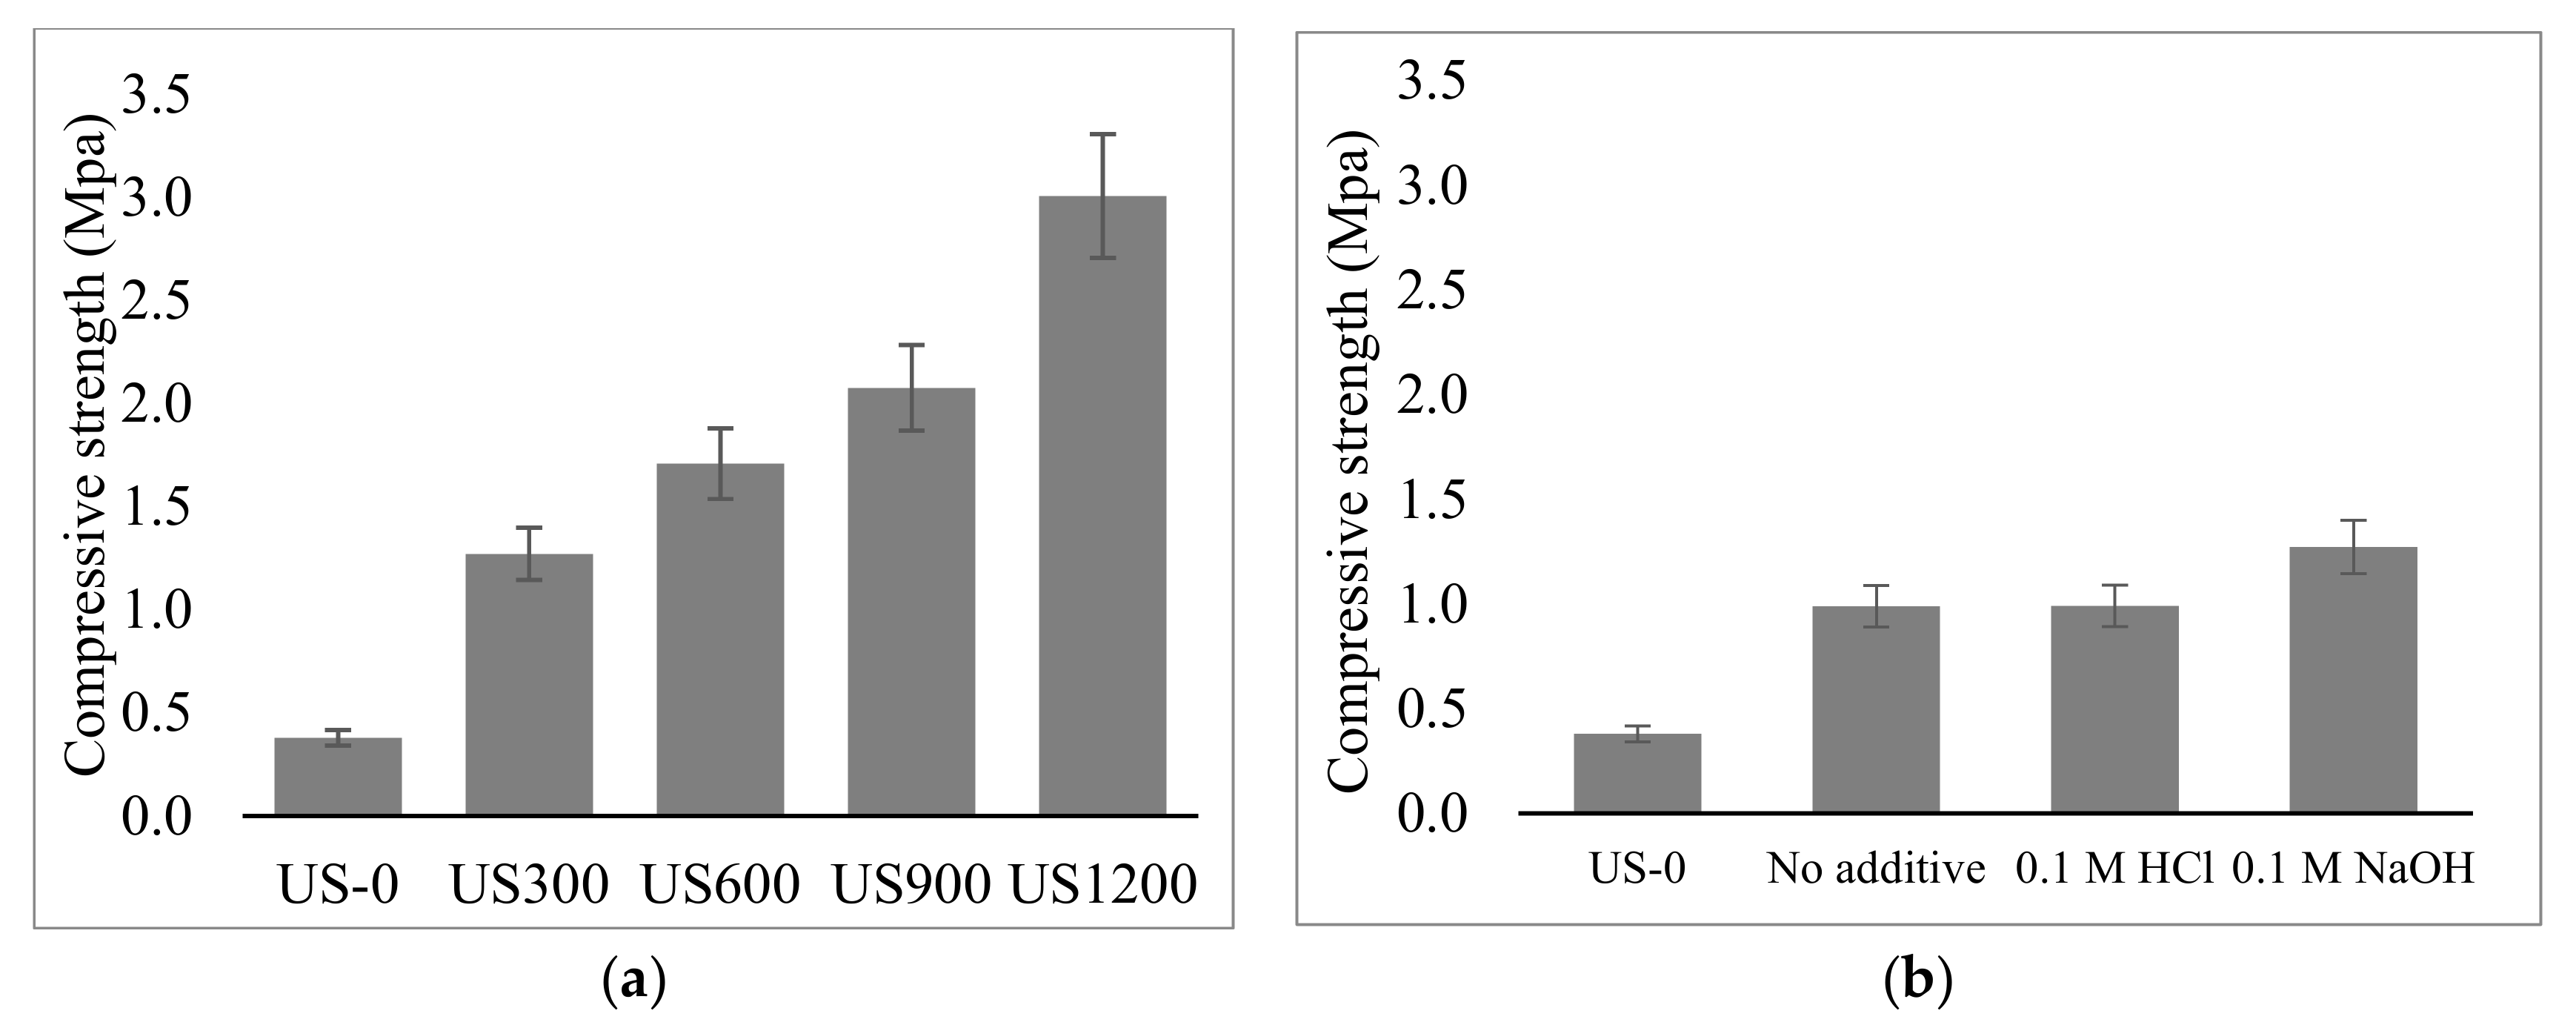
3.2. Fabrication and Properties of Soil Geopolymers

Before US treatment, from Table 1 we can see that the original soil used for the experiment had 3.6% organic carbon content, 50.4%, 18.8% of SiO2 and AL2O3 contents, respectively. However, after US treatment, NaOH like NH3 surfactant extracted 1/3 the carbon content, while an increase in SiO2 from 65.2%–63.3% was noticed as Al2O3 contents decreased from 16.2%–16.1%. For geopolymer, three samples were considered: the original soil without US treatment (US-0), soil washed with 0.1 M NH3 additive under 600 W US (US600), and soil washed with 0.1 M NH3 additive under 1200 W US (US1200). When the soils powders were mixed with the alkaline activator, the workability of the paste was best with the soil which was treated under 1200 W(US1200). After forming the geopolymer matrix, the morphology of the geopolymers was analyzed and the SEM images are shown in Figure 8. The geopolymer formed from untreated soil in Figure 8a shows a clear boundary between the particles and the alkalis activator in the geopolymers. This result explains that the layer has a less compact structure which can clearly be seen with high focus of 10 µm in Figure 8c. However, in the case of US1200 for Figure 8g–i, it can be seen that the effect of the high power US-led to fine soil powder. The geopolymer interface shows a more discrete matrix indicated by the globular unit and a few unreacted particles (layered structure). This means that the soil particles and the alkaline activator in the geopolymers formed dense matrix with fewer gaps at the interfaces, signifying that US was effective in the soil slurry dispersion in the aqueous medium.
The XRD of the geopolymers formed from NH3 above was analyzed and just for clarity it was compared with geopolymer formed from soil treated with NaOH and soil treated with no additive. The geopolymers consisted mainly of amorphous alumino-silicate products with similar amount or slight increase of SiO2 and Al2Si2O5 crystals relative to original sample as shown in Figure 9. The synthesized geopolymers diffractogram showed the presence of residual peaks relating to SiO2 (21.11° and 26.8°). One major difference between the XRD patterns of the geopolymer from NaOH treated soil and NH3 soil was the occurrence of a broad diffuse hump between 25° and 35° 2θ in Figure 9a when the soil was washed with NH3. This amorphous peak corresponded to the aluminosilicates that were formed at the binder phase in the geopolymer matrix. The component analyses of the geopolymer in Table 2 show increases in the SiO2 component and in the Al2O3 component, which are apparent for NH3.
To confirm the formation of geopolymer alumino-silicate, FT-IR spectra for the US treated soil and geopolymer samples were analyzed as shown in Figure 10. The FT-IR data of the additives were seen to have numerous transmission bands around 900 cm−1, 1100 cm−1 and 3200–3500 cm−1 for Al–O, Si–O and Si–OH groups, respectively [36]. In Figure 10a, 0 W indicates no US treatment, while 600 W and 1200 W indicate their respective US powers without additive.
From the FT-IR, the main feature of the spectra of the US treated powder is the appearance of the central band between 1107 and 1040 cm−1 characterized by the asymmetric stretching of Si–O–Si. The characteristic stretching vibration of Al–O was observed in the geopolymers formed from non-additive treated soil as shown in Figure 10a. In Figure 10b, the Si–O stretching band at about 1100 cm−1 of the geopolymer formed from treated soil slightly shifted towards the lower wavenumber region, indicating that condensation occurred in the soil between SiO2 and the sodium silicate. At 1490–1650 cm−1, the characteristic carbonate band appeared. This band from sodium carbonate was formed during the absorption of CO2 gas from the atmosphere by the sodium silicate.
Since strength is one of the major characteristics of a geopolymer, the mechanical strength of the geopolymer matrix was analyzed and plotted in Figure 11. Four standard-cured strength specimens were made from the same sample and tested at the same age. Two plots were made, the compressive strength of the geopolymer formed from soil which was washed with 0.1M NH3 additive under different US power (0–1200 W) (Figure 11a), and the geopolymer made from soil washed with 0.1 HCl and NaOH (Figure 11b) as shown below.
In Figure 11a, 0.1 M NH3, an increase in US power led to an increase in the compressive strength, from 0.4 MPa to 3.0 MPa when 1200 W US (US1200) treated soil was used. This result was mainly related to the morphological structure of the geopolymer, as a higher US power of 1200 W created more fine particles which required less geopolymerization reaction time as compared to larger soil particles in the case of lower powers [43]. When similar US conditions of 1200 W were applied to soils that were treated with other additives like HCl and NaOH, although their particle size was assumed to be the same, their compressive strengths were far lesser than that of NH3 mentioned earlier. The main reason for this could be attributed to the carbon content in the material [15]. The particle size influenced the strength when no additive, as well as when 0.1 M HCl and 0.1 M NaOH was used as shown in Figure 11b.
During geopolymerization, to ensure sufficient reaction multiples of 7 days (7, 14 or 28) are commonly considered for maturity testing in civil engineering at room temp (25–30 °C) [44]. This is because, during geopolymerization, the strength of kaolin geopolymers increases with aging time as the dissolution increases with aging days [45]. As a result geopolymers would only achieve complete geopolymerization after a particular time frame. In this study, although the compressive strength of the prepared geopolymers was considered high with respect to the compressive strength when the other surfactants were used for treatment, on the other hand it was not as high as most reported geopolymers. However, the geopolymer was within the accepted range for geopolymers compressive strength tested after 1 day curing. Reports when similar specimens were cured at 80 °C also showed similar strength after 1 day of curing [46,47].

4. Conclusions

Soil slurry, which was considered as waste, was recycled to prepare geopolymers after having been treated with high power ultrasound (US). Due to the limitation of land fields for waste soil disposal, soil decarbonation is said to be a necessity for soil recycling. Under 28 kHz US exposure, 60 min was sufficient to extract 72.2% of organic carbon from excavated soil when 0.1 M NH3 solution was used as washing solvent. Geopolymer formed from the resultant soil showed a remarkable compressive strength of 3 MPa after curing at 80 °C for 24 hr due to the low proportion of carbon content after treatment. Although the compressive strength acquired with 0.1 M NH3, is thought to be negligible it is significant when compared to geopolymers formed with soils treated with similar concentration of HCl and NaOH. The compressive strength is not as high when compared to the other reported geopolymers but it is within the accepted range for geopolymers after 1 day curing. Since the compressive strength depends on the particle size and carbon content in the soil, more research is required to develop a geopolymer with better strength by altering the concentration of alkalis activator and other ultrasonic parameters.

Author Contributions

Conceptualization, L.-M.K.-N. and T.K.; Data curation, L.-M.K.-N.; Formal analysis, L.-M.K.-N.; Investigation, L.-M.K.-N. and Y.W.; Methodology, L.-M.K.-N.; Project administration, L.-M.K.-N.; Supervision, T.K.; Writing—original draft, L.-M.K.-N.; Writing—review & editing, L.-M.K.-N. and T.K.

Funding

This research received no external funding.

Acknowledgments

The authors thank Fukuda Cooperation Ltd Niigata-Japan, for providing excavated soil samples throughout this work.

Conflicts of Interest

The authors declare no conflict of interest.

References

  1. Davidovits, J. Geopolymer Chemistry and Applications, 4th ed.; Institut Geopolymere: Saint-Quentin, France, 2015; pp. 4–5. [Google Scholar]
  2. Huang, T.Y.; Chuieh, P.T. Life cycle assessment of reusing fly ash from municipal waste incineration. Procedia Eng. 2015, 11, 984–991. [Google Scholar] [CrossRef]
  3. Nakshatra, B.S. Fly ash based geopolymer binder: A construction material. Mineral 2018, 8, 299. [Google Scholar]
  4. Johansson, N.; Krook, J.; Eklund, M.; Berglund, B. An Integrated Review of Concepts and Initiatives for Mining the technosphere towards a new taxonomy. J. Clean. Prod. 2013, 55, 35–44. [Google Scholar] [CrossRef]
  5. Residential and Civil Construction Alliance of Ontario (RCCAO) Best Management Practices for Handling Excess Construction Soils in Ontario. Available online: http://www.rccao.com/news/files/RCCAO_NOV2012.pdf (accessed on 10 July 2019).
  6. Wilpiszeski, R.L.; Aufrecht, J.A.; Retterer, S.T.; Sullivan, M.B.; Graham, D.E.; Pierce, E.M.; Zablocki, O.D.; Palumbo, A.V.; Elias, D.A. Soil Aggregate Microbial Communities: Towards Understanding Microbiome Interactions at Biologically Relevant Scales. Appl. Environ. Microbiol. 2019, 85, e00324-19. [Google Scholar] [CrossRef] [PubMed]
  7. DeGomez, T.; Kolb, P.; Kleinman, S. Basic Soil Components. 2019. Available online: https://climate-woodlands.extension.org/basic-soil-components/ (accessed on 19 November 2019).
  8. Mohammadi, K.; Heidari, G.; Khalesro, S.; Sohrabi, Y. Soil management, microorganisms and organic matter interactions: A review. Afr. J. Biotechnol. 2011, 10, 19840–19849. [Google Scholar]
  9. Robertson, G.P.; Paul, E.A.; Harwood, R.R. Greenhouse gases in intensive agriculture: Contributions of individual gases to the radiative forcing of the atmosphere. Science 2000, 289, 1922–1925. [Google Scholar] [CrossRef] [PubMed]
  10. Kirschbaum, M.U.F. The temperature dependence of soil organic matter 587 decomposition and the effect of global warming on soil organic carbon storage. Soil Biol. Biochem. 1995, 27, 753–760. [Google Scholar] [CrossRef]
  11. Davidson, E.A.; Janssens, I.A. Temperature sensitivity of soil carbon decomposition and feedbacks to climate change. Nature 2006, 440, 165–173. [Google Scholar] [CrossRef] [PubMed]
  12. Linn, D.M.; Doran, J.W. Effect of water-filled pore-space on carbon-dioxide and nitrous-oxide production in tilled and non-tilled soils. Soil Sci. Soc. Am. J. 1984, 48, 1267–1272. [Google Scholar] [CrossRef]
  13. Skopp, J.; Jawson, M.D.; Doran, J.W. Steady-state aerobic microbial activity as a function of soil-water content. Soil Sci. Soc. Am. J. 1990, 54, 1619–1625. [Google Scholar] [CrossRef]
  14. Barnwell Low Level Radioactive Waste Disposal Facility. Available online: http://www.atlanticcompact.org/pdf_file/29f3737663937c53aebb326b1a87c628.ACC_Conceptual_Design_Report_071004.pdf (accessed on 10 July 2019).
  15. Gunasekara, M.P.C.M.; Law, D.W.; Setunge, S. Effect of composition of fly ash on compressive strength of fly ash based geopolymer morta. ACMSM 2014, 23, 113–118. [Google Scholar]
  16. Kaiser, M.; Berhe, A.A.; Sommer, M.; Kleber, M. Application of ultrasound to disperse soil aggregates of high mechanical stability. J. Plant Nutr. Soil Sci. 2012, 4, 521–526. [Google Scholar] [CrossRef]
  17. Jackson, M.L.; Helman, N.N. X-ray Diffraction Procedure for Positive Differentiation of Montmorillonite from Hydrous Mica. Soil Sci. Soc. Am. Proc. 1942, 7, 194–200. [Google Scholar]
  18. Griffiths, R.A. Soil-washing technology and practice. J. Hazard. Mater. 1995, 40, 175–189. [Google Scholar] [CrossRef]
  19. Dermont, G.; Bergeron, M.; Mercier, G. Soil washing for metal removal: A review of physical/chemical technologies and field applications. J. Hazard. Mater. 2008, 152, 1–31. [Google Scholar] [CrossRef] [PubMed]
  20. Schmidt, M.W.I.; Rumpel, C.; Kögel-Knabner, I. Evaluation of an ultrasonic dispersion procedure to isolate primary organo-mineral complexes from soils. Eur. J. Soil Sci. 1996, 50, 87–94. [Google Scholar] [CrossRef]
  21. Schmidt, M.W.I.; Rumpel, C.; Kögel-Knabner, I. Particle size fractionation of soil containing coal and combusted particle. Eur. J. Soil Sci. 1996, 50, 515–522. [Google Scholar] [CrossRef]
  22. Levesque, M.; Schnitzer, M. Effect of NaOH concentration on the extraction of organic matter and of major inorganic constituents from a soil. Can. J. Soil Sci. 1996, 46, 7–12. [Google Scholar] [CrossRef]
  23. Kulhawy, F.H.; Jie-Ru, C. Identification and description of soils containing very coarse fractions. J. Geotech. Geoenviron. Eng. 2009, 135, 635–646. [Google Scholar] [CrossRef]
  24. Gregorich, E.G.; Kachanoski, R.G.; Voroney, R.P. Ultrasonic dispersion of aggregates: Distribution of organic matter in size fractions. Can. J. Soil Sci. 1998, 68, 395–403. [Google Scholar]
  25. Raine, S.R.; So, H.B. Ultrasonic dispersion of soil water: The effect of suspension properties on energy dissipation and soil dispersion. Aust. J. Soil Res. 1994, 32, 1157–1174. [Google Scholar] [CrossRef]
  26. Roscoe, R.; Buurman, P.; Velthorst, E.J. Disruption of soil aggregates by varied amount of ultrasound energy in fractionation of organic matter of a clay latosol: Carbon, nitrogen and delta 13C distribution in particle size fractions. Eur. J. Soil Sci. 2000, 51, 445–454. [Google Scholar] [CrossRef]
  27. Bray, R.H. The significance of particle-size within the clay fraction. J. Am. Ceramic Soc. 1937, 20, 257–261. [Google Scholar] [CrossRef]
  28. Feng, D.; Aldrich, C. Sonochemical treatment of simulated soil contaminated with diesel. Adv. Environ. Res. 2000, 4, 103–112. [Google Scholar] [CrossRef]
  29. Freeman, H.M.; Harris, E.F. Hazardous Waste Remediation: Innovative Treatment Technologies; Tehnomic Publishing Co. Inc.: Lancaster, UK, 1995; pp. 103–112. [Google Scholar]
  30. Torres, R.A.; Pétrier, C.; Combet, E.; Carrier, M.; Pulgarin, C. Ultrasonic cavitation applied to the treatment of bisphenol A. Effect of sonochemical parameters and analysis of BPA by-products. Ultrason. Sonochem. 2008, 15, 605–611. [Google Scholar] [CrossRef] [PubMed]
  31. Inoue, M.; Masuda, Y.; Okada, F.; Sakurai, A.; Ichiro, T.; Sakakibara, M. Degradation of bisphenol-A using sonochemical reactions. Water Res. 2008, 42, 1379–1386. [Google Scholar] [CrossRef] [PubMed]
  32. Teo, B.M.; Chen, F.; Hatton, T.A.; Grieser, F.; Ashokkumar, M. Novel one-pot synthesis of magnetite latex nanoparticles by ultrasound irradiation. Langmuir 2009, 29, 2593–2595. [Google Scholar] [CrossRef] [PubMed]
  33. Teo, B.M.; Prescott, S.W.; Ashokkumar, M.; Grieser, F. Ultrasound initiated miniemulsion polymerization of methacrylate monomers. Ultrason. Sonochem. 2008, 15, 89–94. [Google Scholar] [CrossRef] [PubMed]
  34. Farmer, A.D.; Collings, A.F.; Jameson, G.J. The application of power ultrasound to the durface cleaning of silica and heavy mineral sands. Ultrason. Sonochem. 2000, 7, 243–247. [Google Scholar] [CrossRef]
  35. Balachandran, S.; Kentish, S.E.; Mawson, R.; Ashokkumar, M. Ultrasonics enhancement of the supercritical extraction from ginger. Ultrason. Sonochem. 2006, 13, 471–479. [Google Scholar] [CrossRef] [PubMed]
  36. Rovnavik, P. Effect of curing temperature on the development of hard structure of metakaoline based geopolymer. Contr. Build. Mater. 2012, 24, 1176–1183. [Google Scholar] [CrossRef]
  37. Singhi, B.; Laskar, A.I.; Ahmed, M.A. Investigation on soil-geopolymer with slag, fly ash and their blending. Arab. J. Sci. Eng. 2016, 41, 393–400. [Google Scholar] [CrossRef]
  38. Rao, M.A. Flow and Functional Models for Rheological Properties of Fluid Foods, Rheology of Fluid, Semisolid, and Solid Foods; Food Engineering Series; Science and Business Media: New York, NY, USA, 2014; pp. 21–67. [Google Scholar]
  39. Panda, B.; Unluer, C.; Tan, M.J. Extrusion and rheology characterization of geopolymer nanocomposites used in 3D printing. Compos. Part B Eng. 2019, 176, 107290. [Google Scholar] [CrossRef]
  40. Shimna, P.; Prasad Reddy, H.; Jayakumar, K.V. Swell Potential Studies on Soils Contaminated with NaOH Solutions. In Proceedings of the Indian Geotechnical Conference IGC, Kakinada, India, 18–20 December 2014; pp. 1362–1369. [Google Scholar]
  41. Mitchell, J.K. Fundamentals of Soil Behaviour, 2nd ed.; John Wiley and Sons Inc.: New York, NY, USA, 1993. [Google Scholar]
  42. Ramakrishnegowda, C.; Yaji, R.; Shivashankar, R.; Sivapullaiah, P.V. Geotechnical properties of shedi soil affected by alkali contamination. Int. J. Environ. Protection 2011, 1, 45–52. [Google Scholar]
  43. Isabella, C.; Lukey, G.C.; Xu, H.; van Deventer, J.S. The Effect of Aggregate Particle Size on Formation of Geopolymeric Gel. Adv. Mater. Constr. Bridges Build. Struct. III Art. 2003, 9, 1–10. [Google Scholar]
  44. Raphaëlle, P. Formulation and Durability of Metakaolin-Based Geopolymers. Ph.D. Thesis, Université de Toulouse, Université Toulouse III-Paul Sabatier, Toulouse, France, 2015. [Google Scholar]
  45. Heah, C.Y.; Kamarudin, H.; Mustafa Al Bakri, A.M.; Bnhussain, M. Study on solids-to-liquid and alkaline activator ratios on kaolin-based geopolymers. Constr. Build. Mater. 2012, 35, 912–922. [Google Scholar] [CrossRef]
  46. Adam, A.; Horianto, A. The effect of temperature and duration of curing on the strength of fly ash based geopolymer mortar. Procedia Eng. 2014, 95, 410–414. [Google Scholar] [CrossRef]
  47. Zuhua, Z.; Xiao, Y.; Yue, C. Role of water in the synthesis of calcined kaolin-based geopolymer. Appl. Clay Sci. 2009, 43, 218–223. [Google Scholar] [CrossRef]
Figure 1. Upper view of ultrasound experimental setup.
Materials 12 03804 g001
Figure 2. Protocol for US soil washing, and geopolymer fabrication
Materials 12 03804 g002
Figure 3. The X-ray Diffractometer (XRD) of soil before and after US treatment.
Materials 12 03804 g003
Figure 4. Calculated percentage of carbon extracted under 1200 W US exposure with 0.01–1 M concentration of (a) NH3, (b) HCl, (c) NaOH, and (d) shows a comparison of the US with no additive and 0.1 M concentration of various additives.
Materials 12 03804 g004
Figure 5. Calculated percentage of organic carbon extracted after 1200 W US exposure at different US power for (a) NH3 and (b) NaOH additives.
Materials 12 03804 g005
Figure 6. Particle size distribution analyses of soil sample exposed with no additive at (a) 0 W (b) 600 W and (c) 1200 W and with (0.01–1 M) additive under 1200 W with (d) NH3 (e) HCl(f) NaOH.
Materials 12 03804 g006
Figure 7. Viscosity changes for 60 min treatment soil slurries with additives (a) with different additive concentrations and (b) shear rate of 0.1 M additive concentration.
Materials 12 03804 g007
Figure 8. Microstructure of geopolymer sample after before and after ultrasonic treatment at different intensities. (0 W, 600 W, and 1200 W) of NH3, (ac) US-0, (df) US-600, (gi) US-1200.
Materials 12 03804 g008
Figure 9. XRD patterns of original soil and soil after geopolymerization under different ultrasound power, (a) NH3, (b) NaOH.
Materials 12 03804 g009
Figure 10. FT-IR analysis after geopolymerization of 1200 W US (a) treated soil with no additive. (b) treated with 0.1 M NaOH (top) and 0.1 M HCl (bottom) ) and (c) treated with 0.1 M NH3.
Materials 12 03804 g010aMaterials 12 03804 g010b
Figure 11. Compressive strength of (a) geopolymer from 0.1 M NH3 US treated soil at different power. (b) geopolymer from the US treated soil with different additive.
Materials 12 03804 g011
Table 1. Chemical composition (mass %) of raw sample (soil), before treatment and after 1200 W US (ultrasound) treatment with different concentrations of additive.
HCl NH3 NaOH
US TreatmentSoilNo
additive
0.01 M0.1 M1 M0.01 M0.1 M1 M0.01 M0.1 M1 M
C3.62.42.42.42.12.31.01.91.91.12.0
Na2O1.31.42.01.842.22.12.12.02.22.85.0
SiO250.455.363.662.863.964.865.263.564.263.362.6
Al2O318.817.115.815.414.715.716.2161616.115.3
Fe2O34.14.03.93.22.93.94.14.24.13.93.4
Table 2. XRF of geopolymers.
Mass %
No AdditiveNH3NaOH
CO221.511.612.4
Na2O20.917.118
Al2O31113.912.7
SiO240.448.948.8

