Investigation of AgInS2/ZnS Quantum Dots by Magnetic Circular Dichroism Spectroscopy

 ,
, 
 ,
, 

Abstract
:1. Introduction
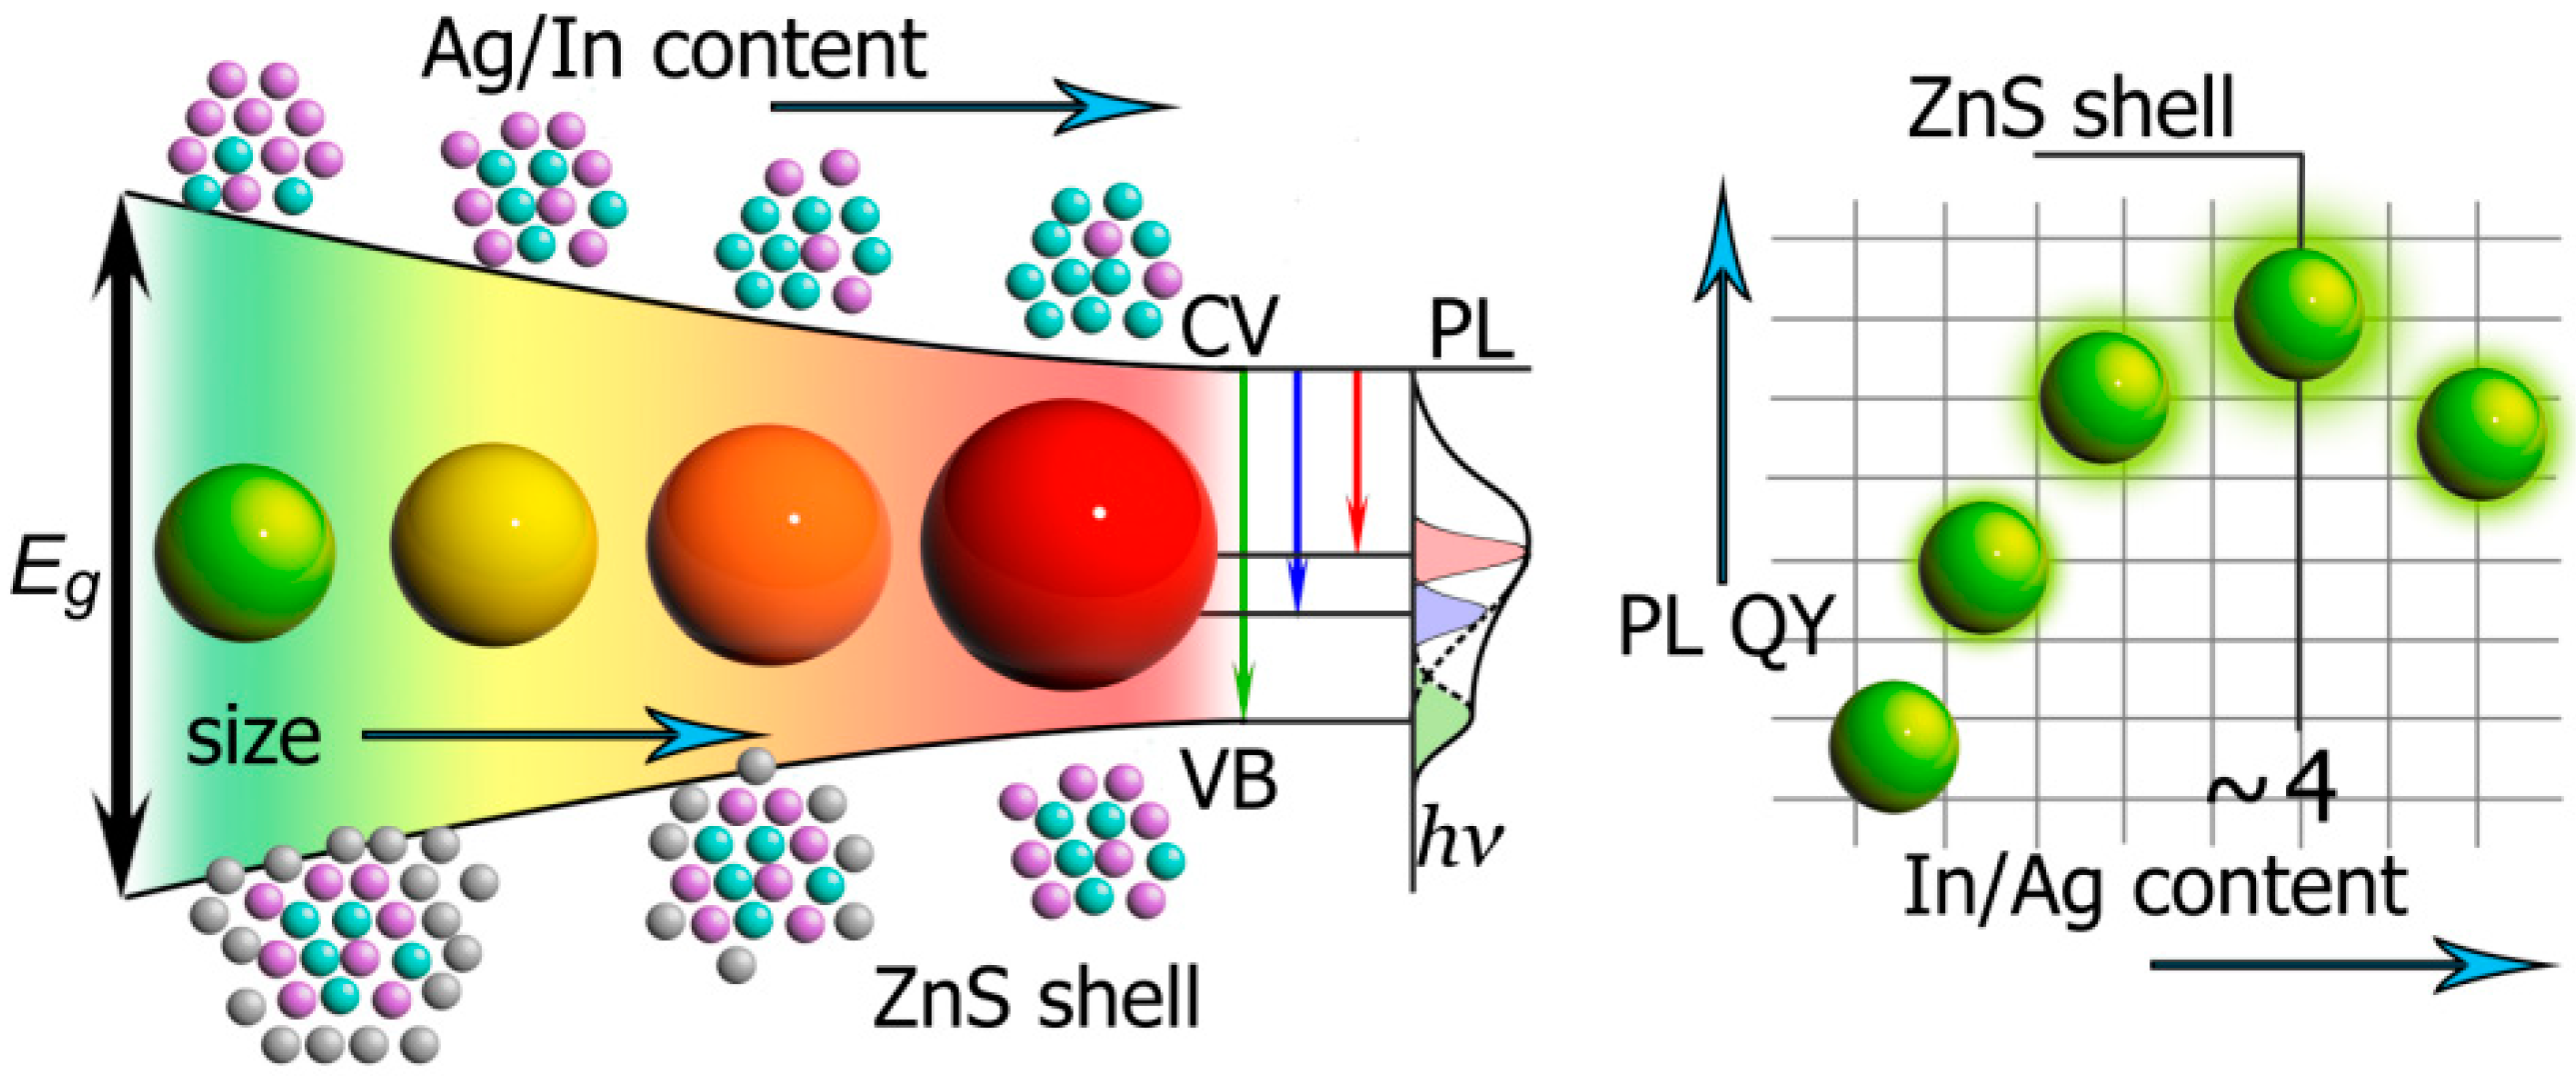
1.1. Optical Properties of AgInS2 Quantum Dots
1.2. Theoretical Models
- Size polydispersity
- Dot-to-dot differences in chemical composition
- Different defect distribution within QDs
1.3. Determination of the Bandgap in Ternary Quantum Dots
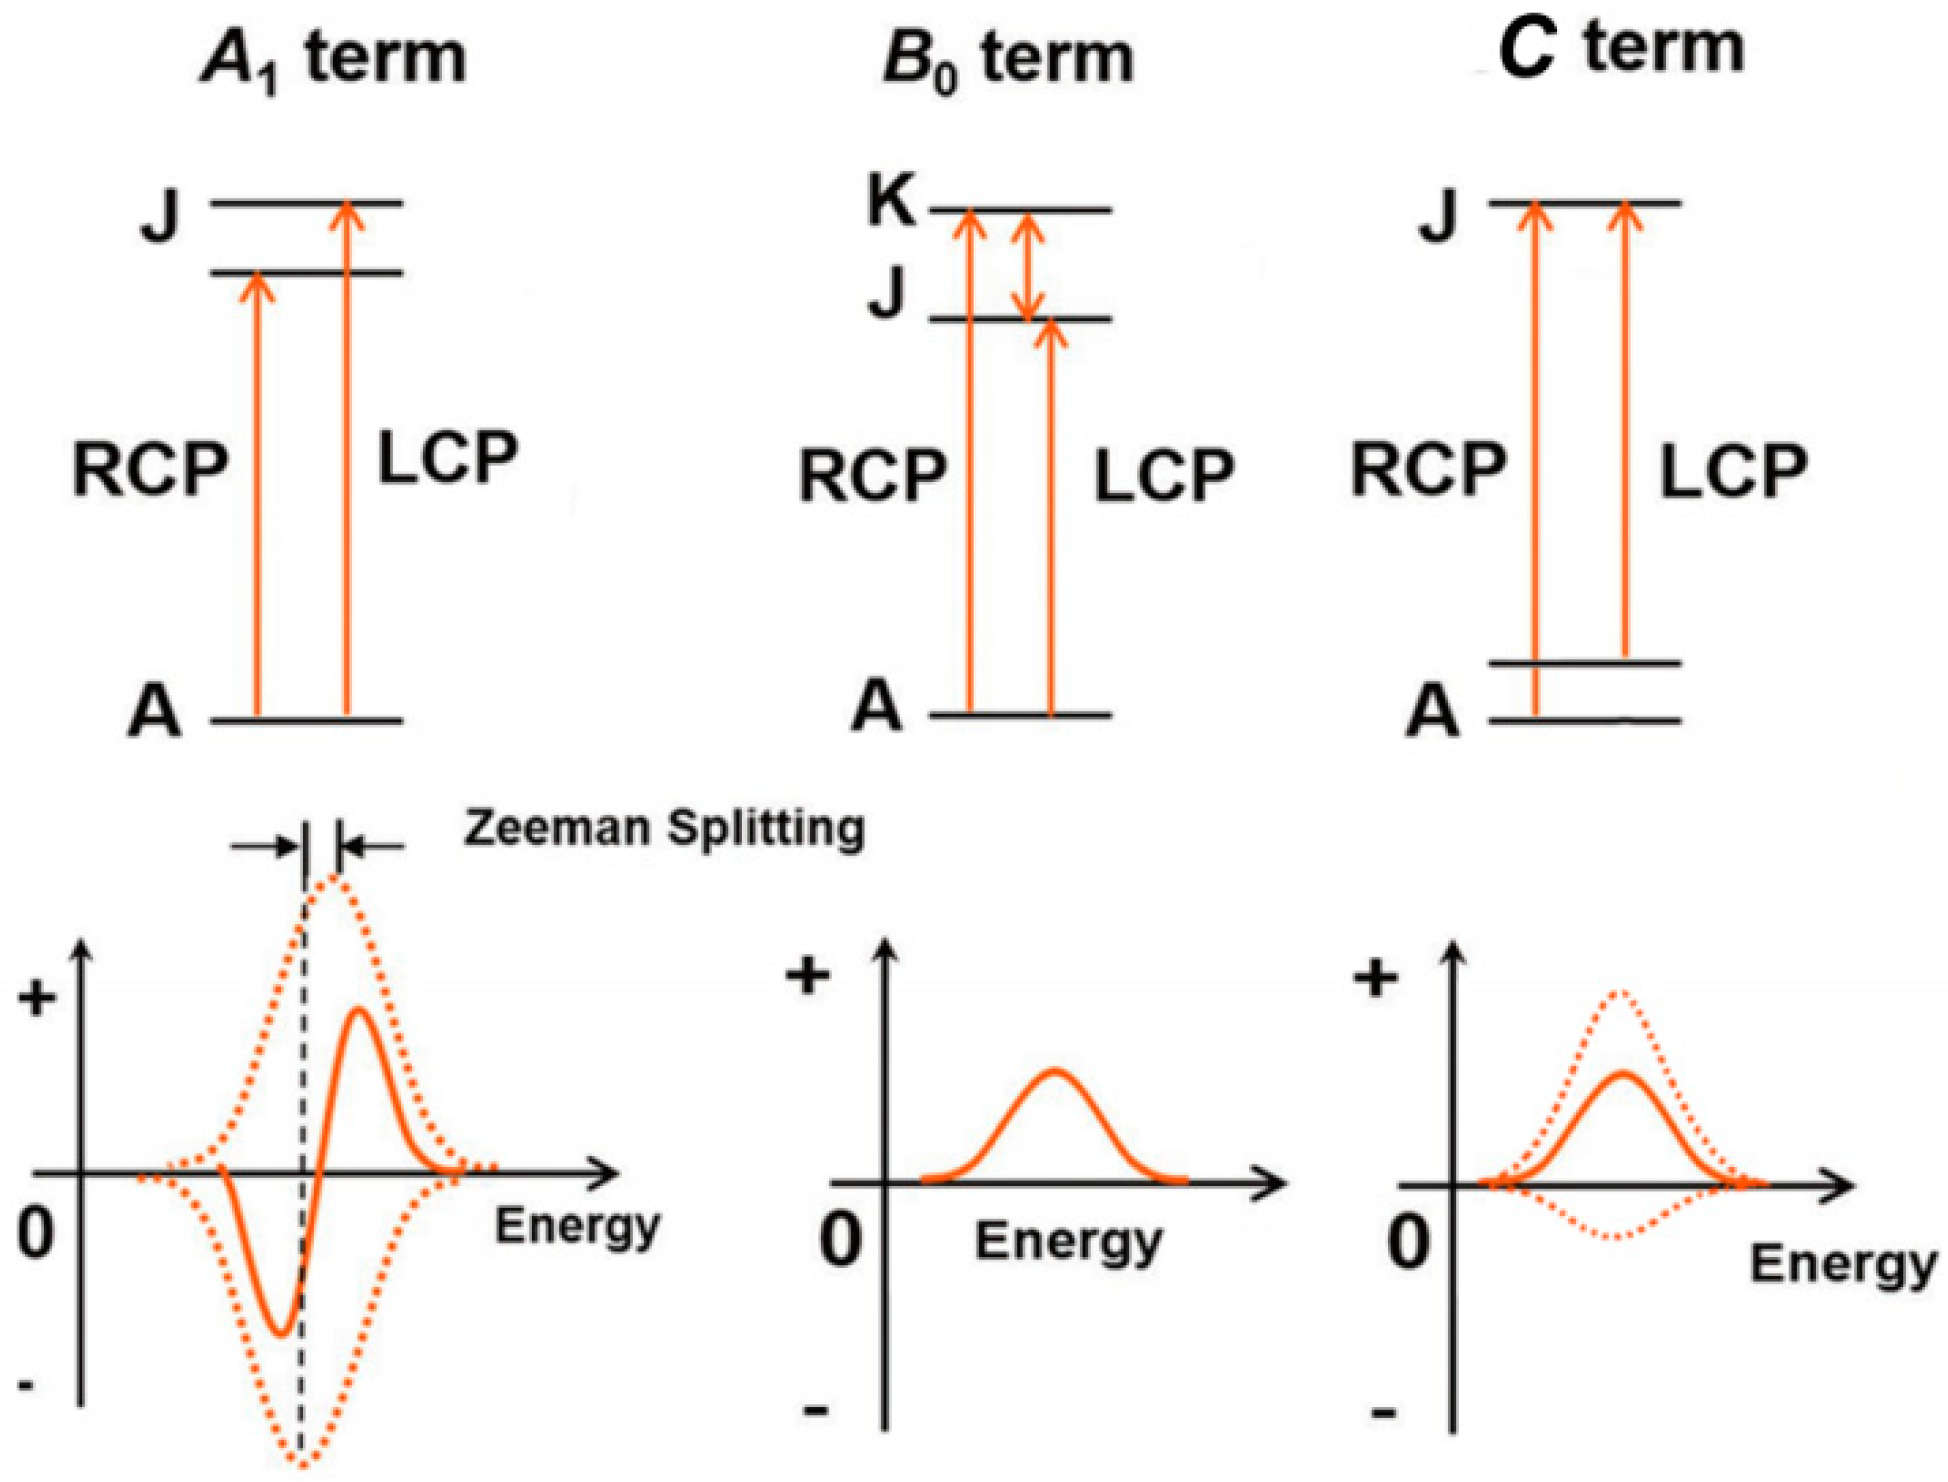
1.4. Magnetic Circular Dichroism Spectroscopy
2. Materials and Methods
2.1. Chemicals
2.2. Synthesis of Hydrophilic AgInS2/ZnS QDs
2.3. Synthesis of Hydrophobic AgInS2/ZnS QDs
2.4. Methods
2.5. Data Treatment
3. Results and Discussion
4. Conclusions
Author Contributions
Funding
Conflicts of Interest
References
- Regulacio, M.D.; Win, K.Y.; Lo, S.L.; Zhang, S.-Y.; Zhang, X.; Wang, S.; Han, M.-Y.; Zheng, Y. Aqueous synthesis of highly luminescent AgInS2-ZnS quantum dots and their biological applications. Nanoscale 2013, 5, 2322–2327. [Google Scholar] [CrossRef] [PubMed]
- Mir, I.A.; Bhat, M.A.; Muhammad, Z.; Rehman, S.U.; Hafeez, M.; Khan, Q.; Zhu, L. Differential and comparative sensing modes of AIS and AIS@ZnS core-shell quantum dots towards bioanalytes. J. Alloys Compd. 2019, 811, 151688. [Google Scholar] [CrossRef]
- Martynenko, I.V.; Kusic, D.; Weigert, F.; Stafford, S.; Donnelly, F.C.; Evstigneev, R.; Gromova, Y.; Baranov, A.V.; Rühle, B.; Kunte, H.-J.; et al. Magneto-fluorescent microbeads for bacteria detection constructed from superparamagnetic Fe3O4 nanoparticles and AIS/ZnS quantum dots. Anal. Chem. 2019, 91, 12661–12669. [Google Scholar] [CrossRef] [PubMed]
- Nong, J.; Lan, G.; Jin, W.; Luo, P.; Guo, C.; Tang, X.; Zang, Z.; Wei, W. Eco-friendly and high-performance photoelectrochemical anode based on AgInS 2 quantum dots embedded in 3D graphene nanowalls. J. Mater. Chem. C 2019, 7, 9830–9839. [Google Scholar] [CrossRef]
- Li, Y.; Li, Z.; Ye, W.; Zhao, S.; Yang, Q.; Ma, S.; Xiao, G.; Liu, G.; Wang, Y.; Yue, Z. Gold nanorods and graphene oxide enhanced BSA-AgInS 2 quantum dot-based photoelectrochemical sensors for detection of dopamine. Electrochim. Acta 2019, 295, 1006–1016. [Google Scholar] [CrossRef]
- Mansur, A.A.P.; Mansur, H.S.; Tabare, C.; Paiva, A.; Capanema, N.S.V. Eco-friendly AgInS2/ZnS quantum dot nanohybrids with tunable luminescent properties modulated by pH-sensitive biopolymer for potential solar energy harvesting applications. J. Mater. Sci. Mater. Electron. 2019, 30, 16702–16717. [Google Scholar] [CrossRef]
- Politano, G.G.; Cazzanelli, E.; Versace, C.; Vena, C.; De Santo, M.P.; Castriota, M.; Ciuchi, F.; Bartolino, R. Graphene oxide on magnetron sputtered silver thin films for SERS and metamaterial applications. Appl. Surf. Sci. 2018, 427, 927–933. [Google Scholar] [CrossRef]
- Baimuratov, A.S.; Martynenko, I.V.; Baranov, A.V.; Fedorov, A.V.; Rukhlenko, I.D.; Kruchinin, S.Y. Giant Stokes Shifts in AgInS 2 Nanocrystals with Trapped Charge Carriers. J. Phys. Chem. C 2019, 123, 6430–16438. [Google Scholar] [CrossRef]
- Stroyuk, O.; Raevskaya, A.; Spranger, F.; Selyshchev, O.; Dzhagan, V.; Schulze, S.; Zahn, D.R.T.; Eychmuller, A. Origin and Dynamics of Highly Efficient Broadband Photoluminescence of Aqueous Glutathione-Capped Size-Selected Ag-In-S Quantum Dots. J. Phys. Chem. C 2018, 144, 369–460. [Google Scholar] [CrossRef]
- Xiao, Z.; Du, K.Z.; Meng, W.; Mitzi, D.B.; Yan, Y. Chemical Origin of the Stability Difference between Copper(I)- and Silver(I)-Based Halide Double Perovskites. Angew. Chemie Int. Ed. 2017, 56, 12107–12111. [Google Scholar] [CrossRef]
- Hong, S.P.; Park, H.K.; Oh, J.H.; Yang, H.; Do, Y.R. Comparisons of the structural and optical properties of o-AgInS2, t-AgInS2, and c-AgIn5S8 nanocrystals and their solid-solution nanocrystals with ZnS. J. Mater. Chem. 2012, 22, 18939–18949. [Google Scholar] [CrossRef]
- Wang, D.; Zheng, W.; Hao, C.; Peng, Q.; Li, Y. General synthesis of I-III-VI2 ternary semiconductor nanocrystals. Chem. Commun. 2008, 2556–2558. [Google Scholar] [CrossRef] [PubMed]
- Chen, S.; Ahmadiantehrani, M.; Zhao, J.; Zhu, S.; Mamalis, A.G.; Zhu, X. Heat-up synthesis of Ag-In-S and Ag-In-S/ZnS nanocrystals: Effect of indium precursors on their optical properties. J. Alloys Compd. 2016, 665, 137–143. [Google Scholar] [CrossRef] [PubMed]
- Saji, P.; Ganguli, A.K.; Bhat, M.A.; Ingole, P.P. Probing the Crystal Structure, Composition-Dependent Absolute Energy Levels, and Electrocatalytic Properties of Silver Indium Sulfide Nanostructures. ChemPhysChem 2016, 17, 1195–1203. [Google Scholar] [CrossRef] [PubMed]
- Girma, W.M.; Fahmi, M.Z.; Permadi, A.; Abate, M.A.; Chang, J.Y. Synthetic strategies and biomedical applications of I-III-VI ternary quantum dots. J. Mater. Chem. B 2017, 5, 6193–6216. [Google Scholar] [CrossRef]
- Moodelly, D.; Kowalik, P.; Bujak, P.; Pron, A.; Reiss, P. Synthesis, photophysical properties and surface chemistry of chalcopyrite-type semiconductor nanocrystals. J. Mater. Chem. C 2019, 7, 11665–11709. [Google Scholar] [CrossRef]
- Zang, H.; Li, H.; Makarov, N.S.; Velizhanin, K.A.; Wu, K.; Park, Y.-S.; Klimov, V.I. Thick-Shell CuInS2/ZnS Quantum Dots with Suppressed “Blinking” and Narrow Single-Particle Emission Line Widths. Nano Lett. 2017, 17, 1787–1795. [Google Scholar] [CrossRef]
- Raevskaya, A.; Lesnyak, V.; Haubold, D.; Dzhagan, V.; Stroyuk, O.; Gaponik, N.; Zahn, D.R.T.; Eychmüller, A. A Fine Size Selection of Brightly Luminescent Water-Soluble Ag-In-S and Ag-In-S/ZnS Quantum Dots. J. Phys. Chem. C 2017, 121, 9032–9042. [Google Scholar] [CrossRef]
- Kurshanov, D.A.; Gromova, Y.A.; Cherevkov, S.A.; Ushakova, E.V.; Kormilina, T.K.; Dubavik, A.; Fedorov, A.V.; Baranov, A.V. Non-Toxic Ternary Quantum Dots AgInS 2 and AgInS 2 /ZnS: Synthesis and Optical Properties. Opt. Spectrosc. 2018, 125, 1041–1046. [Google Scholar] [CrossRef]
- Dai, M.; Ogawa, S.; Kameyama, T.; Okazaki, K.-I.; Kudo, A.; Kuwabata, S.; Tsuboi, Y.; Torimoto, T. Tunable photoluminescence from the visible to near-infrared wavelength region of non-stoichiometric AgInS 2 nanoparticles. J. Mater. Chem. 2012, 22, 12851–12858. [Google Scholar] [CrossRef]
- Torimoto, T.; Kameyama, T.; Kuwabata, S. Photofunctional materials fabricated with chalcopyrite-type semiconductor nanoparticles composed of AgInS2 and its solid solutions. J. Phys. Chem. Lett. 2014, 5, 336–347. [Google Scholar] [CrossRef] [PubMed]
- Kobosko, S.M.; Kamat, P.V. Indium-Rich AgInS2-ZnS Quantum Dots—Ag-/Zn-Dependent Photophysics and Photovoltaics. J. Phys. Chem. C 2018, 122, 14336–14344. [Google Scholar] [CrossRef]
- Chen, T.; Hu, X.; Xu, Y.; Wang, L.; Jiang, W.; Jiang, W.; Xie, Z. Hydrothermal synthesis of highly fluorescent Ag–In–S/ZnS core/shell quantum dots for white light-emitting diodes. J. Alloys Compd. 2019, 804, 119–127. [Google Scholar] [CrossRef]
- Zhang, H.; Fang, W.; Zhong, Y.; Zhao, Q. Zn-Ag-In-S quantum dot sensitized solar cells with enhanced efficiency by tuning defects. J. Colloid Interface Sci. 2019, 547, 267–274. [Google Scholar] [CrossRef] [PubMed]
- Raevskaya, A.; Rozovik, O.; Novikova, A.; Selyshchev, O.; Stroyuk, O.; Dzhagan, V.; Goryacheva, I.; Gaponik, N.; Zahn, D.R.T.; Eychmuller, A. Luminescence and photoelectrochemical properties of size-selected aqueous copper-doped Ag-In-S quantum dots. RSC Adv. 2018, 8, 7550–7557. [Google Scholar] [CrossRef]
- Liao, S.; Huang, Y.; Zhang, Y.; Shan, X.; Yan, Z.; Shen, W. Highly enhanced photoluminescence of AgInS 2 /ZnS quantum dots by hot-injection method. Mater. Res. Express 2015, 2, 015901. [Google Scholar] [CrossRef]
- Xiang, W.; Xie, C.; Wang, J.; Zhong, J.; Liang, X.; Yang, H.; Luo, L.; Chen, Z. Studies on highly luminescent AgInS2 and Ag-Zn-In-S quantum dots. J. Alloys Compd. 2014, 588, 114–121. [Google Scholar] [CrossRef]
- Chang, J.Y.; Wang, G.Q.; Cheng, C.Y.; Lin, W.X.; Hsu, J.C. Strategies for photoluminescence enhancement of AgInS 2 quantum dots and their application as bioimaging probes. J. Mater. Chem. 2012, 22, 10609–10618. [Google Scholar] [CrossRef]
- Marin, G.; Marquez, R.; Guevaraba, R.; Wasim, S.M.; Delgado, J.M.; Rincón, C.; Pérez, G.S.; Molina, I.; Bocaranda, P. Crystal Growth, Structural and Optical Characterization of the Ordered Vacancy Compounds of the I-III 3 -VI 5 and I-III 5 -VI 8 Families. Jpn. J. Appl. Phys. 2000, 39, 44. [Google Scholar] [CrossRef]
- Wang, L.; Kang, X.; Pan, D. Gram-Scale Synthesis of Hydrophilic PEI-Coated AgInS2 Quantum Dots and Its Application in Hydrogen Peroxide/Glucose Detection and Cell Imaging. Inorg. Chem. 2017, 56, 6122–6130. [Google Scholar] [CrossRef]
- Yarema, O.; Yarema, M.; Wood, V. Tuning the Composition of Multicomponent Semiconductor Nanocrystals: The Case of I-III-VI Materials. Chem. Mater. 2018, 30, 1446–1461. [Google Scholar] [CrossRef]
- Kolny-Olesiak, J.; Weller, H. Synthesis and application of colloidal CuInS2 semiconductor nanocrystals. ACS Appl. Mater. Interfaces 2013, 5, 12221–12237. [Google Scholar] [CrossRef] [PubMed]
- Van Der Stam, W.; Berends, A.C.; De Mello Donega, C. Prospects of Colloidal Copper Chalcogenide Nanocrystals. ChemPhysChem 2016, 17, 559–581. [Google Scholar] [CrossRef] [PubMed]
- Hamanaka, Y.; Ogawa, T.; Tsuzuki, M.; Kuzuya, T. Photoluminescence properties and its origin of AgInS2 quantum dots with chalcopyrite structure. J. Phys. Chem. C 2011, 115, 1786–1792. [Google Scholar] [CrossRef]
- Tsuji, I.; Kato, H.; Kobayashi, H.; Kudo, A. Photocatalytic H2 evolution reaction from aqueous solutions over band structure-controlled (Agln)xZn2(1-x)S2 solid solution photocatalysts with visible-light response and their surface nanostructures. J. Am. Chem. Soc. 2004, 126, 13406–13413. [Google Scholar] [CrossRef]
- Stroyuk, O.; Weigert, F.; Raevskaya, A.; Spranger, F.; Würth, C.; Resch-Genger, U.; Gaponik, N.; Zahn, D.R.T. Inherently Broadband Photoluminescence in Ag–In–S/ZnS Quantum Dots Observed in Ensemble and Single-Particle Studies. J. Phys. Chem. C 2019, 123, 2632–2641. [Google Scholar] [CrossRef]
- Shabaev, A.; Mehl, M.J.; Efros, A.L. Energy band structure of CuInS2 and optical spectra of CuInS2 nanocrystals. Phys. Rev. B Condens. Matter Mater. Phys. 2015, 92, 035431. [Google Scholar] [CrossRef]
- Martynenko, I.V.; Baimuratov, A.S.; Weigert, F.; Soares, J.X.; Dhamo, L.; Nickl, P.; Doerfel, I.; Pauli, J.; Rukhlenko, I.D.; Baranov, A.V.; et al. Photoluminescence of Ag-In-S/ZnS quantum dots: Excitation energy dependence and low-energy electronic structure. Nano Res. 2019, 12, 1595–1603. [Google Scholar] [CrossRef]
- Urbach, F. The long-wavelength edge of photographic sensitivity and of the electronic Absorption of Solids. Phys. Rev. 1953, 92, 1324. [Google Scholar] [CrossRef]
- Bonalde, I.; Medina, E.; Rodriguez, M.; Wasim, S.M.; Marin, G.; Rincon, C.; Rincón, A.; Torres, C. Urbach tail, disorder, and localized modes in ternary semiconductors. Phys. Rev. B Condens. Matter Mater. Phys. 2004, 69, 195201. [Google Scholar] [CrossRef]
- Nagamine, G.; Nunciaroni, H.B.; McDaniel, H.; Efros, A.L.; Cruz, C.H.D.B.; Padilha, L.A. Evidence of Band-Edge Hole Levels Inversion in Spherical CuInS2 Quantum Dots. Nano Lett. 2018, 18, 6353–6359. [Google Scholar] [CrossRef]
- Fuhr, A.S.; Yun, H.J.; Makarov, N.S.; Li, H.; McDaniel, H.; Klimov, V.I. Light Emission Mechanisms in CuInS2 Quantum Dots Evaluated by Spectral Electrochemistry. ACS Photonics 2017, 4, 2425–2435. [Google Scholar] [CrossRef]
- Cichy, B.; Rich, R.; Olejniczak, A.; Gryczynski, Z.; Strek, W. Two blinking mechanisms in highly confined AgInS2 and AgInS2/ZnS quantum dots evaluated by single particle spectroscopy. Nanoscale 2016, 8, 4151–4159. [Google Scholar] [CrossRef] [PubMed]
- Martynenko, I.V.; Baimuratov, A.S.; Osipova, V.A.; Kuznetsova, V.A.; Purcell-Milton, F.; Rukhlenko, I.D.; Fedorov, A.V.; Resch-Genger, U.; Baranov, A.V.; Gun’Ko, Y.K.; et al. Excitation Energy Dependence of the Photoluminescence Quantum Yield of Core/Shell CdSe/CdS Quantum Dots and Correlation with Circular Dichroism. Chem. Mater. 2018, 30, 465–471. [Google Scholar] [CrossRef]
- Kuznetsova, V.; Visheratina, A.; Ryan, A.; Martynenko, I.; Loudon, A.; Maguire, C.M.; Orlova, A.; Baranov, A.; Fedorov, A.; Volkov, Y.; et al. Enantioselective cytotoxicity of ZnS:Mn quantum dots in A549 cells. Chirality 2017, 29, 403–408. [Google Scholar] [CrossRef] [PubMed]
- Gromova, Y.A.; Miropoltsev, M.A.; Cherevkov, S.A.; Maslov, V.G.; Baranov, A.V.; Fedorov, A.V. Magnetic Circular Dichroism in 2D Colloidal Semiconductor Nanocrystals. Opt. Spectrosc. 2018, 125, 698–702. [Google Scholar] [CrossRef]
- Gromova, Y.A.; Maslov, V.G.; Baranov, M.A.; Serrano-Garcia, R.; Kuznetsova, V.A.; Purcell-Milton, F.; Baranov, A.V.; Fedorov, A.V.; Gun’Ko, Y.K.; Gun’Ko, Y.K.; et al. Magnetic and Optical Properties of Isolated and Aggregated CoFe2O4 Superparamagnetic Nanoparticles Studied by MCD Spectroscopy. J. Phys. Chem. C 2018, 122, 11491–11497. [Google Scholar] [CrossRef]
- Stephens, P.J. Theory of magnetic circular dichroism. J. Chem. Phys. 1970, 52, 3489–3516. [Google Scholar] [CrossRef]
- Solomon, E.I.; Pavel, E.G.; Loeb, K.E.; Campochiaro, C. Magnetic circular dichroism spectroscopy as a probe of the geometric and electronic structure of non-heme ferrous enzymes. Coord. Chem. Rev. 1995, 144, 369–460. [Google Scholar] [CrossRef]
- Kuno, M.; Nirmal, M.; Bawendi, M.G.; Efros, A.; Rosen, M. Magnetic circular dichroism study of CdSe quantum dots. J. Chem. Phys. 1998, 108, 4242–4247. [Google Scholar] [CrossRef]
- Rice, W.D.; McDaniel, H.; Klimov, V.I.; Crooker, S.A. Magneto-optical properties of CuInS2 nanocrystals. J. Phys. Chem. Lett. 2014, 5, 4105–4109. [Google Scholar] [CrossRef] [PubMed]
- Gabka, G.; Bujak, P.; Giedyk, K.; Ostrowski, A.; Malinowska, K.; Herbich, J.; Golec, B.; Wielgus, I.; Pron, A. A simple route to alloyed quaternary nanocrystals Ag-In-Zn-S with shape and size control. Inorg. Chem. 2014, 53, 5002–5012. [Google Scholar] [CrossRef] [PubMed]


| No. | Hydrophilic | Hydrophobic | ||||
|---|---|---|---|---|---|---|
| Fraction 1 | Fraction 2 | MCD Term | Fraction 1 | Fraction 2 | MCD Term | |
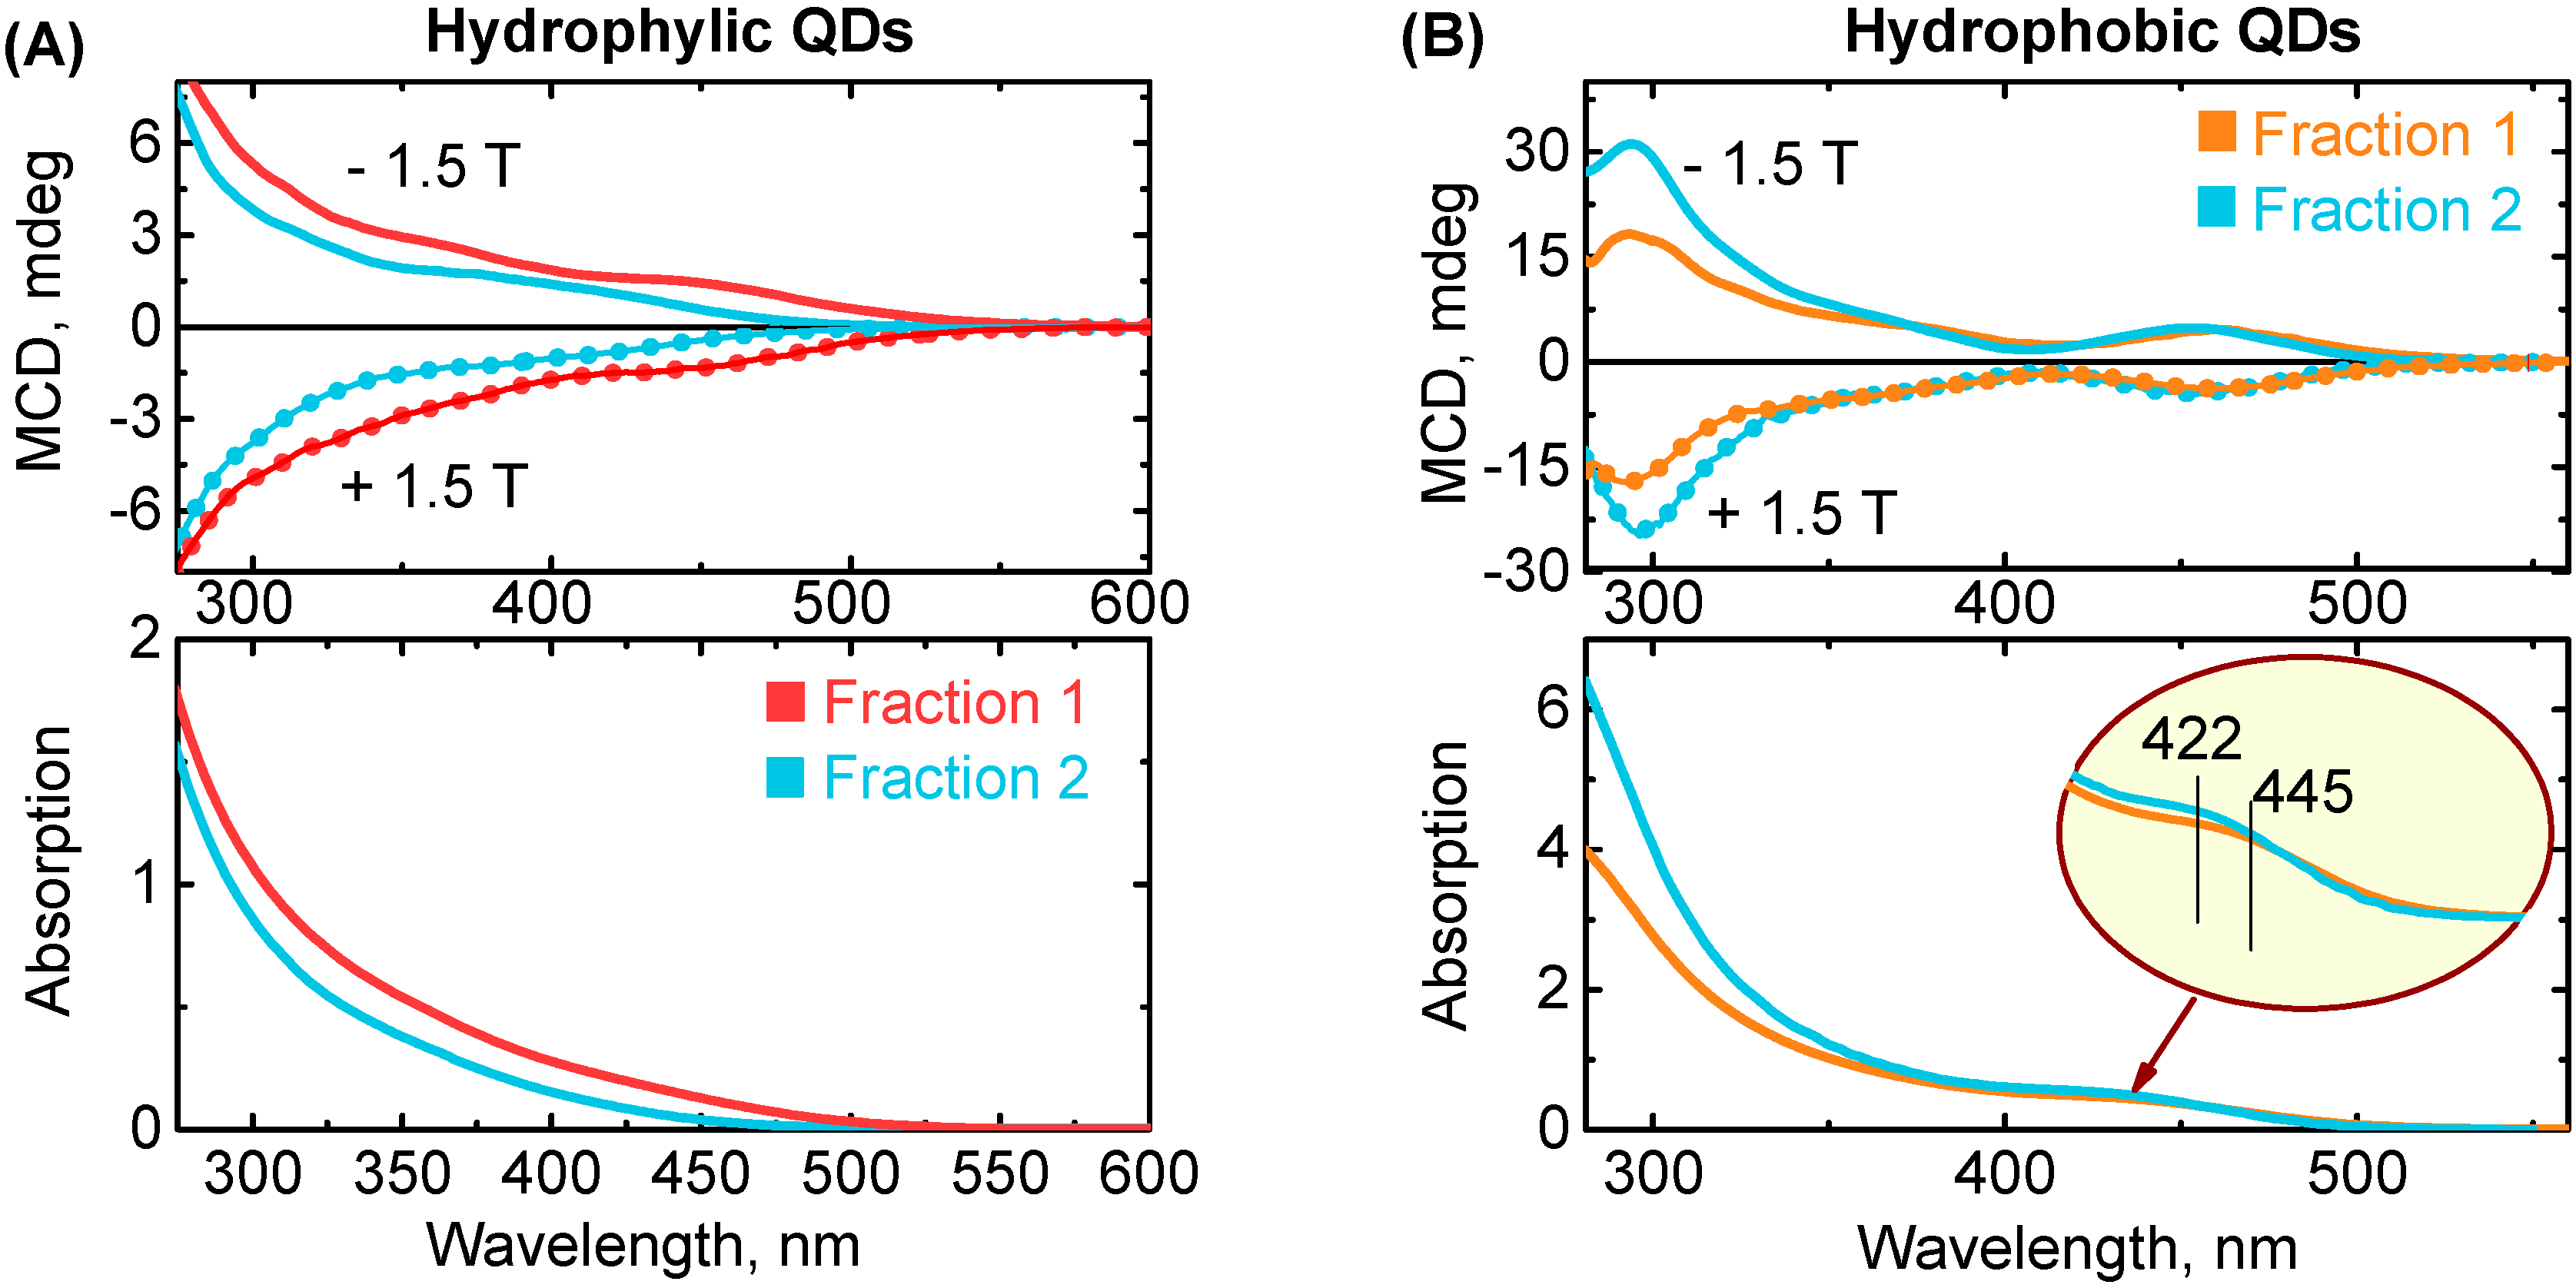
| 1 | 499 (2.48) | 496 (2.49) | A + B | 495 (2.50) | 489 (2.53) | A + B |
| 2 | 461 (2.69) | 459 (2.70) | A + B | 458 (2.70) | 456 (2.72) | B |
| 3 | 417 (2.97) | 415 (2.98) | A + B | 418 (2.96) | 412 (3.01) | B |
| 4 | 369 (3.36) | 370 (3.35) | unknown | 369 (3.36) | 369 (3.36) | unknown |
| 5 | - | - | - | 309 (4.01) | 309 (4.01) | A |
© 2019 by the authors. Licensee MDPI, Basel, Switzerland. This article is an open access article distributed under the terms and conditions of the Creative Commons Attribution (CC BY) license (http://creativecommons.org/licenses/by/4.0/).
Share and Cite
Gromova, Y.; Sokolova, A.; Kurshanov, D.; Korsakov, I.; Osipova, V.; Cherevkov, S.; Dubavik, A.; Maslov, V.; Perova, T.; Gun’ko, Y.; et al. Investigation of AgInS2/ZnS Quantum Dots by Magnetic Circular Dichroism Spectroscopy. Materials 2019, 12, 3616. https://doi.org/10.3390/ma12213616
Gromova Y, Sokolova A, Kurshanov D, Korsakov I, Osipova V, Cherevkov S, Dubavik A, Maslov V, Perova T, Gun’ko Y, et al. Investigation of AgInS2/ZnS Quantum Dots by Magnetic Circular Dichroism Spectroscopy. Materials. 2019; 12(21):3616. https://doi.org/10.3390/ma12213616
Chicago/Turabian StyleGromova, Yulia, Anastasiia Sokolova, Danil Kurshanov, Ivan Korsakov, Victoria Osipova, Sergei Cherevkov, Aliaksei Dubavik, Vladimir Maslov, Tatiana Perova, Yurii Gun’ko, and et al. 2019. "Investigation of AgInS2/ZnS Quantum Dots by Magnetic Circular Dichroism Spectroscopy" Materials 12, no. 21: 3616. https://doi.org/10.3390/ma12213616
APA StyleGromova, Y., Sokolova, A., Kurshanov, D., Korsakov, I., Osipova, V., Cherevkov, S., Dubavik, A., Maslov, V., Perova, T., Gun’ko, Y., Baranov, A., & Fedorov, A. (2019). Investigation of AgInS2/ZnS Quantum Dots by Magnetic Circular Dichroism Spectroscopy. Materials, 12(21), 3616. https://doi.org/10.3390/ma12213616