Article

Microwave-Assisted Synthesis of High-Energy Faceted TiO2 Nanocrystals Derived from Exfoliated Porous Metatitanic Acid Nanosheets with Improved Photocatalytic and Photovoltaic Performance

1
School of Chemistry & Chemical Engineering, Jinzhong University, Jinzhong 030619, China
2
Department of Advanced Materials Science, Faculty of Engineering, Kagawa University, 2217-20 Hayashi-cho, Takamatsu-shi 761-0396, Japan
3
Beijing Key Laboratory of Energy Conversion and Storage Materials, College of Chemistry, Beijing Normal University, Beijing 100875, China
4
State Key Laboratory of Coal Conversion, Institute of Coal Chemistry, Chinese Academy of Sciences, Taiyuan 030001, China
*
Authors to whom correspondence should be addressed.
Materials 2019, 12(21), 3614; https://doi.org/10.3390/ma12213614
Submission received: 23 September 2019 / Revised: 26 October 2019 / Accepted: 30 October 2019 / Published: 4 November 2019
(This article belongs to the Special Issue Advanced Photocatalytic Materials)

Abstract

:
A facile one-pot microwave-assisted hydrothermal synthesis of rutile TiO2 quadrangular prisms with dominant {110} facets, anatase TiO2 nanorods and square nanoprisms with co-exposed {101}/[111] facets, anatase TiO2 nanorhombuses with co-exposed {101}/{010} facets, and anatase TiO2 nanospindles with dominant {010} facets were reported through the use of exfoliated porous metatitanic acid nanosheets as a precursor. The nanostructures and the formation reaction mechanism of the obtained rutile and anatase TiO2 nanocrystals from the delaminated nanosheets were investigated. The transformation from the exfoliated metatitanic nanosheets with distorted hexagonal cavities to TiO2 nanocrystals involved a dissolution reaction of the nanosheets, nucleation of the primary [TiO6]8− monomers, and the growth of rutile-type and anatase-type TiO2 nuclei during the microwave-assisted hydrothermal reaction. In addition, the photocatalytic activities of the as-prepared anatase nanocrystals were evaluated through the photocatalytic degradation of typical carcinogenic and mutagenic methyl orange (MO) under UV-light irradiation at a normal temperature and pressure. Furthermore, the dye-sensitized solar cell (DSSC) performance of the synthesized anatase TiO2 nanocrystals with various morphologies and crystal facets was also characterized. The {101}/[111]-faceted pH2.5-T175 nanocrystal showed the highest photocatalytic and photovoltaic performance compared to the other TiO2 samples, which could be attributed mainly to its minimum particle size and maximum specific surface area.

Graphical Abstract

1. Introduction

Inorganic nanocrystals with tailored morphologies and specific facets have received much attention in the past decade due to their many intrinsic shape-dependent properties and excellent technological applications in energy and environmental fields [1,2]. As one of the most studied semiconductor metal oxides, titanium dioxide (TiO2) has been extensively utilized in photovoltaic cells, dye-sensitized soar cells, photocatalysis, the photocatalytic degradation of organic pollutants, Li-ion batteries, etc., due to its good photocatalytic activity, high biological and chemical inertness, long-term chemical and thermal stability, low price, nontoxicity, and excellent degradation capability [3,4,5,6,7]. Compared to the other two crystalline phases (rutile (tetragonal, space group P42/mnm) and brookite (orthorhombic, space group Pbca)) of TiO2, anatase (tetragonal, space group I41/amd) is widely accepted for its higher photocatalytic activity and for having the most superior dye-sensitized solar cell performance [8,9]. However, the photocatalytic and photovoltaic performances of anatase TiO2 nanocrystals still need to be further improved for their practical application and commercialization. To achieve this purpose, anatase TiO2 nanocrystals with high crystallinity, well-defined morphology, good architecture, a small crystallite size, a large specific surface area, and proper composition are desirable to improve photocatalytic and photovoltaic performance [10,11]. Besides, anatase TiO2 nanocrystals with well-defined morphologies and tailored high-energy crystal facets for photocatalysis and photoanodes also have been proven to be an effective approach to significantly improve photocatalytic and photovoltaic performance in recent years [12]. Surface scientists have demonstrated that the average surface energies of anatase TiO2 increase in the order of {111} facet (1.61 J/m2) > {110} facet (1.09 J/m2) > {001} facet (0.90 J/m2) > {010}/{100} facet (0.53 J/m2) > {101} facet (0.44 J/m2) [13,14]. Generally speaking, facets with high surface energies diminish rapidly during the crystal growth process for the minimization of the total surface free energy under equilibrium conditions, which results in the total exposed surface of the anatase TiO2 crystals being primarily controlled by {101} facets with poor reactivity and thermodynamic stability [15]. As a result, the morphology of the anatase TiO2 crystals is a slightly truncated tetragonal bipyramid with eight equivalent {101} facets and two equivalent {001} facets based on Wulff construction [8]. Therefore, it is imperative to reasonably design and synthesize various morphologies of TiO2 nanocrystals with exposed high-energy surfaces to enhance photocatalytic activity and optimize dye-sensitized solar cell (DSSC) performance. Important progress was made by Wen and coworkers, who reported the synthesis of nanosized anatase TiO2 crystallites with their dominant {010} facets exposed [16]. Subsequently, Yang and coworkers reported the synthesis of microsized anatase TiO2 crystals (with around 47% and 89% {001} facets being exposed) by using TiF4 as the raw material and hydrogen fluoride (HF) as the capping agent [15,17].Following these breakthroughs, more and more research work has focused on the design and control of the synthesis of anatase TiO2 crystals with varied percentages of high active facets [2,8,18,19,20]. However, the previously reported methods for synthesizing anatase TiO2 crystals with high-energy facets often involve the use of toxic and corrosive HF or other F-containing species, which restricts the practical application of TiO2 nanocrystals [10,12]. For example, Feng and coworkers reported the synthesis of regular foursquare anatase TiO2 mesocrystal sheets with dominant {001} facets by using TiCl4 as the titanium source and HF as the capping agent [21]. Illa and coworkers reported on hollow spheres assembled by high-energy {001}-faceted mesoporous cuboid anatase nanocrystals, which showed higher photocatalytic and photoelectrochemical activity than did those of commercial P25 [22]. Khalil and coworkers reported the synthesis of Au–TiO2 heterostructures with exposed {001} facets, which showed enhanced photocatalytic performance [23]. Ye and coworkers reported the synthesis of anatase TiO2 crystals with co-exposed {101}/{001} and {010}/{001} facets by using (NH4)2TiF6 as the titanium and fluorine species [24]. Xu and coworkers reported the synthesis of square-shaped plate TiO2 single crystals with well-defined {111} facets that were exposed using both HF and ammonia as the capping reagents [14]. Amoli and coworkers reported the synthesis of anatase TiO2 nanocubes and nanoparallelepipeds with well-defined {111} facets exposed by using oleylamine as the morphology controlling agent and NH3/HF as the stabilizing agent [25]. Recently, we also synthesized truncated tetragonal bipyramid anatase TiO2 nanocrystals with co-exposed {001}, {010}, and {101} facets and tetragonal cuboid anatase TiO2 nanocrystals with co-exposed [111]- and {101} facets by using the H+ form of tetratitanate H2Ti4O9 as the precursor and HF as the capping agent [26]. Very recently, using porous metatitanic acid H2TiO3 as the precursor and HF as the capping agent, cuboid-like anatase TiO2 nanocrystals with co-exposed {101}/[111] facets and irregular anatase TiO2 nanocrystals with co-exposed {101}/{010} facets were also synthesized [27].
The microwave-assisted hydrothermal method is unique in its ability to be scaledup without suffering thermal gradient effects, providing a potentially industrially important improvement over convective methods in the synthesis of nanocrystals [28]. The advantage of using the microwave-assisted hydrothermal method over a conventional heating method lies in its homogenous selective heating and scalability, its shorter reaction time, its rapid formation rate, and the higher purity and better crystallinity of the produced products (as the yields obtained are identical for both heating methods) [29,30,31]. For example, under microwave-assisted solvothermal conditions, Yoon and coworkers reported the synthesis of various polymorphs of TiO2 nanocrystals with different morphologies by using TiCl4 or TiCl3 as precursors [29]. Nunes and coworkers reported the production and photocatalytic activity of brookite/rutile mixed-phase TiO2 nanorod spheres and nanorod arrays grown on polyethylene terephthalate substrates, which displayed remarkable degradability performance and reusability under ultraviolet and solar radiation for the degradation of rhodamine B [32].
In the present work, we report a facile synthesis of shape-tunable TiO2 nanocrystals with dominant {110}, {010}, and [111] facets through a simple one-step fluorine-free microwave-assisted hydrothermal method. The synthetic process demonstrates that the pH value of the exfoliated nanosheet solution plays a key role in morphology evolution and facet exposure under hydrothermal conditions. The possible transformation reaction mechanism of the TiO2 nanocrystals with various morphologies and exposure facets and the photocatalytic and photovoltaic performance were investigated. Compared to P25 TiO2 nanocrystals, the pH2.5-T175 nanocrystals with dominant [111] facets showed higher photocatalytic and photovoltaic performance.

2. Materials and Methods

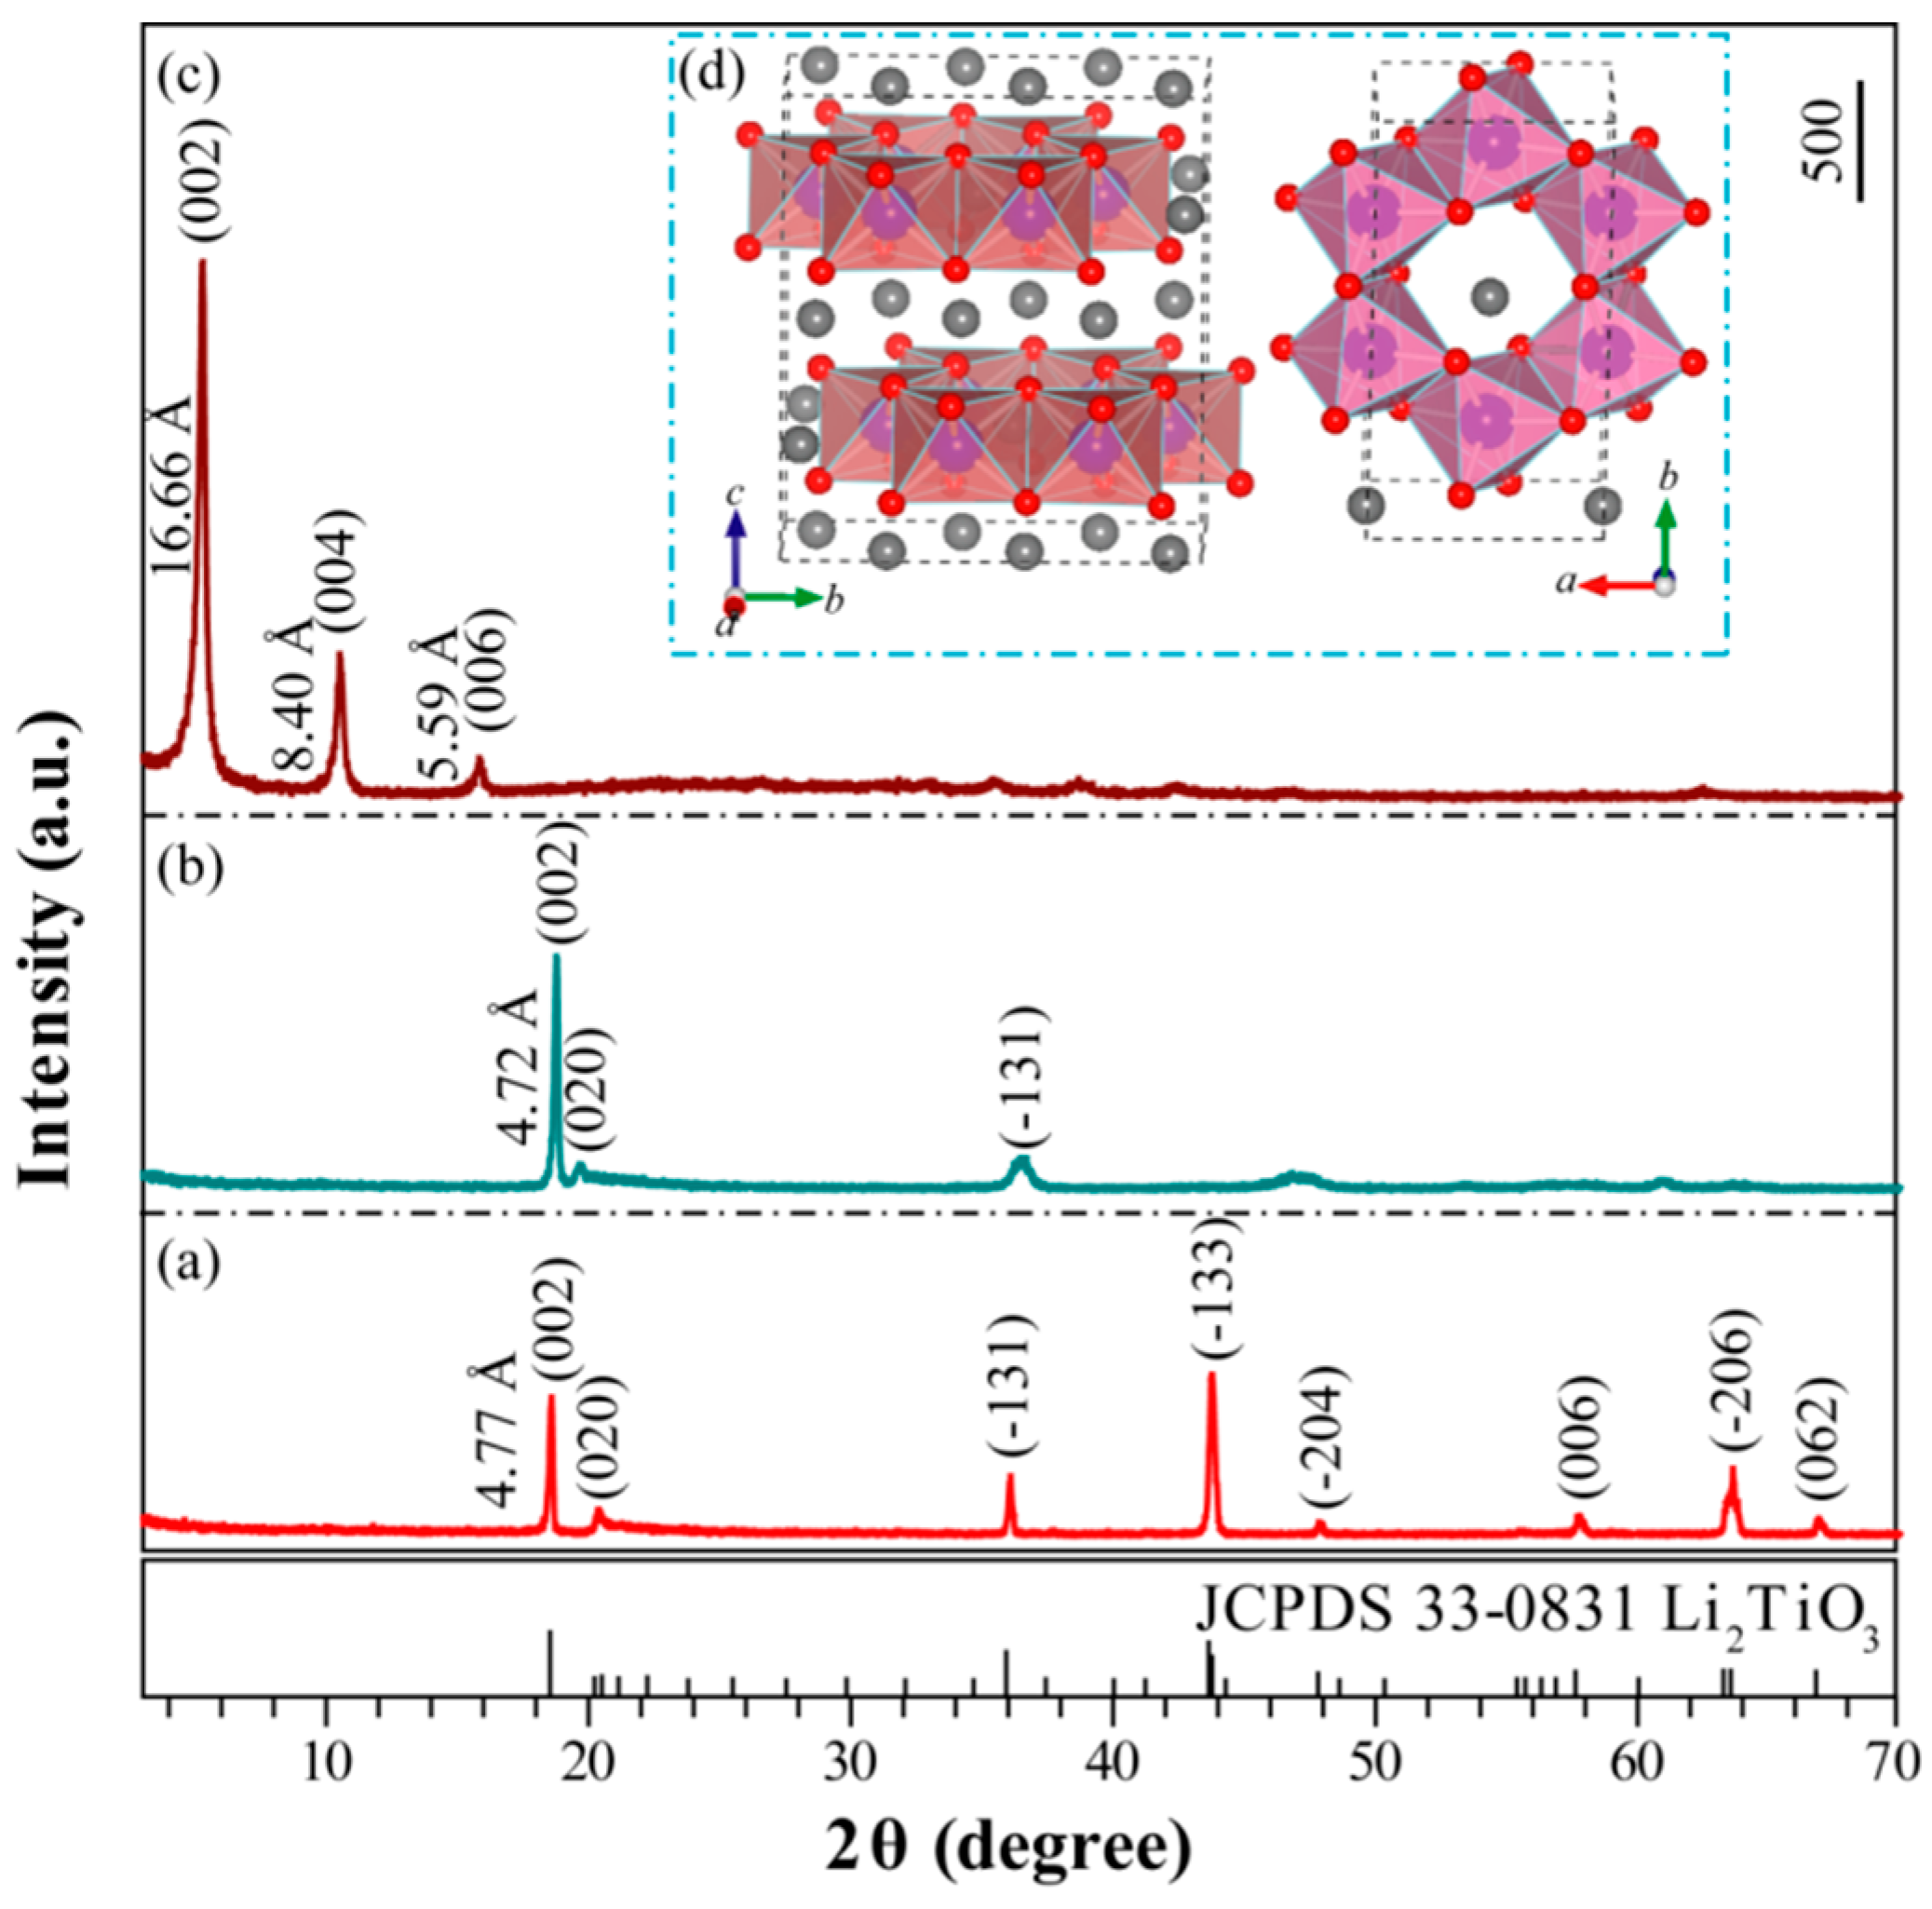
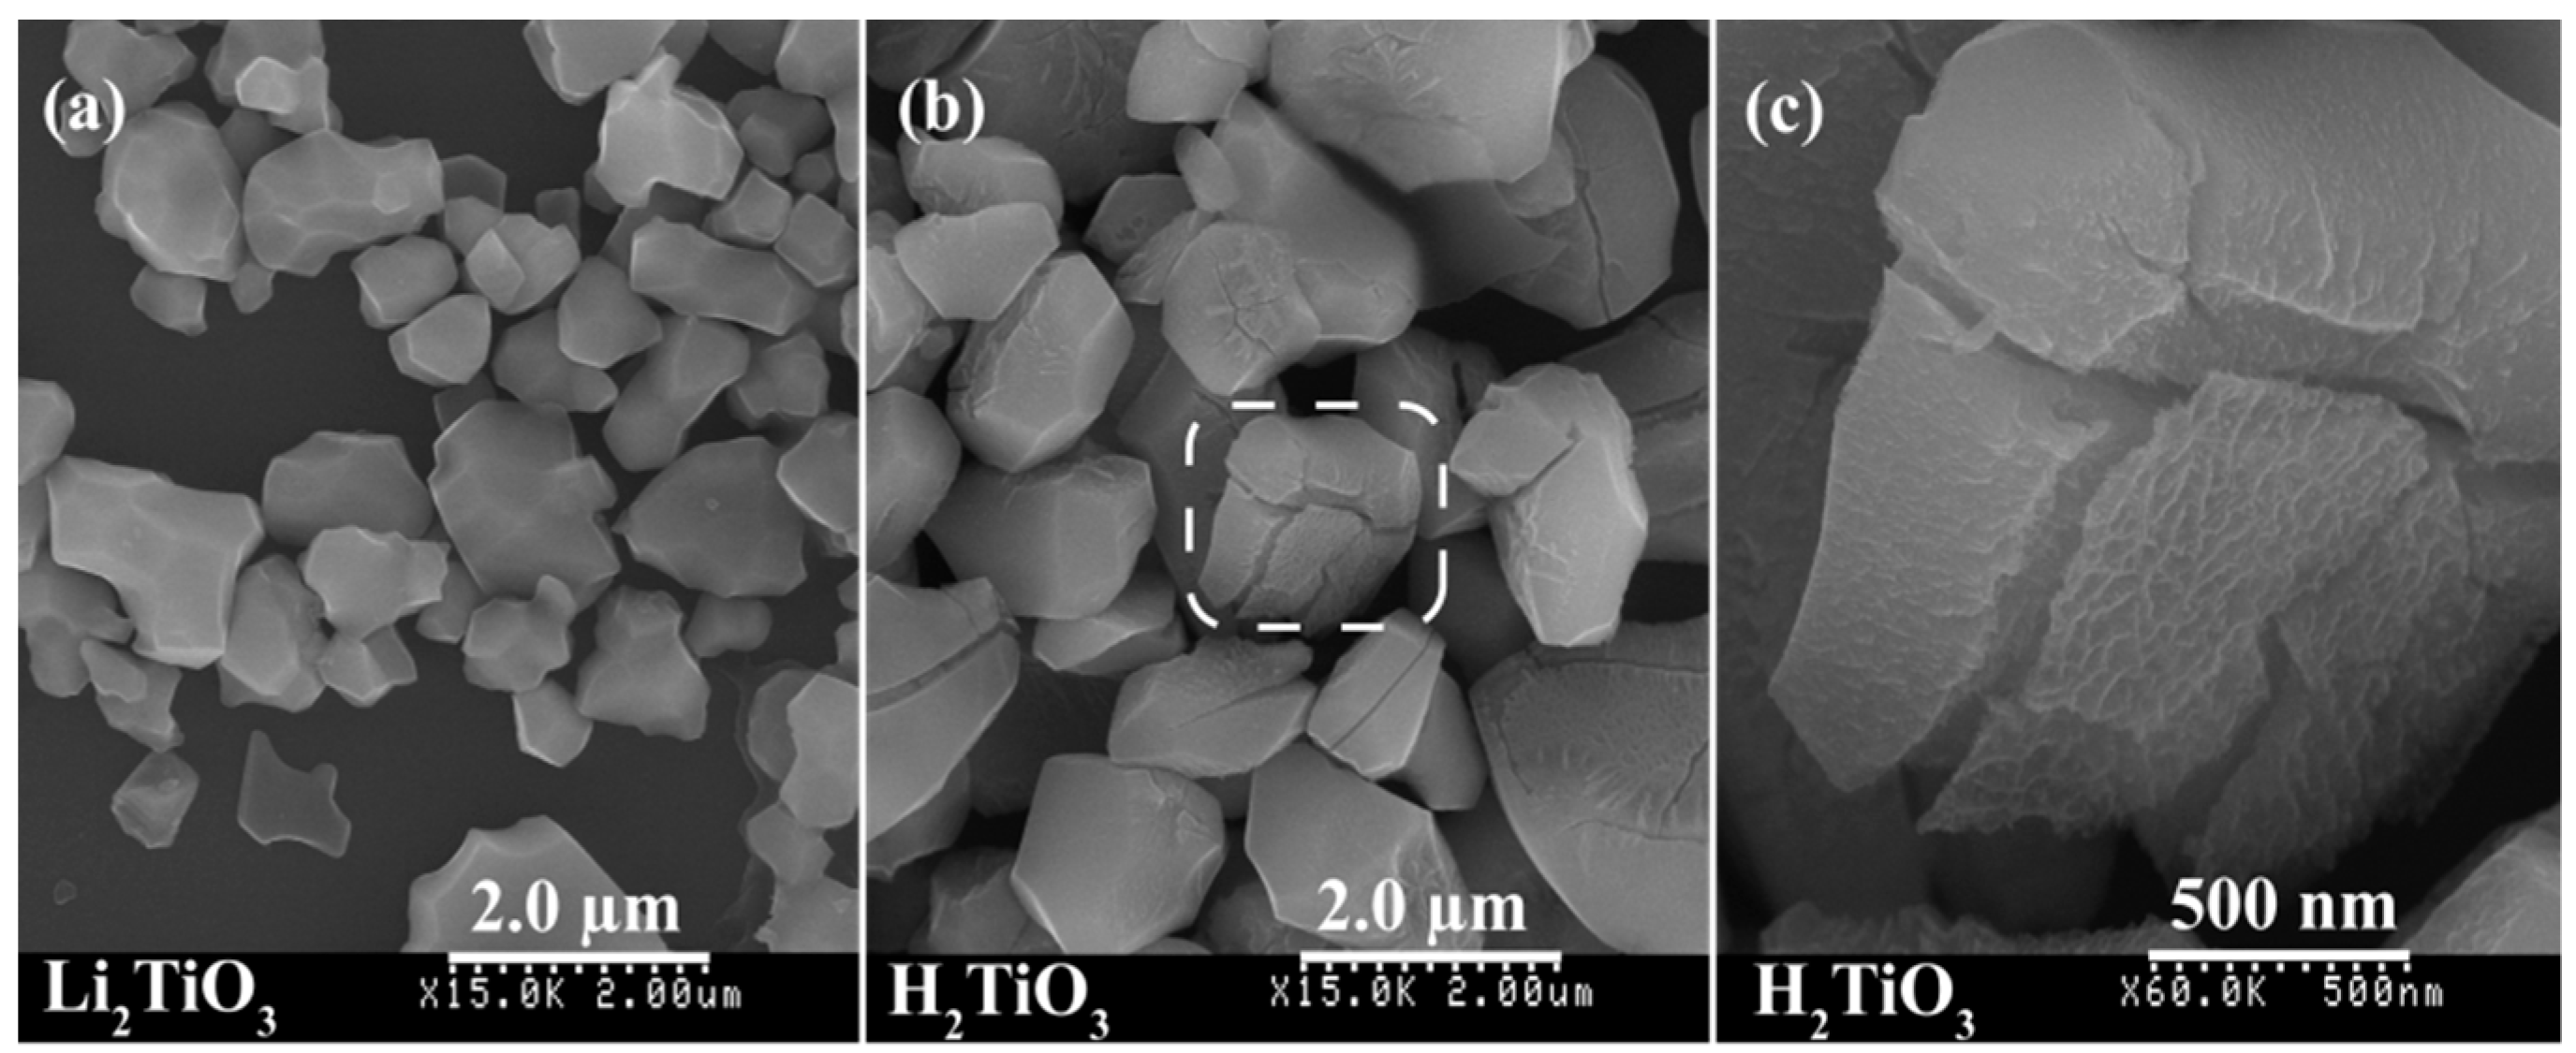
2.1. Preparation of Layered Li2TiO3and H2TiO3

Lithium metatitanate (Li2TiO3) was formed through a conventional solid-state reaction [33]. Lithium carbonate (Li2CO3, 99.0%) and titanium dioxide (TiO2, 98.5%) were taken in a molar ratio of 1.05:3 and milled in a horizontal ball mill at 50 rpm for 6 h, and then the mixture was calcined at 850 °C for 24 h in an air atmosphere. Then, 10.0 g of the obtained earthy gray Li2TiO3 powder was acid-treated three times with a 1.0 mol·L−1 HCl solution (1 L) at room temperature for 24 h under magnetic stirring to remove Li+ completely from the metatitanate to obtain a white metatitanic acid H2TiO3 sample.

2.2. Exfoliation of H2TiO3 into a Nanosheet Colloidal Solution

The obtained metatitanic acid H2TiO3 sample (5.0 g) was hydrothermally treated at 100 °C for 24 h with magnetic stirring in a 12.5% tetramethylammonium hydroxide solution (50 mL, (CH3)4NOH, hereafter TMAOH) to intercalate TMA+ ions into the interlayer of the metatitanic acid H2TiO3 and to obtain a TMA+-intercalated layered H2TiO3 sample. The intercalation compound obtained was delaminated into H2TiO3 nanosheet by dispersed it in 450 mL of deionized water with stirring at room temperature for 3 days.

2.3. Microwave Hydrothermal Synthesis of TiO2 Nanocrystals

TiO2 nanocrystals were prepared through microwave-assisted hydrothermal treatment of the above exfoliated H2TiO3 nanosheet colloidal solution (40 mL) at a desired temperature for 2 h. After the microwave hydrothermal process, the resultant sample was filtered, washed multiple times with deionized water, and then dried using a freeze-drying machine. Here, the obtained TiO2 sample is specified as pHx-Ty, where x and y are the desired pH value of the nanosheet colloidal solution and the desired temperature of the microwave-assisted hydrothermal treatment, respectively.

2.4. Photocatalytic Activity

The photocatalytic activity of the resulting TiO2 nanocrystals was assessed through the photodecomposition of carcinogenic and mutagenic methyl orange (MO), one of the most stable azo dyes [34,35]. Here, 200 mL of 2.31 × 10⁻⁵ mol/L MO solution was added to a 250mL quartz glass beaker containing 75 mg of as-prepared TiO2 nanocrystals and then sonicated for 5 min for the complete dispersion of the TiO2 nanocrystals followed by continuous stirring for 60 min in the dark to prepare the suspension solution of TiO2 nanocrystals. The above suspension solution was placed in the dark for 2 days to ensure that the adsorption–desorption phenomenon reached equilibrium. After that, photocatalytic degradation was carried out by stirring the above suspensions under ultraviolet irradiation using a 175-W low-pressure mercury lamp (λ = 365 nm). The distance between the mercury lamp and the suspension solution was 30 cm. At intervals of 15 min, 4 mL of suspension solution was taken out from the beaker and centrifuged at 2000 rpm for 5 min to separate the TiO2 nanocrystals, and the concentration of MO supernatant solution was analyzed by using a TU-1901 spectrophotometer (Beijing Purkinje General Instrument Co. Ltd. Beijing, China). The photodegradation efficiency (η) of the as-prepared TiO2 nanocrystals (as a percentage) was calculated according to the equation [36]:
η = c 0 c t c t × 100 %
where c0 and ct represent the concentration of the MO suspensionin the absence and presence of light irradiation, respectively. For a comparison, Degussa P25-TiO2 (~87% anatase and ~13% rutile) was also investigated.

2.5. Fabrication of Photoanodes and Dye-Sensitized Solar Cells (DSSCs)

For the preparation of the nanoporous TiO2 layers with the prepared TiO2 nanocrystals and the Degussa P25-TiO2 nanocrystals, a viscous slurry was prepared through the following procedure. The prepared TiO2 nanocrystals (0.5 g) were dispersed in ethanol (2.5 g) and then mixed with α-terpineol (2.0 g), ethyl-cellulose 10 (1.4 g of 10 wt% solution in ethanol), and ethyl-cellulose 45 (1.1 g of 10 wt% solution in ethanol). Subsequently, the resulting mixture was sonicated for 5 min and then ball-milled for 3 days. After removing the ethanol with a rotary evaporator, an optical paste containing 18% TiO2, 9% ethyl-cellulose, and 73% α-terpineol was obtained. A nanoporous TiO2 photoanode was obtained according to the following steps. Fluorine-doped tin oxide (FTO)-conducting glass substrates were cleaned in the order of neutral cleaner, deionized water, and absolute ethanol by ultrasonication for 5 min. Subsequently, the FTO glass substrates (12.5 × 25.0 mm2) were dipped into titanium tetraisopropoxide solution (0.1 mol·L−1) for 1 min and then washed with ionized water and absolute ethanol. After being dried, the prepared FTO glass substrates were placed in a muffle furnace, and the reaction temperature was increased to 480 °C at 10 °C/min and was kept at this temperature for 1 h to coat a dense TiO2 film on the surface of the FTO glass substrates. Afterwards, the prepared TiO2 paste was coated on the above FTO glass substrates by using the doctor-blade technique, was dried at 100 °C for 15 min, and was sintered in the above muffle furnace at 315 °C for 15 min. This process was repeated several times until the desired thickness of TiO2 film was obtained. The above FTO glass substrates coated with the TiO2 pastes were first sintered at 450 °C for 30 min, then treated with 0.1 mol·L−1 titanium tetraisopropoxide solution as described above, and finally sintered at 480 °C for 1 h to fabricate TiO2 thin-film photoanodes. After being cooled to 80 °C, the TiO2 photoanodes were immersed in N719 dye solution for 24 h at room temperature. An N719-sensitized TiO2 photoelectrode (working electrode) was coupled with a platinum-sputtered FTO glass substrate (counter-electrode) with an electrolyte solution between the electrodes to assemble a sandwich-type DSSC. The electrolyte of the DSSC consisted of a solution of 0.6 mol·L−1 1-butyl-3-methylimidazolium iodide, 0.03 mol·L−1 I2, 0.1 mol·L−1 guanidinium thiocyanate, and 0.5 mol·L−1 tert-butylpyridine in a cosolvent of acetonitrile and valeronitrile at a volume ratio of 85:15, which was injected into the cell through capillary forces.

2.6. Characterization

X-ray diffraction (XRD) patterns of the resulting specimens were prepared by a XRD-6100 powder X-ray diffractometer (SHIMADZU, Kyoto, Japan) with Cu Kα radiation. Field-emission scanning electron microscopy (FESEM, HITACHI, Tokyo, Japan) and a transmission electron microscope (TEM, JEOL, Tokyo, Japan) were used to characterize the morphological and structural properties of the TiO2 nanocrystal specimens. The specific surface area of the specimens was determined through aBrunauer-Emmett-Teller (BET) analysis (Quantachrome Quadra Win Instruments, Ashland, VA, USA) using N2 as the adsorbate gas at −196 °C. All of the specimens were degassed at 120 °C for 3 h prior to nitrogen adsorption measurements. Photovoltaic DSSC performance and photocurrent–voltage characteristic curves were measured using a Hokuto-Denko BAS100B electrochemical analyzer (Hokuto, Yamanashi-ken, Osaka, Japan). The effective irradiation area of the DSSC was fixed at 0.25 cm2.

3. Results and Discussion

3.1. Preparation of the Metatitanic Acid Titanate Nanosheet Colloidal Solution

The XRD pattern of the layered Li2TiO3 sample obtained at 850 °C for 24 h in an air atmosphere is shown in Figure 1a. The diffraction peaks recorded at 2θ = 18.59°, 20.40°, 36.10°, 43.78°, 47.86°, 57.78°, 63.46°, and 66.90° can be attributed to the reflections of (002), (020), (−131), (−133), (−204), (006), (−206), and (062) crystal planes of layered Li2TiO3, which were almost in accordance with the characteristic diffraction peaks of the monoclinic Li2TiO3 crystal (C2/c space group, JCPDS No. 33-0831). The interlayer spacing was estimated to be 4.47 Å according to the (002) crystal plane of Li2TiO3, and the chemical formula (Li2.06TiO3.0) (on the basis of the chemical analyses) was close to the theoretical formula of Li2TiO3. The corresponding crystal structure of layered Li2TiO3 is shown in Figure 1d. The crystal structure of Li2TiO3 could be represented as a cubic close packing of three different layers (Li6 layers, O6 layers, and Li2Ti4 layers) in the c axis direction [37]. In the Li2Ti4 layer, 1/3 of the 4e sites were occupied by lithium atoms and 2/3 by titanium atoms, so the formula for a well-ordered Li2TiO3 could be written as Li(Li1/3Ti2/3)O2 [37,38,39]. That is, the atomic fraction of titanium in the Li6 layers and Li2Ti4 layers was 75% and 25%, respectively [38]. Lithium extraction in the layered Li2TiO3 precursor was performed using 1 mol·L−1 hydrochloric acid. According to the chemical analyses (H1.993Li0.007TiO3), the amount of lithium extracted was about 99.65%. Figure 1b depicts the XRD pattern of H2TiO3. The main peak corresponding to (002) of H2TiO3 slightly shifted to a higher 2θ angle compared to the peak in Figure 1a, indicating a decrease in the interlayer (from 4.77 to 4.72 Å) through an exchange of the lithium atoms (radius of ~0.076 nm) for hydrogen ions (radius of ~0.0012 nm) [33]. It can be seen that the XRD pattern in Figure 1b is similar to that in Figure 1a, which suggests that the structure did not change much after lithium extraction. The FESEM image of Li2TiO3 shows that the irregular particles with smooth surfaces were nonagglomerated, and the average size of the particles was in the range of 0.5–2.0 μm (Figure 2a). The particle shape of H2TiO3 (nonagglomerated) was similar to that of the Li2TiO3 precursor, except that the smooth surface of the H2TiO3 particles became rough and irregular cracks appeared on the surface (Figure 2b,c), implying that the extraction process hardly destroyed the structure of the precursor even if the Li+ ions in the Li2Ti4 intralayers were extracted. The XRD pattern of the TMA+-intercalated H2TiO3 sample (i.e., the dried TMA+-exfoliated H2TiO3 nanosheets) is shown in Figure 1c. Compared to the diffraction peaks of the H2TiO3, a set of new diffraction peaks was observed at ~5.30° (002), ~10.52° (004), and ~15.84° (006) in the TMA+-intercalated H2TiO3 sample. The basal diffraction peak of H2TiO3 significantly shifted to a lower 2θ angle (Figure 1b), indicating the expansion of the interlayer (from 4.72 to 16.66 Å) through the intercalation of (CH3)4N+. The gallery heights of [(CH3)4N]2TiO3, which were determined by subtracting the TiO32− layer thicknesses of 4.6 Å, were 12.06 Å (16.66–4.6 Å). Since the height of (CH3)4N+ and the diameter of a water molecule are ca. 5.3 and 2.8 Å [40,41], respectively, it was suspected that two molecules of water (2 × 2.8 Å) and a molecule of (CH3)4N+ (5.3 Å) were vertically arranged in the interlayer. Overall, the data in Figure 1c shows that [(CH3)4N]2TiO3 formed nanosheet stacks after drying [42].

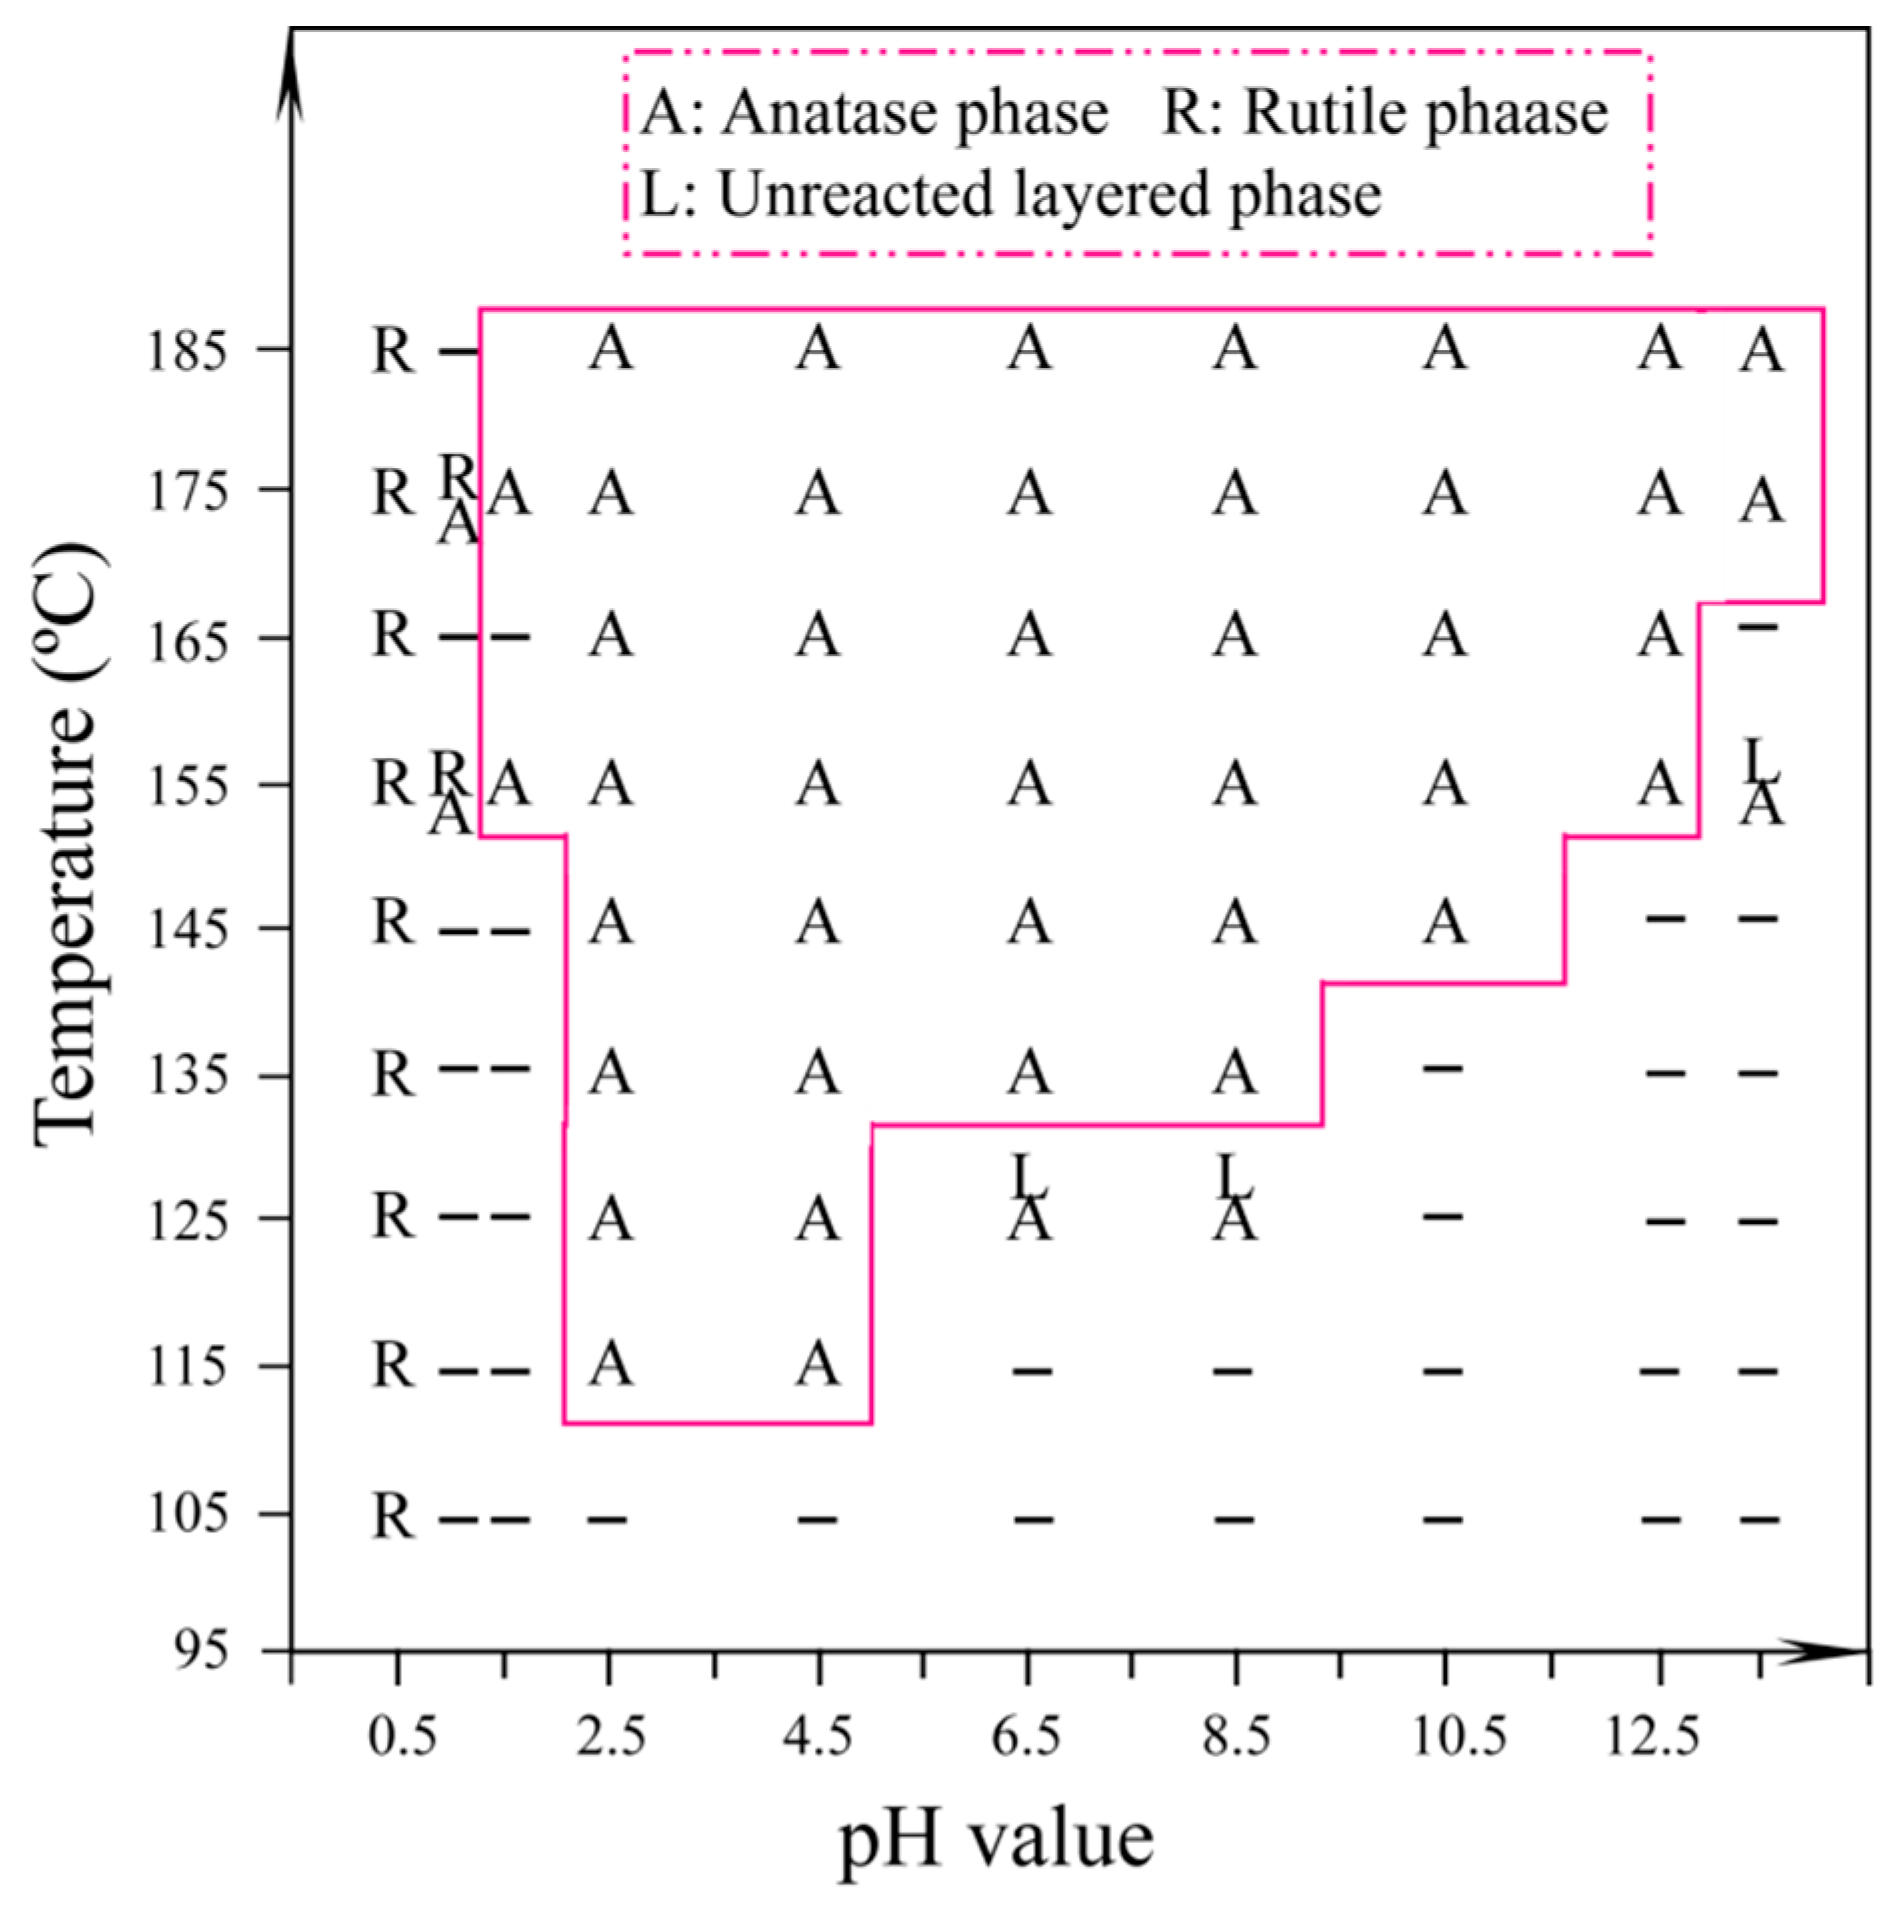
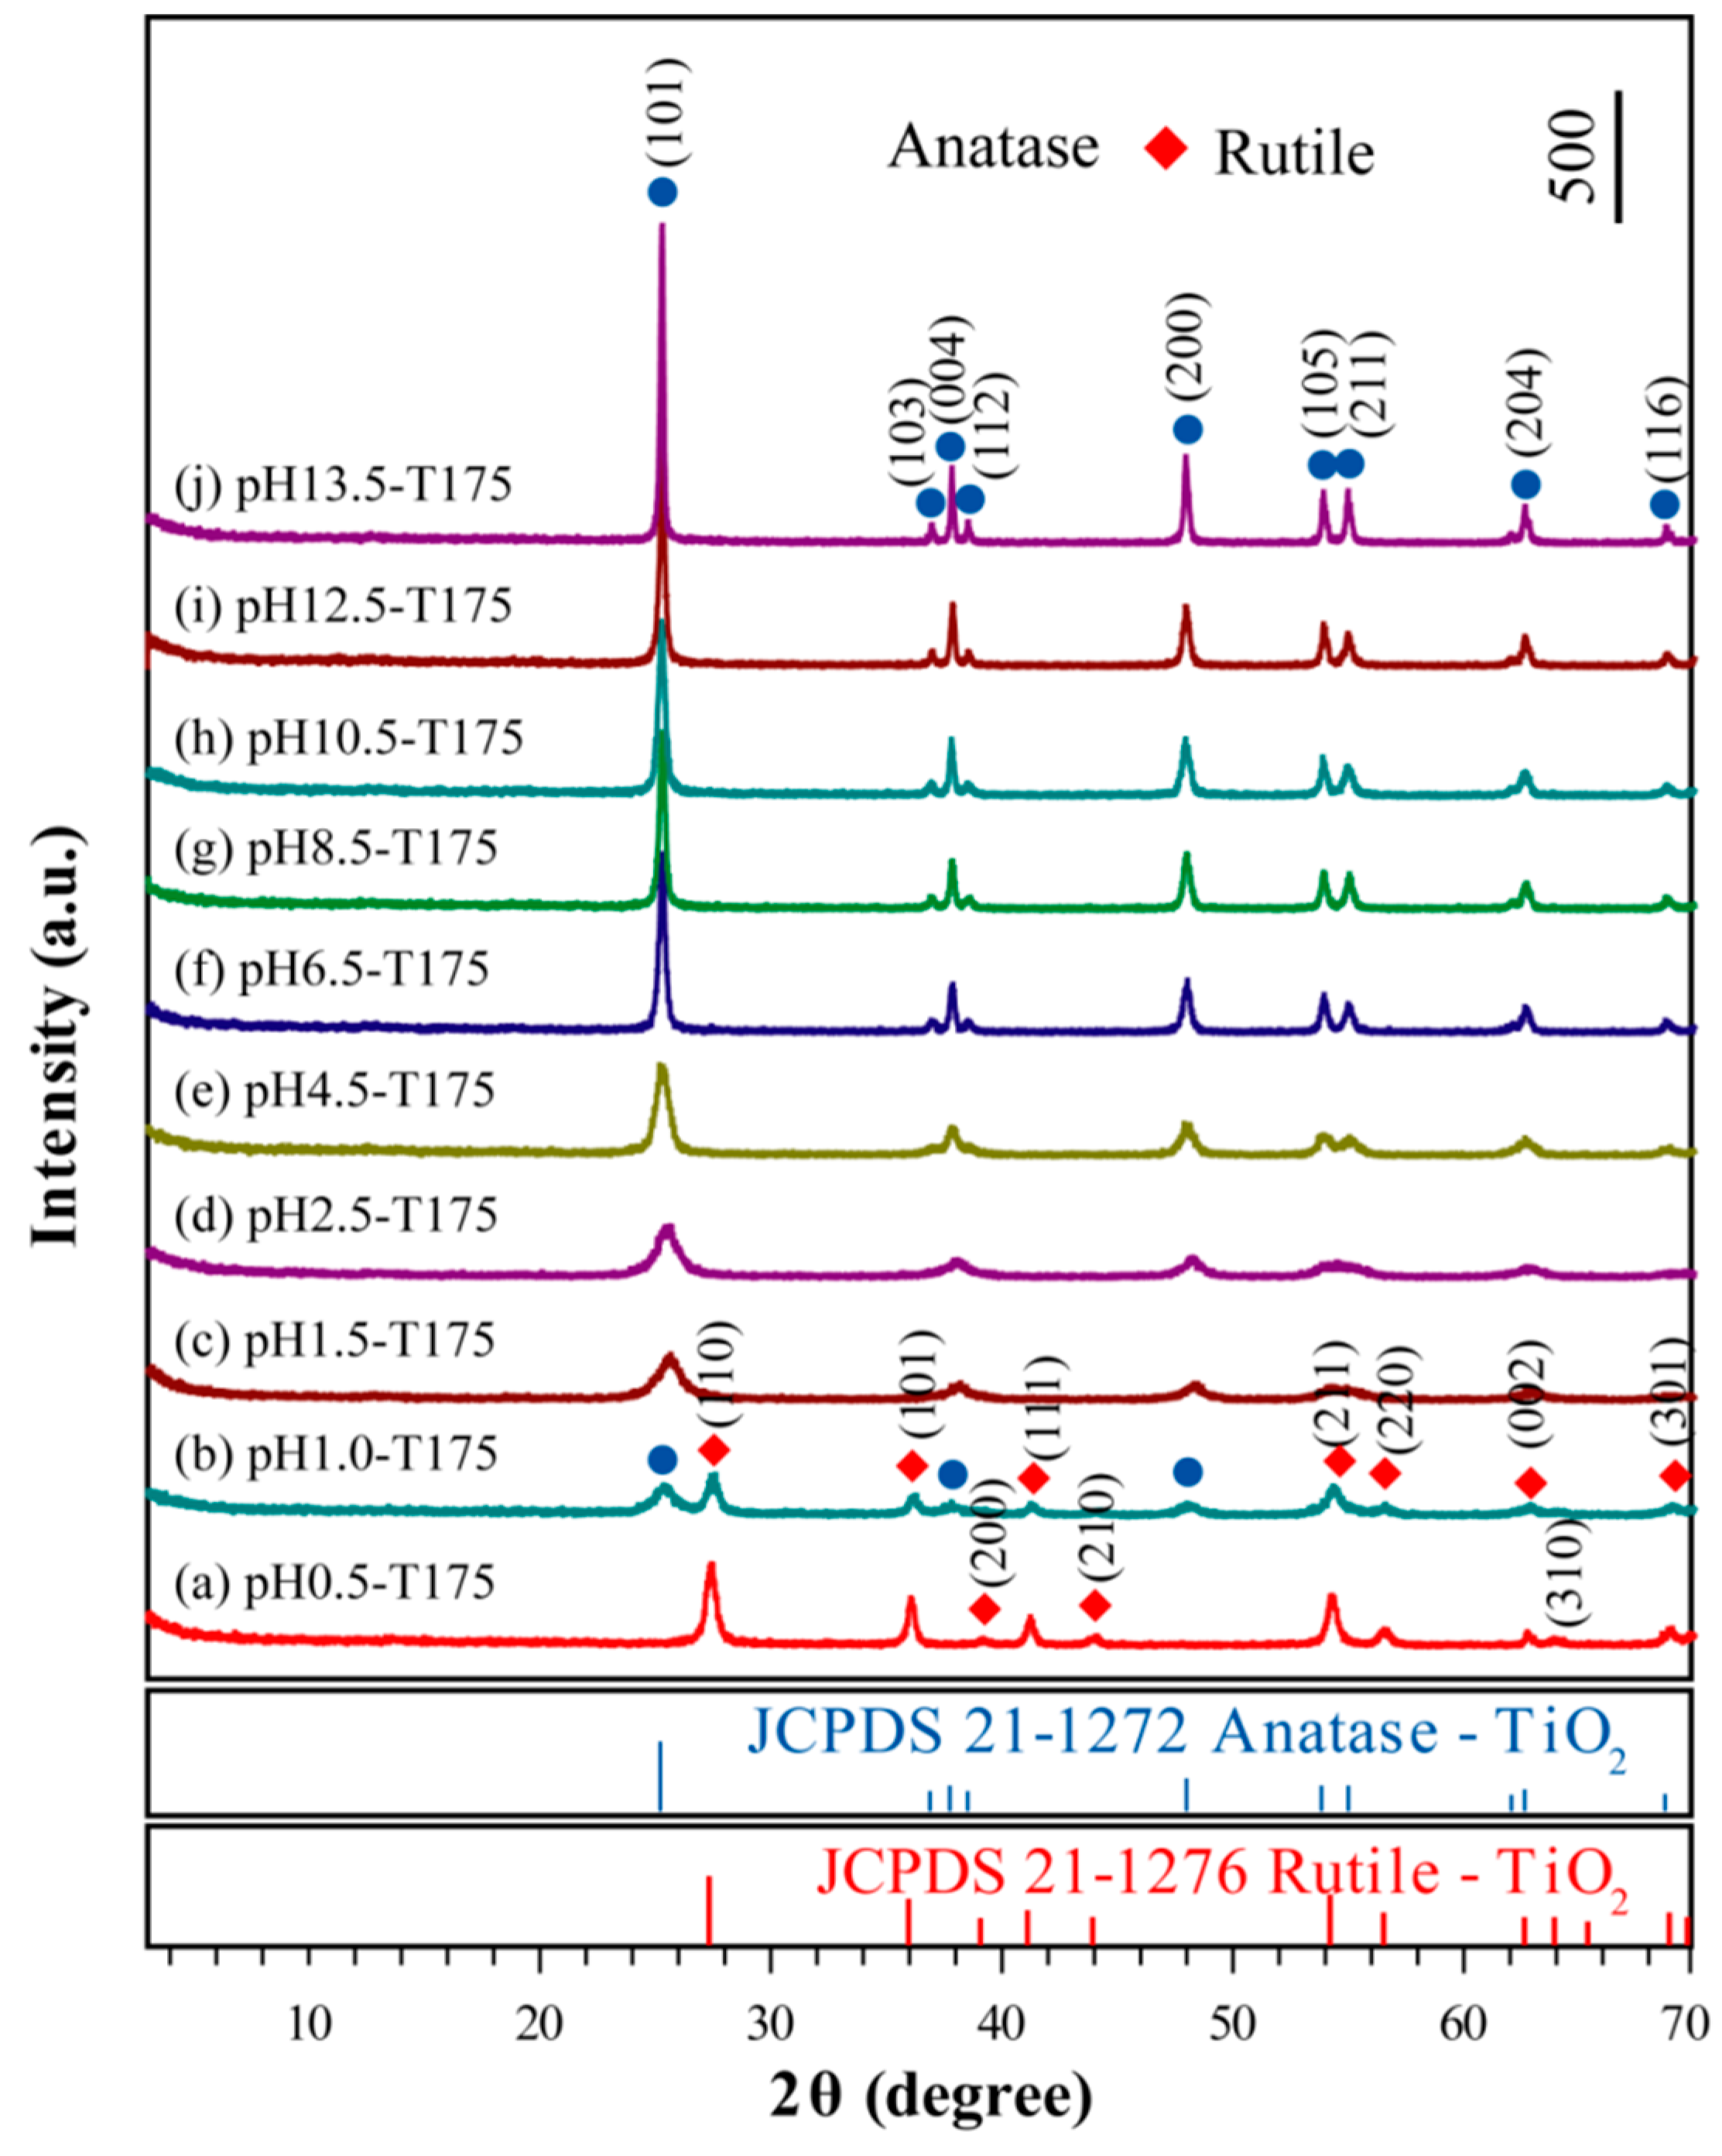
3.2. Synthesis of TiO2 Nanocrystals from Metatitanic Acid Nanosheet Colloidal Solution

TiO2 nanocrystals with different structures and morphologies were rapidly synthesized by microwave-assisted hydrothermal treatment of the prepared metatitanic acid nanosheet colloidal solution at various pH values (0.5–13.5) and temperatures (105–185 °C) for 2 h. The crystallographic structures of the TiO2 nanocrystals obtained at different pH values and various temperatures were identified by XRD analysis (see Supplementary Materials, Figures S1–S8). The dependence of the TiO2 nanocrystals on the microwave-assisted hydrothermal reaction conditions is summarized in Figure 3. It can be seen that the rutile phase was formed preferentially under strong acidic conditions (pH ≤ 0.5). The mixed-phases of rutile and anatase were formed by the microwave-assisted hydrothermal metatitanic acid nanosheet colloidal solution within a certain pH range (0.5 < pH ≤ 1.0). The rutile phase disappeared when the pH increased to 1.5, indicating that the rutile phase was stable under strong acidic conditions and that its stability was greater than anatase. A pure anatase phase could be obtained in a wide pH range of 1.5 ≤ pH ≤ 13.5 at a certain temperature, and its crystallinity increased with increasing temperature and pH values (see Supplementary Materials, Figures S2–S8). The unreacted layered compound was observed at pH ≥6.5 and at low temperatures (see Supplementary Materials, Figures S2, S5, and S8) and was formed through the restacking of the exfoliated metatitanic acid nanosheets, implying that higher pH values and lower temperatures are not conductive to a transformation from nanosheets to anatase nanocrystals.
Figure 4 shows the XRD patterns of the typical samples at different pH values varying from 0.5 to 13.5. Apparently, for the pH0.5-T175 sample, the diffraction peaks (2θ values) of 27.42°, 36.06°, 38.29°, 41.24°, 44.12°, 54.30°, 56.56°, 62.82°, 64.00°, and 69.04°, could be assigned to (110), (101), (200), (111), (210), (211), (220), (002), (310), and (301) crystalline surfaces of the rutile TiO2 phase, respectively (JCPDS No. 21-1276, Figure 4a). With an increasing pH value in the suspension liquid, the pH1.0-T175 sample exhibited an anatase/rutile coexisting diffraction pattern, as shown in Figure 4b. The peaks at 2θ values of 27.40°, 36.04°, 41.28°, 54.34°, 56.70°, 62.88°, and 69.05° could be ascribed to (110), (101), (111), (211), (220), (002), and (301) crystalline surfaces of the rutile phase, respectively (JCPDS No. 21-1276), while other diffraction peaks at 25.46°, 37.82°, and 48.02° arose from the (101), (004), and (200) crystalline surfaces of the anatase TiO2 phase, respectively (JCPDS No. 21-1272). The mass fraction of anatase and the rutile contents present in the sample could be accurately obtained from the following equations [43]:
W A = 1 1 + 1.26 [ I R ( 110 ) / I A ( 101 ) ]
W R = 1 1 + 0.8 [ I A ( 101 ) / I R ( 110 ) ]
where WA and WR represent the mass fraction of anatase and rutile in the mixed phase, respectively, and IA(101) and IR(110) represent the diffraction peak integral intensity of the anatase TiO2 (101) crystal surface and the rutile TiO2(110) crystal surface, respectively. As shown in Figure 4b, the diffraction peak integral intensity of the anatase TiO2 (101) crystal surface and rutile TiO2 (110) crystal surface was 60.7% and 100.0% in the mixed phase, respectively. Therefore, the mass fraction was 32.51% for anatase TiO2 and 67.31% for rutile TiO2. With the pH values further increasing to 1.5, the rutile phase decreased to almost null, which means that the H2TiO3 nanosheets were completely transformed to anatase nanocrystals and that the entire structure became anatase (Figure 4c–j), i.e, the higher pH inhibited the growth of rutile TiO2 and promoted the growth of anatase TiO2 during the microwave-assisted hydrothermal reaction process. The various diffraction peaks observed at ~25.66° (101), ~38.22° (004), ~48.32° (200), ~54.10° (105), ~54.50° (211), ~62.86° (204), and ~68.67° (116) were the characteristic peaks of anatase TiO2 (JCPDS No. 21-1272). It could be found that the broadening diffraction peaks became sharper with increasing pH values, demonstrating that the grain size of the anatase matrix increased with increasing pH values. The increase in grain size was attributed to the Ostwald ripening phenomena during the particle growth process [43].

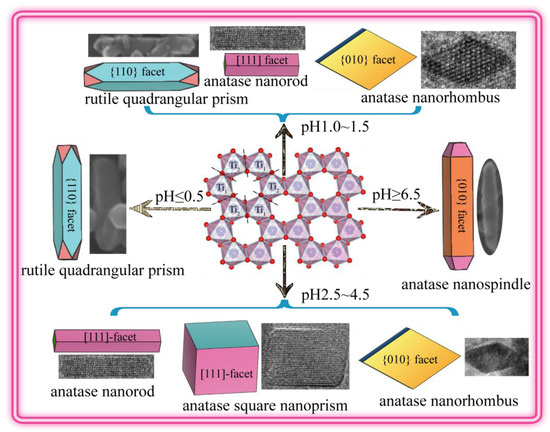
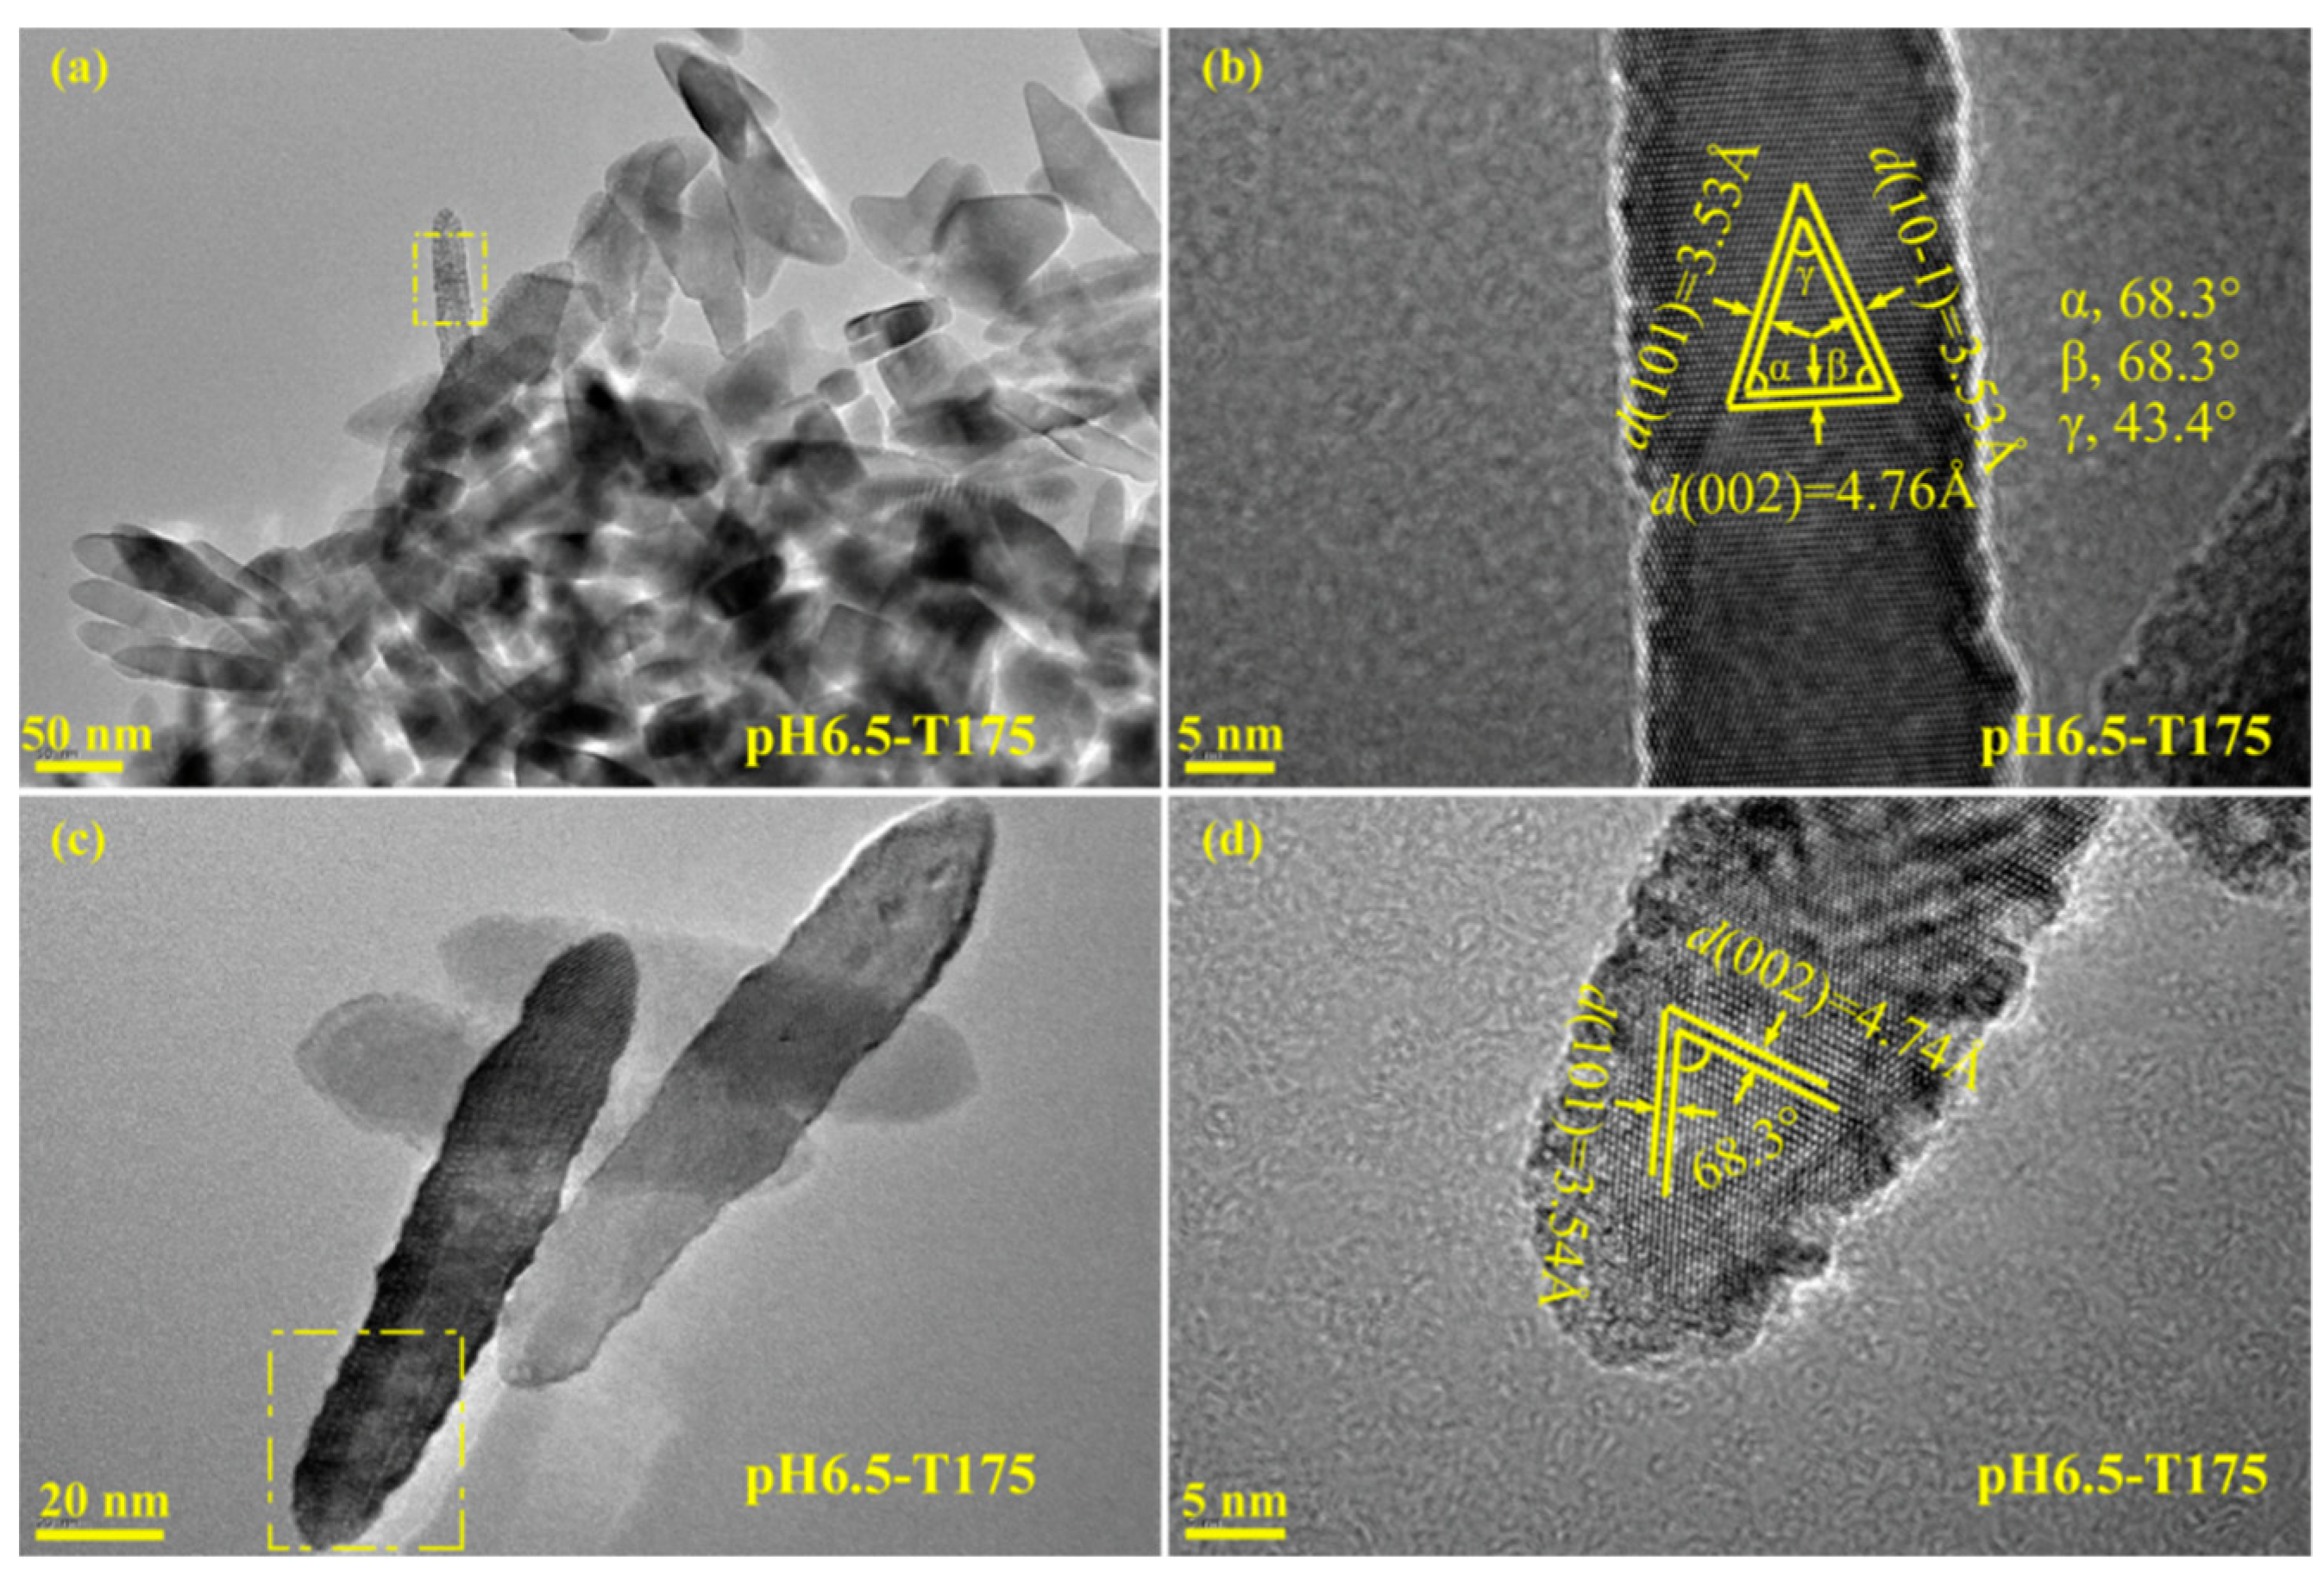
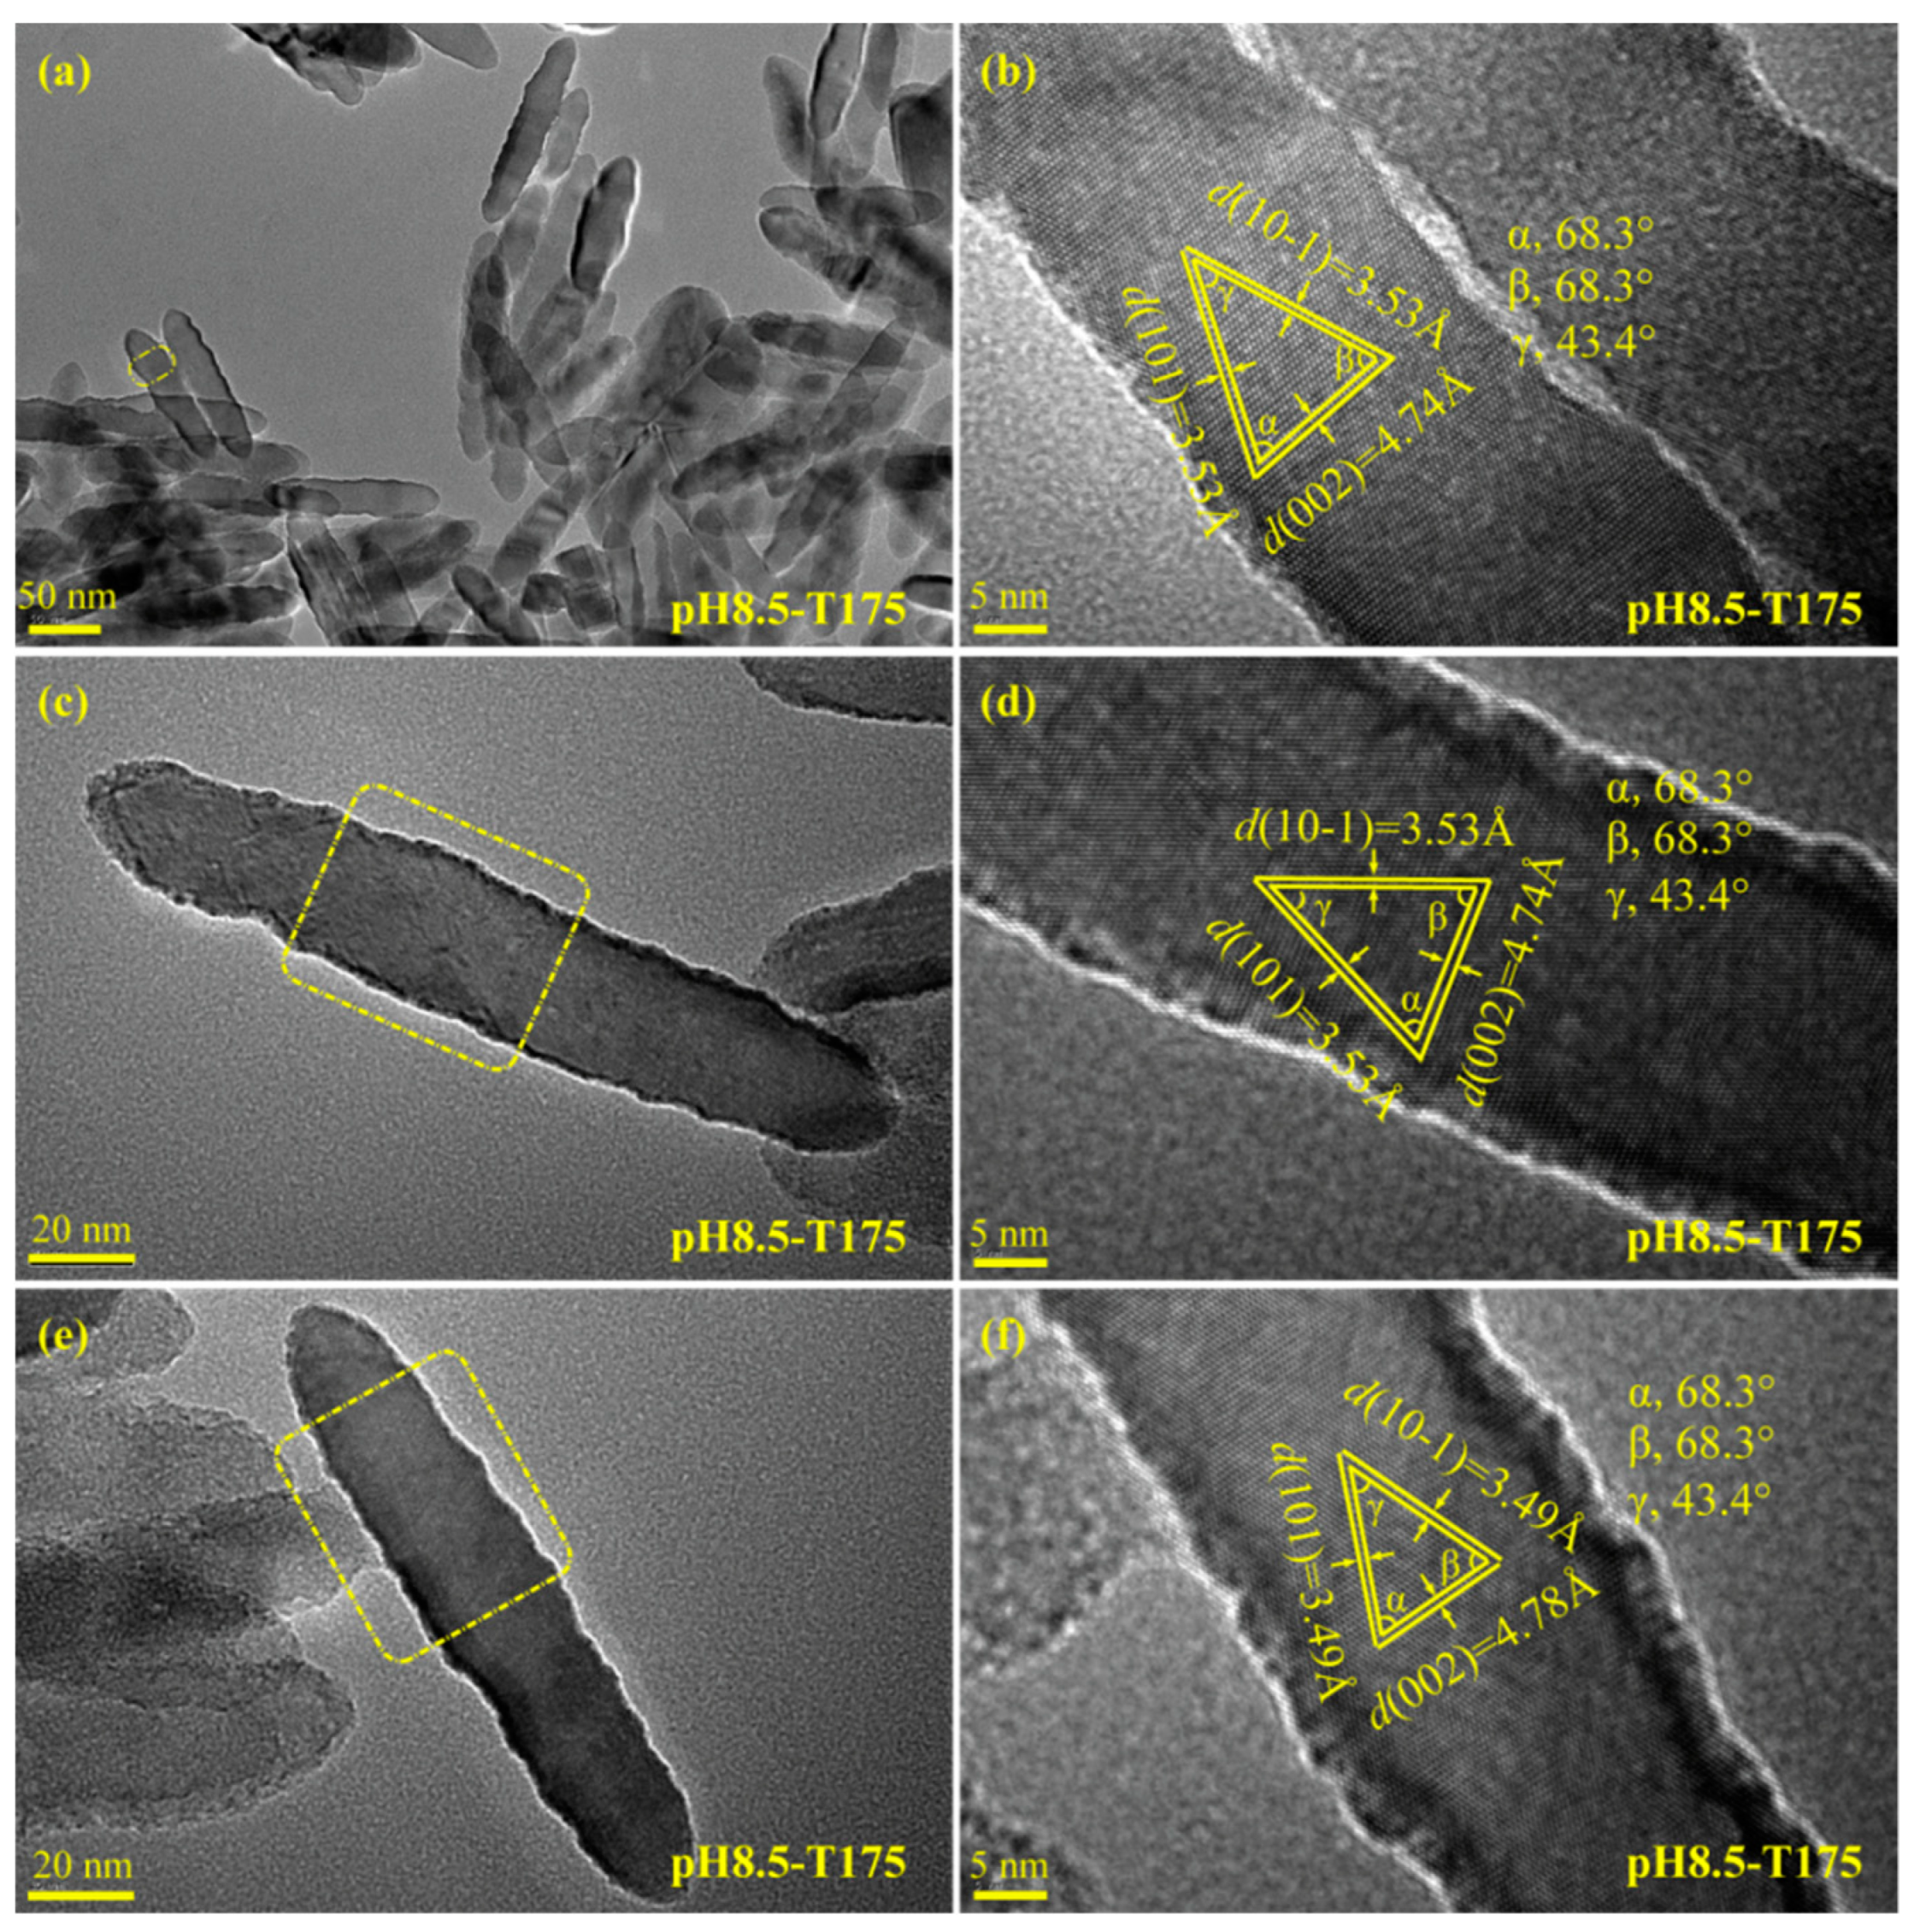
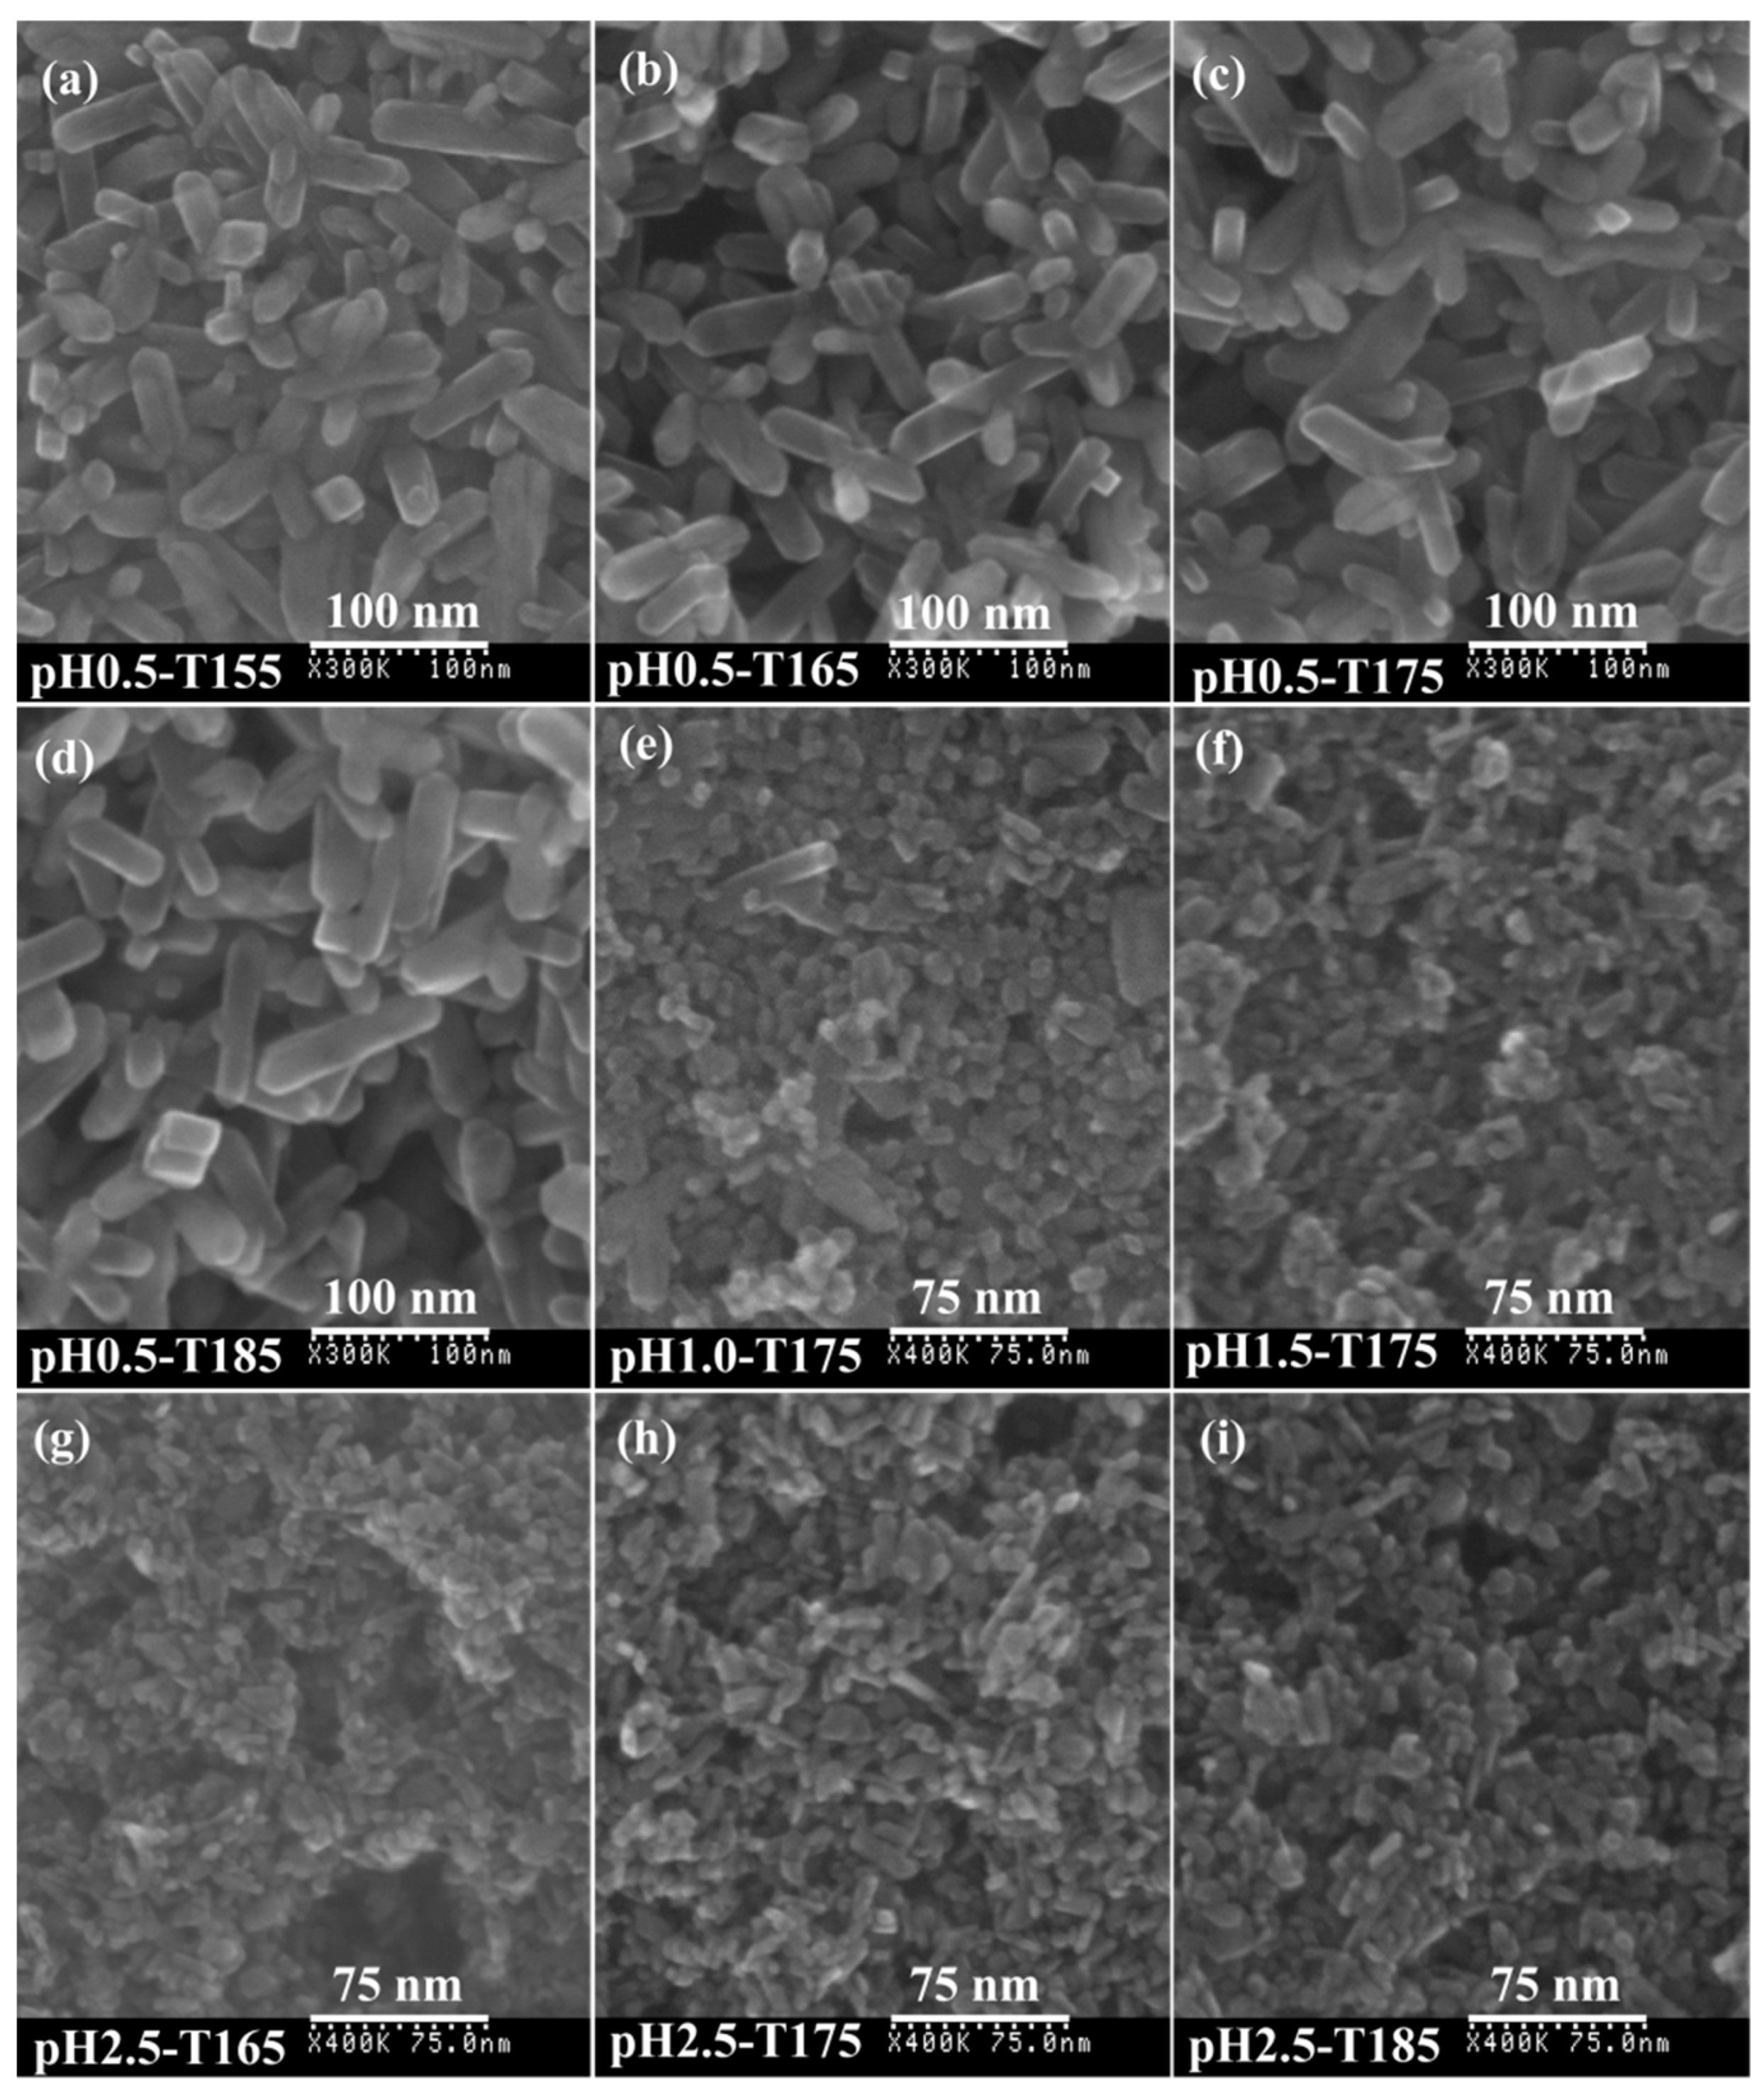
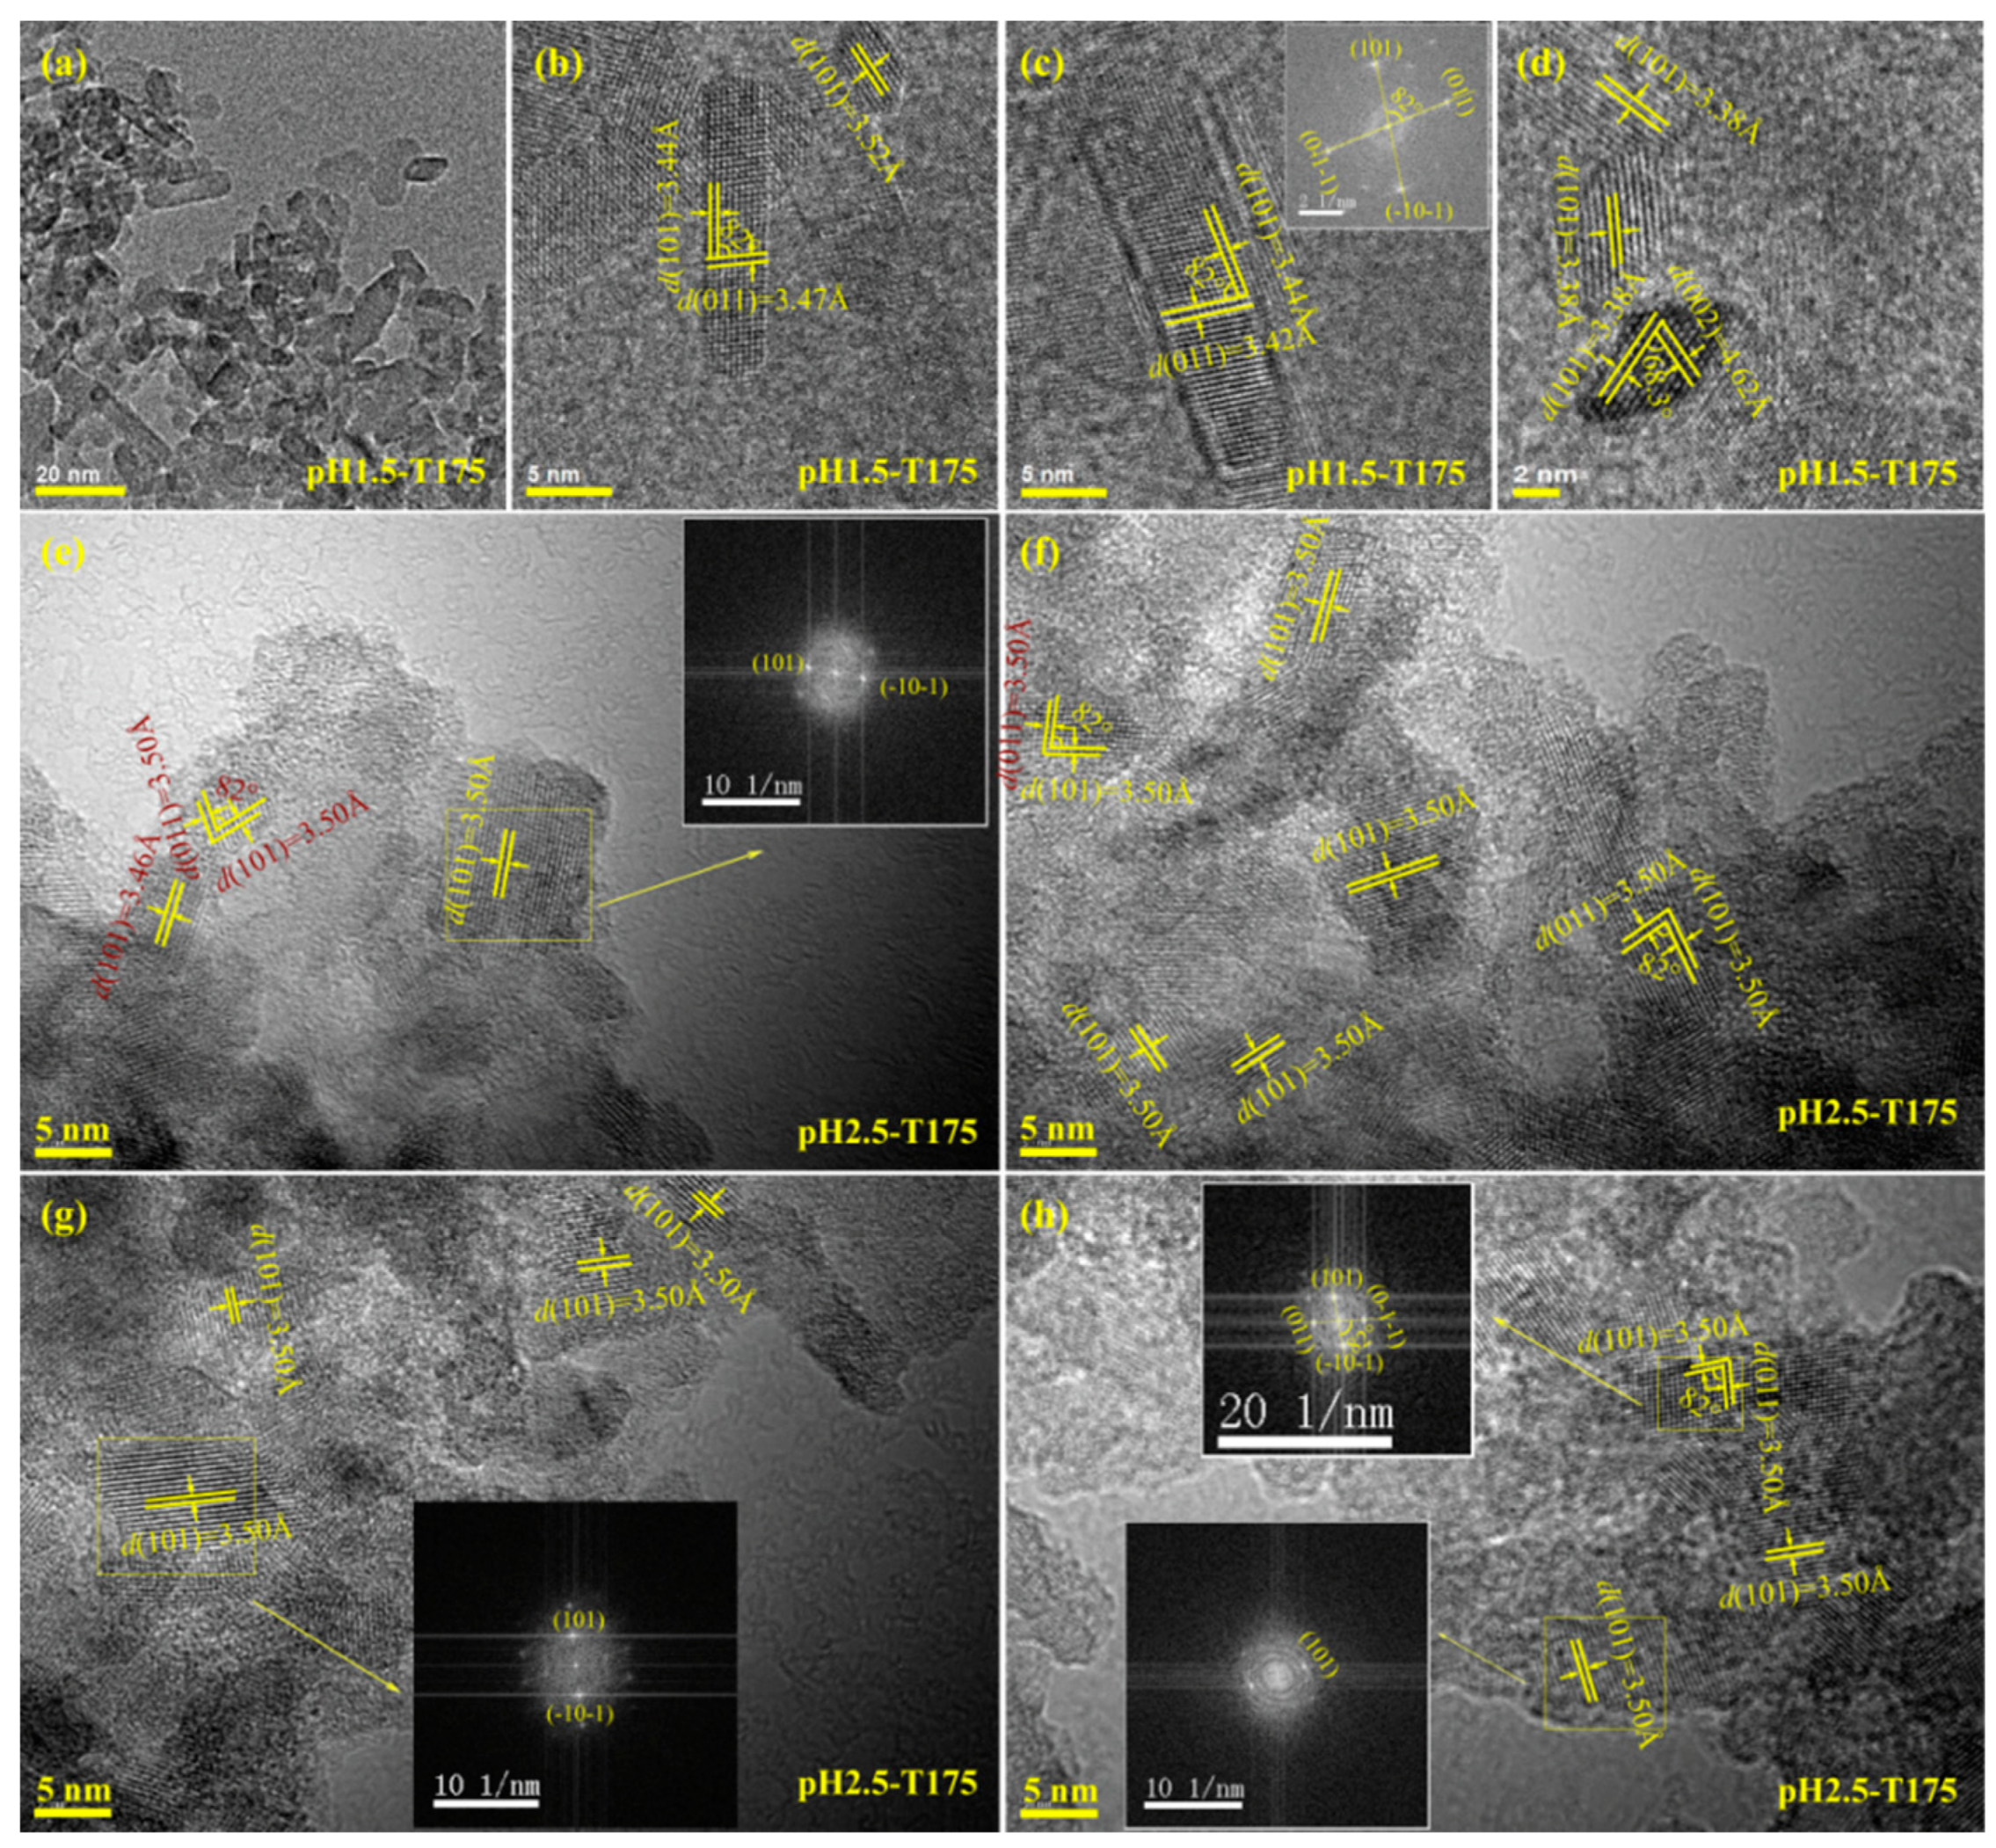
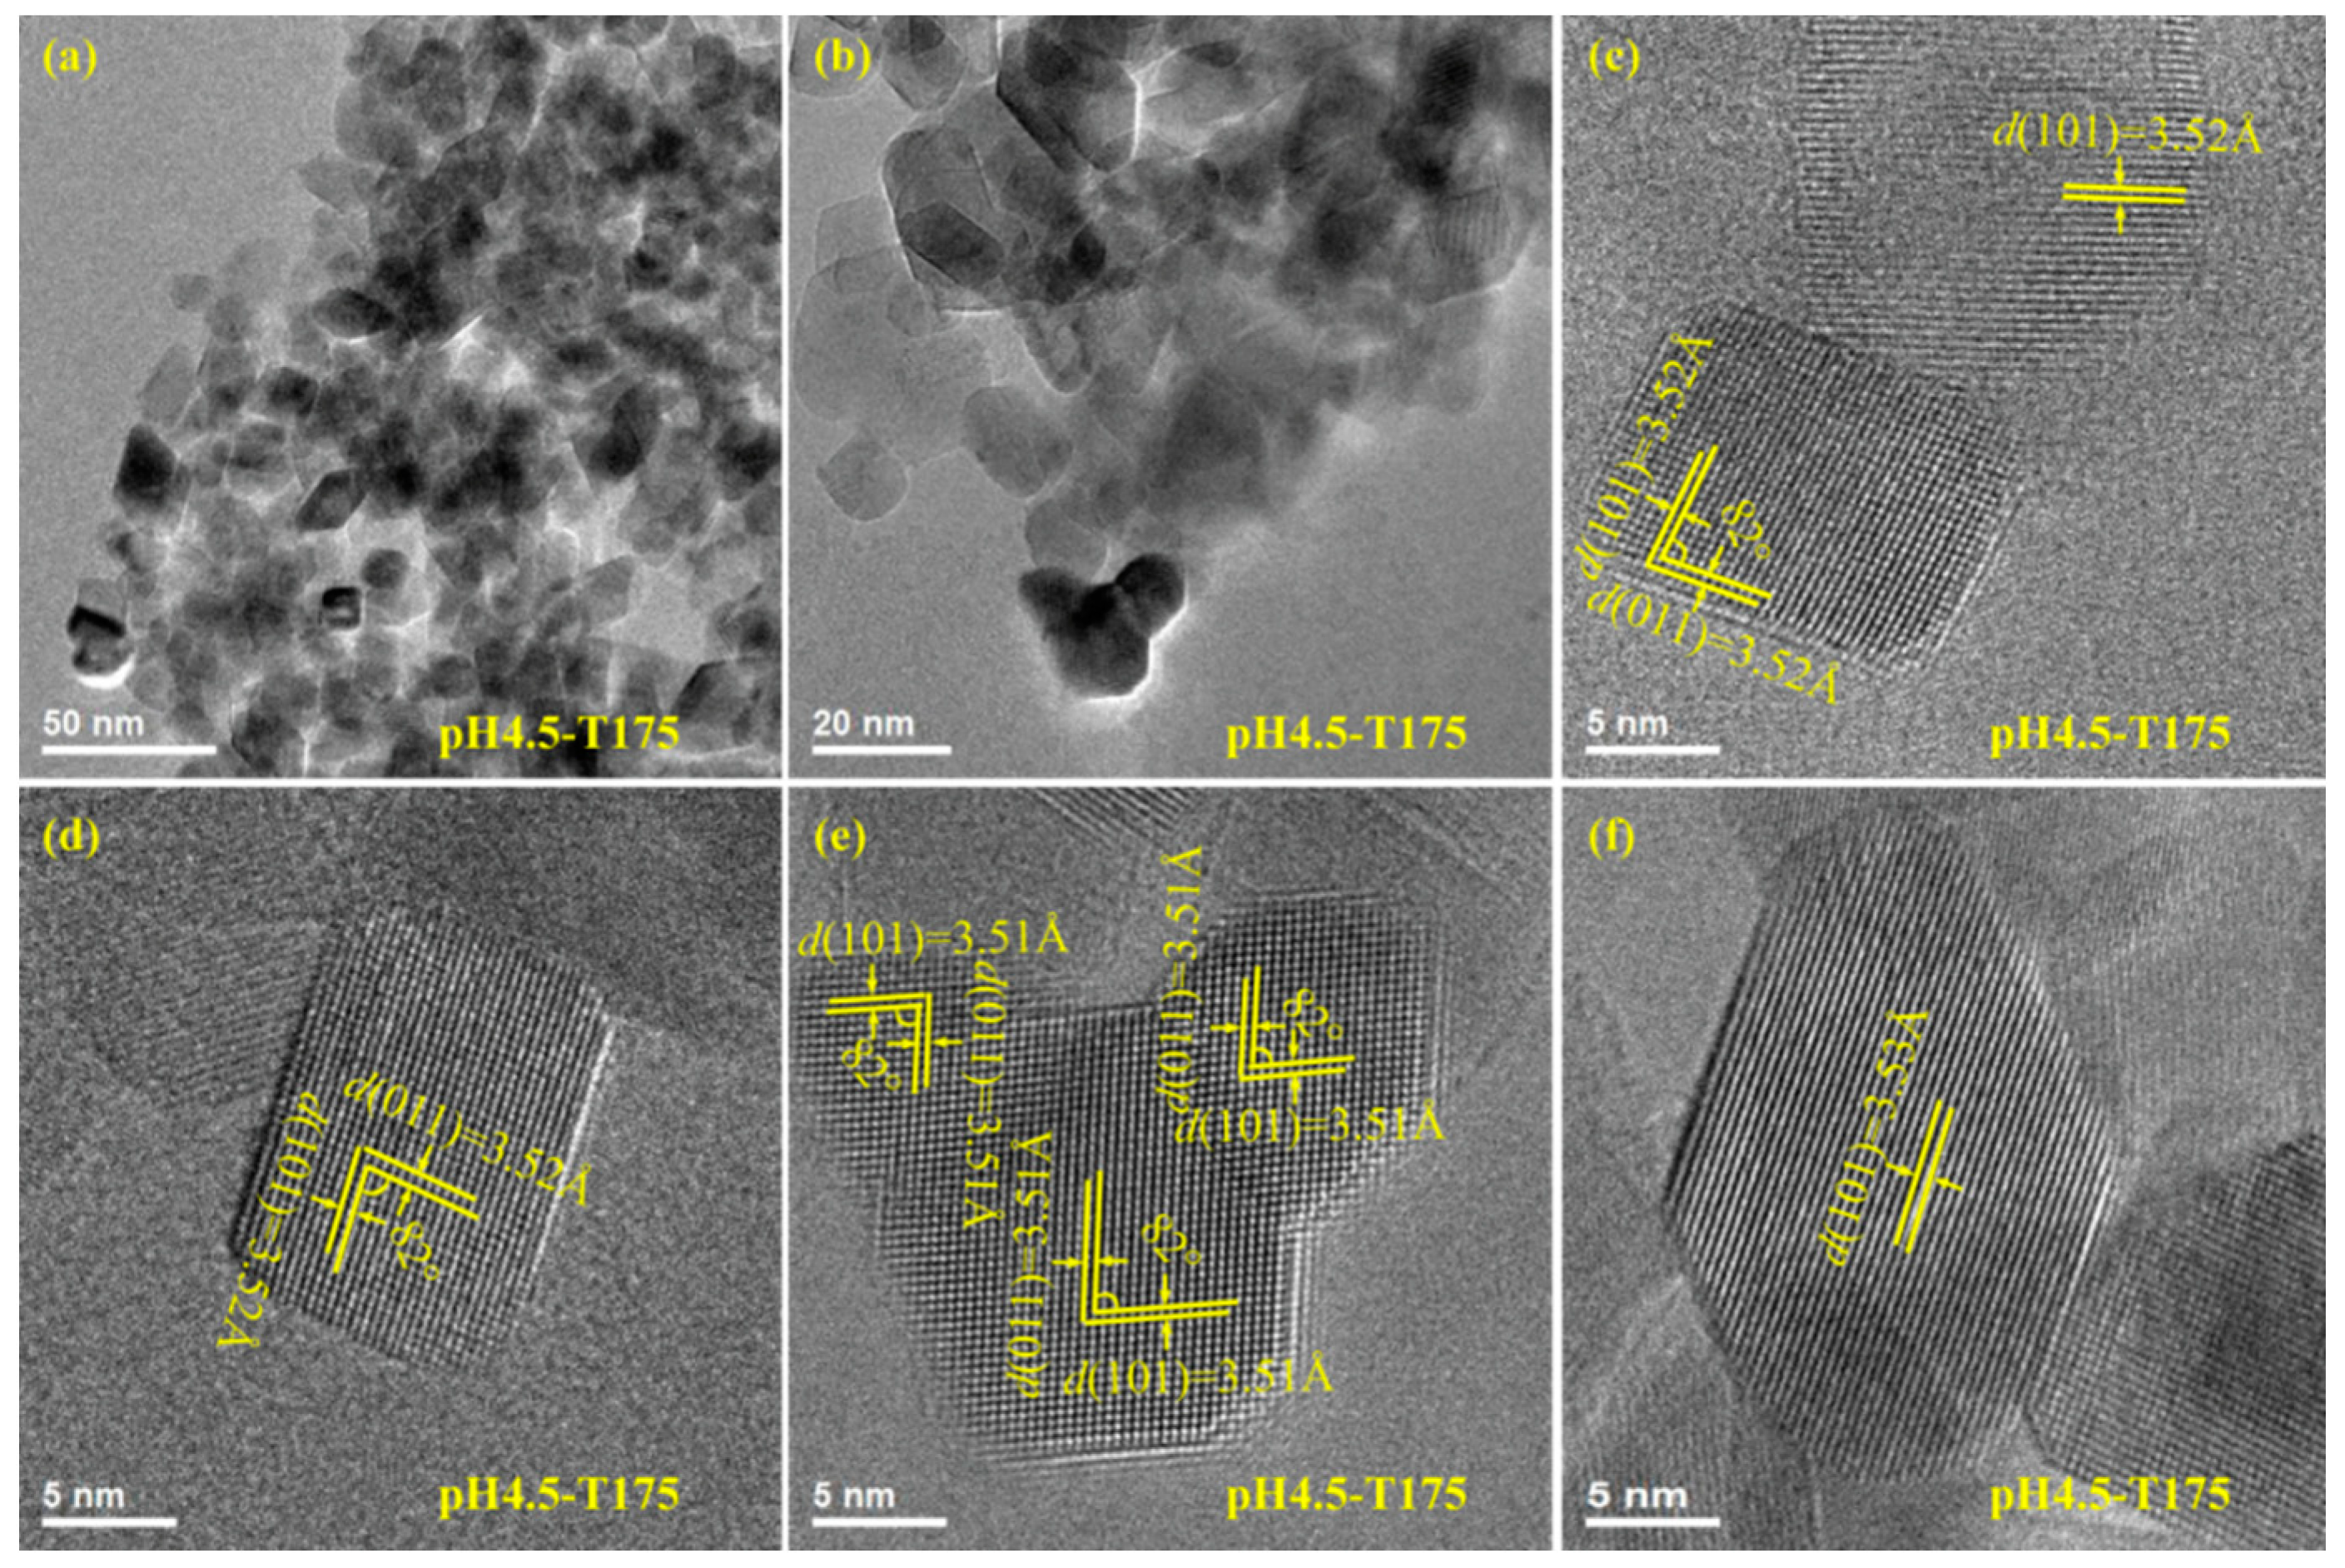
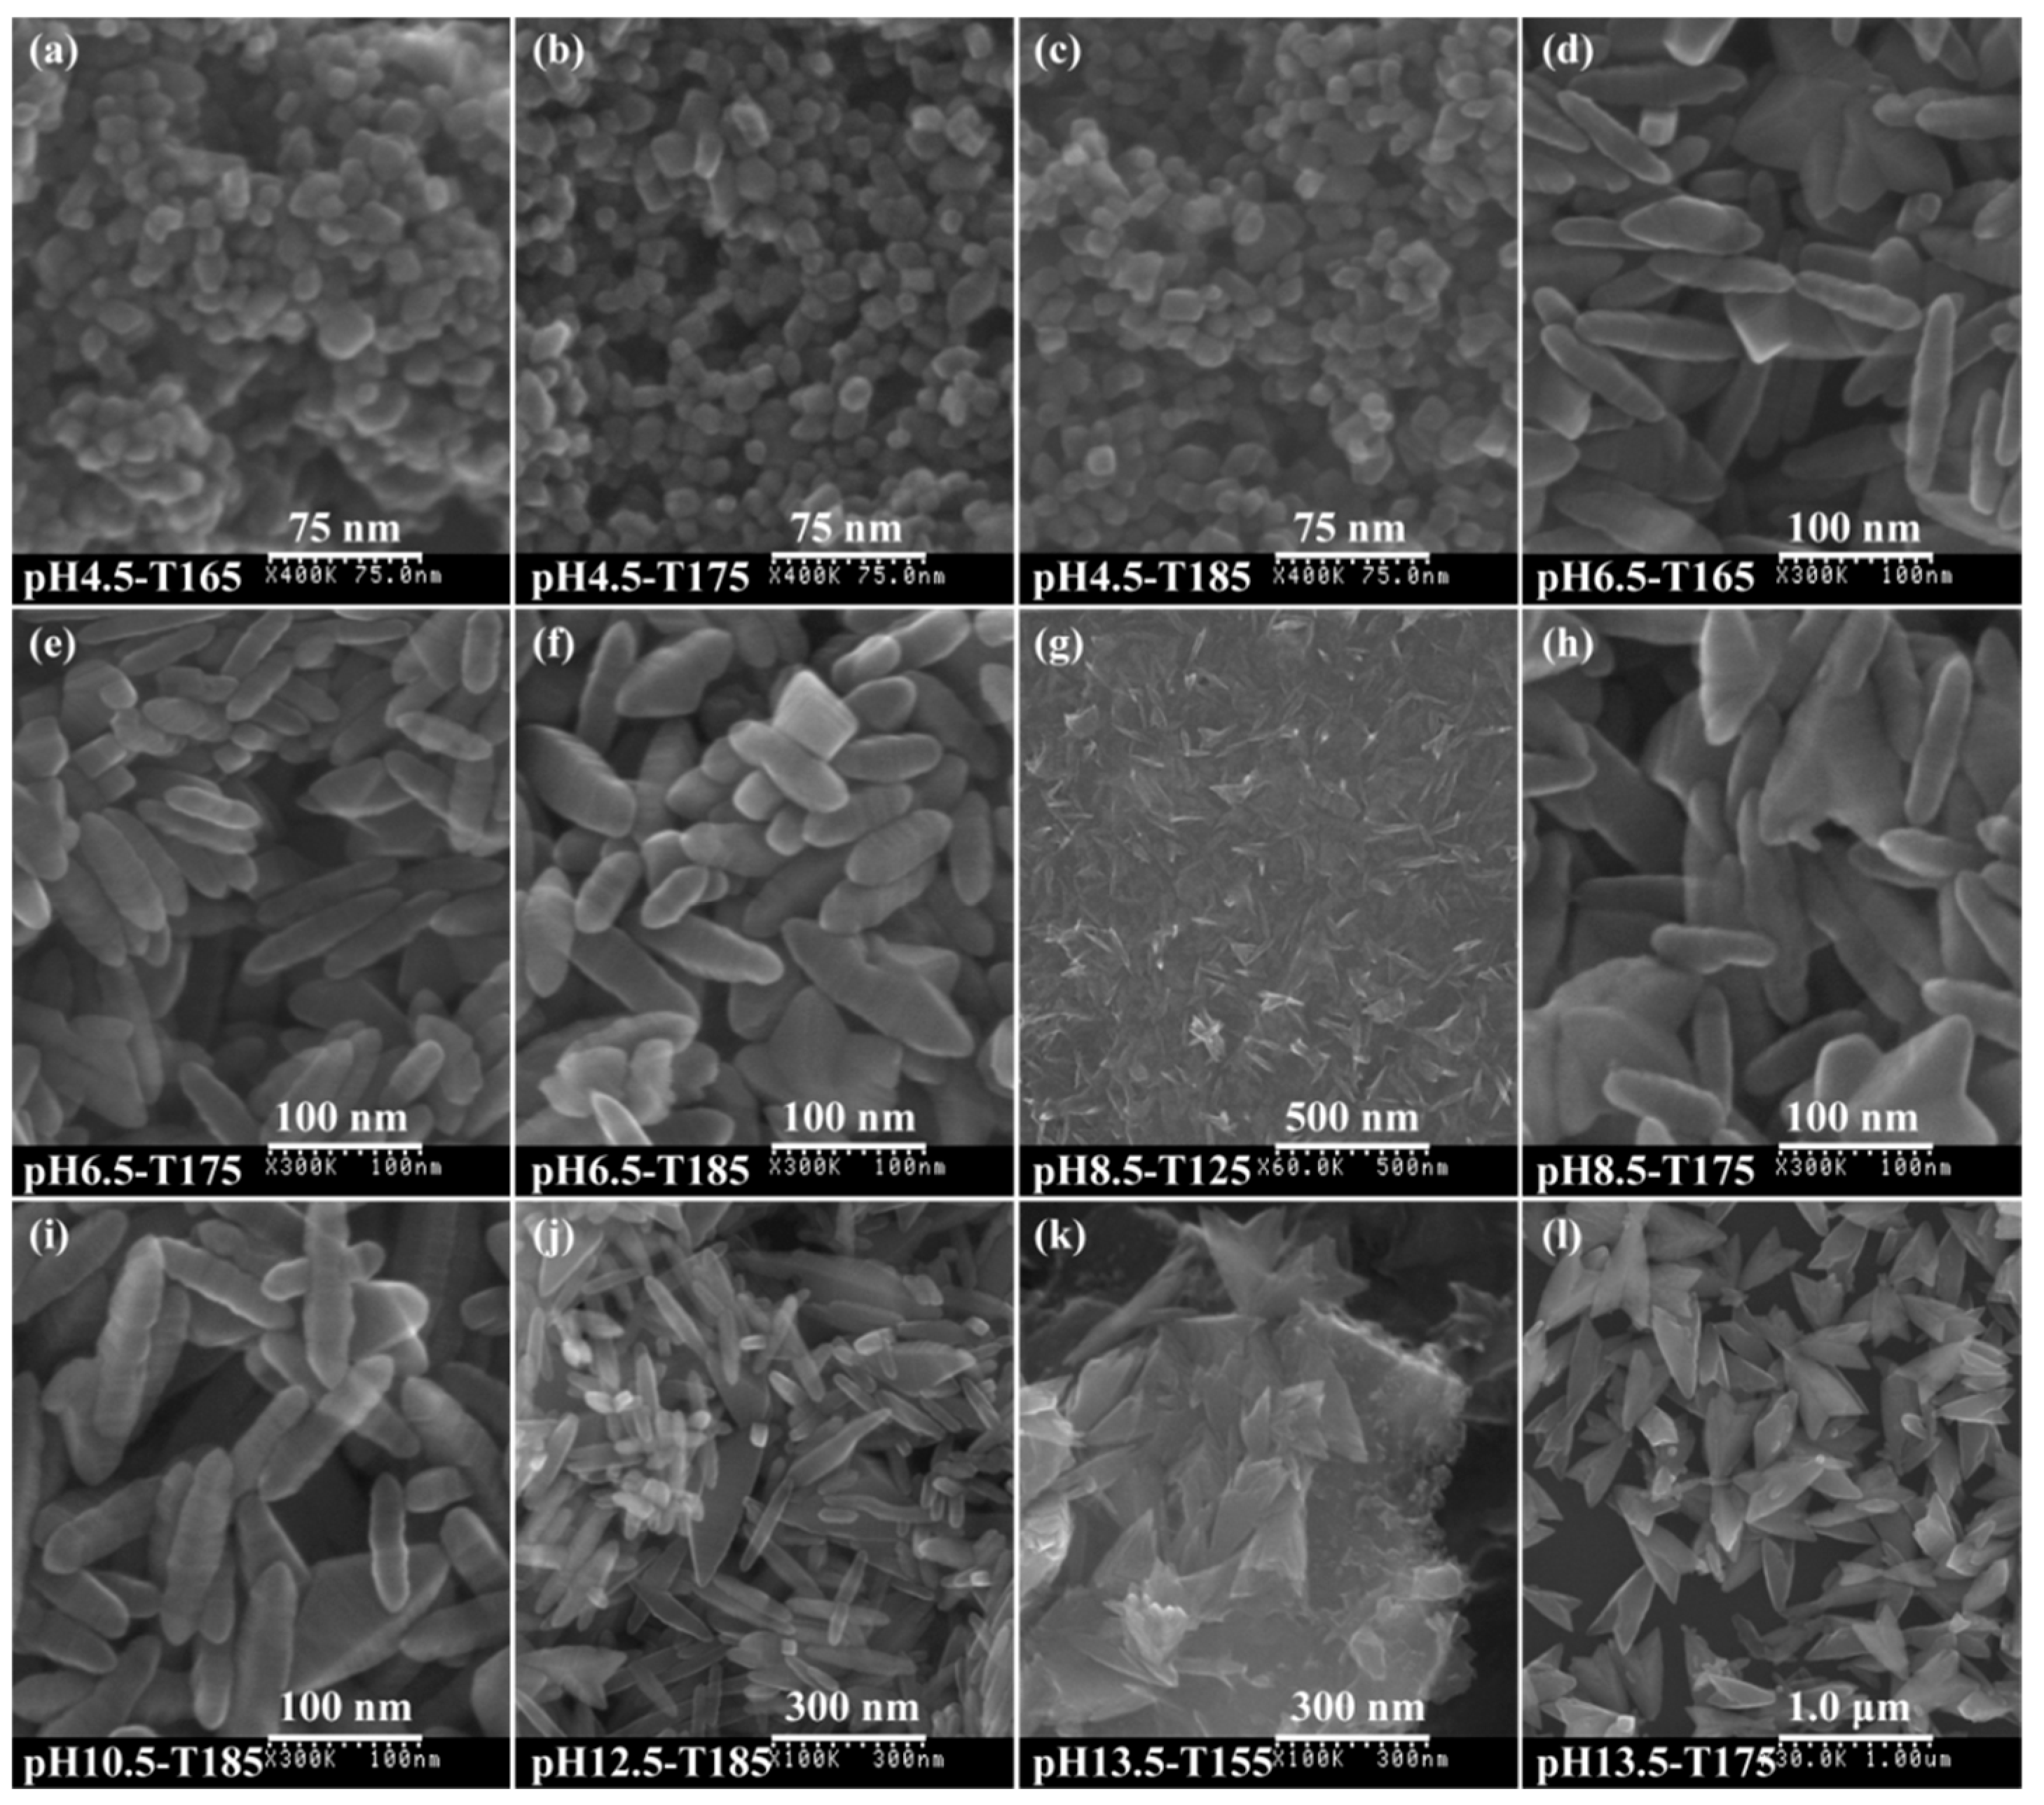
3.3. Morphology and Exposed Crystal Facets of TiO2 Nanocrystals

Figure 5a depicts a TEM image of the pH1.5-T175 nanocrystals derived from microwave-assisted hydrothermal treatment of the exfoliated H2TiO3 nanosheet colloidal solution at 175 °C with a reaction time of 2 h. As shown, a large number of rod-shaped nanocrystals with a size of about 10–30 nm and a small number of rhombic nanocrystals with a size of ~10 nm were observed. The corresponding high-resolution TEM (HRTEM) images (Figure 5b,c) showed unparallel (101) and (011) atomic planes of the rod-shaped nanocrystals with a lattice spacing of 3.44 and 3.47 Å (or 3.42 Å), respectively, and an interfacial angle of 82°, which matches well with the theoretical value for the angle between the {101} and {011} facets of anatase TiO2 nanocrystals [14]. Therefore, the dominant exposed crystal plane of the pH1.5-T175 nanocrystals was perpendicular to the above {101} and {011} crystal facets, i.e., the crystal plane was vertical to the [111] crystal zone axis. Since the crystal plane perpendicular to the {101} and {011} crystal facets was uncertain, for convenience, we express it as an [111] facet. The exposed rod-shaped nanocrystal [111] crystal facet could be further confirmed through a fast-Fourier-transform (FFT) diffraction pattern (Figure 5c inset). It should be noted that the [111] facet was different from the {111} facet, because anatase belongs to a tetragonal system, not a cubic system. In a cubic crystal system, the crystal plane perpendicular to [111] the crystal zone axis is the {111} facet. According to the above analysis, the rod-shaped nanocrystals co-exposed in the crystal planes were [111] facets and {101} facets, i.e., {101}/[111] facets. Figure 5d shows the unparallel (101) and (002) planes of the rhombic nanocrystals with a lattice spacing of 3.38 and 4.62 Å, respectively. Moreover, the interfacial angle of ca. 68.3° between the aforementioned atomic planes also matches well with the theoretical value of anatase TiO2 nanocrystals [15,44]. Therefore, the above rhombic nanocrystal was confirmed to be anatase TiO2 with dominant {010} facets on the two basal surfaces and {101} facets on the four lateral surfaces. Figure 5e–h presents HRTEM images of pH2.5-T175. As shown, nanocrystals with short rod-shaped, square-prism-shaped, and some irregular morphology were observed. Along the [111] zone axis, the HRTEM image in Figure 5e,f,h displays (101) and (011) crystal facets of the rod-shaped (or square-prism-shaped) nanocrystal with an interfacial angle of 82°, which is in good agreement with the theoretic value. Therefore, the above rod-shaped and square-prism-shaped anatase TiO2 nanocrystals co-exposed {101}/[111] facets. Furthermore, lattice fringes with a spacing of 3.50 Å could be assigned to the {101} facets of the irregularly shaped anatase nanoparticles. The FFT diffraction pattern of the yellow dashed lines region (Figure 5e,g,h inset) further indicated that the rod-shaped, square-prism-shaped, and irregular TiO2 nanocrystals were single-crystalline.
As shown in Figure 6a,b, the synthesized pH4.5-T175 nanocrystals (anatase phase) mainly had two morphologies, a square prism and a rhombus. Moreover, a small number of anatase nanocrystals with irregular morphologies were also observed in the above sample. Figure 6c,d shows an HRTEM image of typical square-prism-shaped anatase TiO2 nanocrystals. The lattice fringes of 3.52 and 3.52 Å corresponded to {101} and {011} lattice spacing, respectively, and the angle of 82° measured between the {101} and {011} facets matched closely with the theoretical value, corroborating that the exposed crystal facets were [111] facets and {101} facets (or {011} facets) on the two basal surfaces and the four lateral surfaces of the square-prism-shaped anatase TiO2 nanocrystals, respectively. According to the above discussion, the irregular anatase TiO2 nanocrystals in Figure 6e co-exposing the crystal facets were also {101}/[111] facets. The lattice fringes with spacing of 3.51 Å could be assigned to the {101} facet of the approximately rhombic anatase TiO2 nanocrystal (Figure 6f), which was parallel to the lateral surface, indicating that the lateral surface had exposed {101} facets.
Figure 7a,c shows a TEM image of the product obtained at pH = 6.5 and t = 175 °C with a reaction time of 2 h. As shown, a large number of well-defined spindle-shaped nanocrystals 70–130 nm in length and 15–30 nm widewere observed. In addition, some square-prism-shaped nanocrystals 20–50 nm in length and 20–30 nm wide were also observed. Figure 7b,d includes corresponding HRTEM images taken from the marked area of the TEM images in Figure 7a,c, respectively. As shownin Figure 7b, the spindle-shaped nanocrystal displayed the (101), (10−1), and (002) atomic planes with lattice spacings of 3.53, 3.53 and 4.76 Å, and the angles α, β, γ between the (101) and (002), (10−1) and (002), and (101) and (10−1) facets were 68.3°, 68.3°, and 43.4°, respectively, the same as the theoretical values [45]. These facts prove that the spindle-shaped anatase nanocrystal exhibited four flat facets {010} facets on the four vertical surfaces, eight inclined {101} facets on the slant surfaces, and two parallel {001} facets on the top and bottom surfaces. Along the [010] zone axis, the HRTEM image in Figure 7d also displays (101) and (002) crystal facets with an interfacial angle of 68.3°, indicating a spindle-shaped anatase nanocrystal with exposed {010} facets on the four vertical surfaces.
The well-defined nanospindle structure (with a particle size of about 70–140 × 17–35 nm2) of the pH8.5-T175 sample was further confirmed by the TEM image, as shown in Figure 8a. Two magnified TEM images of the uniform anatase nanospindles are presented in Figure 8c,e. Figure 8b,d,f shows HRTEM images marked from the yellow dotted frame area indicated in Figure 8a,c,e, respectively. There were three types of lattice with fringe spacing of 3.53, 4.74, and 3.53 Å (or 3.49, 4.78, and 3.49 Å) and interfacial angles of 68.3°, 68.3°, and 43.4°, which agreed well with the (101), (002), and (10−1) lattice planes of anatase TiO2. The {001} facets were perpendicular to the long axis (c axis) direction and parallel to the transverse axis (b axis) direction of the spindle-shaped nanocrystal, respectively, indicating the oriented growth of spindle-shaped nanocrystals in the [001] crystallographic direction. Therefore, the exposed lattice facets of the nanospindles were mainly {010} facets (based on the HRTEM analysis).
Figure 9 displays typical FESEM images of the samples derived from microwave-assisted hydrothermal treatment of the exfoliated H2TiO3 nanosheet colloidal solution at various pH values (0.5–2.5) and temperatures (155–185 °C). The pH0.5-Tx (x = 155, 165, 175, or 185) sample exhibited quadrangular prism morphology with a length of 50–100 nm and a width (or thickness) of 15–30 nm, which corresponded with the rutile TiO2 phase and the elongation direction of the nanocrystals along the [001] crystallographic direction (Figure 9a–d) [46]. The average size of the quadrangular prism nanocrystals did not change obviously with an increase in the temperature, indicating that an increase in temperature mainly increased the crystallinity of the nanocrystals during the microwave-assisted hydrothermal reaction, which was consistent with the results of the XRD analysis. As shown in Figure S1, the intensity of the diffraction peaks of the rutile phase at 2θ = 27.42° (110), 36.06 (101), 38.29° (200), 41.24° (111), 54.30° (211), and 56.56° (220) increased with an increase in the reaction temperature (from 105 to 185 °C), indicating that the crystallinity of rutile nanocrystals improved. For the pH1.0-T175 sample, some bigger rod-shaped nanocrystals (rutile phase) and lots of smaller nanocrystals (anatase phase) with various morphologies were observed (Figure 9e). With a further increase in the pH value, rod-shaped (or square-prism-shaped) nanocrystals with a size of about several tens of nanometers were observed, all of them belonging to the anatase phase (Figure 9f–i). The results showed that the pH value of the nanosheet colloidal solution had a great influence on the crystal structure and morphology of the produced TiO2.
As shown in Figure 10a–c, the pH4.5-Ty (y = 165, 175, or 185) sample mainly exhibited square-prism and rhombus morphologies with a particle size of ~15–30 nm. With the increase of temperature, the particle size did not increase significantly, which indicated that the increase of temperature only increased the crystallinity of the particles, which was consistent with the results of the XRD analysis. As shown in Figure S4, the intensity of the characteristic diffraction peaks of the anatase phase at 2θ = 25.66° (101), 38.22° (004), 48.32° (200), 54.10° (105), 54.50° (211), and 62.86° (204) increased with increases in the reaction temperature (from 115 to 185 °C), indicating that the crystallinity of anatase nanocrystals increased with an increase in the reaction temperature. Figure 10d–j presents the FE-SEM images of pHx-Ty (x = 6.5, 8.5, 10.5, or 12.5; y =125, 165, 175, or 185) products, which revealed that the obtained TiO2 products consisted of uniform, well-defined, spindle-shaped structures with an axial length of 75–155 nm and a transverse width of 20–35 nm. Interestingly, a series of directional streaks could be observed on the surface of the spindle-shaped crystal, which were perpendicular to the long axis (c axis)direction and parallel to the transverse axis (b axis) direction of the spindle-shaped nanocrystals, indicating that the orientation growth was in the [001] crystallographic direction. The crystal size increased with an increase in the pH value (from 6.5 to 12.5), especially for the [001] orientation of the spindle-shaped nanocrystals. Arrow-shaped crystals 500–700 nm in length were formed at pH13.5, as shown in Figure 10l. Spindle-shaped, arrow-shaped nanocrystals and unreacted nanosheets were observed at lower temperatures, indicating that a lower temperature was not conducive to the fracturing of the nanosheet (Figure 10g,k).

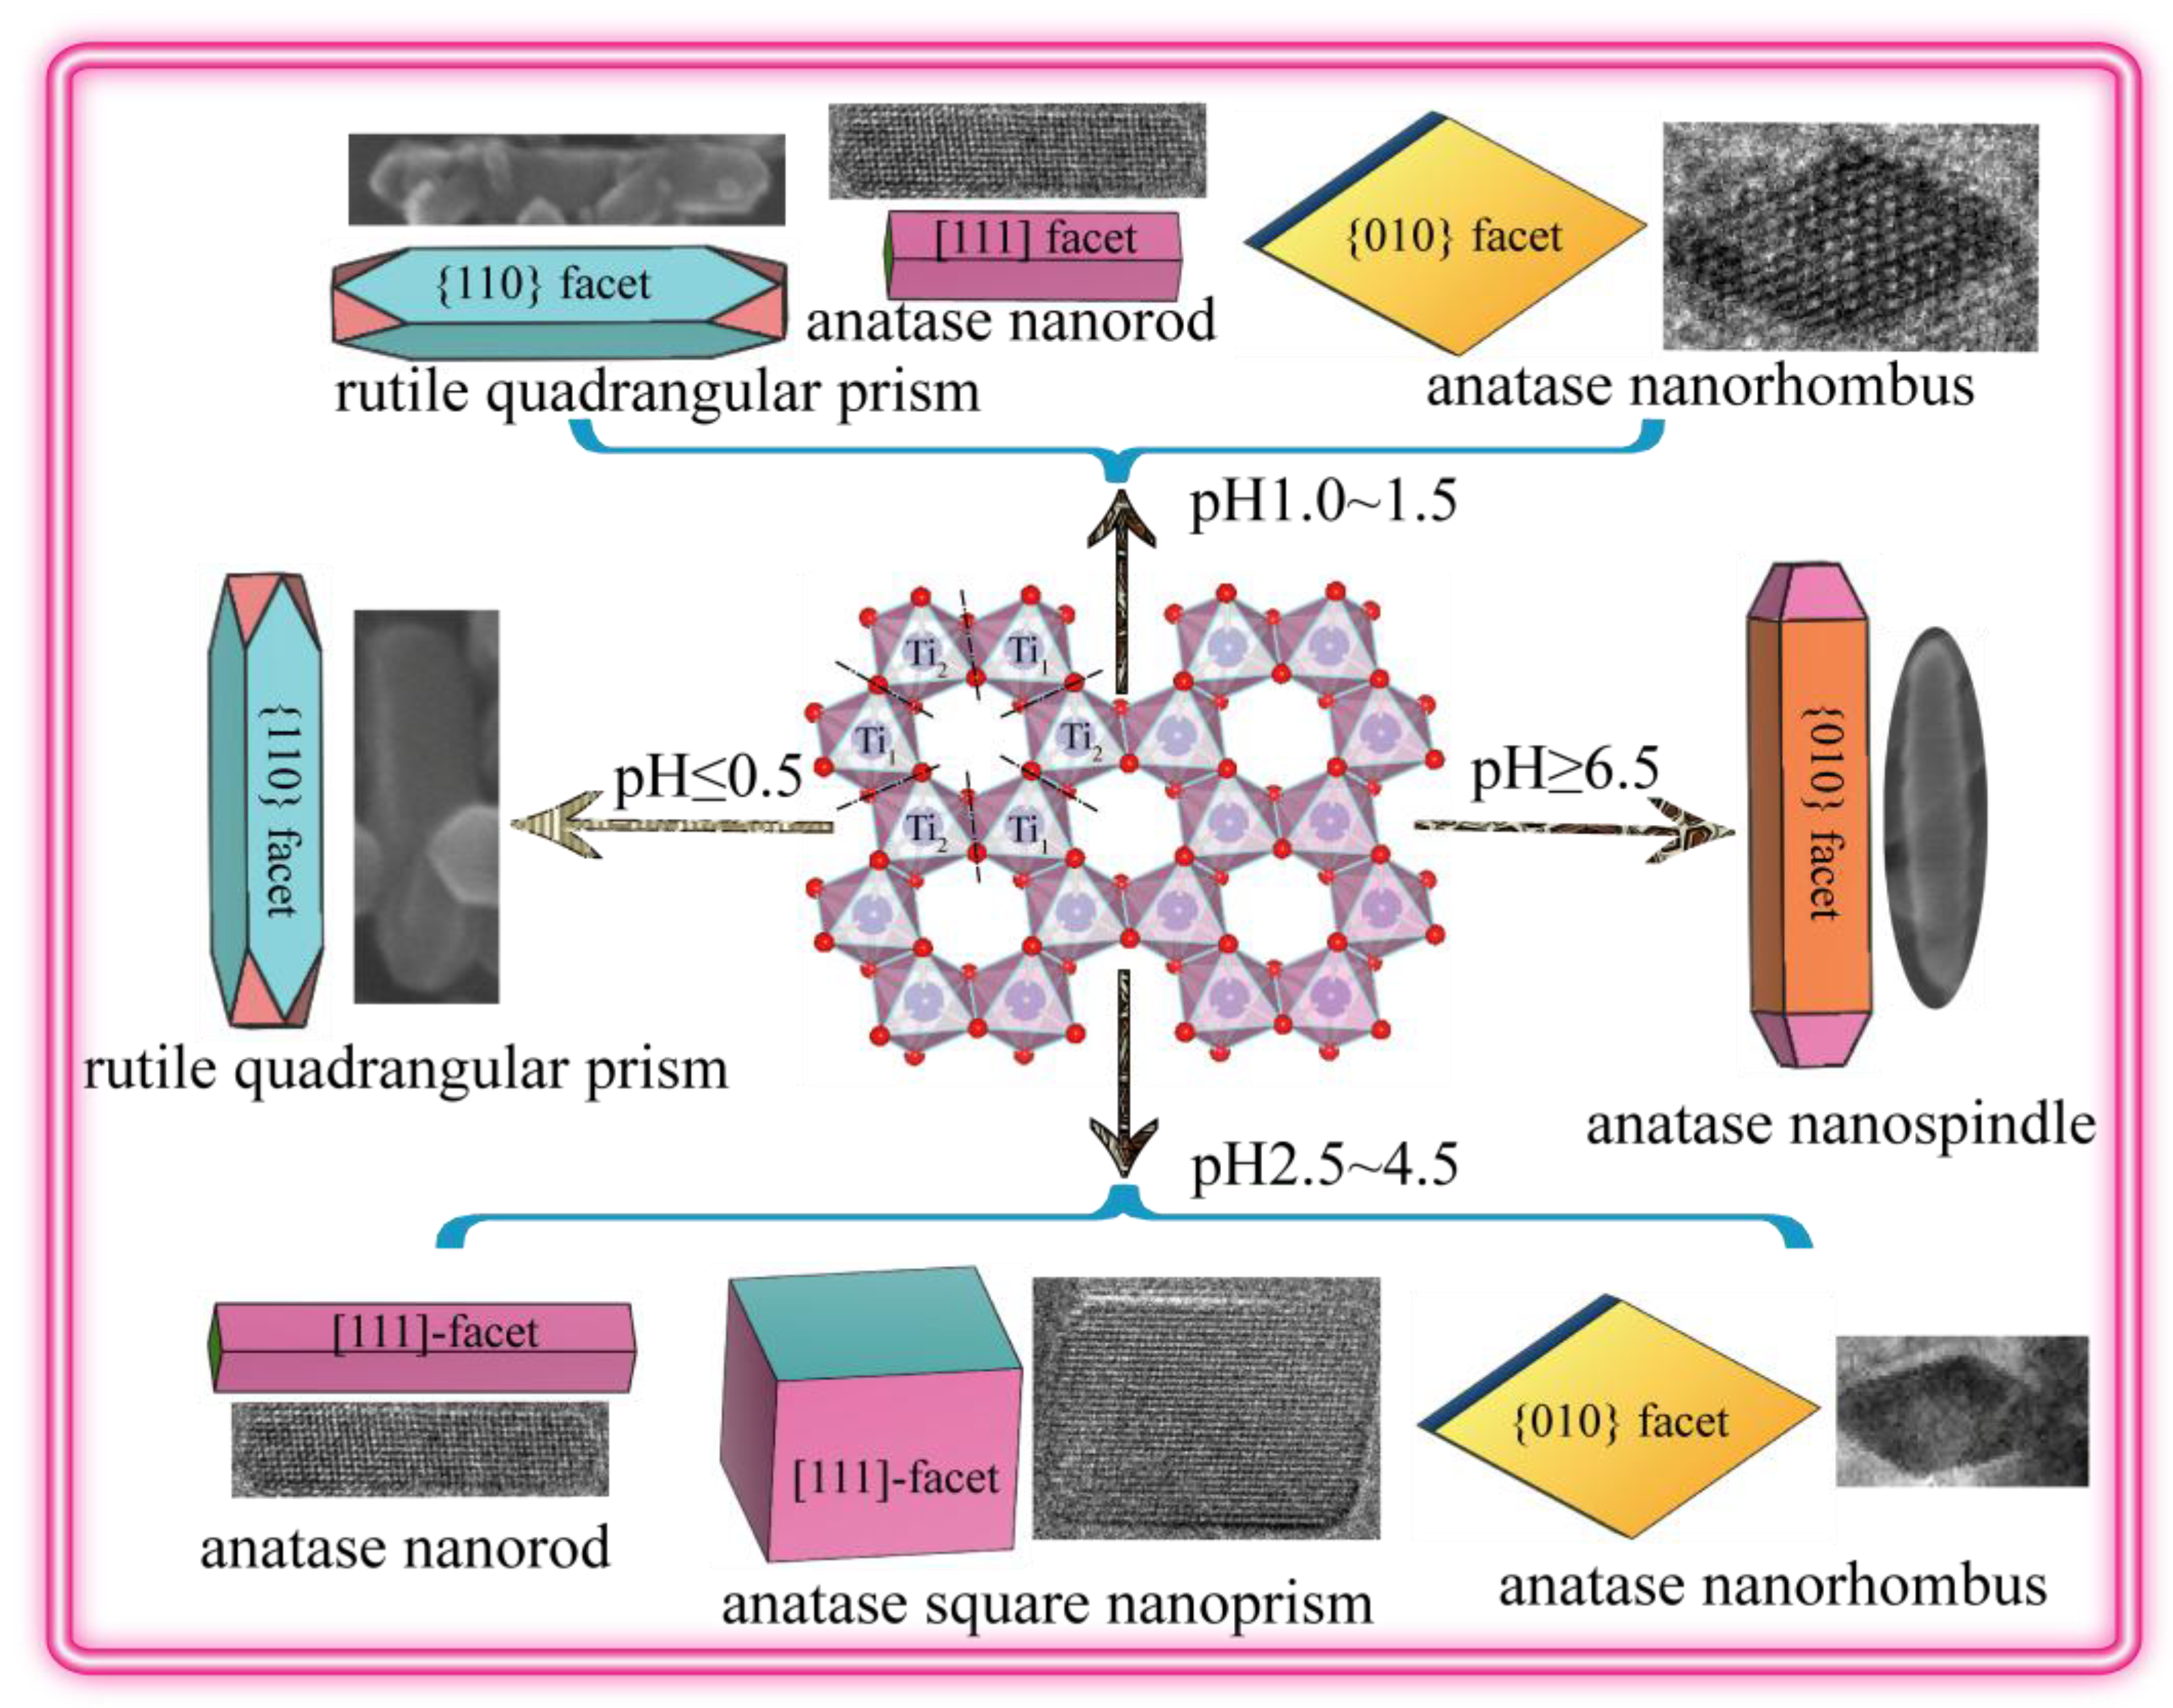
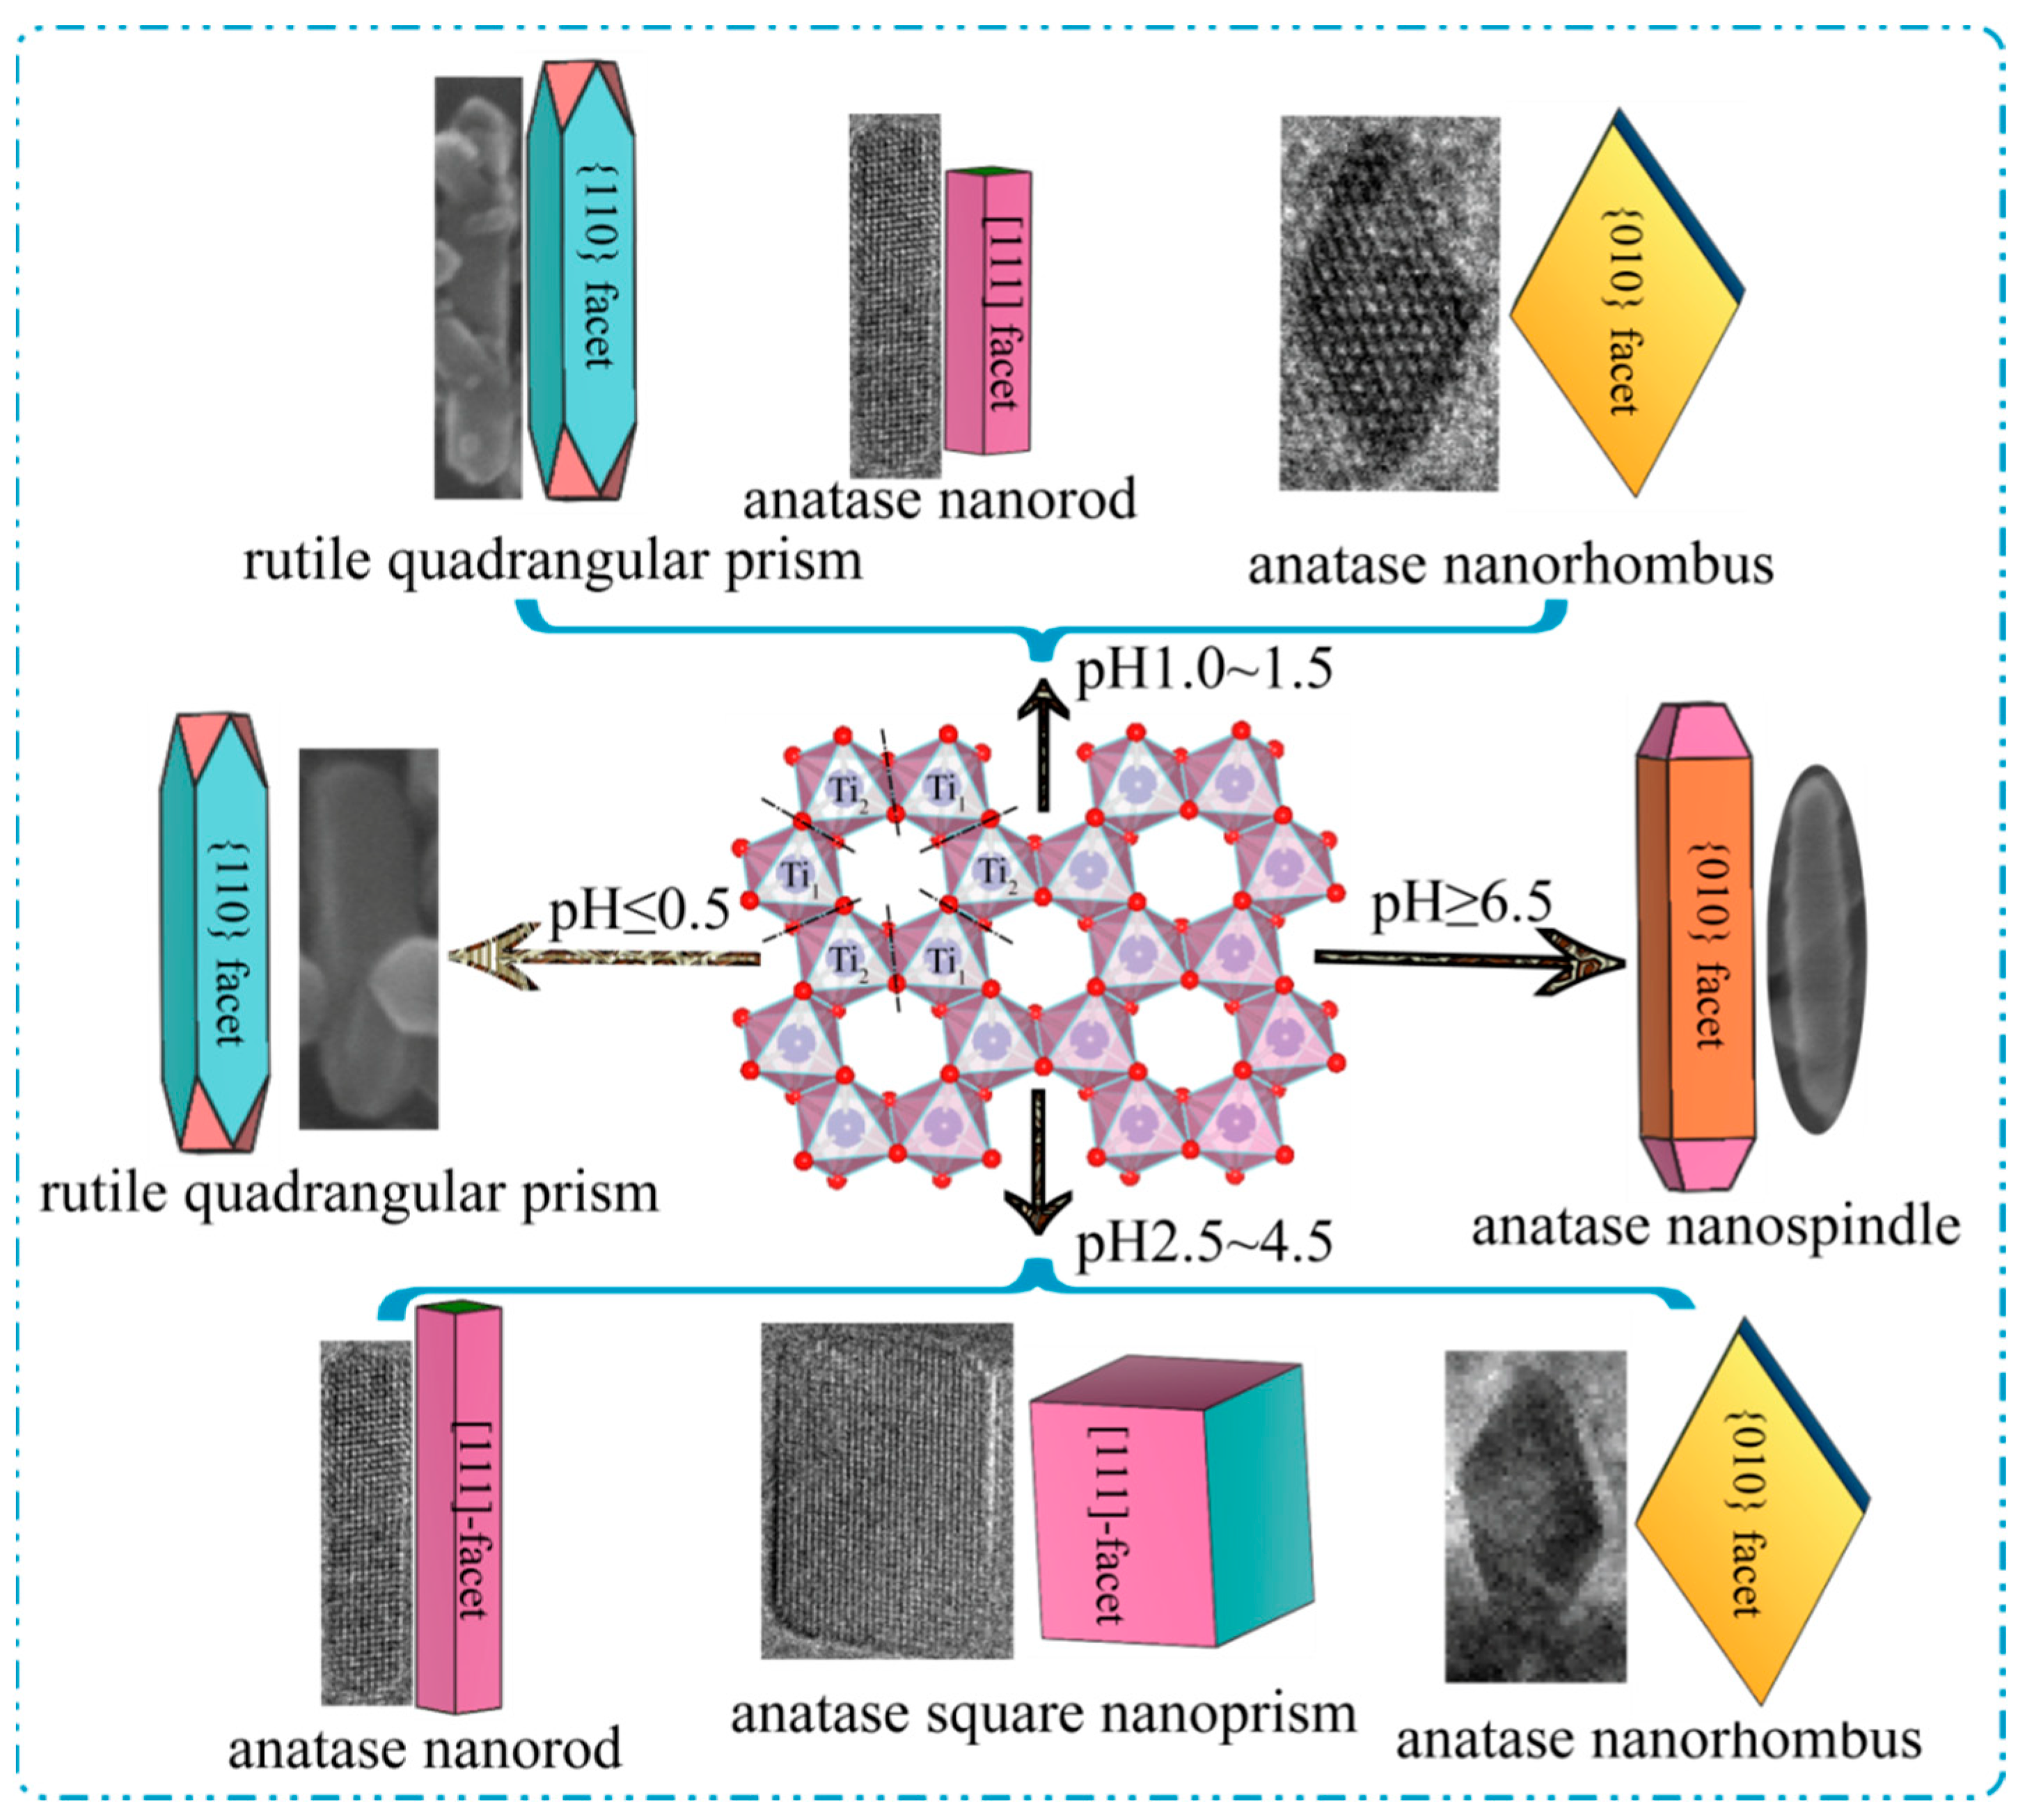
3.4. Transformation Reaction from the Delaminated H2TiO3 Nanosheets to TO2 Nanocrystals

The nanocrystal conversion process between the exfoliated H2TiO3 nanosheets and the TiO2 nanocrystals can be described as the schematic diagram in Figure 11. On the basis of the discussion above, the transformation reaction mechanism from the exfoliated metatitanic nanosheets with distorted hexagonal cavities to TiO2 nanocrystals can be described by the following chemical equations:
[TiO3]2− + 3H2O → [TiO6]8− + 6H+
[TiO6]8− + 8H+ → TiO2 + 4H2O
[TiO6]8− + 4H2O → TiO2 + 8OH
First, the delaminated [TiO3]2− nanosheets were split into many primary [TiO6]8− monomers along the edge-shared oxygen atoms under microwave-assisted hydrothermal conditions. At this stage, the pH values of the [TiO3]2− nanosheet colloidal solution had an important influence on the reaction (3). As shown in Figure 3, the acidic conditions were advantageous to the reaction (Equation (3)), which could be carried out at relatively lower temperatures, while the alkaline conditions were disadvantageous to the reaction (Equation (3)), which needed to be carried out at relatively higher temperatures. Furthermore, the rutile-type and anatase-type TiO2 nuclei were formed by polymeric [TiO6]8− monomers along the equatorial and apical edges at different pH values, respectively. Rutile nuclei could be formed under super acidic conditions (Equation (4)), and anatase nuclei could be formed under weak acidic, neutral, or alkaline conditions (Equations (4) and (5)). Finally, the different types of TiO2 nanocrystals with various morphologies and exposed facets were formed through the directional growth of the TiO2 nuclei.
The growth of the rutile-type and anatase-type TiO2 nuclei along the different crystallographic directions caused the formation of a rutile quadrangular prism, an anatase nanorod, an anatase nanorhombus, an anatase square nanoprism, and an anatase nanospindle. As shown in Figure 11, a rutile quadrangular prism with exposed {110} facets on the four lateral surfaces was formed by the directional growth of the rutile-type TiO2 nuclei along the [001] crystallographic direction under strong acidic conditions (pH = 0.5, 1.0). An anatase nanorod (or square nanoprism) with co-exposed {101}/[111] facets was formed by the directional growth of the anatase-type TiO2 nuclei along the [101] and [011] crystallographic directions, and an anatase nanorhombus with dominant exposed {010} facets was formed by the directional growth of the nuclei of anatase-type TiO2 along the [101] and [001] crystallographic directions at relatively low pH values (1.0 ≤ pH ≤ 4.5). At pH ≥ 6.5, an anatase nanospindle with dominant exposed {010} facets was formed by the directional growth of the nuclei of anatase-type TiO2 along the [001] crystallographic direction.

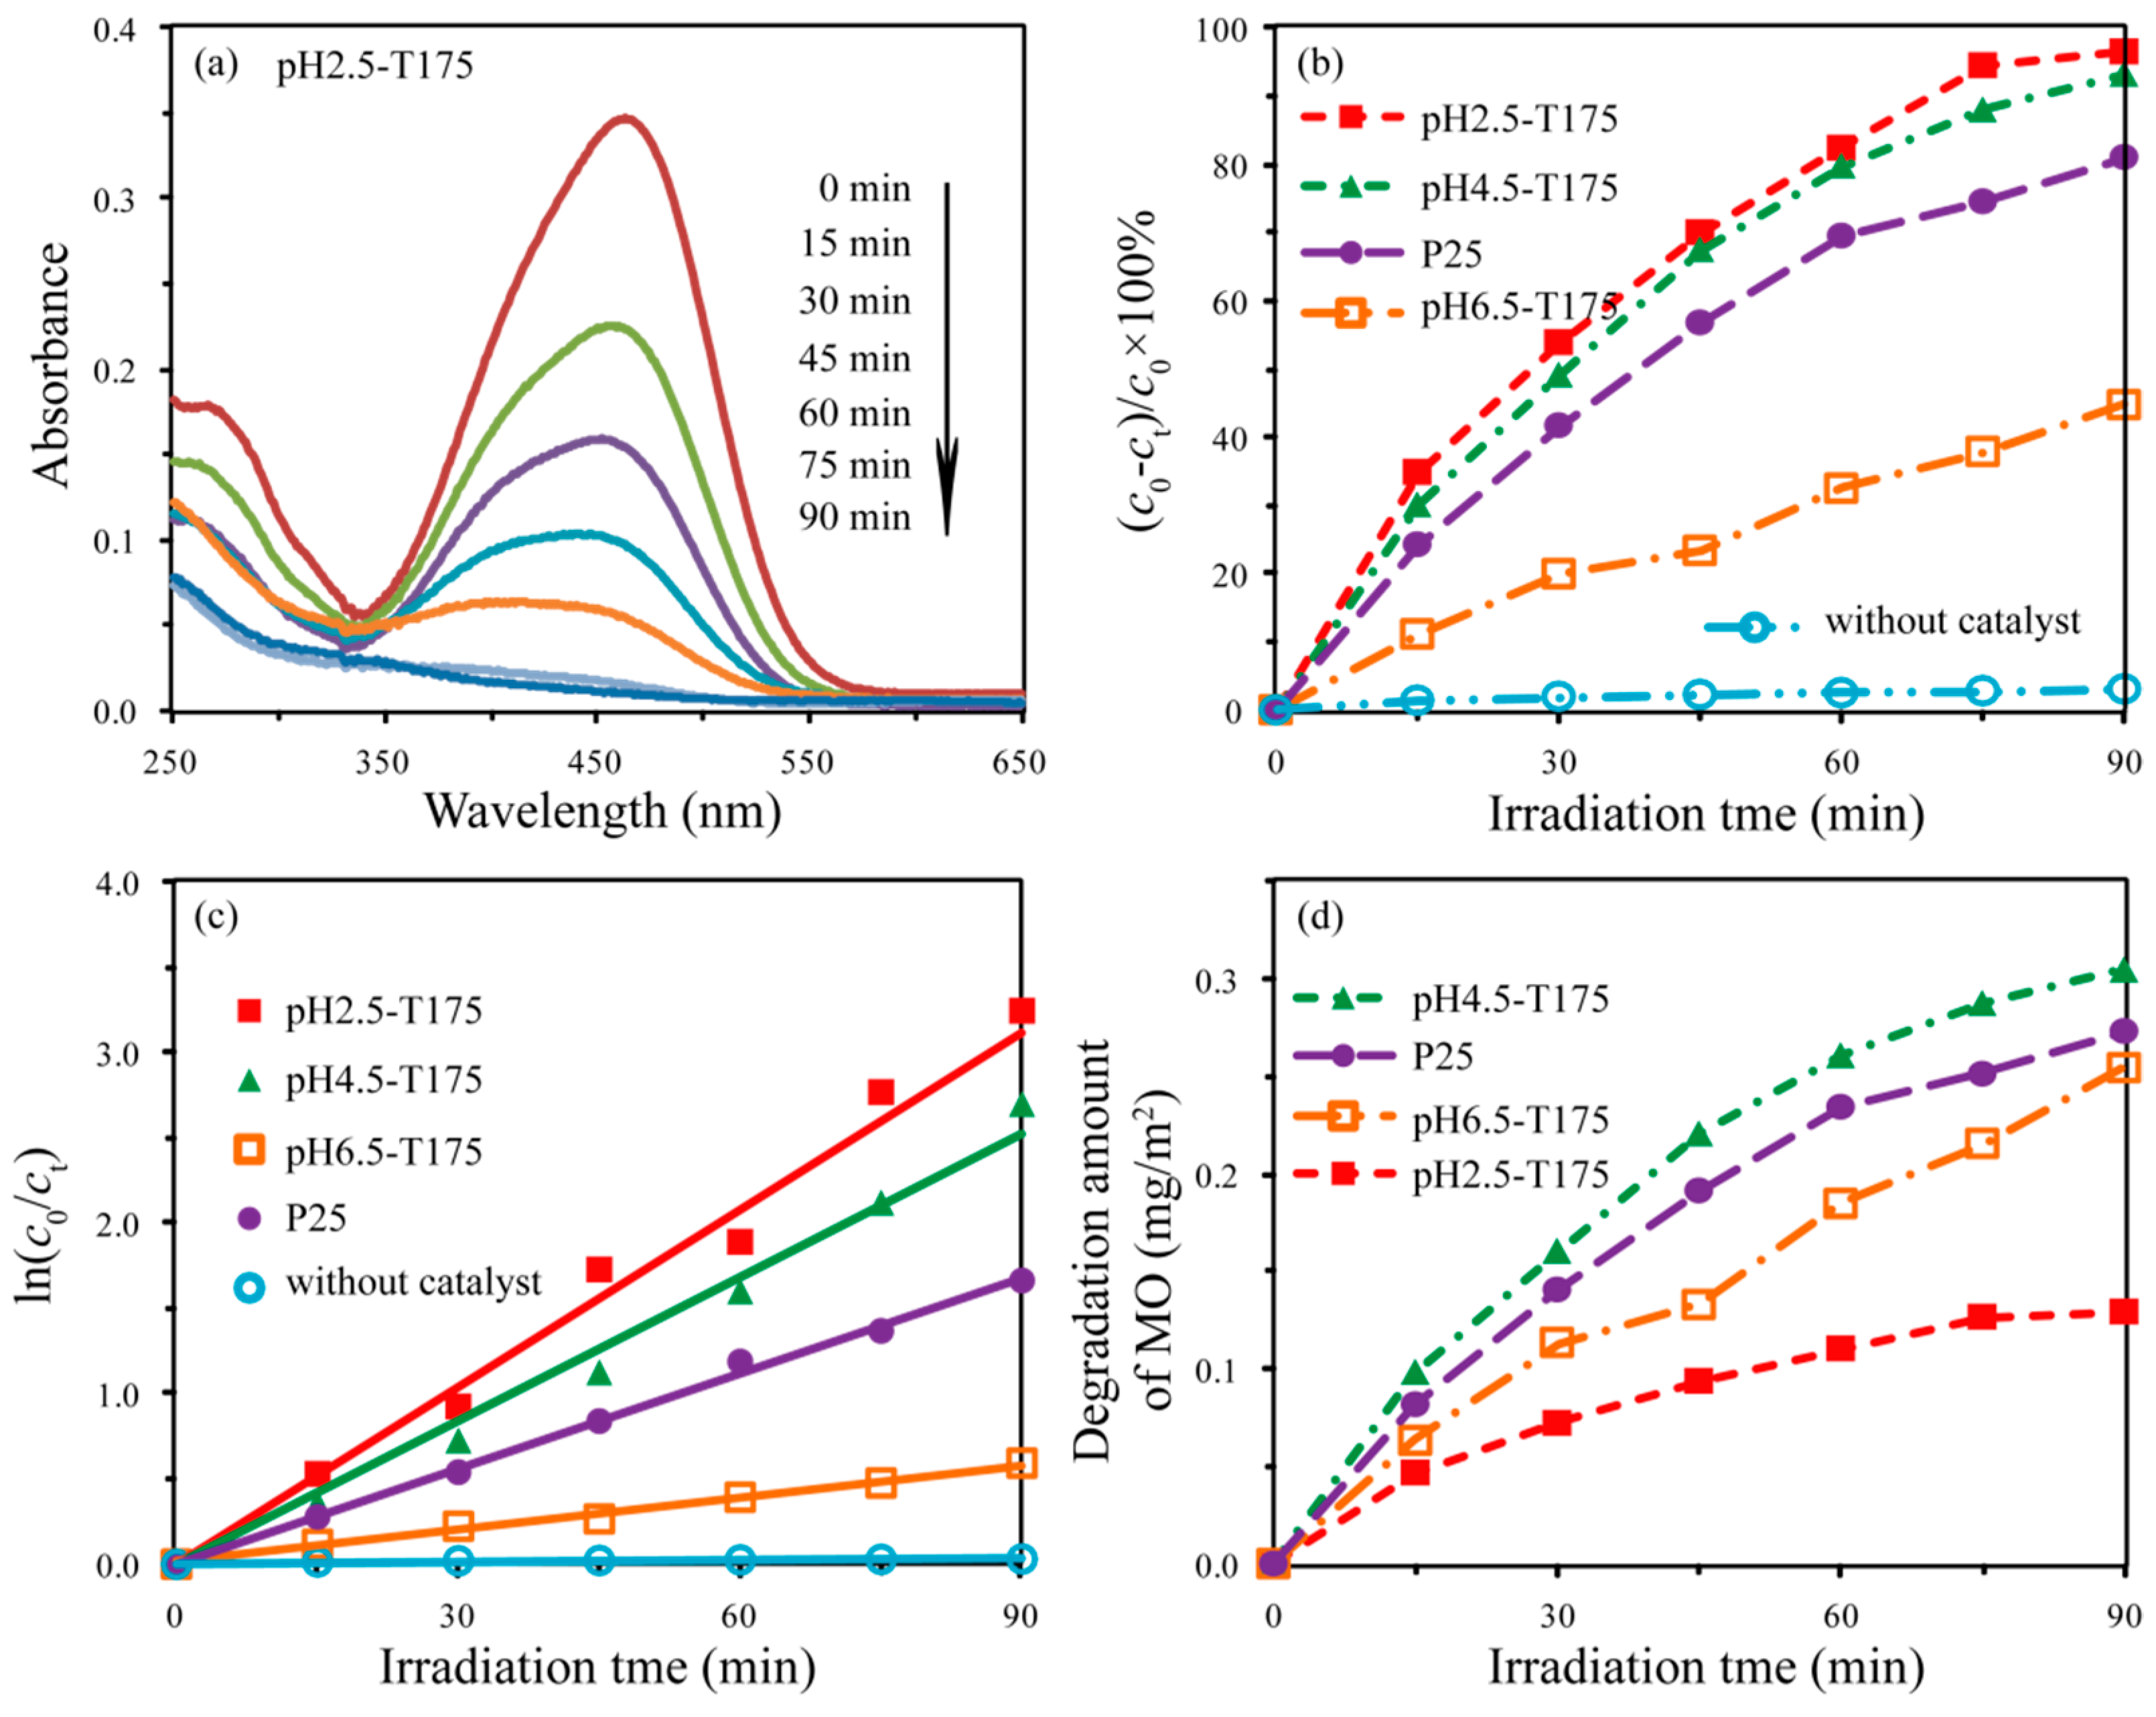
3.5. Photocatalytic Activities of the As-Synthesized TiO2 Nanocrystals

The photocatalytic activities of the TiO2 nanocrystal samples synthesized in the present work were quantitatively evaluated via bleaching 7.5 mg/L MO solutions under UV light irradiation at room temperature. The photocatalytic degradation of MO can be considered as the following reactions [47,48]:
TiO 2 + h v TiO 2 ( e + h + ) h + + OH · OH e + O 2 O 2 O 2 + H 2 O HO 2 · + OH HO 2 · + H 2 O H 2 O 2 + · OH H 2 O 2 2 · OH
·OH + MO → peroxides or hydroxylated intermediates→ degraded or mineralized products.
The above reactions were selected because both the photoelectrons and photoholes eventually participate in the formation of the OH radical, which degrades MO. In order to have a better evaluation of the photocatalytic efficiency of the as-prepared TiO2 nanocrystals, Degussa P25 (average particle size of 26.2 nm) was chosen as the photocatalytic reference. Figure 12a and Figure S9 show the UV-Vis absorption spectra of the centrifuged MO solutions at certain intervals during the photodegradation treatment with and without TiO2 nanocrystals. As can be seen, the intensity of the peaks in the visible region gradually decreased with an extension of the irradiation time. Moreover, it can be observed that the strongest peaks at 464 nm shifted toward the shorter wavelength direction (i.e., a hypsochromic shift), which can be attributed to the demethylation of the MO [49]. Demethylation and cleavage of the MO chromophore ring structure occurred simultaneously during the initial period of photodegradation of MO, in which demethylation played a predominant role [49]. With the prolongation of UV light irradiation time, the demethylated MO intermediates could be further decomposed, which was indicated by the change in peak intensity at 435 nm (Figure 12a). However, the intensity of the peaks changed little after 90 min of UV irradiationin the absence of the TiO2 sample (see Figure S9d), which indicated that the bleaching/degradation of the MO aqueous solution occurred on the surface of the TiO2 photocatalyst [35].
Figure 12b shows the evolution of the photodegradation rate along with the irradiation time. It can be noticed that the pH2.5-T175 nanocrystal showed the highest decomposition efficiency among all the tested samples, reaching above 96.5% under UV irradiation for 90 min. The second fastest decomposition efficiency was obtained with the pH4.5-T175 nanocrystal, where 93.3% of MO was decomposed after 90 min of UV light irradiation. The order of decomposition efficiency observed for MO degradation in the other samples was P25 (81.1%) > pH6.5-T175 (44.7%) > blank sample (3.1%). In order to have a quantitative comparison of the decomposition efficiency of the above samples, the experimental data in Figure 12b were fitted according to the pseudo-first-order kinetic process, which can be expressed as follows [50]:
ln(c0/ct ) = kt
where k is the photocatalytic degradation rate constant (min−1), and t is the degradation time. The fitted curves are shown in Figure 12c, and the obtained k (min−1), as well as the correlative coefficient (R2) of all the curves, is listed in Table 1. Obviously, the curves agreed well with the experimental data points. It can be seen that the pH2.5-T175 nanocrystal showed the highest k value of 0.0346 min−1, almost 1.23, 1.85, 5.32, and 86.5 times as high as that of pH4.5-T175, P25, pH6.5-T175, and the blank sample (Table 1), respectively, which helped us to have a better understanding of the pH2.5-T175 nanocrystal having the highest performance among all of the tested samples.
It is well known that the photocatalytic activity of a photocatalyst can be strongly influenced by many factors, including phase structure, particle morphology, crystallite size, specific surface area, crystal composition, crystallinity, and crystal facets [35,51]. Generally speaking, the specific surface area increases with a decrease in the particle size. Figure S10 shows the particle size distributions of pH2.5-T175, pH4.5-T175, pH6.5-T175, and P25 measured from the enlarged photograph of FESEM images, and the corresponding parameters are listed in Table 1. Since degradation occurs on the surface of catalysts, the surface area is an important parameter for photocatalytic activity. The specific surface area was ranked in the order of pH2.5-T175 > pH4.5-T175 > P25 > pH6.5-T175, which was opposite to the increasing order of the average particle size (Table 1). The photocatalytic activity increased in the order of pH2.5-T175 > pH4.5-T175 > P25 > pH6.5-T175 > blank. The pH2.5-T175 sample exhibited the highest photocatalytic activity of the samples, while pH6.5-T175 showed the lowest photocatalytic activity of the samples. On the basis of the results, the order of the photocatalytic activity can be explained by considering the following factors: (1) A smaller particle size can provide a powerful redox capability in the photochemical reaction due to the quantum size effect, resulting in an increase in the rate of migration and a decrease in the rate of recombination of the photoelectrons and photogenerated holes, thereby improving the photocatalytic activity [52]. (2) The larger specific surface can provide more adsorption sites, resulting in an enhancement of MO adsorbed on the surface of TiO2, thereby contributing to the improvement of the photocatalytic activity [53].
In order to better understand the intrinsic photocatalytic activity of the different TiO2 nanocrystals, we examined the degradation amount of MO per unit surface area of catalyst (mg (MO) per m2 (TiO2 surface area)), as shown in Figure 12d. The degradation amount of pH2.5-T175, pH6.5-T175, P25, and pH4.5-T175 was calculated to be 0.13, 0.25, 0.27, and 0.31 mg/m2, respectively. On the basis of the above results and discussions, we know that the co-exposed facets of pH2.5-T175, pH4.5-T175, pH6.5-T175, and P25 were {101}/[111] facets, {101}/[111] facets, {010}/{001} facets, and {101}/[111] facets [54], respectively. Although the exposed crystal facets of the pH2.5-T175 and pH4.5-T175 nanocrystals were the same, their photocatalytic performances were quite different, indicating that the crystal facets were not the main factor affecting the photocatalytic performance. The degradation amount of MO per unit surface area of the pH2.5-T175 nanocrystals was the smallest among the samples, which can be attributed to them having the lowest crystallinity. Except for pH2.5-T175, theother samples all had high crystallinity, so their photocatalytic activity depended on the crystal plane. For the low-index facets of anatase, the average surface energy (γ) can be arranged in the following order: γ{111} (1.61 J/m2) > γ{110} (1.09 J/m2) > γ{001} (0.90 J/m2) > γ{010} (0.53 J/m2) > γ{101} (0.44 J/m2) [55]. The P25 sample contained~87% anatase nanocrystals (partially co-exposed in the {101}/[111]-facets) and ~13% rutile nanocrystals, with an average size of ~26.2 nm [54]. The degradation amounts of MO per unit surface area of the pH4.5-T175 and P25 nanocrystals were higher than that of the pH6.5-T175 nanocrystal, which can be attributed to the existence of oxygen vacancies (active reaction sites) on the [111] facets of the TiO2 nanocrystals [14]. The pH4.5-T175 nanocrystal exhibited higher degradation amounts than did the P25 nanocrystal due to the larger proportion of [111] facets exposed on the surface of TiO2, which could create more active reaction sites in the process of photocatalytic reaction.

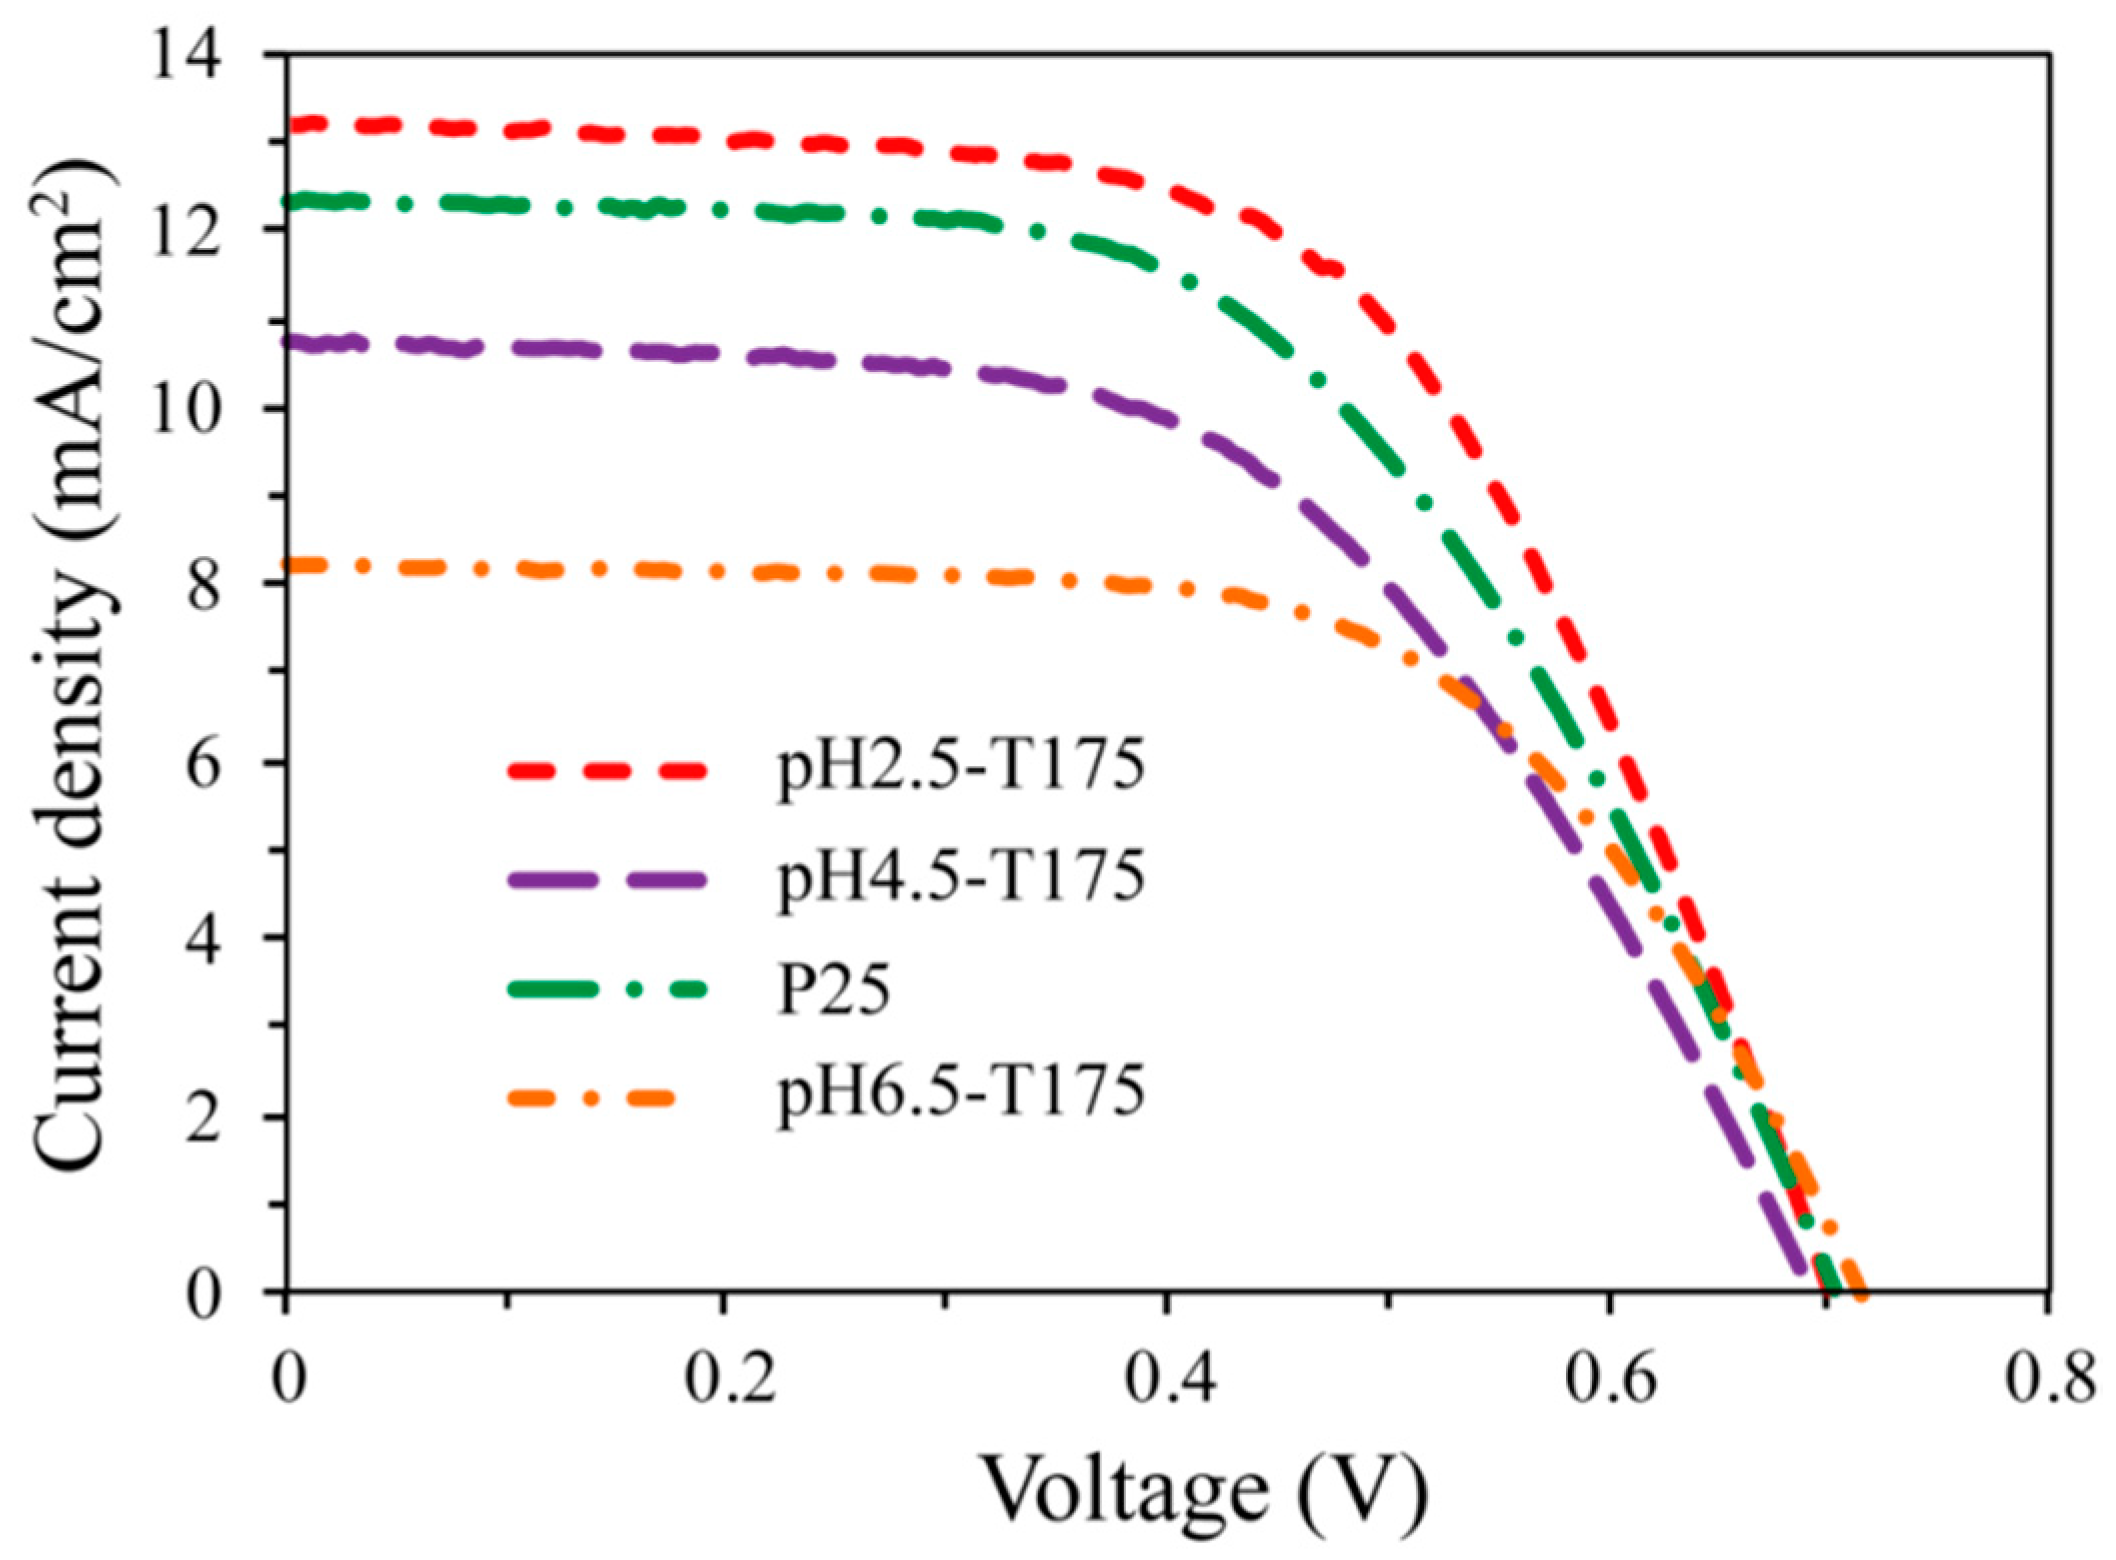
3.6. Photovoltic Performances of As-Synthesized TiO2 Nanocrystals

The photocurrent–voltage characteristics of the DSSCs with the as-synthesized TiO2 nanocrystals and commercial Degussa P25 nanoparticles in the photoelectrodes are shown in Figure 13, and the detailed photovoltaic parameters of the four DSSCs, including open-circuit (VOC) and short-circuit photocurrent densities (JSC), the fill factor (FF), and the overall conversion efficiency (η), are summarized in Table 2. For comparison, the thicknesses of the TiO2 porous films were kept almost the same, at about 20 μm. The value of JSC increased in the order of pH6.5-T175 < P25 < pH4.5-T175 < pH2.5-T175, which agreed with the decreasing order of the crystal size, while the value of VOC increased in the order of P25 < pH2.5-T175 < pH4.5-T175 < pH6.5-T175, which was almost consistent with the increasing order of the crystal size, except for the P25 sample. The value of FF increased in the order of P25 < pH4.5-T175 < pH2.5-T175 < pH6.5-T175, which was almost the same as the VOC increasing order, except for the pH2.5-T175 sample. The value of η increased in the same order as the JSC value, i.e., the cell made of pH2.5-T175 nanocrystals showed the highest performance for the DSSCs, which represented an enhancement 20.7%, 25.1%, and 33.5% compared to the pH4.5-T175, P25, and pH6.5-T175 samples, respectively. It is well known that the particle size, specific surface area, film thickness, exposed crystal facets, crystal structure, and particle morphology of photoanodes are essential factors for enhancing photovoltaic properties [56,57]. The photoanode films of DSSCs that are prepared by smaller nanoparticles often possess a large internal surface area, which is beneficial to the adsorption of dye, resulting in an increase in the photocurrent and energy conversion efficiency [57]. The cells with the pH6.5-T175 electrode exhibited the lowest value of JSC and η (Table 2) due to having the largest particle size and the lowest specific area (Table 1), which reduced the available internal surface area for the adsorption of the dye molecules, resulting in a decrease in light-harvesting efficiency [58]. The cells made of pH2.5-T175 possessed the highest JSC and η values, which can be attributed to their minimum particle size and maximum surface area.
In accordance with the previous discussion, the exposed crystal facets of the pH2.5-T175, pH4.5-T175, pH6.5-T175, and P25 nanocrystals were {101}/[111] facets, {101}/[111] facets, {101}/{010} facets, and {101}/[111] facets (only a small fraction), respectively. It has been reported that the adsorption equilibrium constant and the surface uptake density of N719 dye molecules on different crystal facets of the TiO2 surface increase in the order of the following: without specific exposed facets < {101} facets < [111] facets < {010} facets on the surface of anatase TiO2. In other words, the strong adsorption and surface uptake density of N719 dye molecules on the surface of anatase TiO2 can increase the light-harvesting efficiency, resulting in an improvement in the photovoltaic performance [59,60]. However, the {101}/{010} facets co-exposed in the pH6.5-T175 photoanode exhibited the lowest JSC value, which implies that compared to the specific area, the crystal facets were not the most important effecting factor in this research. The cells with a pH6.5-T175 photoanode showed the highest VOC and FF values, which may be attributed to the fact that the high surface uptake density can decrease the charge recombination at the TiO2/electrolyte interface [56], and the oriented anatase TiO2 nanospindle structure can improve the charge transport properties in the porous TiO2 film [57]. The photoanode made of pH2.5-T175 nanocrystals (co-exposed {101} and [111] facets) possessed a higher JSC value than did the one made of pH4.5-T175 nanocrystals (co-exposed {101} and [111] facets) or P25 nanocrystals (partial co-exposed {101} and [111] facets) at a similar film thickness, which can be attributed to the higher specific surface area enhancing N719 dye adsorption, resulting in an increase in the JSC value.

4. Conclusions

Microwave-assisted hydrothermal synthesis is an effective synthesis route to produce TiO2 nanocrystals with different morphologies and high-energy surfaces at relatively low temperatures, which can shorten the reaction time, reduce the energy consumption, and enhance the purity and crystallinity of the produced products compared to the traditional hydrothermal method. Titanate nanosheets were exfoliated from layered porous metatitanic acid with a lepidocrocite-type structure, which was suitable as a building block for the assembly of different structured TiO2 nanocrystals. The pH values of the nanosheets had a significant effect on the crystallinity, crystallite, phase structure, morphology, and exposure facets of the prepared TiO2 nanocrystals. Rutile TiO2 quadrangular prisms with dominant {110} facets, anatase TiO2 nanorods and square nanoprisms with co-exposed {101}/[111] facets, anatase TiO2 nanorhombuses with co-exposed {101}/{010} facets, and anatase TiO2 nanospindles with dominant {010} facets were synthesized through a facile green approach with the use of exfoliated porous metatitanic acid nanosheets as the precursor at various pH values. The morphology and exposed crystal facets of the obtained TiO2 nanocrystals could be controlled by adjusting the pH value of the nanosheet solution. The transformation reaction mechanism from the exfoliated metatitanic nanosheets with distorted hexagonal cavities to TiO2 nanocrystals could include a dissolution reaction of the nanosheets, nucleation of the primary [TiO6]8− monomers, and the growth of rutile-type and anatase-type TiO2 nuclei. The {101}/[111]-faceted pH2.5-T175 nanocrystal showed the highest photocatalytic and photovoltaic performance compared to the other TiO2 samples, which could be attributed mainly to its minimum particle size and maximum specific surface area.

Supplementary Materials

The following are available online at https://www.mdpi.com/1996-1944/12/21/3614/s1, Figures S1–S8: Evolution of the XRD patterns of the TiO2 nanocrystal samples synthesized at pH0.5–13.5 and various temperatures; Figure S9: UV-Vis spectral changes of MO solutions as a function of UV irradiation time in the presence of (a) pH4.5-T175, (b) pH6.5-T175, and (c) P25 photocatalysts and in the (d) absence of photocatalysts; Figure S10: Particle size distributions of (a) pH2.5-T175, (b) pH4.5-T175, (c) pH6.5-T175, and (d) P25.

Author Contributions

Conceptualization, Y.-e.D. and X.N.; methodology, Y.-e.D. and X.N.; formal analysis, Y.-e.D. and J.A.; investigation, Y.-e.D. and W.L.; resources, Y.-e.D., Y.L., and Y.C.; data curation, Y.-e.D.; writing—original draft preparation, Y.-e.D.; writing—review and editing, Y.-e.D., X.Y., and Q.F.; supervision, P.W., X.Y., and Q.F.; project administration, Y.-e.D.; funding acquisition, Y.L., Y.C., and Y.-e.D.

Acknowledgments

This work was supported by the Grants-in-Aid for Doctor Research Funds, the higher education reform and innovation project of Shanxi (J2019186), the education reform and innovation project of Jinzhong University (J201903), the fund for the Shanxi “1331 Project” Key Innovation Team (PY201817), the fund for the Jinzhong University “1331 Project” Key Innovation Team (jzxycxtd2017004), the National Science Foundation of China (no. 51272030 and 51572031), and the Grants-in-Aid for Scientific Research (B) (grant number 26289240) from the Japan Society for the Promotion of Science and Kagawa University.

Conflicts of Interest

The authors declare no conflicts of interest.

References

  1. Wu, L.; Yang, B.X.; Yang, X.H.; Chen, Z.G.; Li, Z.; Zhao, H.J.; Gong, X.G.; Yang, H.G. On the synergistic effect of hydrohalic acids in the shape-controlled synthesis of anatase TiO2 single crystals. Cryst. Eng. Comm. 2013, 15, 3252–3255. [Google Scholar] [CrossRef]
  2. Wen, C.Z.; Jiang, H.B.; Qiao, S.Z.; Yang, H.G.; Lu, G.Q. Synthesis of high-reactive facets dominated anatase TiO2. J. Mater. Chem. 2011, 21, 7052–7061. [Google Scholar] [CrossRef]
  3. Zhang, J.; Zhang, L.L.; Shi, Y.X.; Xu, G.L.; Zhang, E.P.; Wang, H.B.; Kong, Z.; Xia, J.H.; Ji, Z.G. Anatase TiO2 nanosheets with coexposed {101} and {001}facets coupled with ultrathin SnS2 nanosheets as a face-to-face n-p-n dual heterojunction photocatalyst for enhancing photocatalytic activity. Appl. Surf. Sci. 2017, 420, 839–848. [Google Scholar] [CrossRef]
  4. Regue, M.; Sibby, S.; Ahmet, I.Y.; Friedrich, D.; Abdi, F.F.; Johnson, A.L.; Eslava, S. TiO2 photoanodes with exposed {010} facets grown by aerosol-assisted chemical vapor deposition of a titanium oxo/alkoxy cluster. J. Mater. Chem. A 2019, 7, 19161–19172. [Google Scholar] [CrossRef]
  5. Kashiwaya, S.; Olivier, C.; Majimel, J.; Klein, A.; Jaegermann, W.; Toupance, T. Nickel oxide selectively depositedon the {101} facet of anatase TiO2 nanocrystal bipyramids for enhanced photocatalysis. ACS Appl. Nano Mater. 2019, 2, 4793–4803. [Google Scholar] [CrossRef]
  6. He, J.; Du, Y.-E.; Bai, Y.; An, J.; Cai, X.M.; Chen, Y.Q.; Wang, P.F.; Yang, X.J.; Feng, Q. Facile formation of anatase/rutile TiO2 nanocomposites with enhanced photocatalytic activity. Molecules 2019, 24, 2996. [Google Scholar] [CrossRef]
  7. Ding, Y.; Zhang, T.T.; Liu, C.; Yang, Y.; Pan, J.H.; Yao, J.X.; Hu, L.H.; Dai, S.Y. Shape-controlled synthesis of single-crystalline anatase TiO2 micro/nanoarchitectures for efficient dye-sensitized solar cells. Sustain. Energy Fuels 2017, 1, 520–528. [Google Scholar] [CrossRef]
  8. Ong, W.J.; Tan, L.L.; Chai, S.P.; Yong, S.T.; Mohamed, A.R. Highly reactive {001} facets of TiO2-based composites: synthesis, formation mechanism and characterization. Nanoscale 2014, 6, 1946–2008. [Google Scholar] [CrossRef]
  9. Du, Y.-E.; Niu, X.J.; Bai, Y.; Qi, H.X.; Guo, Y.Q.; Chen, Y.Q.; Wang, P.F.; Yang, X.J.; Feng, Q. Synthesis of anatase TiO2 nanocrystals with defined morphologies from exfoliated nanoribbons: photocatalytic performance and application in dye-sensitized solar cell. ChemistrySelect 2019, 4, 4443–4457. [Google Scholar] [CrossRef]
  10. Yu, S.L.; Liu, B.C.; Wang, Q.; Gao, Y.X.; Shi, Y.; Feng, X.; An, X.T.; Liu, L.X.; Zhang, J. Ionic liquid assisted chemical strategy to TiO2 hollow nanocube assemblies with surface-fluorination and nitridation and high energy crystal facet exposure for enhanced photocatalysis. ACS Appl. Mater. Interfaces 2014, 6, 10283–10295. [Google Scholar] [CrossRef]
  11. Yu, J.G.; Wang, G.H.; Cheng, B.; Zhou, M.H. Effects of hydrothermal temperature and time on the photocatalytic activity and microstructures of bimodal mesoporous TiO2 powders. Appl. Catal. B 2007, 69, 171–180. [Google Scholar] [CrossRef]
  12. Wang, Y.; Zhang, H.M.; Han, Y.H.; Liu, P.R.; Yao, X.D.; Zhao, H.J. A selective etching phenomenon on {001} faceted anatase titanium dioxide single crystal surfaces by hydrofluoric acid. Chem. Commun. 2011, 47, 2829–2831. [Google Scholar] [CrossRef] [PubMed]
  13. Han, X.G.; Kuang, Q.; Jin, M.S.; Xie, Z.X.; Zheng, L.S. Synthesis of titania nanosheets with a high percentage of exposed (001) facets and related photocatalytic properties. J. Am. Chem. Soc. 2009, 131, 3152–3153. [Google Scholar] [CrossRef] [PubMed]
  14. Xu, H.; Reunchan, P.; Ouyang, S.X.; Tong, H.; Umezawa, N.; Kako, T.; Ye, J.H. Anatase TiO2 single crystals exposed with high-reactive {111} facets toward efficient H2 evolution. Chem. Mater. 2013, 25, 405–411. [Google Scholar] [CrossRef]
  15. Yang, H.G.; Sun, C.H.; Qiao, S.Z.; Zou, J.; Liu, G.; Smith, S.C.; Cheng, H.M.; Lu, G.Q. Anatase TiO2 single crystals with a large percentage of reactive facets. Nature 2008, 453, 638–641. [Google Scholar] [CrossRef]
  16. Wen, P.H.; Itoh, H.; Tang, W.P.; Feng, Q. Single nanocrystals of anatase-type TiO2 prepared from layered titanate nanosheets: Formation mechanism and characterization of surface properties. Langmuir 2007, 23, 11782–11790. [Google Scholar] [CrossRef]
  17. Yang, H.G.; Liu, G.; Qiao, S.Z.; Sun, C.H.; Jin, Y.G.; Smith, S.C.; Zou, J.; Cheng, H.M.; Lu, G.Q. Solvothermal Synthesis and photoreactivity of anatase TiO2 nanosheets with dominant {001} facets. J. Am. Chem. Soc. 2009, 131, 4078–4083. [Google Scholar] [CrossRef]
  18. Liu, G.; Yu, J.C.; Lu, G.Q.; Cheng, H.M. Crystal facet engineering of semiconductor photocatalysts: motivations, advances and unique properties. Chem. Commun. 2011, 47, 6763–6783. [Google Scholar] [CrossRef]
  19. Ye, L.Q.; Mao, J.; Liu, J.Y.; Jiang, Z.; Peng, T.Y.; Zan, L. Synthesis of anatase TiO2 nanocrystals with {101}, {001} or {010} single facets of 90% level exposure and liquidphase photocatalytic reduction and oxidation activity orders. J. Mater. Chem. A 2013, 1, 10532–10537. [Google Scholar] [CrossRef]
  20. Li, T.; Shen, Z.L.; Shu, Y.L.; Li, X.G.; Jiang, C.J.; Chen, W. Facet-dependent evolution of surface defects in anatase TiO2 by thermal treatment: Implications for environmental applications of photocatalysis. Environ. Sci. Nano 2019, 6, 1740–1753. [Google Scholar] [CrossRef]
  21. Feng, J.Y.; Yin, M.C.; Wang, Z.Q.; Yan, S.C.; Wan, L.J.; Li, Z.S.; Zou, Z.G. Facile synthesis of anatase TiO2 mesocrystal sheets with dominant {001} facets based on topochemical conversion. CrystEngComm 2010, 12, 3425–3429. [Google Scholar] [CrossRef]
  22. Illa, S.; Boppella, R.; Manorama, S.V.; Basak, P. Mesoporous assembly of cuboid anatase nanocrystals into hollow spheres: Realizing enhanced photoactivity of high energy {001} facets. J. Phys. Chem. C 2016, 120, 18028–18038. [Google Scholar] [CrossRef]
  23. Khalil, M.; Anggraeni, E.S.; Ivandini, T.A.; Budianto, E. Exposing TiO2 (001) crystal facet in nano Au-TiO2 heterostructures for enhanced photodegradation of methylene blue. Appl. Surf. Sci. 2019, 487, 1376–1384. [Google Scholar] [CrossRef]
  24. Ye, L.Q.; Liu, J.Y.; Tian, L.H.; Peng, T.Y.; Zan, L. The replacement of {101} by {010} facets inhibits the photocatalytic activity of anatase TiO2. Appl. Catal., B 2013, 134–135, 7515–7519. [Google Scholar] [CrossRef]
  25. Amoli, V.; Bhat, S.; Maurya, A.; Banerjee, B.; Bhaumik, A.; Sinha, A.K. Tailored synthesis of porous TiO2nanocubes and nanoparallelepipeds with exposed {111} facets and mesoscopic void space: A superior candidate for efficient dye-sensitized solar cells. ACS Appl. Mater. Interfaces 2015, 7, 26022–26035. [Google Scholar] [CrossRef]
  26. Niu, X.J.; Du, Y.E.; Liu, Y.F.; Qi, H.X.; An, J.; Yang, X.J.; Feng, Q. Hydrothermal synthesis and formation mechanism of the anatase nanocrystals with co-exposed highenergy {001}, {010} and [111]-facets for enhanced photocatalytic performance. RSC Adv. 2017, 7, 24616–24627. [Google Scholar] [CrossRef]
  27. Liu, Y.F.; Du, Y.-E.; Bai, Y.; An, J.; Li, J.Q.; Yang, X.J.; Feng, Q. Facile synthesis of {101}, {010} and [111]-Faceted anatase-TiO2 nanocrystals derived from porous metatitanic acid H2TiO3 for enhanced photocatalytic performance. ChemistrySelect 2018, 3, 2867–2876. [Google Scholar] [CrossRef]
  28. Gerbec, J.A.; Magana, D.; Washington, A.; Strouse, G.F. Microwave-enhanced reaction rates for nanoparticle synthesis. J. Am. Chem. Soc. 2005, 127, 15791–15800. [Google Scholar] [CrossRef]
  29. Yoon, S.; Lee, E.-S.; Manthiram, A. Microwave-solvothermal synthesis of various polymorphs of nanostructured TiO2 in different alcohol media and their lithium ion storage properties. Inorg. Chem. 2012, 51, 3505–3512. [Google Scholar] [CrossRef]
  30. Krishnapriya, R.; Praneetha, S.; Murugan, A.V. Microwave-solvothermal synthesis of different TiO2 nanomorphologies with perked up efficiency escorted by incorporating Ni nanoparticle in electrolyte for dye sensitized solar cells. Inorg. Chem. Front. 2017, 4, 1665–1678. [Google Scholar] [CrossRef]
  31. Kokel, A.; Schäfer, C.; Török, B. Application of microwave-assisted heterogeneous catalysis in sustainable synthesis design. Green Chem. 2017, 19, 3729–3751. [Google Scholar] [CrossRef]
  32. Nunes, D.; Pimentel, A.; Santos, L.; Barquinha, P.; Fortunato, E.; Rodrigo Martins, R. Photocatalytic TiO2 nanorod spheres and arrays compatible with flexible applications. Catalysts 2017, 7, 60. [Google Scholar] [CrossRef]
  33. Shi, X.C.; Zhang, Z.B.; Zhou, D.F.; Zhang, L.F.; Chen, B.Z.; Yu, L.L. Synthesis of Li+ adsorbent (H2TiO3) and its adsorption properties. Trans. Nonferrous Met. Soc. China 2013, 23, 253–259. [Google Scholar] [CrossRef]
  34. Wang, C.-C.; Li, J.-R.; Lv, X.-L.; Zhang, Y.-Q.; Guo, G.S. Photocatalytic organic pollutants degradation in metal–organic frameworks. Energy Environ. Sci. 2014, 7, 2831–2867. [Google Scholar] [CrossRef]
  35. Liao, Y.L.; Que, W.X.; Jia, Q.Y.; He, Y.C.; Zhang, J.; Zhong, P. Controllable synthesis of brookite/anatase/rutile TiO2 nanocomposites and single-crystalline rutile nanorods array. J. Mater. Chem. 2012, 22, 7937–7944. [Google Scholar] [CrossRef]
  36. Zheng, J.-Y.; Bao, S.-H.; Guo, Y.; Jin, P. Anatase TiO2 films with dominant {001} facets fabricated by direct-current reactive magnetron sputtering at room temperature: oxygen defects and enhanced visible-light photocatalytic behaviors. ACS Appl. Mater. Interfaces 2014, 6, 5940–5946. [Google Scholar] [CrossRef]
  37. Azuma, K.; Dover, C.; Grinter, D.C.; Grau-Grespo, R.; Almora-Barrios, N.; Thornton, G.; Oda, T.; Tanaka, S. Scanning tunneling microscopy and molecular dynamics study of the Li2TiO3 (001) surface. J. Phys. Chem. C 2013, 117, 5126–5131. [Google Scholar] [CrossRef]
  38. Chitrakar, R.; Makita, Y.; Ooi, K.; Sonoda, A. Lithium recovery from salt brine H2TiO3. Dalton Trans. 2014, 43, 8933–8939. [Google Scholar] [CrossRef]
  39. Yu, C.-L.; Yanagisawa, K.; Kamiya, S.; Kozawa, T.; Ueda, T. Monoclinic Li2TiO3nano-particles via hydrothermal reaction: processing and structure. Ceram. Int. 2014, 40, 1901–1908. [Google Scholar] [CrossRef]
  40. Hou, W.H.; Chen, Y.S.; Guo, C.X.; Yan, Q.J. Synthesis of porous chromia-pillared tetratitanate. J. Solid State Chem. 1998, 136, 320–321. [Google Scholar] [CrossRef]
  41. Liu, Z.-H.; Ooi, K.; Kanoh, H.; Tang, W.-P.; Tomida, T. Swelling and delamination behaviors of birnessite-type manganese oxide by intercalation of tetraalkylammonium ions. Langmuir 2000, 16, 4154–4164. [Google Scholar] [CrossRef]
  42. Allen, M.R.; Thibert, A.; Sabio, E.M.; Browning, N.D.; Larsen, D.S.; Osterloh, F.E. Evolution of physical and photocatalytic properties in the layered titanates A2Ti4O9 (A = K, H) and nanosheets derived by chemical exfoliation. Chem. Mater. 2010, 22, 1220–1228. [Google Scholar] [CrossRef]
  43. Pal, S.; Laera, A.M.; Licciulli, A.; Catalano, M.; Taurino, A. Biphase TiO2 microspheres with enhanced photocatalytic activity. Ind. Eng. Chem. Res. 2014, 53, 7931–7938. [Google Scholar] [CrossRef]
  44. Liu, S.W.; Yu, J.G.; Jaroniec, M. Tunable photocatalytic selectivity of hollow TiO2 microspheres composed of anatase polyhedral with exposed {001} facets. J. Am. Chem. Soc. 2010, 132, 11914–11916. [Google Scholar] [CrossRef]
  45. Yang, W.G.; Wang, Y.L.; Shi, W.M. One-step synthesis of single-crystal anatase TiO2 tetragonal faceted-nanorods for improved-performance dye-sensitized solar cells. CrystEngComm 2012, 14, 230–234. [Google Scholar] [CrossRef]
  46. Zuo, F.; Dillon, R.J.; Wang, L.; Smith, P.; Zhao, X.; Bardeen, C.; Feng, P. Active facets on titanium(III)-doped TiO2: A effective strategy to improve the visible-light photocatalytic. Angew. Chem., Int. Ed. 2012, 51, 6223–6226. [Google Scholar] [CrossRef]
  47. Liu, B.; Khare, A.; Aydil, E.S. TiO2-B/anatase core-shell heterojunction nanowires for photocatalysis. ACS Appl. Mater. Inter. 2011, 3, 4444–4450. [Google Scholar] [CrossRef]
  48. Wu, T.X.; Liu, G.M.; Zhao, J.C. Photoassisted degradation of dye pollutants. v. self-photosensitized oxidative transformation of rhodamine B under visible light irradiation in aqueous TiO2 dispersions. J. Phys. Chem. B 1998, 102, 5845–5851. [Google Scholar] [CrossRef]
  49. Zhang, T.; Oyama, T.; Aoshima, A.; Hidaka, H.; Zhao, J.; Serpone, N. Photooxidative N-demethylation of methylene blue in aqueous TiO2 dispersions under UV irradiation. J. Photochem. Photobiol. A Chem. 2001, 140, 163–172. [Google Scholar] [CrossRef]
  50. Liu, X.; Li, Y.; Deng, D.; Chen, N.; Xing, X.; Wang, Y. A one-step nonaqueous sol–gel route to mixed-phase TiO2 with enhanced photocatalytic degradation of rhodamine B under visible light. CrystEngComm. 2016, 18, 1964–1975. [Google Scholar] [CrossRef]
  51. Zhang, H.M.; Liu, P.R.; Li, F.; Liu, H.W.; Wang, Y.; Zhang, S.Q.; Guo, M.X.; Cheng, H.M.; Zhao, H.J. Facile fabrication of anatase TiO2 microspheres on solid substrates and surface crystal facet transformation from {001} and {100}. Chem. Eur. J. 2011, 17, 5949–5957. [Google Scholar] [CrossRef] [PubMed]
  52. Fu, W.W.; Li, G.D.; Wang, Y.; Zeng, S.J.; Yan, Z.J.; Wang, J.W.; Xin, S.G.; Zhang, L.; Wu, S.W.; Zhang, Z.T. Facile formation of mesoporous structured mixed-phase (anatase/rutile) TiO2 with enhanced visible light photocatalytic activity. Chem. Commun. 2018, 54, 58–61. [Google Scholar] [CrossRef] [PubMed]
  53. Hu, D.W.; Zhang, W.X.; Tanaka, Y.; Kusunose, N.; Peng, Y.; Feeng, Q. Mesocrystalline nanocomposition of TiO2 polymorphs: Topochemical mesocrystal conversion, characterization, and photocatalytic response. Cryst. Growth Des. 2015, 15, 1214–1225. [Google Scholar] [CrossRef]
  54. Du, Y.-E.; Bai, Y.; Liu, Y.F.; Guo, Y.Q.; Cai, X.M.; Feng, Q. One-pot synthesis of [111]-/{010} facets coexisting anatase nanocrystals with enhanced dye-sensitized solar cell performance. ChemistrySelect 2016, 1, 6632–6640. [Google Scholar] [CrossRef]
  55. Liu, M.; Piao, L.Y.; Zhao, L.; Ju, S.T.; Yan, Z.J.; He, T.; Zhou, C.L.; Wang, W.J. Anatase TiO2 single crystals with exposed {001} and {110} facets: facile synthesis and enhanced photocatalysis. Chem. Commun. 2010, 46, 1664–1666. [Google Scholar] [CrossRef] [PubMed]
  56. Wen, P.H.; Xue, M.; Ishikawa, Y.; Itoh, H.; Feng, Q. Relationships between cell parameters of dye-sensitized solar cells and dye-adsorption parameters. ACS Appl. Mater. Interfaces 2012, 4, 1928–1934. [Google Scholar] [CrossRef] [PubMed]
  57. Wang, H.E.; Zheng, L.X.; Liu, C.P.; Liu, Y.K.; Luan, C.Y.; Cheng, H.; Li, Y.Y.; Martinu, L.; Zapien, J.A.; Bello, I. Rapid microwave synthesis of porous TiO2 spheres and their applications in dye-sensitized solar cells. J. Phys. Chem. C 2011, 115, 10419–10425. [Google Scholar] [CrossRef]
  58. Chen, J.Z.; Li, B.; Zheng, J.F.; Jia, S.P.; Zhao, J.H.; Jing, H.W.; Zhu, Z.P. Role of one-dimensional ribbonlike nanostructures in dye-sensitized TiO2-based solar cells. J. Phys. Chem. C 2011, 115, 7104–7113. [Google Scholar] [CrossRef]
  59. Chen, C.D.; Sewvandi, G.A.; Kusunose, T.; Tanaka, Y.; Nakanishi, S.; Feng, Q. Synthesis of {010}-faceted anatase TiO2 nanoparticles from layered titanate for dye-sensitized solar cells. CrystEngComm 2014, 16, 8885–8895. [Google Scholar] [CrossRef]
  60. Du, Y.-E.; Feng, Q.; Chen, C.D.; Tanaka, Y.; Yang, X.J. Photocatalytic and dye-sensitized solar cell performances of {010}-faceted and [111]-faceted anatase TiO2 nanocrystals synthesized from tetratitanate nanoribbons. ACS Appl. Mater. Interfaces 2014, 6, 16007–16019. [Google Scholar] [CrossRef]
Figure 1. X-ray diffraction (XRD) patterns of (a) Li2TiO3, (b) H2TiO3, and (c) TMA+-intercalated H2TiO3 samples; and (d) structural model of Li2TiO3 viewed in the a axis and c axis directions.
Materials 12 03614 g001
Figure 2. Field-emission (FE)SEM images of (a) Li2TiO3, and (b,c) H2TiO3.
Materials 12 03614 g002
Figure 3. Changes in the crystal form of titanium dioxide with temperature and pH value.
Materials 12 03614 g003
Figure 4. Evolution of the XRD patterns of the TiO2 nanocrystal samples synthesized at various pH values with the indicated lattice phases of () anatase and the () rutile phases.
Materials 12 03614 g004
Figure 5. (a) TEM and (b–d) high-resolution (HR)TEM images of (a–d) pH1.5-T175 and (e–h) HRTEM images of pH2.5-T175 samples prepared by microwave-assisted hydrothermal treatment of the exfoliated H2TiO3 nanosheet colloidal solution at 175 °C with a reaction time of 2 h.The insets in (c,e,g,h) are fast-Fourier-transform (FFT) diffraction patterns.
Materials 12 03614 g005
Figure 6. (a,b) TEM images and (c–f) corresponding HRTEM images of the pH4.5-T175 sample prepared by microwave-assisted hydrothermal treatment of the exfoliated H2TiO3 nanosheet colloidal solution at 175 °C with a reaction time of 2 h.
Materials 12 03614 g006
Figure 7. (a,c) TEM images and (b,d) corresponding HRTEM images of the pH6.5-T175 sample derived from microwave-assisted hydrothermal treatment of the exfoliated H2TiO3 nanosheet colloidal solution at 175 °C with a reaction time of 2 h.
Materials 12 03614 g007
Figure 8. (a,c,e) TEM images and (b,d,f) corresponding HRTEM images of the pH8.5-T175 sample derived from microwave-assisted hydrothermal treatment of the exfoliated H2TiO3 nanosheet colloidal solution at 175 °C with a reaction time of 2 h.
Materials 12 03614 g008
Figure 9. FESEM images of TiO2 nanocrystals synthesized under different pH values and temperatures: (a) pH0.5-T155, (b) pH0.5-T165, (c) pH0.5-T175, (d) pH0.5-T185, (e) pH1.0-T175, (f) pH1.5-T175, (g) pH2.5-T165, (h) pH2.5-T175, and (i) pH2.5-T185.
Materials 12 03614 g009
Figure 10. FESEM images of the TiO2 nanocrystals synthesized under different pH values and temperatures: (a) pH4.5-T165, (b) pH4.5-T175, (c) pH4.5-T185, (d) pH6.5-T165, (e) pH6.5-T175, (f) pH6.5-T185, (g) pH8.5-T125, (h) pH8.5-T175, (i) pH10.5-T185, (j) pH12.5-T185, (k) pH13.5-T155, and (l) pH13.5-T175.
Materials 12 03614 g010
Figure 11. Schematic diagramof the formation mechanism of the TiO2 nanocrystals with different morphologies from the exfoliated H2TiO3 nanosheets at different pH values.
Materials 12 03614 g011
Figure 12. (a) UV-Vis spectral changes of the centrifuged methyl orange (MO) solutions at certain intervals during the photodegradation treatment with pH2.5-T180; (b) photocatalysis degradation profiles of MO under UV irradiation; (c) first-order kinetics fitting data for the photodegradation of the MO; (d) degradation amount of MO per unit area of TiO2 nanocrystals.
Materials 12 03614 g012
Figure 13. Current–voltage characteristic curves of dye-sensitized solar cells (DSSCs) fabricated using pH2.5-T175, pH4.5-T175, pH6.5-T175, and P25 samples.
Materials 12 03614 g013
Table 1. specific surface area, average particle size (nm), k, and R2 values of the TiO2 nanocrystals.
SamplesSpecific Surface Area (m2/g)Average Particle Size (nm)Degradation Rate Constant k (min−1)Correlative Coefficient (R2)
pH2.5-T175135.68.30.03460.9502
pH4.5-T17554.813.30.02810.9846
pH6.5-T17532.387.00.00650.9920
P2552.523.90.01870.9971
blank 0.00040.9595
Table 2. Cell performance parameters of DSSCs fabricated using different TiO2 samples.
PhotoelectrodeFilm Thickness (μm)JSC (mA/cm2)VOC (V)FFη (%)
pH2.5-T17519.1713.190.7010.5955.50
pH4.5-T17520.0312.320.7040.5564.83
pH6.5-T17519.118.220.7150.6223.66
P2520.4010.730.6930.5544.12

