The Effect of Shear Deformation on Permeability of 2.5D Woven Preform

Abstract
1. Introduction
2. Materials and Methods
2.1. Experimental Materials
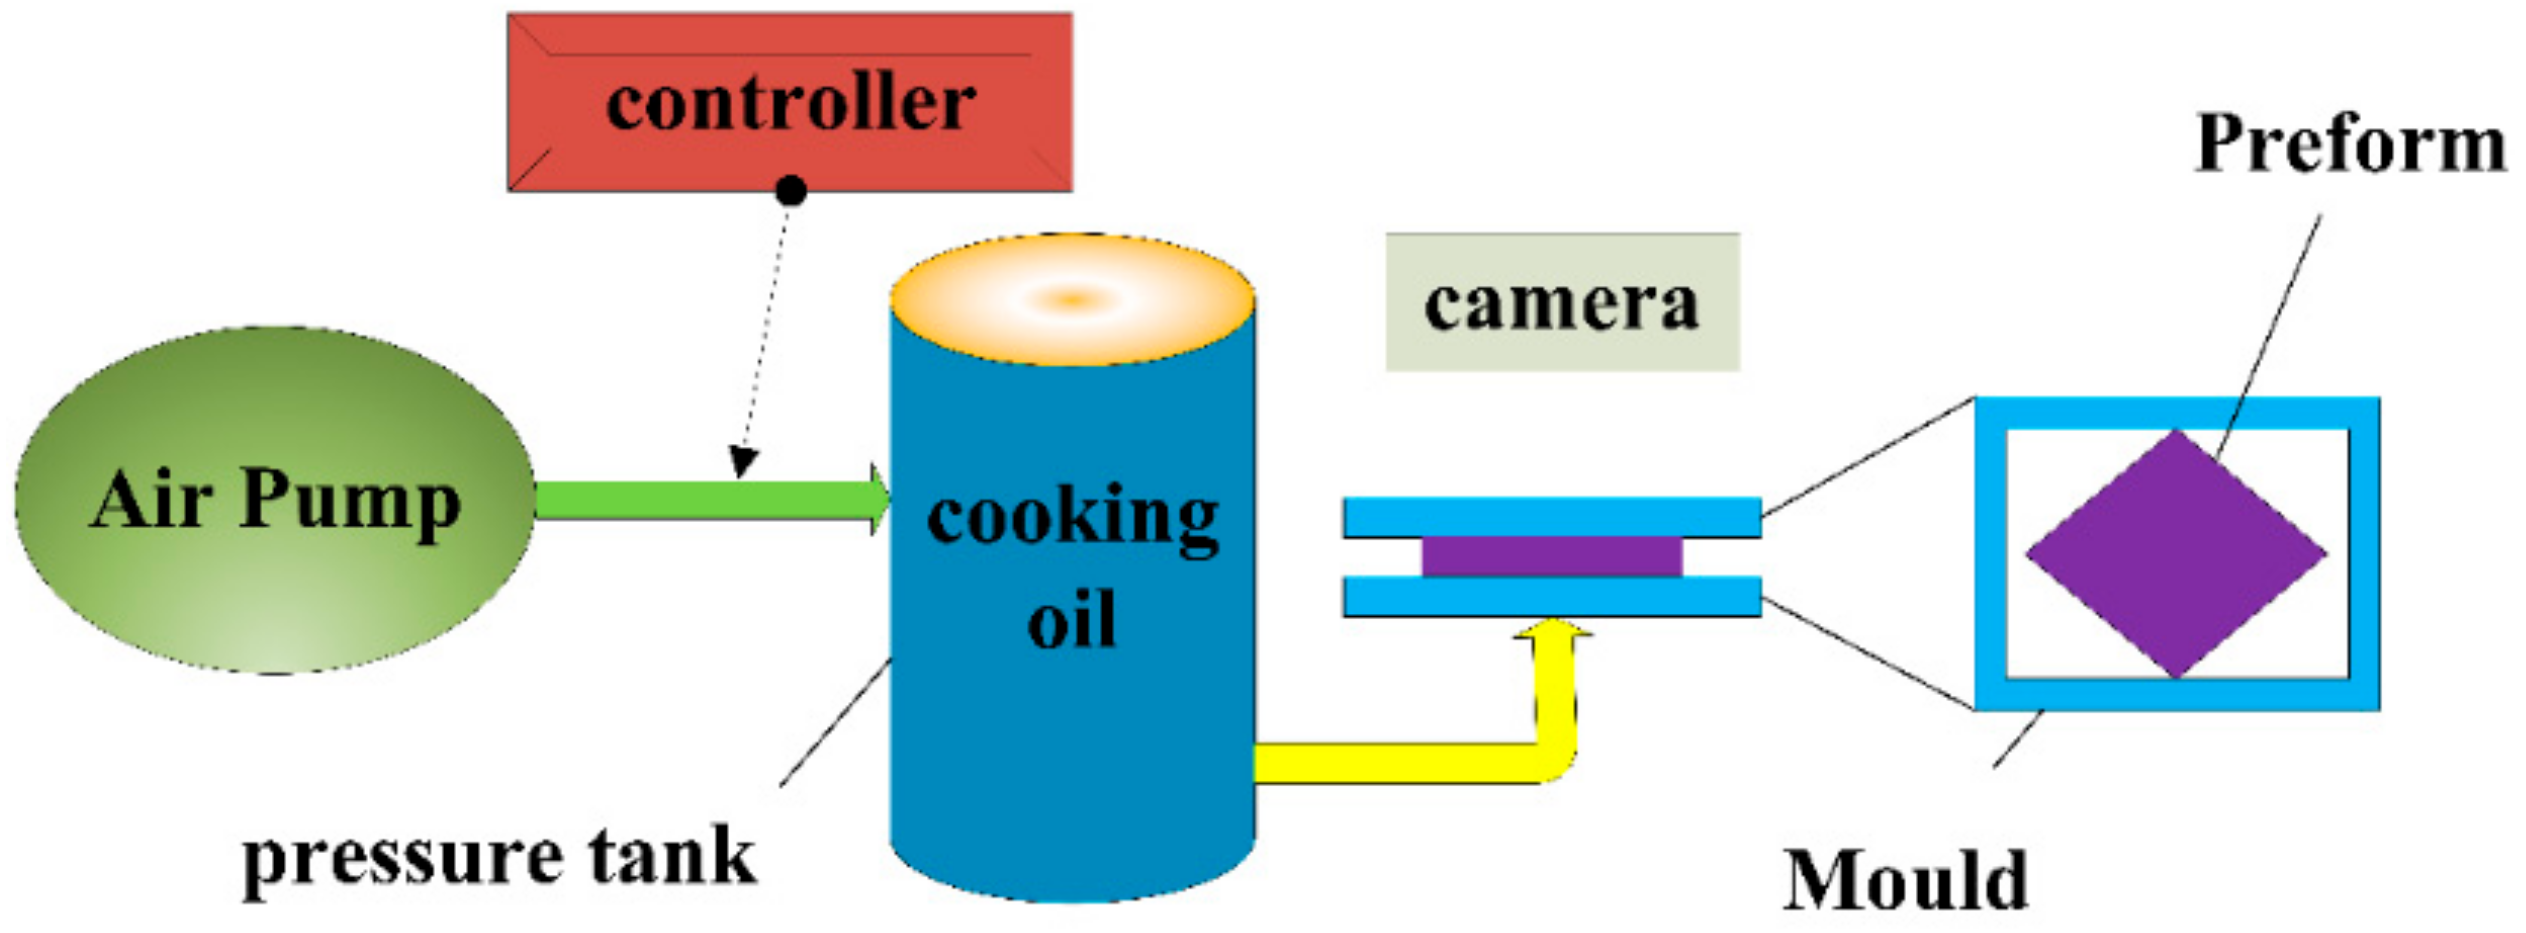
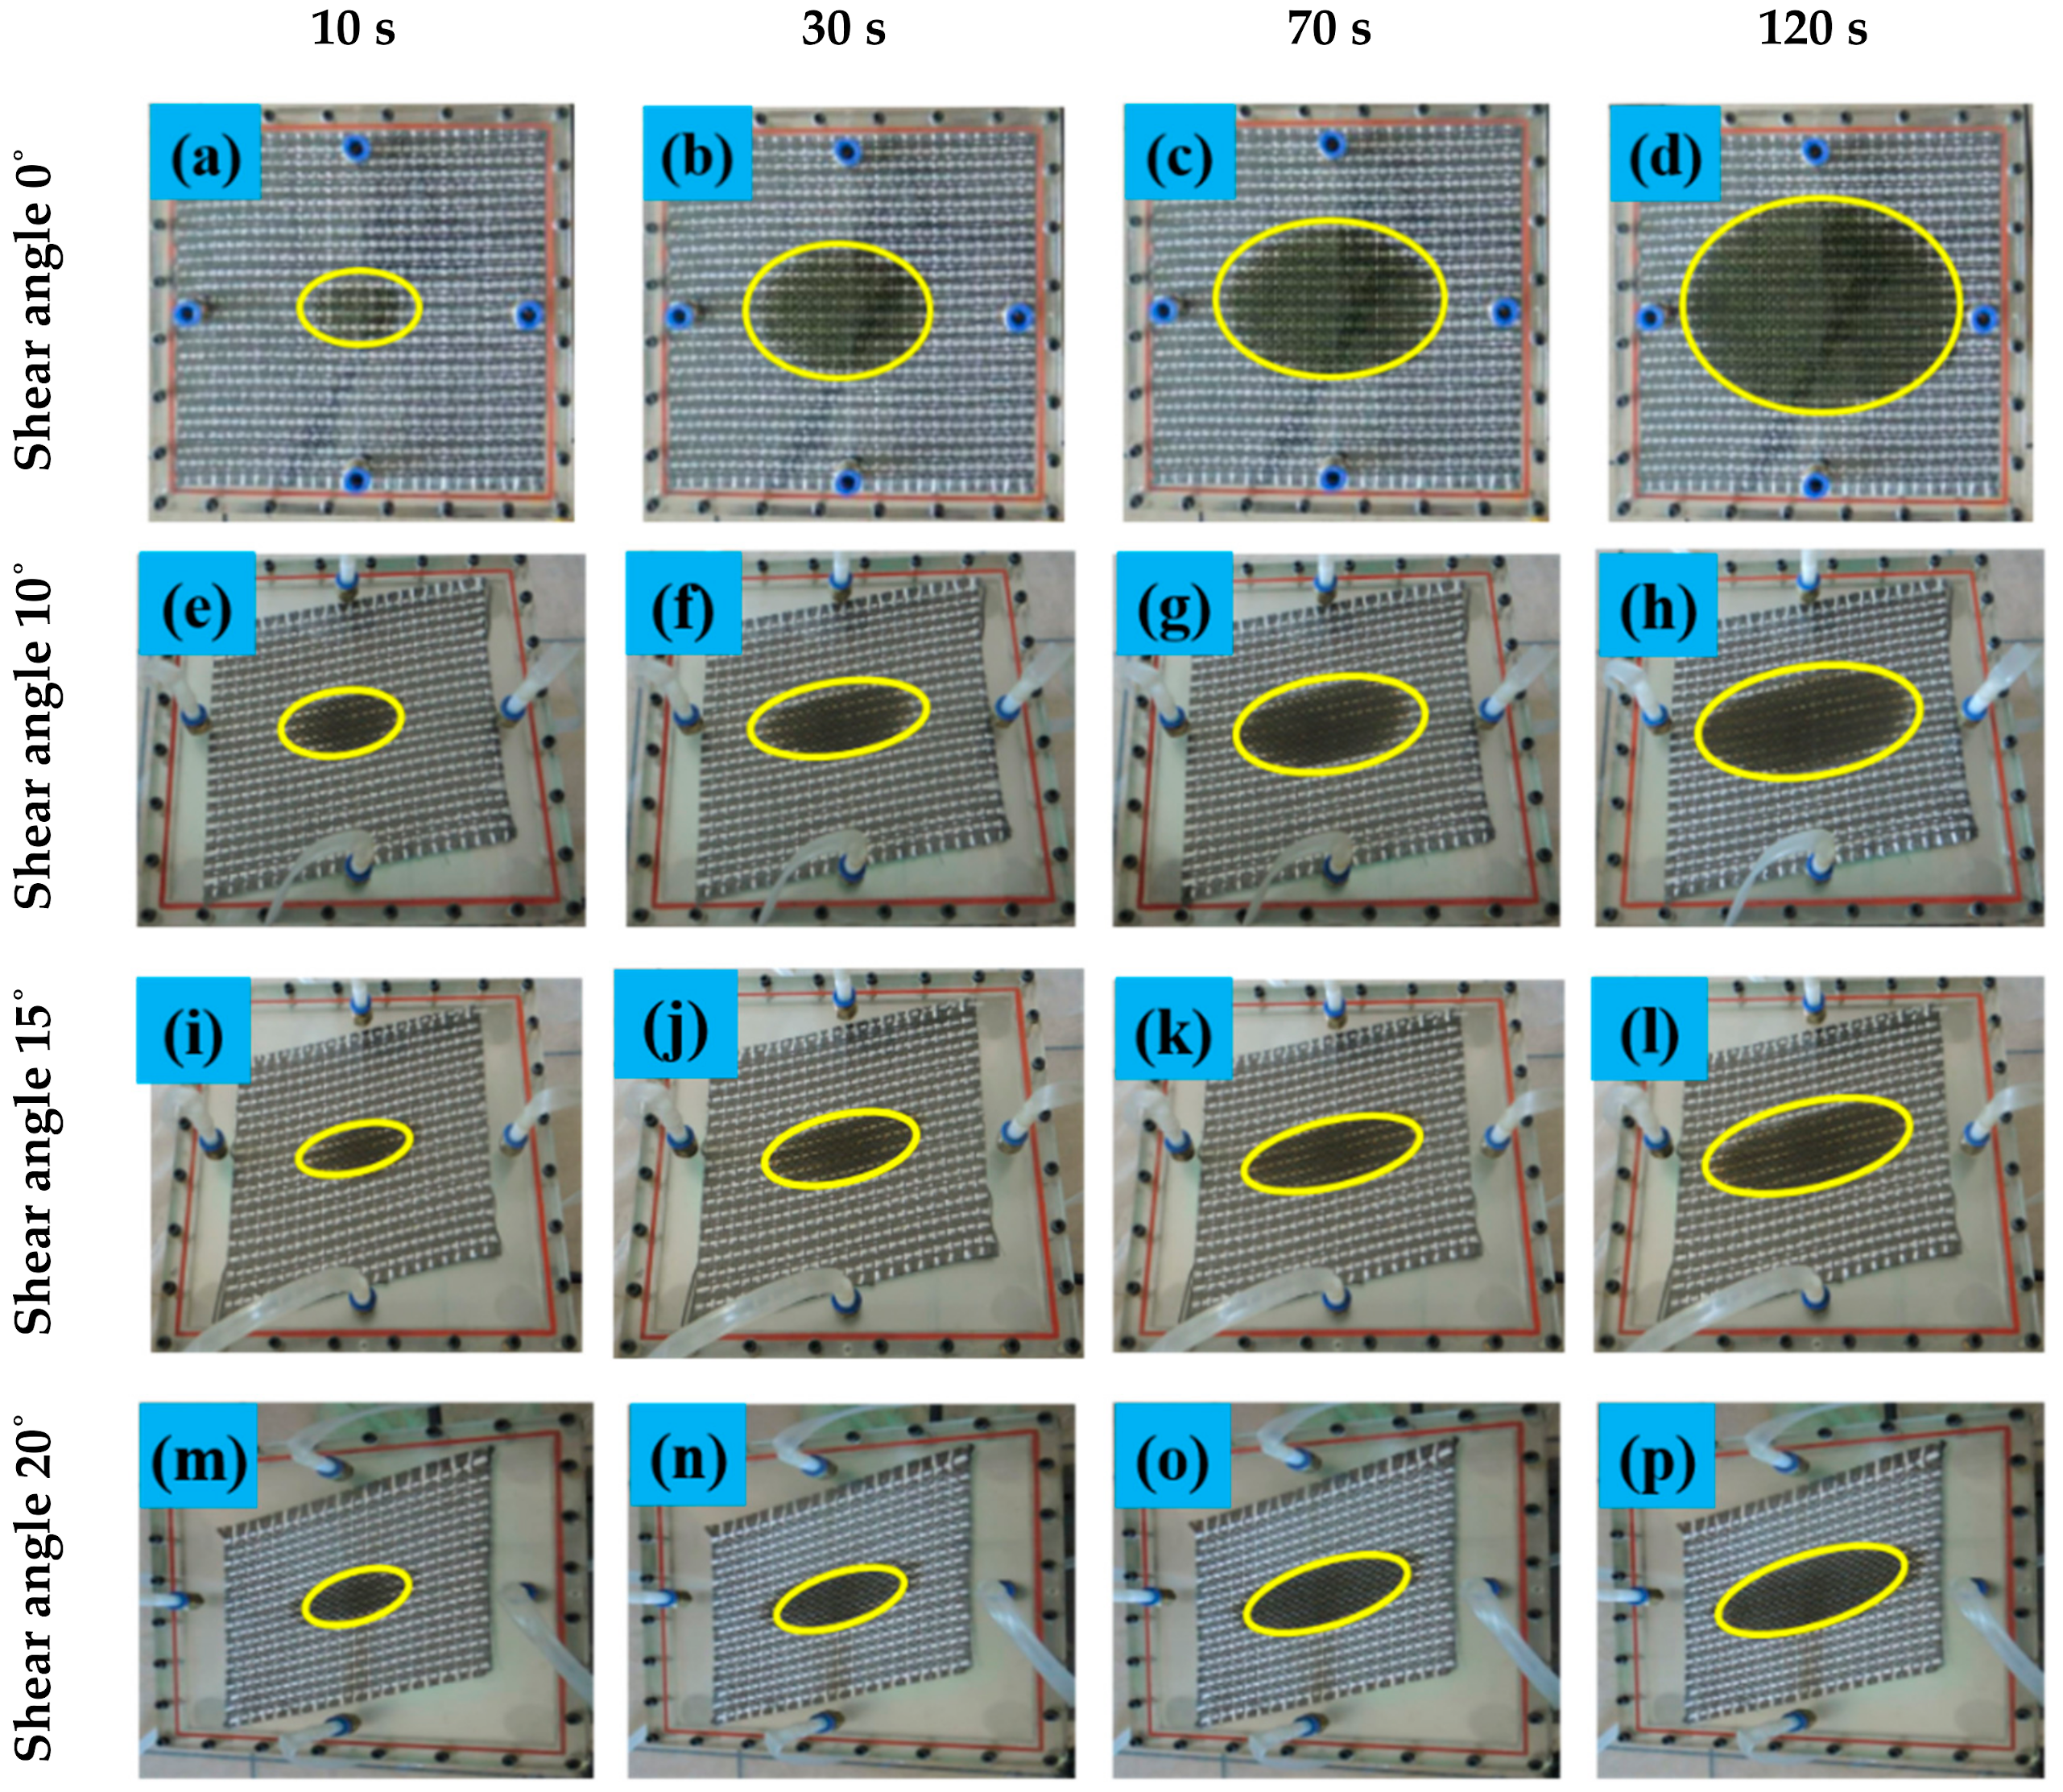
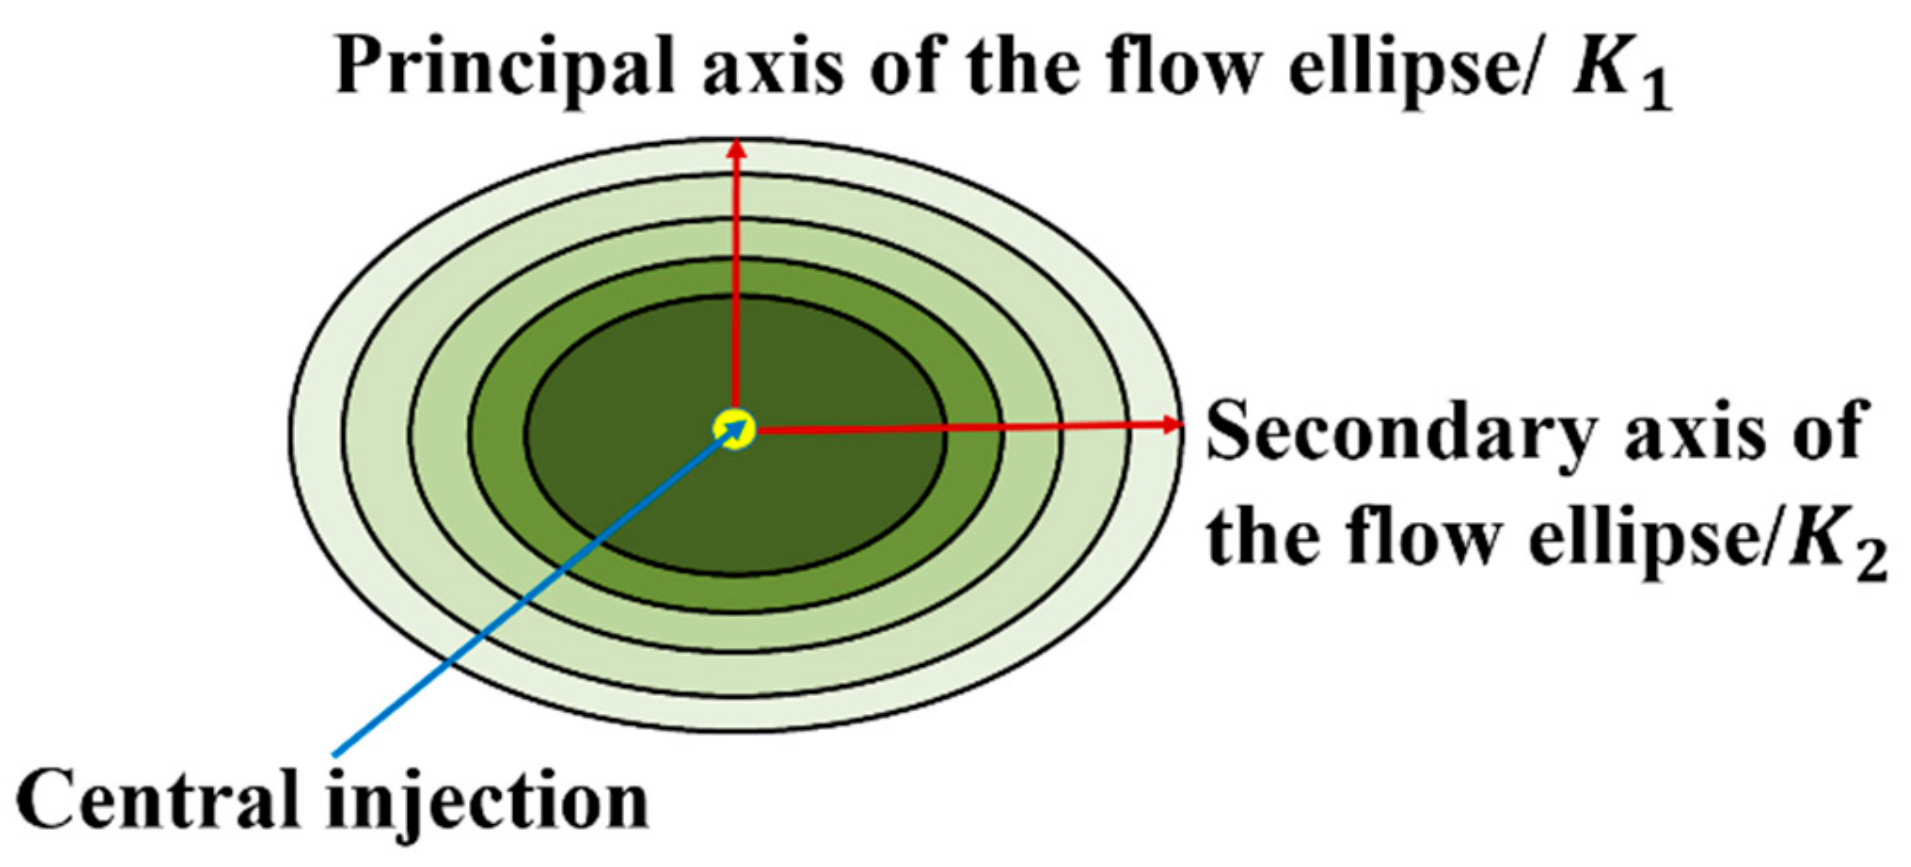
2.2. Radial Flow Permeability Measurements
3. Results and Discussion
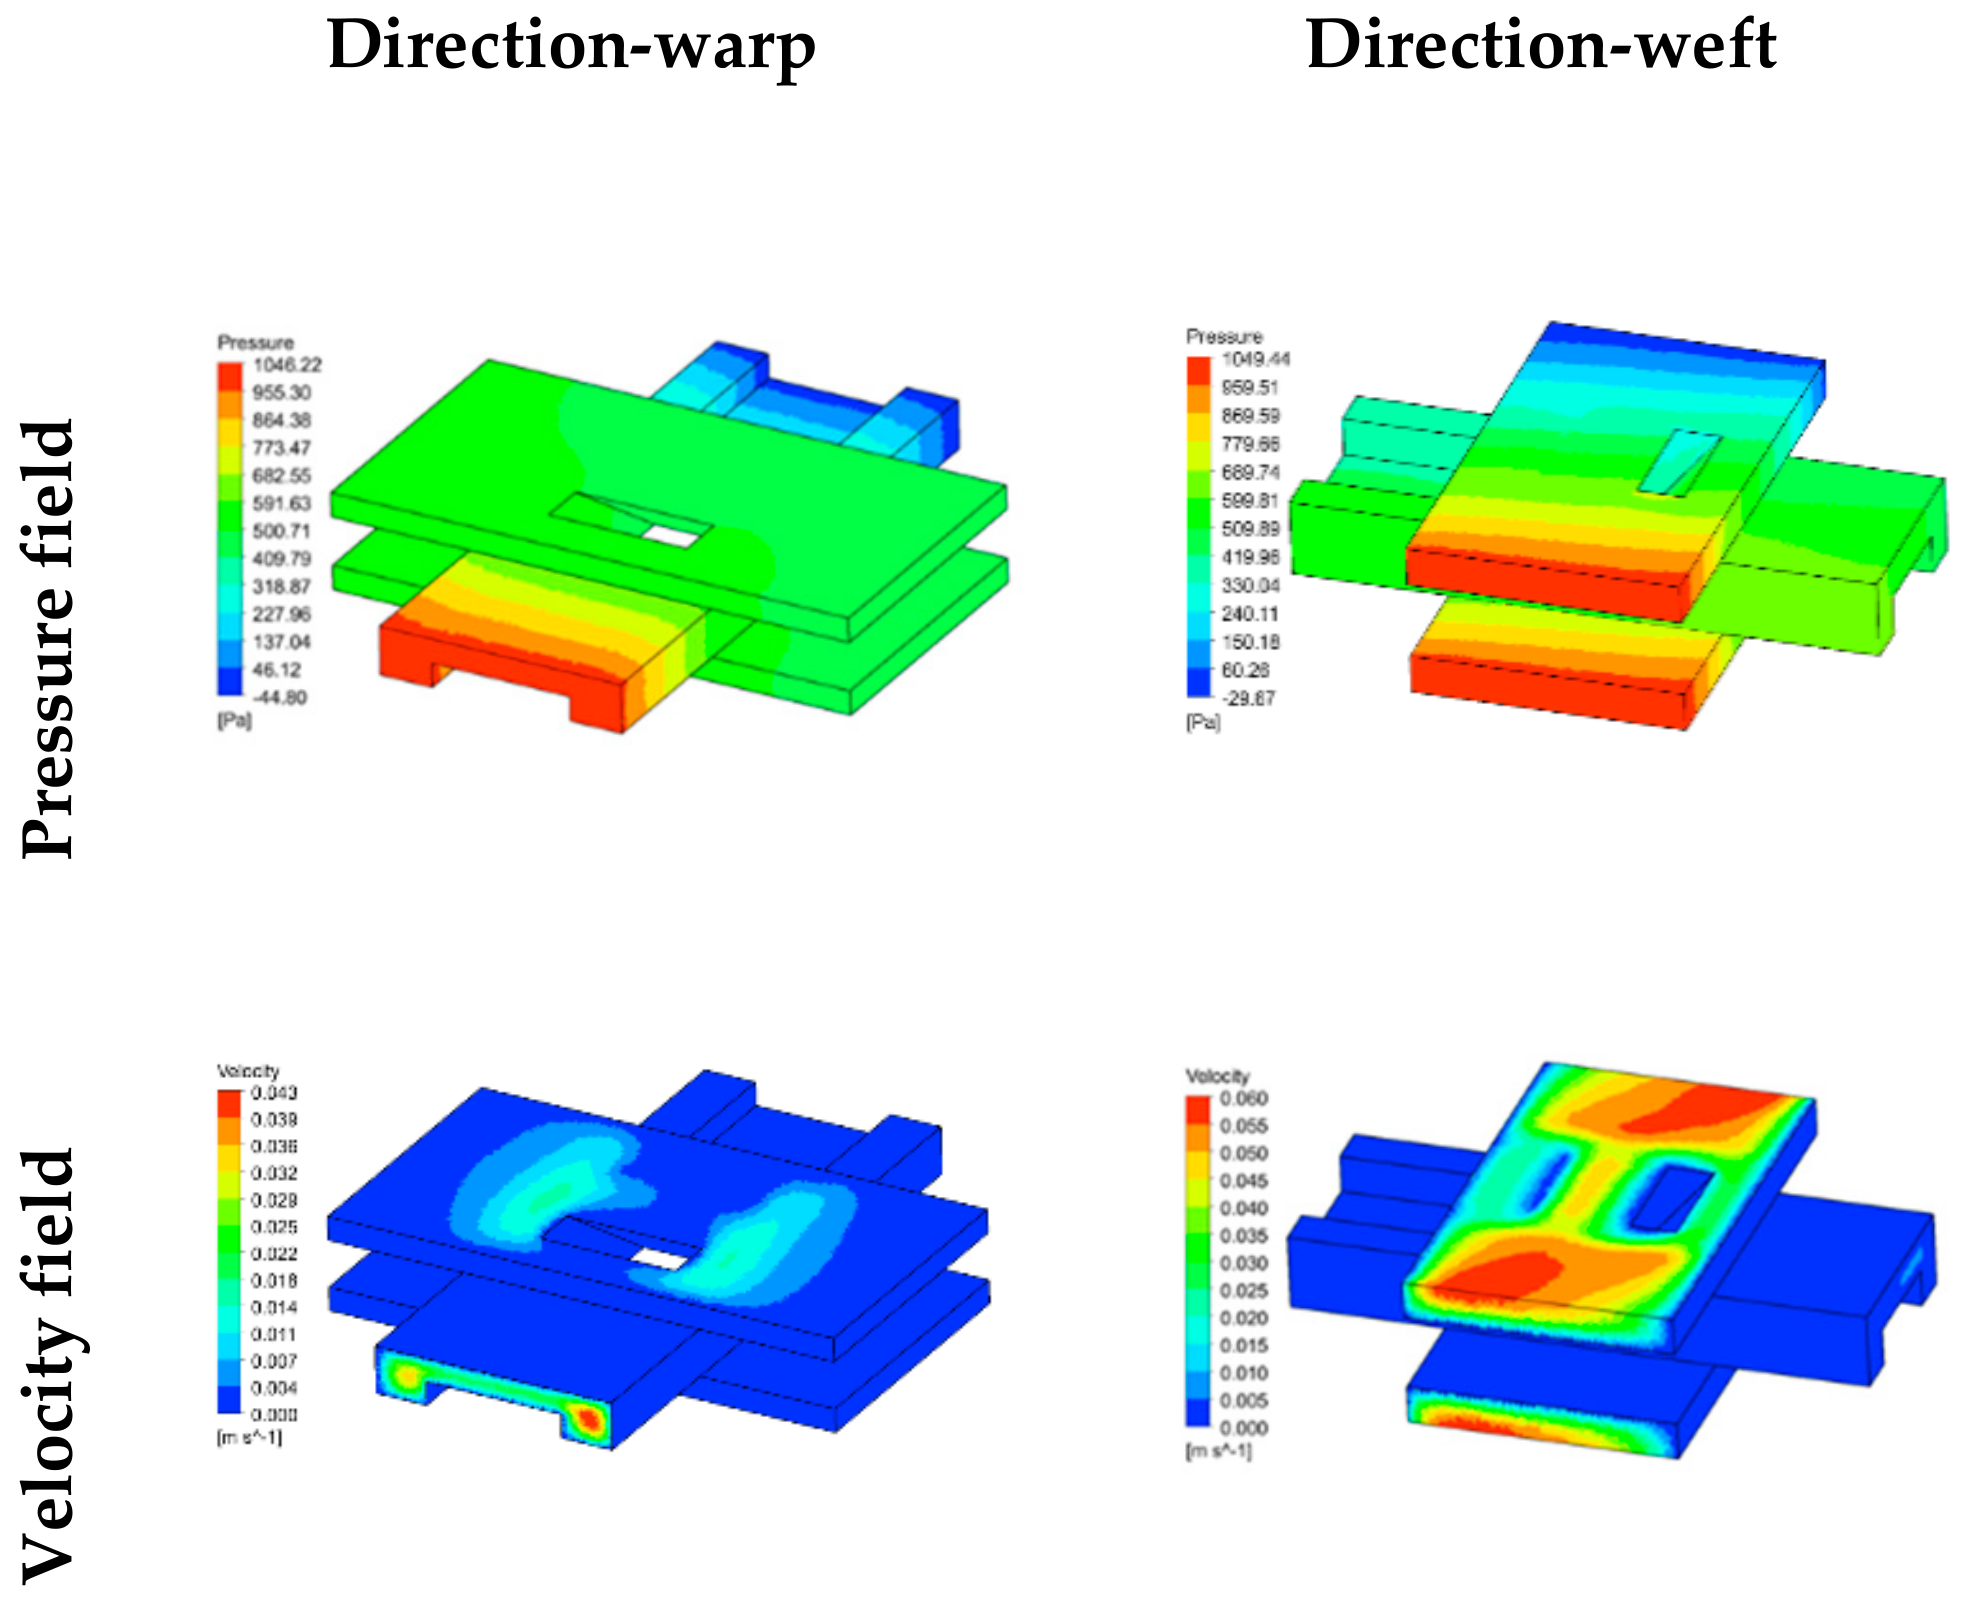
3.1. Simulation Analysis
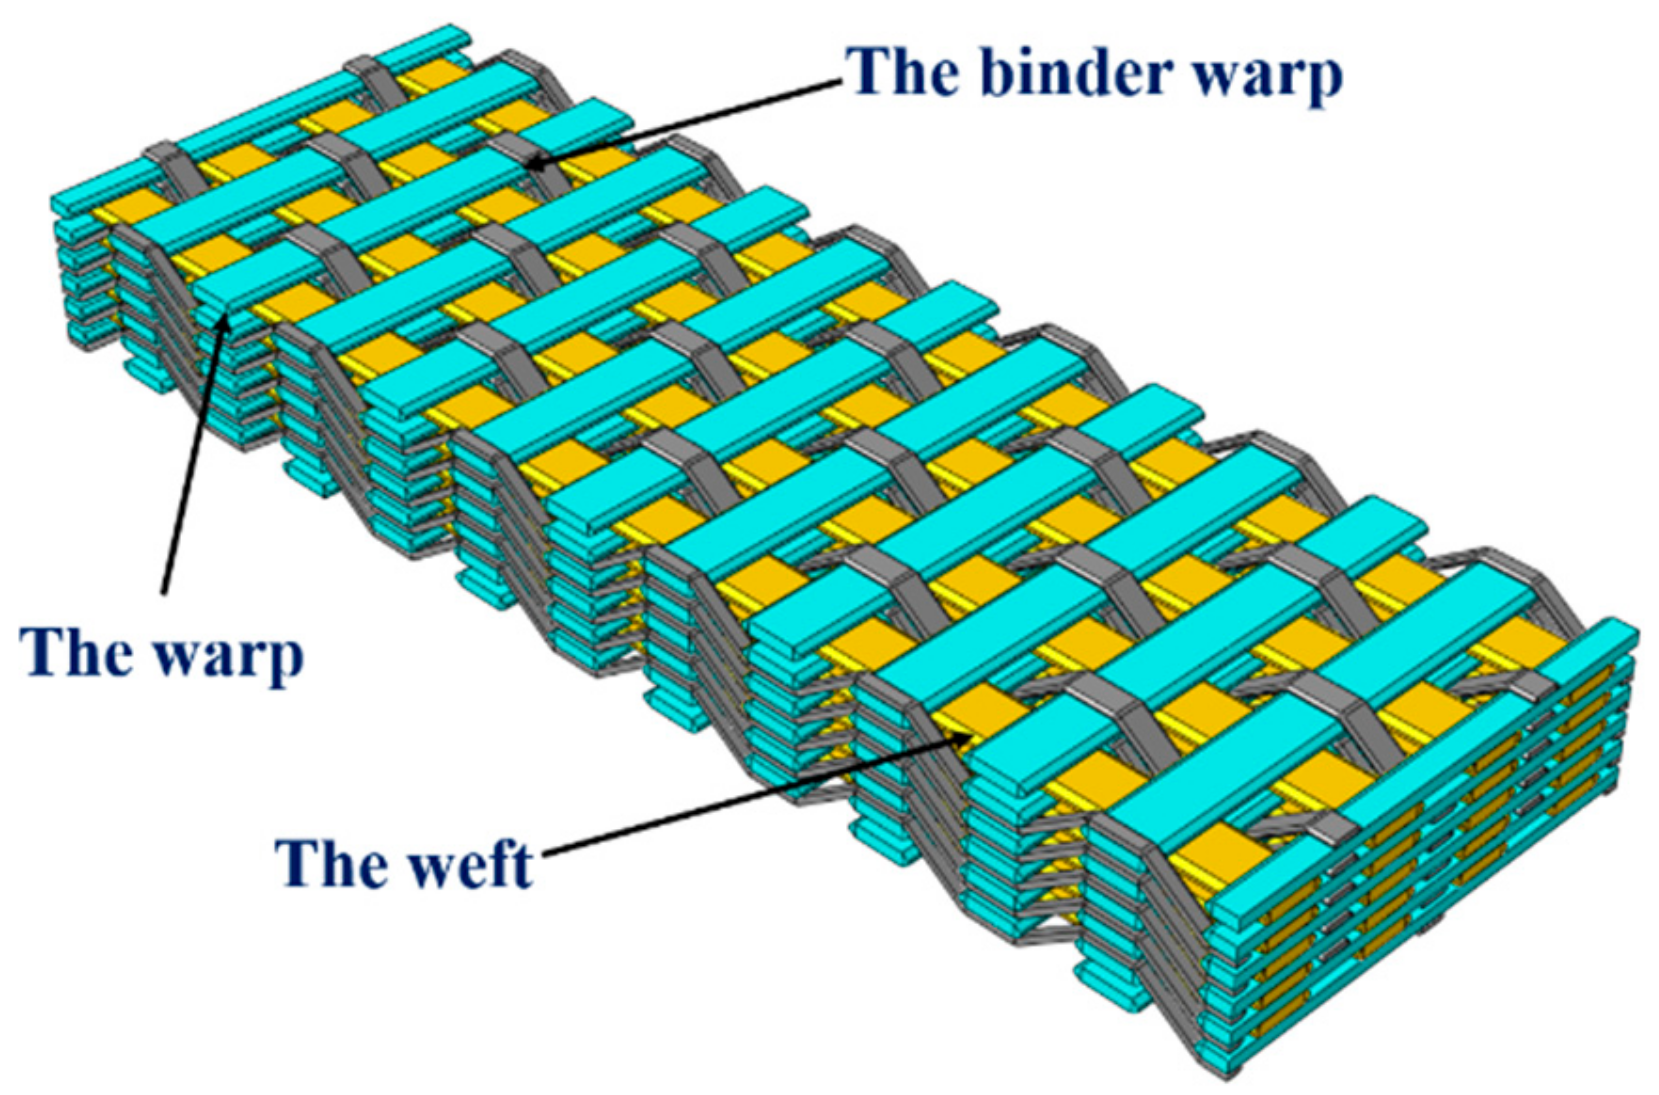
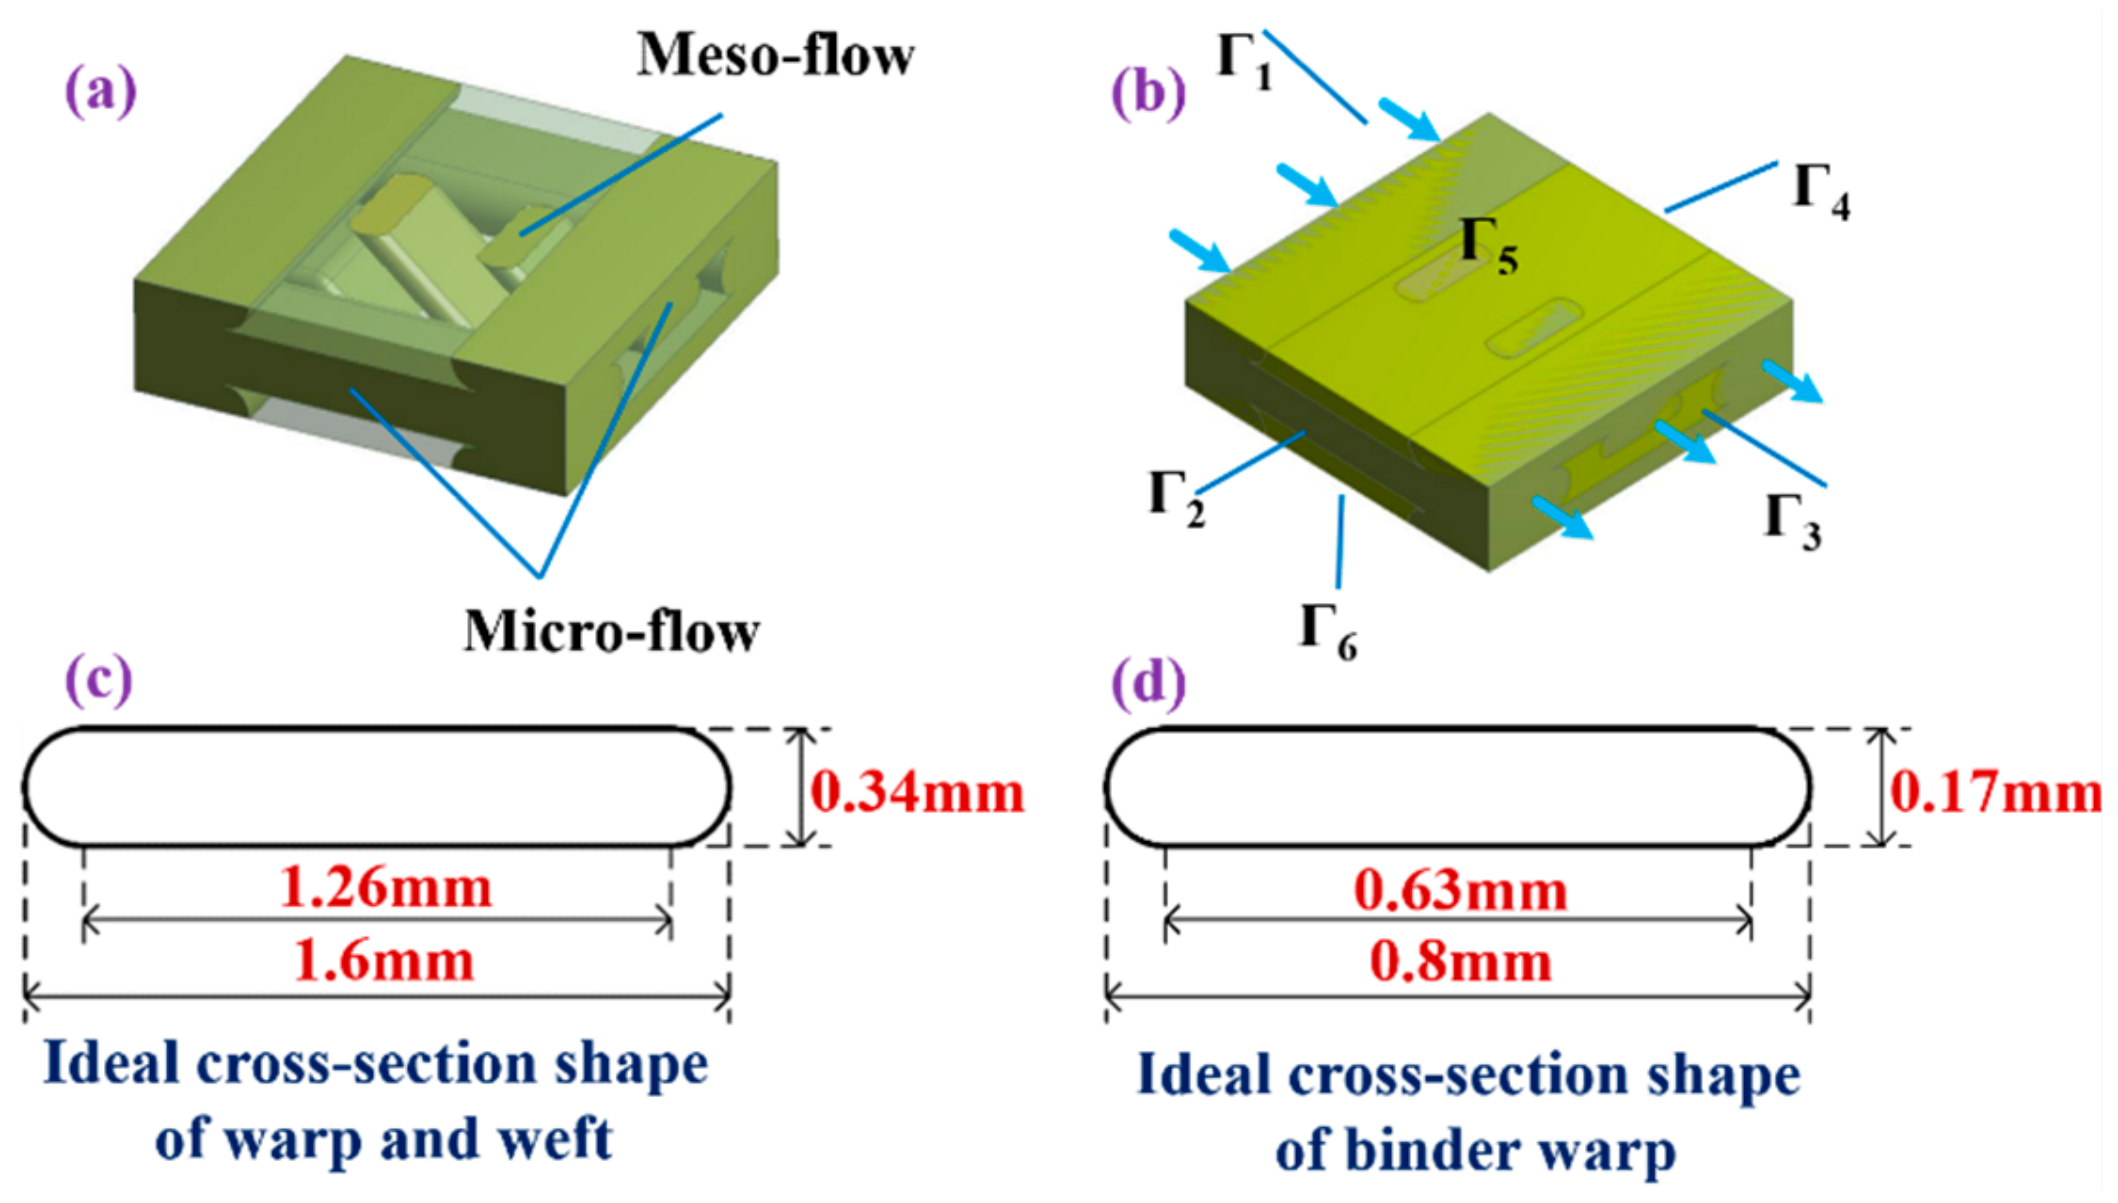
3.1.1. Unit Cell Model with Shear Deformation
3.1.2. Boundary Conditions and Permeability Calculation
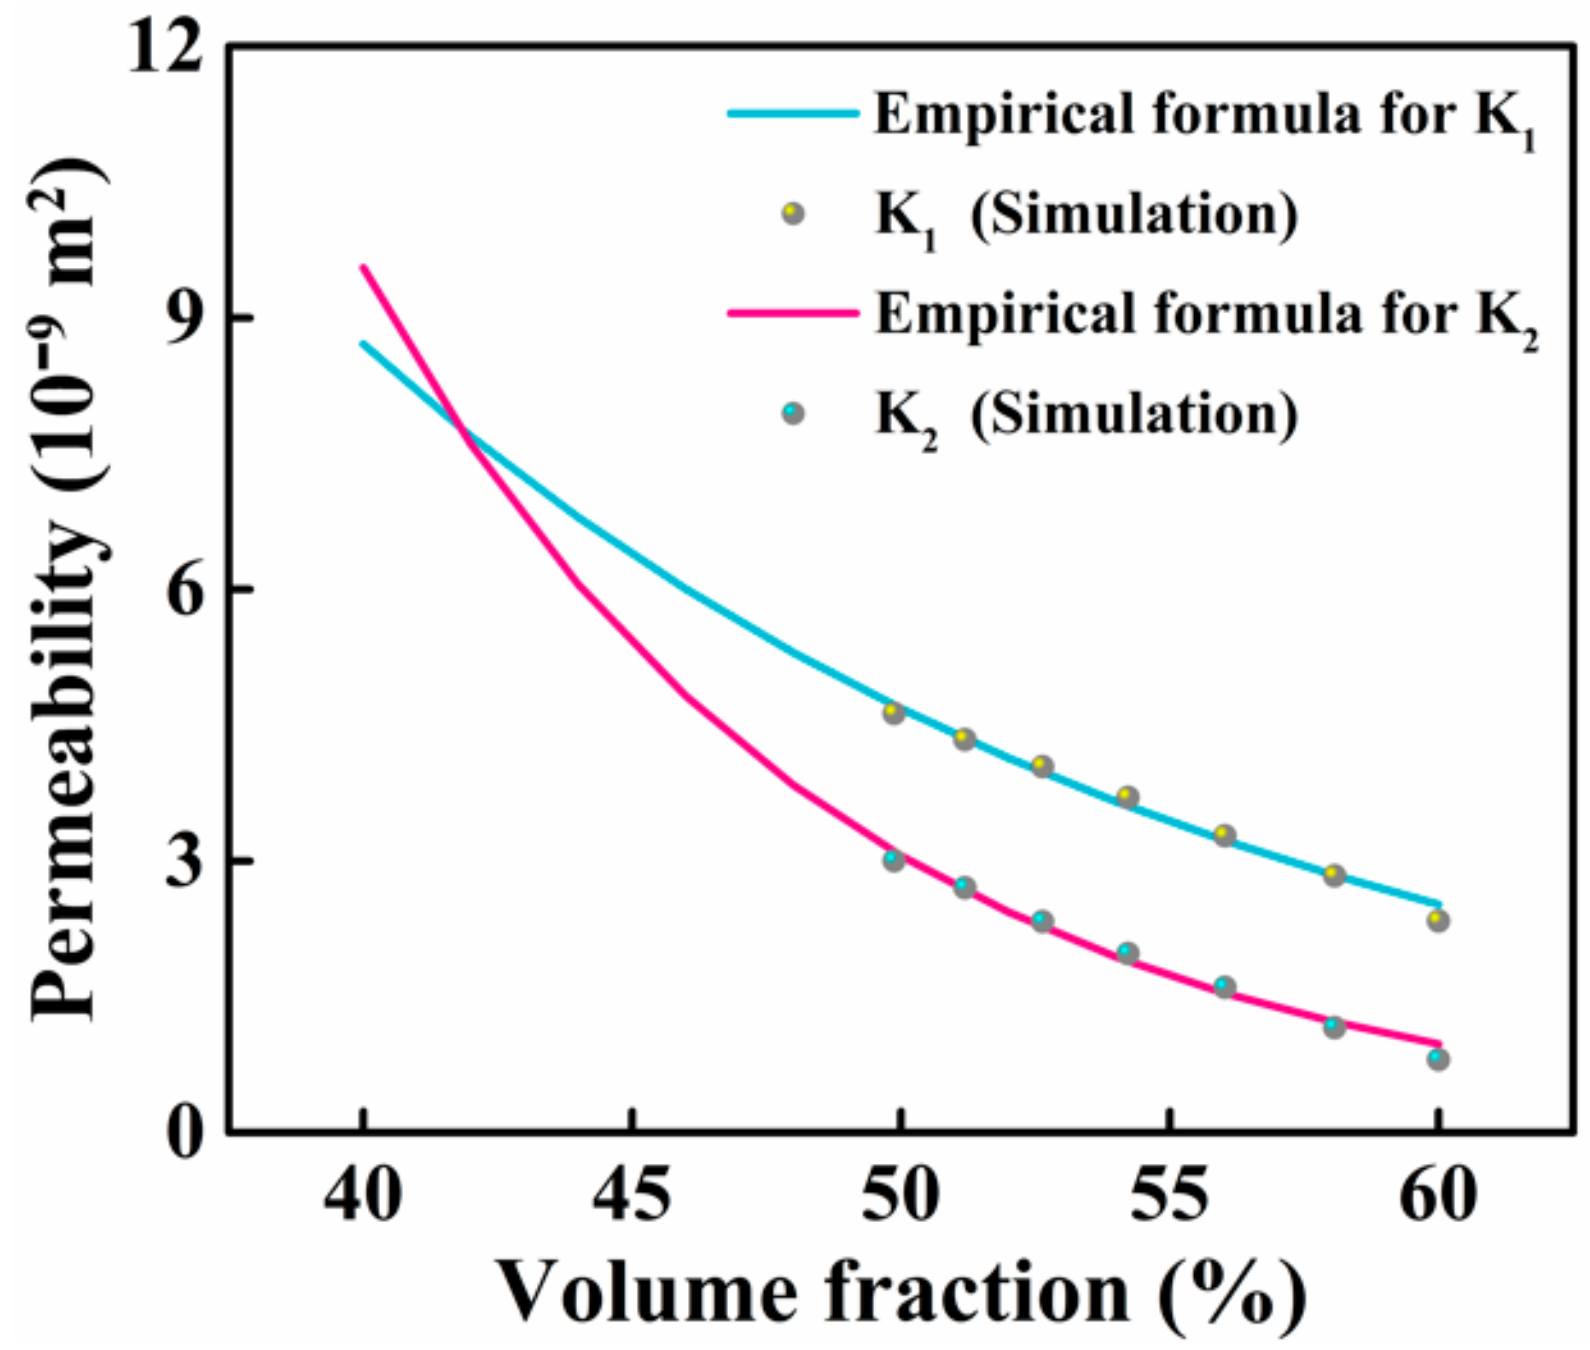
3.2. Corrected Empirical Formula
3.3. Prediction
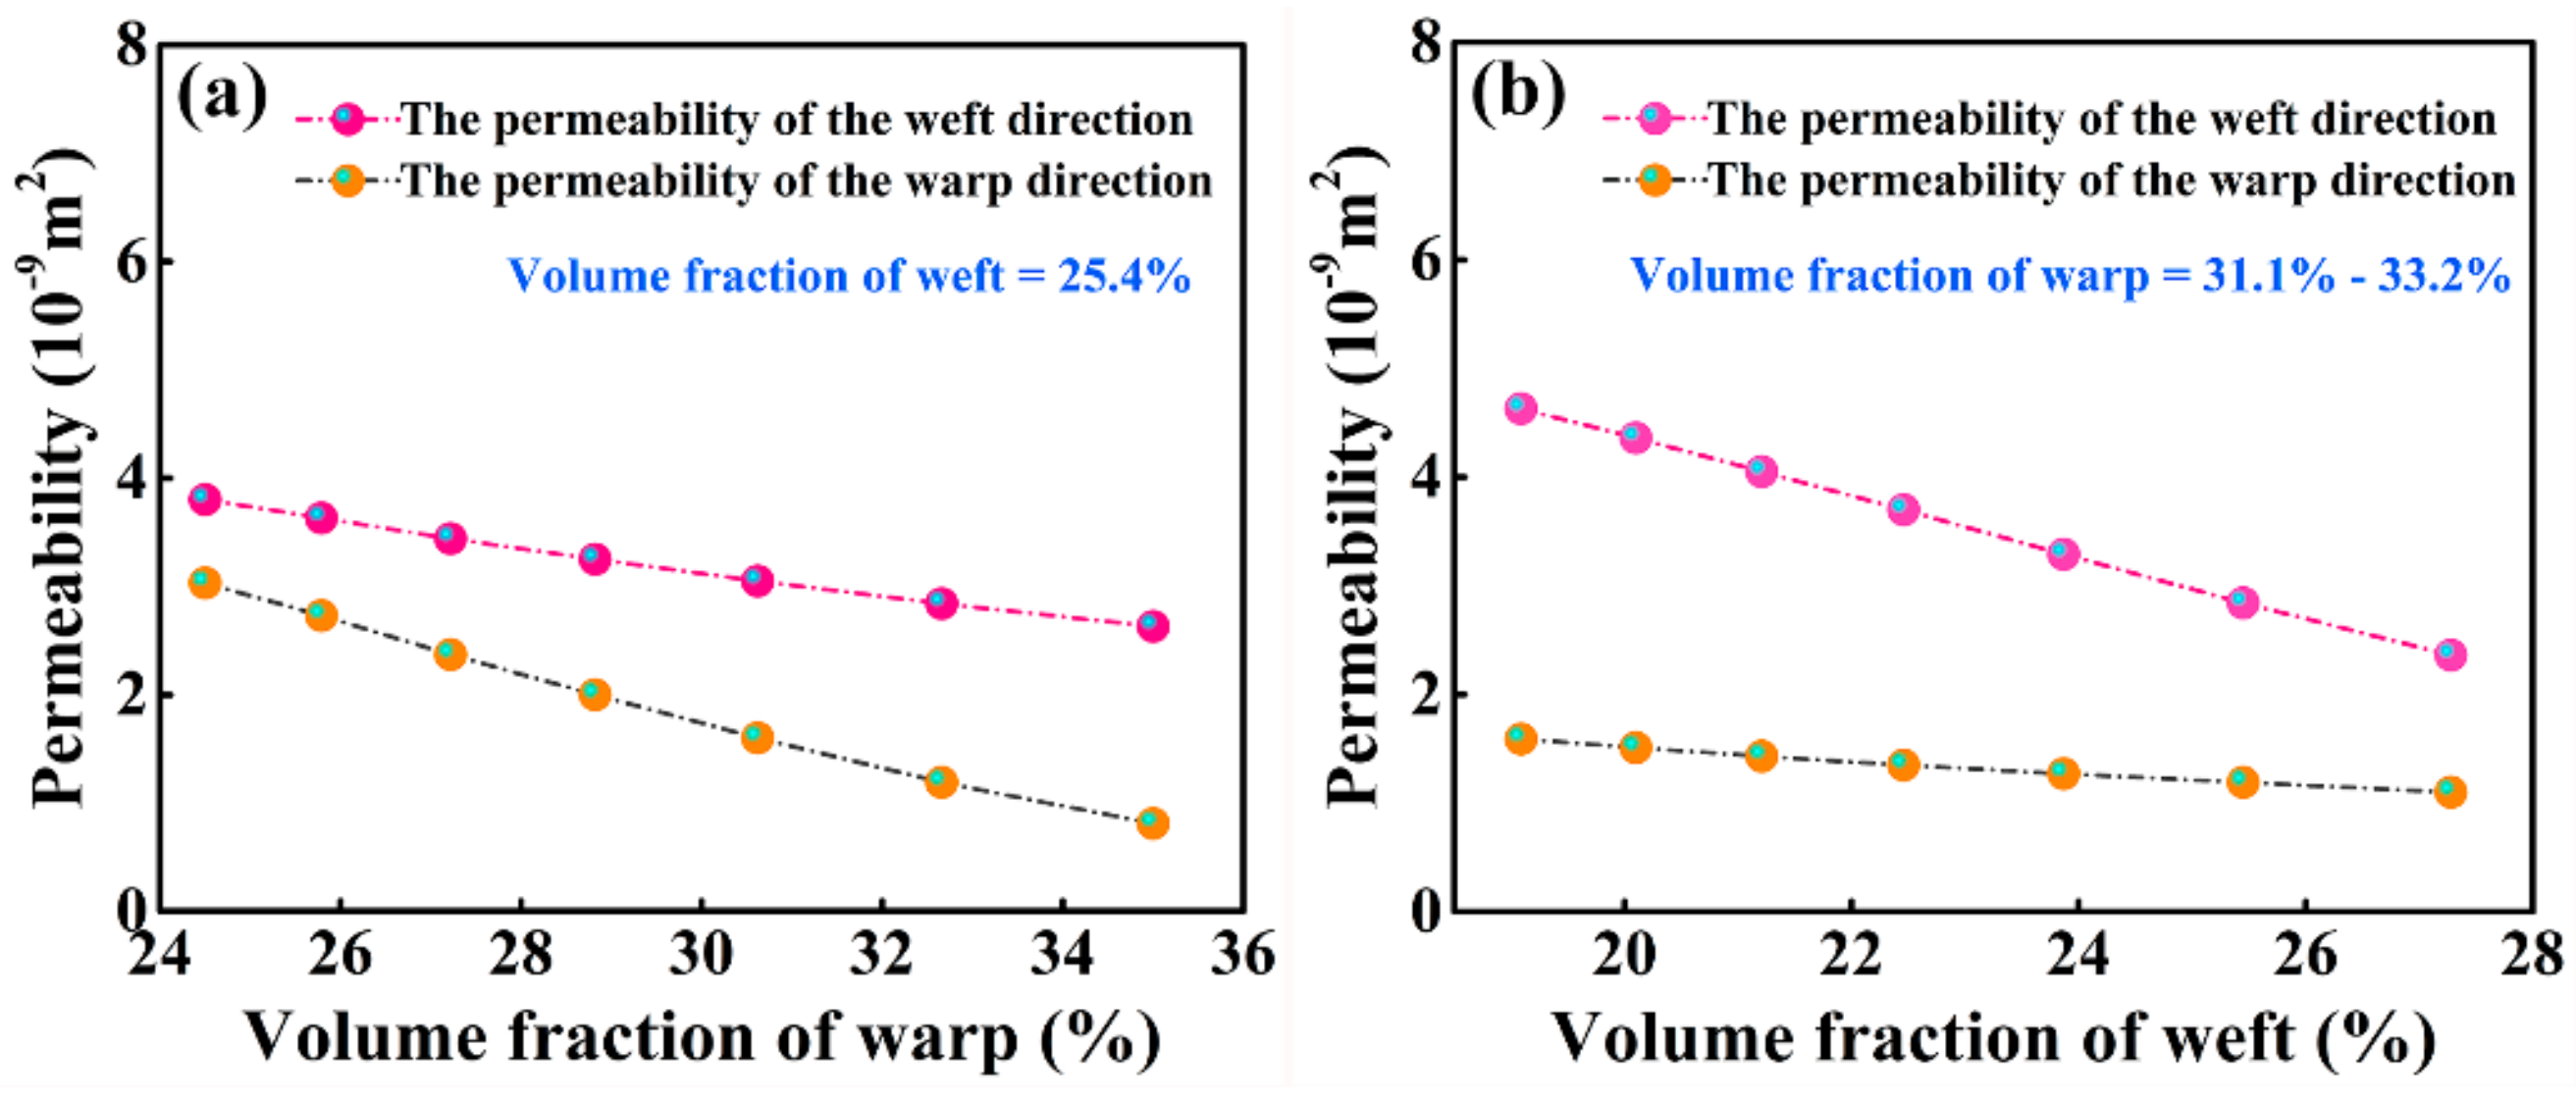
3.3.1. Effect of Fiber Volume Fraction on Permeability
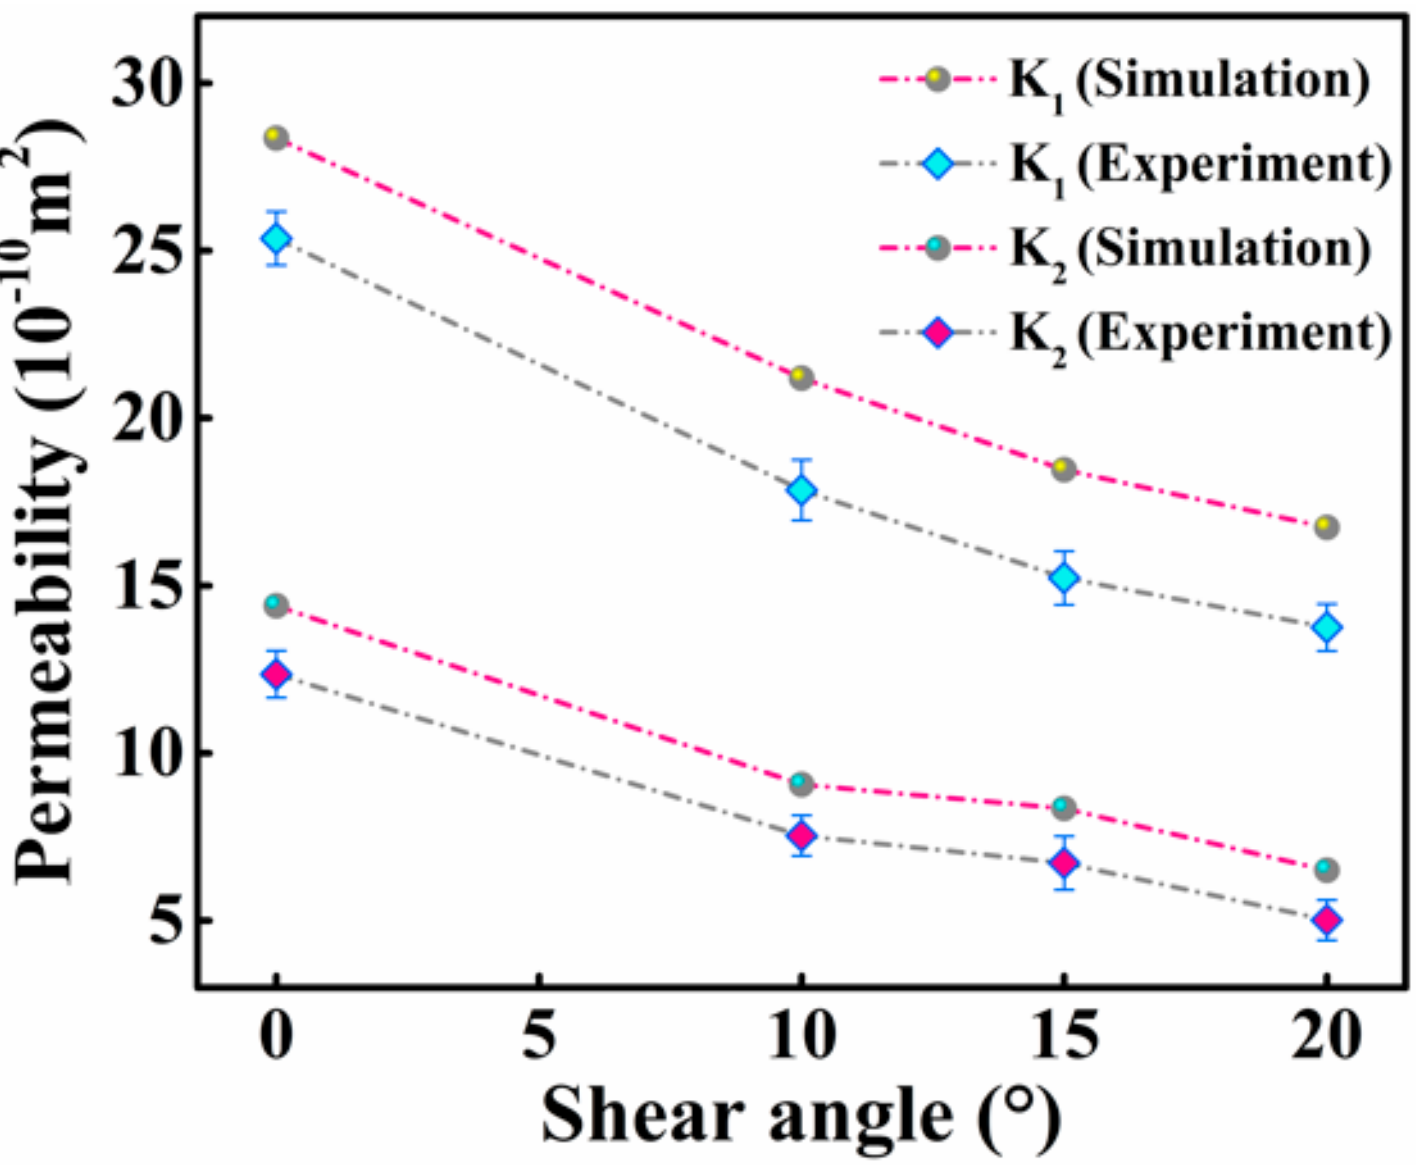
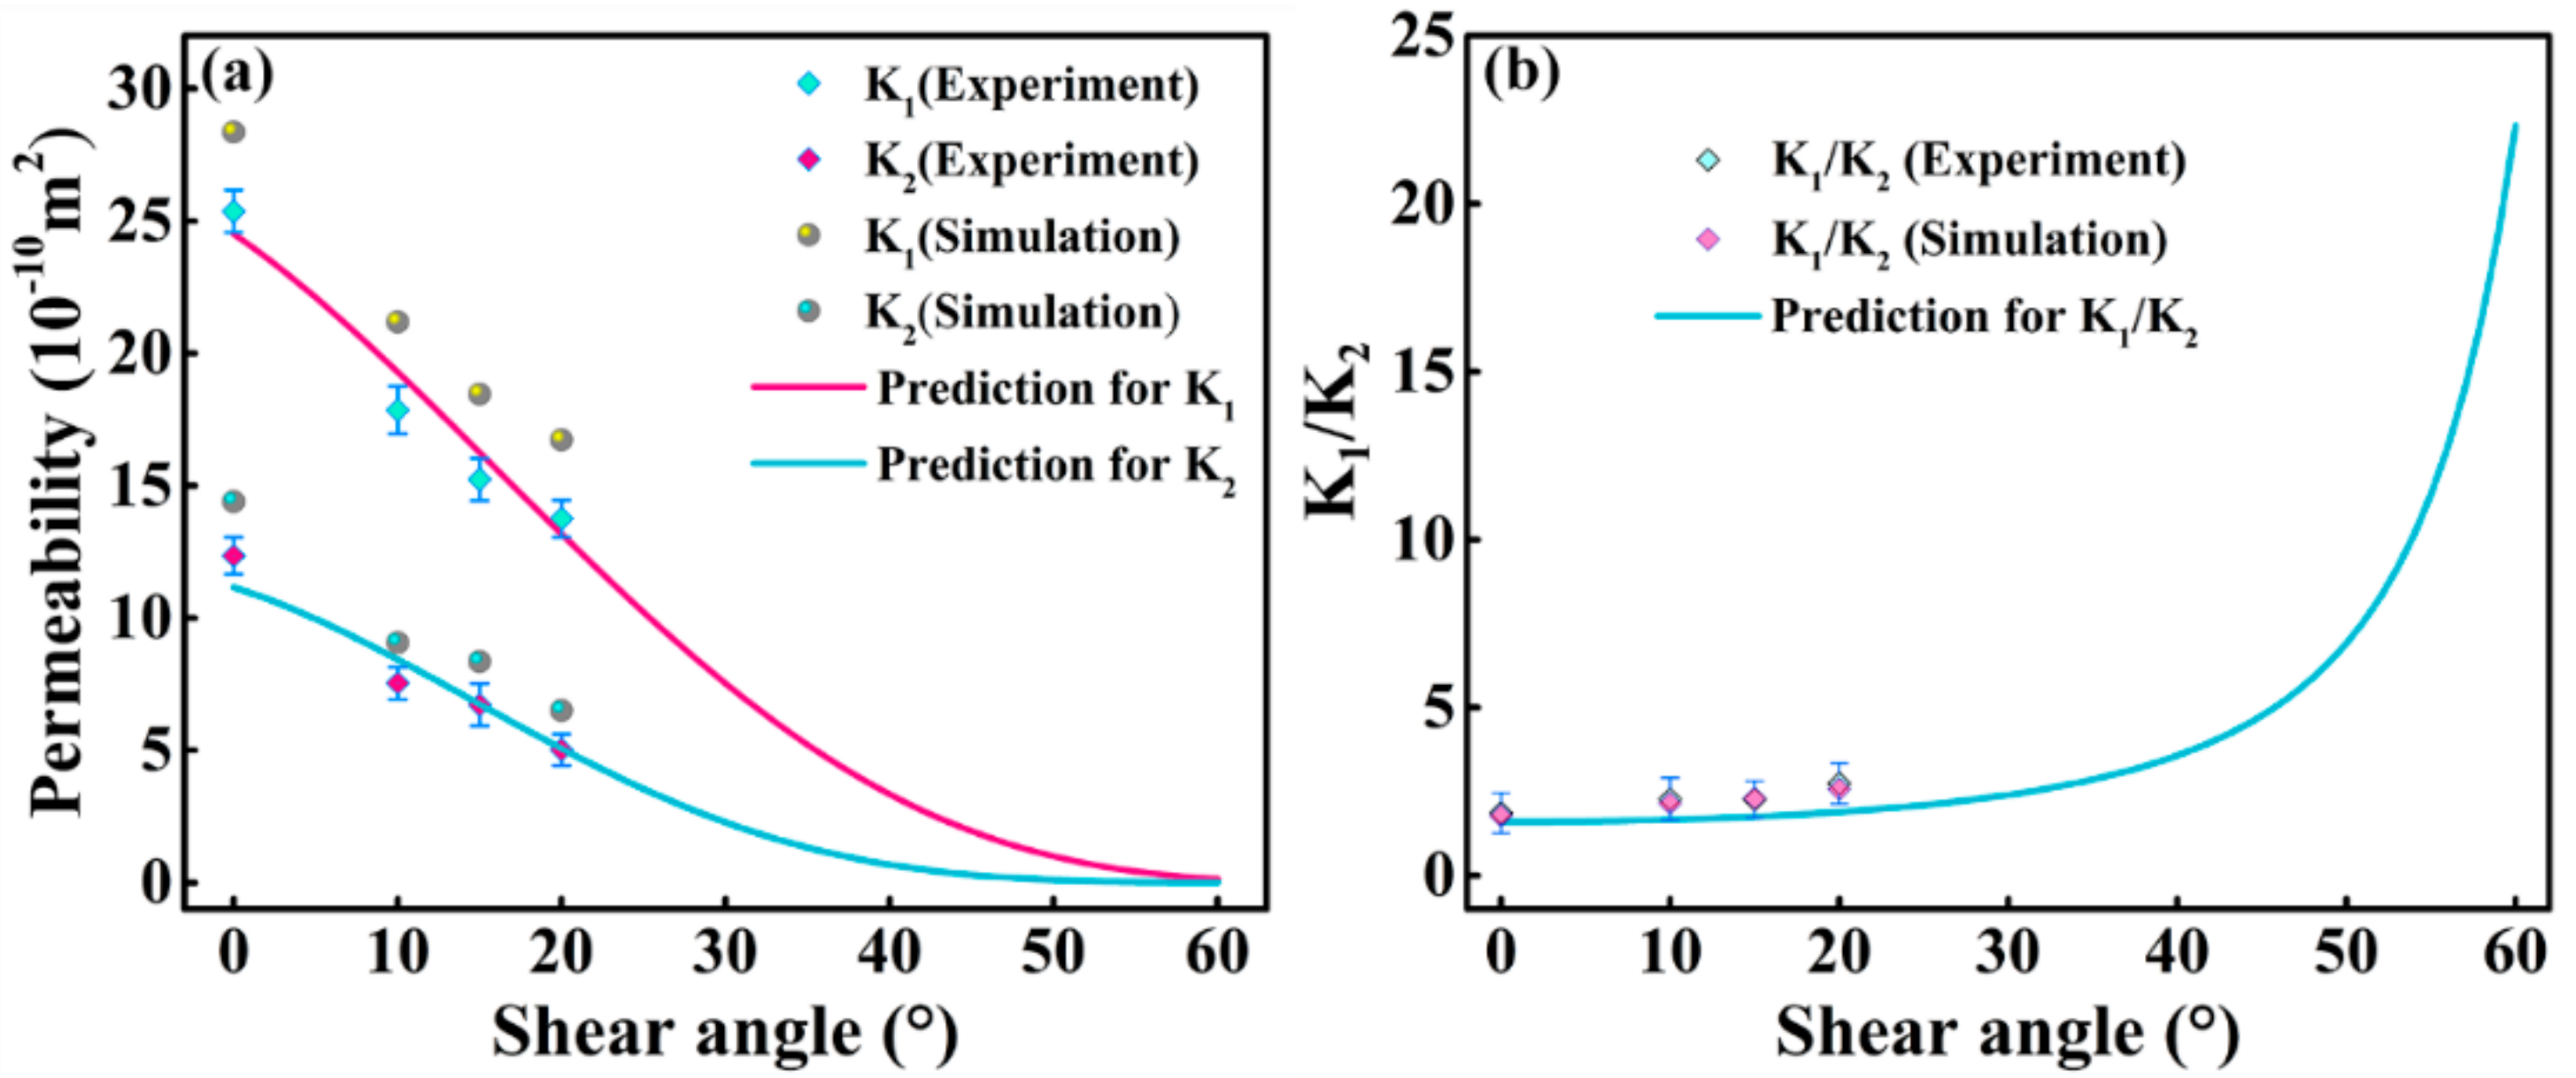
3.3.2. Effect of Shear Deformation on Magnitude of Principle Permeability
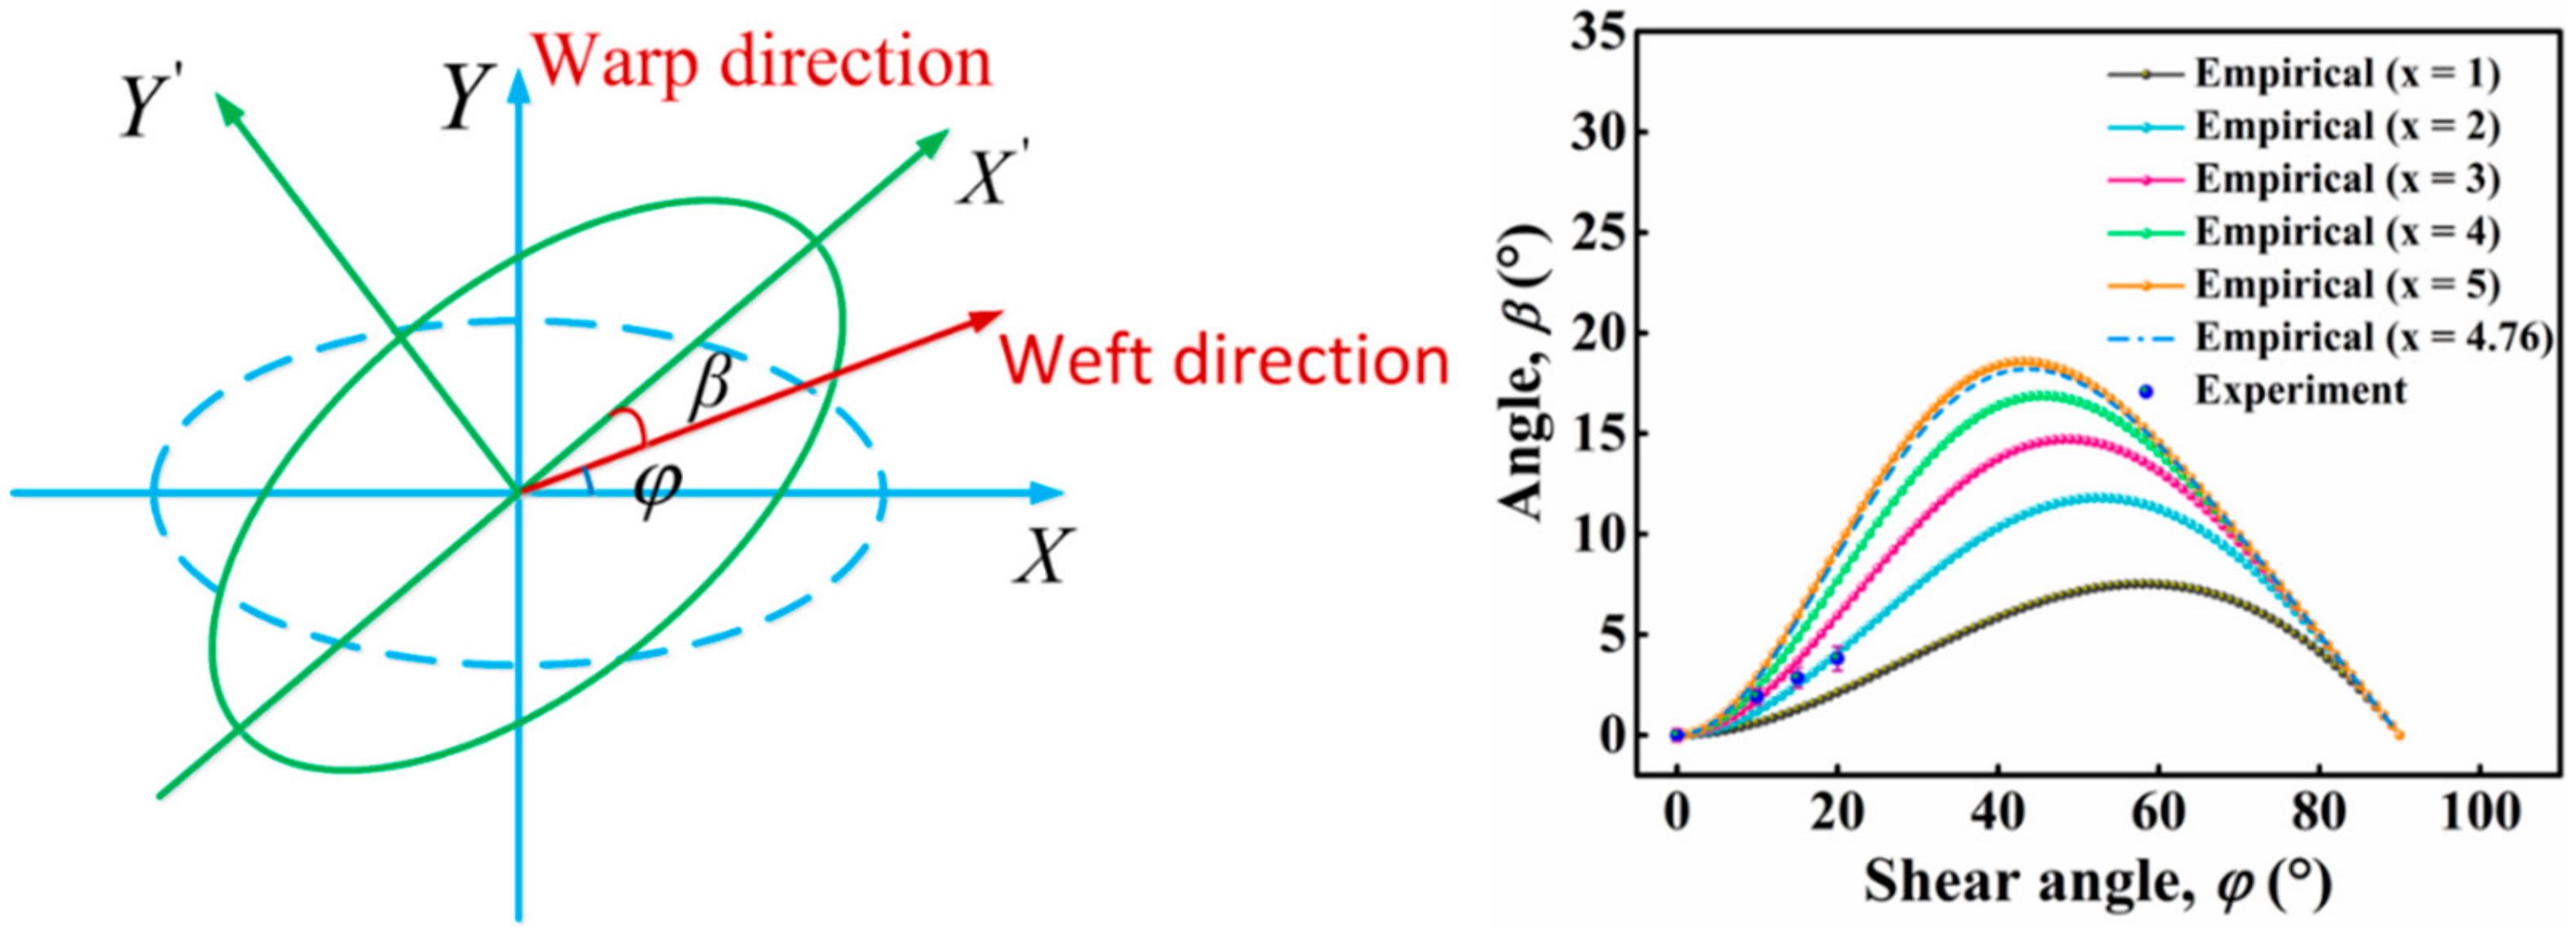
3.3.3. Effect of Shear Deformation on Direction of Principle Permeability
4. Conclusions
Author Contributions
Funding
Conflicts of Interest
References
- Aranda, S.; Berg, D.C.; Dickert, M.; Drechsel, M.; Ziegmann, G. Influence of shear on the permeability tensor and compaction behaviour of a non-crimp fabric. Compos. B Eng. 2014, 65, 158–163. [Google Scholar] [CrossRef]
- Jae, I.K.; Yeon, T.H.; Kyung, H.C.; Hee, J.K.; Hak, S.K. Prediction of the vacuum assisted resin transfer molding (VARTM) process considering the directional permeability of sheared woven fabric. Compos. Struct. 2019, 211, 236–243. [Google Scholar]
- Hong, B.; Xian, G.; Li, H. Comparative Study of the Durability Behaviors of Epoxy- and Polyurethane-Based CFRP Plates Subjected to the Combined Effects of Sustained Bending and Water/Seawater Immersion. Polymers 2017, 9, 603. [Google Scholar] [CrossRef] [PubMed]
- Lu, Z.; Xie, J.; Zhang, H.; Li, J. Long-Term Durability of Basalt Fiber-Reinforced Polymer (BFRP) Sheets and the Epoxy Resin Matrix under a Wet–Dry Cyclic Condition in a Chloride-Containing Environment. Polymers 2017, 9, 652. [Google Scholar] [CrossRef] [PubMed]
- Michaud, V. A review of non-saturated resin flow in liquid composite moulding processes. Transport. Porous. Media 2016, 115, 581–601. [Google Scholar]
- Gereke, T.; Cherif, C. A review of numerical models for 3D woven composite reinforcements. Compos. Struct. 2019, 209, 60–66. [Google Scholar] [CrossRef]
- Louis, M.; Huber, U. Investigation of shearing effects on the permeability of woven fabrics and implementation into LCM simulation. Compos. Sci. Technol. 2003, 63, 2081–2088. [Google Scholar] [CrossRef]
- Nahiène, H.; Boisse, P. Simulations of textile composite reinforcement draping using a new semi-discrete three node finite element. Compos. B Eng. 2008, 39, 999–1010. [Google Scholar]
- Gebart, B.R. Permeability of Unidirectional Reinforcements for RTM. J. Compos. Mater. 1992, 26, 1100–1133. [Google Scholar] [CrossRef]
- Bruschke, M.V.; Advani, S.G. Flow of Generalized Newtonian Fluids Across a Periodic Array of Cylinders. J. Rheology 1993, 37, 479–498. [Google Scholar] [CrossRef]
- Endruweit, A.; Zeng, X.; Matveev, M.; Long, A.C. Effect of yarn cross-sectional shape on resin flow through inter-yarn gaps in textile reinforcements. Compos. Appl. Sci. Manuf. 2017, 104, 139–150. [Google Scholar] [CrossRef]
- Endruweit, A.; Zeng, X.; Long, A.C. Multiscale modeling of combined deterministic and stochastic fabric non-uniformity for realistic resin injection simulation. Adv. Manuf. Polym. Compos. Sci. 2015, 1, 3–15. [Google Scholar] [CrossRef]
- Swery, E.E.; Allen, T.; Comas-Cardona, S.; Govignon, Q.; Hickey, C.; Timms, J.; Tournier, L.; Walbran, A.; Kelly, P.; Bickerton, S. Efficient experimental characterization of the permeability of fibrous textiles. J Compos. Mater. 2016, 50, 4023–4038. [Google Scholar] [CrossRef]
- Chen, Z.R.; Ye, L.; Lu, M. Permeability Predictions for Woven Fabric Preforms. J. Compos. Mater. 2010, 44, 1569–1586. [Google Scholar] [CrossRef]
- Xiao, X.; Endruweit, A.; Zeng, X.; Hu, J.; Long, A. Through-thickness permeability study of orthogonal and angle-interlock woven fabrics. J. Mater. Sci. 2015, 50, 1257–1266. [Google Scholar] [CrossRef]
- Vernet, N.; Trochu, F. Analysis of mesoscopic pore size in 3D-interlock fabrics and validation of a predictive permeability model. J. Reinforc Plast Compos. 2016, 35, 471–486. [Google Scholar] [CrossRef]
- Vernet, N.; Trochu, F. In-plane and through-thickness permeability models for three-dimensional Interlock fabrics. J. Compos. Mater. 2016, 50, 1951–1969. [Google Scholar] [CrossRef]
- Karaki, M.; Hallal, A.; Younes, R.; Trochu, F.; Lafon, P. In-plane permeability prediction model for non-crimp and 3D orthogonal fabrics. J Text. Inst. 2018, 109, 1110–1126. [Google Scholar] [CrossRef]
- Verpoest, I.; Lomov, S.V. Virtual textile composites software WiseTex: Integration with micro-mechanical, permeability and structural analysis. Compos. Sci. Technol. 2005, 65, 2563–2574. [Google Scholar] [CrossRef]
- Loix, F.; Badel, P.; Orgéas, L.; Geindreau, C.; Boisse, P. Woven fabric permeability: From textile deformation to fluid flow mesoscale simulations. Compos. Sci. Technol. 2008, 68, 1624–1630. [Google Scholar] [CrossRef]
- Endruweit, A.; Ermanni, P. The in-plane permeability of sheared textiles. Experimental observations and a predictive conversion model. Compos. A Appl. Sci. Manuf. 2004, 35, 439–451. [Google Scholar] [CrossRef]
- Verleye, B.; Croce, R.; Griebel, M.; Klitz, M.; Lomov, S.V.; Morren, G.; Sol, H.; Verpoest, I.; Roose, D. Permeability of textile reinforcements: Simulation, influence of shear and validation. Compos. Sci. Technol. 2008, 68, 2804–2810. [Google Scholar] [CrossRef]
- Zeng, X.; Endruweit, A.; Brown, L.P.; Andrew Long, C. Numerical prediction of in-plane permeability for multilayer woven fabrics with manufacture-induced deformation. Compos. A Appl. Sci. Manuf. 2015, 77, 266–274. [Google Scholar] [CrossRef]
- Smith, P.; Rudd, C.D.; Long, A.C. The effect of shear deformation on the processing and mechanical properties of aligned reinforcements. Compos. Sci. Technol. 1997, 57, 327–344. [Google Scholar] [CrossRef]
- Demaría, C.; Ruiz, E.; Trochu, F. In-plane anisotropic permeability characterization of deformed woven fabrics by unidirectional injection. Part I: Experimental results. Polym. Compos. 2007, 28, 797–811. [Google Scholar] [CrossRef]
- Demaría, C.; Ruiz, E.; Trochu, F. In-plane anisotropic permeability characterization of deformed woven fabrics by unidirectional injection. Part II: Prediction model and numerical simulations. Polym. Compos. 2007, 28, 812–827. [Google Scholar] [CrossRef]
- Arbter, R.; Beraud, J.; Binetruy, C.; Bizet, L.; Bréard, J.; Comas-Cardona, S.; Demaria, C.; Endruweit, A.; Ermanni, P.; Gommer, F. Experimental determination of the permeability of textiles: A benchmark exercise. Compos. Appl. Sci. Manuf. 2011, 42, 1157–1168. [Google Scholar] [CrossRef]
- Vernet, N.; Ruiz, E.; Advani, S.; Alms, J.; Aubert, M.; Barburski, M.; Barari, B.; Beraud, J.; Berg, D.; Correia, N. Experimental determination of the permeability of engineering textiles: Benchmark II. Compos. Appl. Sci. Manuf. 2014, 61, 172–184. [Google Scholar] [CrossRef]


| Parameter | Value |
|---|---|
| the fineness of the stitching warp yarn | T300(3K) |
| the fineness of weft | T700(12K) |
| The layer number of fabric | 6 layers |
| the density of stitching warp | 3.0 piece/cm/layer |
| the density of the lining warp | 3.0 piece/cm/layer |
| the density of the warp | 3.0 piece/cm/layer |
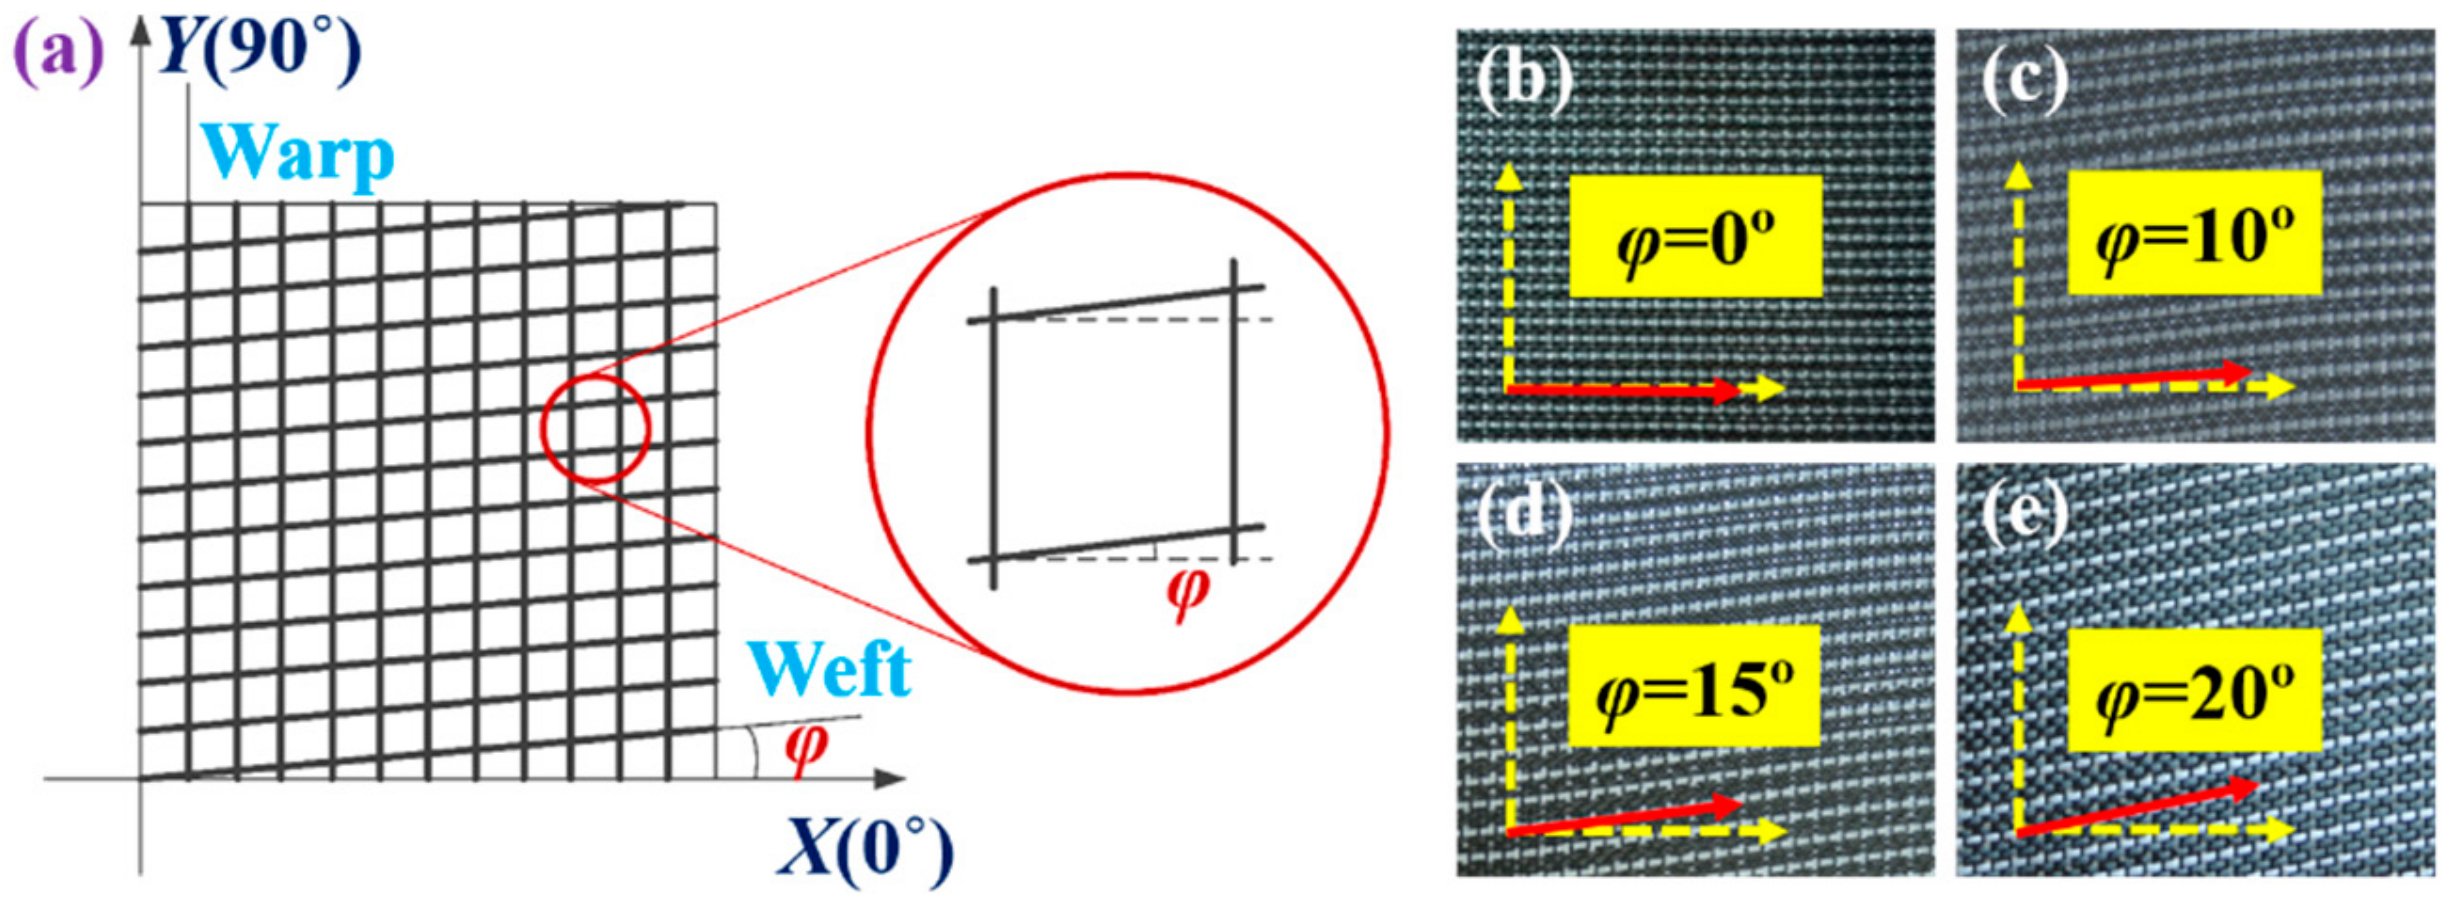
| Sample Number | Shear Angle (°) | Sample Size (mm) |
|---|---|---|
| S-1 | 0 | 250 × 250 |
| S-2 | 10 | 210 × 210 |
| S-3 | 15 | 198 × 198 |
| S-4 | 20 | 186 × 186 |
| Shear Angle (°) | The Fiber Volume Fraction |
|---|---|
| 0 | 50.8% |
| 10 | 51.8% |
| 15 | 52.4% |
| 20 | 54.0% |
| Parameter | Value (mm) |
|---|---|
| Warp (weft) width | 1.6 |
| Warp (weft) height | 0.34 |
| Binder warp width | 0.8 |
| Binder warp height | 0.17 |
| Lateral distance between warp (weft) yarns | 3 |
| Vertical distance between warp (weft) yarns | 0.68 |
| Lateral distance between binder warp yarns | 3 |
| Vertical distance between binder warp yarns | 0.68 |
| Shear angle (°) | Lateral Distance between Warp (Weft, Binder Warp) Yarns (mm) |
|---|---|
| 0 | 3 |
| 10 | 2.94 |
| 15 | 2.91 |
| 20 | 2.82 |
© 2019 by the authors. Licensee MDPI, Basel, Switzerland. This article is an open access article distributed under the terms and conditions of the Creative Commons Attribution (CC BY) license (http://creativecommons.org/licenses/by/4.0/).
Share and Cite
Chen, Z.; Pan, S.; Zhou, Z.; Lei, T.; Dong, B.; Xu, P. The Effect of Shear Deformation on Permeability of 2.5D Woven Preform. Materials 2019, 12, 3594. https://doi.org/10.3390/ma12213594
Chen Z, Pan S, Zhou Z, Lei T, Dong B, Xu P. The Effect of Shear Deformation on Permeability of 2.5D Woven Preform. Materials. 2019; 12(21):3594. https://doi.org/10.3390/ma12213594
Chicago/Turabian StyleChen, Zhiming, Shidong Pan, Zhengong Zhou, Tao Lei, Baofeng Dong, and Peifei Xu. 2019. "The Effect of Shear Deformation on Permeability of 2.5D Woven Preform" Materials 12, no. 21: 3594. https://doi.org/10.3390/ma12213594
APA StyleChen, Z., Pan, S., Zhou, Z., Lei, T., Dong, B., & Xu, P. (2019). The Effect of Shear Deformation on Permeability of 2.5D Woven Preform. Materials, 12(21), 3594. https://doi.org/10.3390/ma12213594