Preparation and Characterization of Fly Ash Coated with Zinc Oxide Nanocomposites


Abstract
:
1. Introduction
2. Materials and Methods
2.1. Materials
2.2. The Composite Preparation
2.3. Physical Property Measurement
3. Results and Discussion
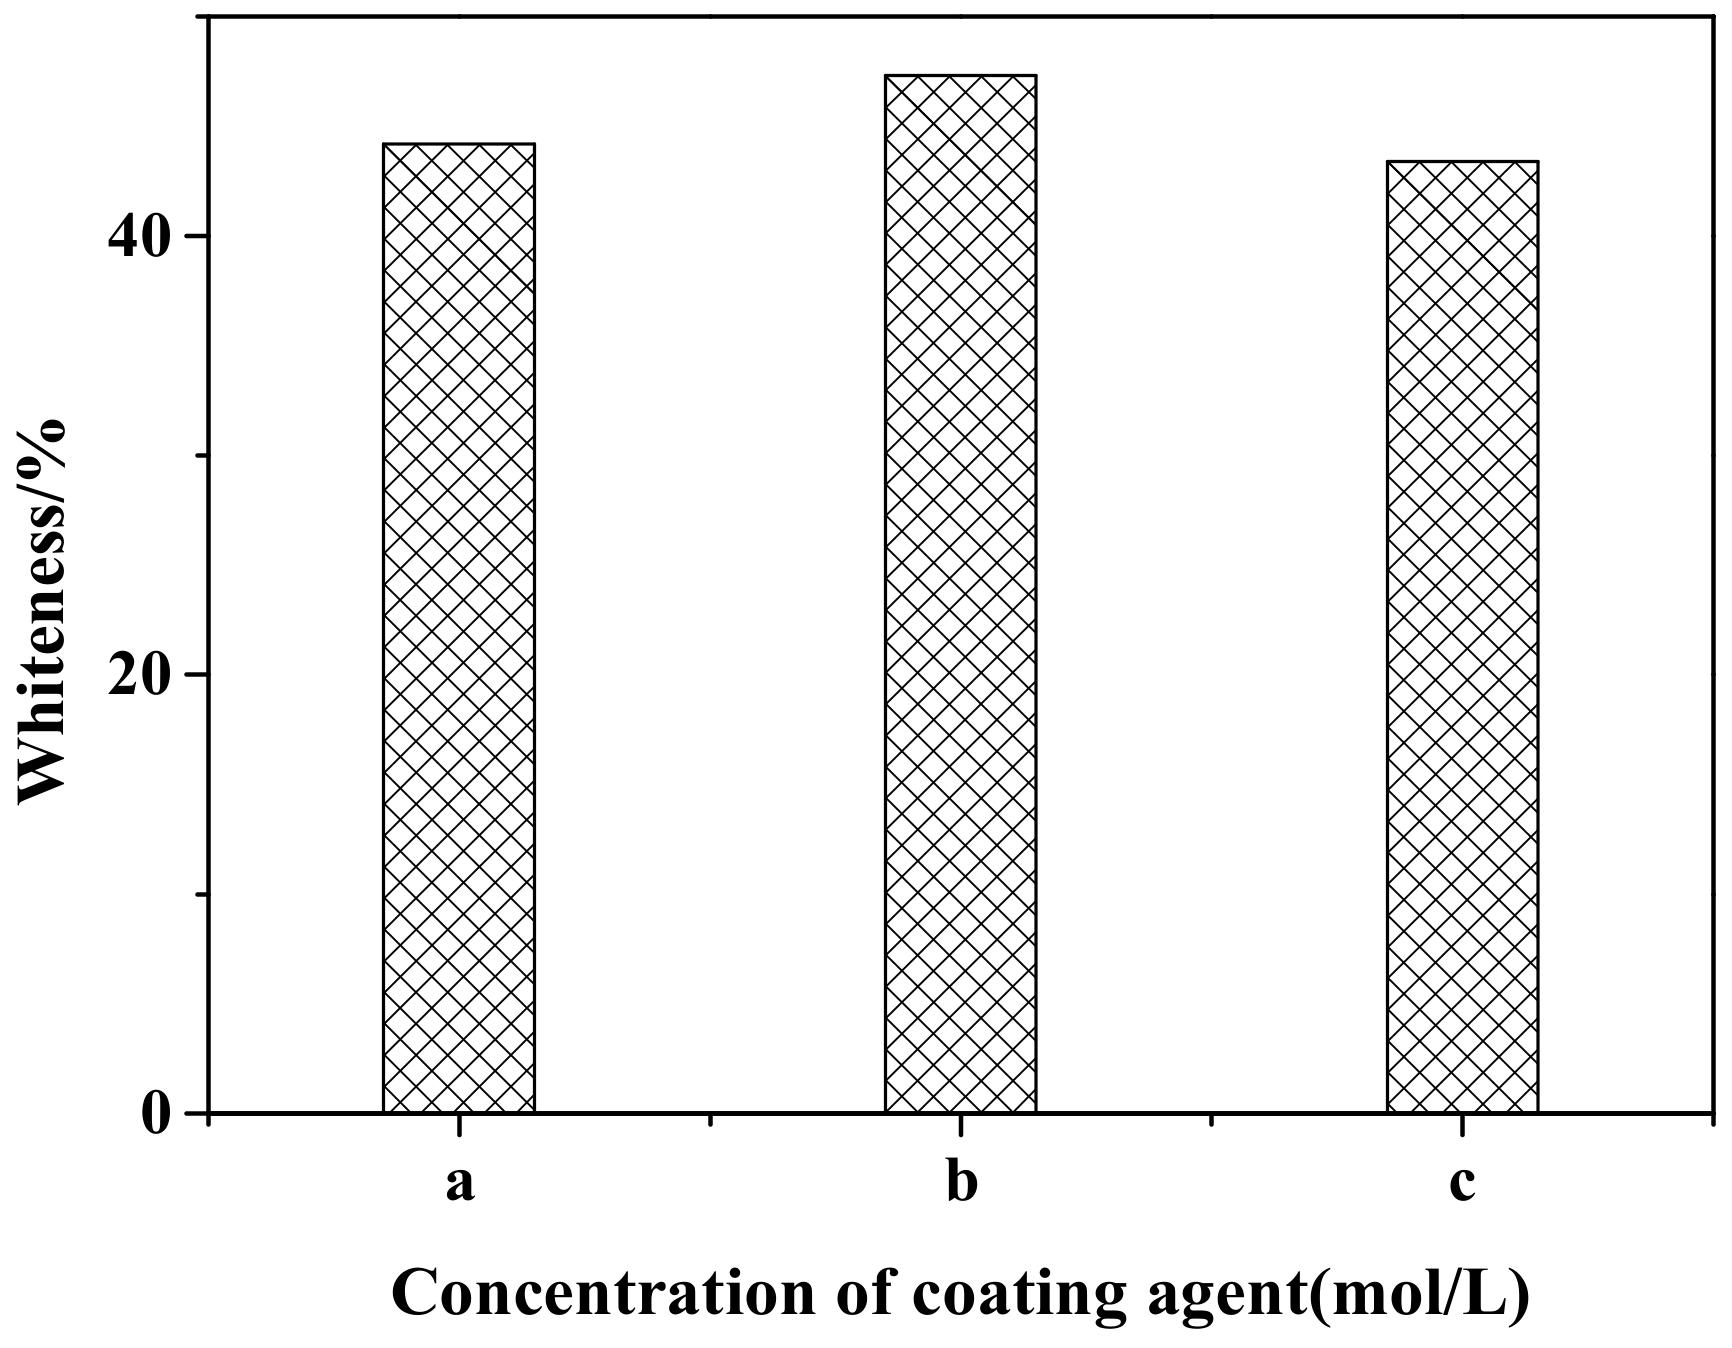
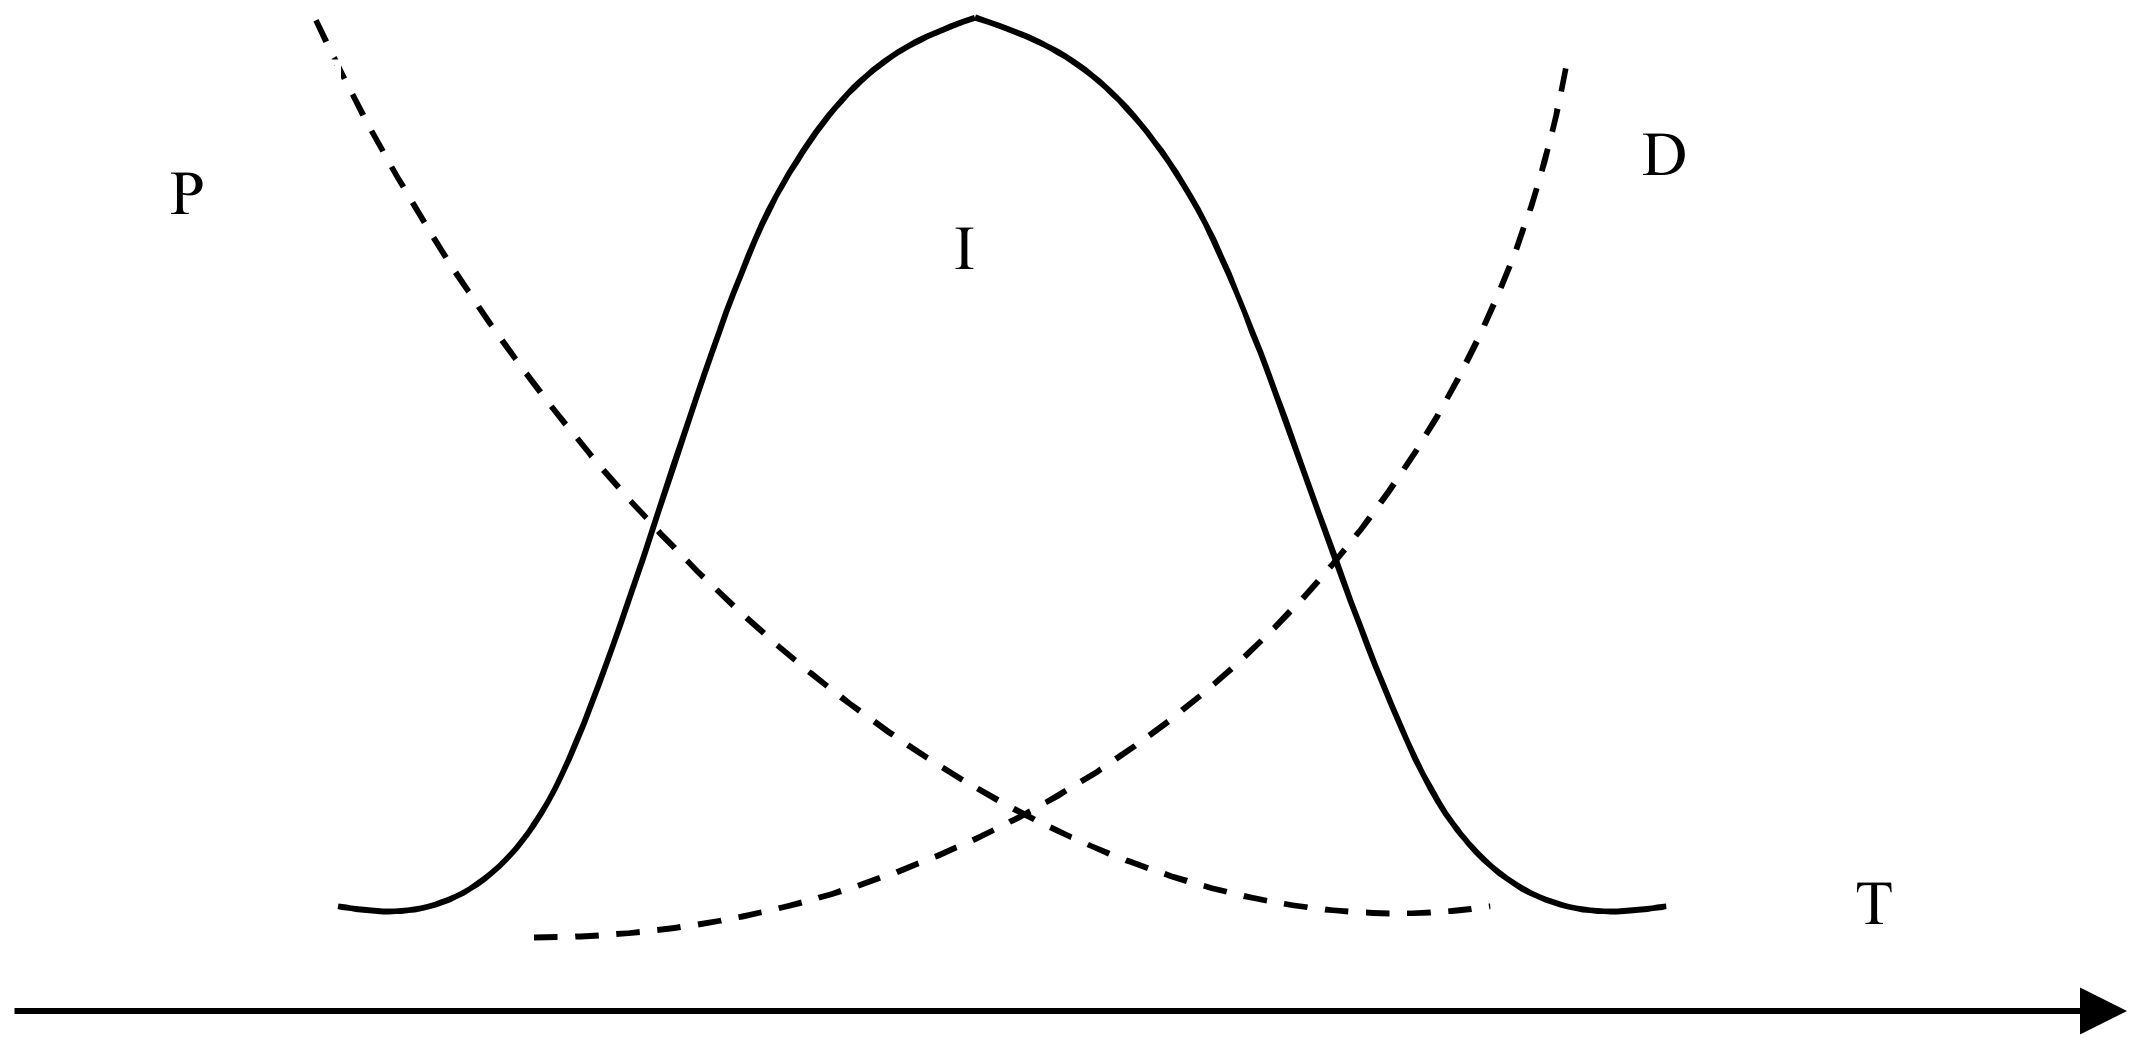
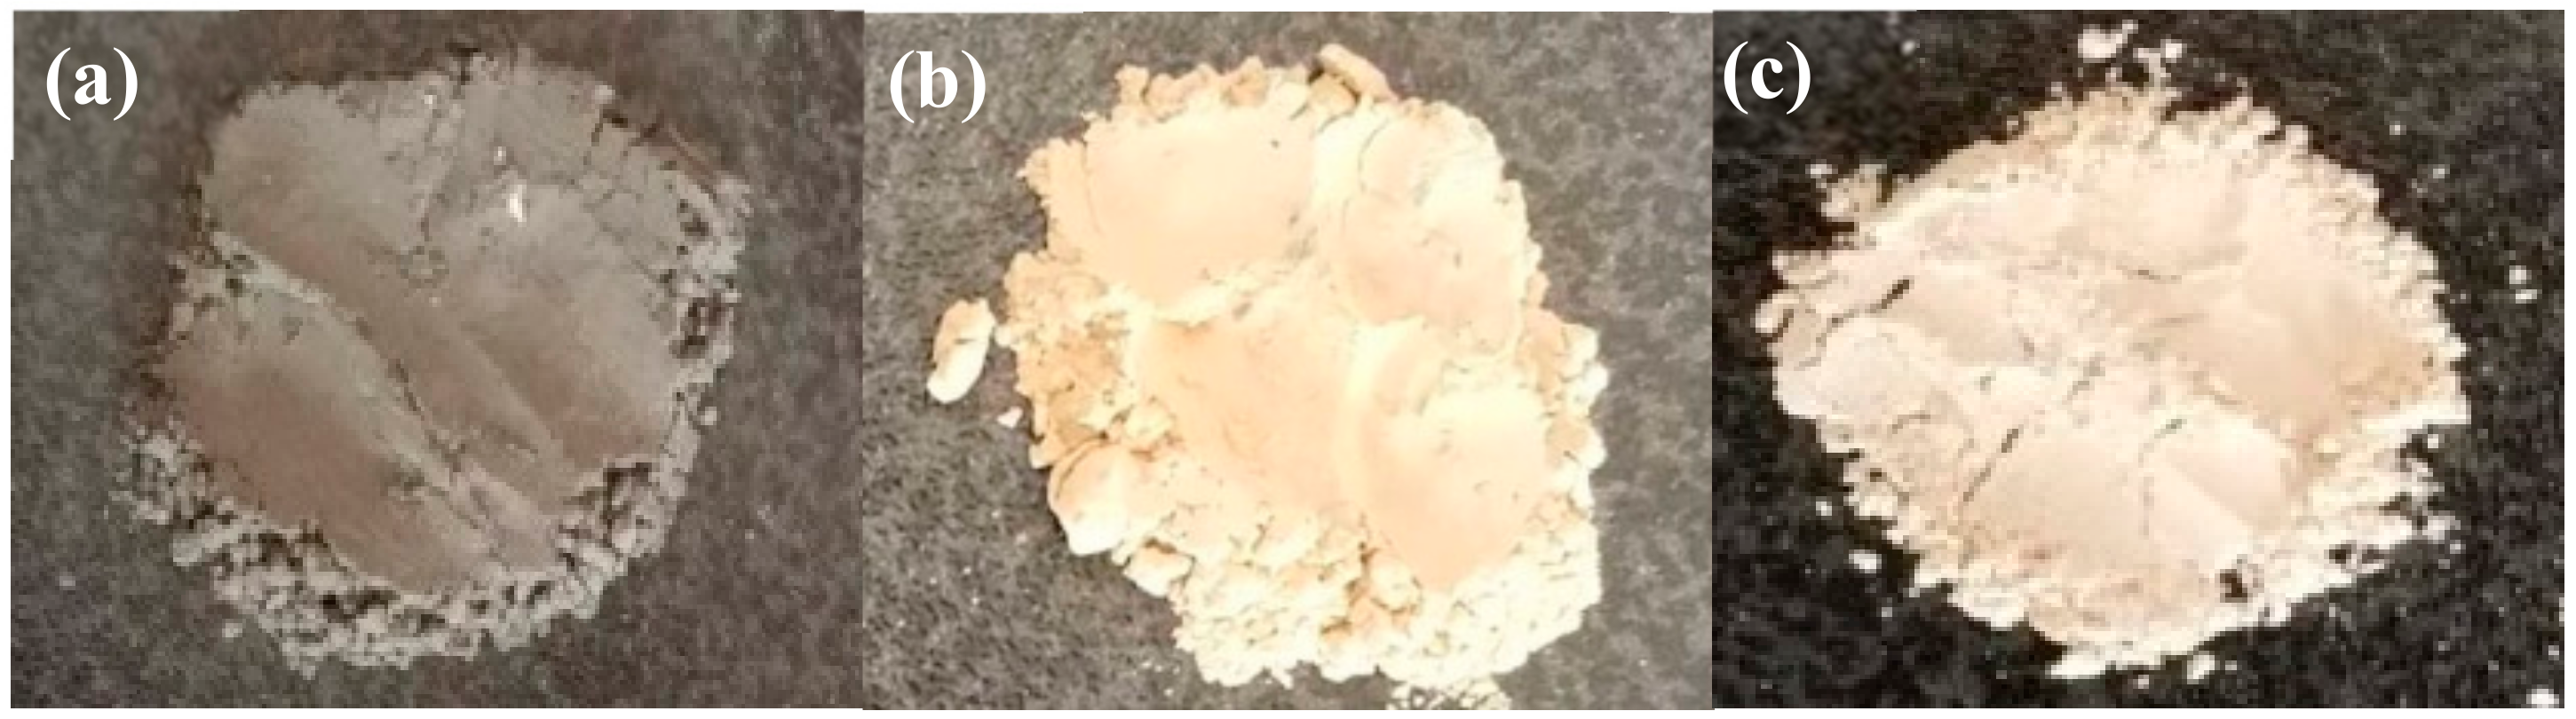
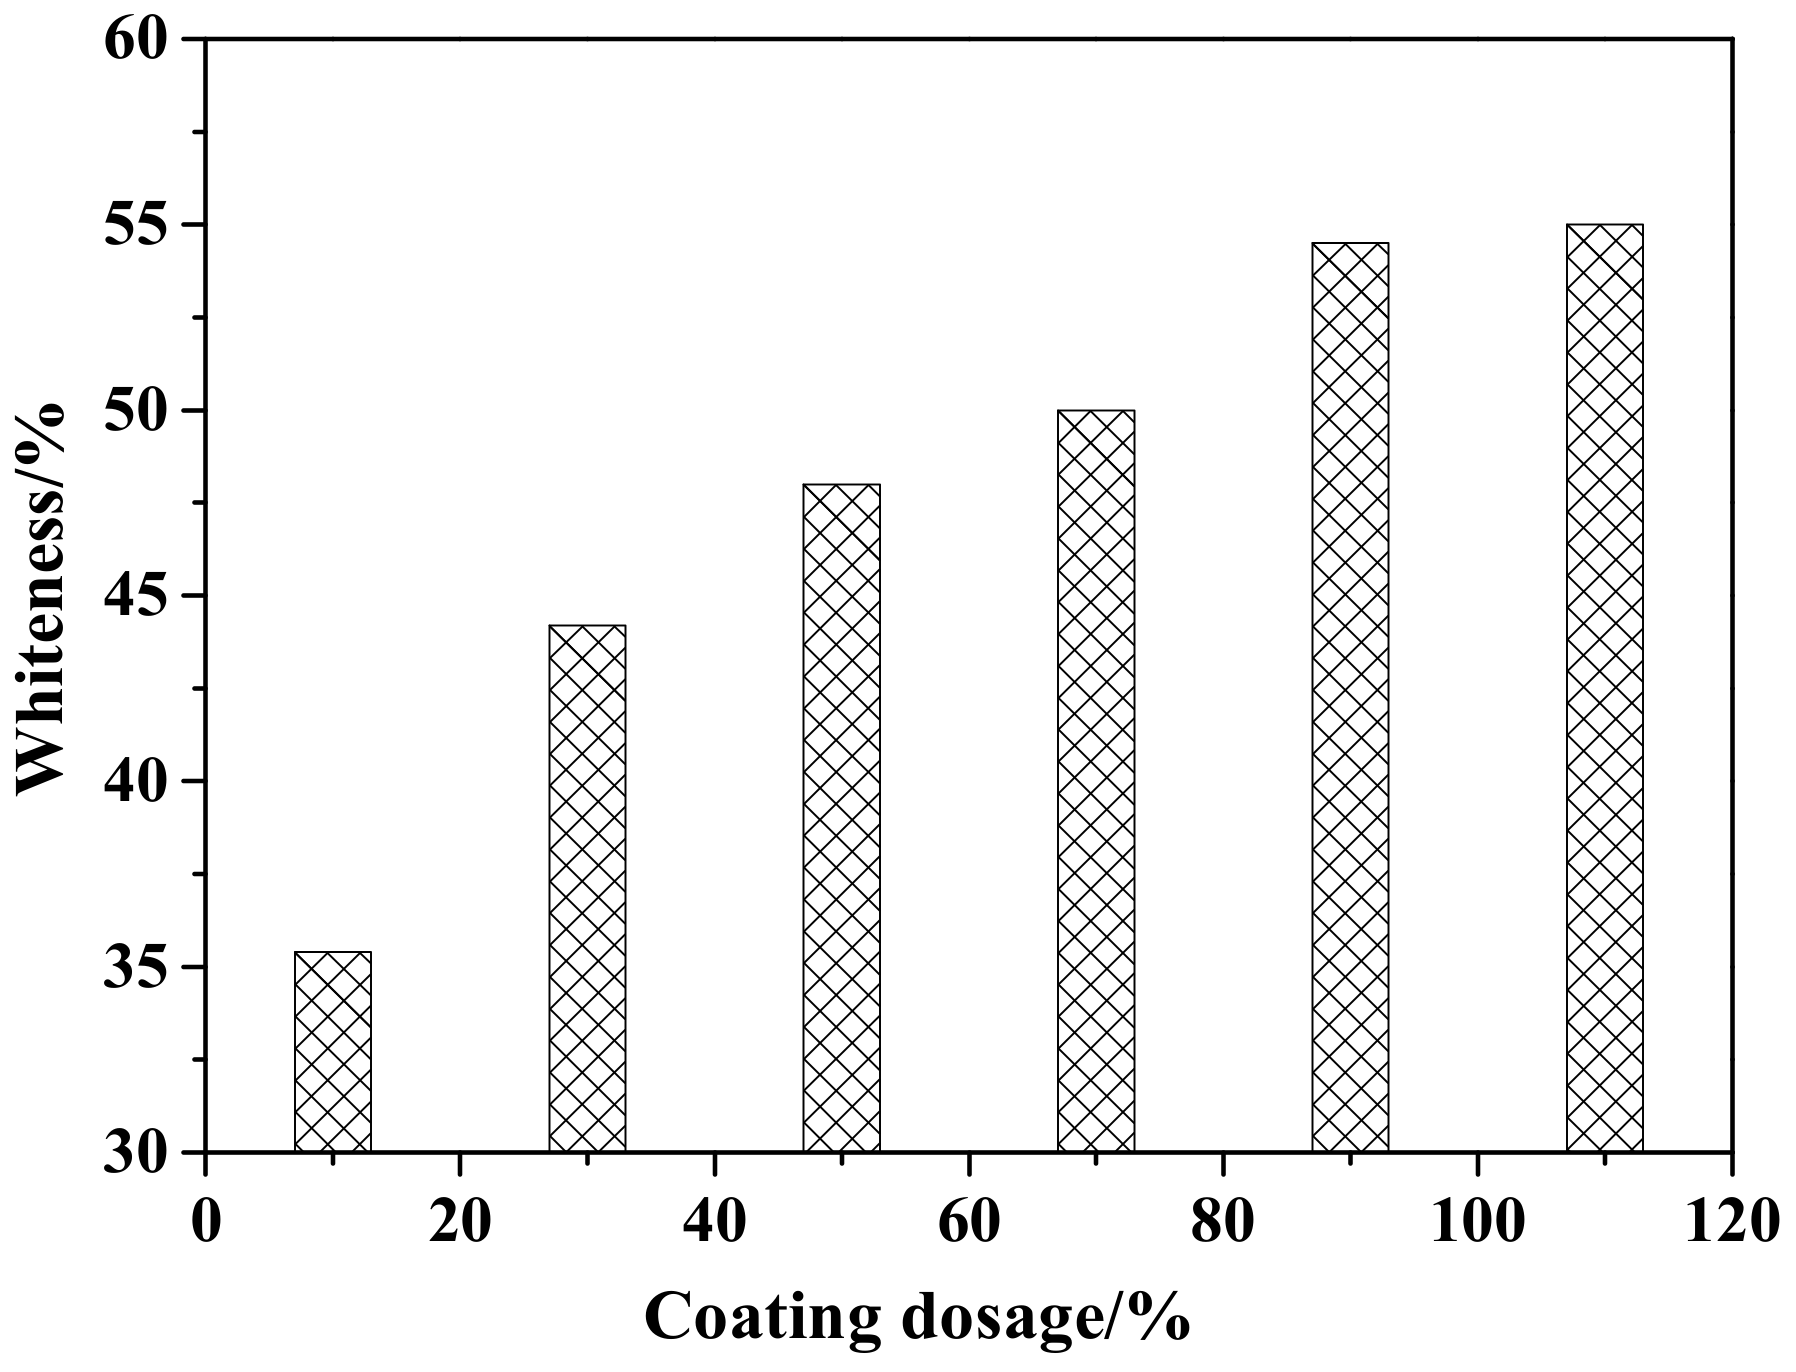
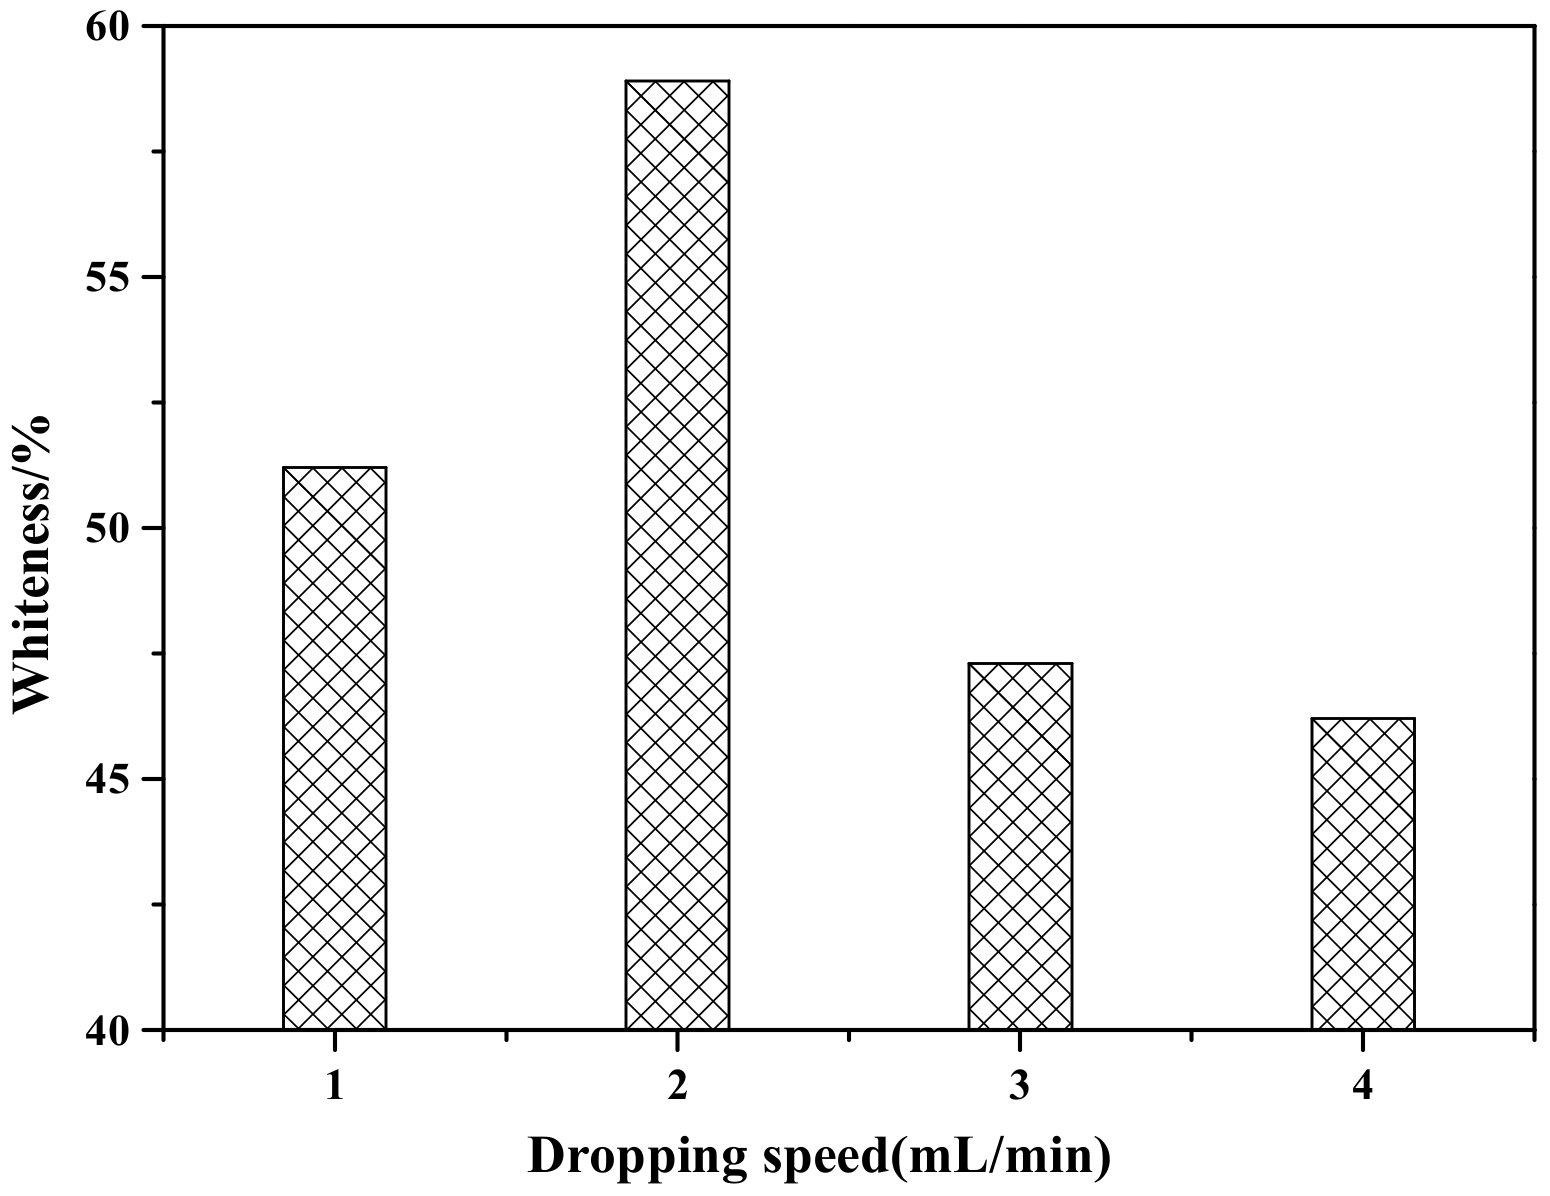
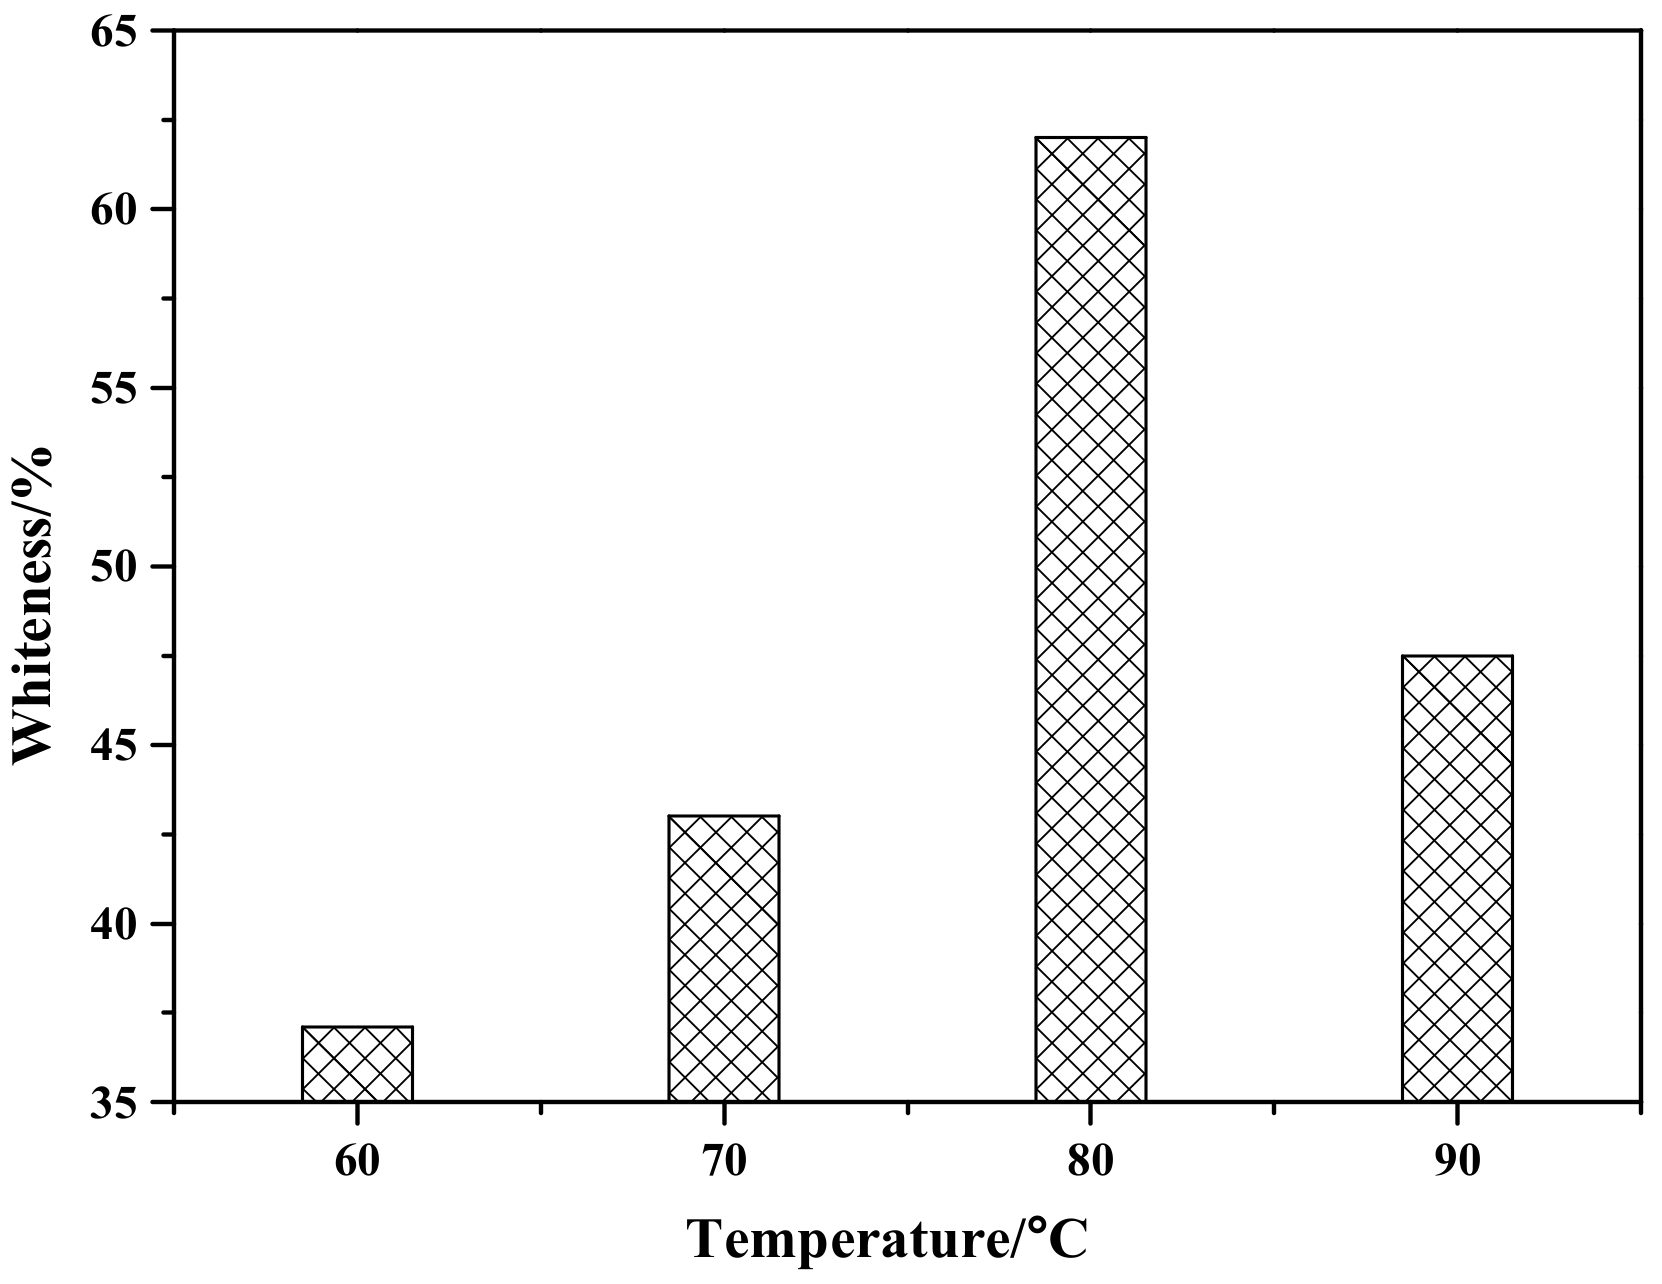
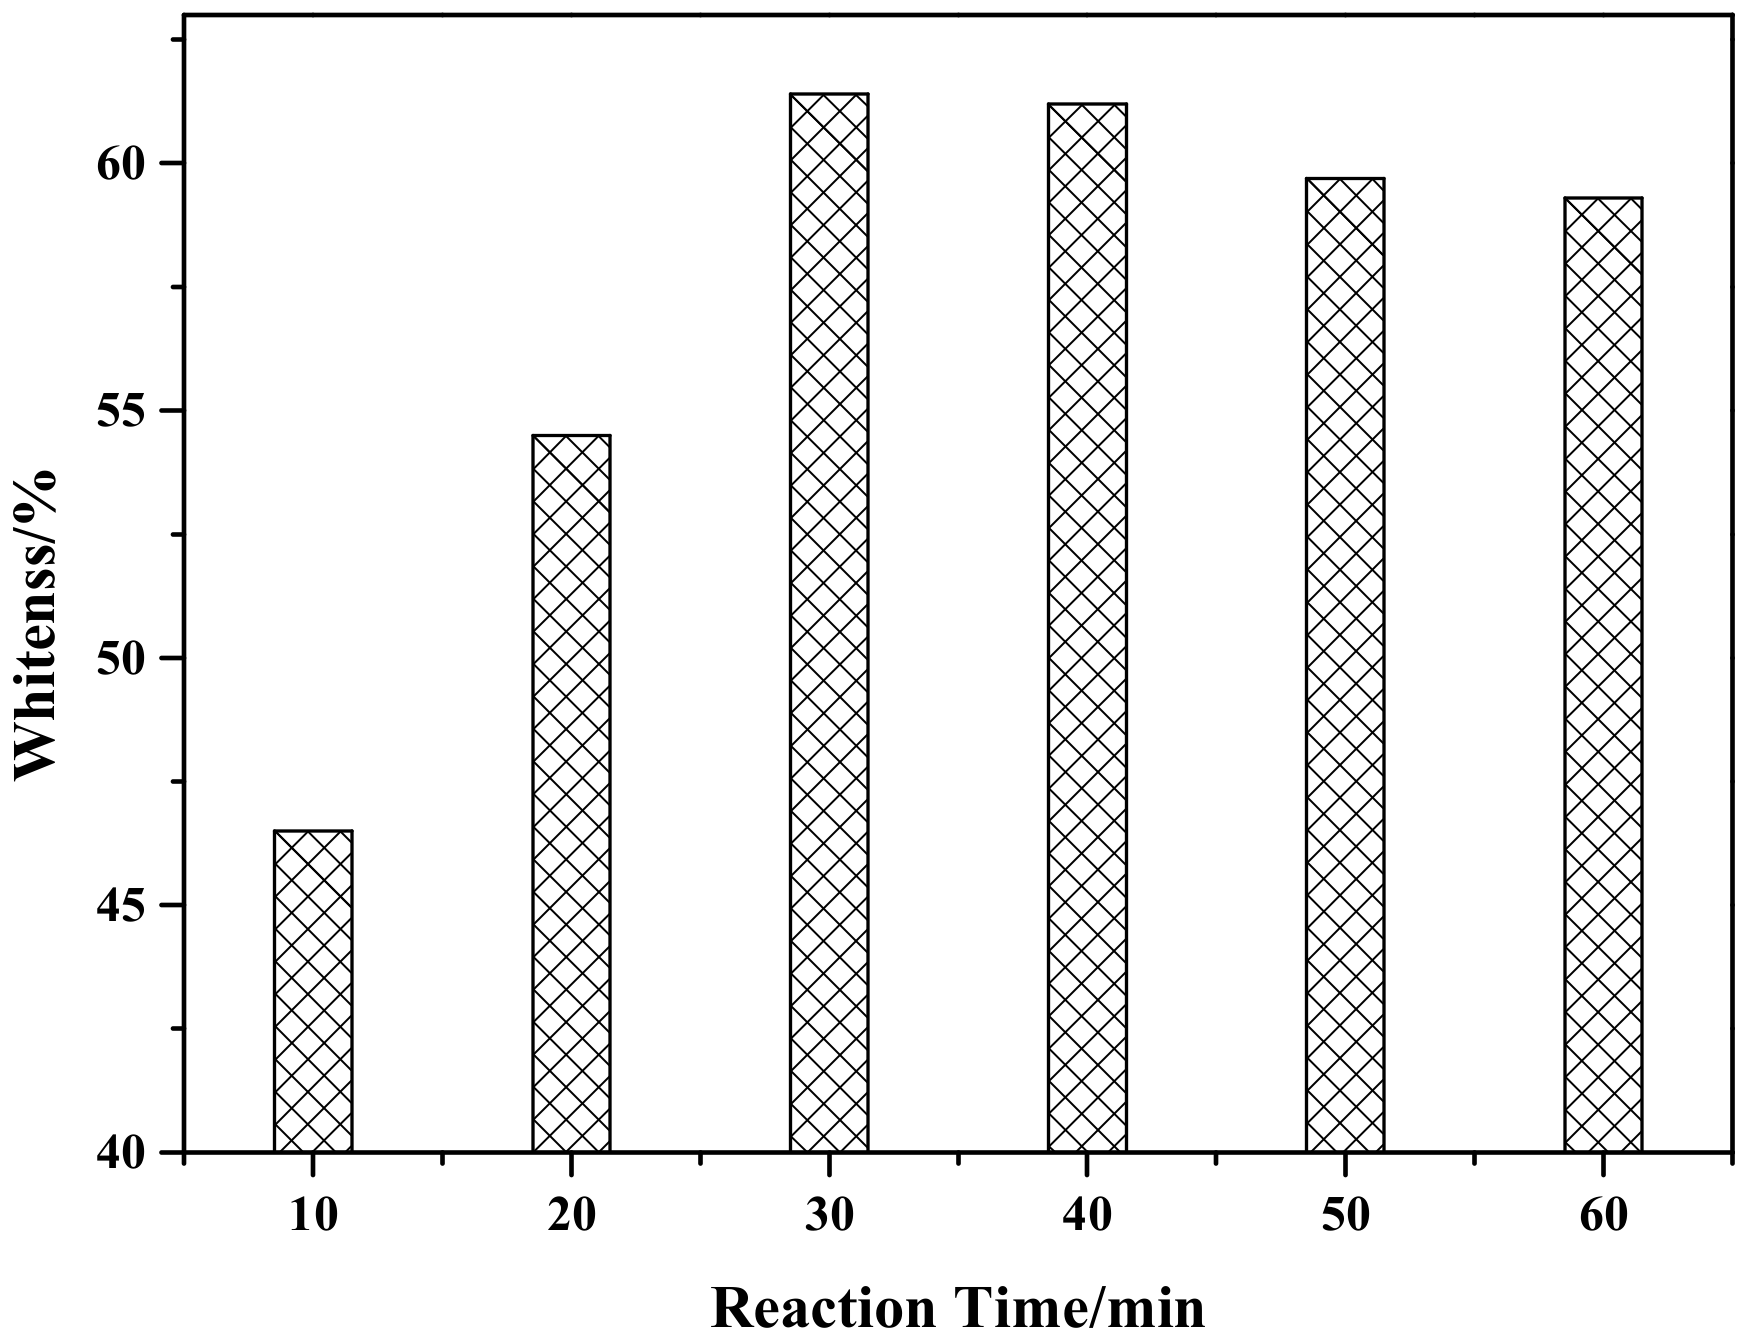
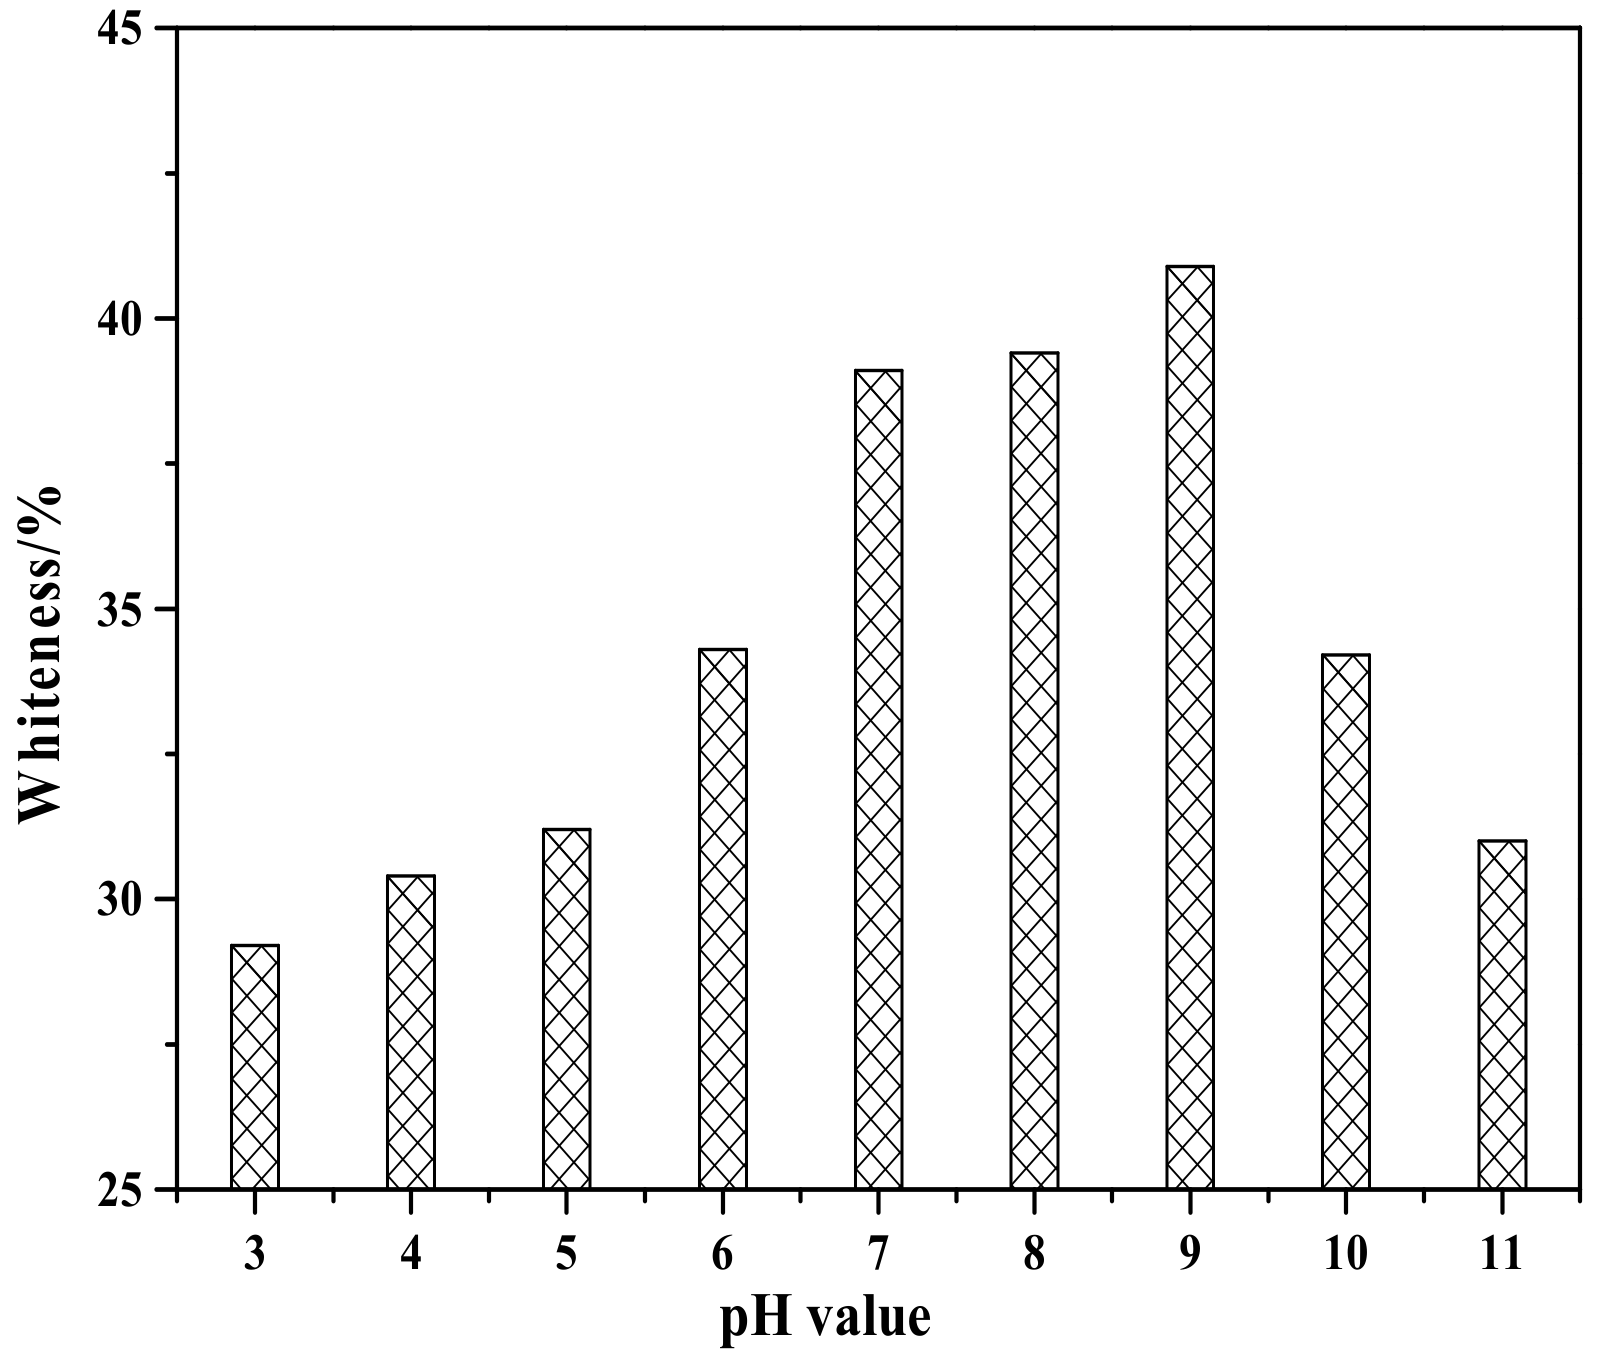
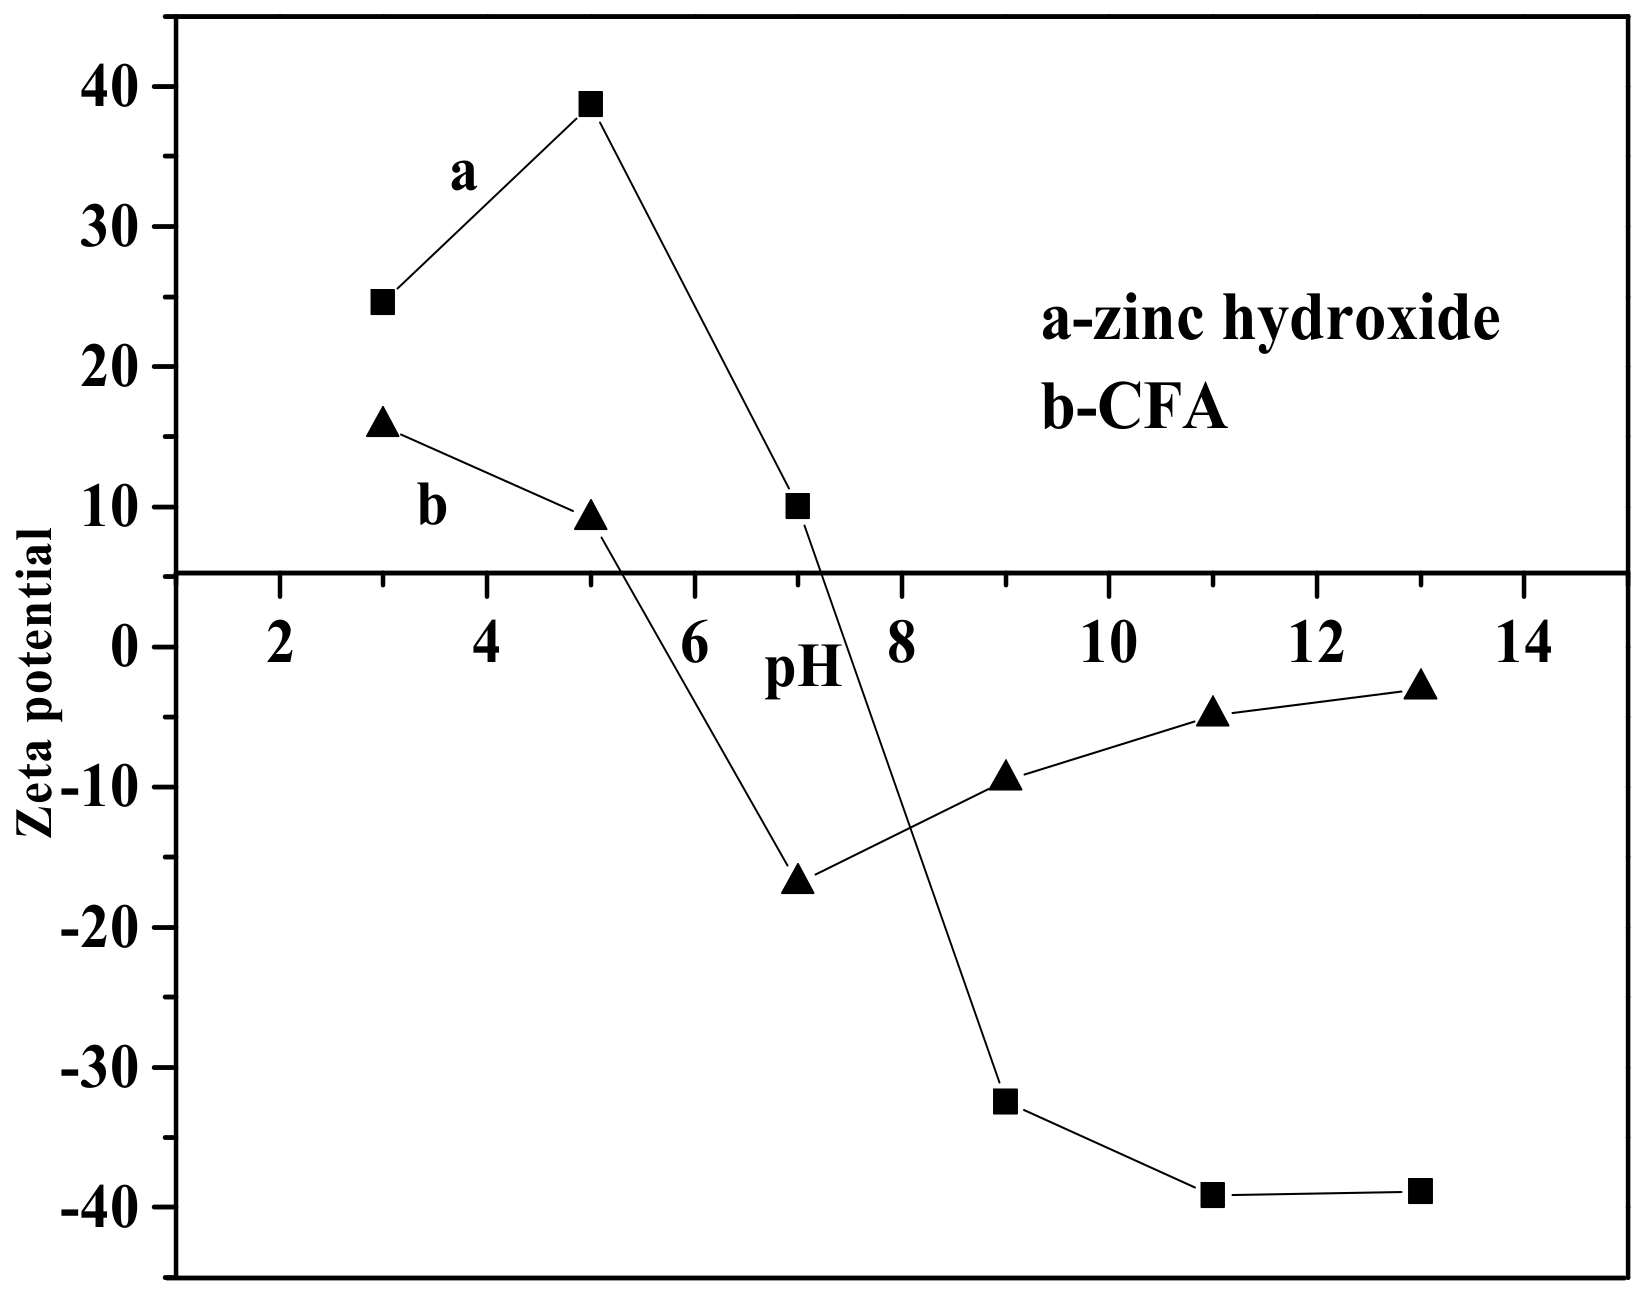
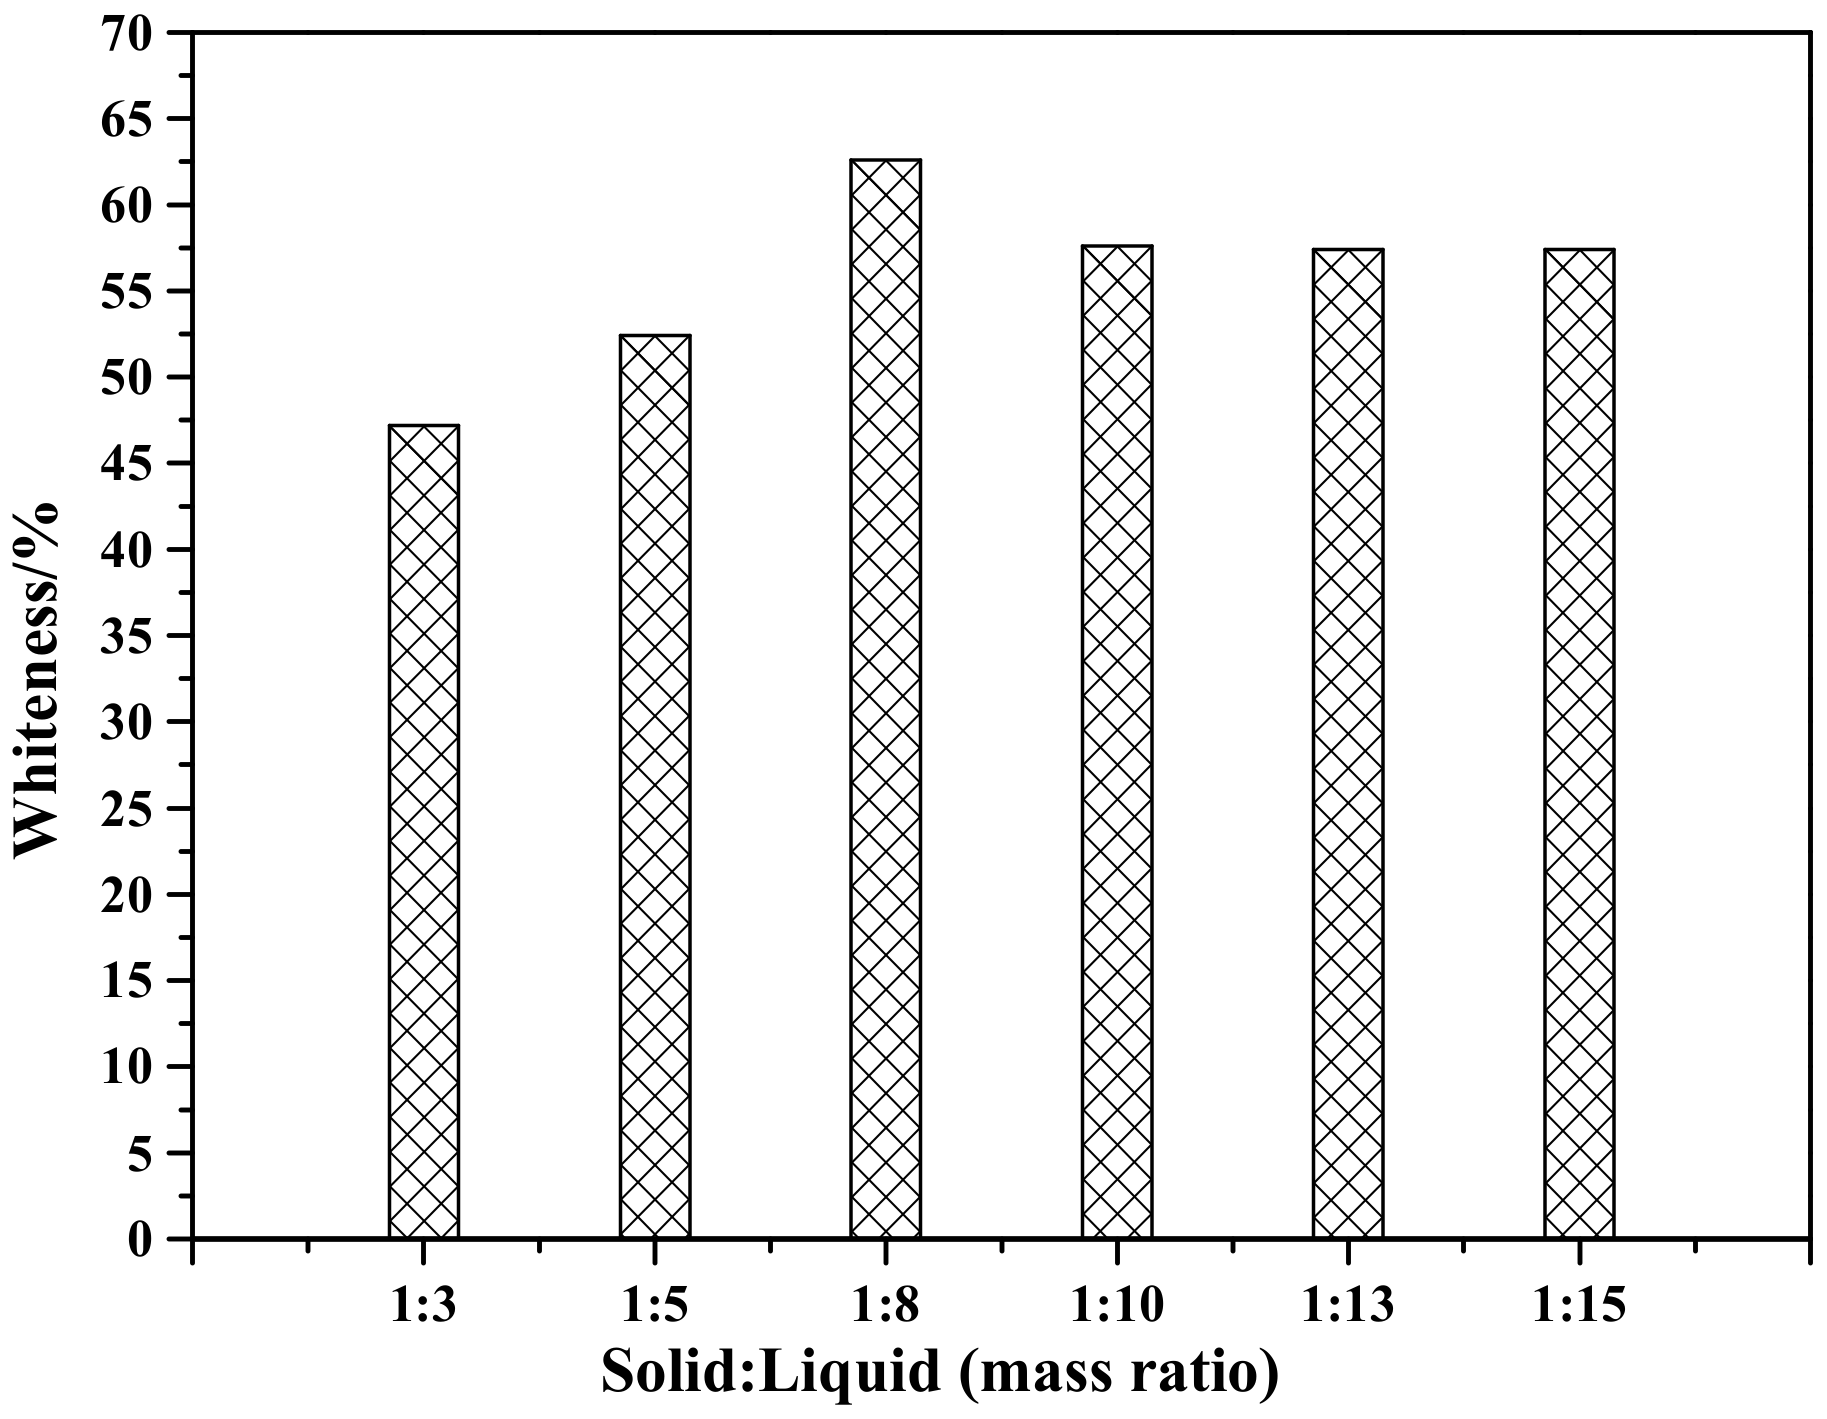
3.1. Effects of Processing Parameters on ZCFA Whiteness and Morphology
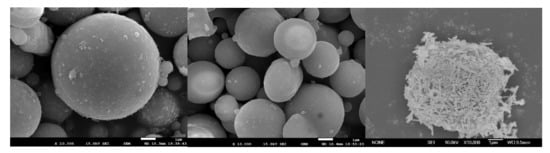
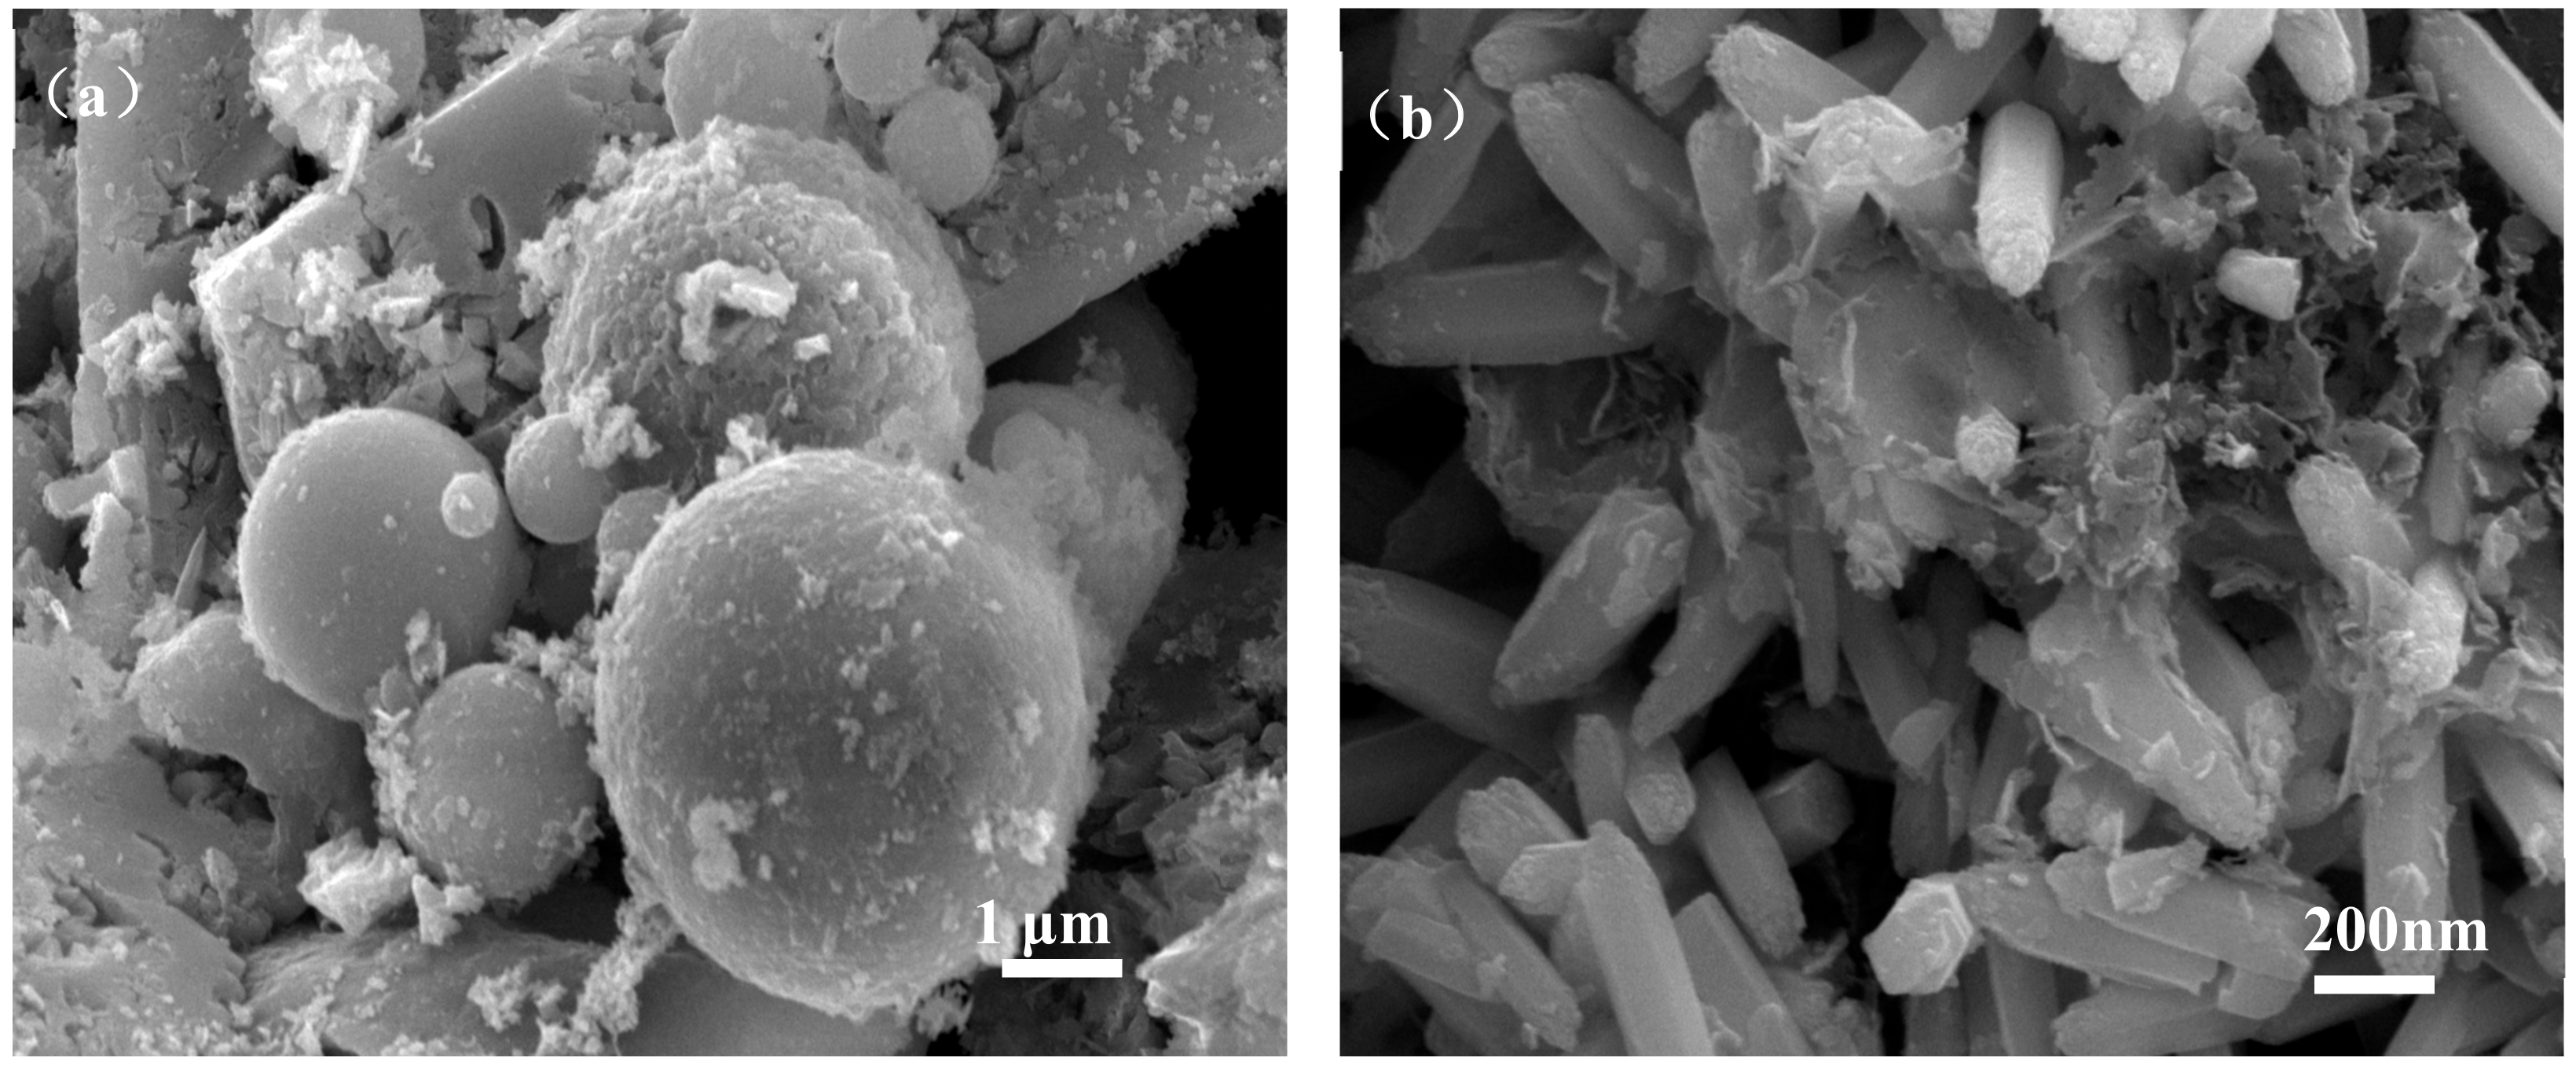
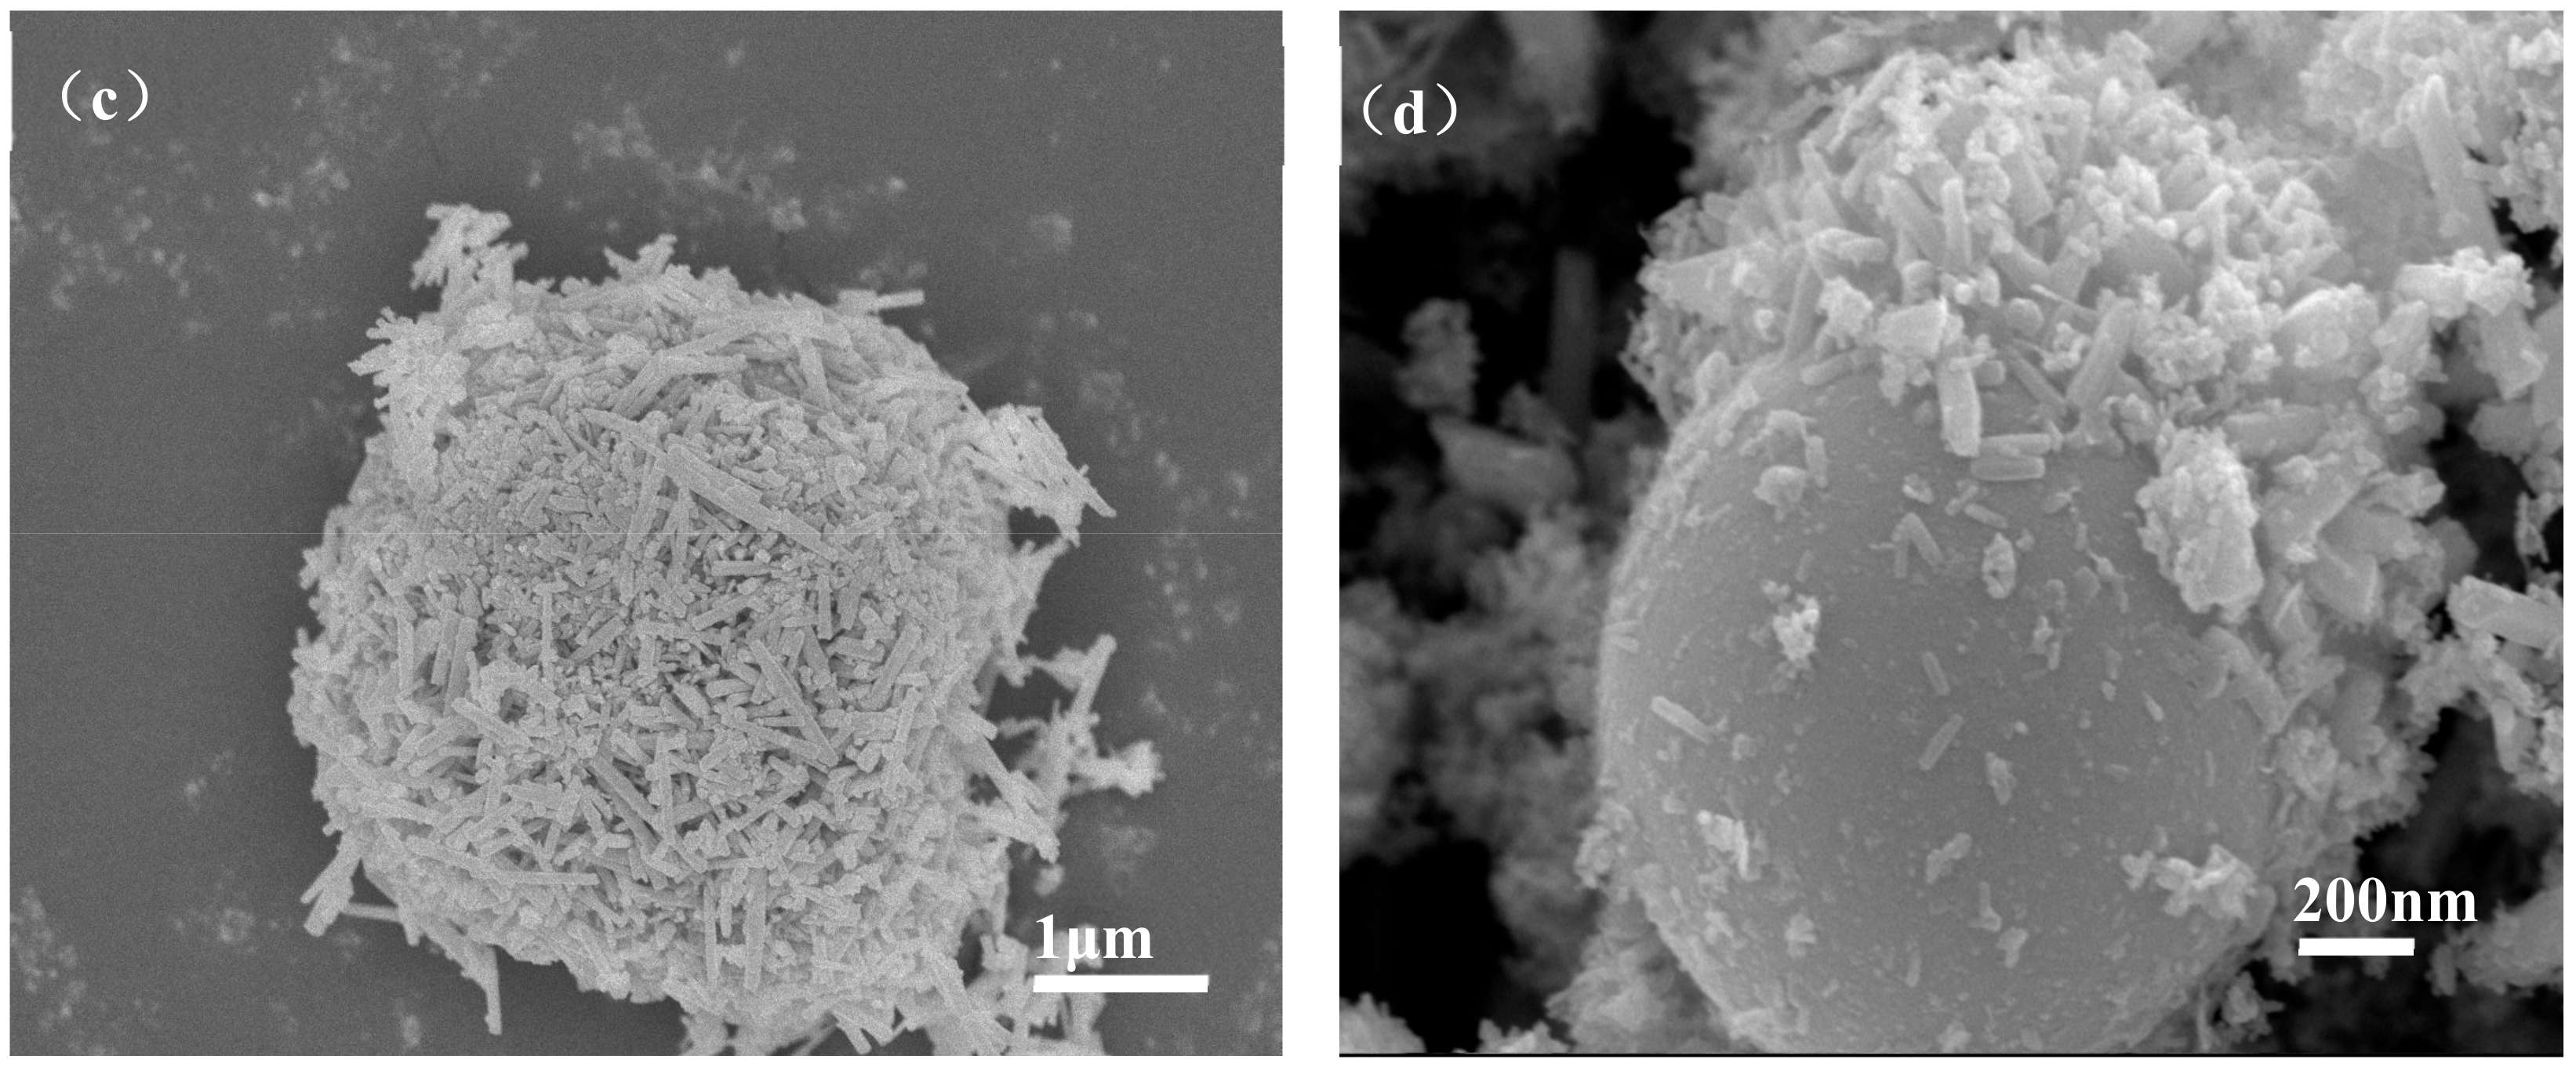
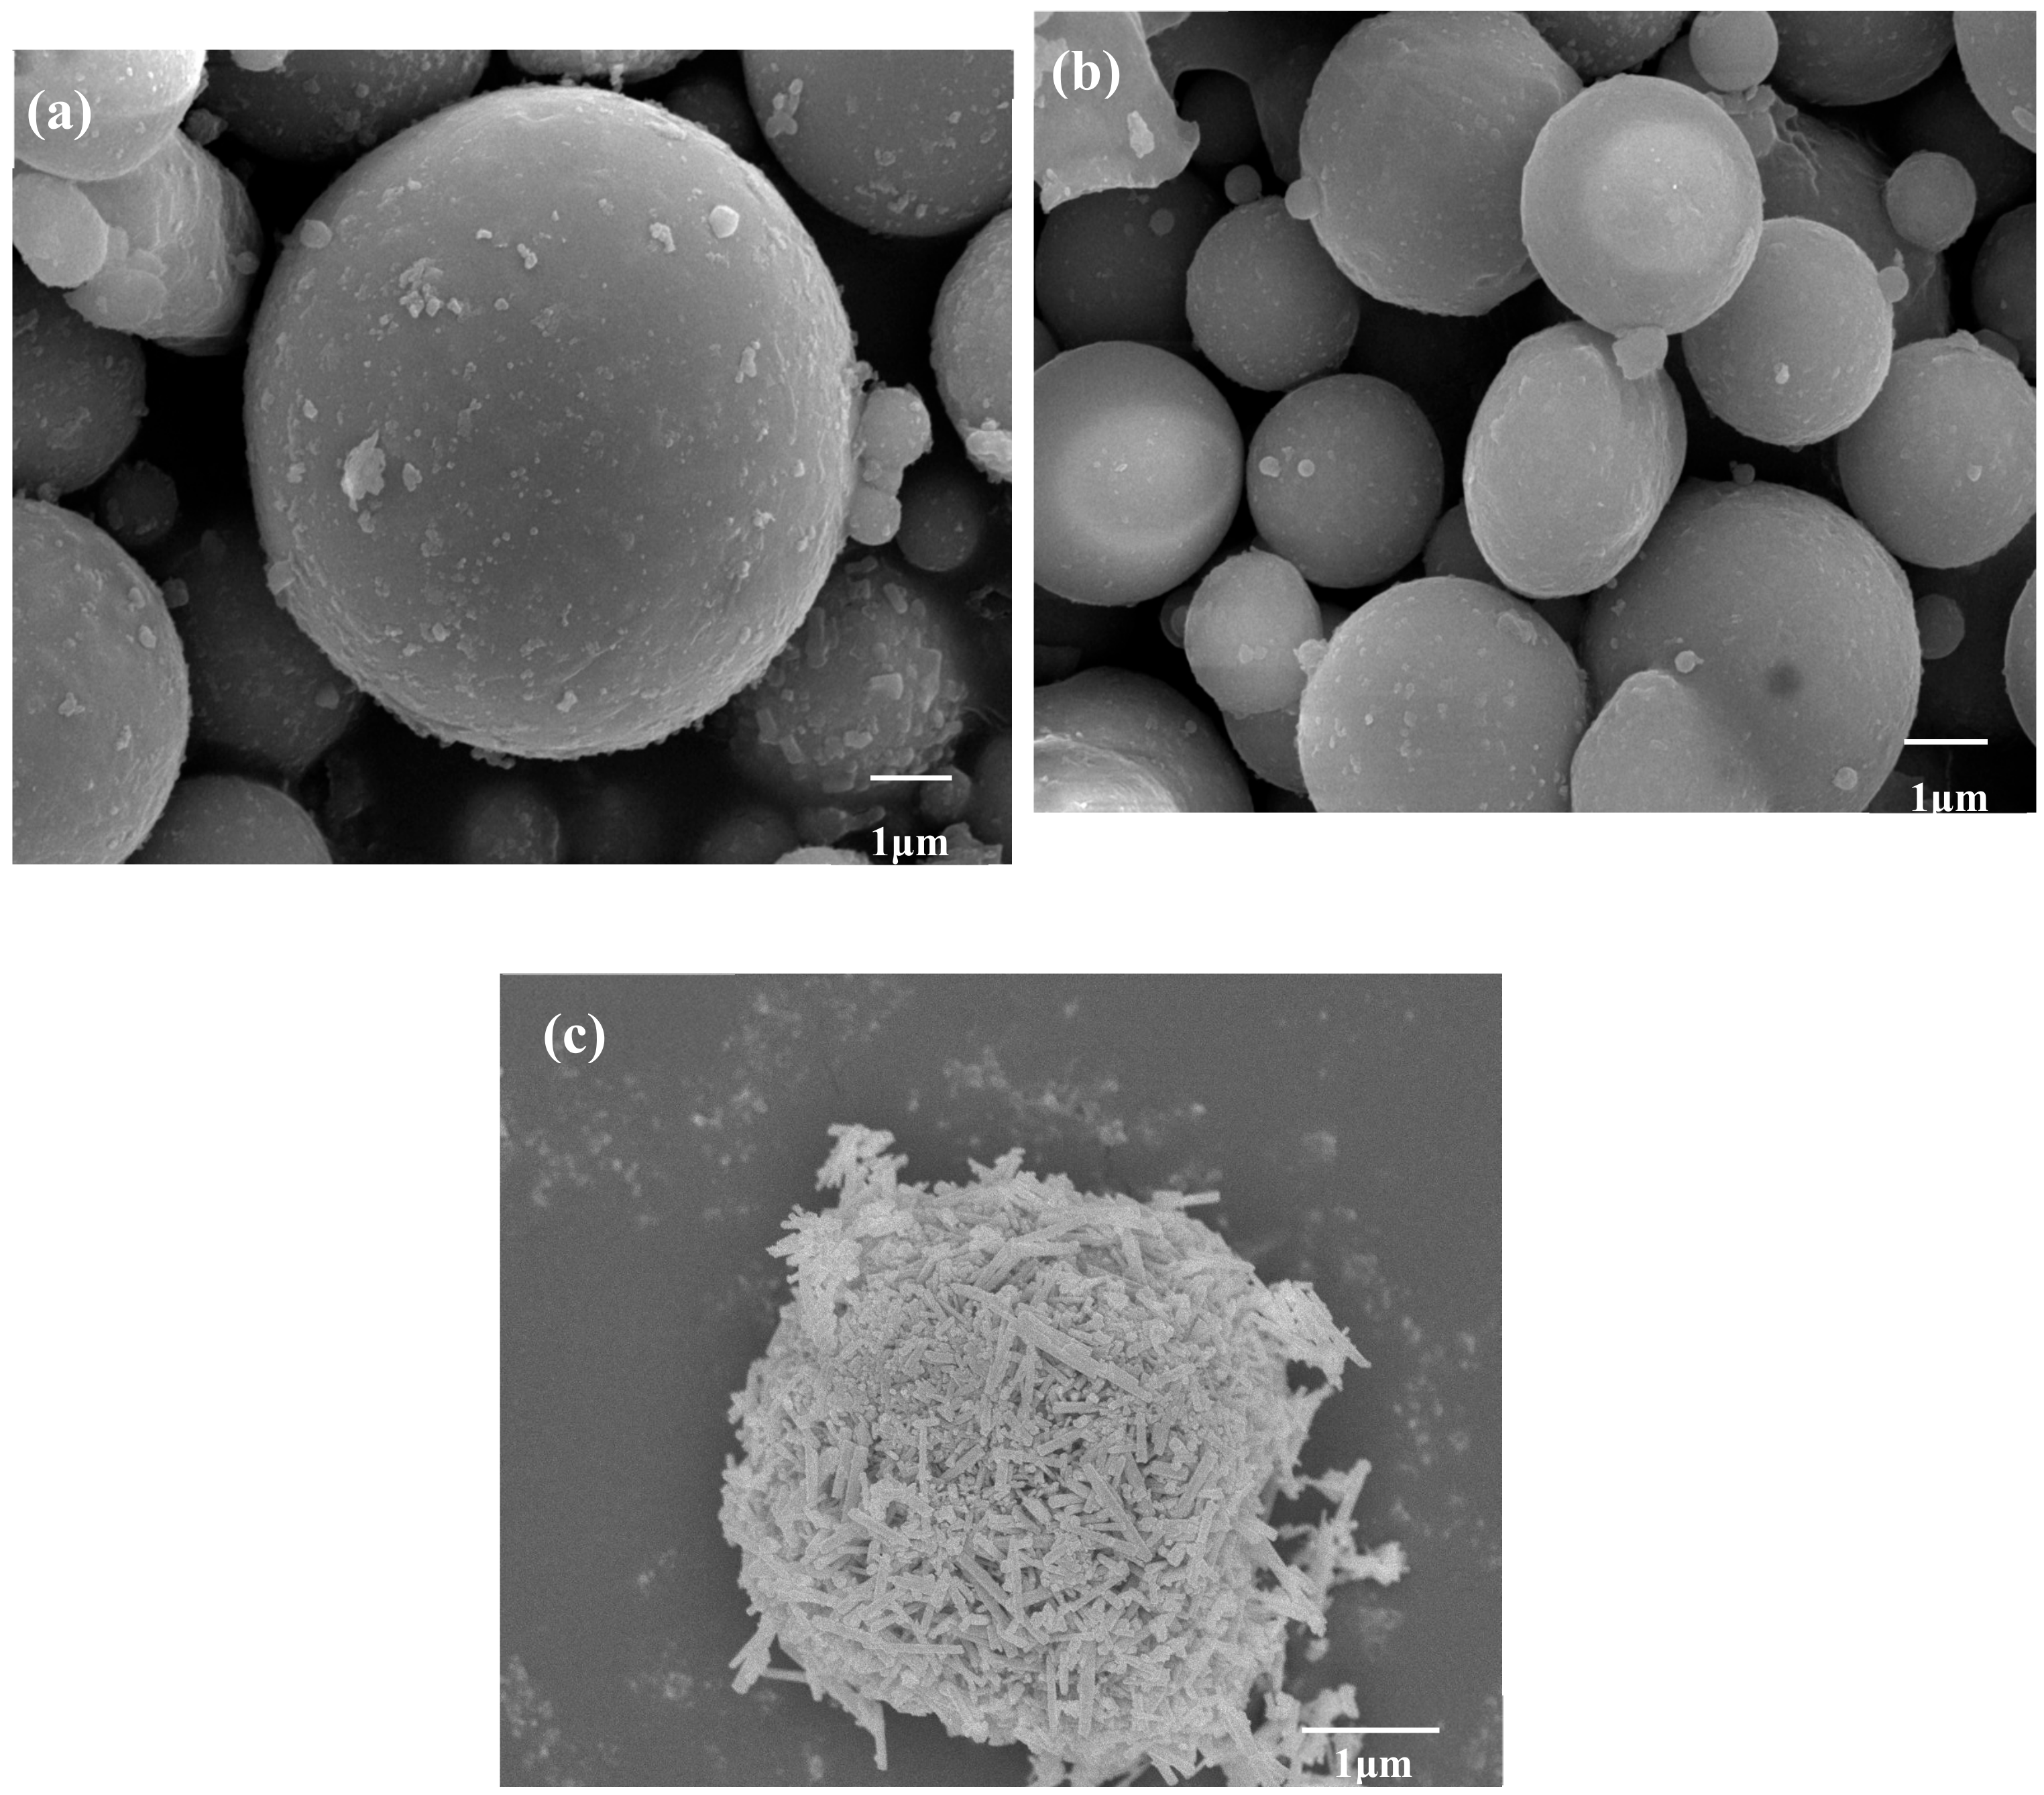
3.2. Morphology of ZCFA
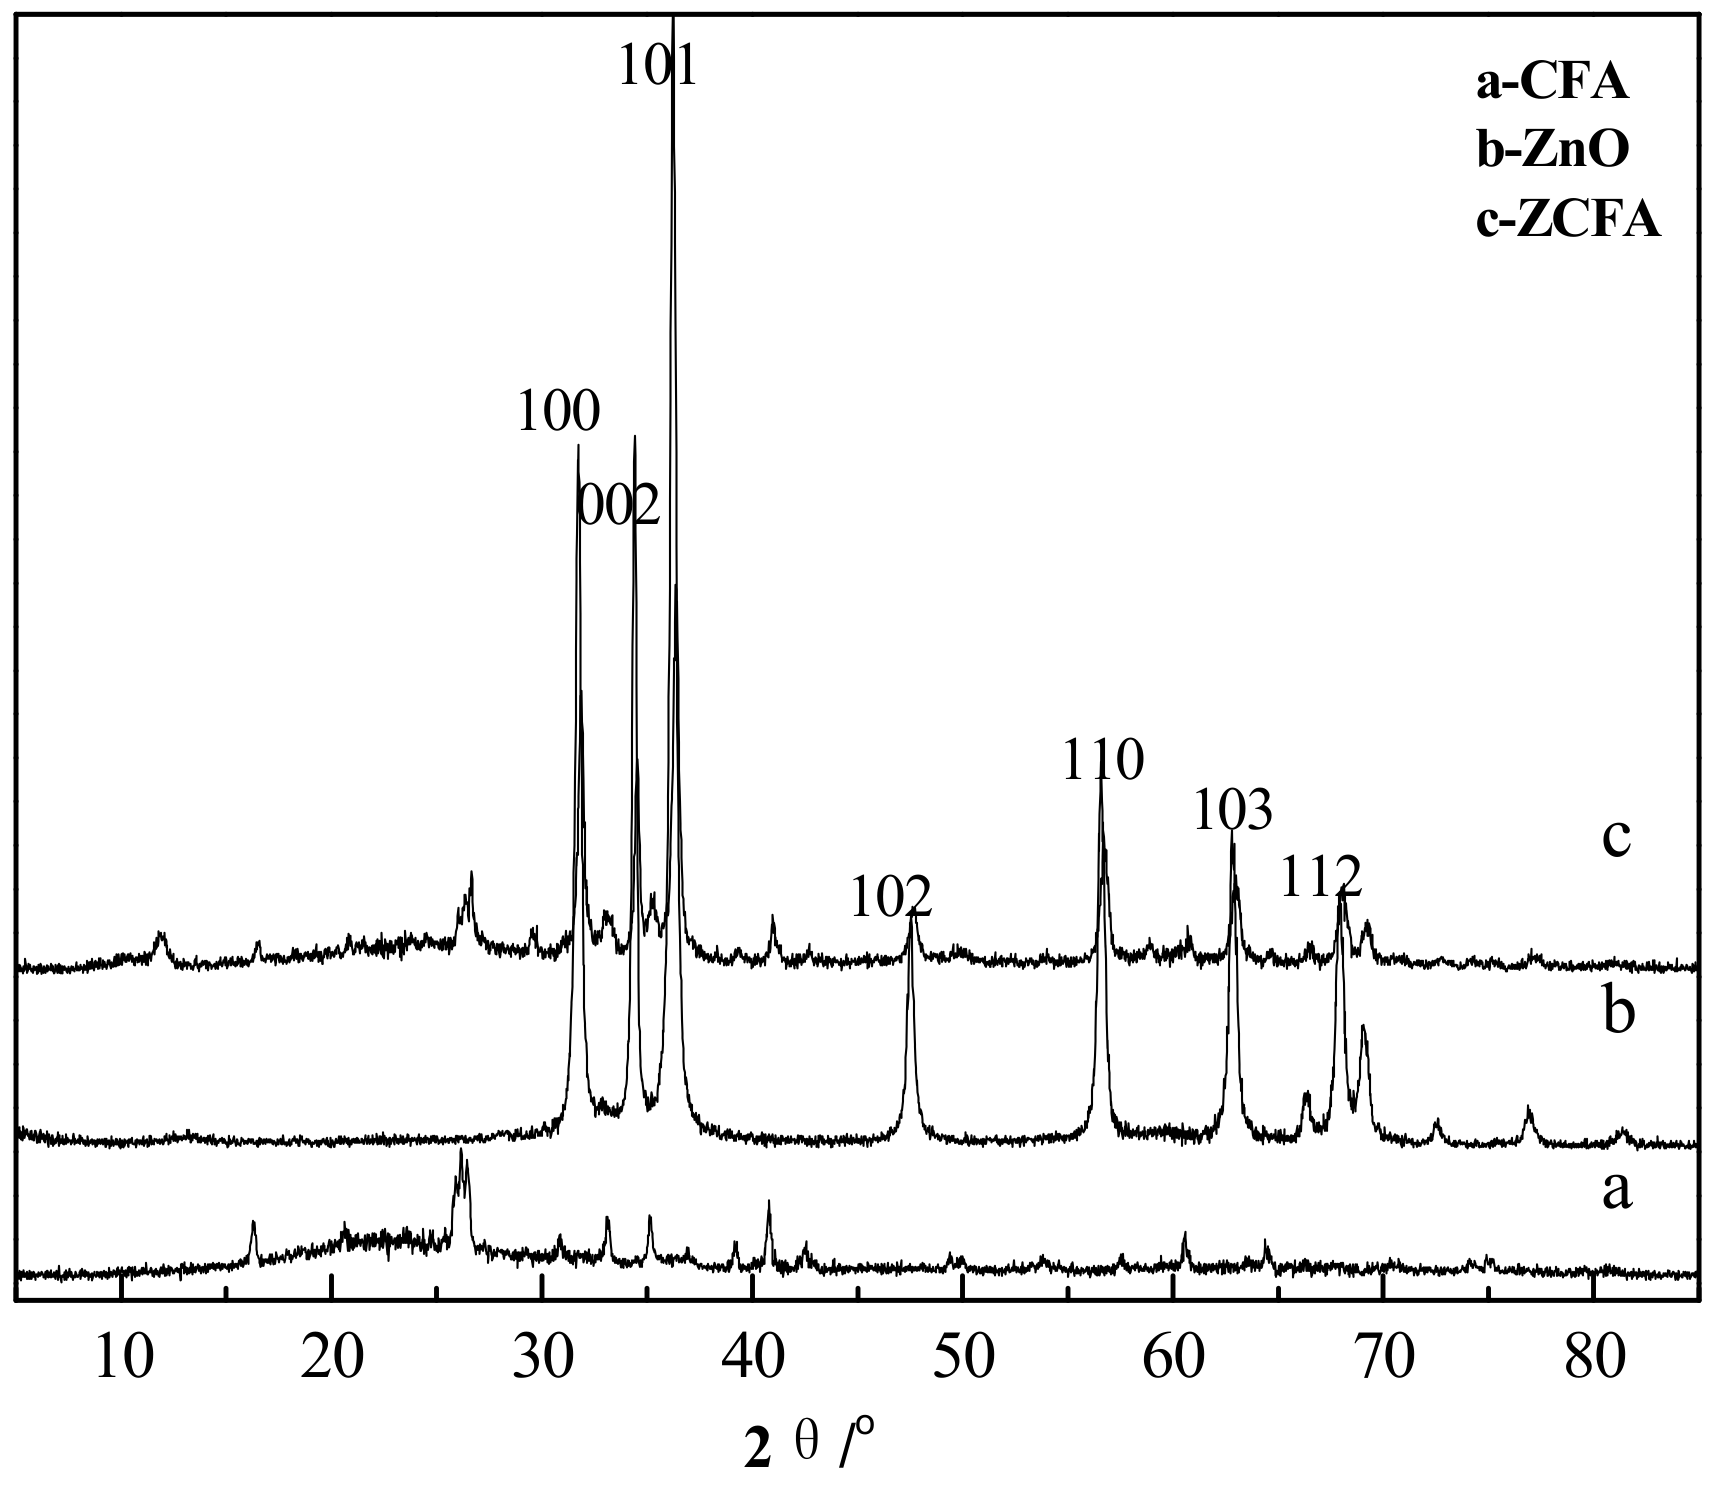
3.3. XRD Analysis
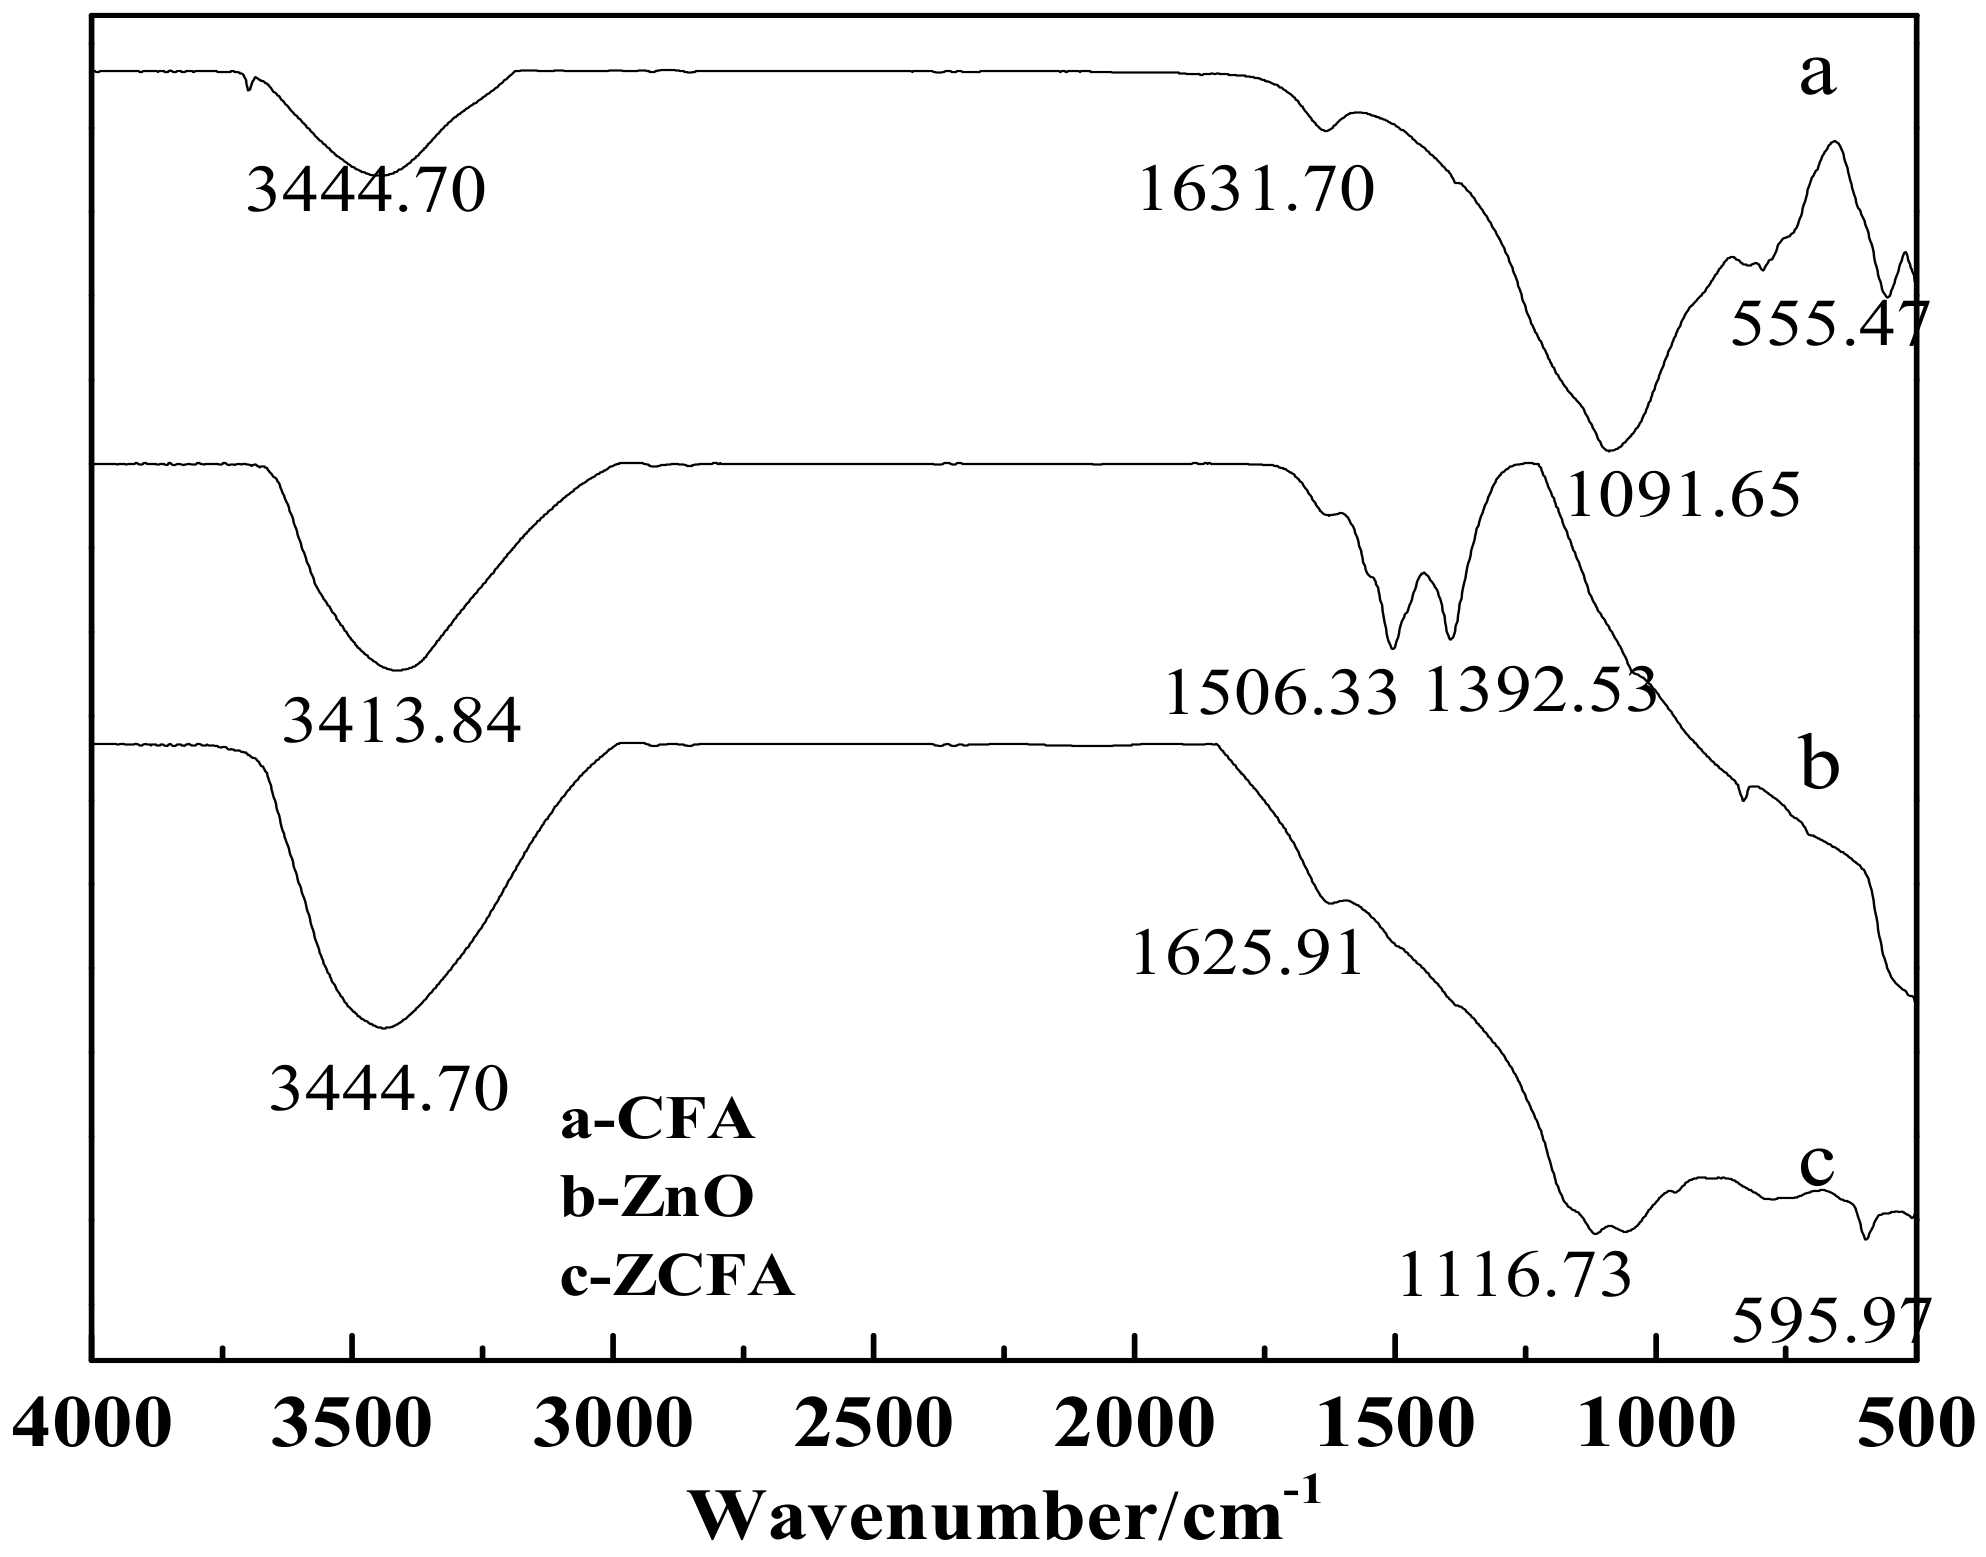
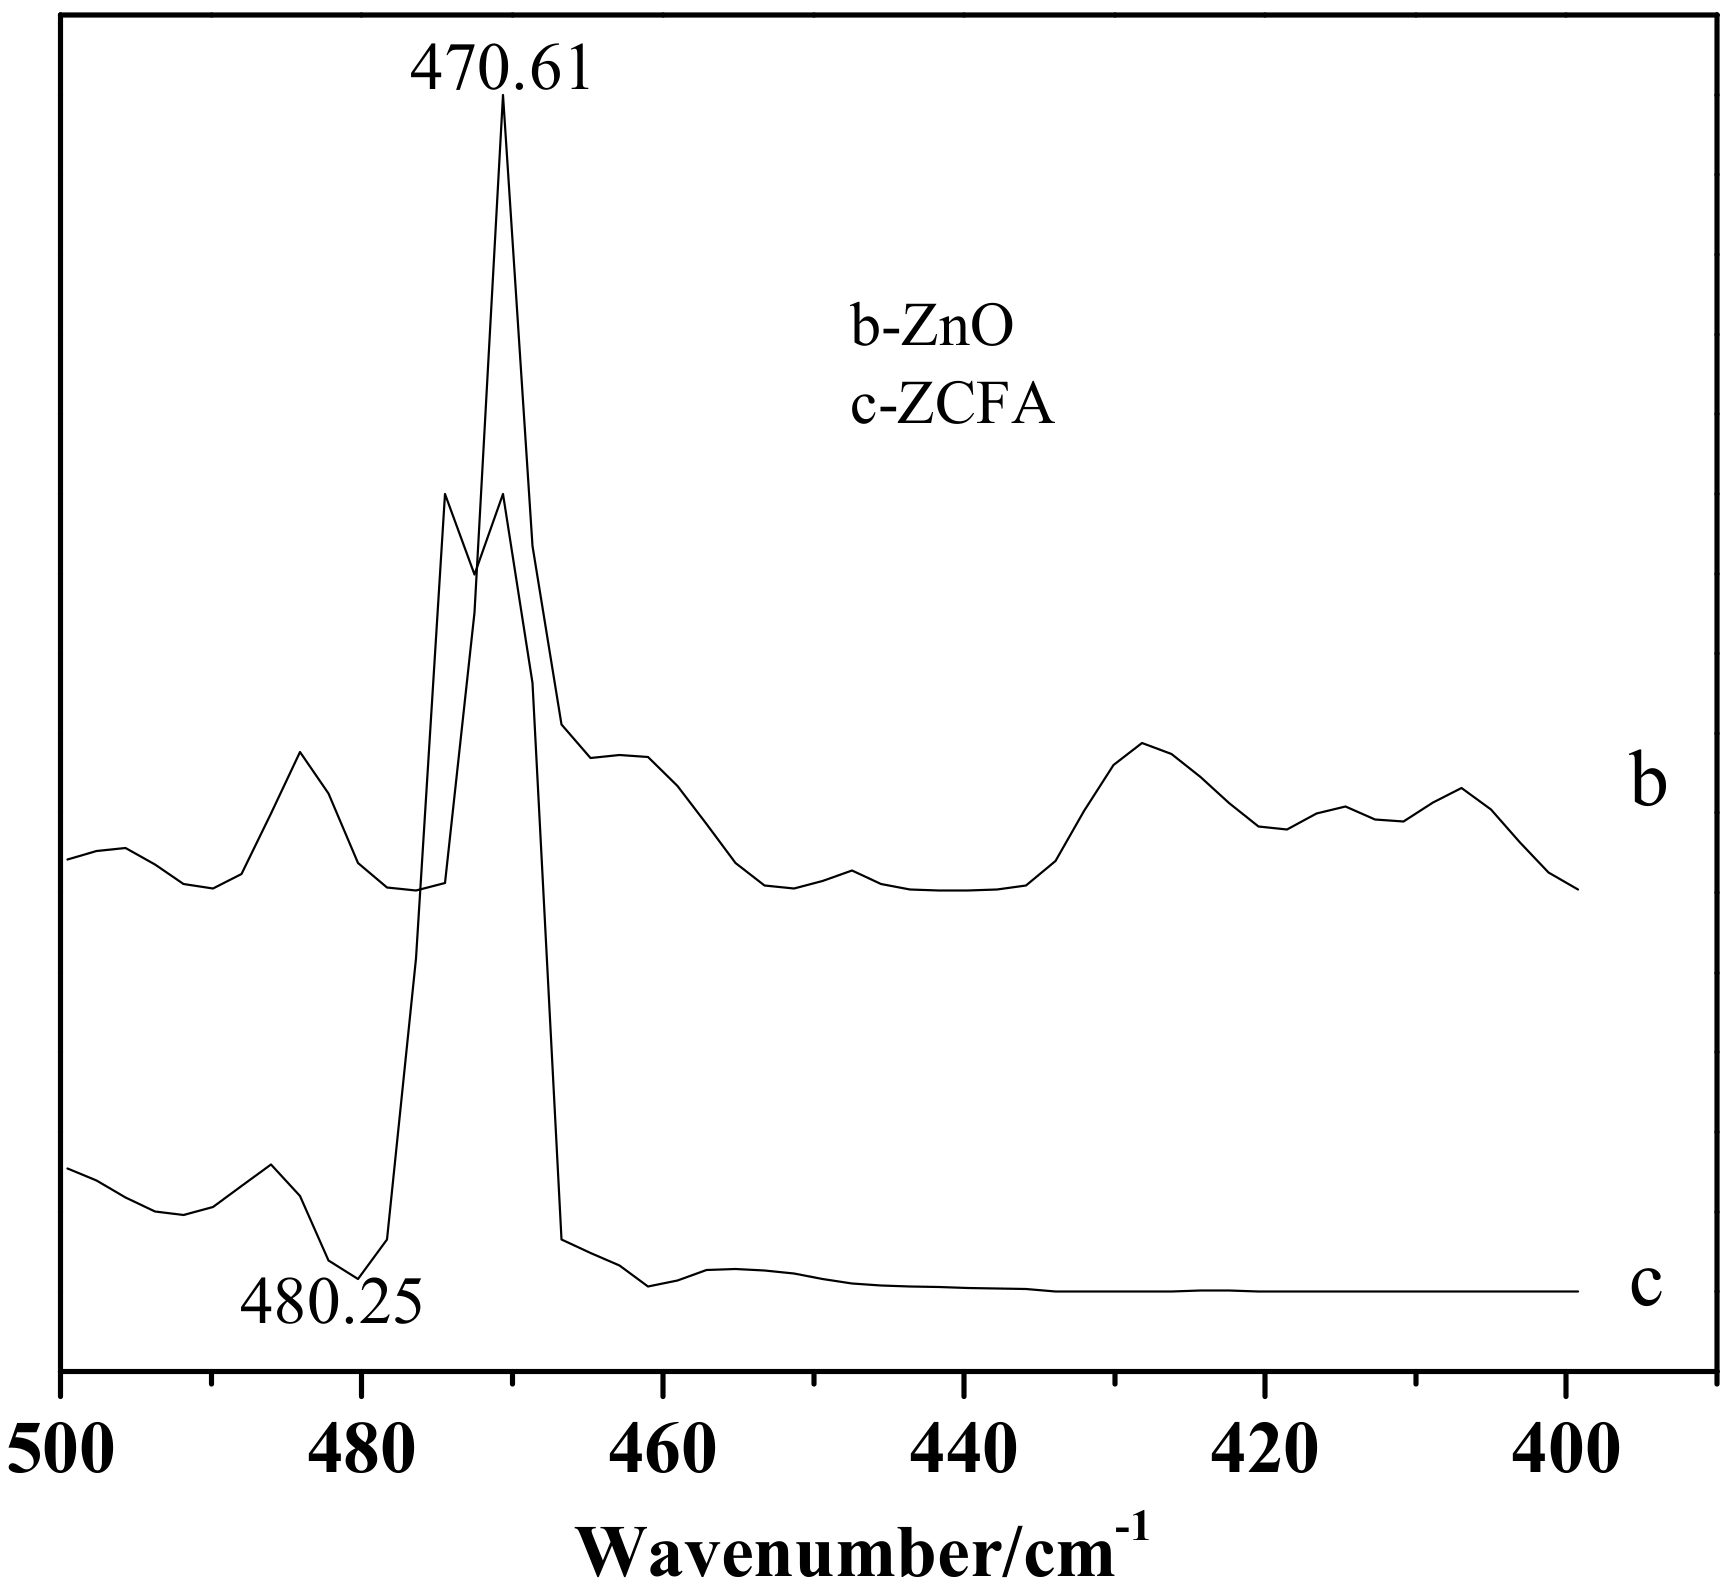
3.4. FTIR Analysis
3.5. Specific Surface Area and Pore Characteristics
4. Conclusions
Author Contributions
Funding
Conflicts of Interest
References
- Wang, S.B.; Wu, H.W. Environmental-benign utilisation of fly ash as low-cost adsorbents. J. Hazard. Mater. 2006, 136, 482–501. [Google Scholar] [CrossRef] [PubMed]
- Parvaiz, M.R.; Mohanty, S.; Nayak, S.K.; Mahanwar, P.A. Effect of surface modification of fly ash on the mechanical, thermal, electrical and morphological properties of polyetheretherketone composites. Mater. Sci. Eng. A 2011, 528, 4277–4286. [Google Scholar] [CrossRef]
- Albitar, M.; Mohamed Ali, M.S.; Visintin, P. Experimental study on fly ash and lead smelter slag-based geopolymer concrete columns. Constr. Build. Mater. 2017, 141, 104–112. [Google Scholar] [CrossRef]
- Mohammadinia, A.; Arulrajah, A.; Horpibulsuk, S.; Chinkulkijniwat, A. Effect of fly ash on properties of crushed brick and reclaimed asphalt in pavement base/subbase applications. J. Hazard. Mater. 2017, 321, 547–556. [Google Scholar] [CrossRef]
- Yang, L.; Gao, Y.N.; Wang, F.Z.; Liu, P.; Hu, S.G. Enhanced photocatalytic performance of cementitious material with TiO2@Ag modified fly ash micro-aggregates. Chin. J. Catal. 2017, 38, 357–364. [Google Scholar] [CrossRef]
- Shaheen, S.M.; Hooda, P.S.; Tsadilas, C.D. Opportunities and challenges in the use of coal fly ash for soil improvements-A review. J. Environ. Manag. 2014, 145, 249–267. [Google Scholar] [CrossRef]
- Kesarla, H.; Robit, K.; Mohod, A.; Tanji, S.; Mane, O.; Venkatachalam, G. Study on Tensile Behavior of Fly Ash Reinforced Hybrid Polymer Matrix Composite. Mater. Today Proc. 2018, 5, 11922–11932. [Google Scholar] [CrossRef]
- Wang, S.B.; Ma, Q.; Zhu, Z.H. Characteristics of coal fly ash and adsorption application. Fuel 2008, 87, 3469–3473. [Google Scholar] [CrossRef]
- Zhuang, X.Y.; Chen, L.; Komarneni, S.; Zhou, C.H.; Tong, D.S.; Yang, H.M.; Yu, W.H.; Wang, H. Fly ash-based geopolymer: Clean, production, properties and applications. J. Clean. Prod. 2016, 125, 253–267. [Google Scholar] [CrossRef]
- Catauro, M.; Tranquillo, E.; Barrino, F.; Poggetto, G.D.; Blanco, I.; Cicala, G.; Ognibene, G.; Recca, G. Mechanical and thermal properties of fly ash-filled geopolymers. J. Therm. Anal. Calorim. 2019. [Google Scholar] [CrossRef]
- Anandhan, S.; Sundar, S.M.; Senthil, T.; Mahendran, A.R.; Shibulal, G.S. Extruded poly(ethylene -co-octene)/fly ash composites-value added products from an environmental pollutant. J. Polym. Res. 2012, 19, 1–11. [Google Scholar] [CrossRef]
- Yang, Y.F.; Gai, G.S.; Cai, Z.F.; Chen, Q.R. Surface modification of purified fly ash and application in polymer. J. Hazard. Mater. 2006, 133, 276–282. [Google Scholar] [CrossRef] [PubMed]
- Wang, C.L.; Wang, D.; Zheng, S.L. Preparation of aluminum silicate/fly ash particles composite and its application in filling polyamide 6. Mater. Lett. 2013, 111, 208–210. [Google Scholar] [CrossRef]
- Wang, C.L.; Wang, D.; Zheng, S.L. Characterization, organic modification of wollastonite coated with nano-Mg(OH)2 and its application in filling PA6. Mater. Res. Bull. 2014, 50, 273–278. [Google Scholar] [CrossRef]
- Cao, Z.J.; Chen, Q.Y.; Li, X.X.; Zhang, Y.C.; Ren, M.H.; Sun, L.F.; Wang, M.M.; Liu, X.T.; Yu, G. The non-negligible environmental risk of recycling halogenated flame retardants associated with plastic regeneration in China. Sci. Total Environ. 2019, 646, 1090–1096. [Google Scholar] [CrossRef] [PubMed]
- Fang, H.X.; Zhou, T.; Chen, X.P.; Li, S.M.; Shen, G.S.; Liao, X.Y. Controlled preparation and characterization of nano-sized hexagonal Mg(OH)2 flame retardant. Particuology 2014, 14, 51–56. [Google Scholar] [CrossRef]
- Liang, J.Z.; Feng, J.Q.; Tsui, C.P.; Tang, C.Y.; Liu, D.F.; Zhang, S.D.; Huang, W.F. Mechanical properties and flame-retardant of PP/MRP/Mg(OH)2/Al(OH)3 composites. Compos. Part B Eng. 2015, 71, 74–81. [Google Scholar] [CrossRef]
- Abd EI-Hady, M.M.; Farouk, A.; Sharaf, S. Flame retardancy and UV protection of cotton based fabrics using nano ZnO and polycarboxylic acids. Carbohyd. Polym. 2013, 92, 400–406. [Google Scholar] [CrossRef]
- Wang, M.Q.; Yan, J.; Cui, H.P.; Du, S.G. Low temperature preparation and characterization of TiO2 nanoparticles coated glass beads by heterogeneous nucleation method. Mater. Charact. 2013, 76, 39–47. [Google Scholar] [CrossRef]
- Hu, G.X.; Cai, X.; Rong, Y.H. Fundamentals of Materials Science, 3rd ed.; Shanghai Jiaotong University Press: Shanghai, China, 2010; pp. 230–236. [Google Scholar]
- Alswata, A.A.; Ahmad, M.B.; Al-Hada, N.M.; Kamari, H.M.; Hussein, M.Z.B.; Ibrahim, N.A. Preparation of Zeolite/Zinc Oxide Nanocomposites for toxic metals removal from water. Results Phys. 2017, 7, 723–731. [Google Scholar] [CrossRef]
- Meng, A.; Xing, J.; Li, Z.J.; Li, Q.D. Cr-Doped ZnO Nanoparticles: Synthesis, Characterization, Adsorption Property, and Recyclability. ACS Appl. Mater. Interfaces 2015, 7, 27449–27457. [Google Scholar] [CrossRef] [PubMed]
- Ke, C.J.; Jiang, P.; Wu, W.Z. Research on Autoclaved Reactivity of Fly Ash by Infrared Spectrum. J. Wuhan Univ. Technol. 2009, 31, 35–39. [Google Scholar]
- Wang, C.L.; Wang, D.; Yang, R.Q.; Wang, H.F. Preparation and electrical properties of wollastonite coated with antimony-doped tin oxide nanoparticles. Powder Technol. 2019, 342, 397–403. [Google Scholar] [CrossRef]


| Samples | SBET (m2/g) | Vtotal (cm3/g) | Vmeso (cm3/g) | Vmac (cm3/g) | D (nm) |
|---|---|---|---|---|---|
| FA | 5.80 | 0.0113 | 0.0112 | 0.0001 | 4.75 |
| CFA | 4.51 | 0.0090 | 0.0089 | 0.0001 | 4.86 |
| ZCFA | 14.61 | 0.0327 | 0.0324 | 0.0003 | 5.86 |
© 2019 by the authors. Licensee MDPI, Basel, Switzerland. This article is an open access article distributed under the terms and conditions of the Creative Commons Attribution (CC BY) license (http://creativecommons.org/licenses/by/4.0/).
Share and Cite
Wang, C.; Wang, J.; Bai, L.; Yang, R.; Wang, H. Preparation and Characterization of Fly Ash Coated with Zinc Oxide Nanocomposites. Materials 2019, 12, 3550. https://doi.org/10.3390/ma12213550
Wang C, Wang J, Bai L, Yang R, Wang H. Preparation and Characterization of Fly Ash Coated with Zinc Oxide Nanocomposites. Materials. 2019; 12(21):3550. https://doi.org/10.3390/ma12213550
Chicago/Turabian StyleWang, Caili, Jing Wang, Liqi Bai, Runquan Yang, and Huaifa Wang. 2019. "Preparation and Characterization of Fly Ash Coated with Zinc Oxide Nanocomposites" Materials 12, no. 21: 3550. https://doi.org/10.3390/ma12213550
APA StyleWang, C., Wang, J., Bai, L., Yang, R., & Wang, H. (2019). Preparation and Characterization of Fly Ash Coated with Zinc Oxide Nanocomposites. Materials, 12(21), 3550. https://doi.org/10.3390/ma12213550