Comparison of Concrete Creep in Compression, Tension, and Bending under Drying Condition


Abstract
1. Introduction
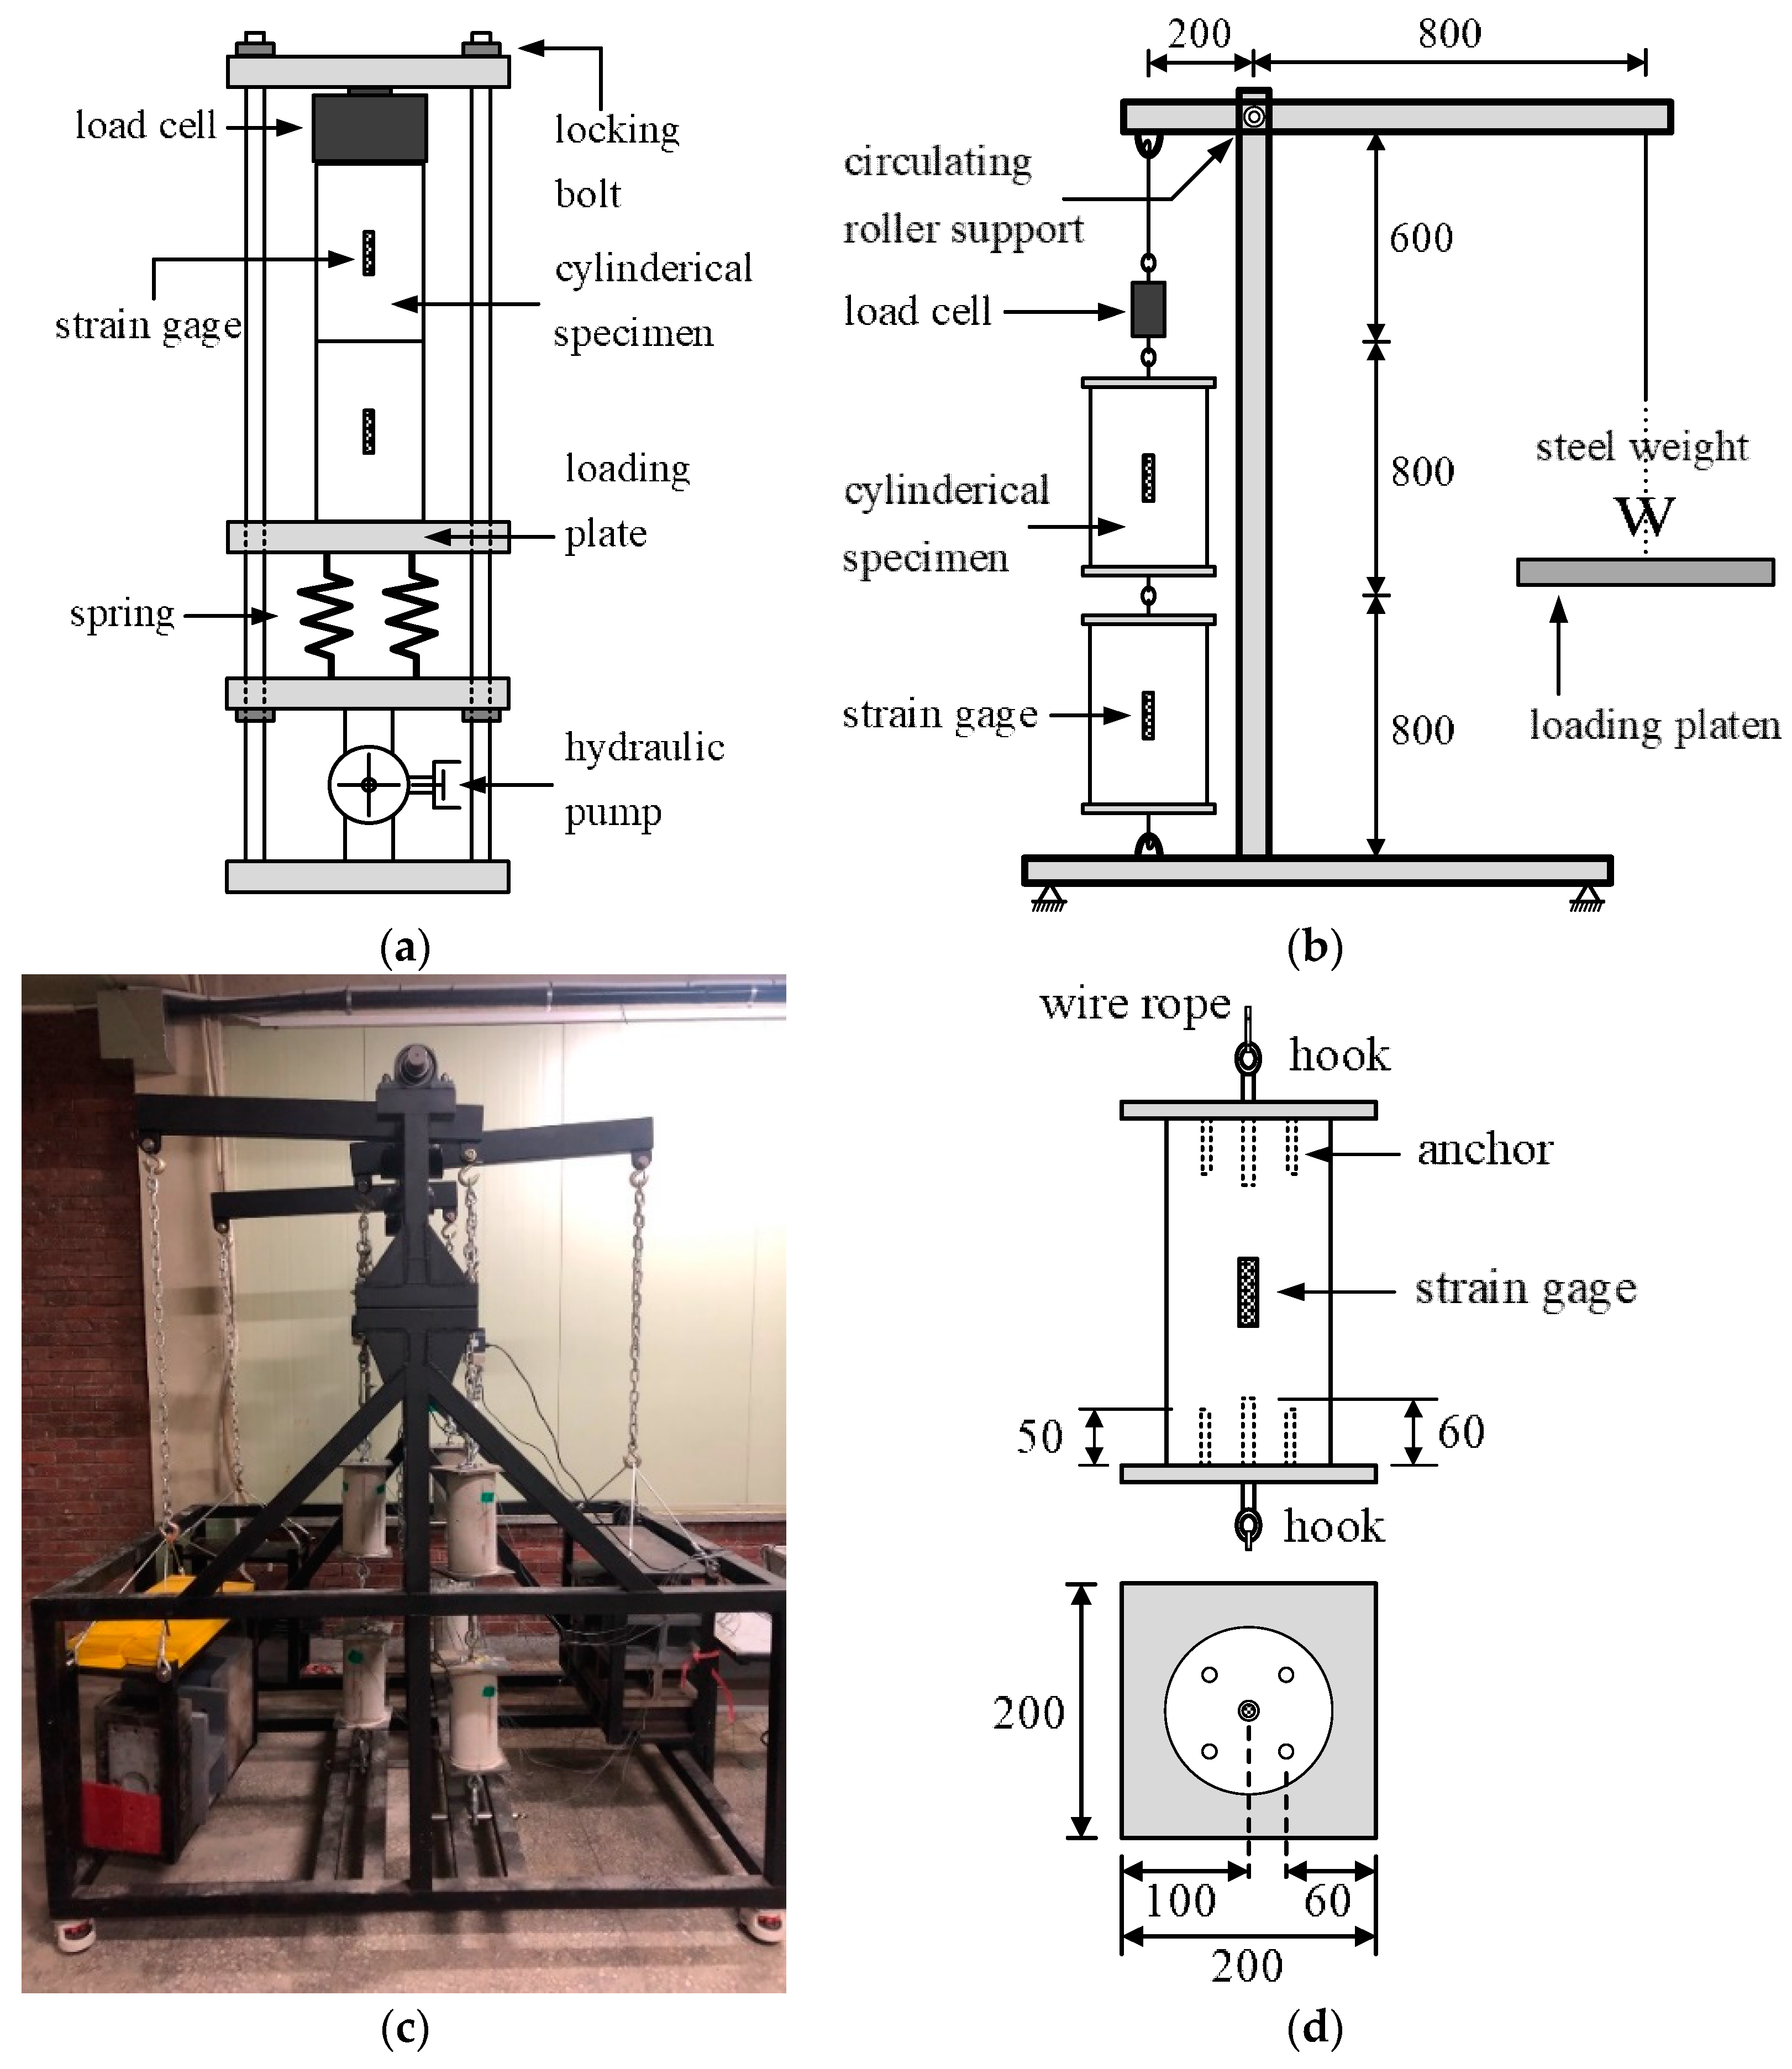
2. Test Setup
2.1. Test Plan
2.2. Creep Tests Under Compression and Tension
2.3. Beam Creep Test
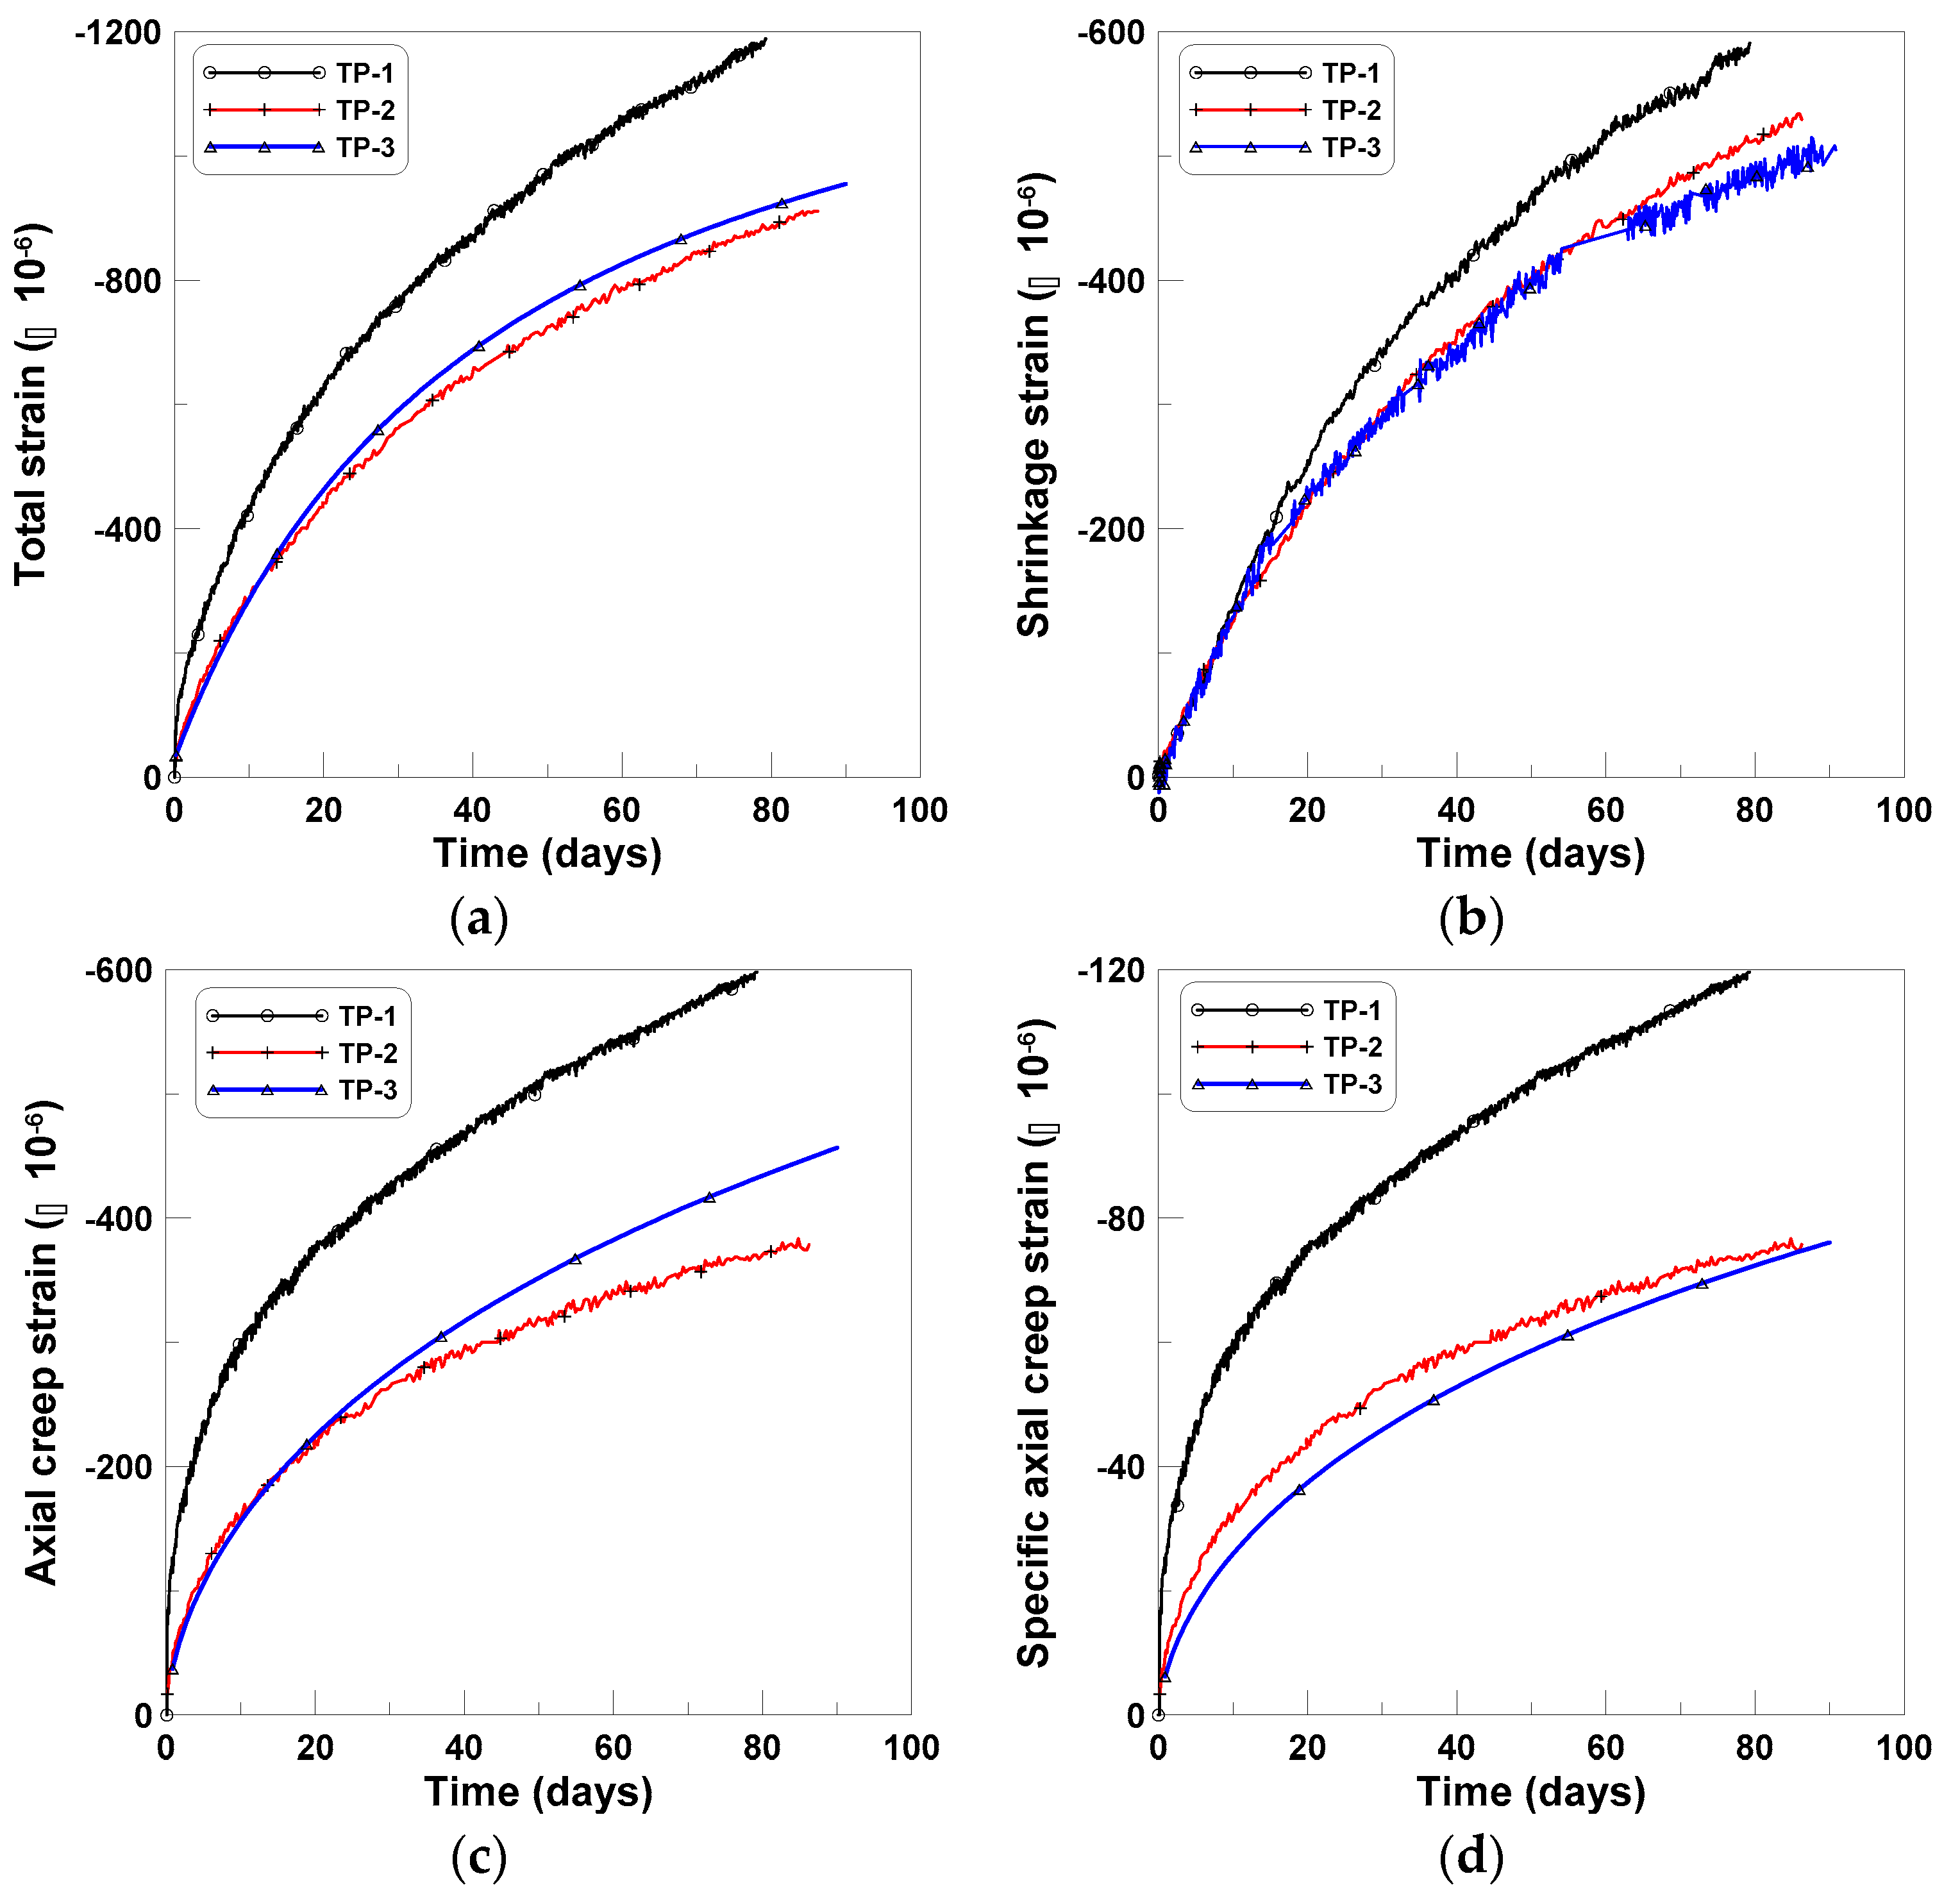
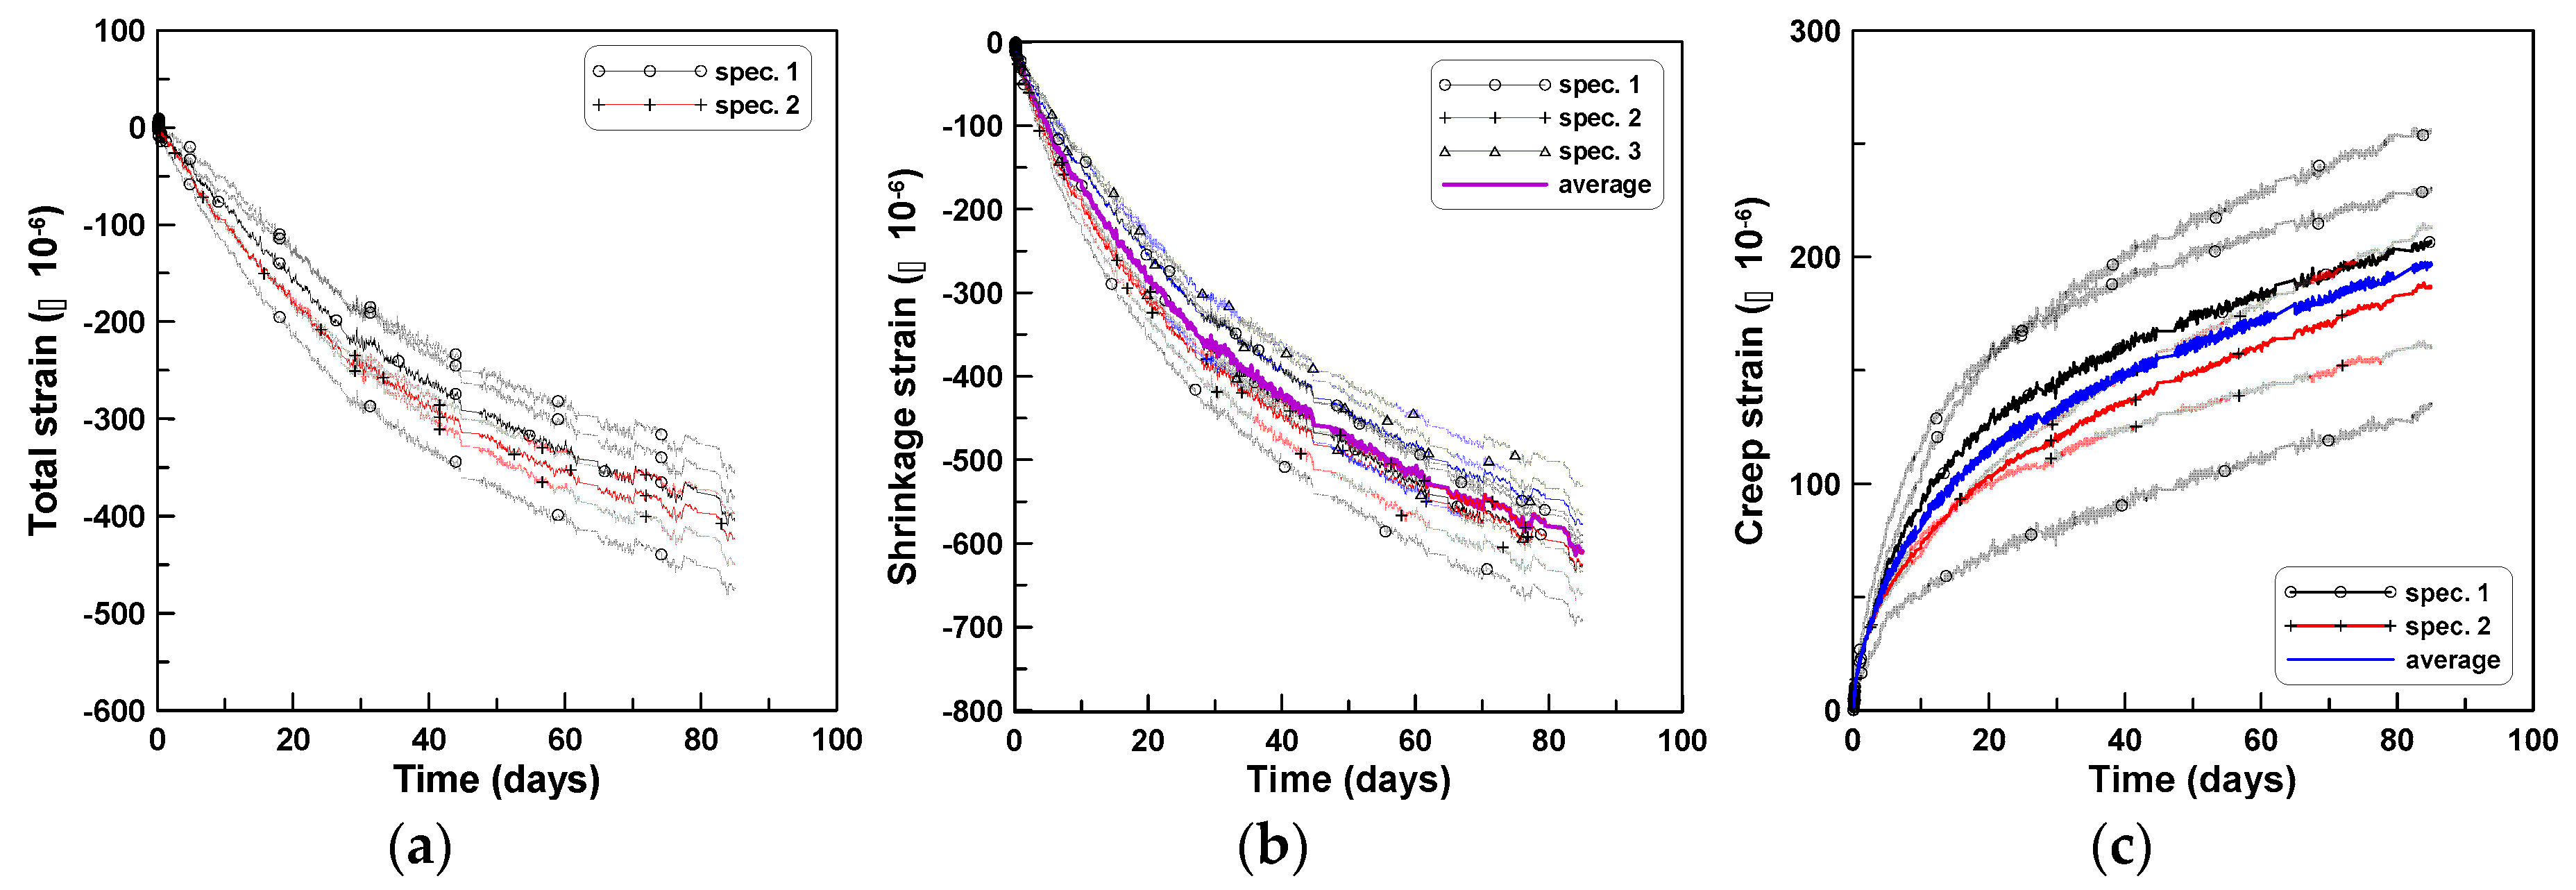
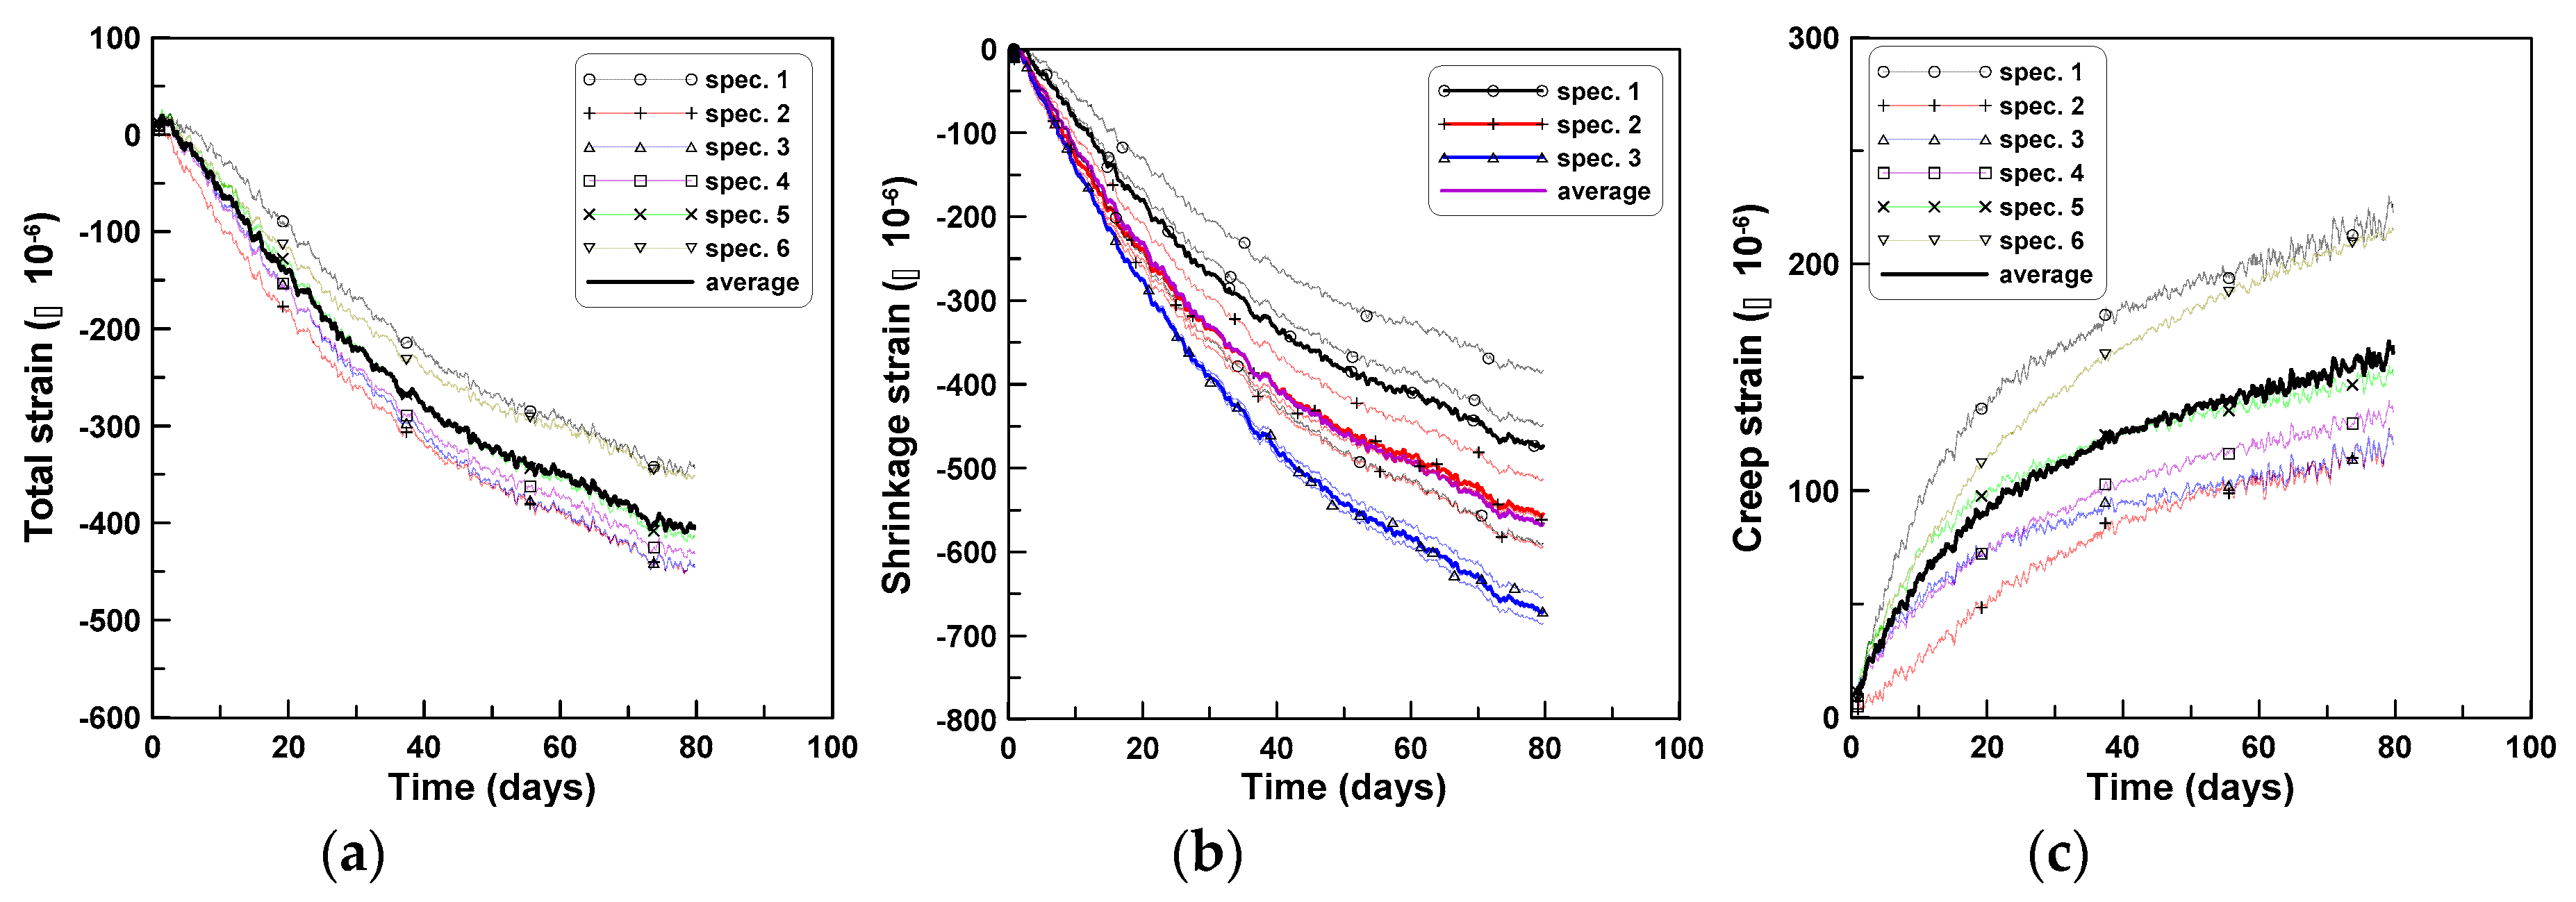
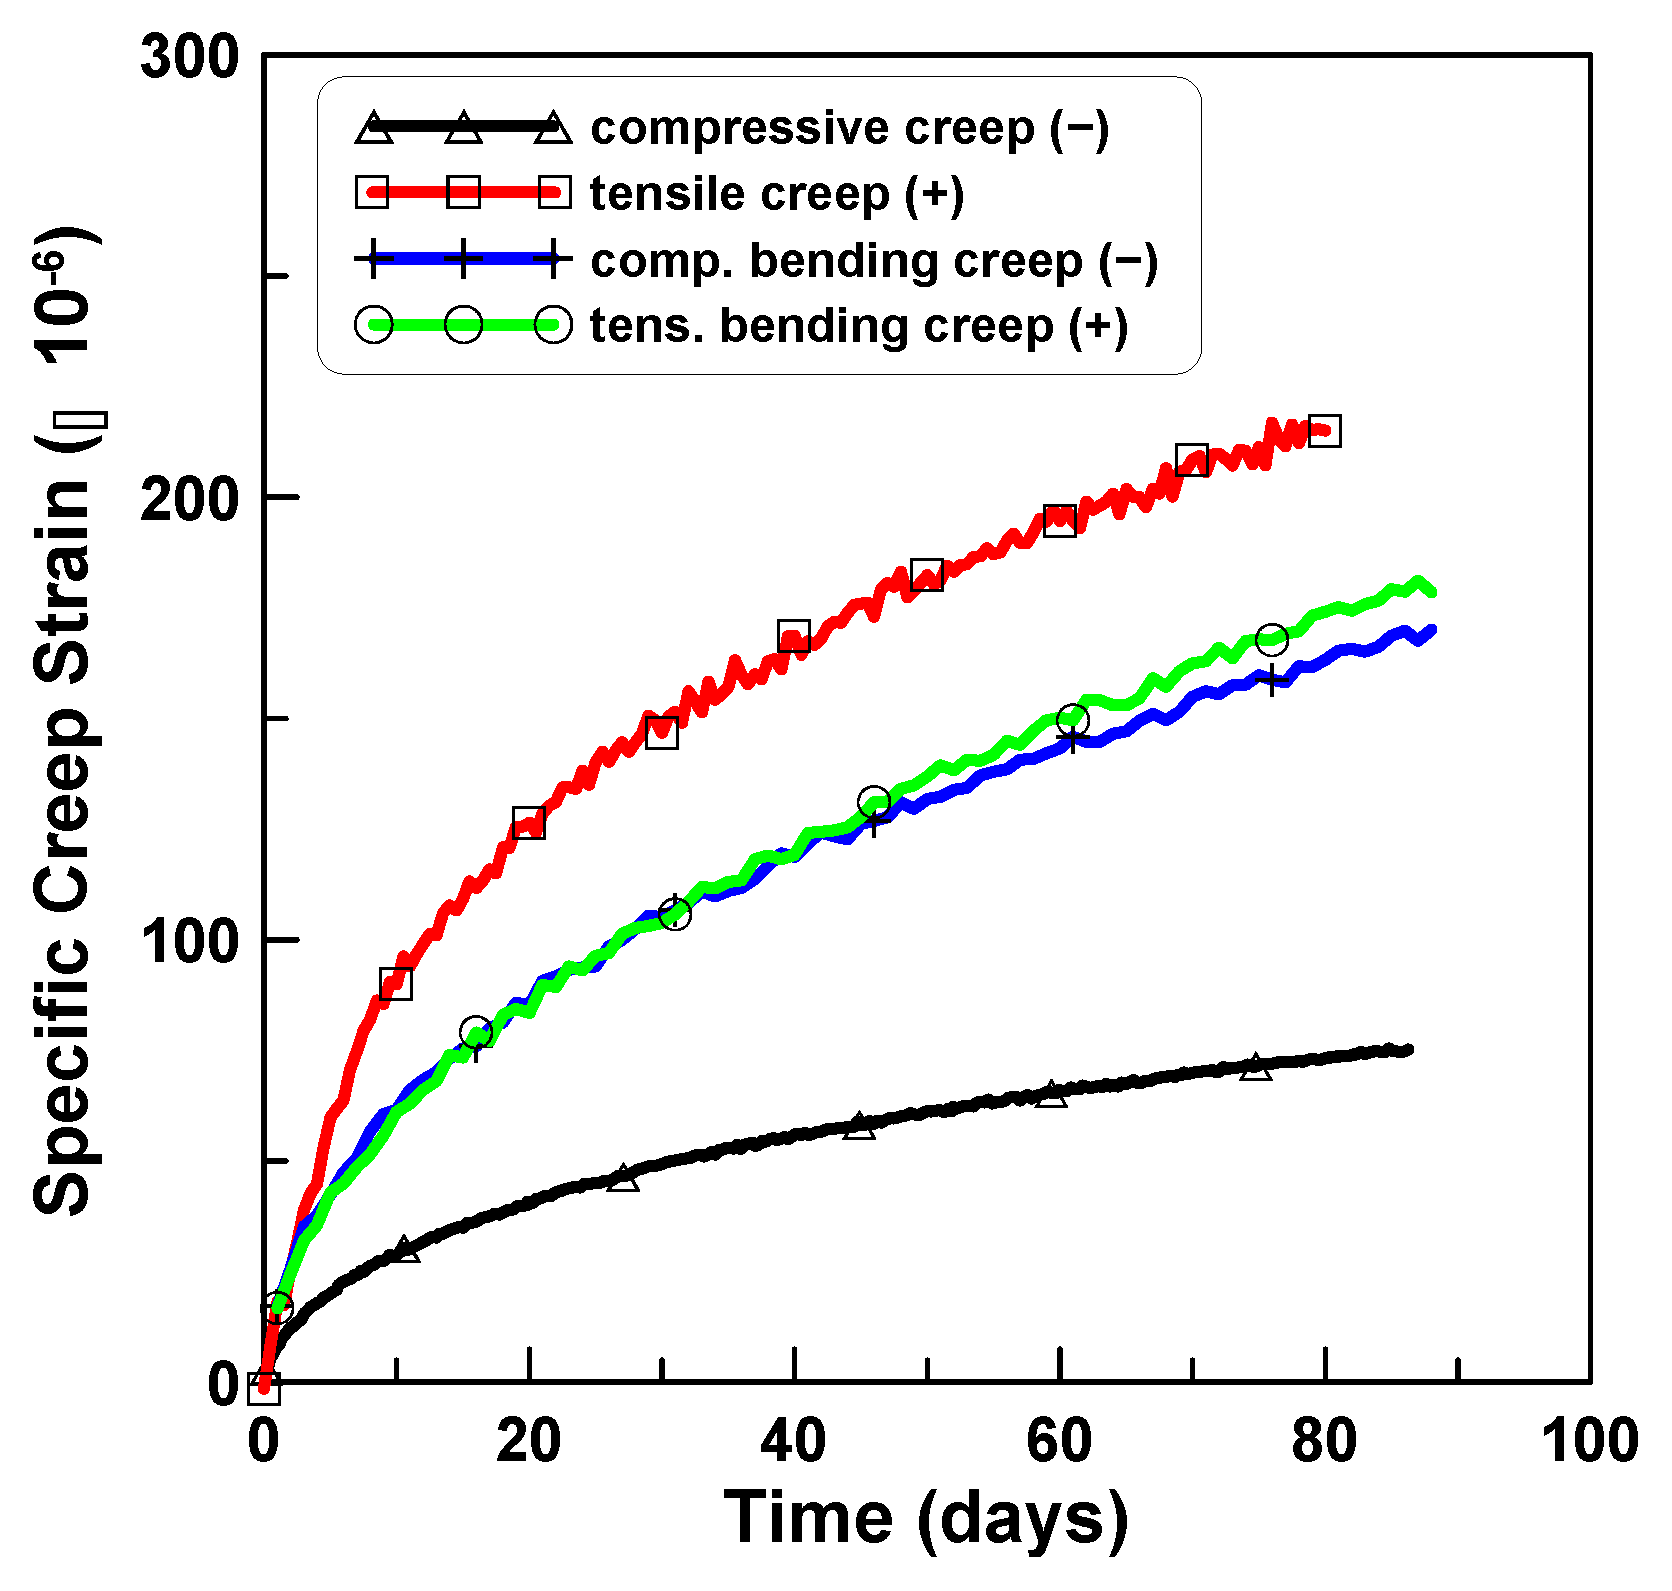
3. Test Results
3.1. Compression Creep
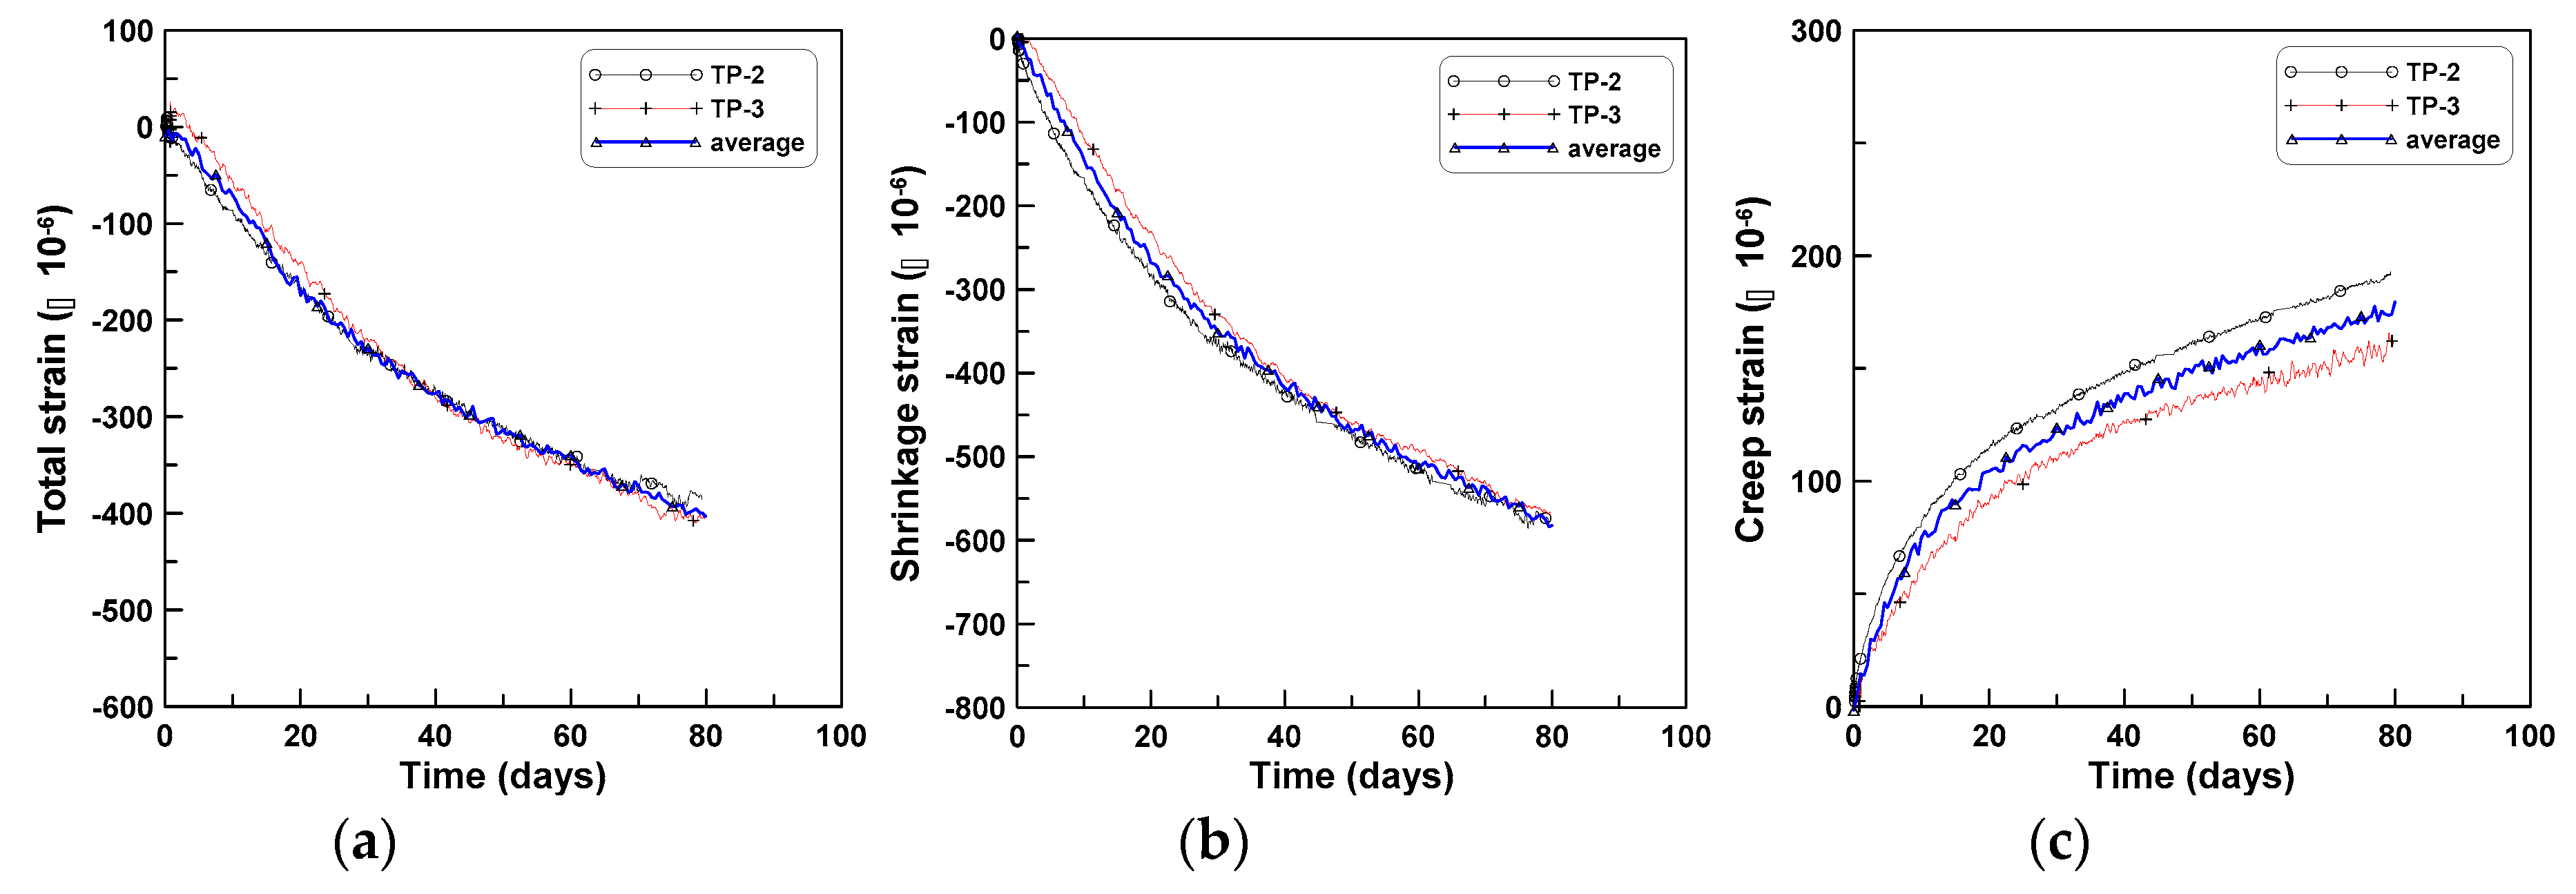
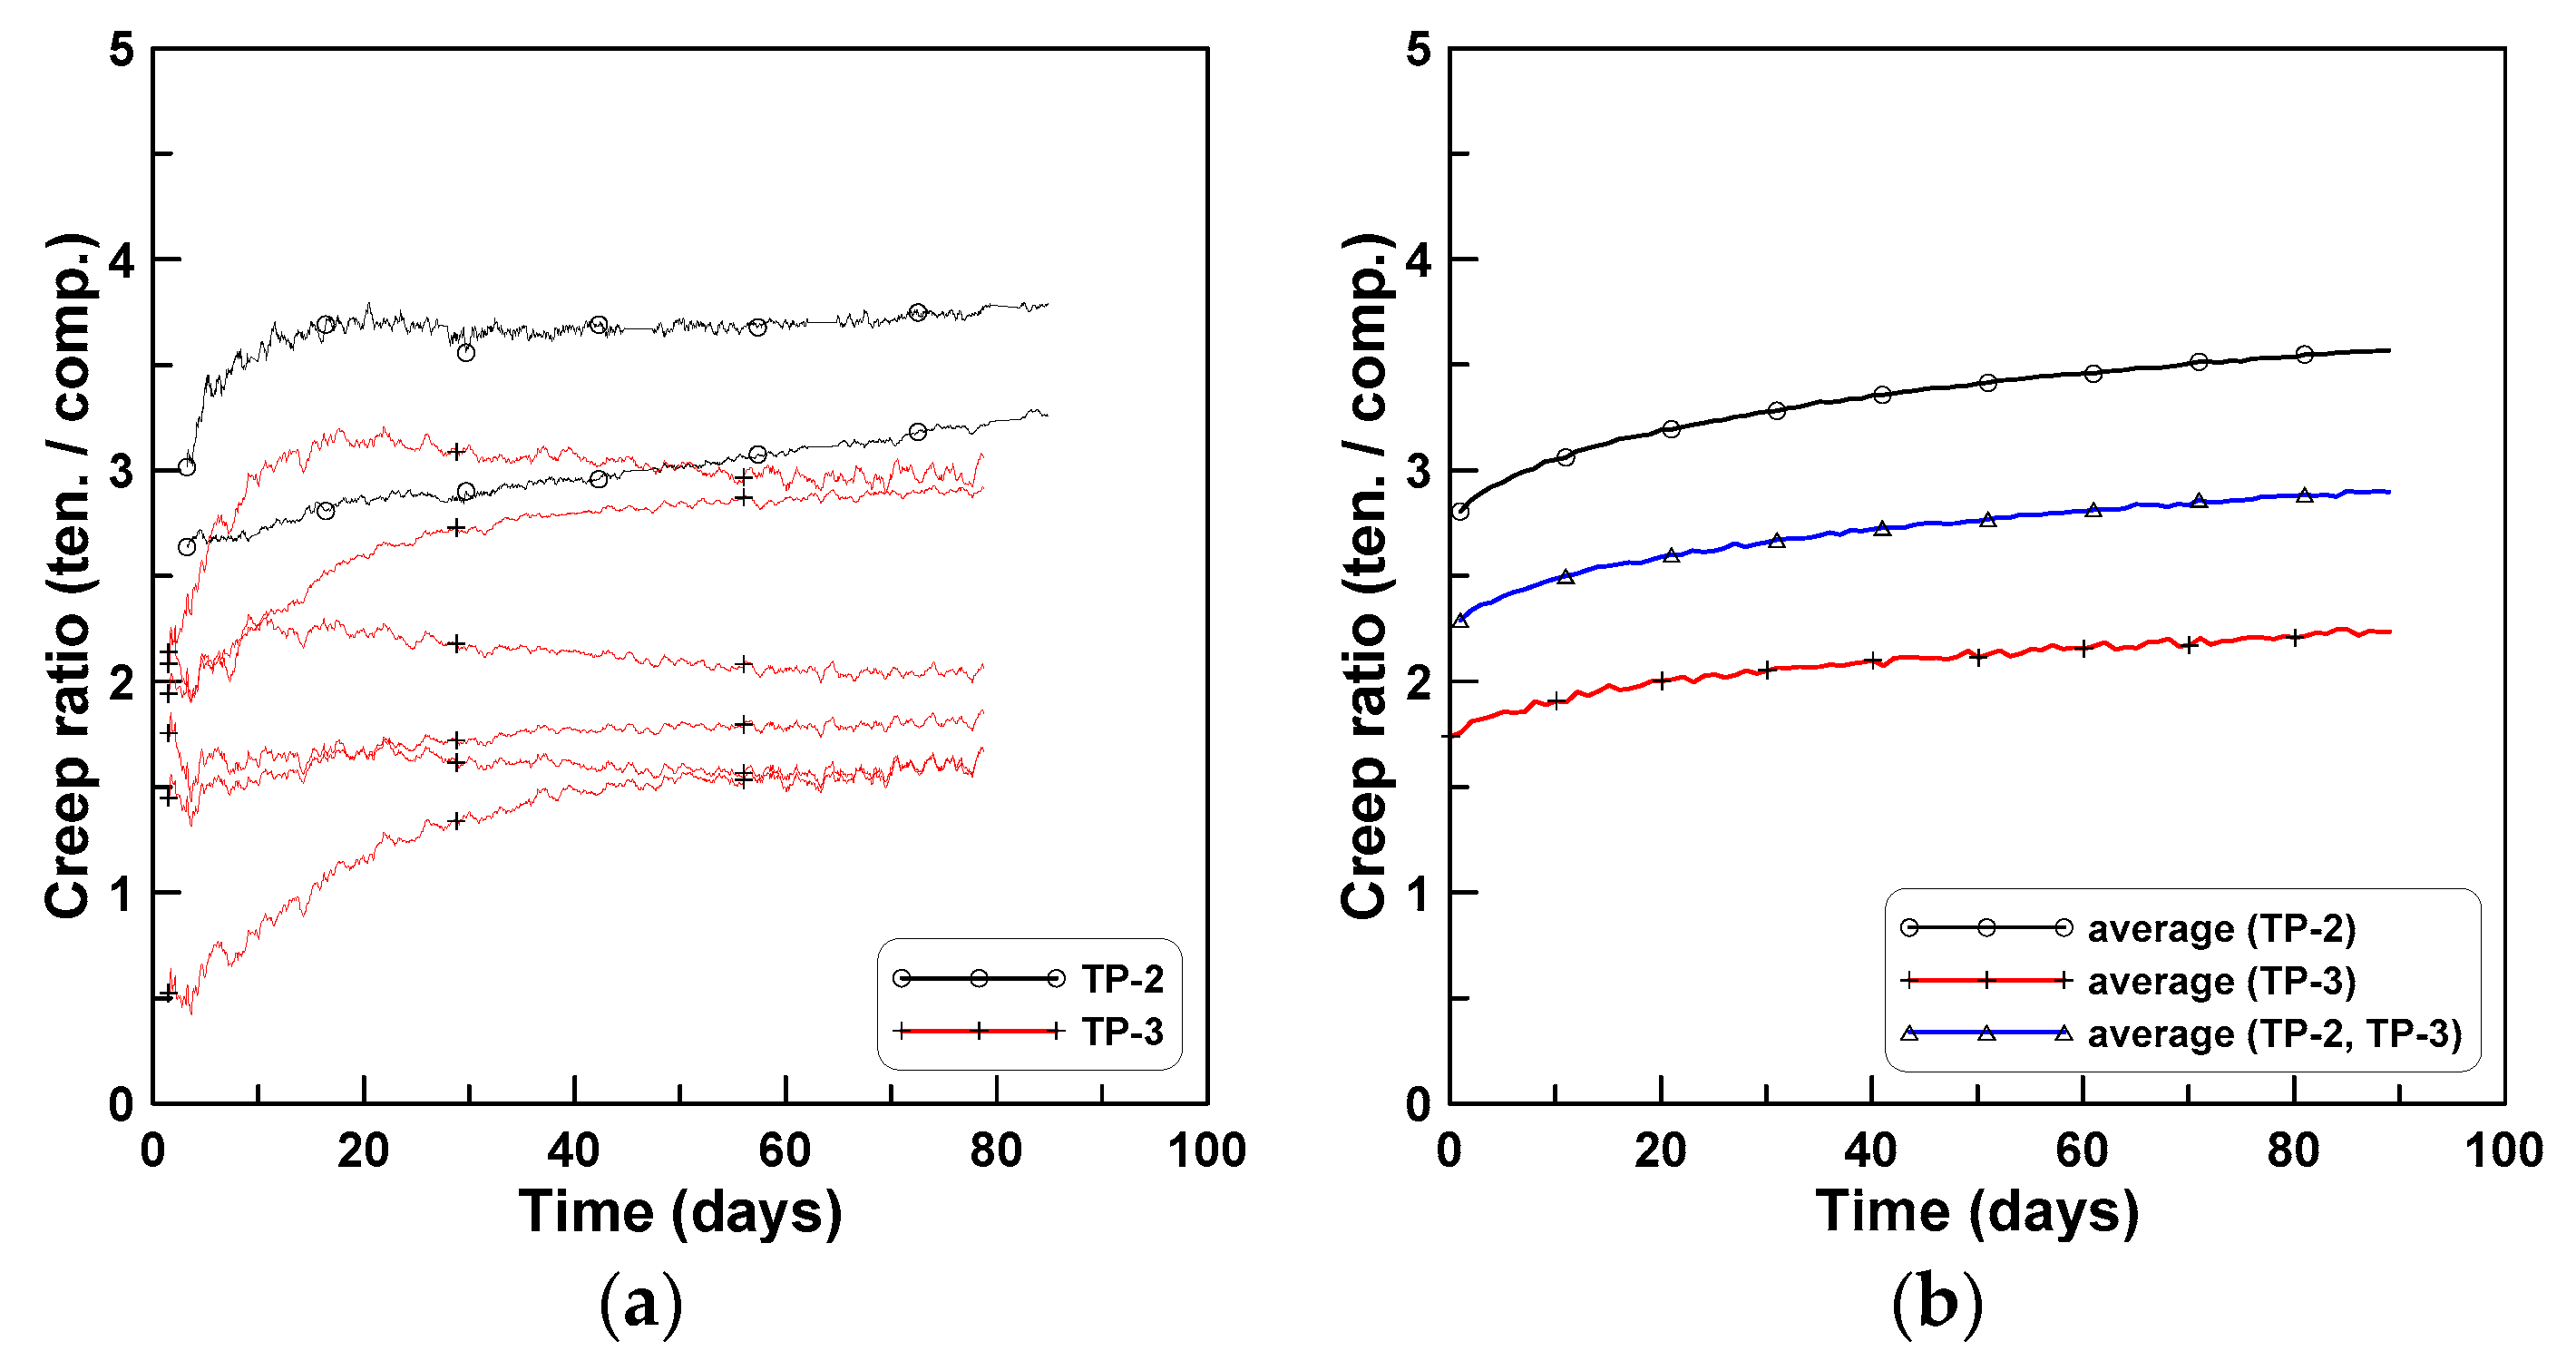
3.2. Tension Creep
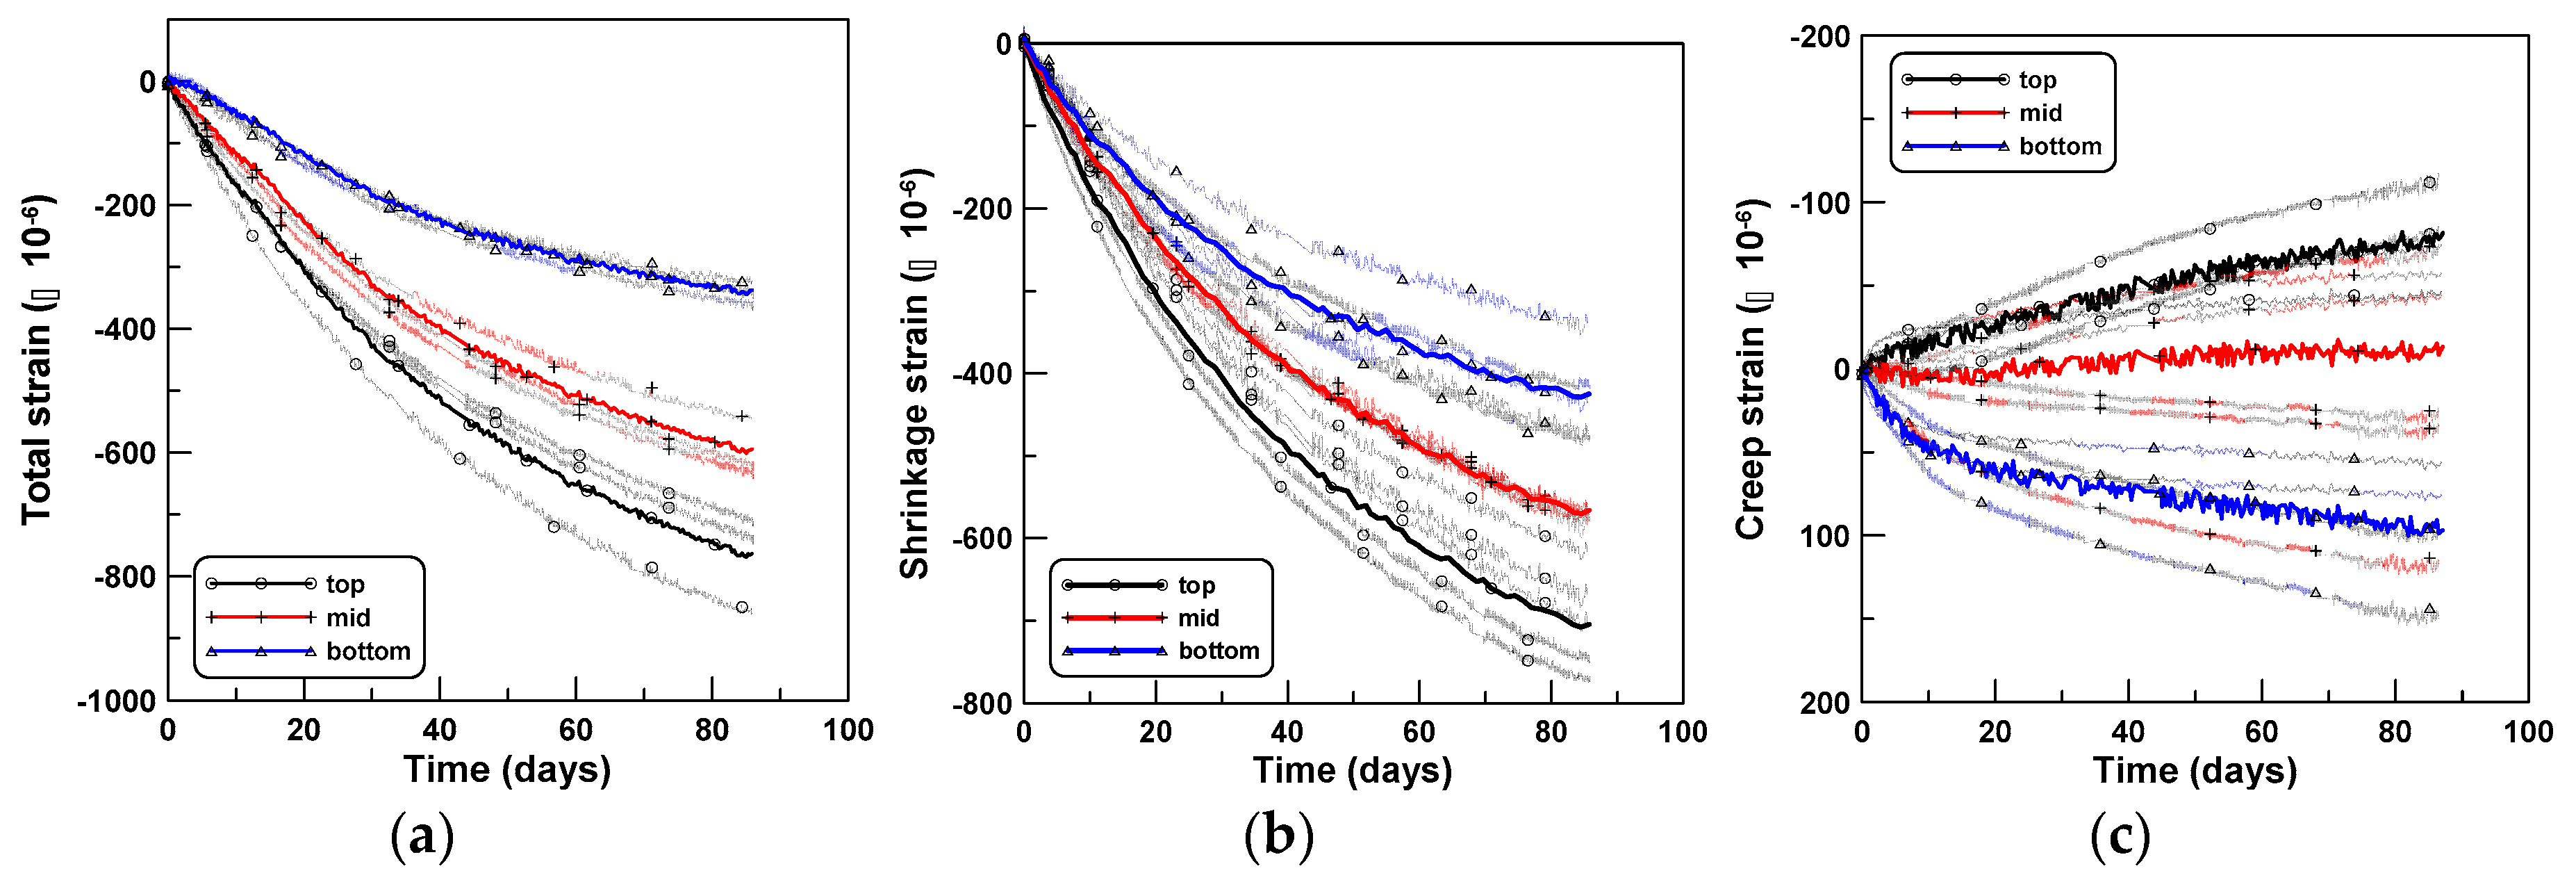
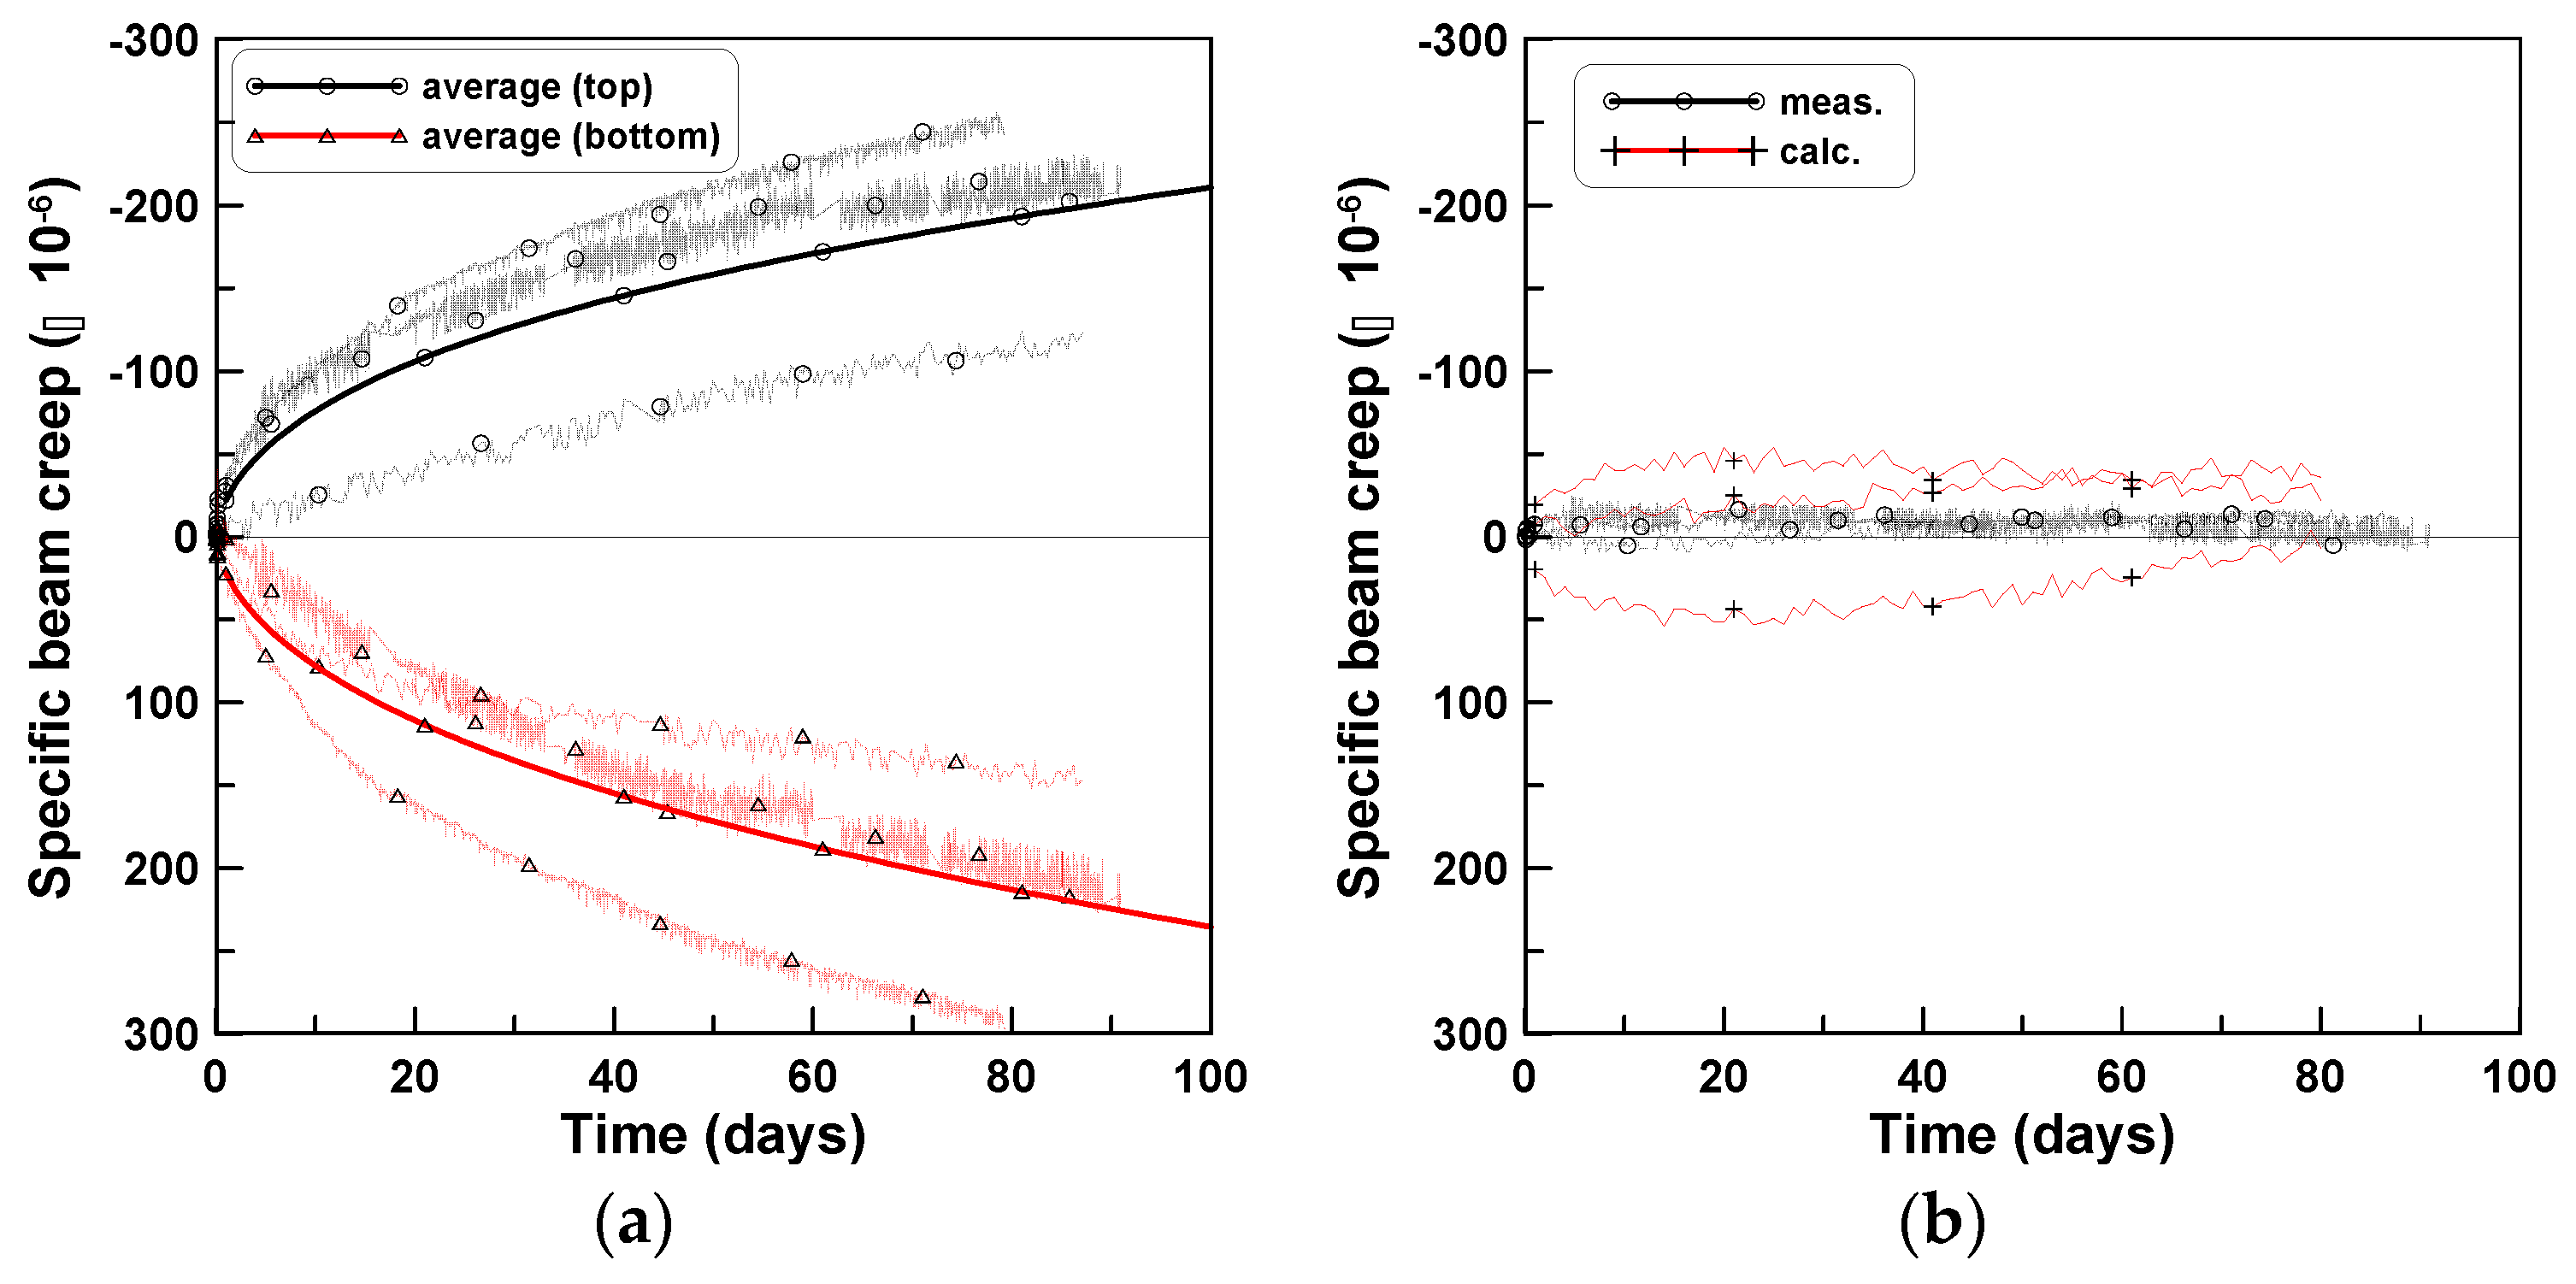
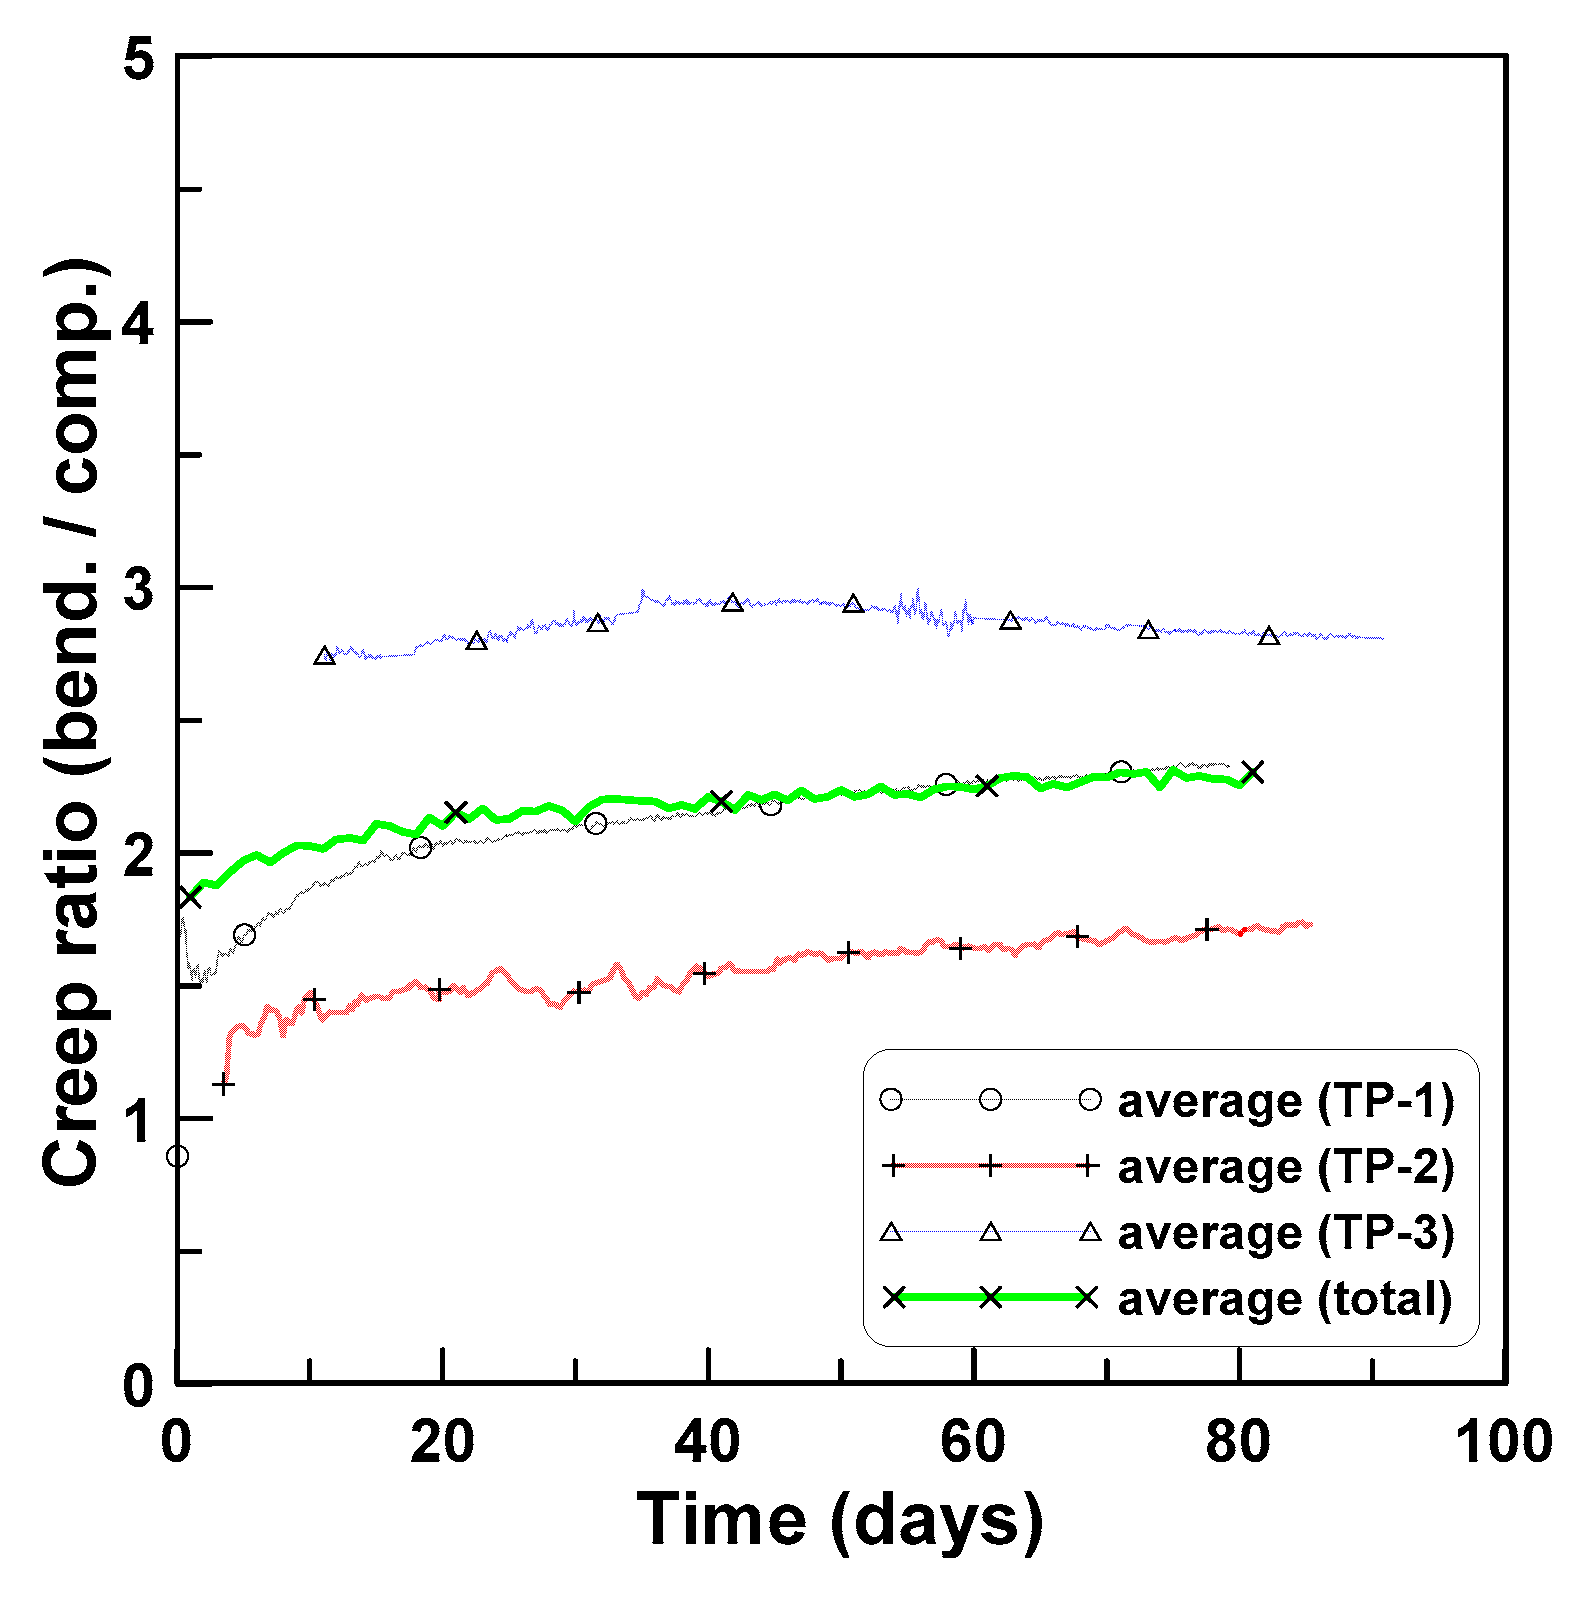
3.3. Beam Creep
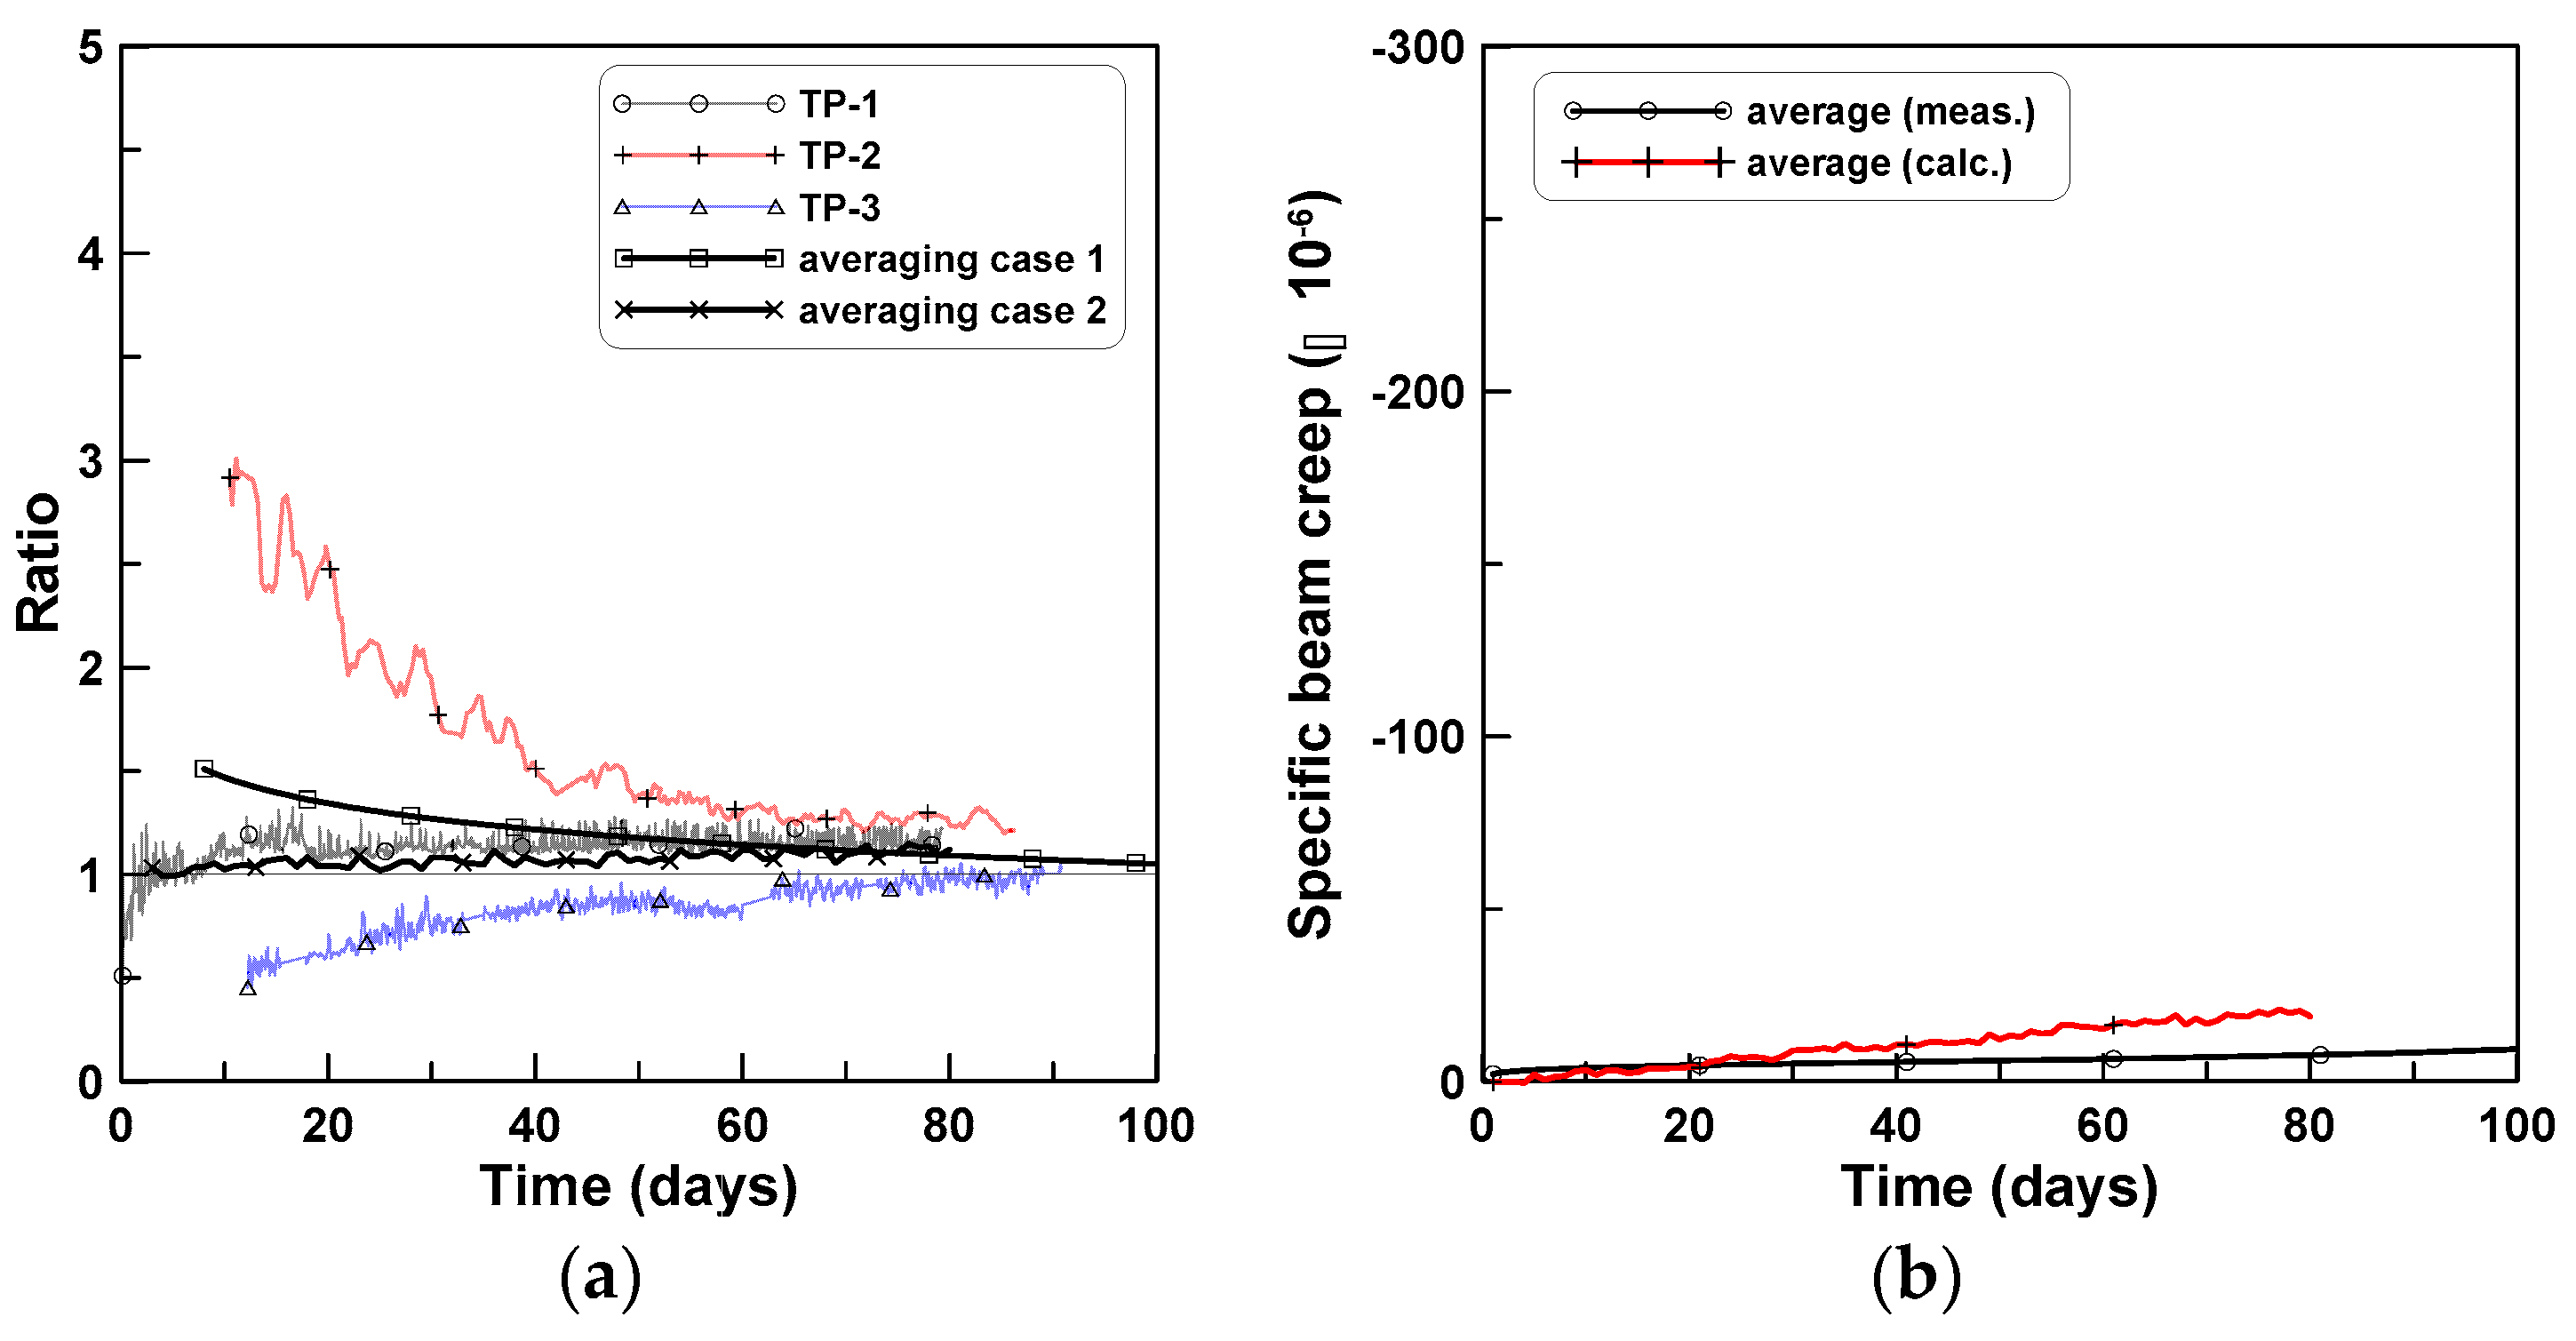
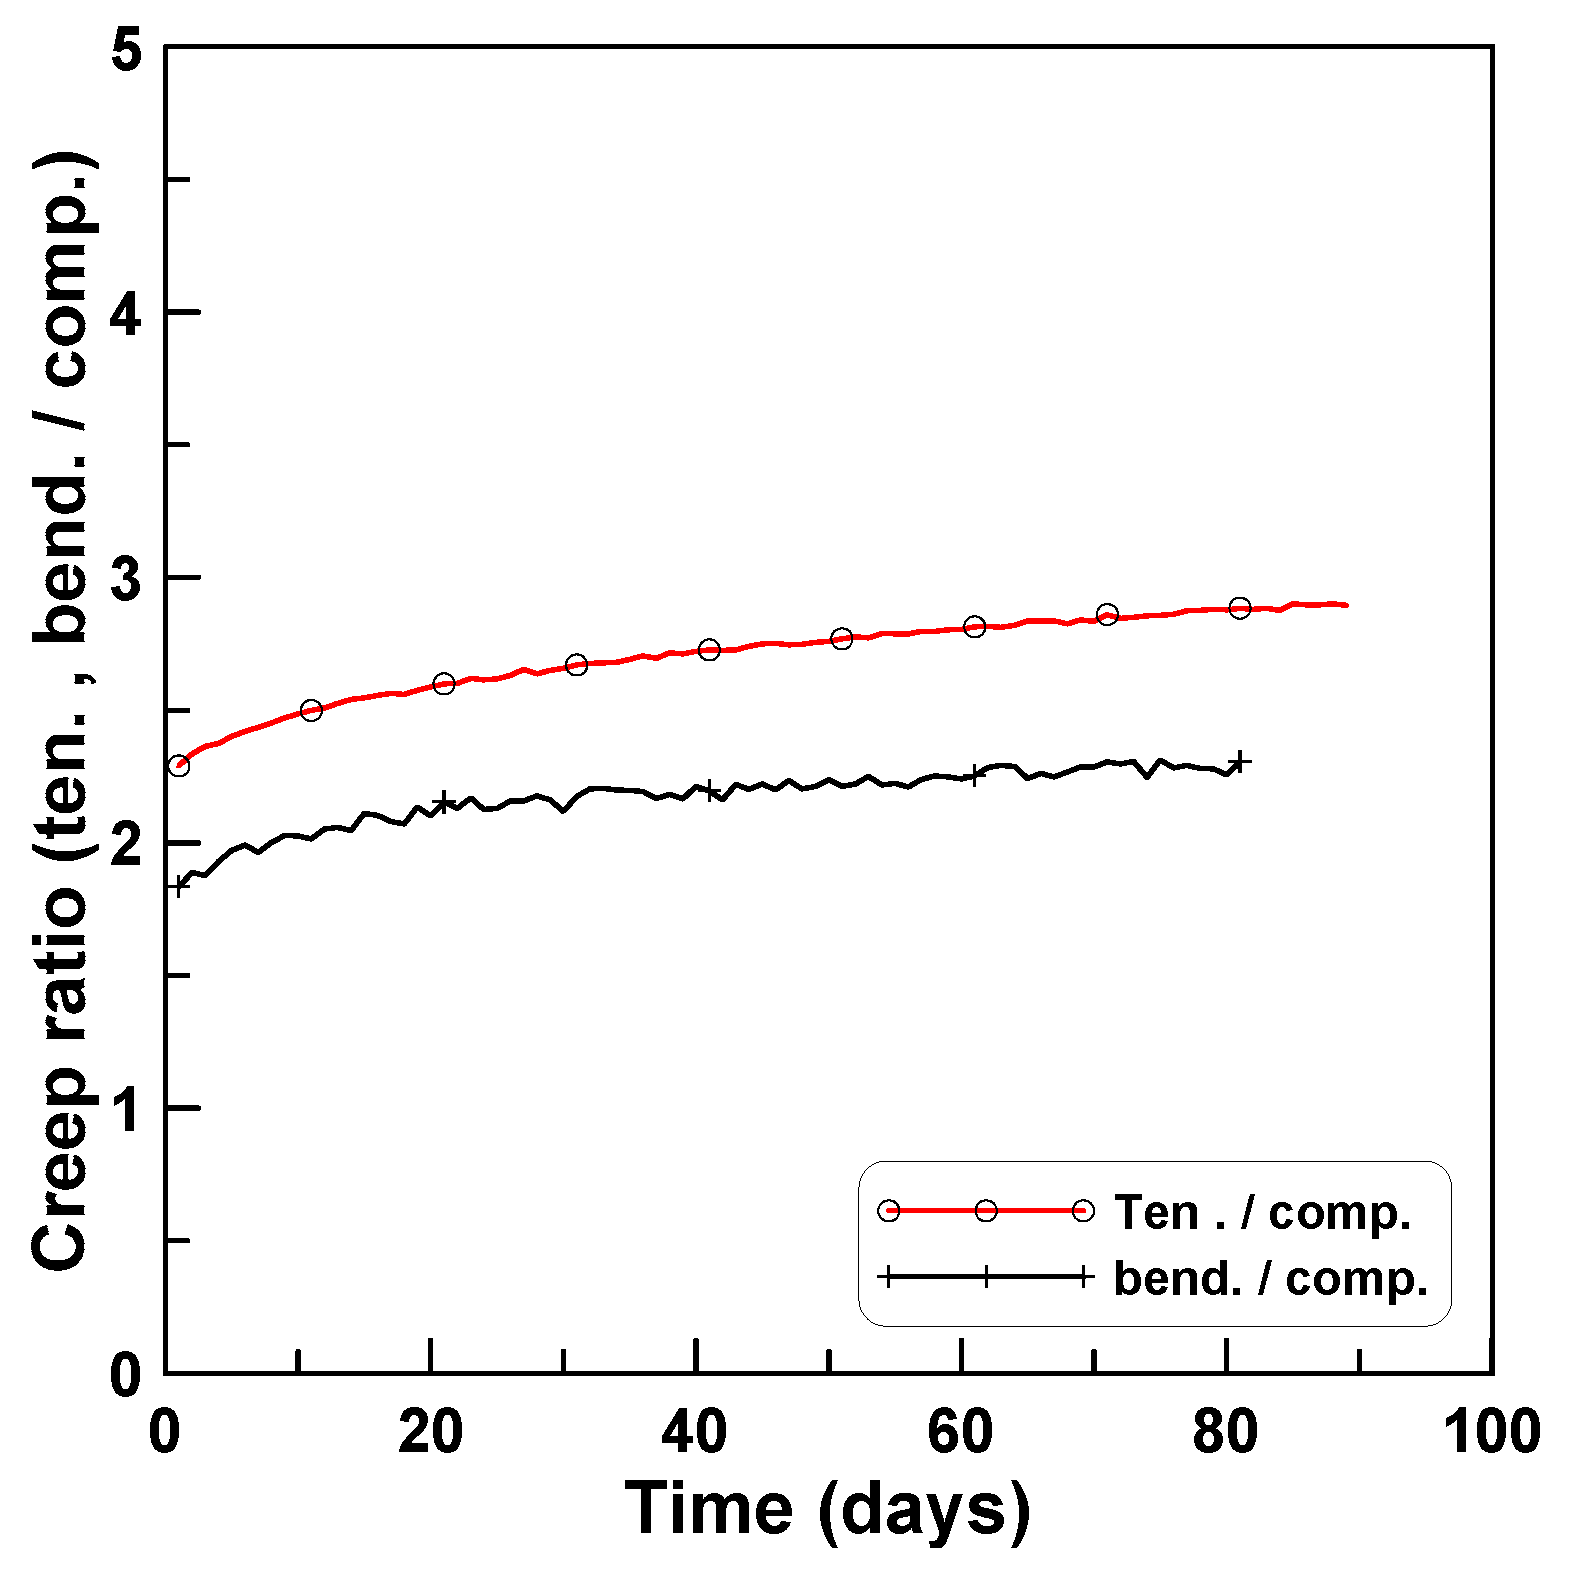
4. Discussions
5. Conclusions
Author Contributions
Funding
Conflicts of Interest
References
- Acker, P.; Ulm, F.-J. Creep and shrinkage of concrete: Physical origins and practical measurements. Nucl. Eng. Des. 2001, 203, 143–158. [Google Scholar] [CrossRef]
- Burlion, F.; Bourgeois, F.; Shao, J.-F. Effects of desiccation on mechanical behavior of concrete. Cem. Concr. Compos. 2005, 27, 367–379. [Google Scholar] [CrossRef]
- Cagnon, H.; Vidal, T.; Sellier, A.; Bourbon, X.; Camps, G. Drying creep in cyclic humidity condition. Cem. Concr. Res. 2015, 76, 91–97. [Google Scholar] [CrossRef]
- Kovler, K. A new look at the problem of drying creep of concrete under tension. J. Mater. Civ. Eng. 1999, 11, 84–87. [Google Scholar] [CrossRef]
- Pickett, C. The effect of change in moisture-content on the creep of concrete under a sustained load. ACI J. 1942, 38, 333–356. [Google Scholar]
- Al-Kubaisy, M.A.; Young, A.G. Failure of concrete under sustained tension. Mag. Concr. Res. 1975, 27, 171–178. [Google Scholar] [CrossRef]
- Forth, J.P. Predicting the tensile creep of concrete. Cem. Concr. Compos. 2015, 55, 70–80. [Google Scholar] [CrossRef]
- García-Taengua, E.; Arango, S.; Martí-Vargas, J.R.; Serna, P. Flexural creep of steel fiber reinforced concrete in the cracked state. Constr. Build. Mater. 2014, 65, 321–329. [Google Scholar] [CrossRef]
- Ranaivomanana, N.; Multon, S.; Turatsinze, A. Basic creep of concrete under compression, tension and bending. Constr. Build. Mater. 2013, 38, 173–180. [Google Scholar] [CrossRef]
- Ranaivomanana, N.; Multon, S.; Turatsinze, A. Tensile, compressive and flexural basic creep of concrete at different stress levels. Cem. Concr. Res. 2013, 52, 1–10. [Google Scholar] [CrossRef]
- Reinhardt, H.W.; Rinder, T. Tensile creep of high-strength concrete. J. Adv. Concr. Technol. 2006, 4, 277–283. [Google Scholar] [CrossRef]
- Tailhan, J.L.; Boulay, C.; Rossi, P.; Le Maou, F.; Martin, E. Compressive, tensile and bending basic creep behaviours related to the same concrete. Struct. Concr. 2013, 14, 124–130. [Google Scholar] [CrossRef]
- Rossi, P.; Tailhan, J.-L.; Le Maou, F. Comparison of concrete creep in tension and in compression: Influence of concrete age at loading and drying conditions. Cem. Concr. Res. 2013, 51, 78–84. [Google Scholar] [CrossRef]
- Powers, T.C. Mechanics of shrinkage and reversible creep of hardened cement paste. In The Structure of Concrete and its Behavior Under Load: In Proceedings of an International Conference, London, September 1965; Cement and Concrete Association: London, UK, 1968; pp. 319–344. [Google Scholar]
- Brooks, J.J.; Neville, A.M. A comparison of creep, elasticity and strength of concrete in tension and in compression. Mag. Concr. Res. 1977, 29, 131–141. [Google Scholar] [CrossRef]
- Domone, P.L. Uniaxial tensile creep and failure of concrete. Mag. Concr. Res. 1974, 26, 144–152. [Google Scholar] [CrossRef]
- Reutz, W. A hypothesis for the creep of hardened cement paste and the influence of simultaneous shrinkage. In The Structure of Concrete and its Behavior Under Load: In Proceedings of an International Conference, London, September 1965; Cement and Concrete Association: London, UK, 1968; pp. 365–387. [Google Scholar]
- Illston, J.M. The creep of concrete under uniaxial tension. Mag. Concr. Res. 1965, 17, 77–84. [Google Scholar] [CrossRef]
- Bissonnette, B.; Pigeon, M. Tensile creep at early ages of ordinary, silica fume and fiber reinforced concretes. Cem. Concr. Res. 1995, 25, 1075–1085. [Google Scholar] [CrossRef]
- Bissonnette, B.; Pigeon, M.; Vaysburd, A.M. Tensile creep of concrete: Study of its sensitivity to basic parameters. ACI Mater. J. 2007, 104, 360–368. [Google Scholar]
- Klausen, A.E.; Kanstad, T.; Bjøntegaard, Ø.; Sellevold, E. Comparison of tensile and compressive creep of fly ash concretes in the hardening phase. Cem. Concr. Res. 2017, 95, 188–194. [Google Scholar] [CrossRef]
- Østergaard, L.; Lange, D.A.; Altoubat, S.A.; Stang, H. Tensile basic creep of early-age concrete under constant load. Cem. Concr. Res. 2001, 31, 1895–1899. [Google Scholar] [CrossRef]
- Li, Z.; Shah, S. Localization of microcracking in concrete under uniaxial tension. ACI Mater. J. 1994, 91, 372–381. [Google Scholar]
- Khan, I.; Castel, A.; Gilbert, R.I. Tensile creep and early-age concrete cracking due to restrained shrinkage. Constr. Build. Mater. 2017, 149, 705–715. [Google Scholar] [CrossRef]
- Foraboschi, P. Effectiveness of novel methods to increase the FRP-masonry bond capacity. Compos. Part B Eng. 2016, 107, 214–232. [Google Scholar] [CrossRef]
- Foraboschi, P. Structural layout that takes full advantage of the capabilities and opportunities afforded by two-way RC floors, coupled with the selection of the best technique, to avoid serviceability failures. Eng. Fail. Anal. 2016, 70, 387–418. [Google Scholar] [CrossRef]
- Jeong, J.H.; Park, Y.S.; Lee, Y.H. Variation of shrinkage strain within the depth of concrete beams. Materials 2015, 8, 7780–7794. [Google Scholar] [CrossRef]
- Ayano, T.; Wittmann, F.H. Drying, moisture distribution, and shrinkage of cement-based materials. Mater. Struct. 2002, 35, 134–140. [Google Scholar] [CrossRef]
- Hobbs, D.W. The dependence of the bulk modulus, Young’s modulus, creep, shrinkage and thermal expansion of concrete upon aggregate volume concentration. Mater. Struct. 1971, 4, 107–114. [Google Scholar] [CrossRef]
- Hobbs, D.W. Influence of aggregate restraint on the shrinkage of concrete. ACI 1974, 71, 445–450. [Google Scholar]
- Hoshino, M. Difference of the w/c ratio, porosity and microscopical aspect between the upper boundary paste and the lower boundary paste of the aggregate in concrete. Mater. Struct. 1988, 21, 336–340. [Google Scholar] [CrossRef]
- Hoshino, M. Relation between bleeding, coarse aggregate, and specimen height of concrete. Mater. J. 1989, 86, 185–190. [Google Scholar]
- Elvery, R.H.; Haroun, W. A direct tensile test for concrete under long- or short-term loading. Mag. Con. Res. 1968, 20, 111–116. [Google Scholar] [CrossRef]
- ACI Committee 209. Guide for Modeling and Calculating Shrinkage and Creep in Hardened Concrete; ACI: Farmington Hills, MI, USA, 2008. [Google Scholar]


| Test Series | Max Aggregate Size (mm) | W/C Ratio (%) | Slump (mm) | Unit Mass (kg/m3) | |||
|---|---|---|---|---|---|---|---|
| Water | Cement | Aggregates | |||||
| Coarse | Fine | ||||||
| TP-1 | 20 | 57 | 200 | 212 | 372 | 945 | 761 |
| TP-2 | 20 | 54 | 120 | 190 | 352 | 974 | 775 |
| TP-3 | 20 | 54 | 120 | 190 | 350 | 974 | 774 |
| Test Series | Age at Loading (to, Days) | Compressive Strength (MPa) | Tensile Strength (MPa) | Elastic Modulus (MPa) | |||
|---|---|---|---|---|---|---|---|
| Age at Loading | 28 Days | Age at Loading | 28 Days | Age at Loading | 28 Days | ||
| TP-1 | 8 | 20.4 | 30.0 | - | - | 22,700 | 25,300 |
| TP-2 | 10 | 23.1 | 32.0 | 1.93 | 2.45 | 22,500 | 25,000 |
| TP-3 | 11 | 24.0 | 33.2 | 2.23 | 2.69 | 22,100 | 25,500 |
© 2019 by the authors. Licensee MDPI, Basel, Switzerland. This article is an open access article distributed under the terms and conditions of the Creative Commons Attribution (CC BY) license (http://creativecommons.org/licenses/by/4.0/).
Share and Cite
Kim, S.-G.; Park, Y.-S.; Lee, Y.-H. Comparison of Concrete Creep in Compression, Tension, and Bending under Drying Condition. Materials 2019, 12, 3357. https://doi.org/10.3390/ma12203357
Kim S-G, Park Y-S, Lee Y-H. Comparison of Concrete Creep in Compression, Tension, and Bending under Drying Condition. Materials. 2019; 12(20):3357. https://doi.org/10.3390/ma12203357
Chicago/Turabian StyleKim, Seung-Gyu, Yeong-Seong Park, and Yong-Hak Lee. 2019. "Comparison of Concrete Creep in Compression, Tension, and Bending under Drying Condition" Materials 12, no. 20: 3357. https://doi.org/10.3390/ma12203357
APA StyleKim, S.-G., Park, Y.-S., & Lee, Y.-H. (2019). Comparison of Concrete Creep in Compression, Tension, and Bending under Drying Condition. Materials, 12(20), 3357. https://doi.org/10.3390/ma12203357