Article

Revealing High Oxygen Evolution Catalytic Activity of Fluorine-Doped Carbon in Alkaline Media

1
Department of Chemistry, Faculty of Science, Hokkaido University, Sapporo 060-0810, Japan
2
Institute for International Collaboration, Hokkaido University, Sapporo 060-0815, Japan
*
Author to whom correspondence should be addressed.
Materials 2019, 12(2), 211; https://doi.org/10.3390/ma12020211
Submission received: 24 November 2018 / Revised: 22 December 2018 / Accepted: 7 January 2019 / Published: 10 January 2019
(This article belongs to the Section Energy Materials)

Abstract

:
Oxygen evolution reactions (OER) are important reactions for energy conversion. Metal-free carbon-based catalysts potentially contribute to the catalytic materials for OER. However, it has been difficult to understand the intrinsic catalytic activity of carbon materials, due to catalyst decomposition over the course of long-term reactions. Here, we report high oxygen evolution reaction catalytic activity of F-doped carbon in alkaline media. Intrinsic OER activity was evaluated from a combination of measurements using a rotating disk electrode and O2 sensor. The F-doped carbon catalyst is a highly active catalyst, comparable to state-of-the-art precious-metal-based catalysts such as RuO2.

Graphical Abstract

1. Introduction

The oxygen evolution reaction (OER) in water splitting reactions is an important reaction for energy conversion and storage [1]. High overpotential is generally required to promote the reaction kinetics of the 4-electron reaction for the oxidation of hydroxide to oxygen in alkaline conditions [2]. Researchers have studied OER activity for metal oxide thin films or nanoparticles on conductive substrates. Ruthenium oxide (RuO2) is a state-of-the-art catalyst with high stability [3]. However, precious-metal-based catalysts are limited by their cost and abundance. Recently, carbon materials have been highlighted. We recently reported that semi-ionic C–F bonds in fluorine-doped carbon (F–carbon) enhance the catalysis for OER in alkaline media [4]. Comparable catalysts have been reported for carbon based catalysis of OER [5,6,7,8]. However, in general, due to the highly oxidative conditions of OER, catalyst degradation is problematic for analysis of intrinsic OER activity [9,10]. In order to investigate OER kinetics, rates of reaction for OER ( r OER ) should be evaluated by appropriate analytical methods.
The most commonly used method is electrochemical experimentation, which is actually useful if the current density is only derived from a single faradaic electrocatalytic OER process. Rotating ring disk electrode (RRDE) systems can be utilized for evaluation of the kinetics of OER [11,12]. Evolved O2 is measured on a ring electrode by monitoring the current of the oxygen reduction reaction at a constant potential, which is proportional to the amount of O2 evolved from the disk electrodes. However, we assume that the ring current is sensitive to catalyst corrosion or formation of O2 bubbles from the disk electrode, leading to difficulty evaluating OER from the disk electrode. The other evaluation method is differential electrochemical mass spectrometry (DEMS) during cyclic voltammetry [13]. DEMS records the ion current of species on porous electrodes. However, DEMS requires sufficient catalyst for detection at about 10 ppb [14]. A fluorescence-based O2 sensor, which detects fluorescent quenching by O2, has been used for evaluation of OER rate in a gas-tight electrochemical cell [15]. An O2 sensor was placed in the headspace over the electrolyte. The O2 sensor method takes a long time, due to gas exchange between the gas and solution phases. Actually, the fluorescent O2 detector is quite sensitive even for concentration levels of O2 as low as a few ppb with ignorable noise level. Therefore, O2 detection methods in solution could be a candidate for the evaluation of OER catalytic activity even for carbon materials.
Here, we report high catalytic activity for our F–carbon, as evaluated based on electrode kinetics. This analytical method is based on the combination of measurement of faradic current using a rotating disk electrode (RDE), and detection of evolved O2 by fluorescent sensor, which is placed in the electrolyte and close to the catalyst. Because of shear flow induced by rotation of the RDE, in situ and real-time measurement is possible by O2 sensor. We constructed a kinetic model of the OER reaction by analysis of in situ monitoring of O2 concentration. This methodology revealed that our F–carbon catalyst is comparable to the precious metal oxide.

2. Materials and Methods

2.1. Sample Preparation

Nafion (5% dispersion solution), Ketjen black (EC-600JD), and RuO2 (~99%) were purchased from Wako Pure Chemical Industries, LTD. (Osaka, Japan), Lion Special Chemicals Co., LTD. (Tokyo, Japan), and Sigma-Aldrich (St. Louis, MO, USA), respectively. Nafion (400 μL) and Ketjen black (10 mg) were dispersed in methanol (10 mL) using an ultrasonication homogenizer (UH-50F, SMT, Tokyo, Japan) at 50 W and 20 kHz for 30 min. After drying overnight at 60 °C, the mixture was pyrolyzed in Ar (200 sccm) for 1 h at 600 °C. F–carbon has 2 types of C–F bond: covalent (689.0 eV) and semi-ionic (687.0 eV), as shown in X-ray photoelectron spectroscopy (XPS, JEOL, Tokyo, Japan) in Figure S1. The atomic ratios of covalent and semi-ionic C–F bonds are 1.6% and 3.9%, respectively. The RDE was prepared as follows. The sample (1 mg) was dispersed in ethanol (40 μL) and deionized water (160 μL) using an ultrasonic homogenizer for 10 min. Nafion (2 μL) was then added to the composite ink and dispersed by ultrasonic homogenizer for 1 min. The catalyst (8.3 μL) was loaded onto a glassy carbon disk electrode (5 mm diameter). Catalyst loading was calculated as 0.2 mg cm−2.

2.2. Electrochemical Characterization

The electrochemical cell was equipped with an O2 sensor (Pyroscience OXROB10, BAS, Tokyo, Japan), RDE working electrode, Pt counter electrode, and a reversible hydrogen electrode (RHE) as the reference electrode. The distance between the dissolved O2 detector and working electrode was fixed at 5 mm. The electrochemical cell is schematically shown in Figure S2. To minimize the dissolved O2 before measurements, the electrolyte was bubbled with Ar gas until the dissolved O2 concentration was stable for 10 min. The background concentration was subtracted and defined as 0 ppb. To evaluate the effect of pH on OER on the F–carbon, the pH of the KOH alkaline solution was set at 12, 13, 13.5, and 14 by pH meter (Horiba, 9625-10D, Kyoto, Japan). Chronoamperometry (current density versus time) of F–carbon was stepped at 1.5 V, 1.53 V, 1.56 V, 1.59, and 1.62 V for 1 min. In case of the RuO2, chronoamperometry was stepped at 1.4 V, 1.43 V, 1.46 V, 1.49 V, and 1.52 V for 1 min. Rotation speed of the RDE was maintained at 1600 rpm. Potential versus log O2 concentration curves were estimated by increment of O2 concentration per 1 min for potential. Tafel plot (potential versus log current density) was plotted by averaged current density for 1 min at given potentials.

2.3. Theoretical Calculation

Density functional theory (DFT) calculations were carried out using Gaussian 03 software, at the B3LYP level of DFT with 6-31G** basis sets. The molecular model for nanographene was treated as C42H16. The model structure was constructed using the Avogadro package, and structure was optimized by thermal quenching method. Thereafter, initial structure of molecular model was optimized using “opt” command in Gaussian. Atomic coordinates are shown in appendix (Supplementary Materials).

3. Results and Discussion

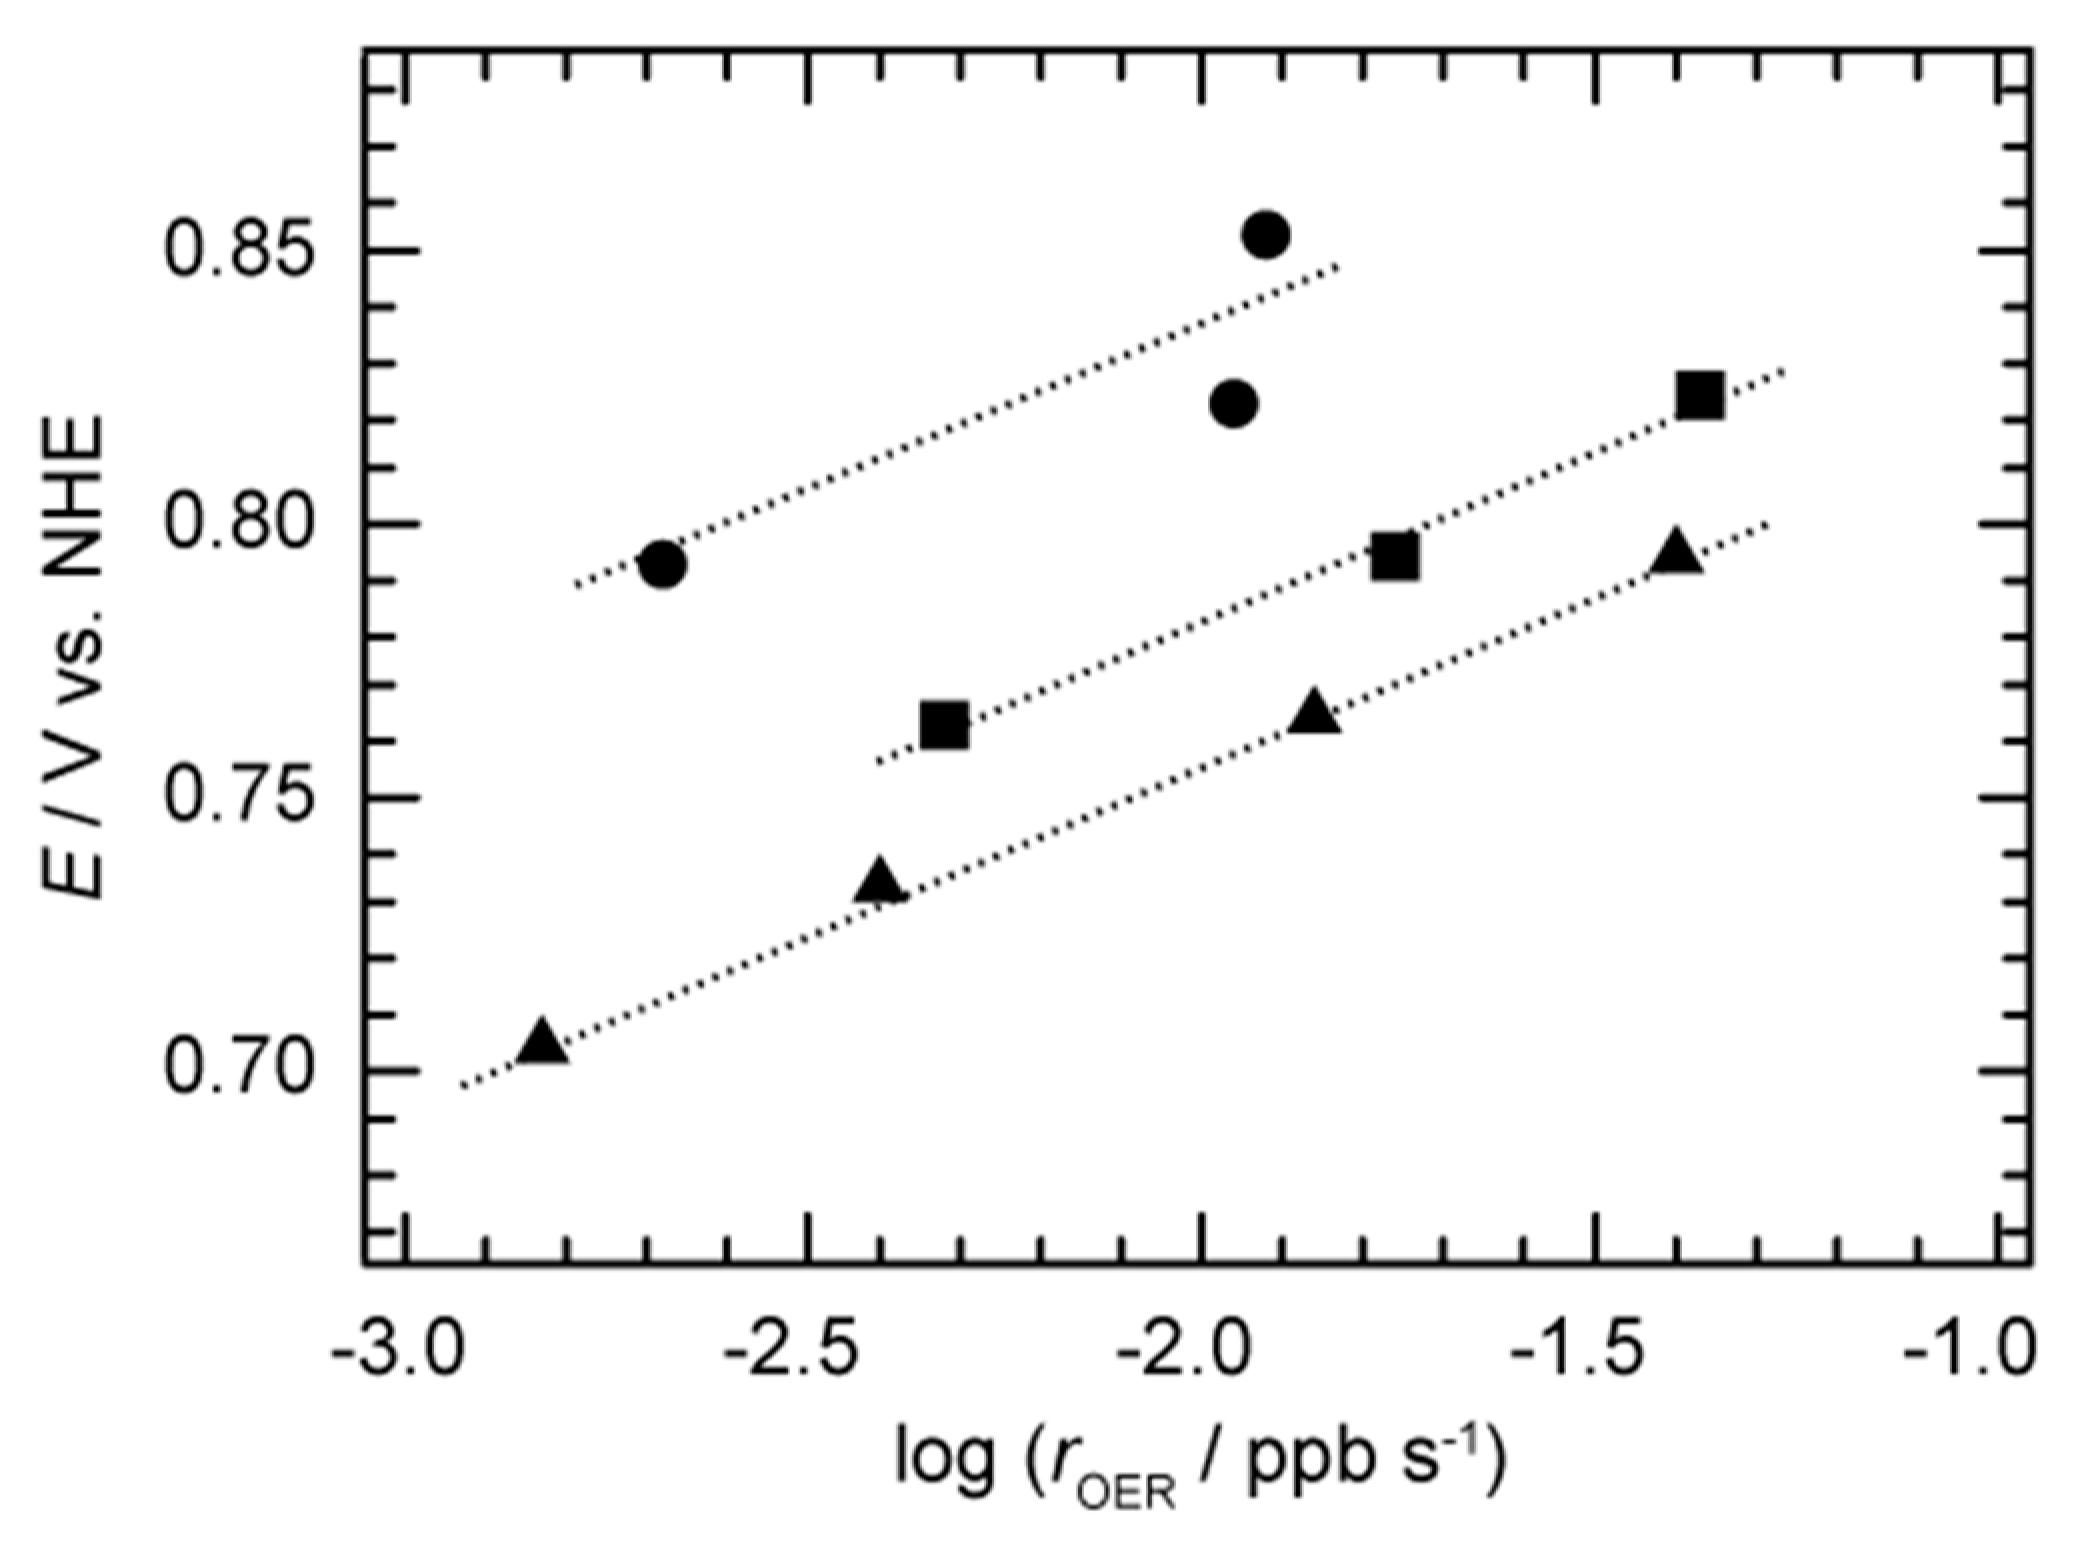
3.1. Evaluation of pH-Dependent Tafel Slopes from Electrochemical Measurement and O2 Sensor

We first confirmed the relationship between evolved O2 relative concentration ( C O 2 ) and total current density ( j total ), using RuO2 as model catalyst. Disk electrodes were rotated at 1600 rpm, and potentiostatic polarization was conducted in 0.1 M KOH aqueous solution (pH = 13) to induce OER. As a result, positive polarization of electrochemical potential led to increases in both j total and O2 concentration C O 2 (see Figure S3). Importantly, the slope of O2 concentration for time, i.e., rate for OER ( r OER = d C O 2 /dt), was increased with increment of j total . This result suggests that there is a positive correlation between r OER and j total using RDE with the O2 sensor method. With the aid of successive demonstrations of our experimental setup, we prepared and characterized the F–carbon electrode according to our previous work. The sample was characterized by XPS (see Figure S1) [4,16]. Figure 1 shows the plot of time versus applied potential, j total , and C O 2 , recorded in 0.1 M KOH aqueous solution (pH = 13). As discussed in the RuO2 experiment, C O 2 increased as the electrochemical potential, E, increased. On the other hand, forward and backward traces for j total and r OER were distinct. For example, v O 2 at 1.59 V in the forward trace (0.011 ppb s−1, 180–240 s) was twice as high as in the backward trace (0.0047 ppb s−1, 360–420 s). In addition to that, j total was not stable during the potentiostatic polarization. On the other hand, r OER showed linearity under potentiostatic polarization. This observation of j total and r OER suggests that j total is derived from OER, as well as catalyst oxidation after the initiation of OER.
We investigated effect of pH on the observed current density. Figure 2 shows the Tafel plot of OER from F–carbon by plotting log( j total ) and E versus normal hydrogen electrode (NHE) scale. We averaged j total in each duration for potentiostatic polarization, because of the instability of the observed current density during chronoamperometry (see Figure S4). Importantly, j total showed different behavior depending on pH of the KOH aqueous solution (pH = 12–14). In the case of pH 12, the current density did not show apparent increments, regardless of the applied potential. Increases in pH of more than 13 led to the increase of j total . In the case of pH 13.5 and 14, the values of j total were almost of a similar order. The Tafel slopes, ∂E/∂log( j total ), varied depending on pH of solution, as shown in Figure 2. Tafel slopes at pH 13, pH 13.5, and pH 14 were 227 mV dec−1, 225 mV dec−1, and 183 mV dec−1, respectively. The relatively high Tafel slopes observed imply that the current density includes contributions from additional electrochemical side reactions such as catalyst degradation.
To evaluate the pH dependence of r OER , we investigated the r OER from the measurement of C O 2 under potentiostatic polarization. In the case of pH 12, C O 2 was almost same regardless of applied potential (see Figure S5). However, r OER at pH 13.5 and pH 14 was significantly increased compared to the results of pH 12 and pH 13. In addition, r OER at the potential of 1.62 V corresponded to a maximum value of 0.038 ppb s−1 in KOH solution (pH = 14). Therefore, the OER activity of F–carbon is enhanced by increasing the pH and E. In addition, oxygen evolution rate was slightly decreased with a backward trace from 1.62 to 1.53 V in comparison with a forward trace from 1.53 to 1.62 V at pH 13. Figure 3 shows Tafel plots of OER from F–carbon by plotting r OER and E versus NHE scale. The Tafel slope can be treated as same even for r OER instead of j OER (vide infra). Tafel slopes were similar regardless of pH of KOH aqueous solutions. Tafel slopes at pH 13, pH 13.5, and pH 14 were 62 mV dec−1, 62 mV dec−1, and 66 mV dec−1, respectively. In addition to that, potential shifts at the same r OER were quite similar to each other, and ∂E/∂log(aH+) was 63 mV pH unit−1. This observation suggests that r OER is related to the activity of protons.
Importantly, observed OER activity was not due to the deposition of metal impurity species [17,18]. In our previous work, we demonstrated that pristine carbon materials show negligible oxygen evolution rates compared to the observed current density [4]. If that comes from the activity of impurity deposition, ignorable activity will not be observed. The Faradaic efficiency was roughly estimated from the conversion of r OER to corresponding current density by calculation of nearly 100% of Faradaic efficiency for RuO2 (Figure S6 and Tables S1–S3). The calculated Faradaic efficiency ranged from 5% to 30% for our F–carbon catalyst. Even though carbon corrodes easily under OER conditions, the materials that did remain showed activity, suggesting that our catalyst has high potential for OER.

3.2. Kinetic Model and Theoretical Calculation for F–Carbon

Conventionally, the kinetic model is constructed from rate-limiting kinetics in the net reaction of the catalytic cycle. OER current ( j OER ) is described by r OER , Faraday’s constant (F), and number of electron (n). j OER is expressed as follows:
j OER = n F r OER
Therefore, we can use r OER as a parameter for Tafel analysis, and Tafel slope is expressed herein as ∂E/log( r OER ). Differences in pH induce a shift of thermodynamic potential between the water and oxygen equilibrium redox couple. Therefore, the order of the proton is estimated from the following Equation (2), which is based on Euler’s chain rule [19,20,21]:
log ( r OER ) log ( a H + ) = log ( E ) log ( a H + ) log ( E ) log ( r OER )
Here, ∂E/log( r OER ) is a conventional Tafel slope, and ∂E/log(aH+) is explained as a potential shift depending on pH at the same r OER . As shown in Figure 3, Tafel slopes for all the plots correspond to almost 59 mV dec−1 value, regardless of the pH that corresponds to 2.3 × RT/F. In addition to that, the potential shift of pH at the same reaction rate (∂E/∂pH) is 60 mV pH unit−1. By using Equation (2), r OER is revealed to be proportional to the inverse first order dependence of proton activity.
The reaction order for r OER is described by the following expression, using the constant v0:
r OER = r 0 ( a H + ) 1 exp ( F E R T )
The rate expression carries the observed inverse first order dependence on proton activity, and the exponential relationship with electrochemical potential (E). Rearrangement of the log form of Equation (3) yields a Tafel slope (∂E/log( r OER )) of 59 mV decade, which is also consistent with experimental data. Equation (3) represents a mechanistic sequence involving a reversible one electron, one proton equilibrium step, followed by a rate-determining chemical step. These mechanisms are expressed by Equations (4) and (5) as follows:
θ 1 θ = K ( a H + ) 1 exp ( F E R T )
r OER = k 2 θ
θ is the coverage of the adsorption step involving the proton-coupled electron transfer process. Due to the pre-equilibrium, θ is expected to be small value. Therefore, θ/(1−θ) ≃ θ. Importantly, the intrinsic exchange reaction rate is determined by pre-factor k2K. This suggests that one of following is important factor (1) the strong interaction between surface-adsorbed hydroxide and water or (2) the stronger strong interaction between hydroxide and surface. In order to investigate the structural origin of F–carbon, we conducted a theoretical calculation for the model molecular structure of F–carbon. In our previous study, we found 90.8% of carbon element and 3.9% of fluorine from semi-ionic C–F bonding [4]. The observed value corresponds to one C–F bond site per 50 Å2. We constructed an aromatic system based on the model structure (C42H16F) for structure evaluation (see Supplementary Materials for detail). Importantly, we found that fluorine-doping on the graphene-like sheet induced a positive charge for the neighboring α-carbon atom, revealed by Mulliken charge analysis (see Figure S7). In the case of semi-ionic C–F bonding structures, α-carbon is positively charged with the values of 0.196 and 0.189. On the other hand, in the case of covalent C–F bonding structures, α-carbon is less positively charged at 0.124 and 0.112. This result suggests that fluorine doping induces charge localization at the α-carbon atom, which can be an active site for turnover rate-determining steps as shown in Figure 4. We expect that fluorine-doping induces either (1) the increase of hydroxide adsorption energy or (2) the increase of electrophilicity of adsorbed hydroxide species. Interestingly, observed phenomena in F–carbon are reminiscent of highly active catalysts such as perovskites and surface platinum oxides [20,22,23].

4. Conclusions

In conclusion, we showed from the kinetic data profile that our F–carbon possesses high catalytic activity. In most cases, carbon catalysts suffer from decomposition, and mechanistic study is quite difficult in terms of catalyst design. Our method, based on an O2 sensor and RDE, enables the in situ monitoring of O2 concentration directly from solution. Tafel data and pH dependence proved that OER catalysis proceeds with proton-coupled electron transfer process and an irreversible chemical step. The present study shed light on potential catalysts for designer interfaces.

Supplementary Materials

The following are available online at https://www.mdpi.com/1996-1944/12/2/211/s1, Figure S1: XPS results of F–carbon around (a) F 1s range and (b) wide scan; Figure S2: Electrochemical cell setup. Three-electrode cell was used for the controlling the electrochemical potential of working electrode. Evolved O2 was detected by O2 sensor immersed in solution; Figure S3: OER from RuO2 in 0.1 M KOH solution (pH = 13). (a) Applied potential (E), (b) current density (j), and (b) O2 concentration ( C O 2 ) were plotted versus time; Figure S4: Chronoamperometry at different electrochemical potentials. Applied electrochemical potentials were shown in above; Figure S5: Time–course analysis of O2 concentration trace under the potentiostatic polarization. Applied electrochemical potentials were shown in above; Figure S6: Correlation between rate of OER and current density in RuO2 under oxygen evolution condition. Data was adapted from Figure S3; Table S1: Calculation of Faradaic efficiency for F–carbon under OER conditions in pH 13; Table S2: Calculation of Faradaic efficiency for F–carbon under OER condition in pH 13.5; Table S3: Calculation of Faradaic efficiency for F–carbon under OER condition in pH 14; Figure S7: Mulliken charge analysis for semi-ionic C–F model structure and covalent C–F model structure. Green color and red color indicates the positive and negative charges respectively; Appendix: Cartesian coordinates for C42H16 and C42H16F (semi-ionic and covalent).

Author Contributions

Conceptualization, J.K., T.F. and K.M.; methodology, J.K., T.F. and R.Z.; software, T.F.; analysis, J.K. and T.F.; investigation, J.K.; writing J.K., T.F., R.Z. and K.M.

Funding

This work was partially supported by Grants-in-Aid for Scientific Research (No. 16K17848), from the Ministry of Education, Culture, Sports, Science, and Technology of Japan, especially that of Scientific Research on Innovative Areas “Nano-Material Optical-Manipulation” (16H06506).

Acknowledgments

J.K. acknowledge Satoshi Yasuda for scientific discussion for the synthesis of F-doped carbon.

Conflicts of Interest

The authors declare no conflict of interest.

References

  1. Suen, N.-T.; Hung, S.-F.; Quan, Q.; Zhang, N.; Xu, Y.-J.; Chen, H.M. Electrocatalysis for the oxygen evolution reaction: Recent development and future perspectives. Chem. Soc. Rev. 2017, 46, 337–365. [Google Scholar] [CrossRef] [PubMed]
  2. Matsumoto, Y.; Sato, E. Electrocatalytic properties of transition metal oxides for oxygen evolution reaction. Mater. Chem. Phys. 1986, 14, 397–426. [Google Scholar] [CrossRef]
  3. Reier, T.; Oezaslan, M.; Strasser, P. Electrocatalytic Oxygen Evolution Reaction (OER) on Ru, Ir, and Pt Catalysts: A Comparative Study of Nanoparticles and Bulk Materials. ACS Catal. 2012, 2, 1765–1772. [Google Scholar] [CrossRef]
  4. Kim, J.; Zhou, R.; Murakoshi, K.; Yasuda, S. Advantage of semi-ionic bonding in fluorine-doped carbon materials for the oxygen evolution reaction in alkaline media. RSC Adv. 2018, 8, 14152–14156. [Google Scholar] [CrossRef]
  5. Xiao, Z.; Huang, X.; Xu, L.; Yan, D.; Huo, J.; Wang, S. Edge-selectively phosphorus-doped few-layer graphene as an efficient metal-free electrocatalyst for the oxygen evolution reaction. Chem. Commun. 2016, 52, 13008–13011. [Google Scholar] [CrossRef] [PubMed]
  6. Cheng, Y.; Zhang, J.; Jiang, S.P. Are metal-free pristine carbon nanotubes electrocatalytically active? Chem. Commun. 2015, 51, 13764–13767. [Google Scholar] [CrossRef] [PubMed] [Green Version]
  7. Tian, G.L.; Zhao, M.Q.; Yu, D.; Kong, X.Y.; Huang, J.Q.; Zhang, Q.; Wei, F. Nitrogen-Doped Graphene/Carbon Nanotube Hybrids: In Situ Formation on Bifunctional Catalysts and Their Superior Electrocatalytic Activity for Oxygen Evolution/Reduction Reaction. Small 2014, 10, 2251–2259. [Google Scholar] [CrossRef]
  8. Zhao, Y.; Nakamura, R.; Kamiya, K.; Nakanishi, S.; Hashimoto, K. Nitrogen-doped carbon nanomaterials as non-metal electrocatalysts for water oxidation. Nat. Commun. 2013, 4, 1–7. [Google Scholar] [CrossRef]
  9. Staud, N.; Sokol, H.; Ross, P.N. The Corrosion of Carbon Black Anodes in Alkaline Electrolyte. IV. Current Efficiencies for Oxygen Evolution from Metal Oxide-Impregnated Graphitized Furnace Blacks. J. Electrochem. Soc. 1989, 136, 3570–3576. [Google Scholar] [CrossRef]
  10. Yi, Y.; Weinberg, G.; Prenzel, M.; Greiner, M.; Heumann, S.; Becker, S.; Schlögl, R. Electrochemical corrosion of a glassy carbon electrode. Catal. Today 2017, 295, 32–40. [Google Scholar] [CrossRef]
  11. McCrory, C.C.L.; Jung, S.; Peters, J.C.; Jaramillo, T.F. Benchmarking Heterogeneous Electrocatalysts for the Oxygen Evolution Reaction. J. Am. Chem. Soc. 2013, 135, 16977–16987. [Google Scholar] [CrossRef] [PubMed] [Green Version]
  12. Suntivich, J.; May, K.J.; Gasteiger, H.A.; Goodenough, J.B.; Shao-Horn, Y. A perovskite oxide optimized for oxygen evolution catalysis from molecular orbital principles. Science 2011, 334, 1383–1385. [Google Scholar] [CrossRef] [PubMed]
  13. Görlin, M.; Chernev, P.; De Araújo, J.F.; Reier, T.; Dresp, S.; Paul, B.; Krähnert, R.; Dau, H.; Strasser, P. Oxygen Evolution Reaction Dynamics, Faradaic Charge Efficiency, and the Active Metal Redox States of Ni–Fe Oxide Water Splitting Electrocatalysts. J. Am. Chem. Soc. 2016, 138, 5603–5614. [Google Scholar] [CrossRef] [PubMed]
  14. Berkes, B.B.; Jozwiuk, A.; Vračar, M.; Sommer, H.; Brezesinski, T.; Janek, J. Online Continuous Flow Differential Electrochemical Mass Spectrometry with a Realistic Battery Setup for High-Precision, Long-Term Cycling Tests. Anal. Chem. 2015, 87, 5878–5883. [Google Scholar] [CrossRef]
  15. Kanan, M.W.; Nocera, D.G. In Situ Formation of an Oxygen-Evolving Catalyst in Neutral Water Containing Phosphate and Co2+. Science 2008, 321, 1072–1075. [Google Scholar] [CrossRef] [PubMed]
  16. Sato, Y.; Itoh, K.; Hagiwara, R.; Fukunaga, T.; Ito, Y. On the so-called “semi-ionic” C–F bond character in fluorine–GIC. Carbon 2004, 42, 3243–3249. [Google Scholar] [CrossRef]
  17. Corrigan, D.A. The Catalysis of the Oxygen Evolution Reaction by Iron Impurities in Thin Film Nickel Oxide Electrodes. J. Electrochem. Soc. 1987, 134, 377–384. [Google Scholar] [CrossRef]
  18. Trotochaud, L.; Young, S.L.; Ranney, J.K.; Boetther, S.W. Nickel-Iron Oxyhydroxide Oxygen Evolution Electrocatalysis: The Role of Intentional and Incidental Iron Incorporation. J. Am. Chem. Soc. 2014, 136, 6744–6753. [Google Scholar] [CrossRef]
  19. Bockris, J.O.M. Kinetics of Activation Controlled Consecutive Electrochemical Reactions: Anodic Evolution of Oxygen. J. Chem. Phys. 1956, 24, 817–827. [Google Scholar] [CrossRef]
  20. Surendranath, Y.; Kanan, M.W.; Nocera, D.G. Mechanistic Studies of the Oxygen Evolution Reaction by a Cobalt-Phosphate Catalyst at Neutral pH. J. Am. Chem. Soc. 2010, 132, 16501–16509. [Google Scholar] [CrossRef]
  21. Shinagawa, T.; Garcia-Esparza, A.T.; Takanabe, K. Insight on Tafel slopes from a microkinetic analysis of aqueous electrocatalysis for energy conversion. Sci. Rep. 2015, 5, 1–21. [Google Scholar] [CrossRef] [PubMed]
  22. Iwakura, C.; Fukuda, K.; Tamura, H. The anodic evolution of oxygen on platinum oxide electrode in alkaline solutions. Electrochim. Acta 1976, 21, 501–508. [Google Scholar] [CrossRef]
  23. Bockris, J.O.M.; Otagawa, T. The Electrocatalysis of Oxygen Evolution on Perovskites. J. Electrochem. Soc. 1984, 131, 290–302. [Google Scholar] [CrossRef]
Figure 1. OER from F–carbon in 0.1 M KOH solution (pH = 13). (a) Applied potential (E), (b) current density ( j total ), and (c) O2 concentration ( C O 2 ) were plotted versus time.
Materials 12 00211 g001
Figure 2. Tafel plot of logarithm total current density (log( j total )) versus electrochemical potential (E) under oxygen evolution condition from F–carbon. The data were recorded in pH 13 (circle), pH 13.5 (square) and pH 14 (triangle). Current density was averaged throughout at each potential step.
Materials 12 00211 g002
Figure 3. Tafel plot of logarithm reaction rate of OER ( r OER ) versus electrochemical potential (E) under oxygen evolution condition from F–carbon. The data were recorded at pH 13 (circle), pH 13.5 (square), and pH 14 (triangle). Values of r OER were evaluated from the slope of concentration of oxygen versus time: d C O 2 /dt.
Materials 12 00211 g003
Figure 4. Schematic illustration of the reaction mechanism of F–carbon. Pre-equilibrium of the hydroxide adsorption and one-electron oxidation occurred at positively charged carbon sites (red) with respect to the fluorine-doped carbon sites (blue). The adsorbed hydroxide reacts with H2O as the irreversible rate-determining chemical step.
Materials 12 00211 g004

