To accurately predict the mechanical properties of the plate-like EMWM, the temperature softening term expression in the Johnson-Cook model is incorporated into the Sherwood–Frost constitutive framework model, and is assumed. On the other hand, the mechanical properties of the EMWM were characterized by the density term, the strain strengthening term and the strain rate strengthening term in the Sherwood–Frost constitutive framework model. The advantages of the two constitutive models were fully combined to establish a relatively accurate quasi-static compression constitutive model of the plate-like EMWM with the consideration of the temperature effect. At the same time, the influence of thermal stress inside the EMWM should be considered.
The thermal stress of the EMWM changes with the change of the ambient temperature, and then the stress–strain curves will not start from zero strain and zero stress. To facilitate the analysis, thermal stress is only considered in temperature softening term.
3.2. Shape Function
The elastic force of the plate-like EMWM can be described by the form of the product of the strain level and the density term, and can be expressed as follows:
where
Ai is the coefficient of the polynomial, n is the number of polynomials.
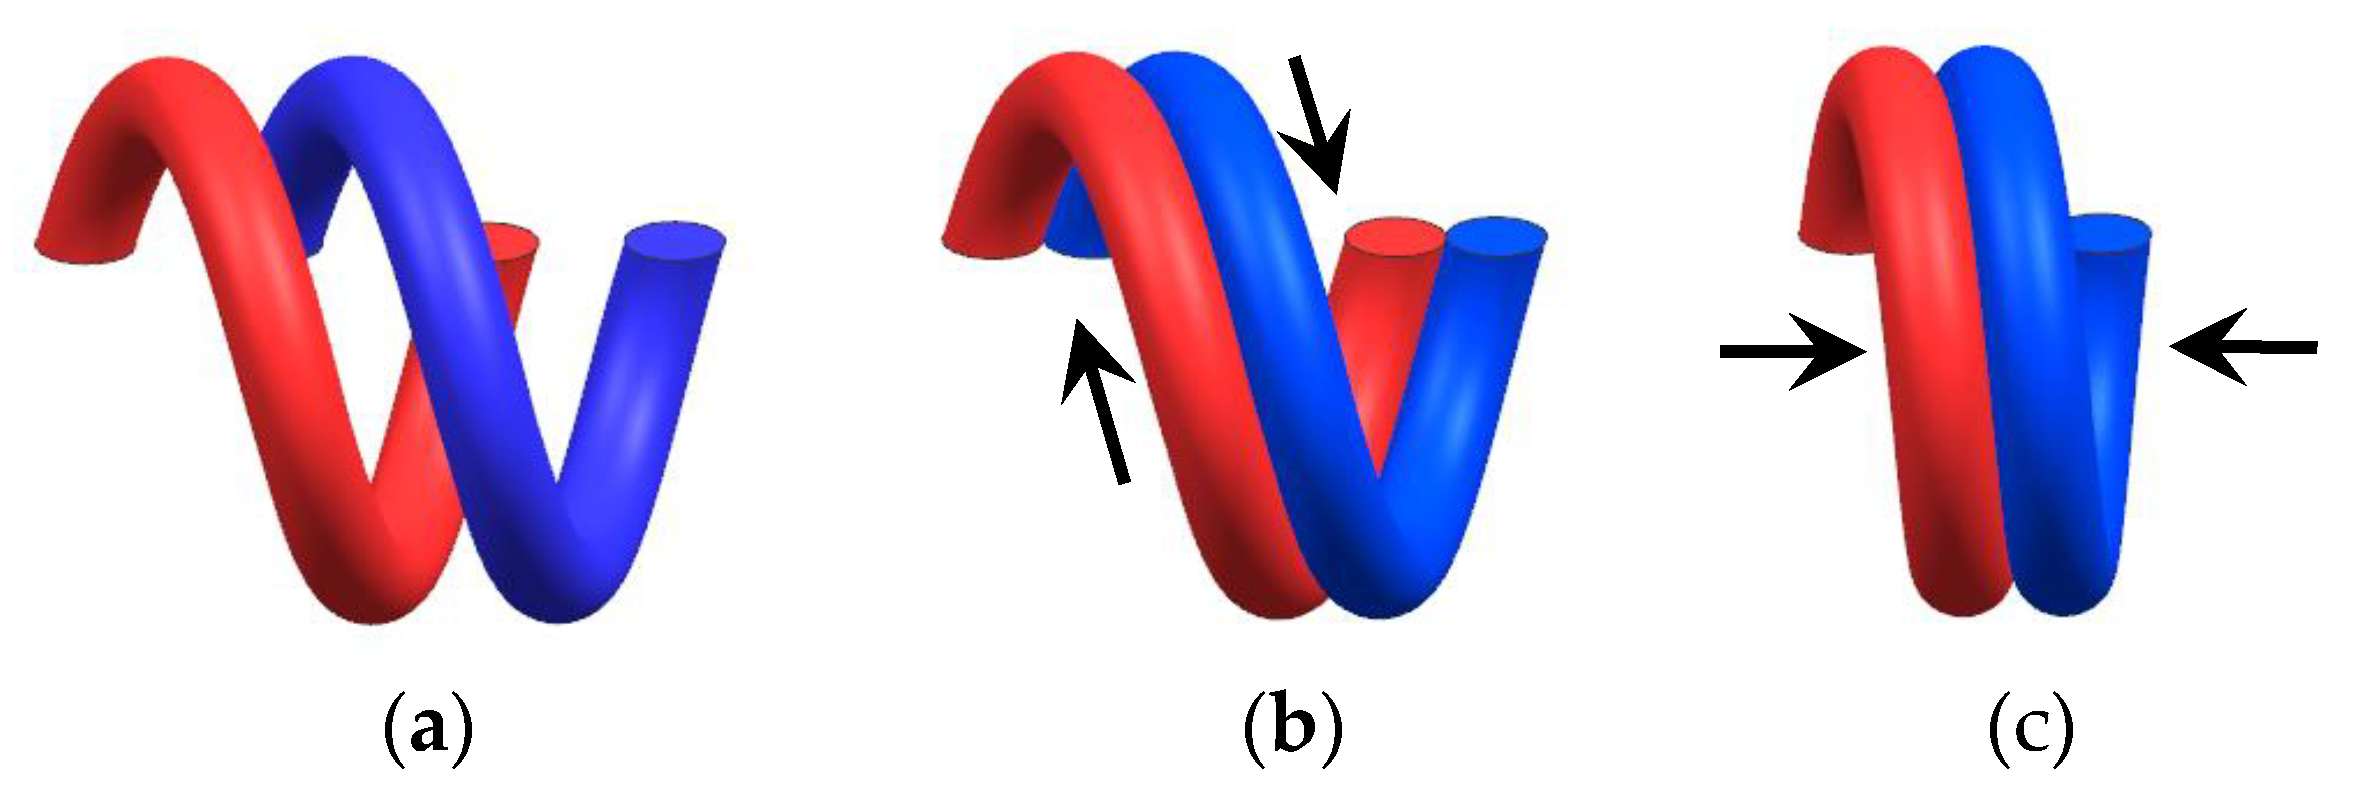
The friction between the internal wire helixes at contact points of the EMWM directly affects the stiffness and the energy dissipation capacity of the EMWM. The internal contact points of the EMWM under the external load can be divided into three types: First type (1) there is no shearing force at the contact point. Second type (2) there is a shear force at the contact point, but no slip occurs due to the static friction at the contact point. Third type (3) there is a shear force at the contact point and the force is greater than the static friction force at the contact point. Slip friction occurs between the contact points.
The frictional contact point of the EMWM can be regarded as all of the contact points in the three-dimensional space, which satisfy the Poisson distribution characteristics. If the probability of the contact state in internal EMWM transitioning from the first type (1) to the second type (2) or the third type (3) is considered equal, and the mutual transition between states is completely independent, the latter can be considered a Poisson distribution. The relationship between the number
of contact points where friction exists and the number of all contact points
in the EMWM can be expressed by Equation (10).
where
is the structural parameters of the EMWM,
is deformation value after alternating changes in deformation direction.
,
and
are respectively number of first type of contact points (1), second type of contact points (2) and third type of contact points (3), which directly affect the internal friction of EMWM components.
During the loading process of the plate-like EMWM, there exists a relative movement between the wire helixes, and the energy will be dissipated by friction. The stress on the EMWM includes the elastic stress
and the friction stress
. The friction is related to the number of contact points and the contact area inside the EMWM. It can be known from the literature [
28] that the relationship between the internal elastic stress
and the frictional stress
of the EMWM can be expressed as Equation (11).
where
ξ and
λ are the proportional coefficients, which are associated with the contact points of the internal structure.
Then, the total stress inside the EMWM can be described as Equation (12).
By comparing the Sherwood–Frost constitutive frame model with the above equation and substituting Equation (8) into Equation (2), the modified shape function can be obtained as Equation (13).
The reference density
is set as
, and the reference temperature
T0 is set as
. When
,
, the temperature softening term and the density term can be expressed as Equations (14) and (15).
Substituting Equations (13)–(14) into the Equation (2), the stress–strain relationship of the plate-like EMWM specimen with a density of
at 20 °C can be expressed as Equation (16).
where
.
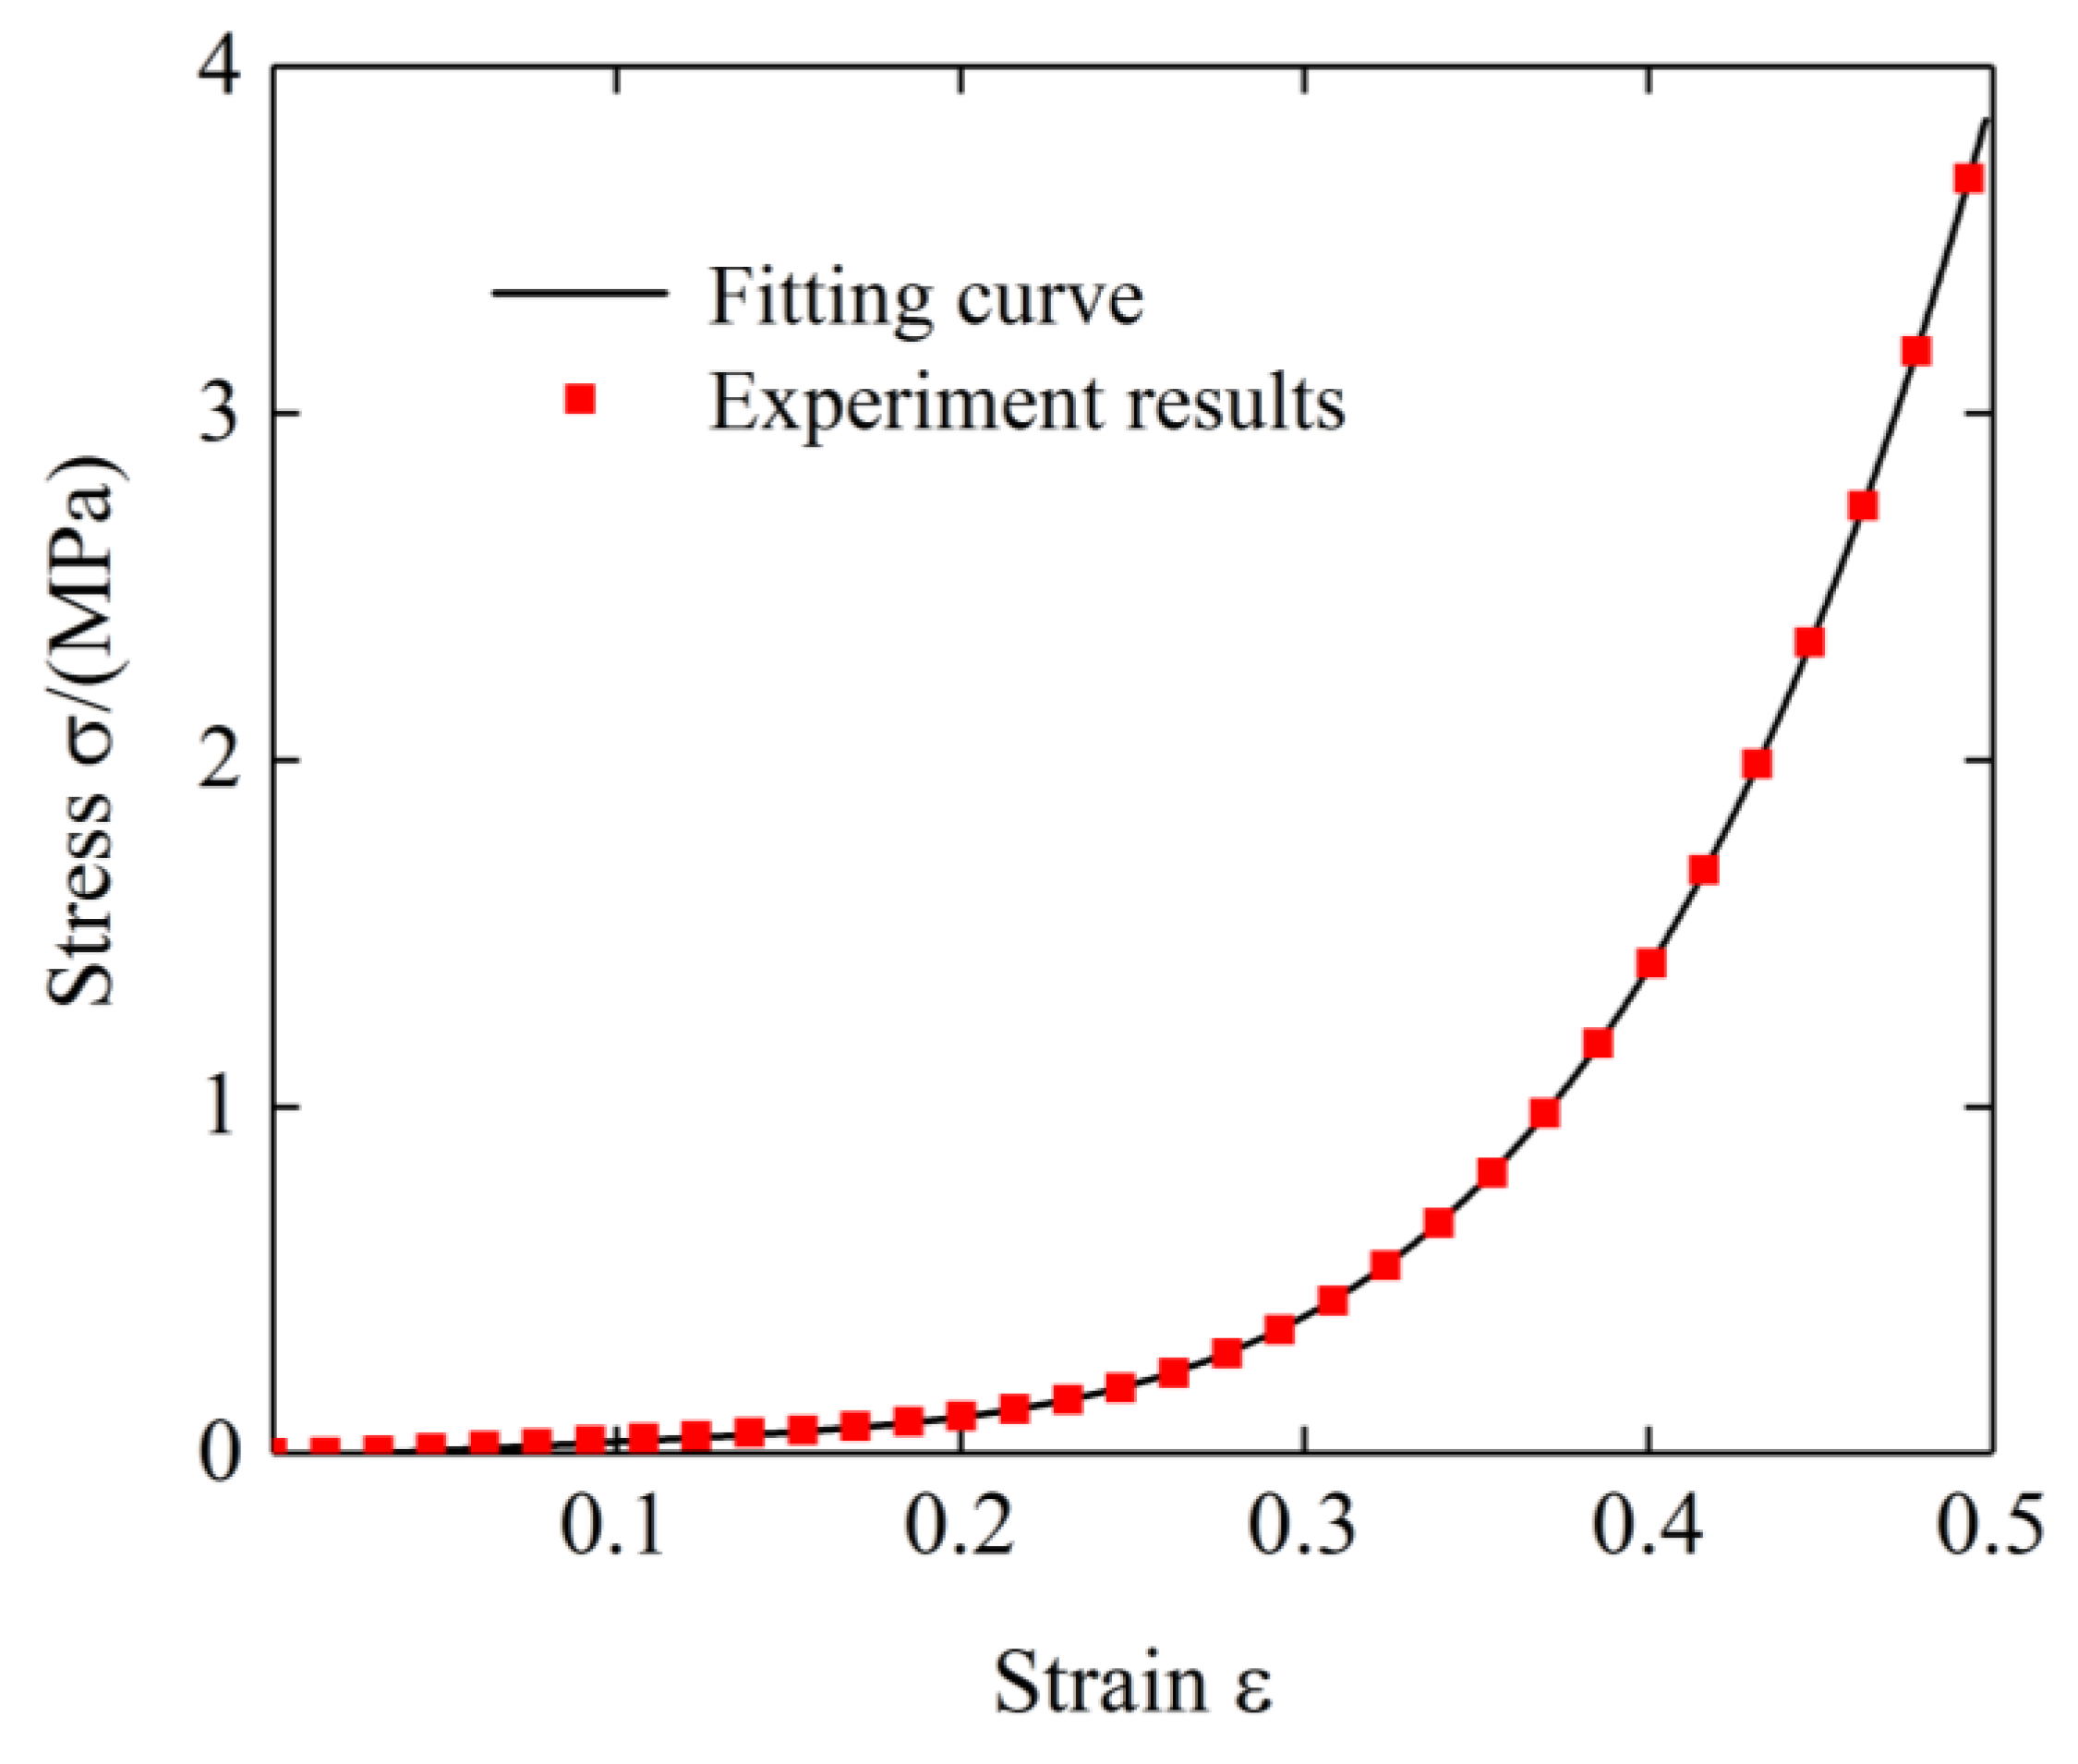
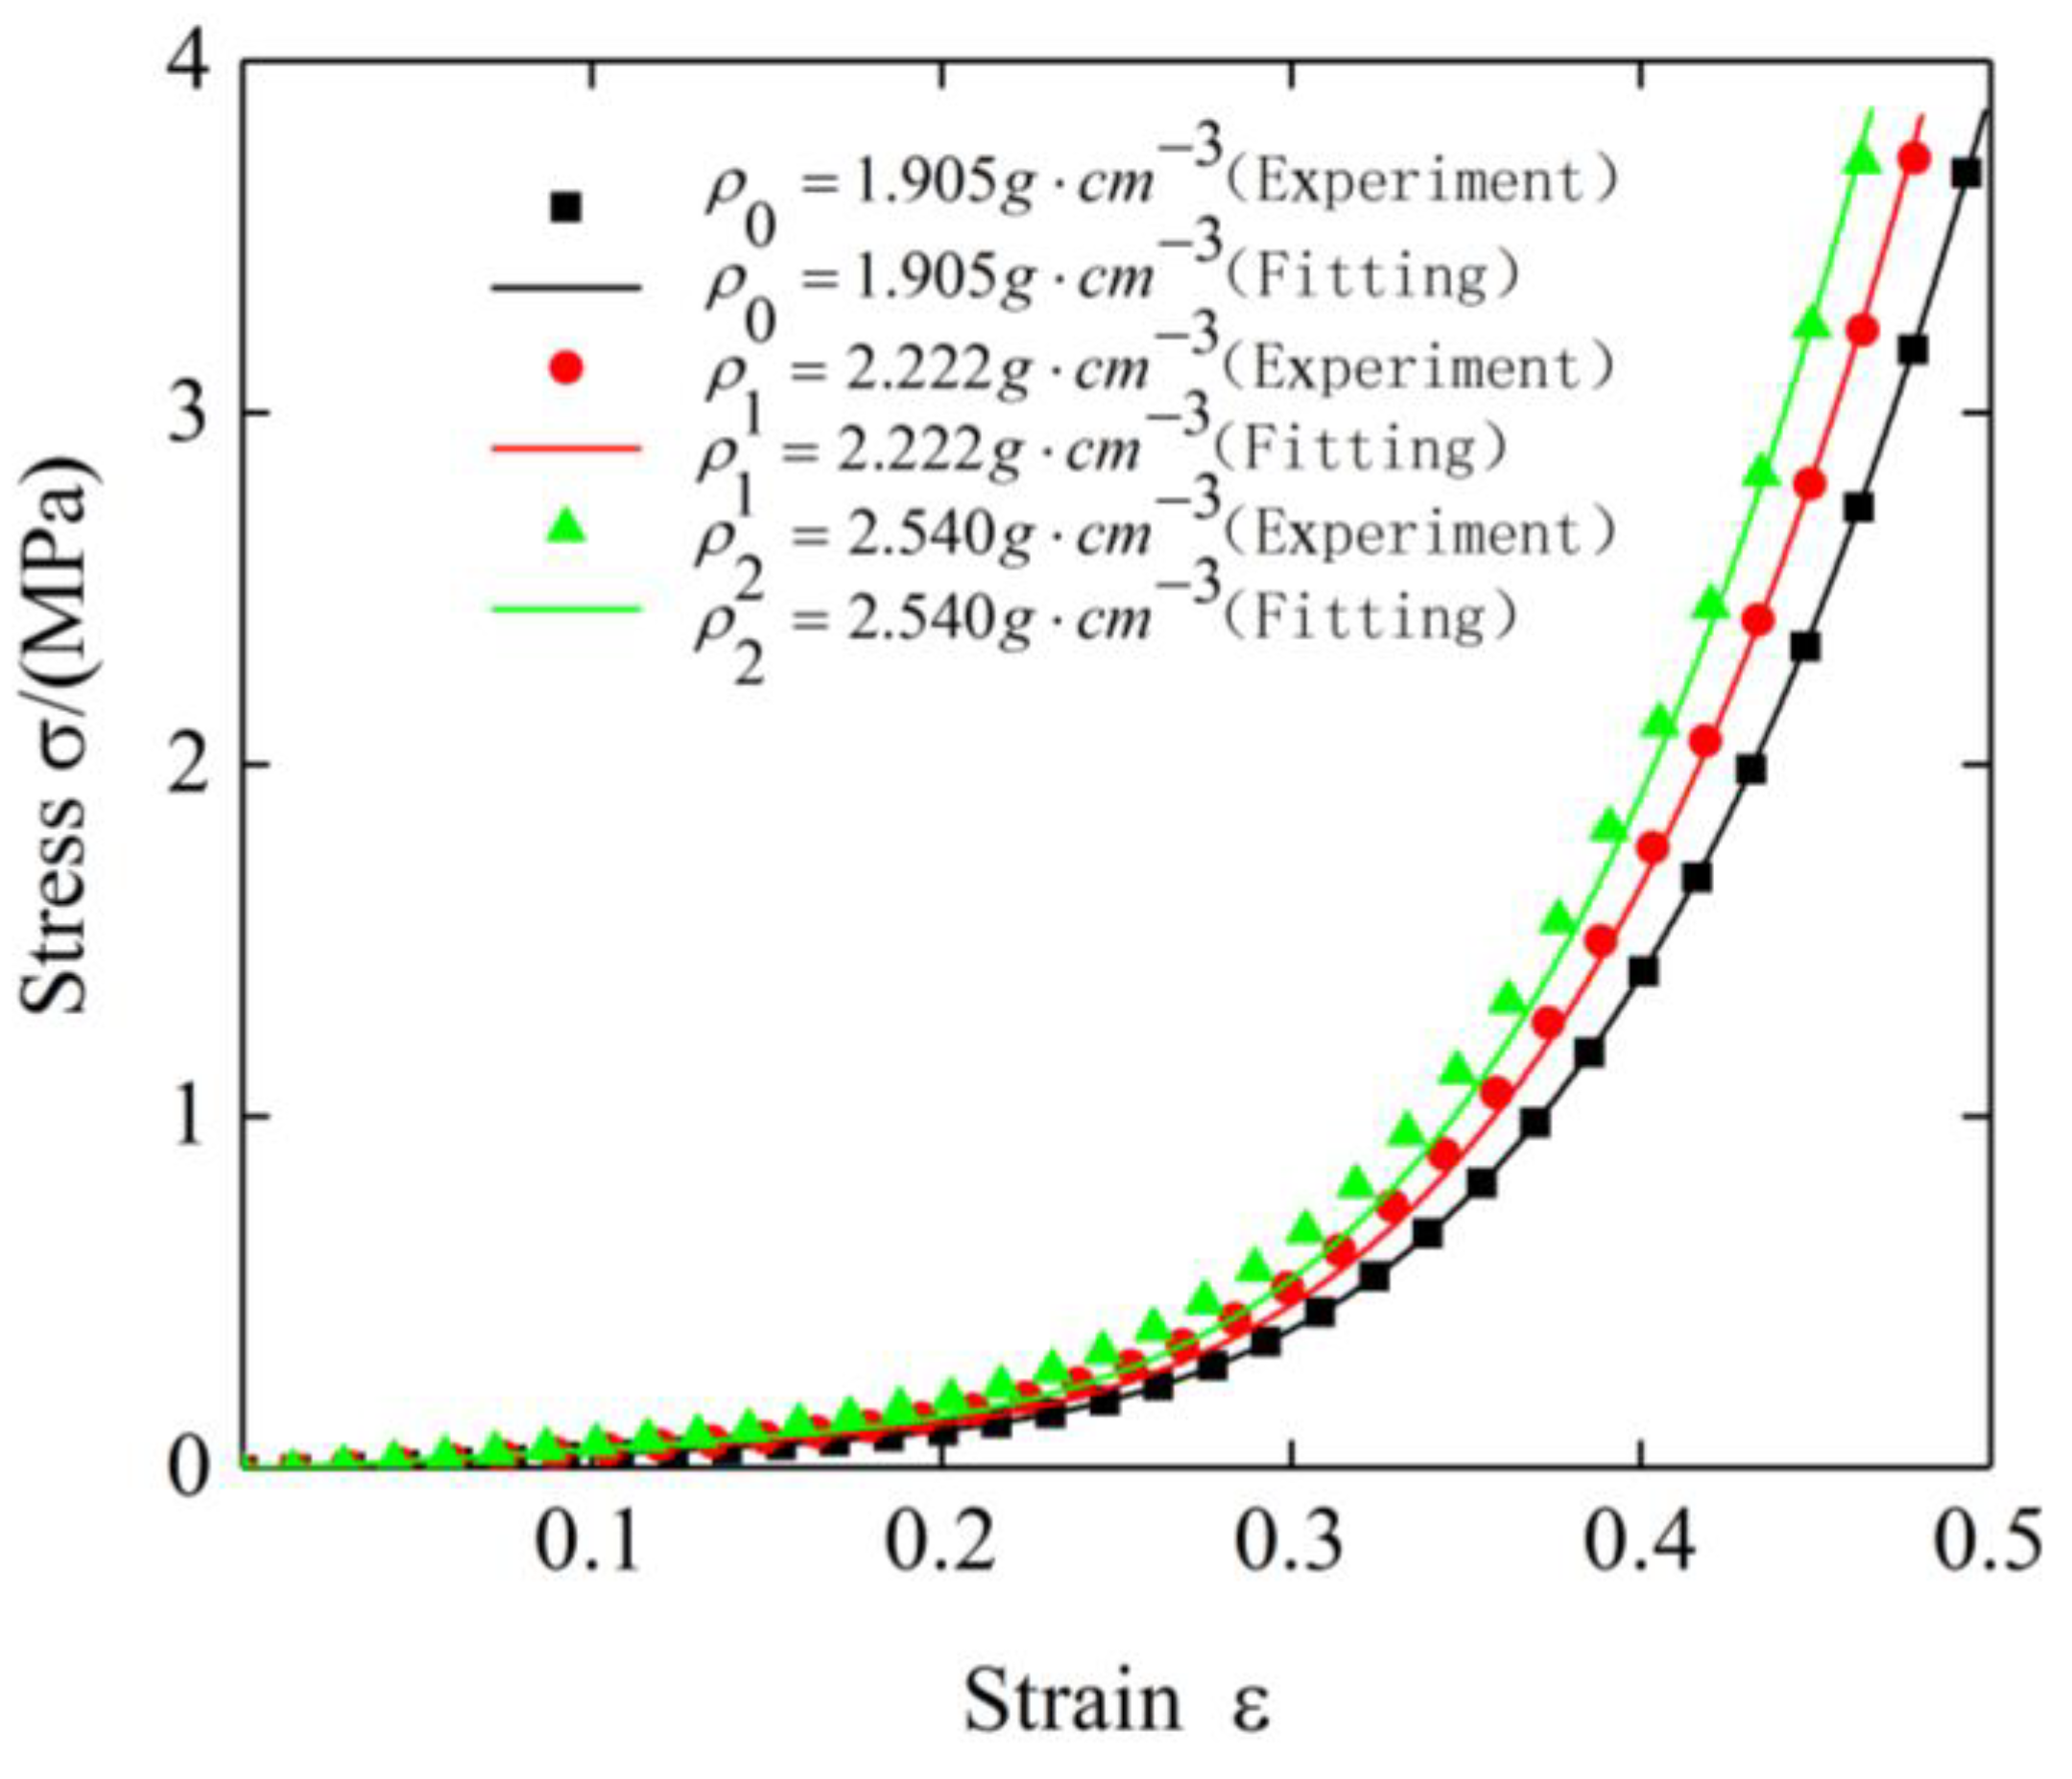
To obtain the correlation coefficient in the shape function, the test data of specimen 1 was subjected to the least squares fitting at room temperature. To avoid the shape function expression being too complicated and ensure high fitting precision, the value of
n is set as 3. The fitting curve obtained is shown in
Figure 12. The fitting parameters are shown in
Table 2.
3.4. Temperature Softening Term
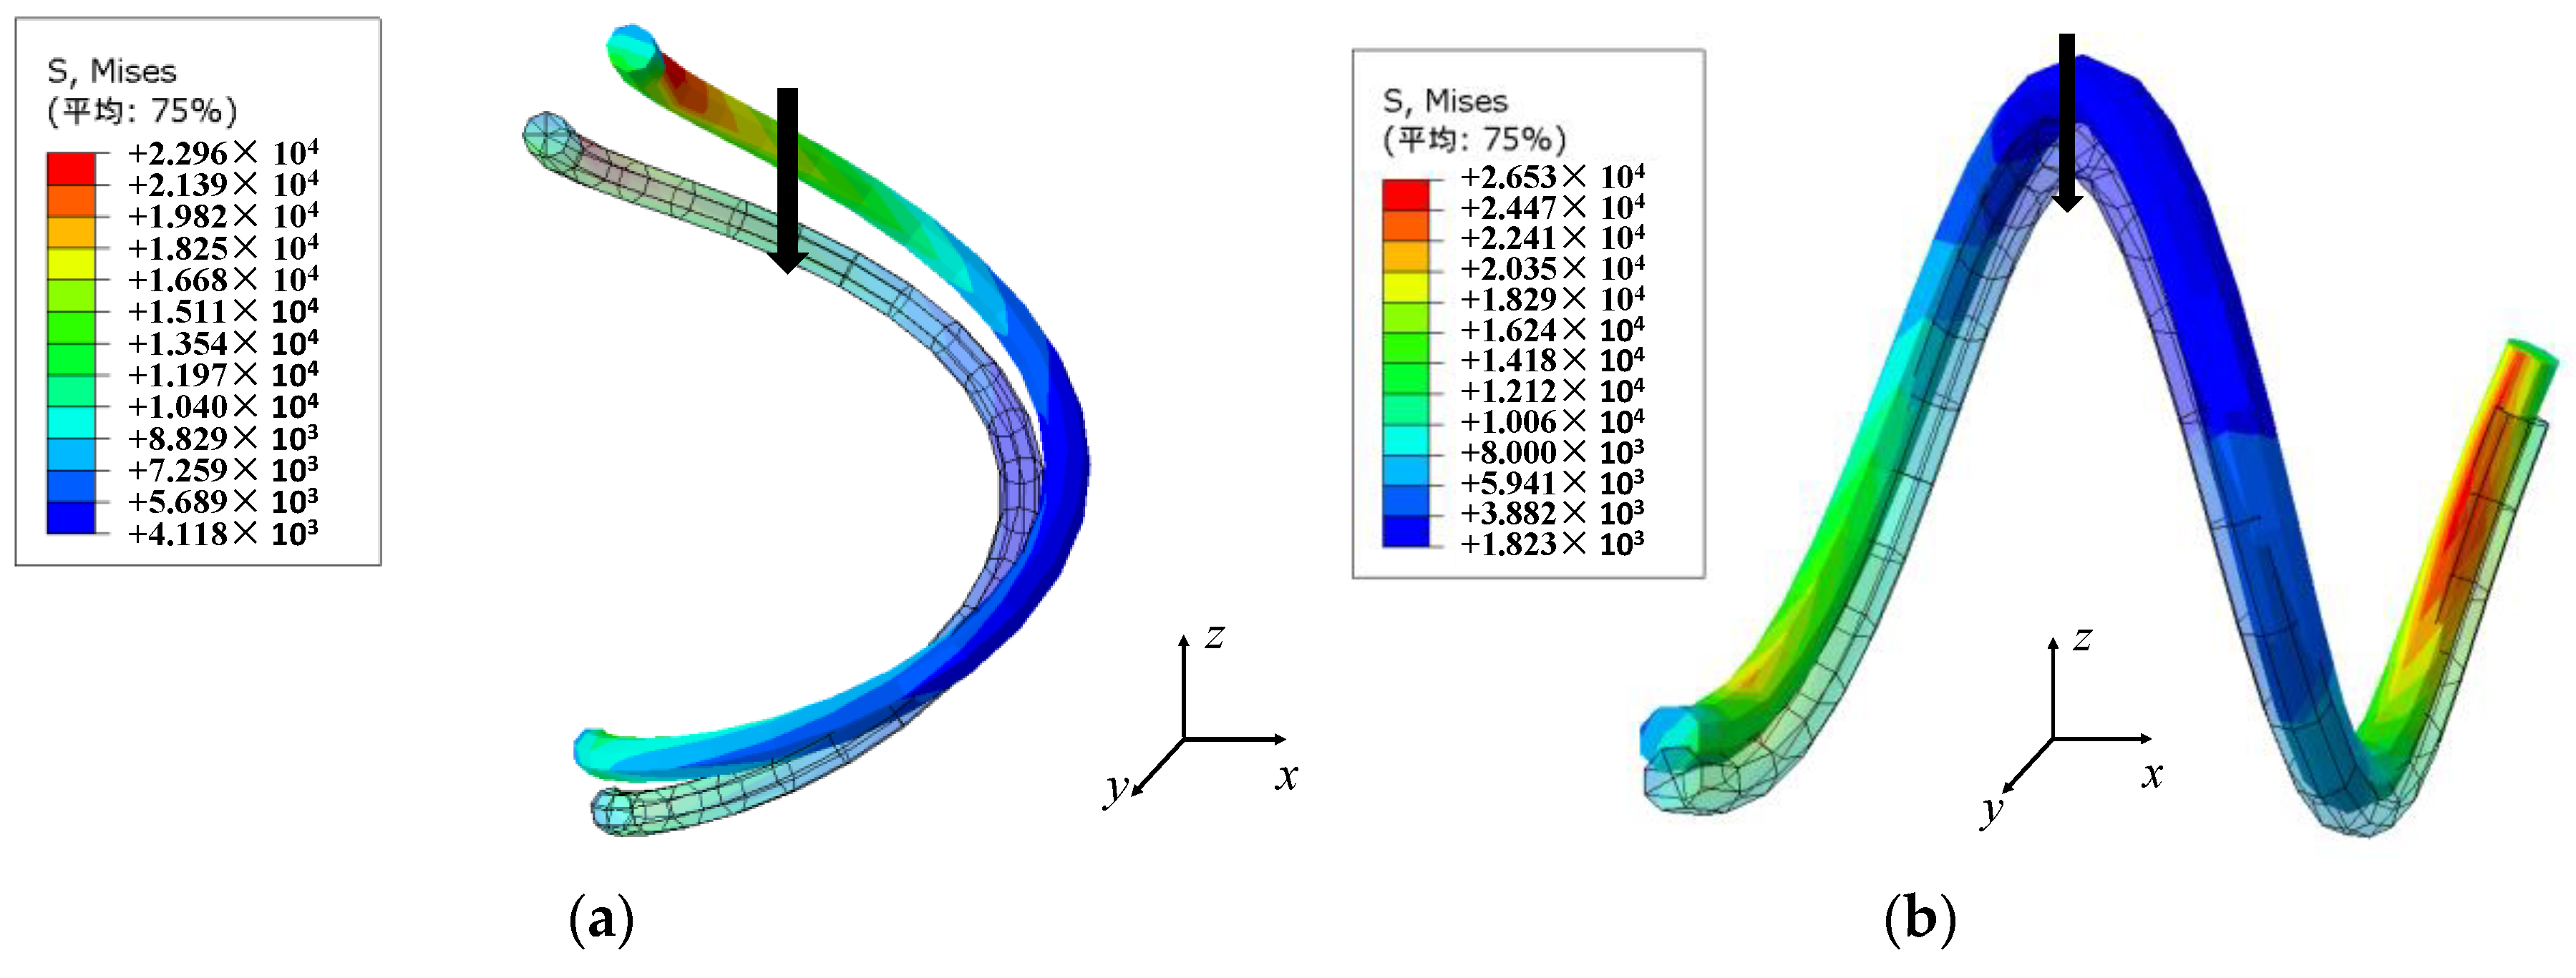
To investigate the influence of the ambient temperature on the thermal expansion coefficient of the metal wire helixes, the thermal expansion behavior of the micro-element structure was analyzed by the finite element method (Abaqus). Assume that the inner wire helix of the plate-like EMWM has only longitudinal and lateral spiral arrangement [
33], the material of the wire helix is 06Cr19Ni10, the Poisson’s ratio is 0.247, and the average expansion coefficient at 0–500 °C is
, the average elastic modulus is
, the diameter of the metal wire is 0.3 mm, the spring diameter of the wire helix is 3 mm, and the helix angle is 60°. A thermal load of 500 °C was applied to the wire helix, and the thermal expansion deformation of the longitudinal and lateral micro-body was compared with the wire helix at room temperature. The comparison results are shown in
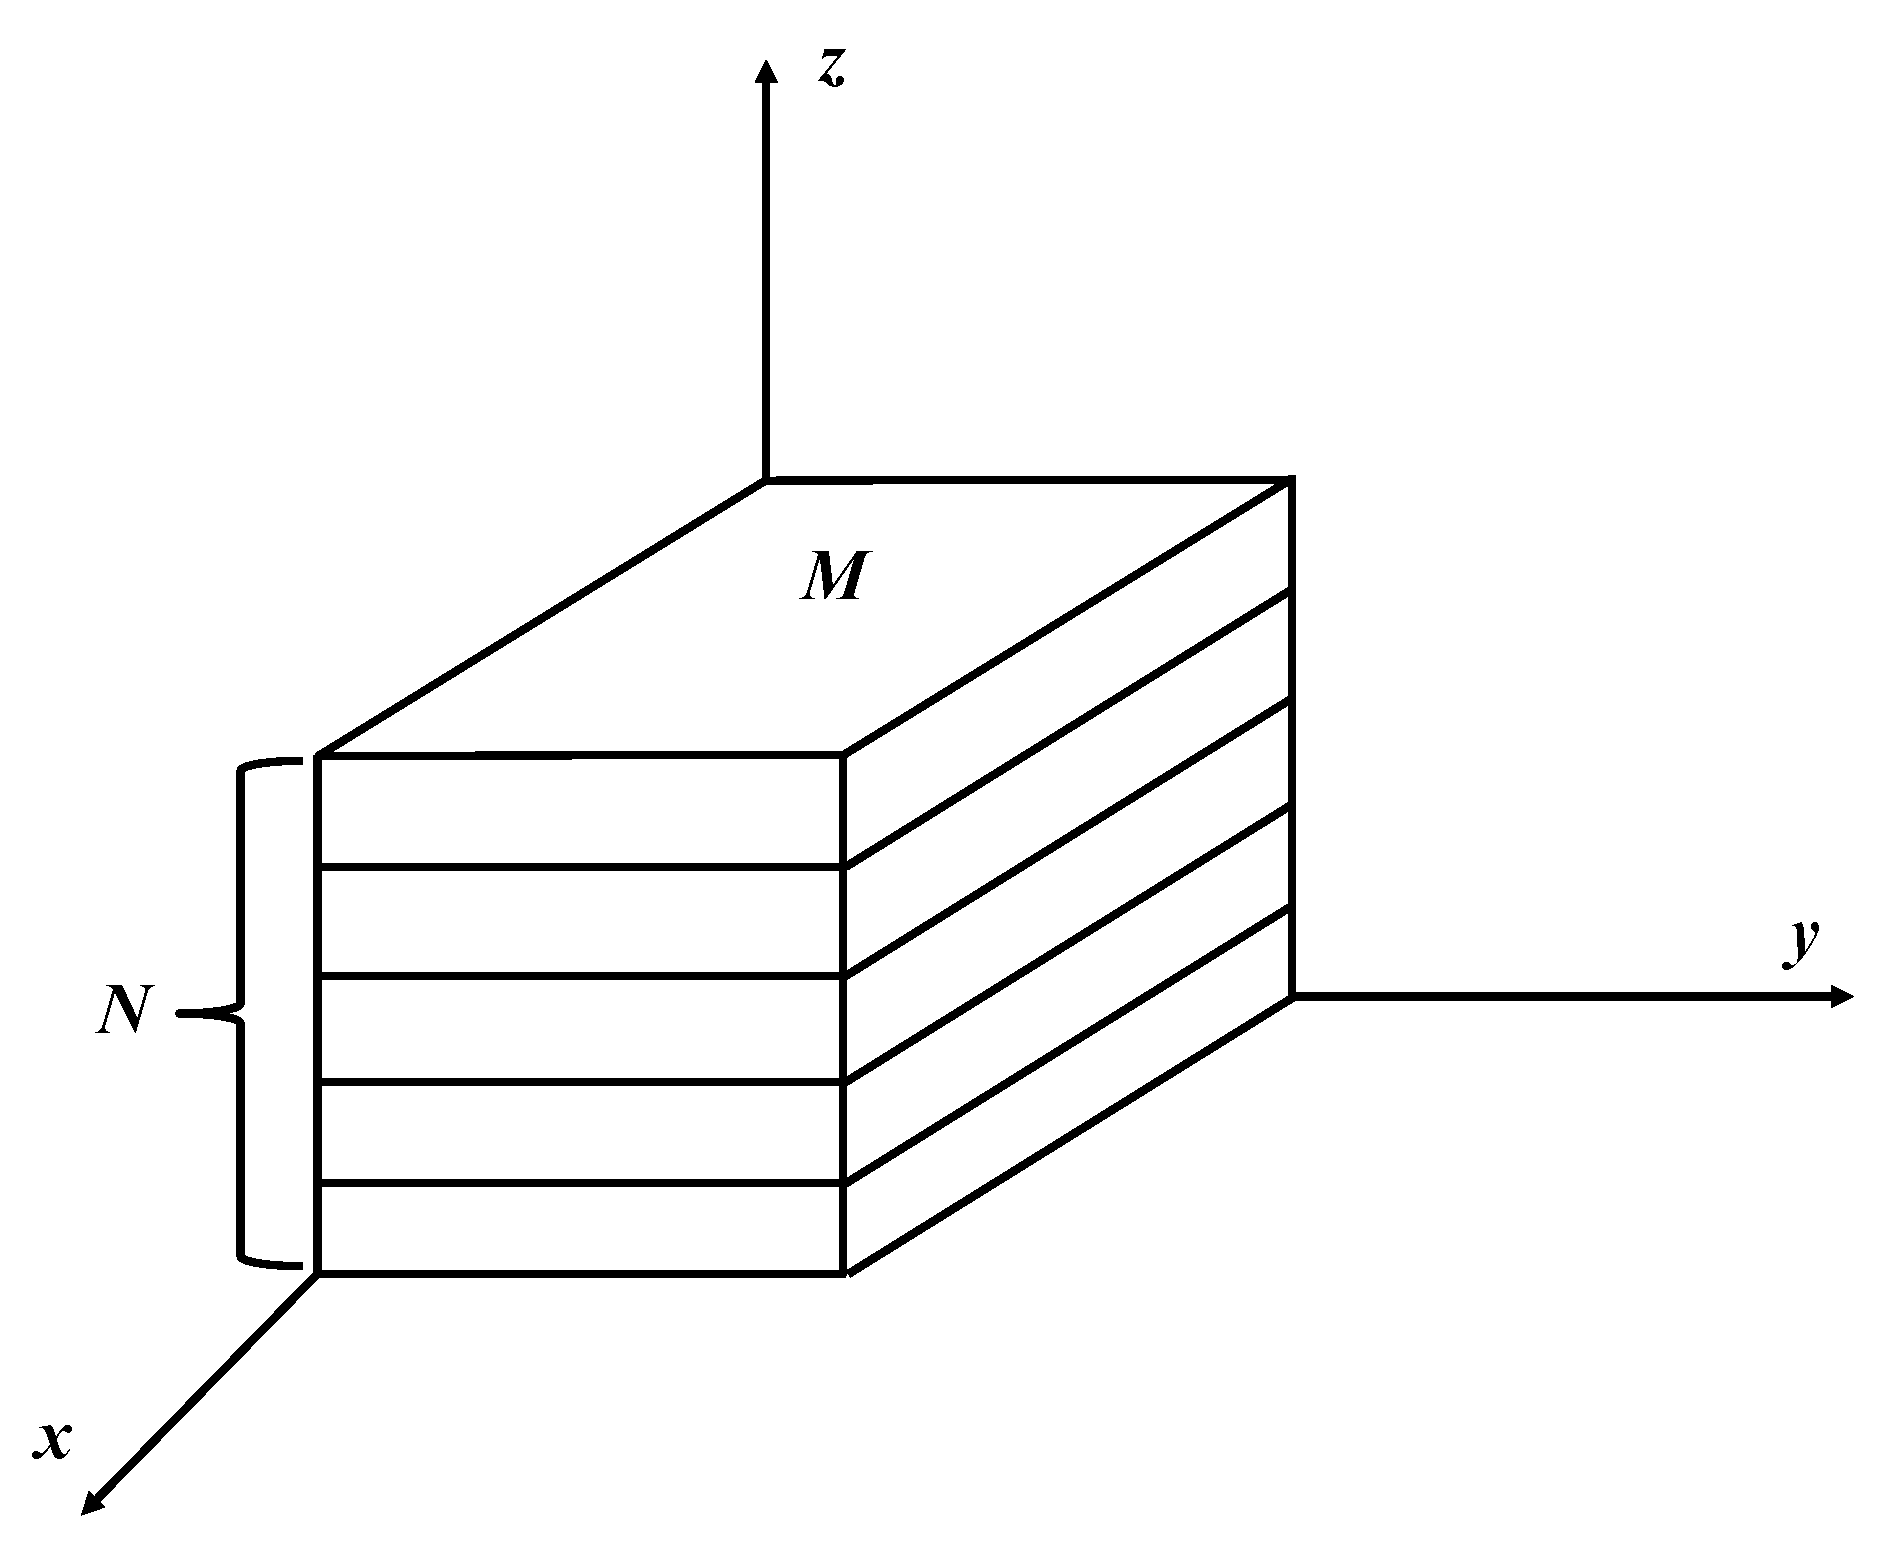
Figure 15. The z-axis in the
Figure 15 indicates the forming direction and x-axis indicates the non-forming direction.
Figure 15 shows that the thermal deformation of the longitudinal micro-element is the axial direction deformation, and the thermal deformation of the lateral micro-element is the radial direction deformation. As shown in
Figure 15, the micro-element has three-contact status under the molding pressure: no contact, slip contact and stick contact. Due to the existence of the internal porosity, the thermal expansion coefficient of the non-contact micro-element is smaller than the thermal expansion coefficient of the wire material itself, which is directly affected by the relative density of the EMWM. When thermal expansion occurs in the wire, the amount of radial expansion of the wire is much smaller than the amount of axial expansion of the wire. Thus, the
can be considered as a constant. Assuming that before the temperature changes, the length of the wire in the
EMWM can be expressed as Equation (20).
where
is wire density,
is wire diameter.
The changes of wire density
with temperature is ignored. When the amount of temperature change is
and the linear expansion coefficient is
, the changes in the length of the original length of
is:
At this time, the volume change of the wire is:
where
, which indicates the relative density of the EMWM. This reflects the proportional relationship between the volume of wire and pores in the EMWM. Changes in ambient temperature will cause changes in wire volume and cause changes of the contact state and the pores of the inner wire of the EMWM, with the result that the macroscopic performance of the EMWM will change.
The thermal expansion coefficient of the micro-elements in contact status is equivalent to the wire itself, and its elastic modulus is not affected by the parameters of the EMWM. With the increase of compression, the number of wire helixes in the non-contact status will decrease, and the internal porosity decreases. Thus, the influence of thermal expansion on the mechanical properties of plate-like EMWM is more significant with the increase of the amount of compression. According to the three contact types of the internal wire helixes (
Figure 10), combined with the effect of thermal expansion on its contact type, the thermal expansion correction coefficient
is assumed as follows:
where
C,
z and
p are the proportional coefficients of the internal micro-element in non-contact, slip-contact and stick contact status, respectively.
There is a clear expression of the temperature softening term in the Johnson-Cook model, but it does not take into account the effects of thermal expansion of the material. In this paper, according to the trend of the stress-strain curve under different temperatures, an appropriate thermal expansion correction coefficient is added to the temperature softening term. The modified temperature softening term is expressed as follows
When , the EMWM is not affected by temperature softening term, and . The second term in the Equation (24) is the thermal expansion correction coefficient.
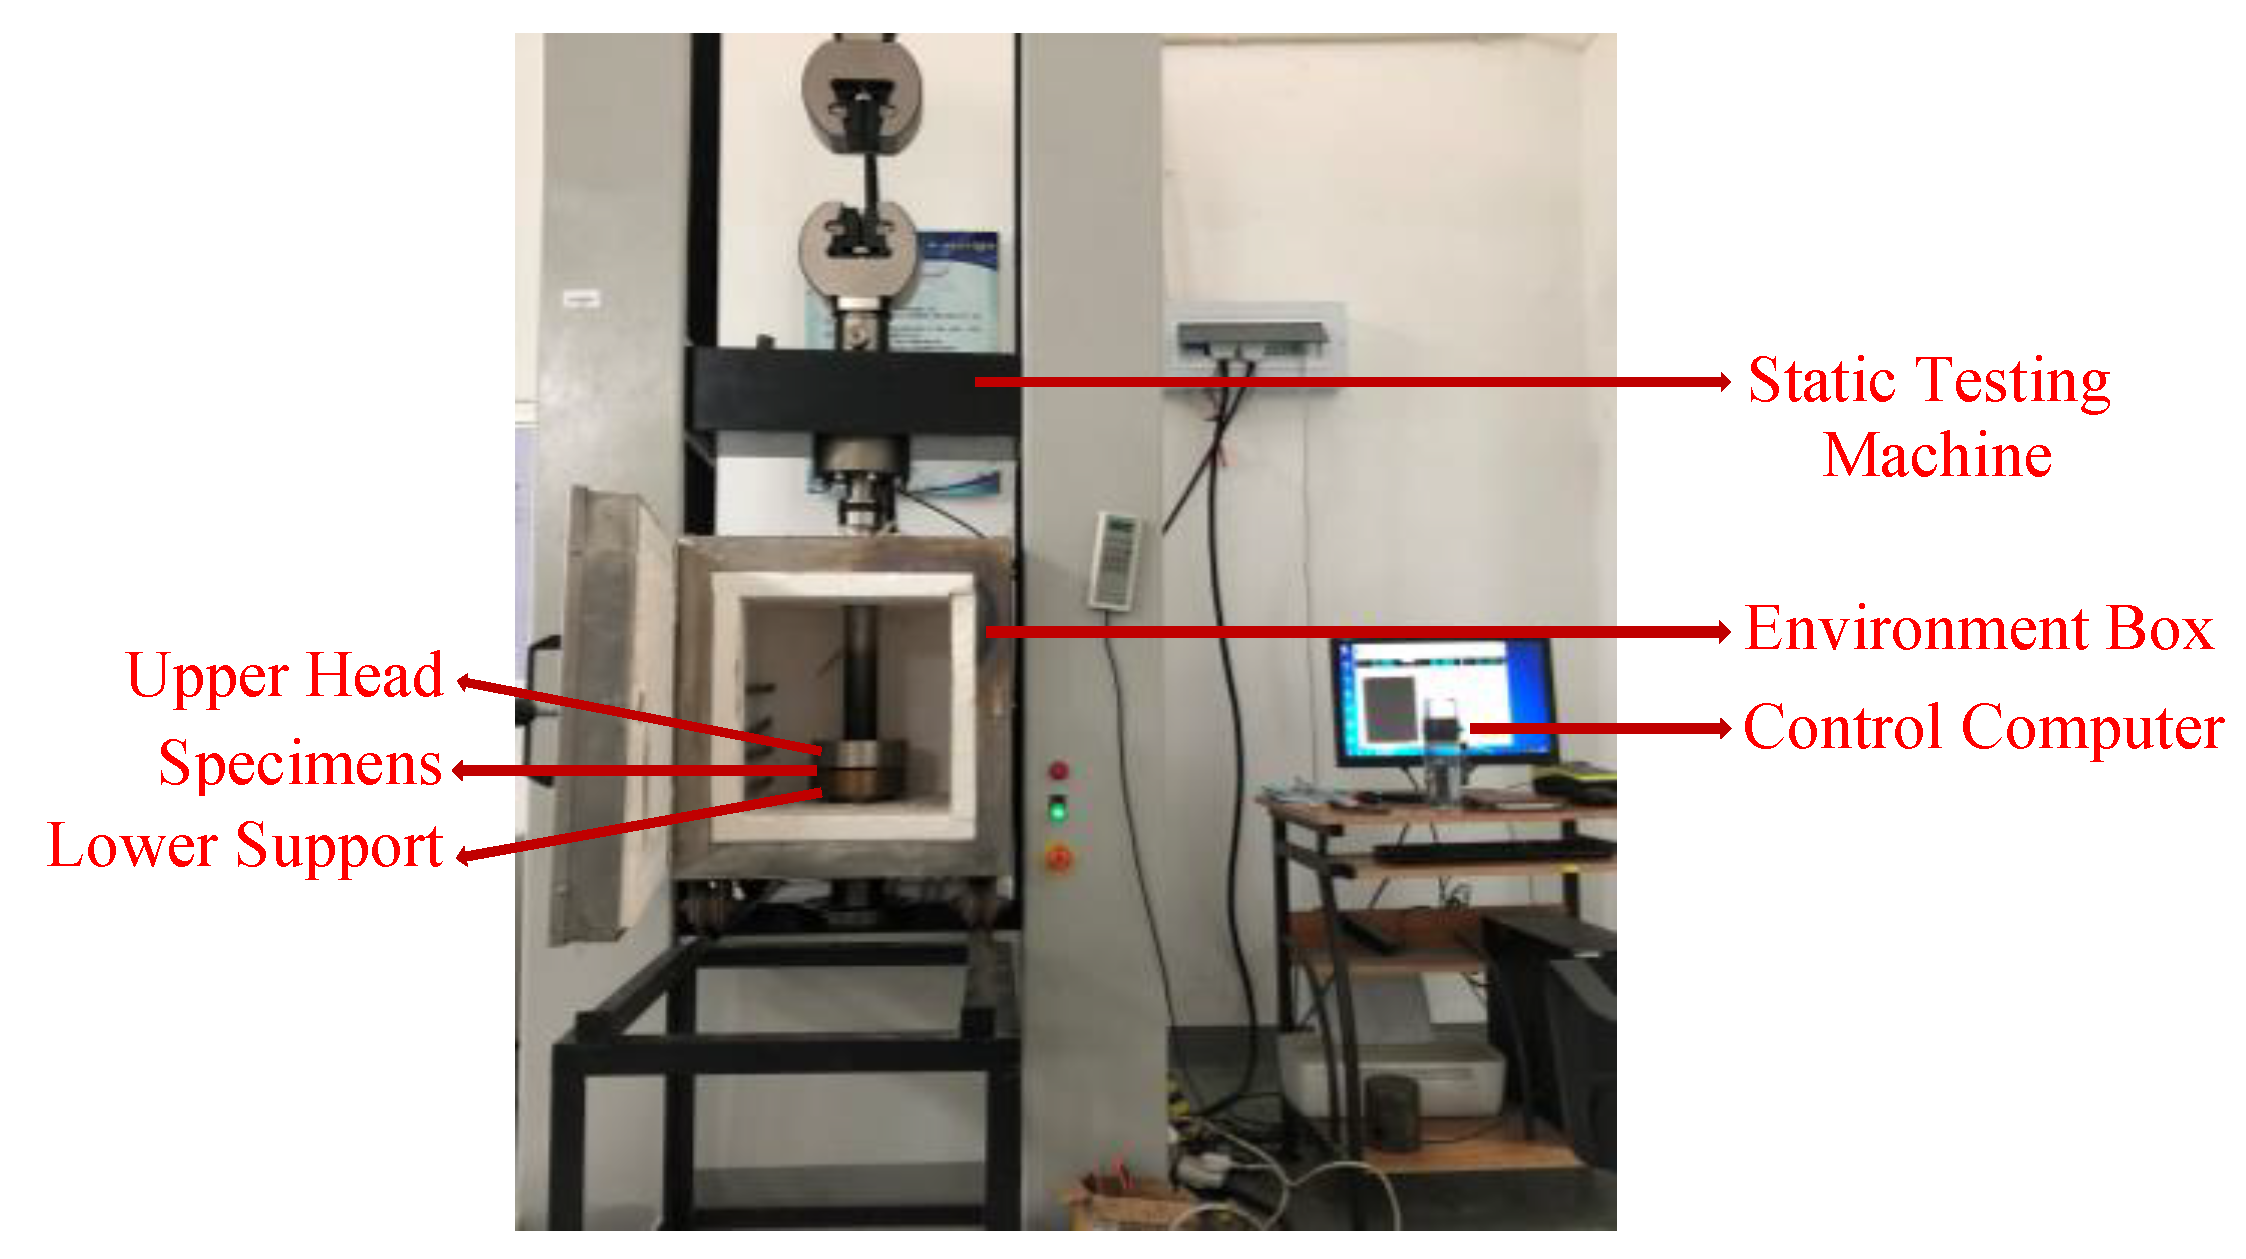
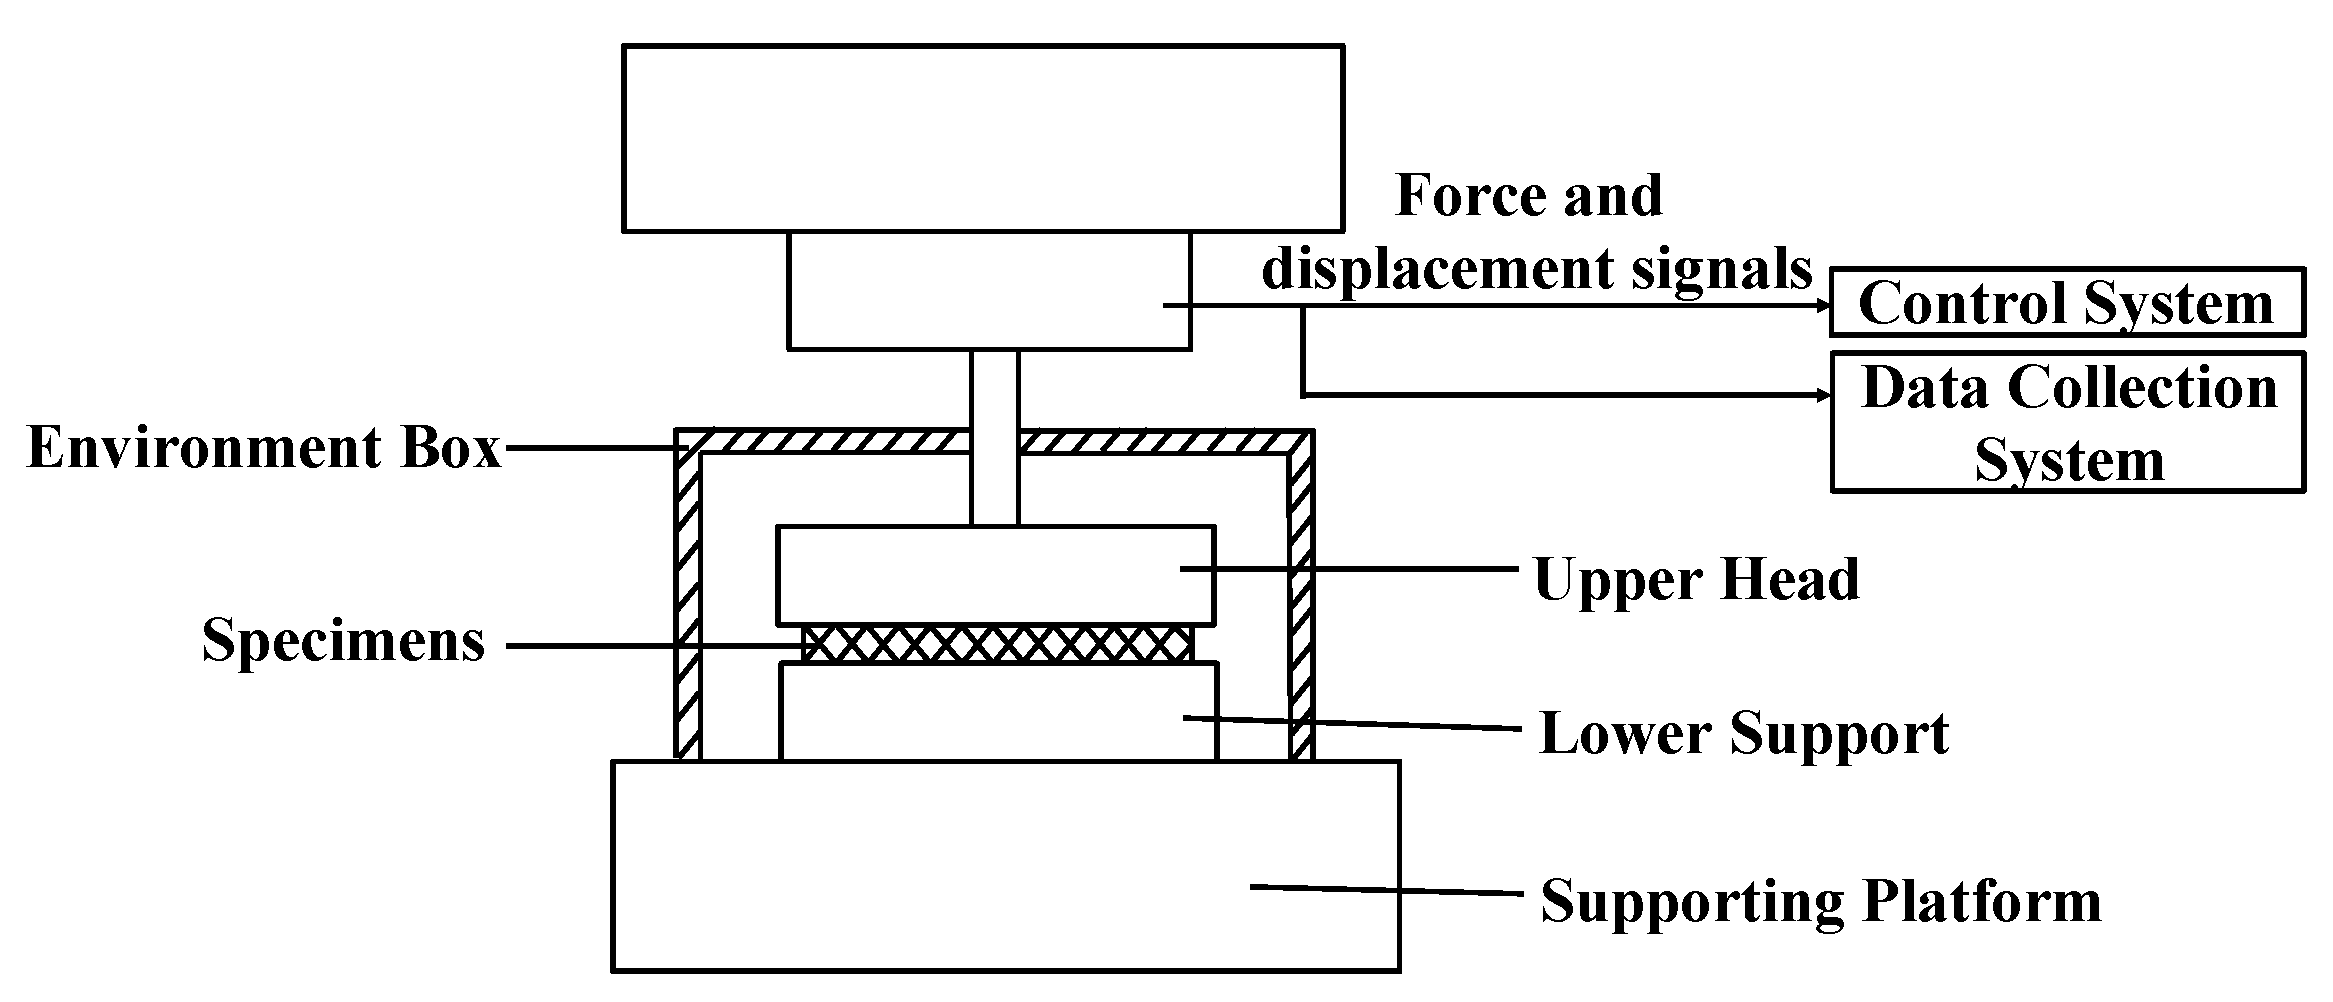
During the test, due to the pre-pressure (20 N), the EMWM was constrained by the upper head and lower support of the electronic universal testing machine in the molding direction. Therefore, in high-temperature environments, the wire helixes cannot expand freely in the molding direction. It indicates that as the temperature rises, the wire will expand internally and cause a decrease in the porosity of the EMWM. On the other hand, because EMWM was heated under restraint, the effect of thermal stress should be considered. The thermal stress values of the EMWM are shown in
Table 3.
It is notable that at the same temperature, the greater the density of the specimens the greater the thermal stress. The reason for this is that the thermal conduction of EMWM is mainly divided into heat conduction of the wire and heat conduction of the internal air, wherein the wire conducts heat much faster than the internal air. On the one hand, the higher the density of the EMWM, the more the internal wire helixes in a given volume. It indicates that the EMWM has smaller porosity and is easier to conduct heat. On the other hand, the EMWM was constrained in the molding direction, the greater the density of the specimens, more wire helixes were heated and thermal expansion would occur, which would lead to a decrease in the porosity of metal rubber.
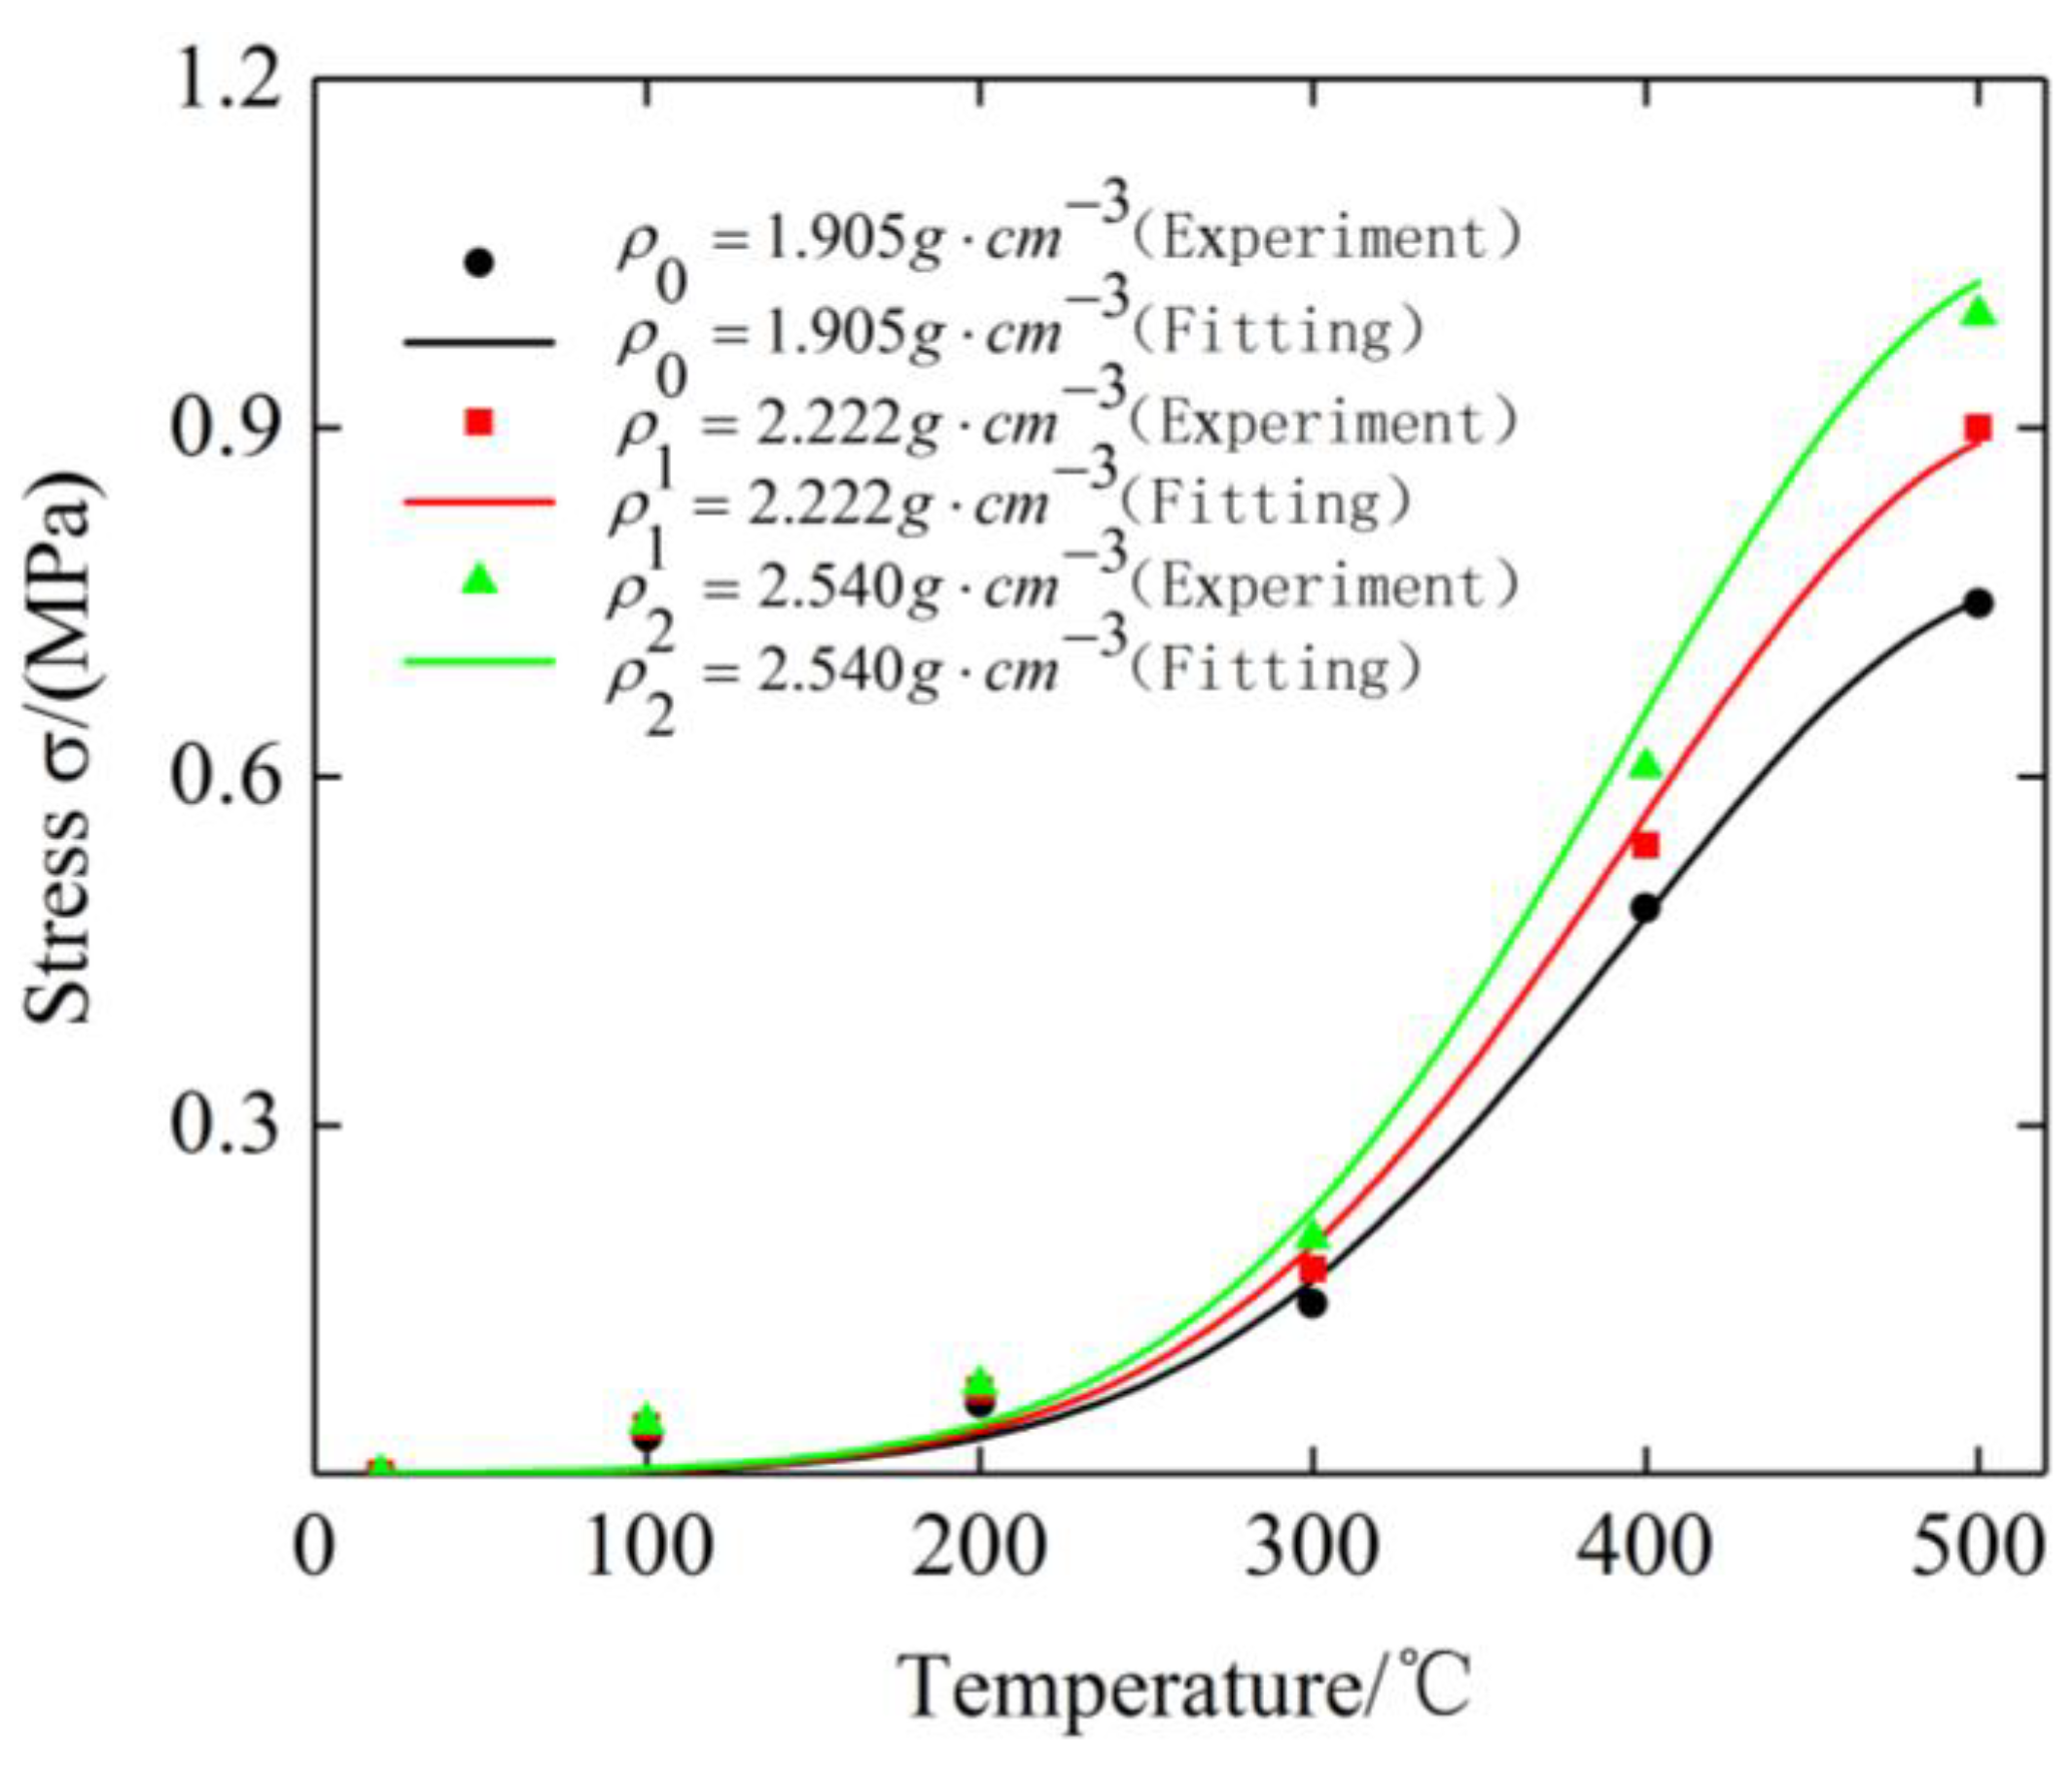
Under 500 °C, the maximum thermal stress accounts for 23.28% of the target stress, thus its impact cannot be ignored. Considering that the thermal stress is related to the ambient temperature and the density of the specimen, and its trend with temperature is close to the Gaussian fitting within 500 °C. Therefore, the density term is brought into the thermal stress calculation, assuming the coupling relationship of density and temperature is:
where γ, τ and ζ are the proportional coefficients of the thermal stress.
Figure 16 shows the fitting curves of three specimens under different ambient temperatures. The values of γ, τ and ζ obtained by fitting are 0.763, 523.3, and 180.9, respectively.
The total stress should be expressed as:
Bring the thermal stress data before being zeroed into the calculation.
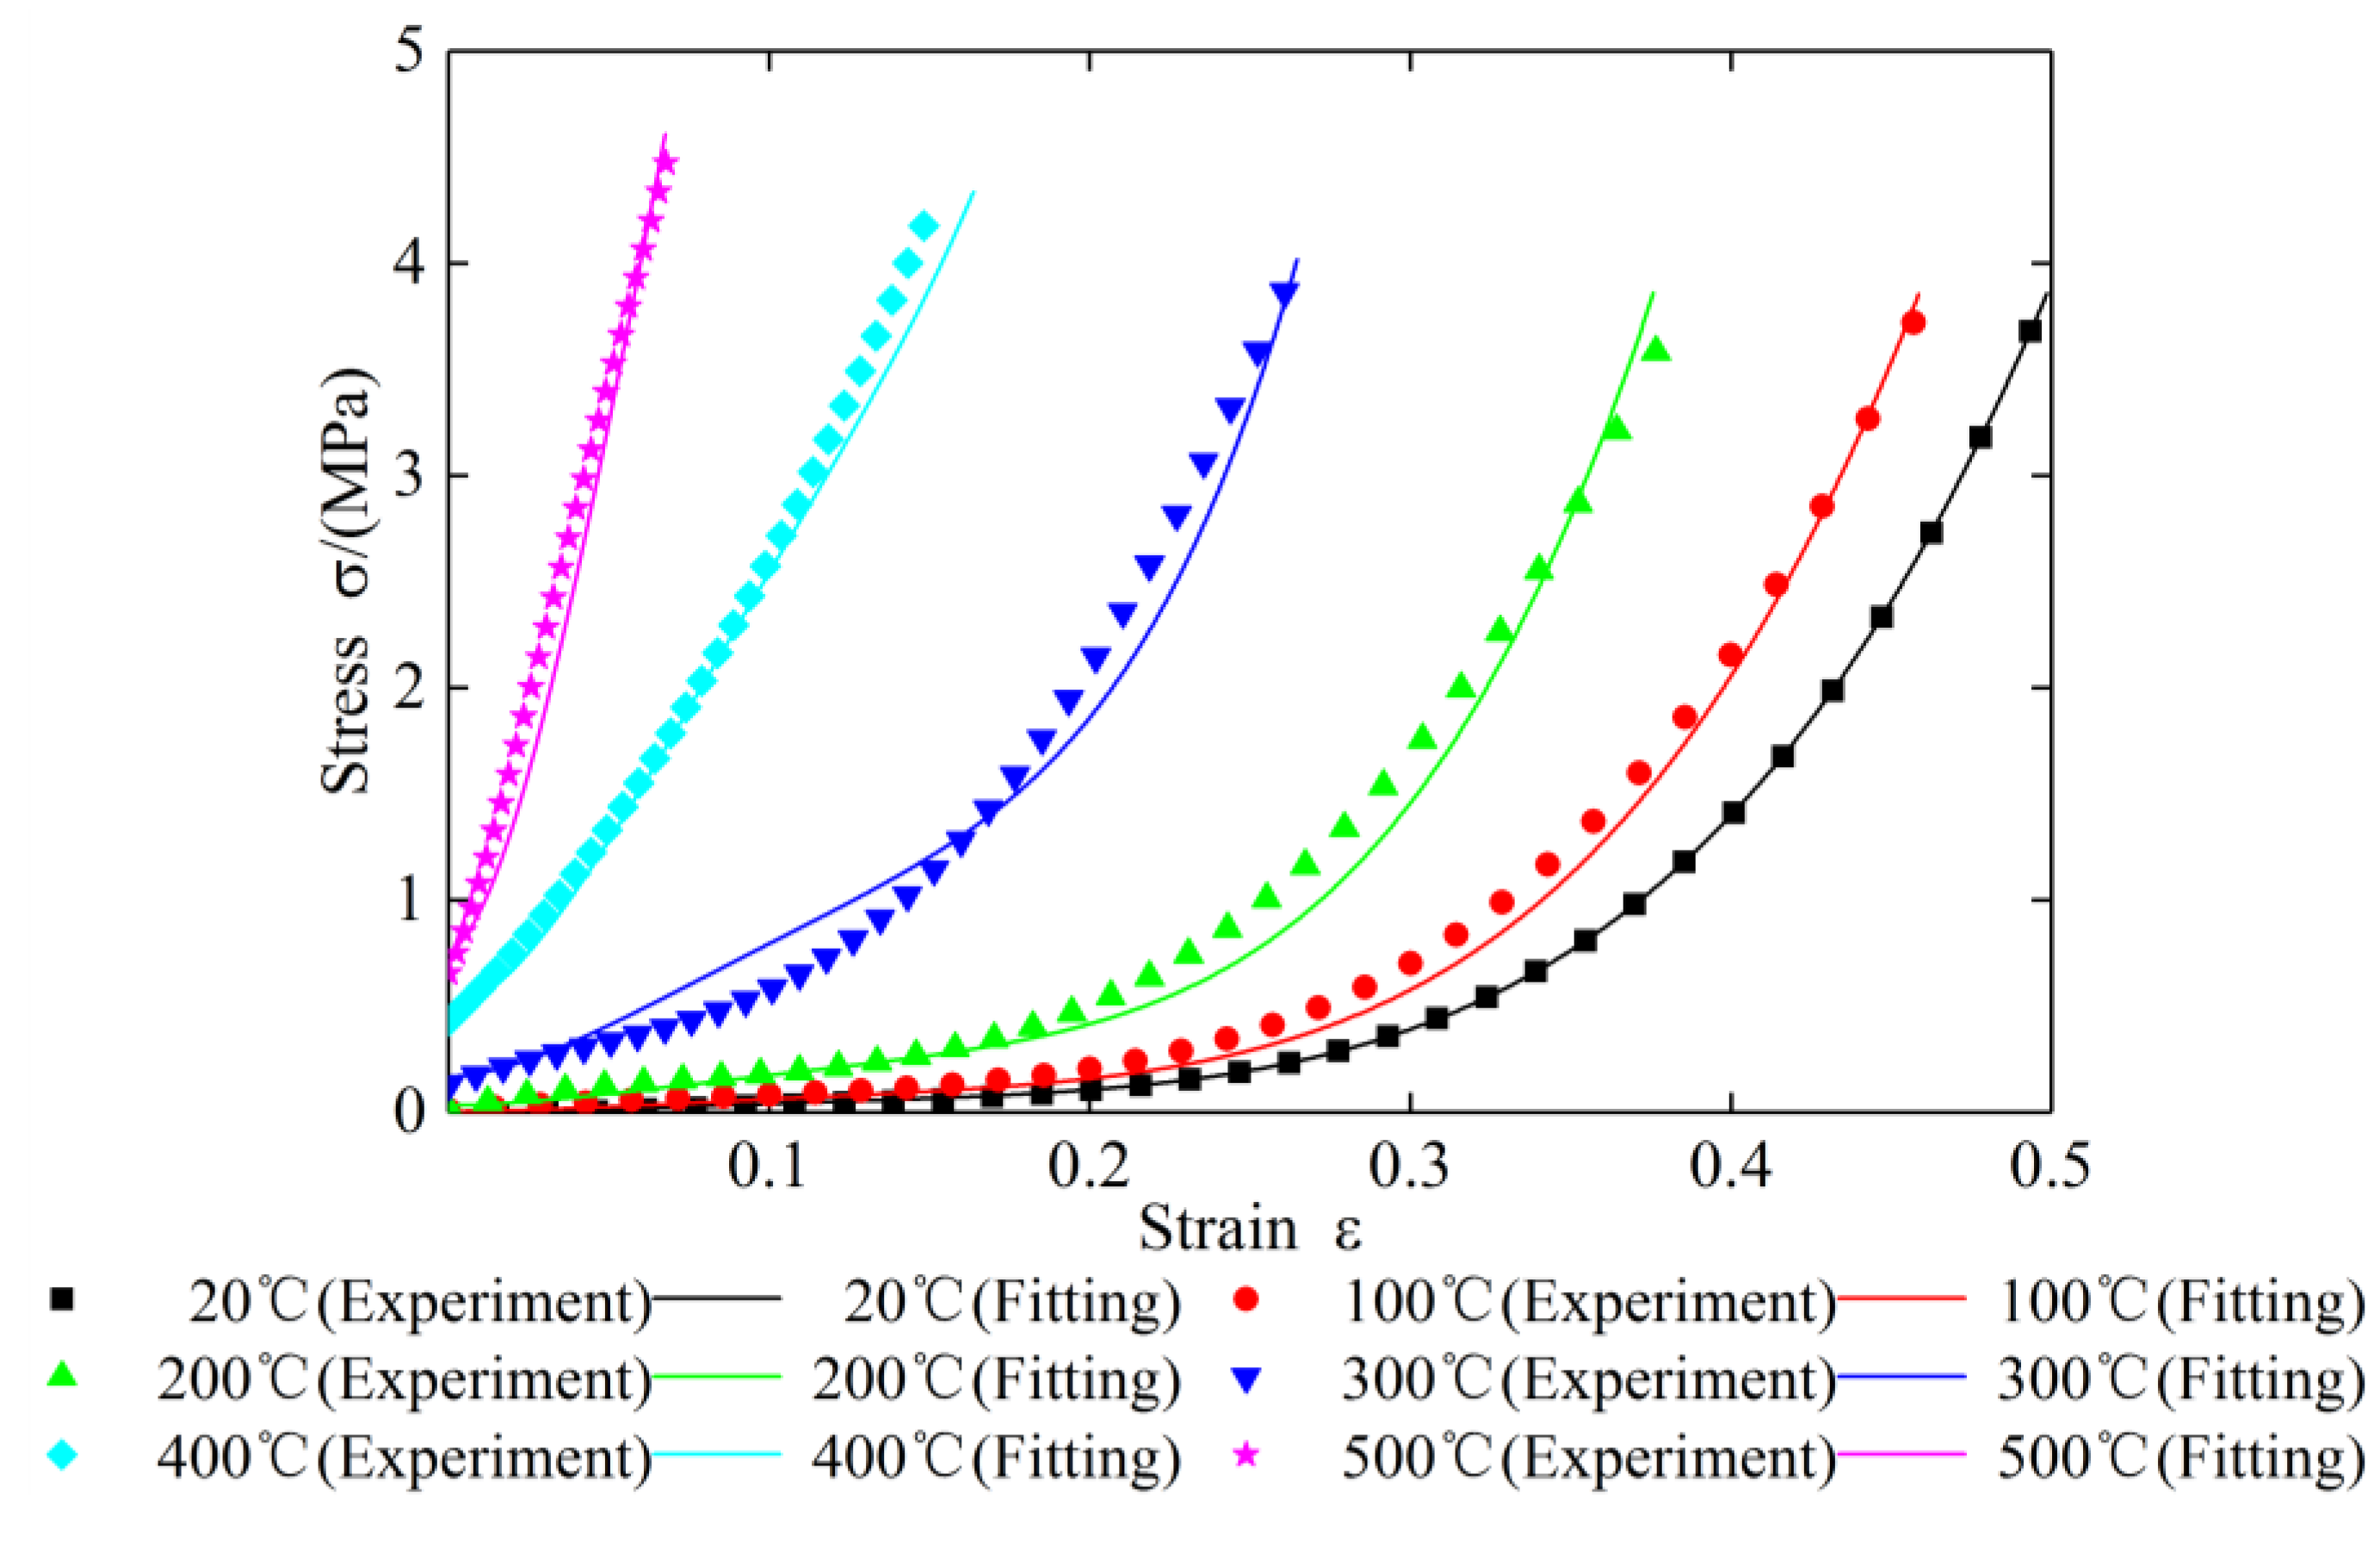
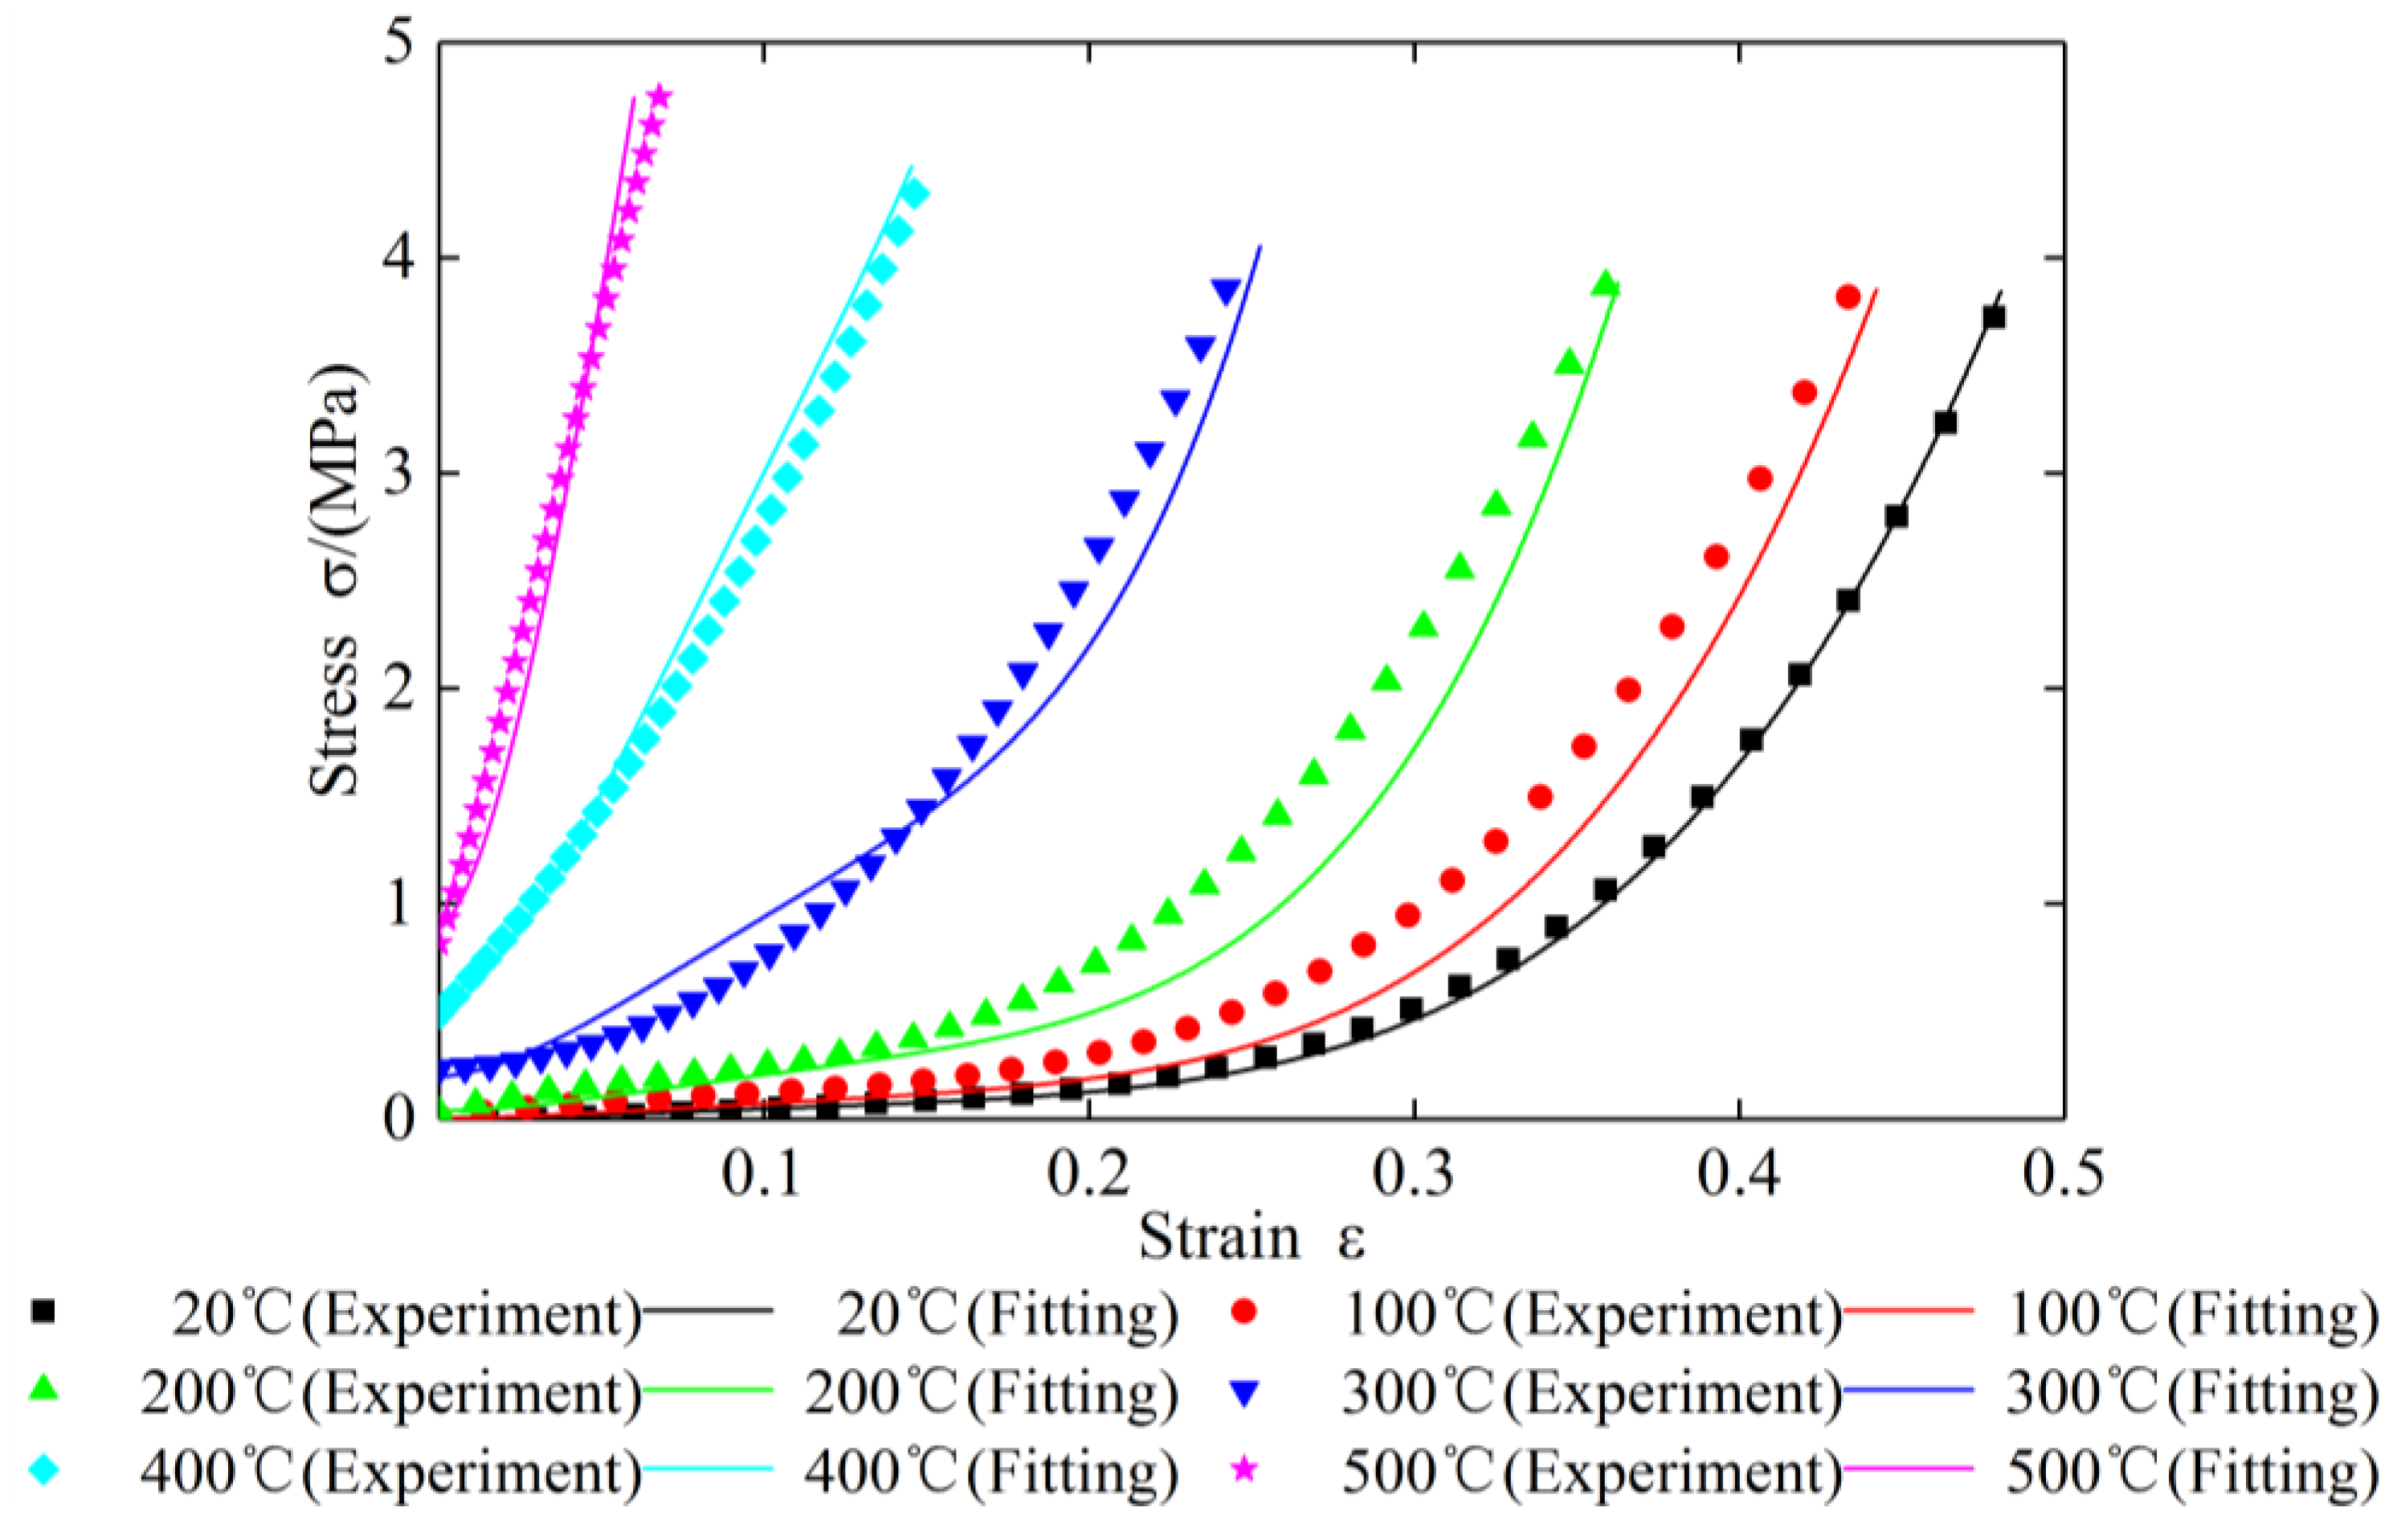
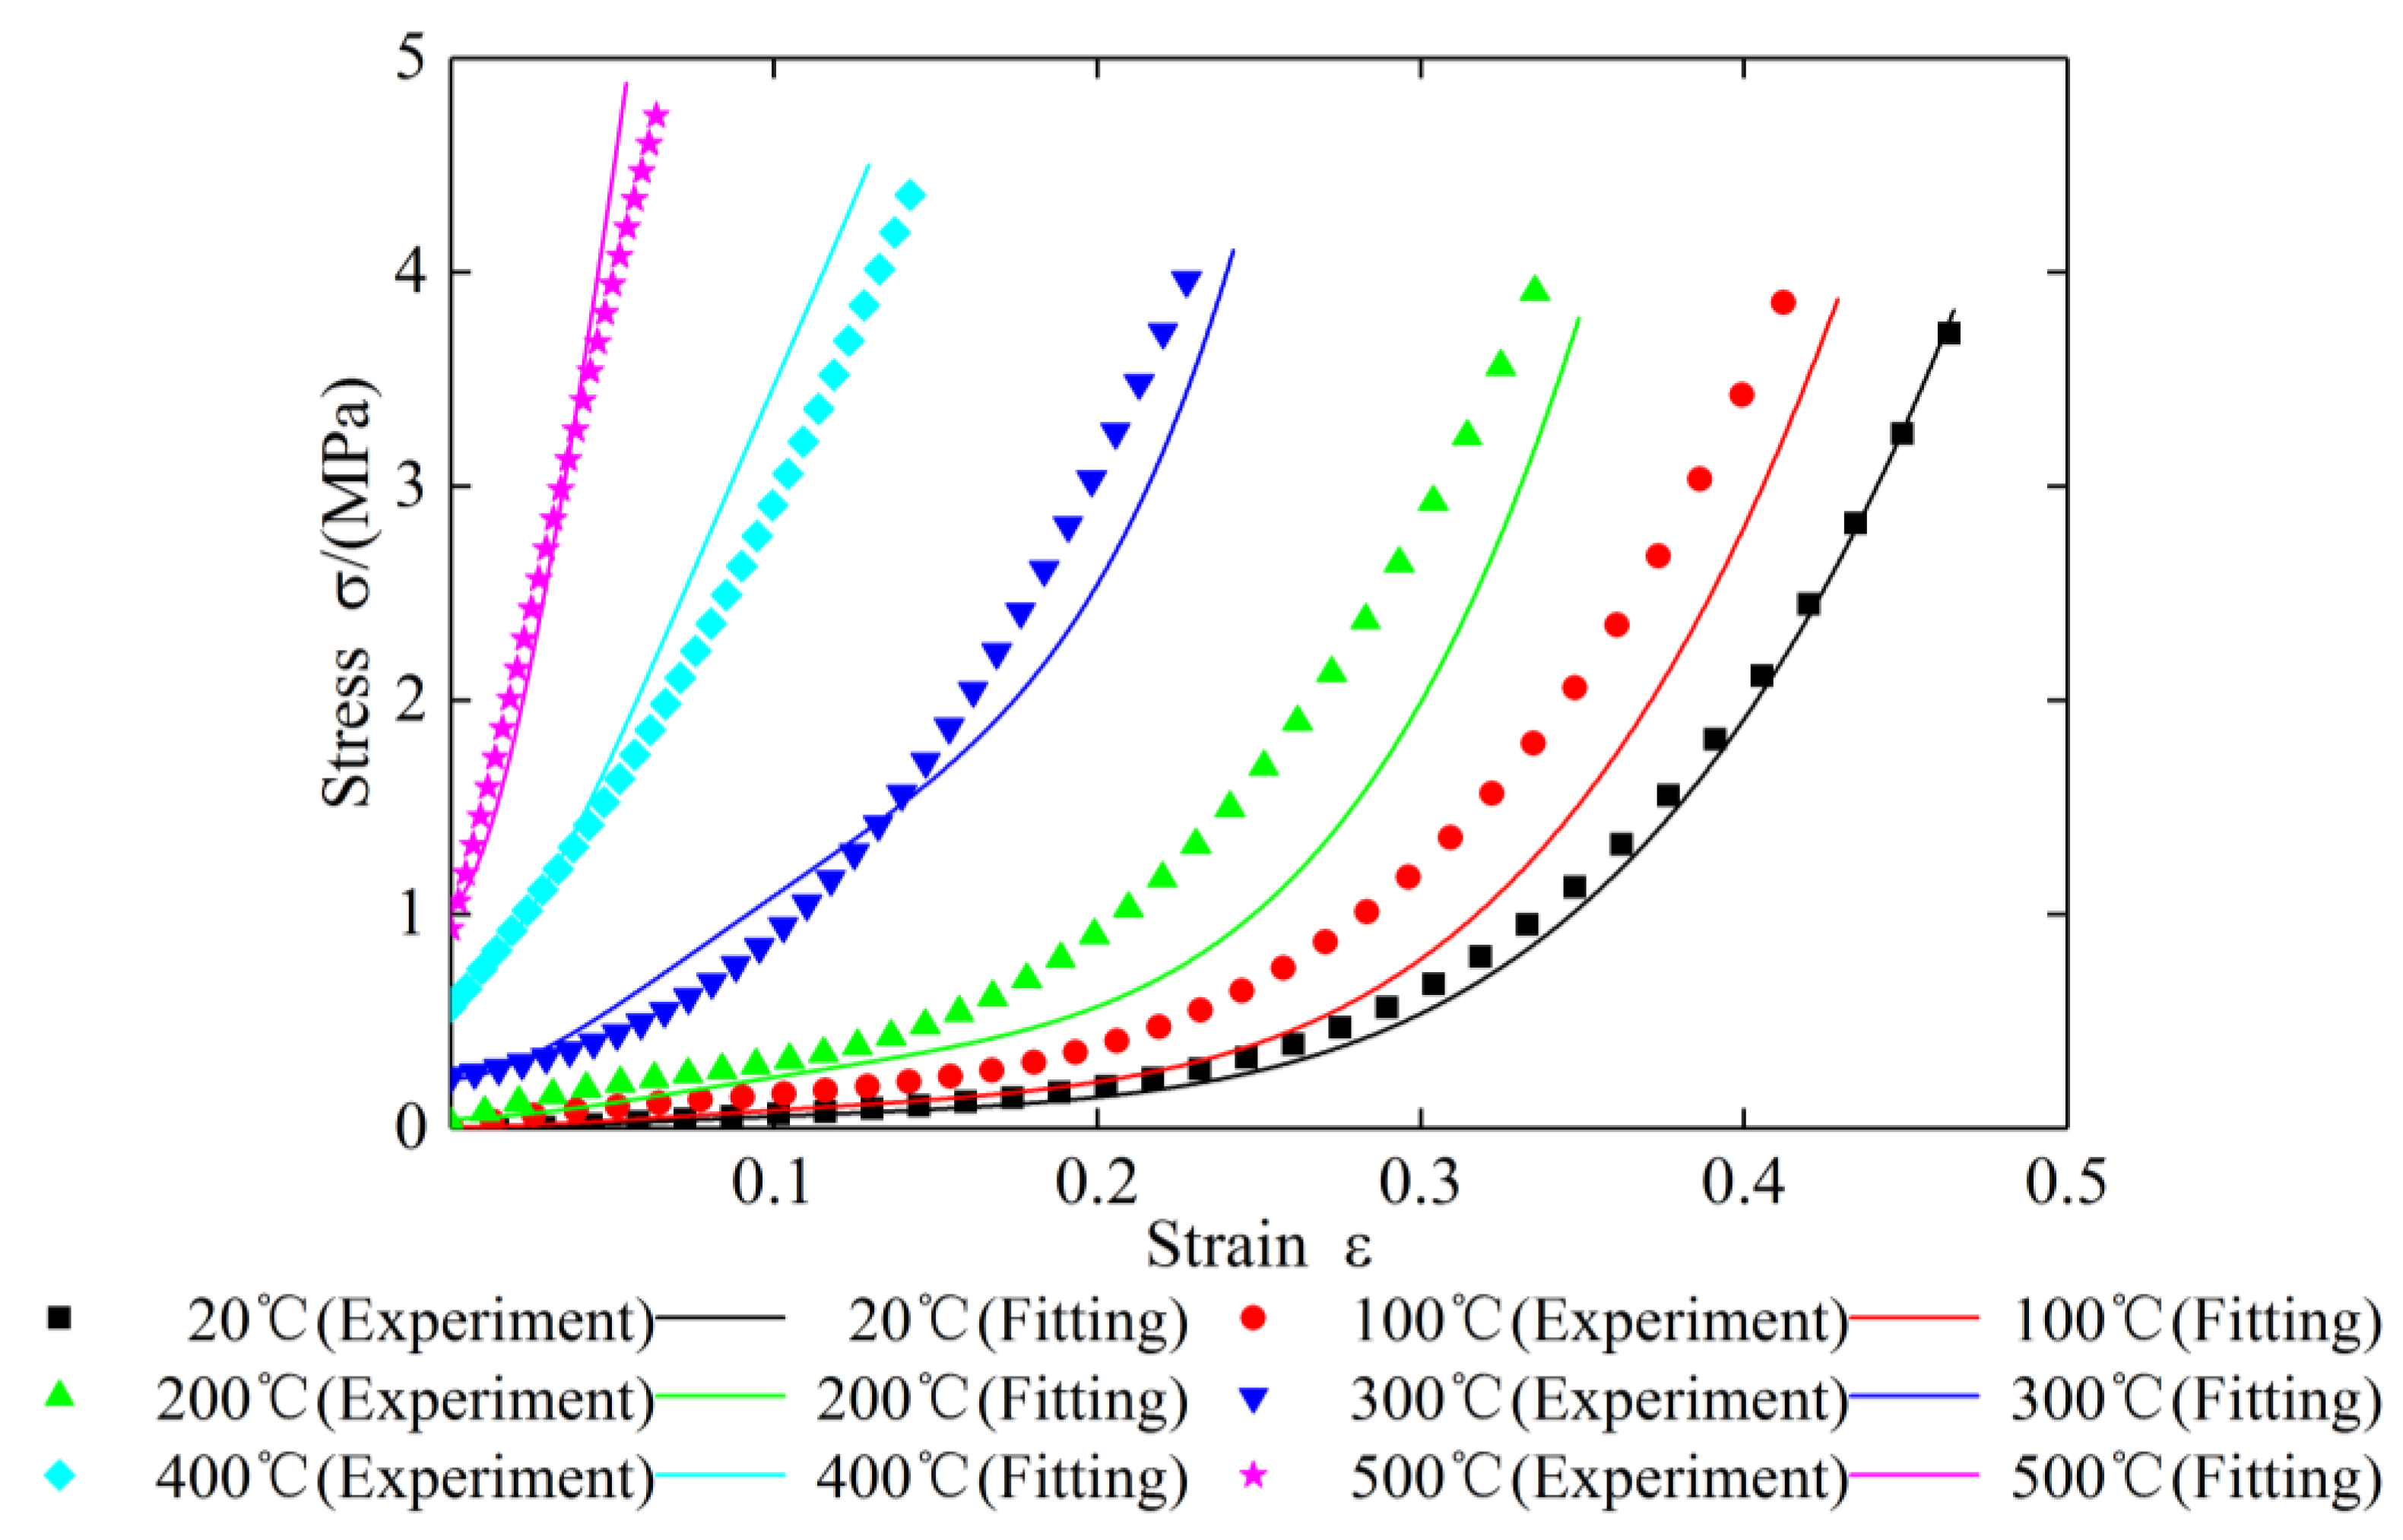
Figure 17 shows the fitting curves of specimen 1 (
) under different ambient temperatures. The values of C,
z and
p obtained by fitting are 0.1426, −0.8743, and 0.711161, respectively. A strain value was taken for every 100 test points of each curve, and the error between the test data and the fitted value is calculated. The fitting errors are shown in
Table 4,
Table 5,
Table 6,
Table 7 and
Table 8.
It can be seen from
Table 4,
Table 5,
Table 6,
Table 7 and
Table 8 that the error between the test value and the fitted value of the specimen 1 is less than 30% at 100 °C, the error between the test value and the fitted value of the specimen 1 is less than 20% at different temperatures except for 100 °C, indicating that the constitutive equation has relatively high reliability.


