A Study on Exfoliation of Expanded Graphite Stacks in Candelilla Wax

 ,
, 
 , ,
, , 
Abstract
1. Introduction
2. Materials and Methods
2.1. Materials
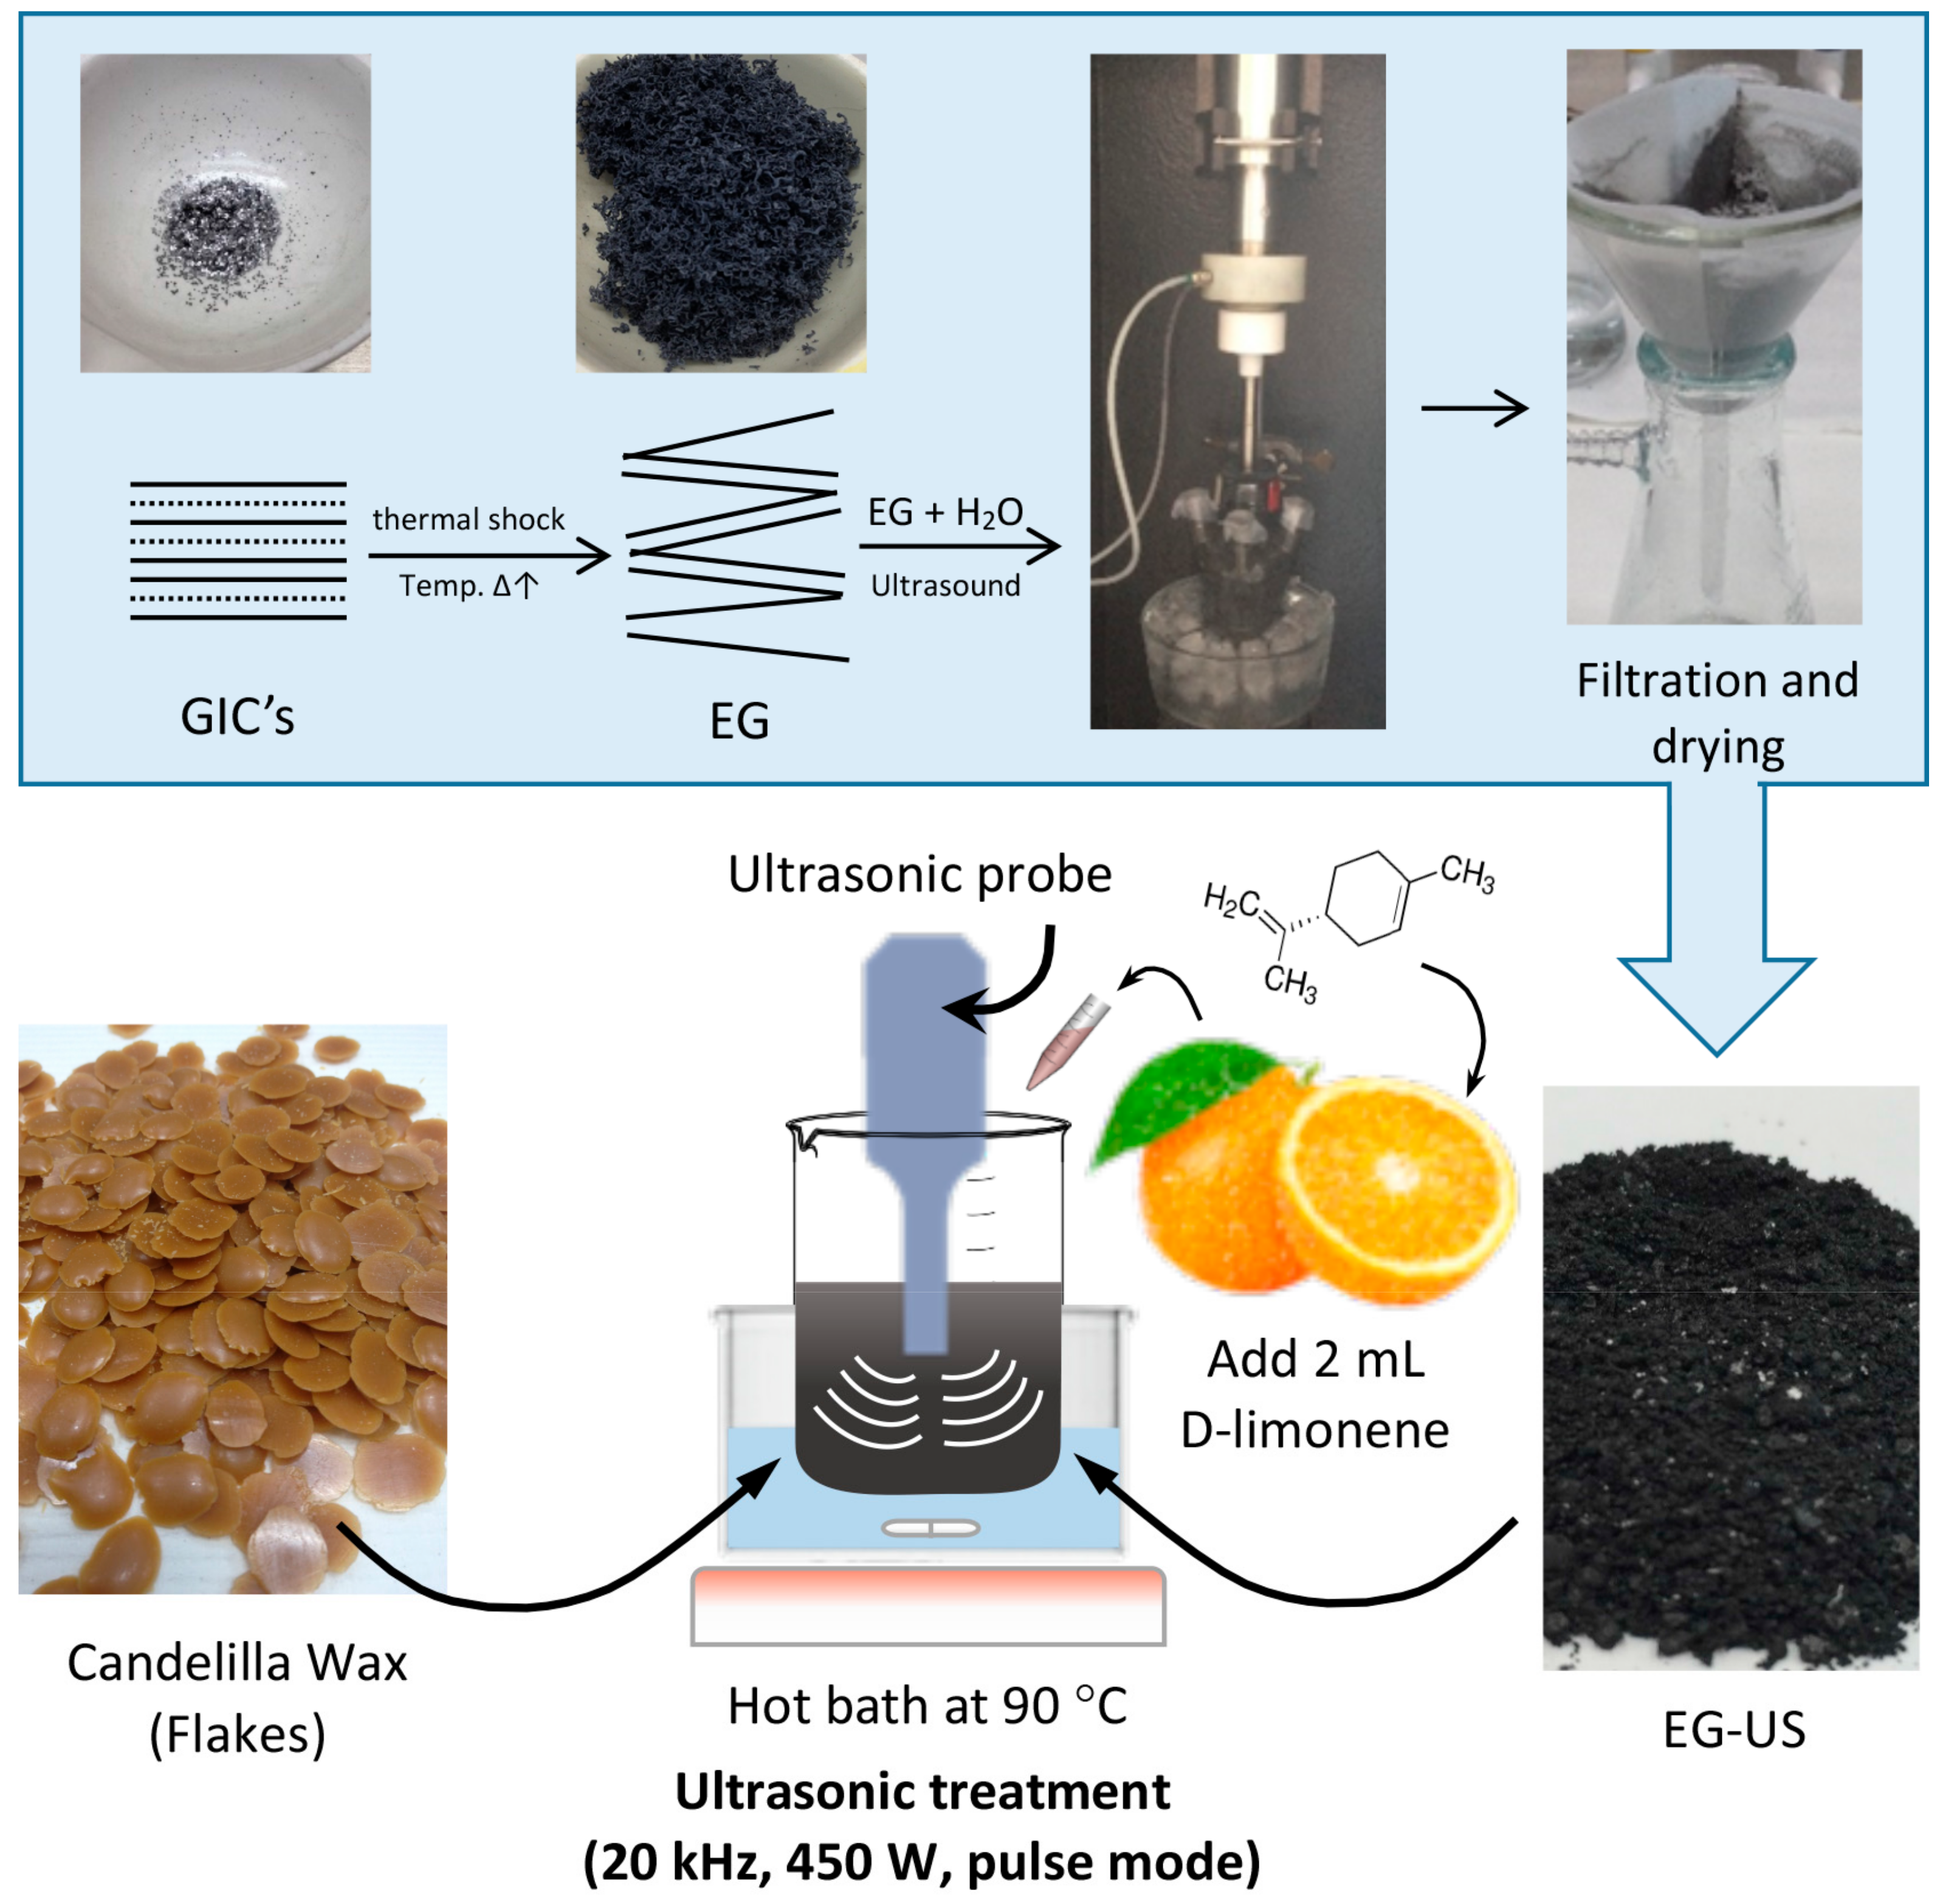
2.2. Preparation of Wax–Expanded Graphite (EG) Composites
2.3. Characterization Methods
3. Results
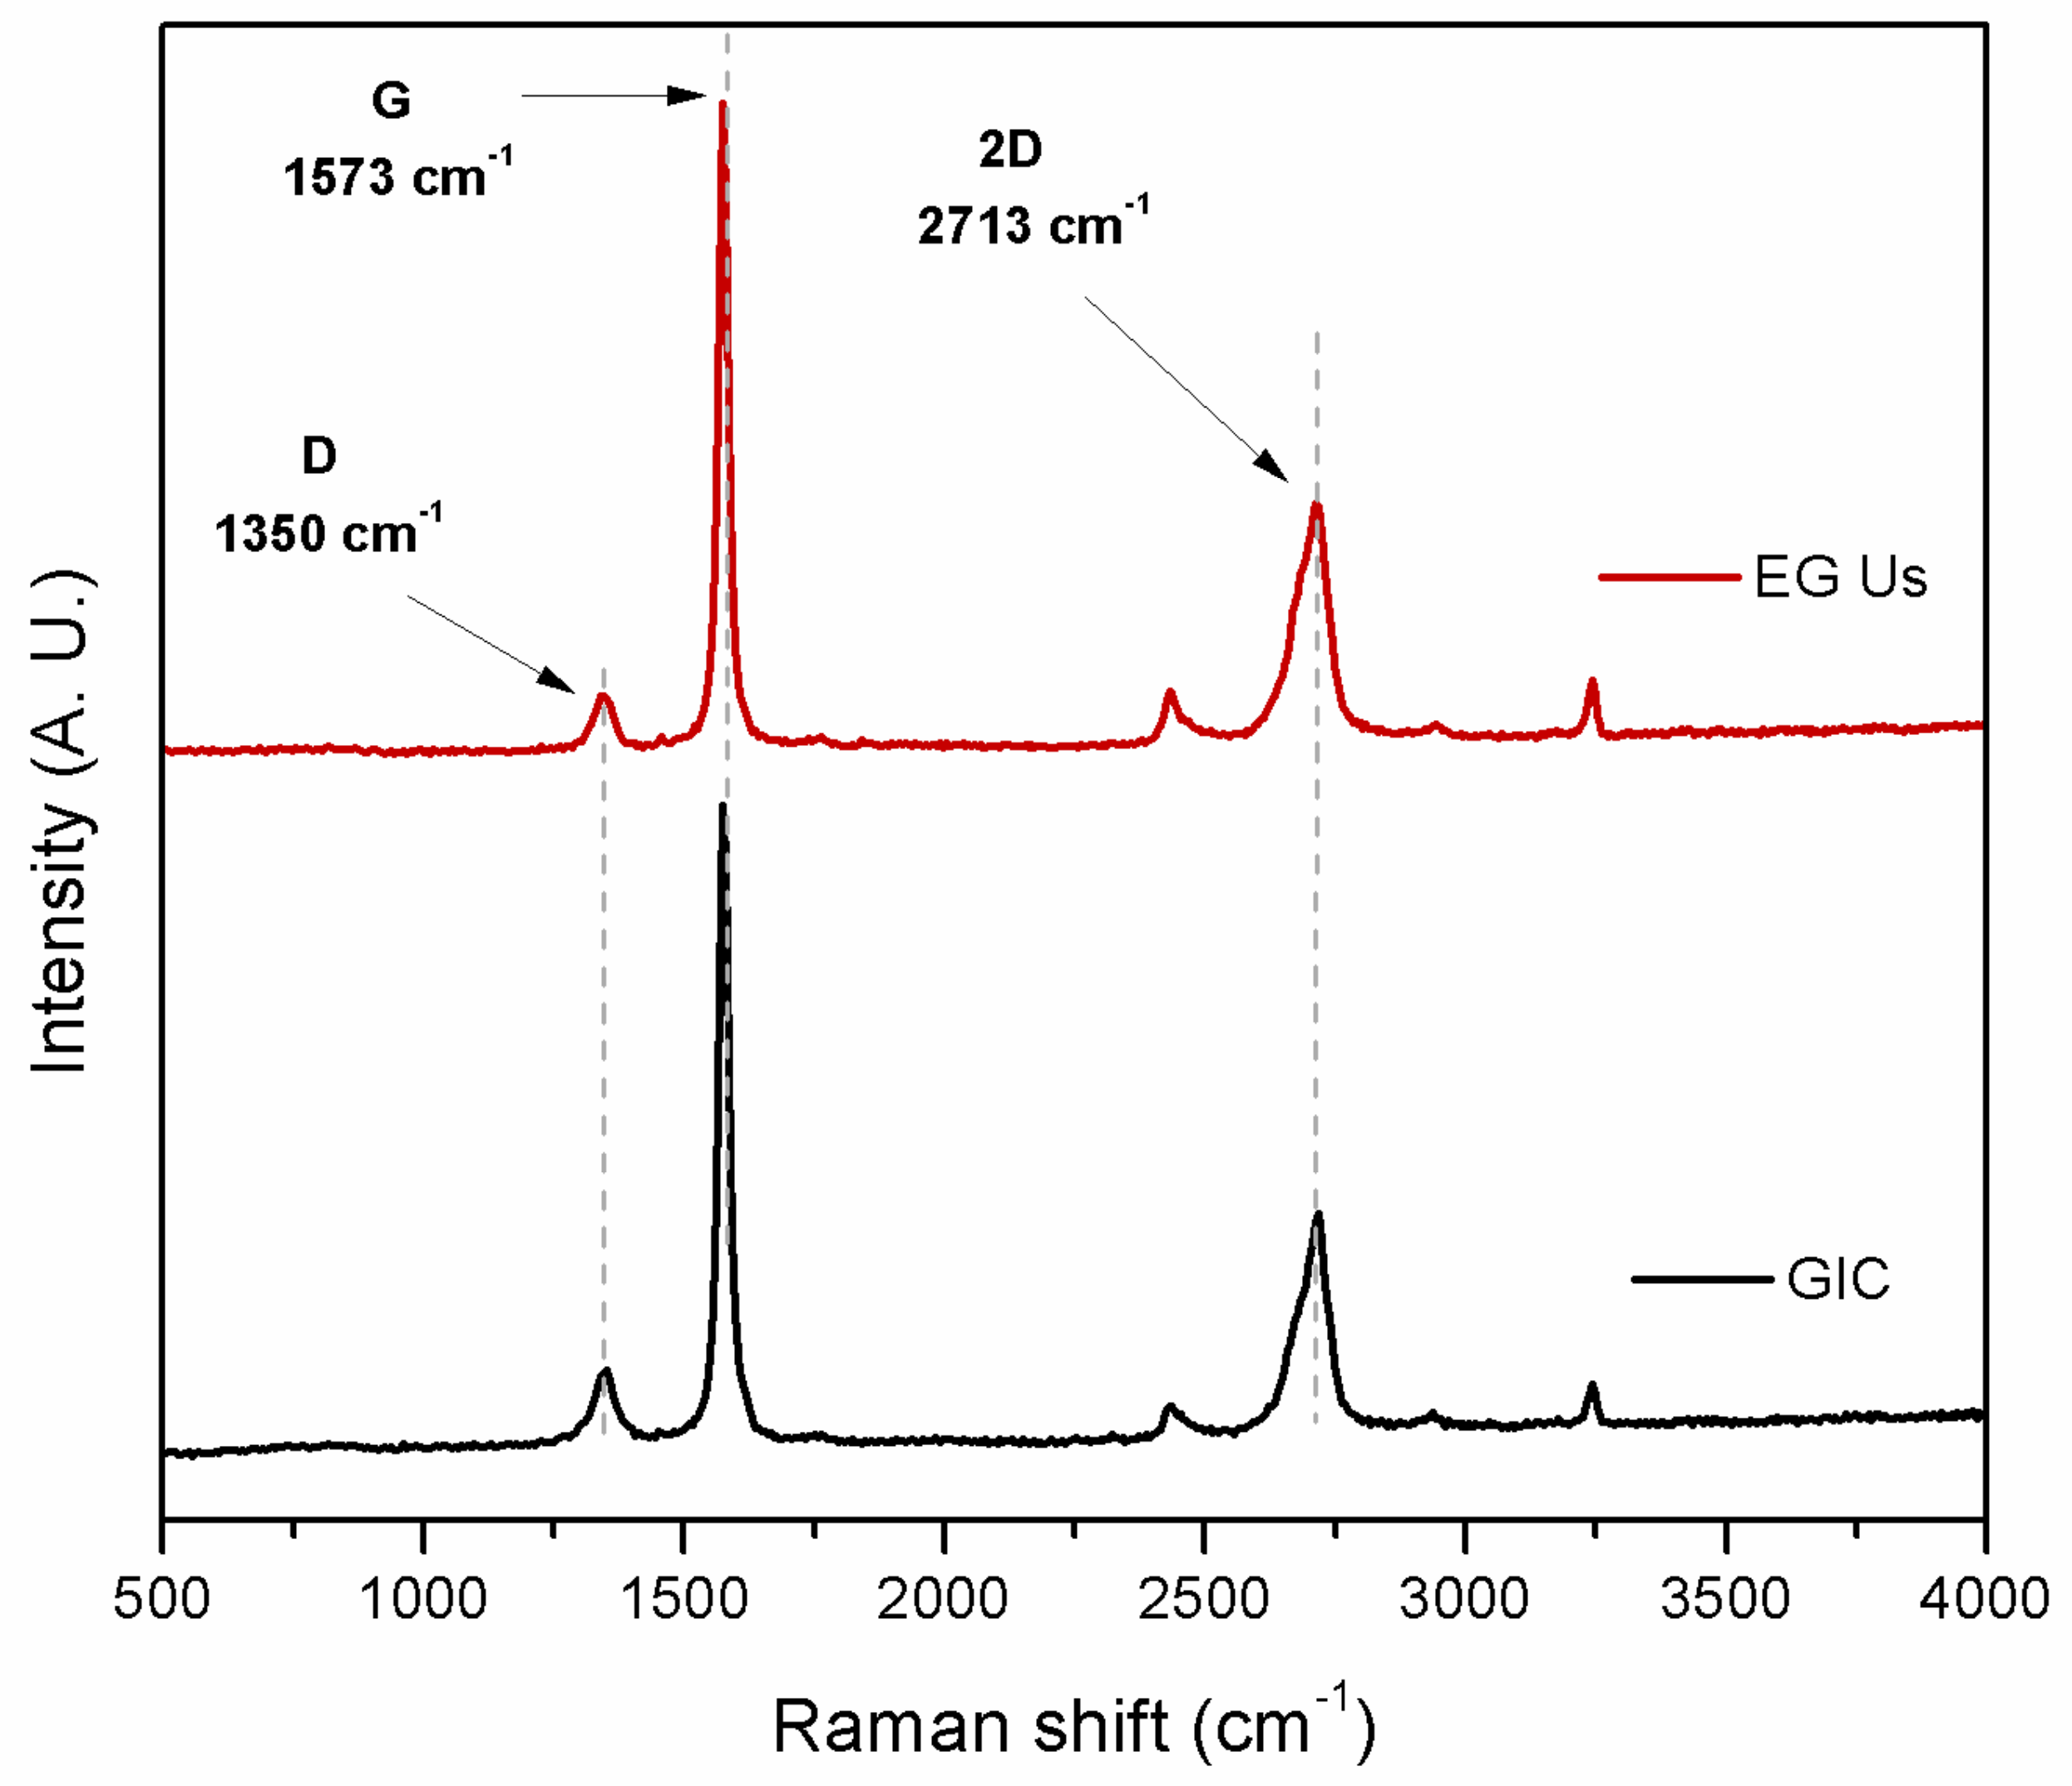
3.1. RamanSpectroscopy for EG
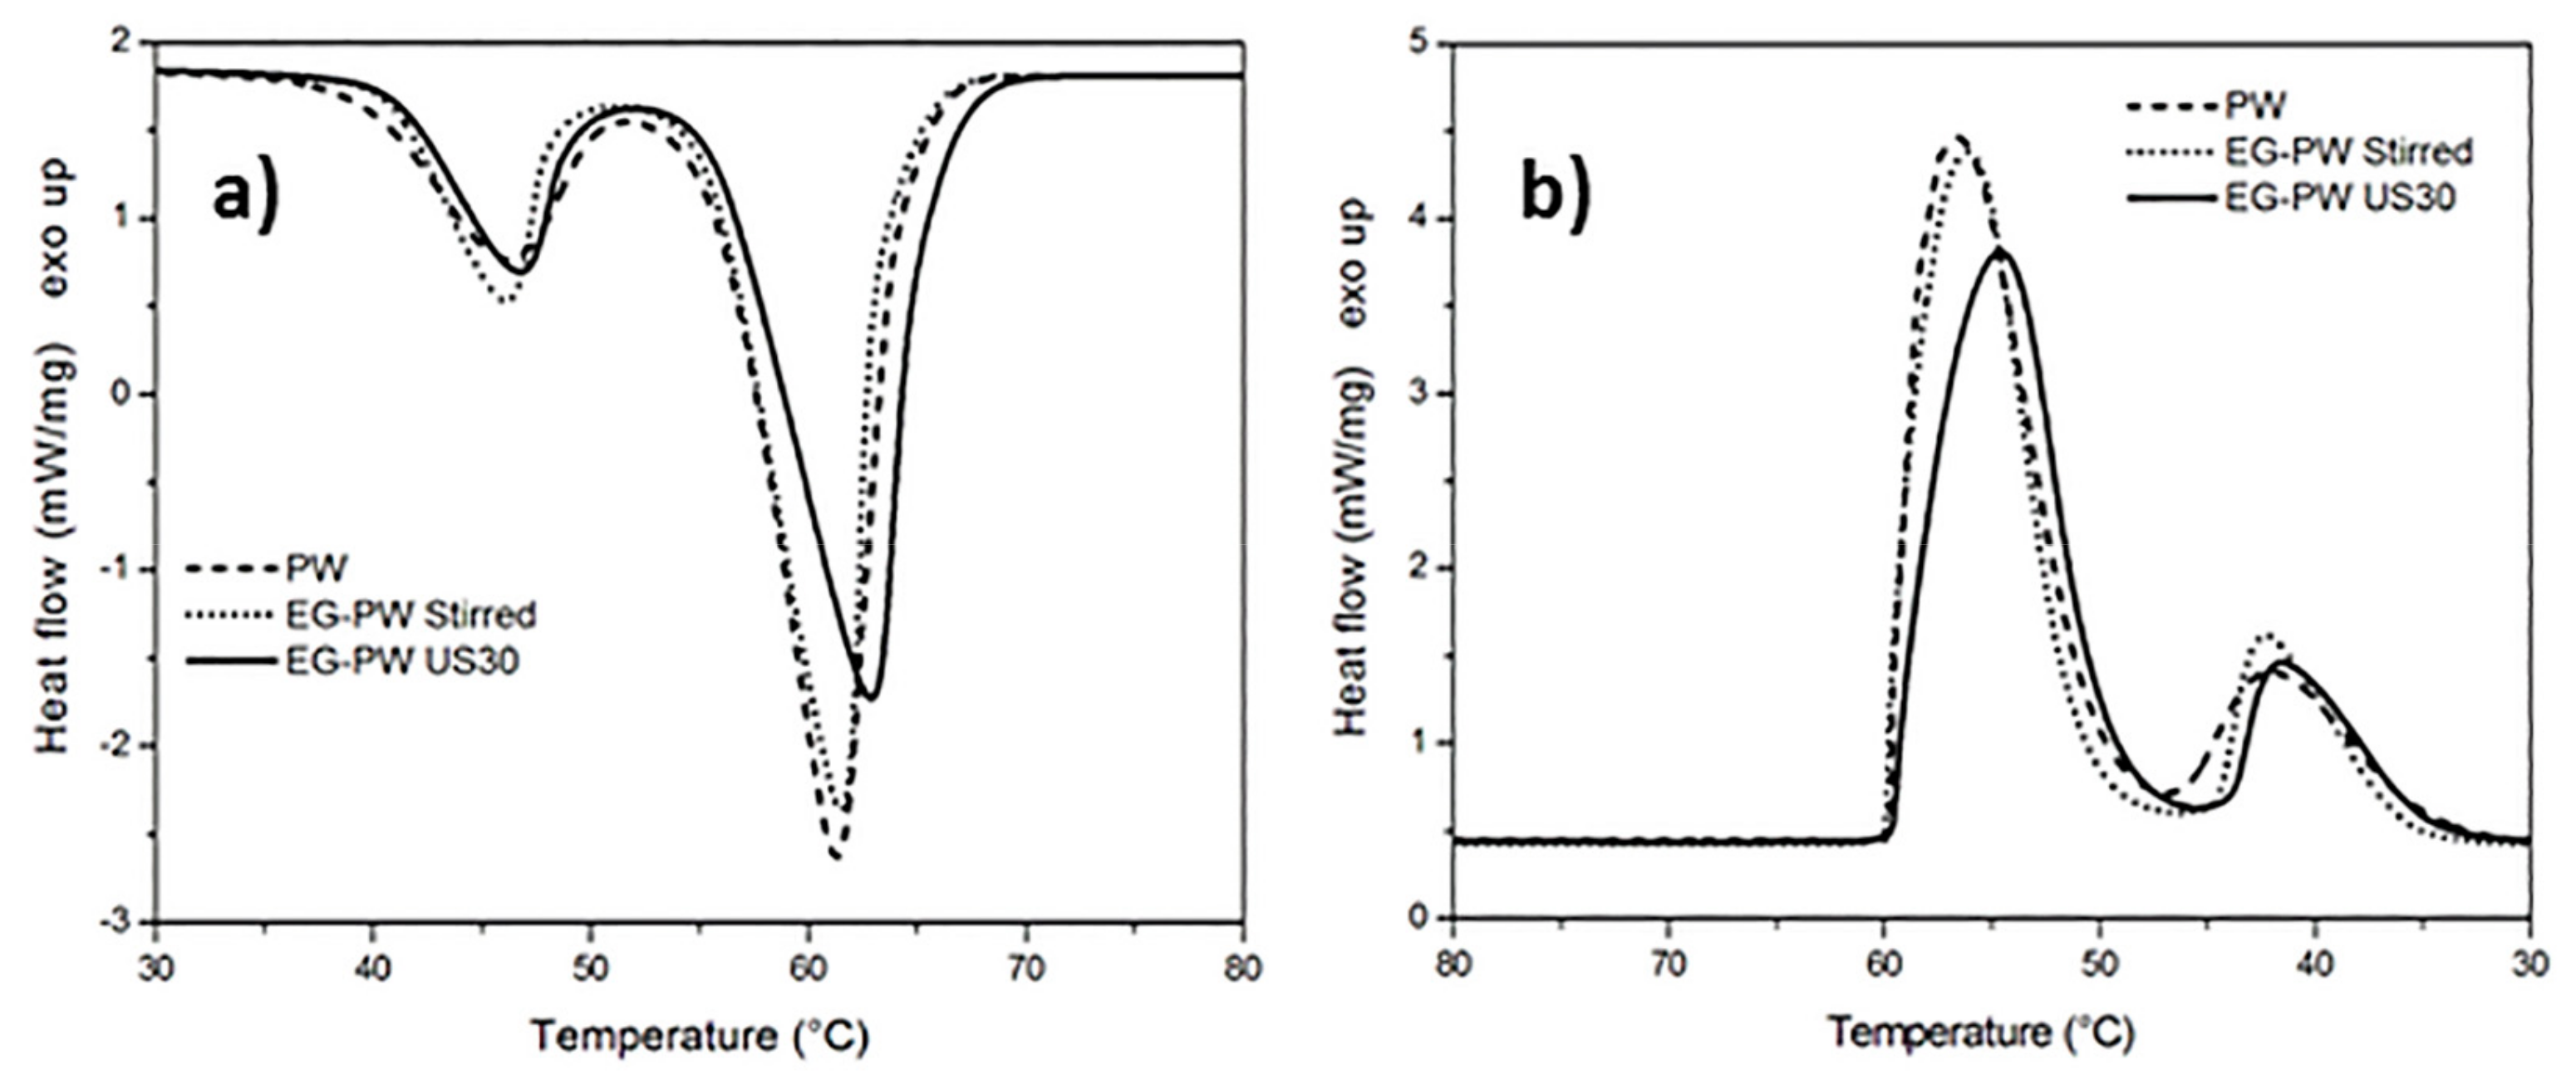
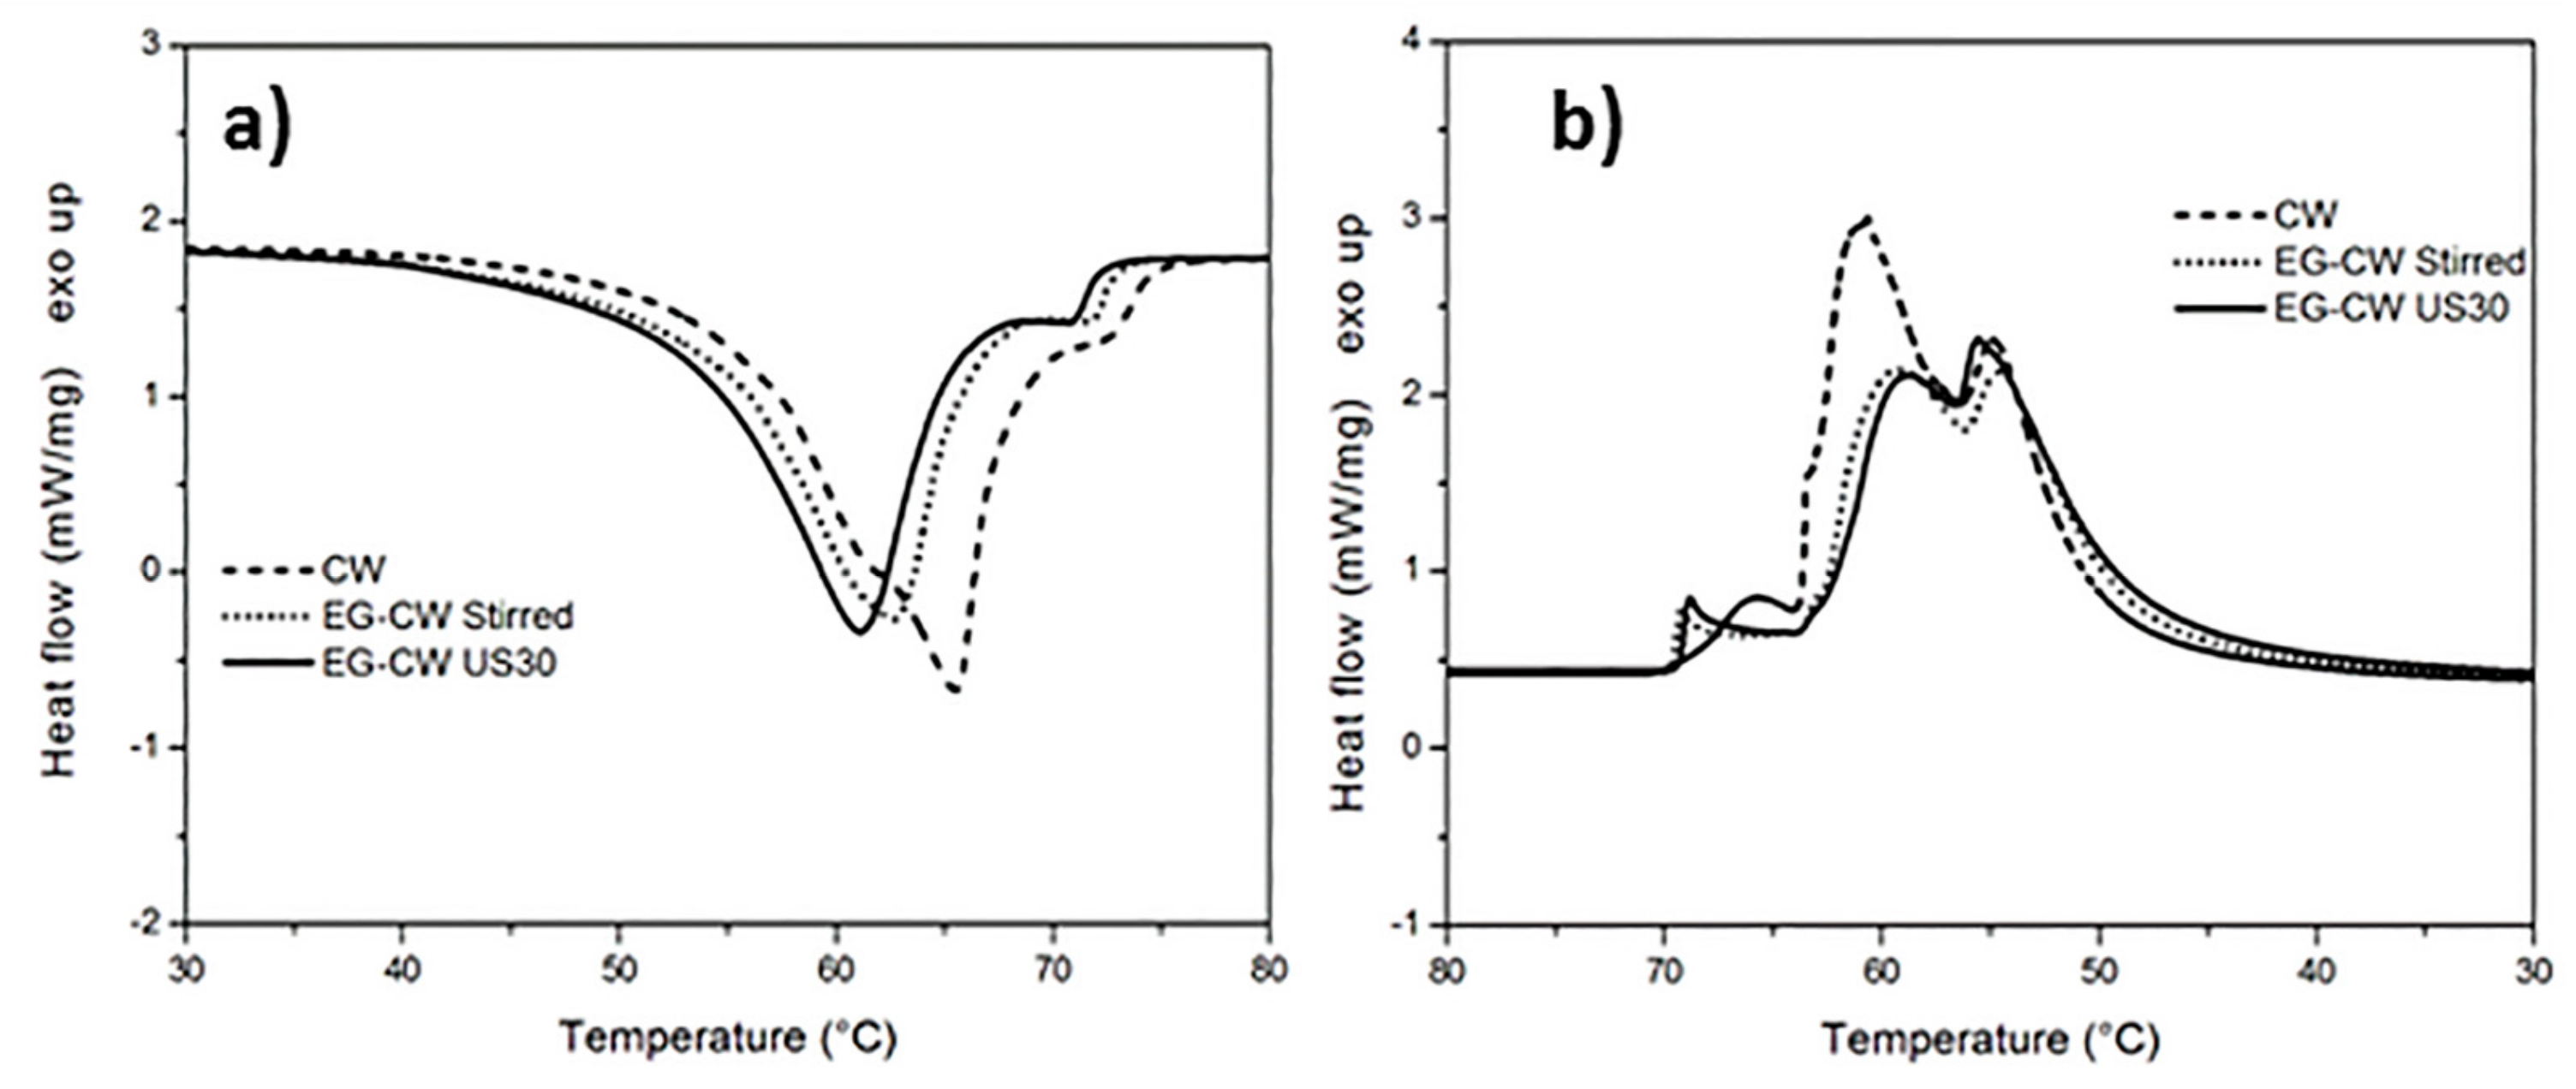
3.2. Differential Scanning Calorimetry (DSC) Results
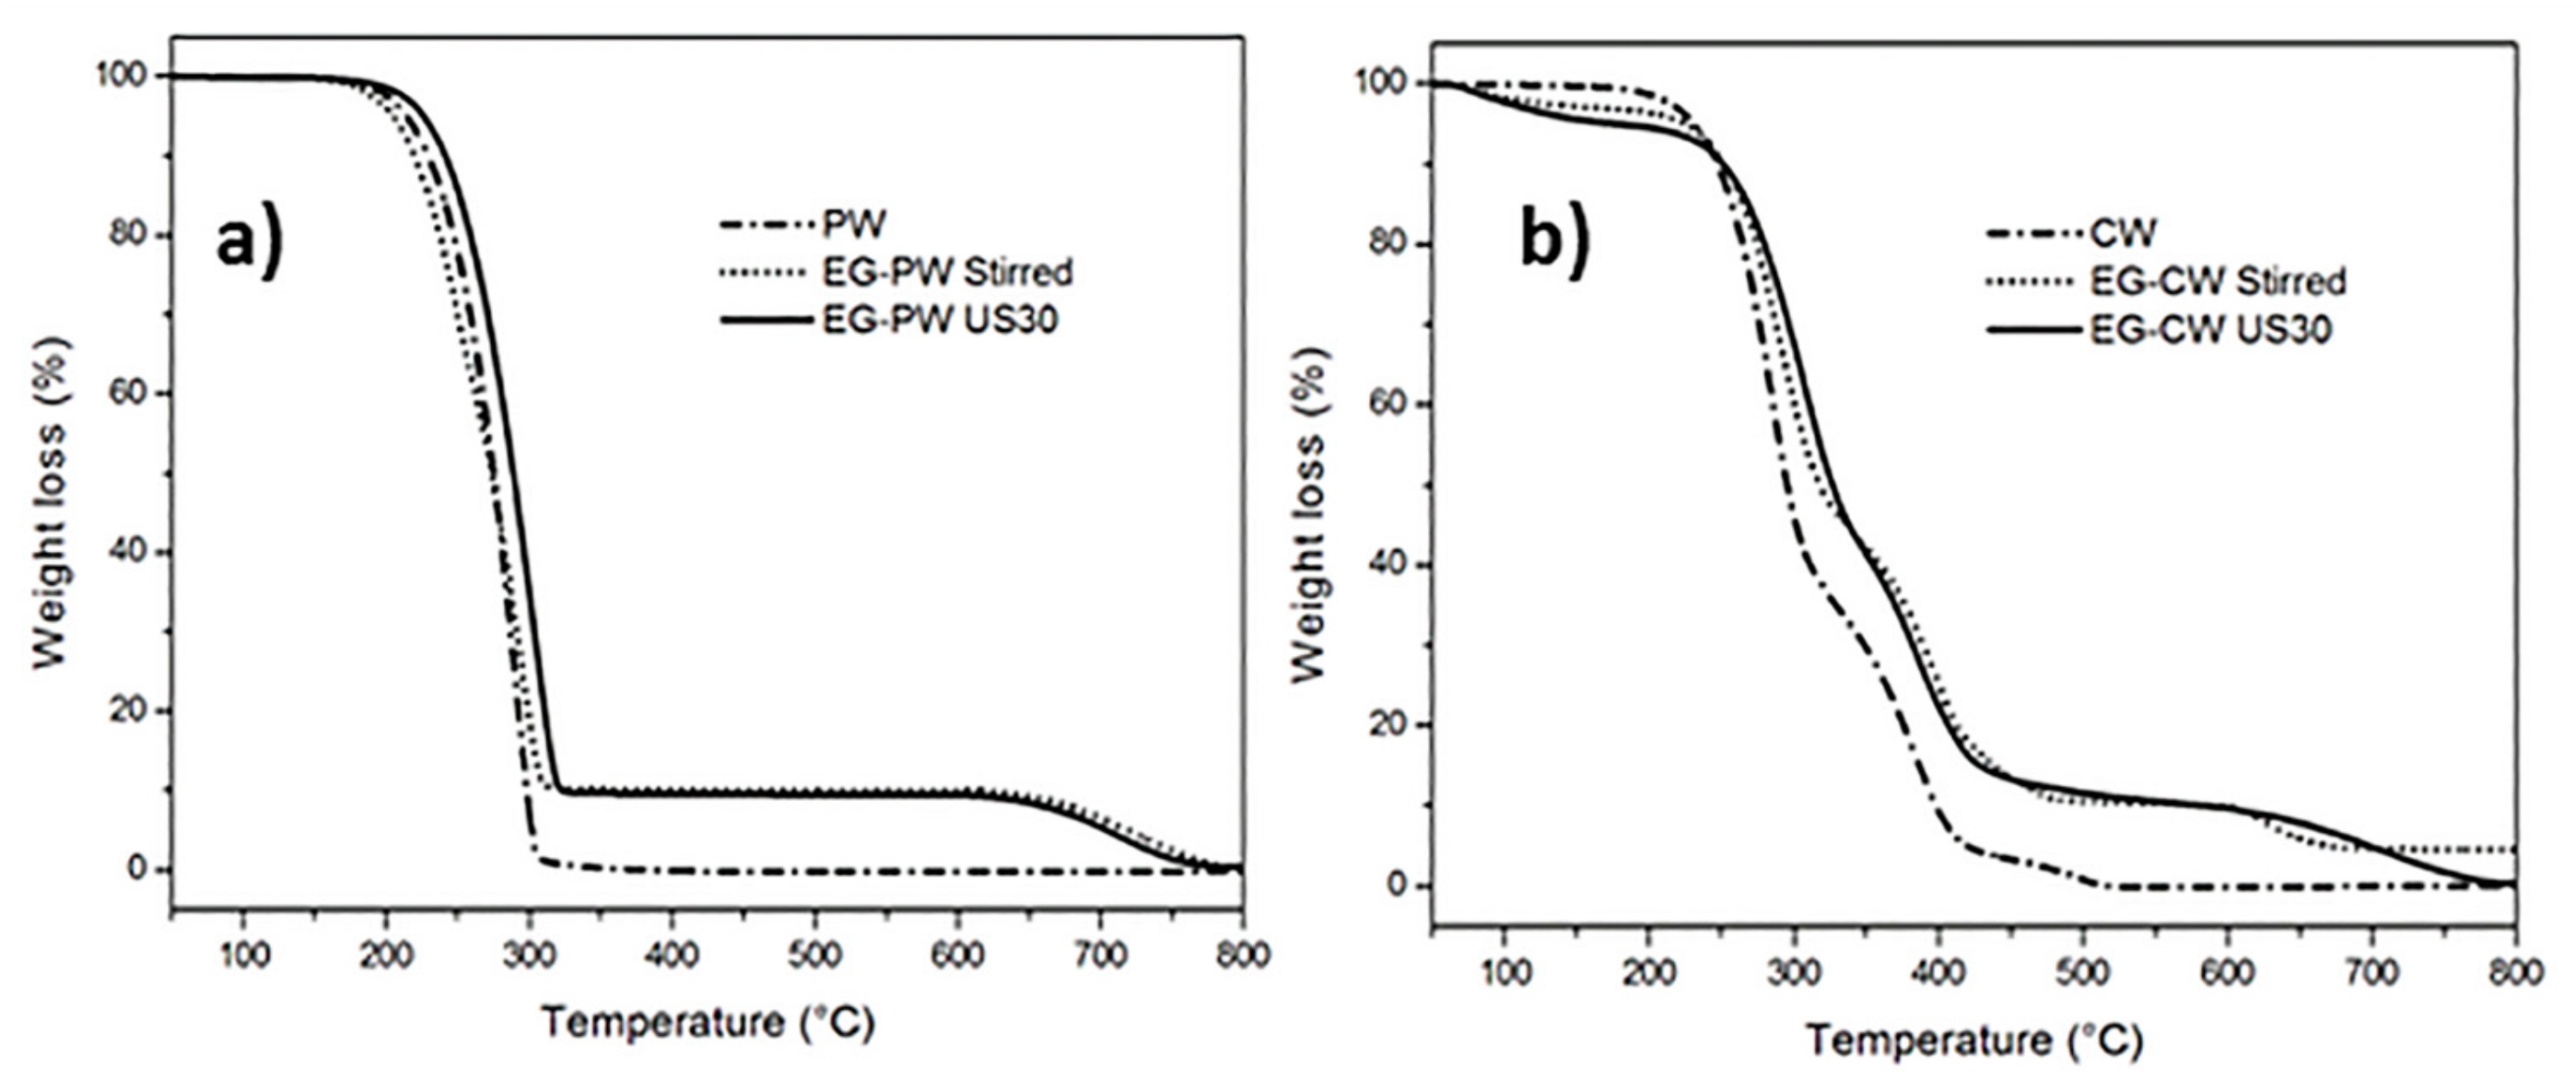
3.3. Thermogravimetric Analysis (TGA) Results
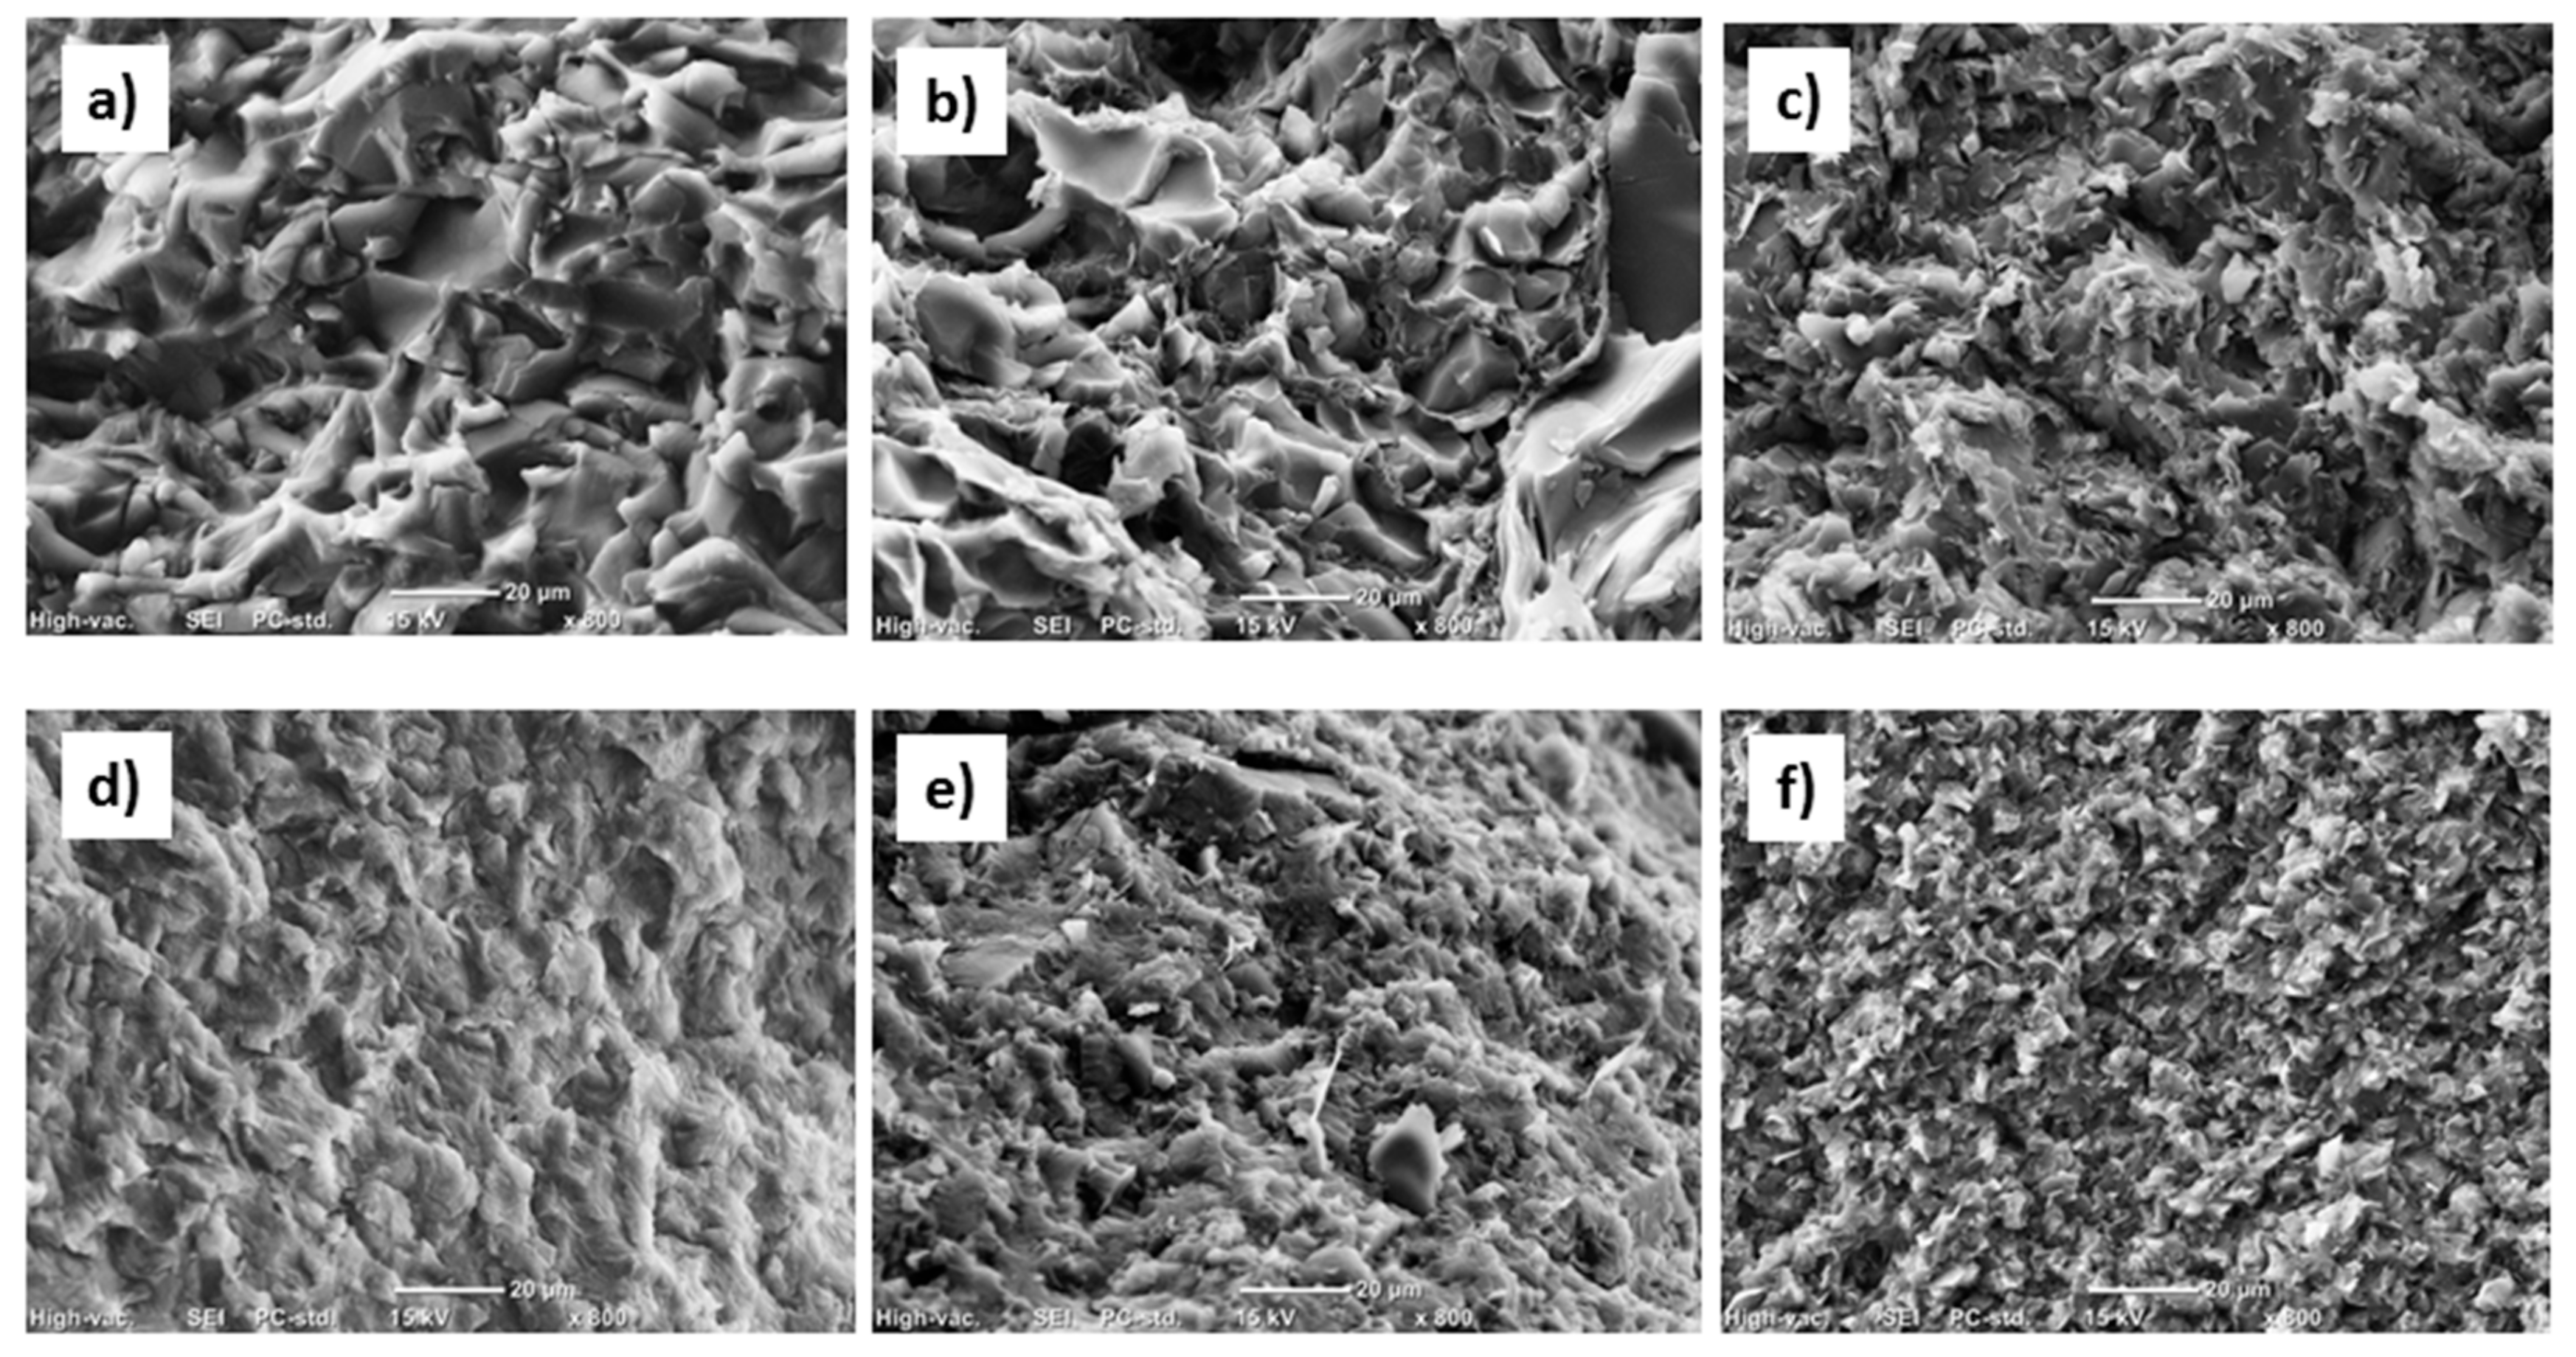
3.4. Scanning Electron Microscopy (SEM) Results
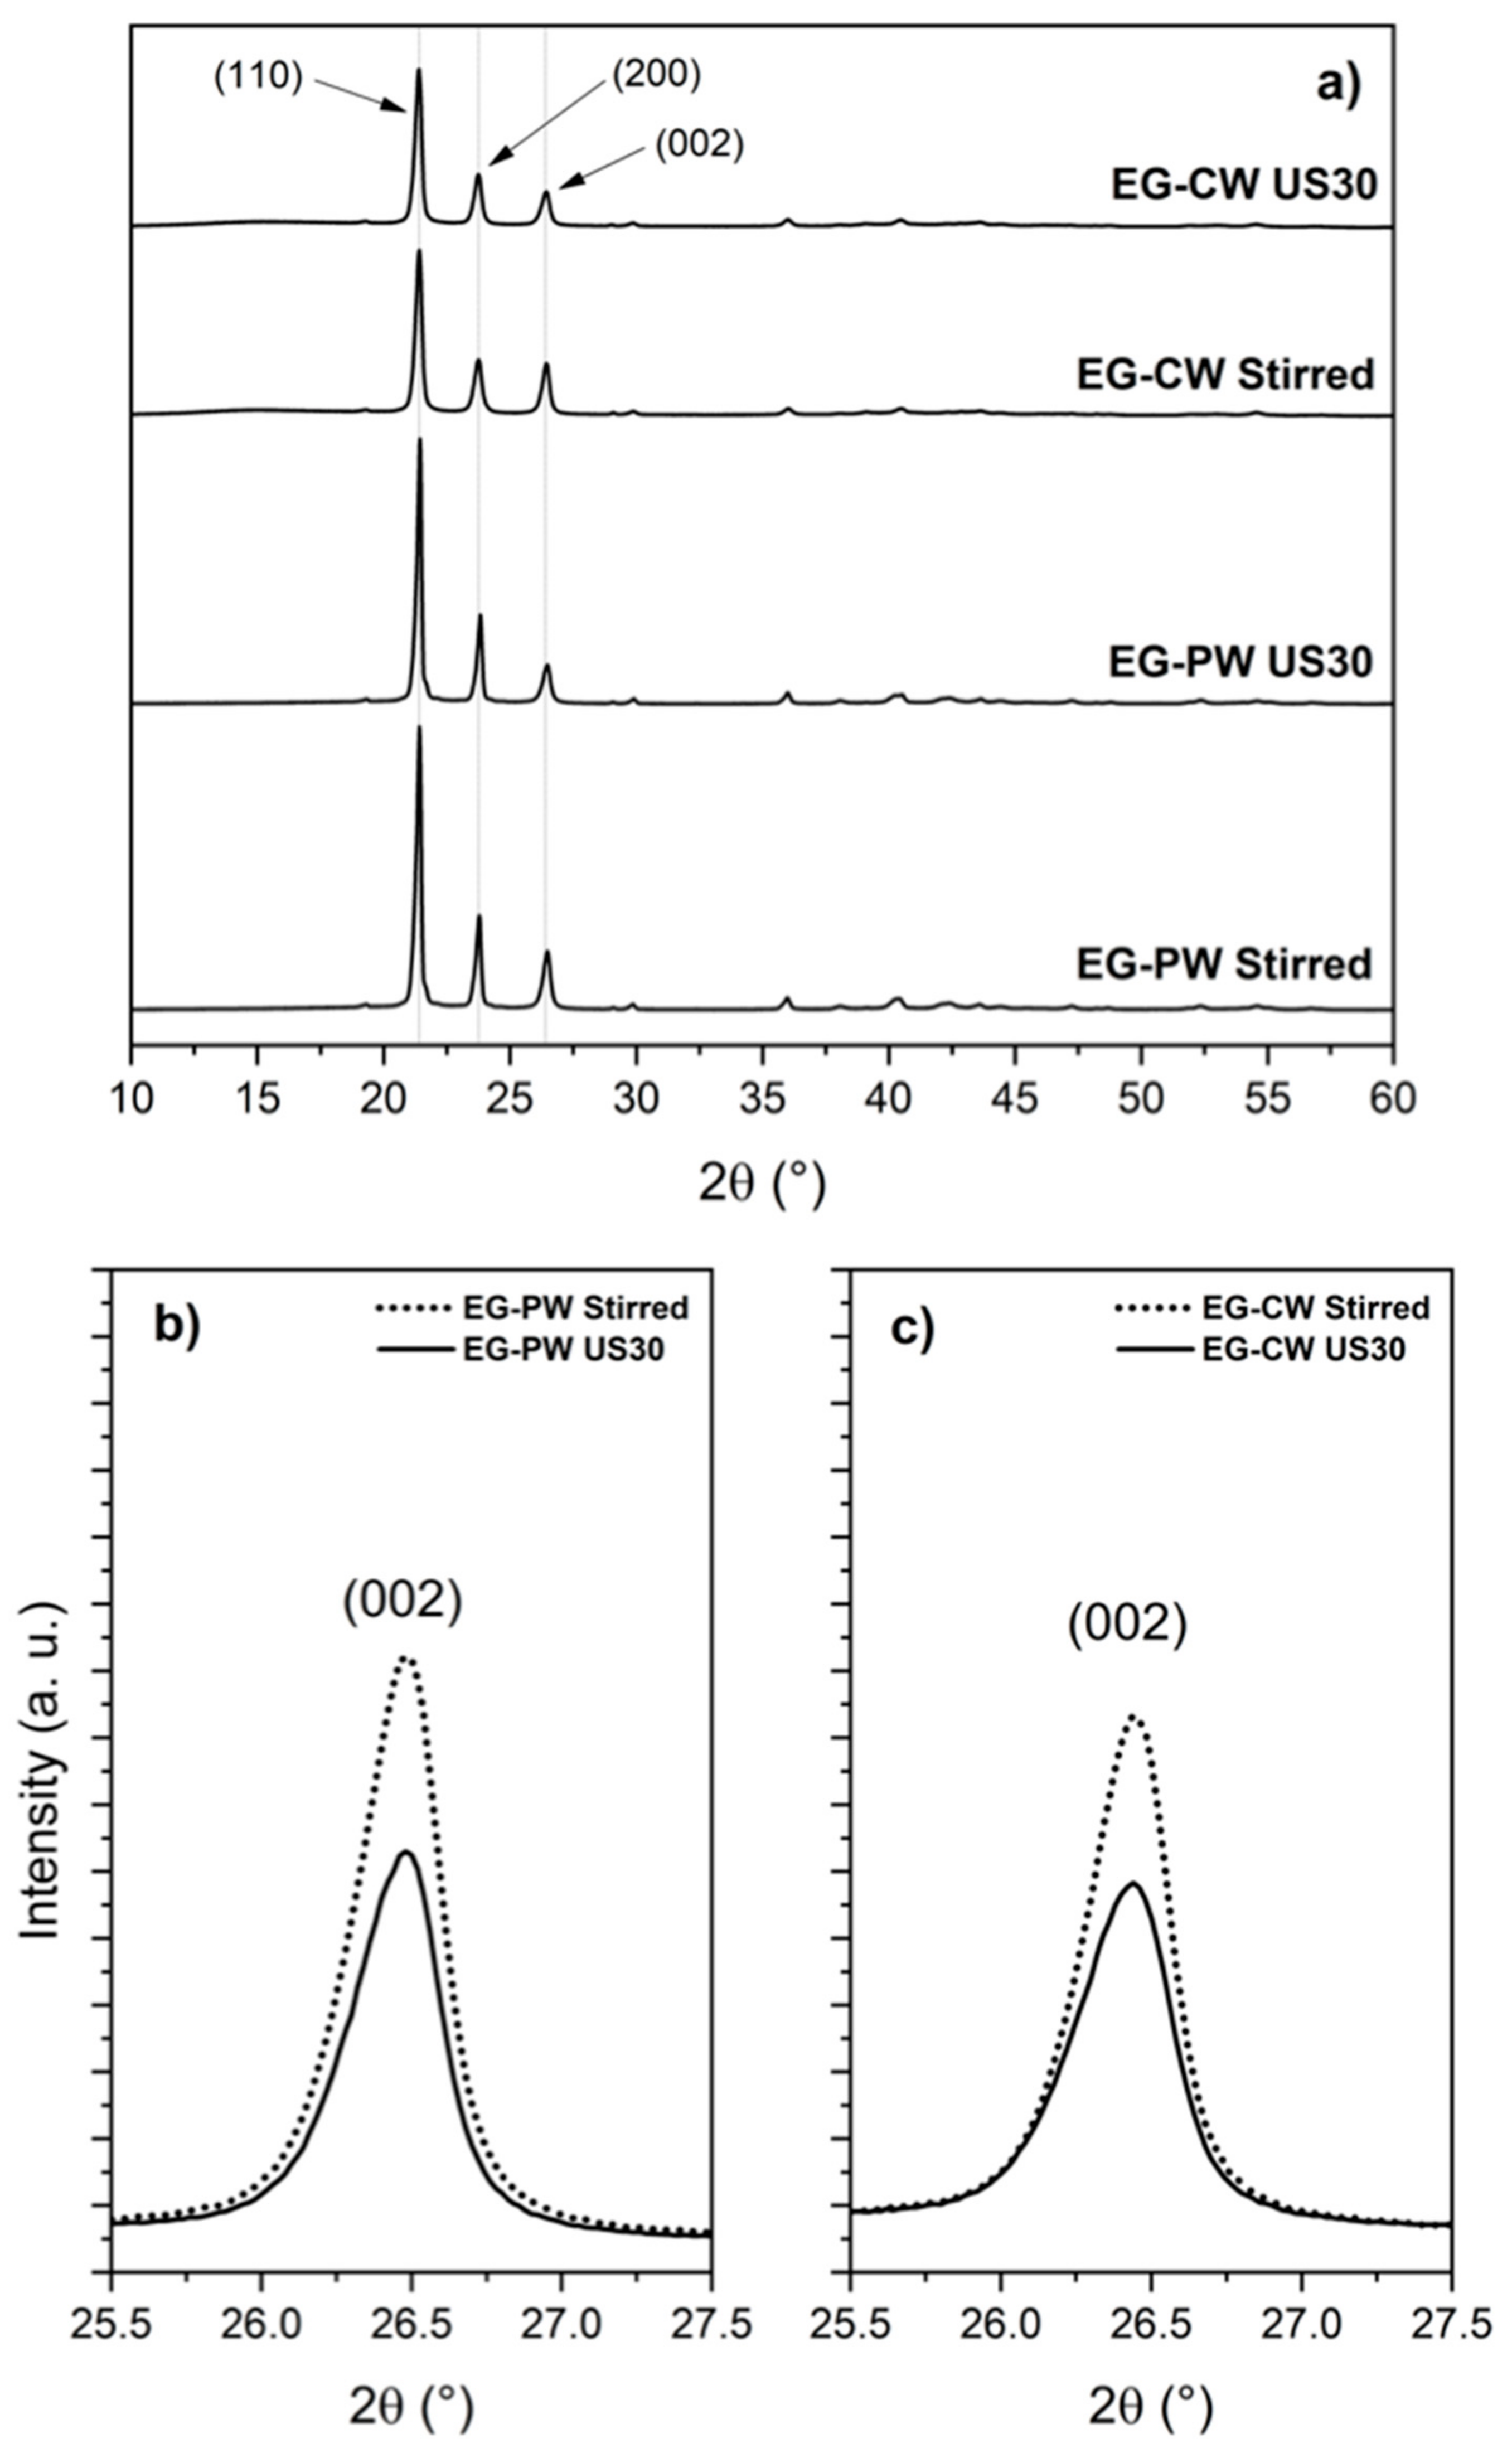
3.5. X-ray Diffraction (XRD) Results
3.6. Rheology
3.7. Ultrasonic Dynamic Mechanical Analysis (UDMA) Results
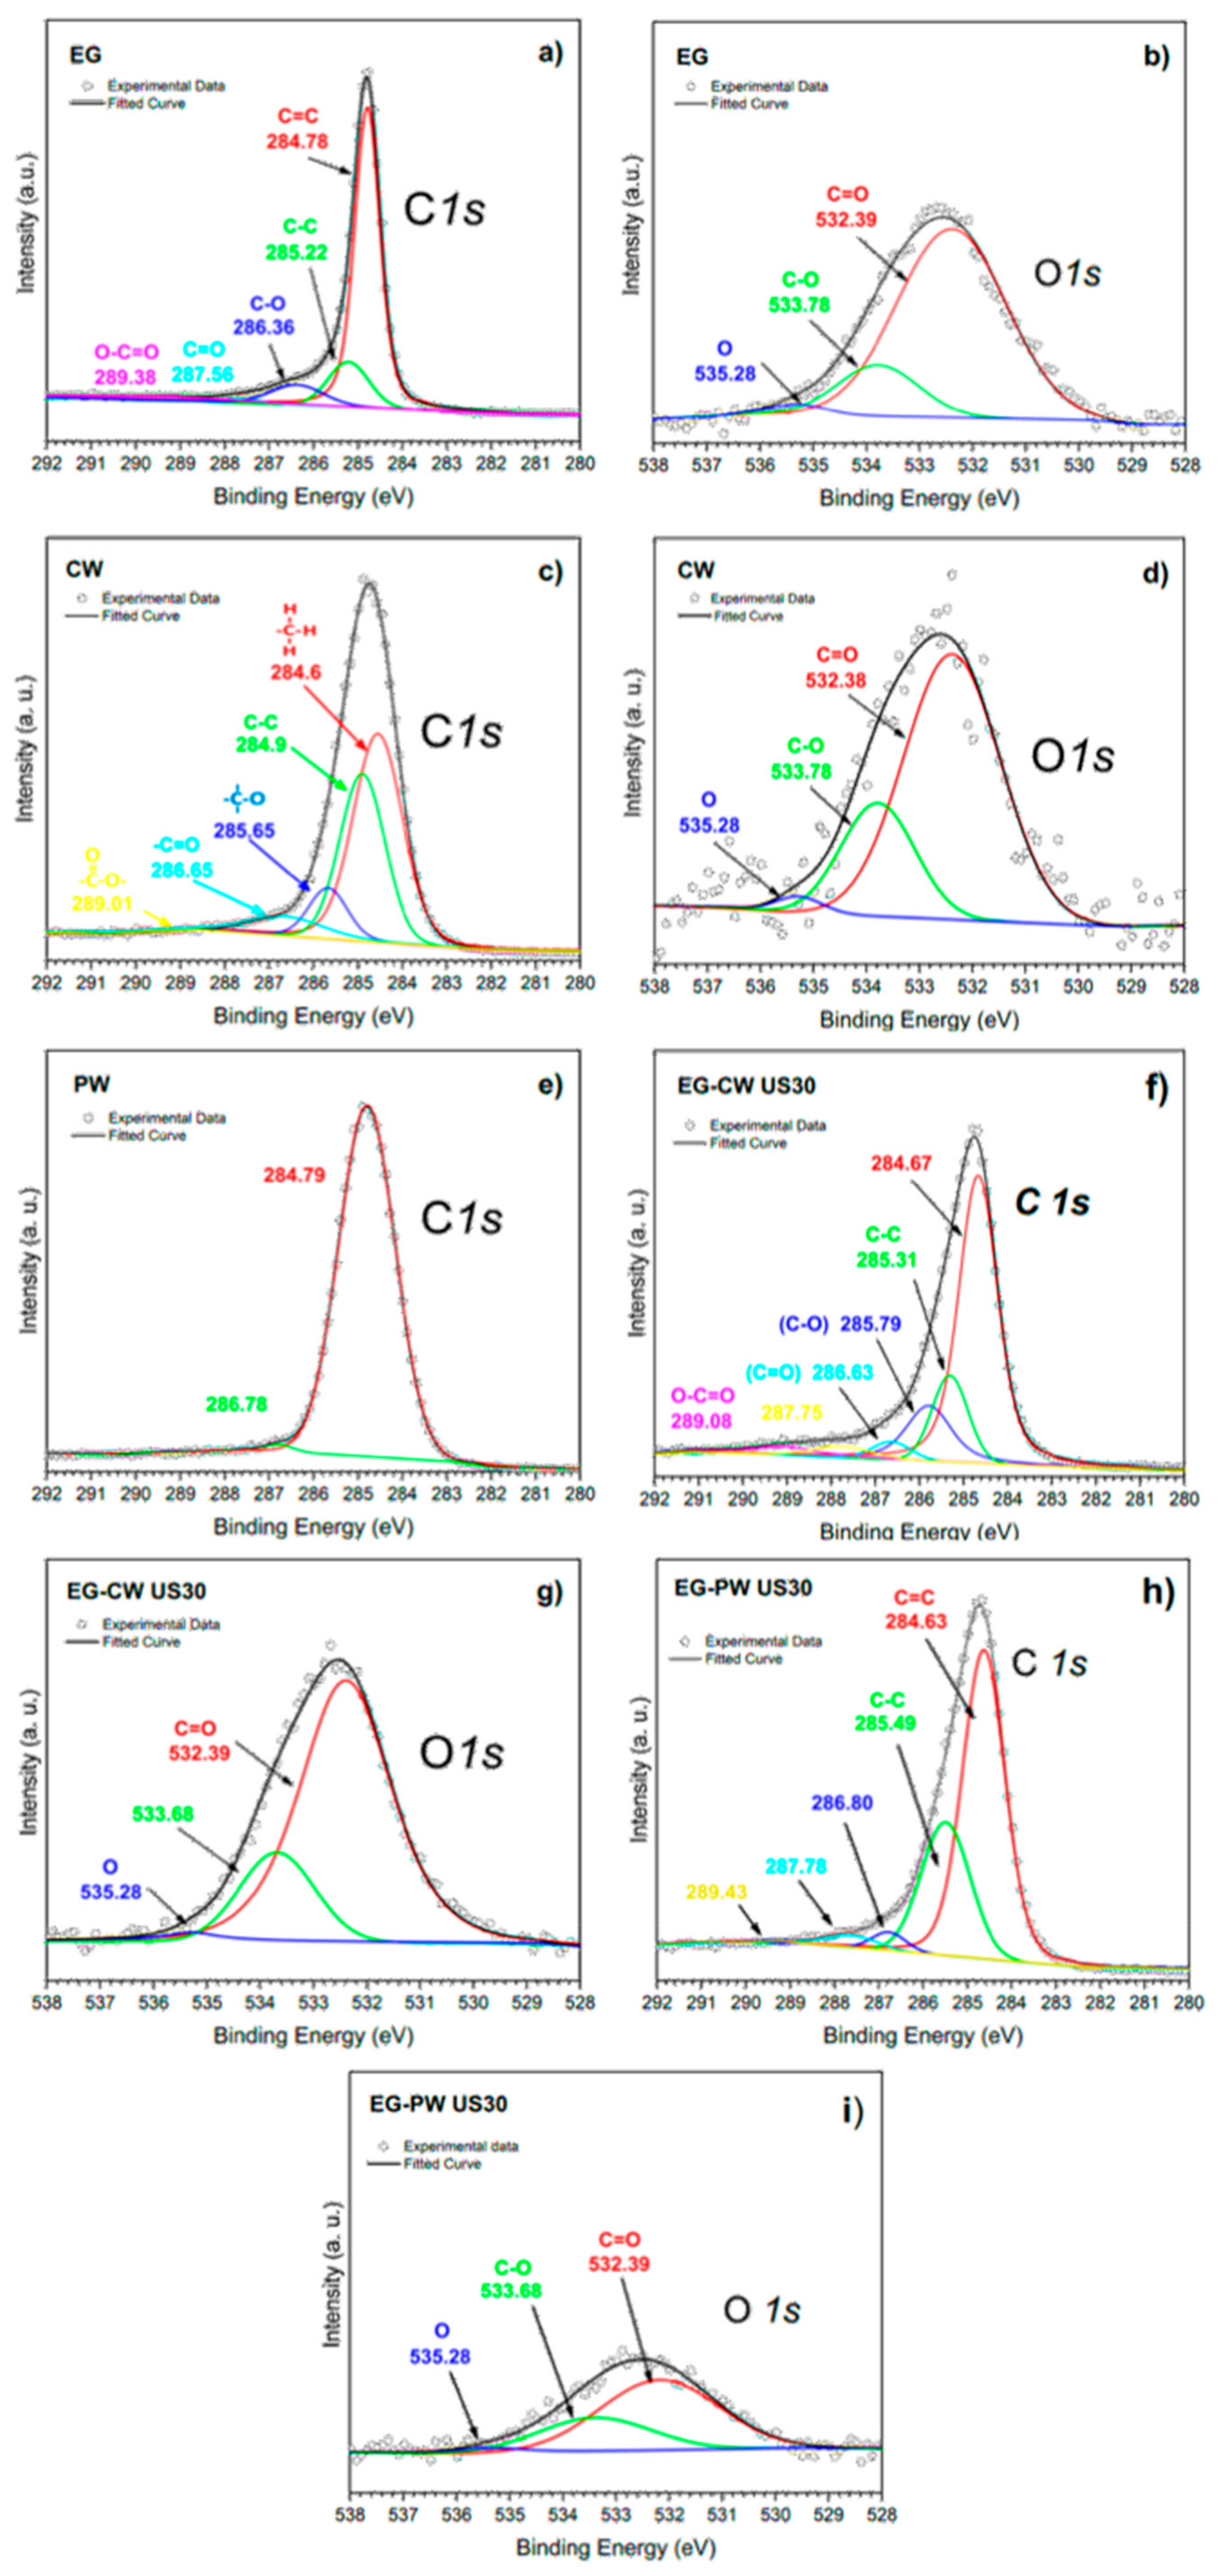
3.8. X-ray Photoelectron Spectroscopy (XPS) Results
4. Conclusions
- DSC analysis suggests that the reduced crystallinity in the EG–CW samples can be ascribed to a possible confinement of the chain segments (i.e., intercalation), which hinders the segmental rearrangement during crystallization and restricts the formation of perfect crystals in the polymer matrix.
- TGA indicates that the addition of expanded graphite improves the thermal stability of paraffin and candelilla wax, probably due to the interactions between the matrices and the graphite stacks.
- XRD analysis revealed that the ultrasonic treatment of EG in candelilla wax induces a higher exfoliation of graphite, demonstrated by a considerable decrease in the intensity of the (002) diffraction plane of graphite. Polar groups present in candelilla wax compounds could interact better with polar groups of the EG, facilitating the exfoliation process.
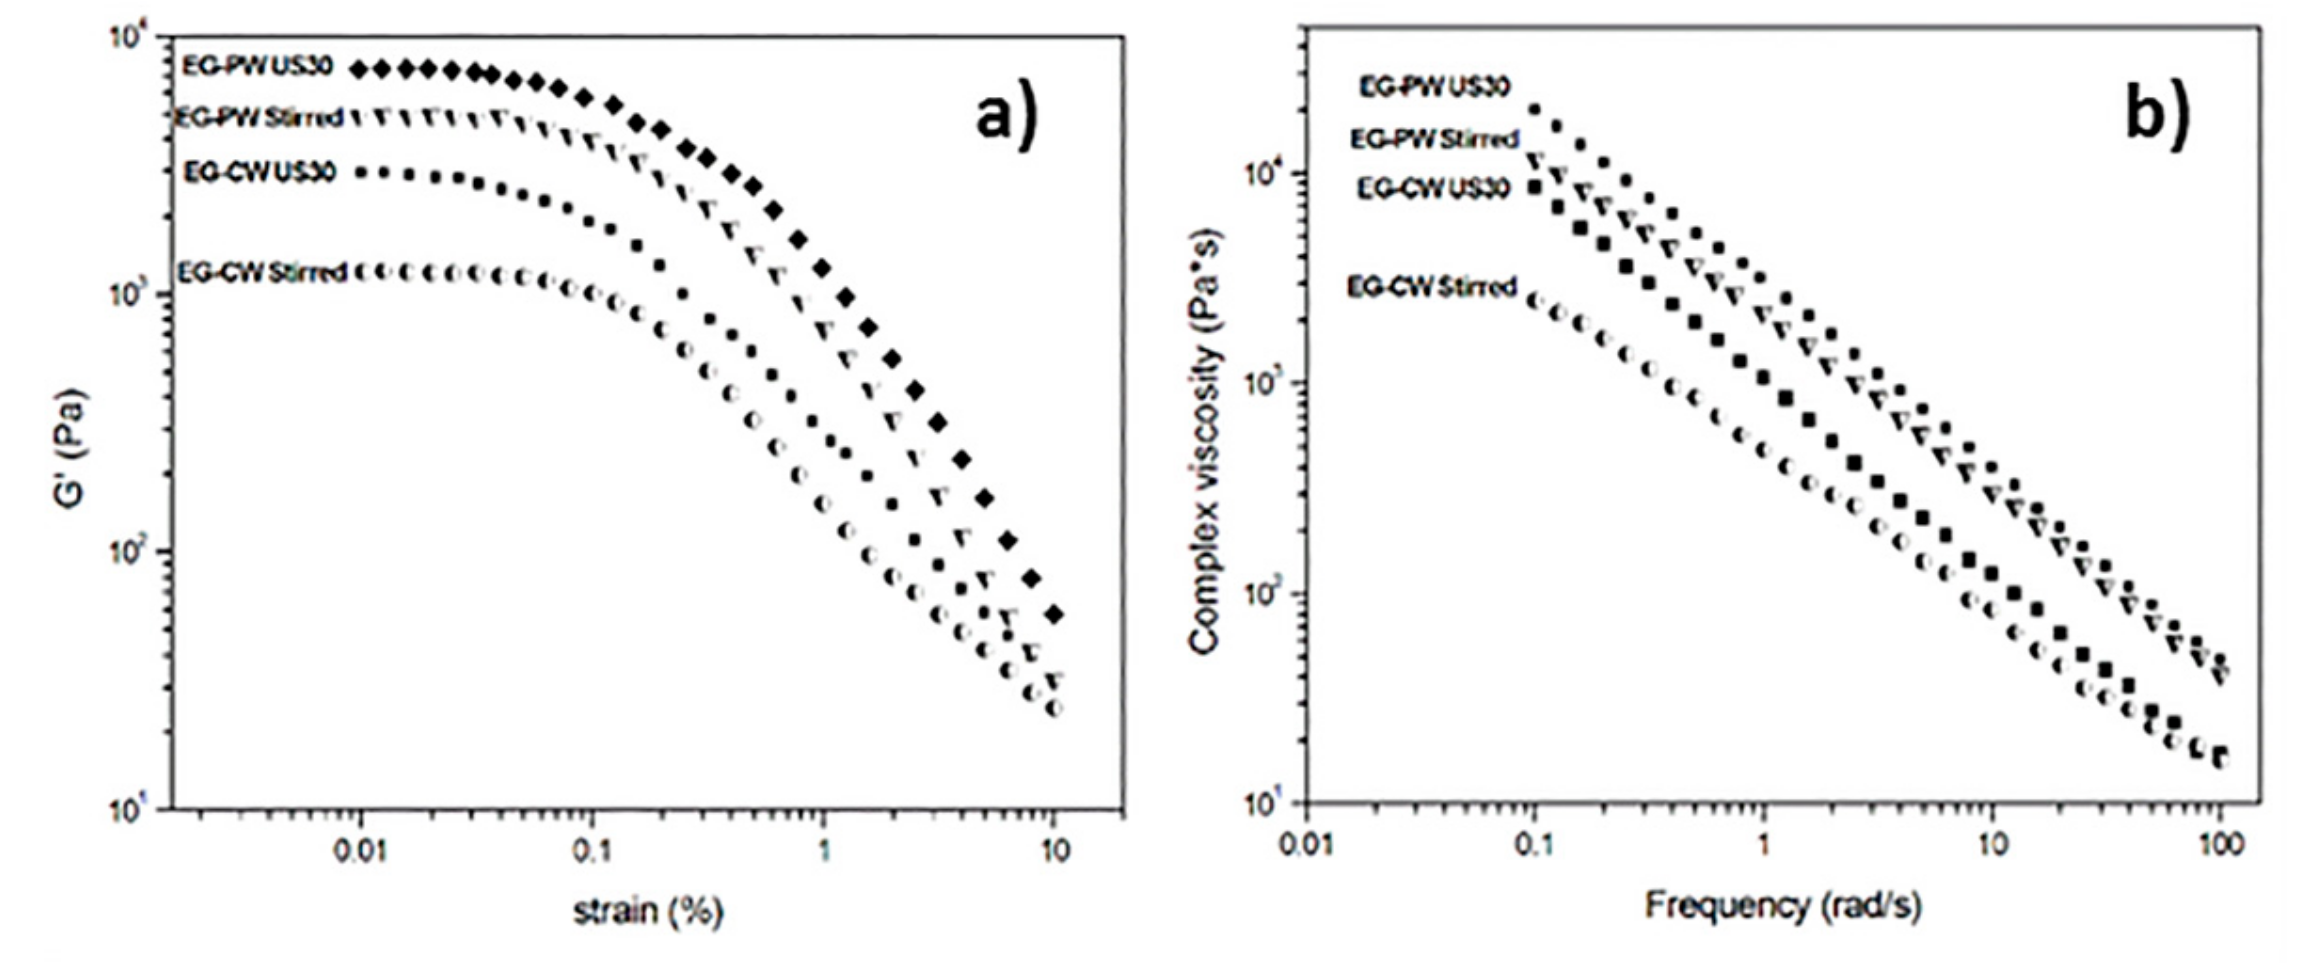
- Rheological analysis by dynamic oscillatory rheometry has proved that EG–wax mixtures show a gel or solid-like behavior in the linear viscoelastic region, probably resulting from the formation of a three-dimensional network (i.e., a physical gel) involving weak bonding forces between the organic and inorganic phase. Ultrasonic treatment leads to a significant increment in the storage modulus, a reduction of the linear viscoelastic region, and an increase of the shear thinning exponent. This is a further indication that the CW nanocomposite samples present a higher degree of EG dispersion after ultrasonic treatment.
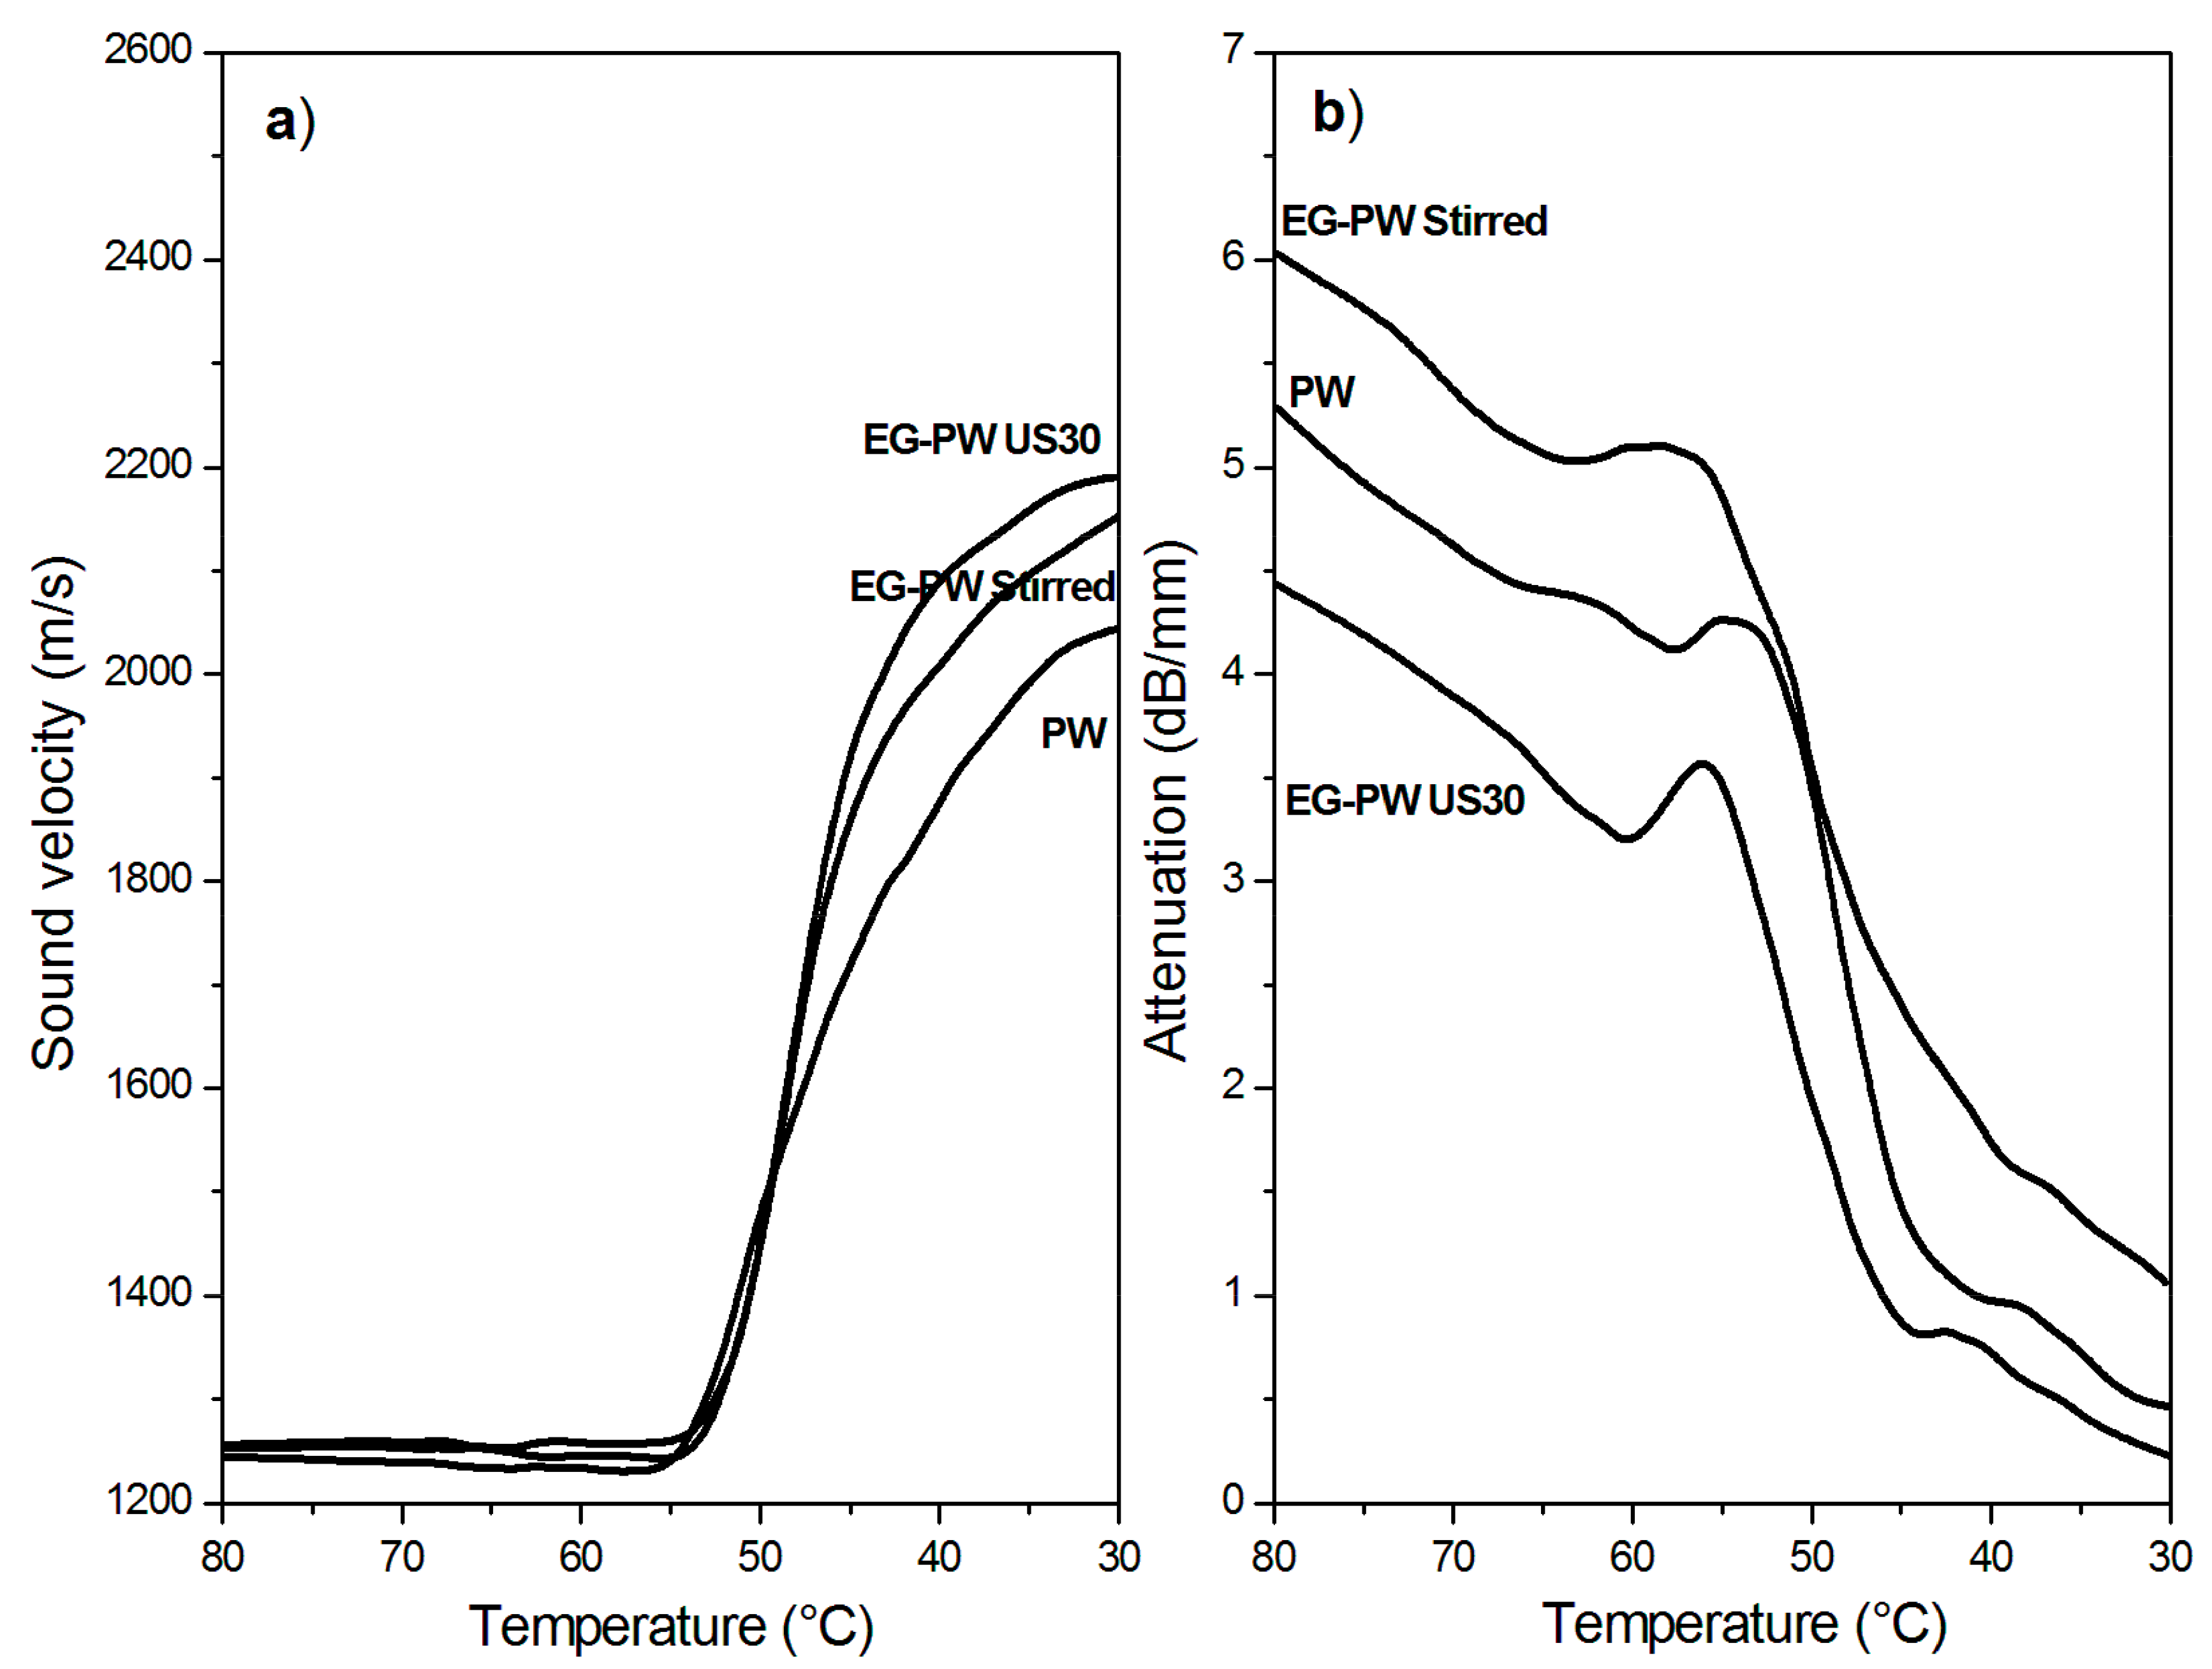
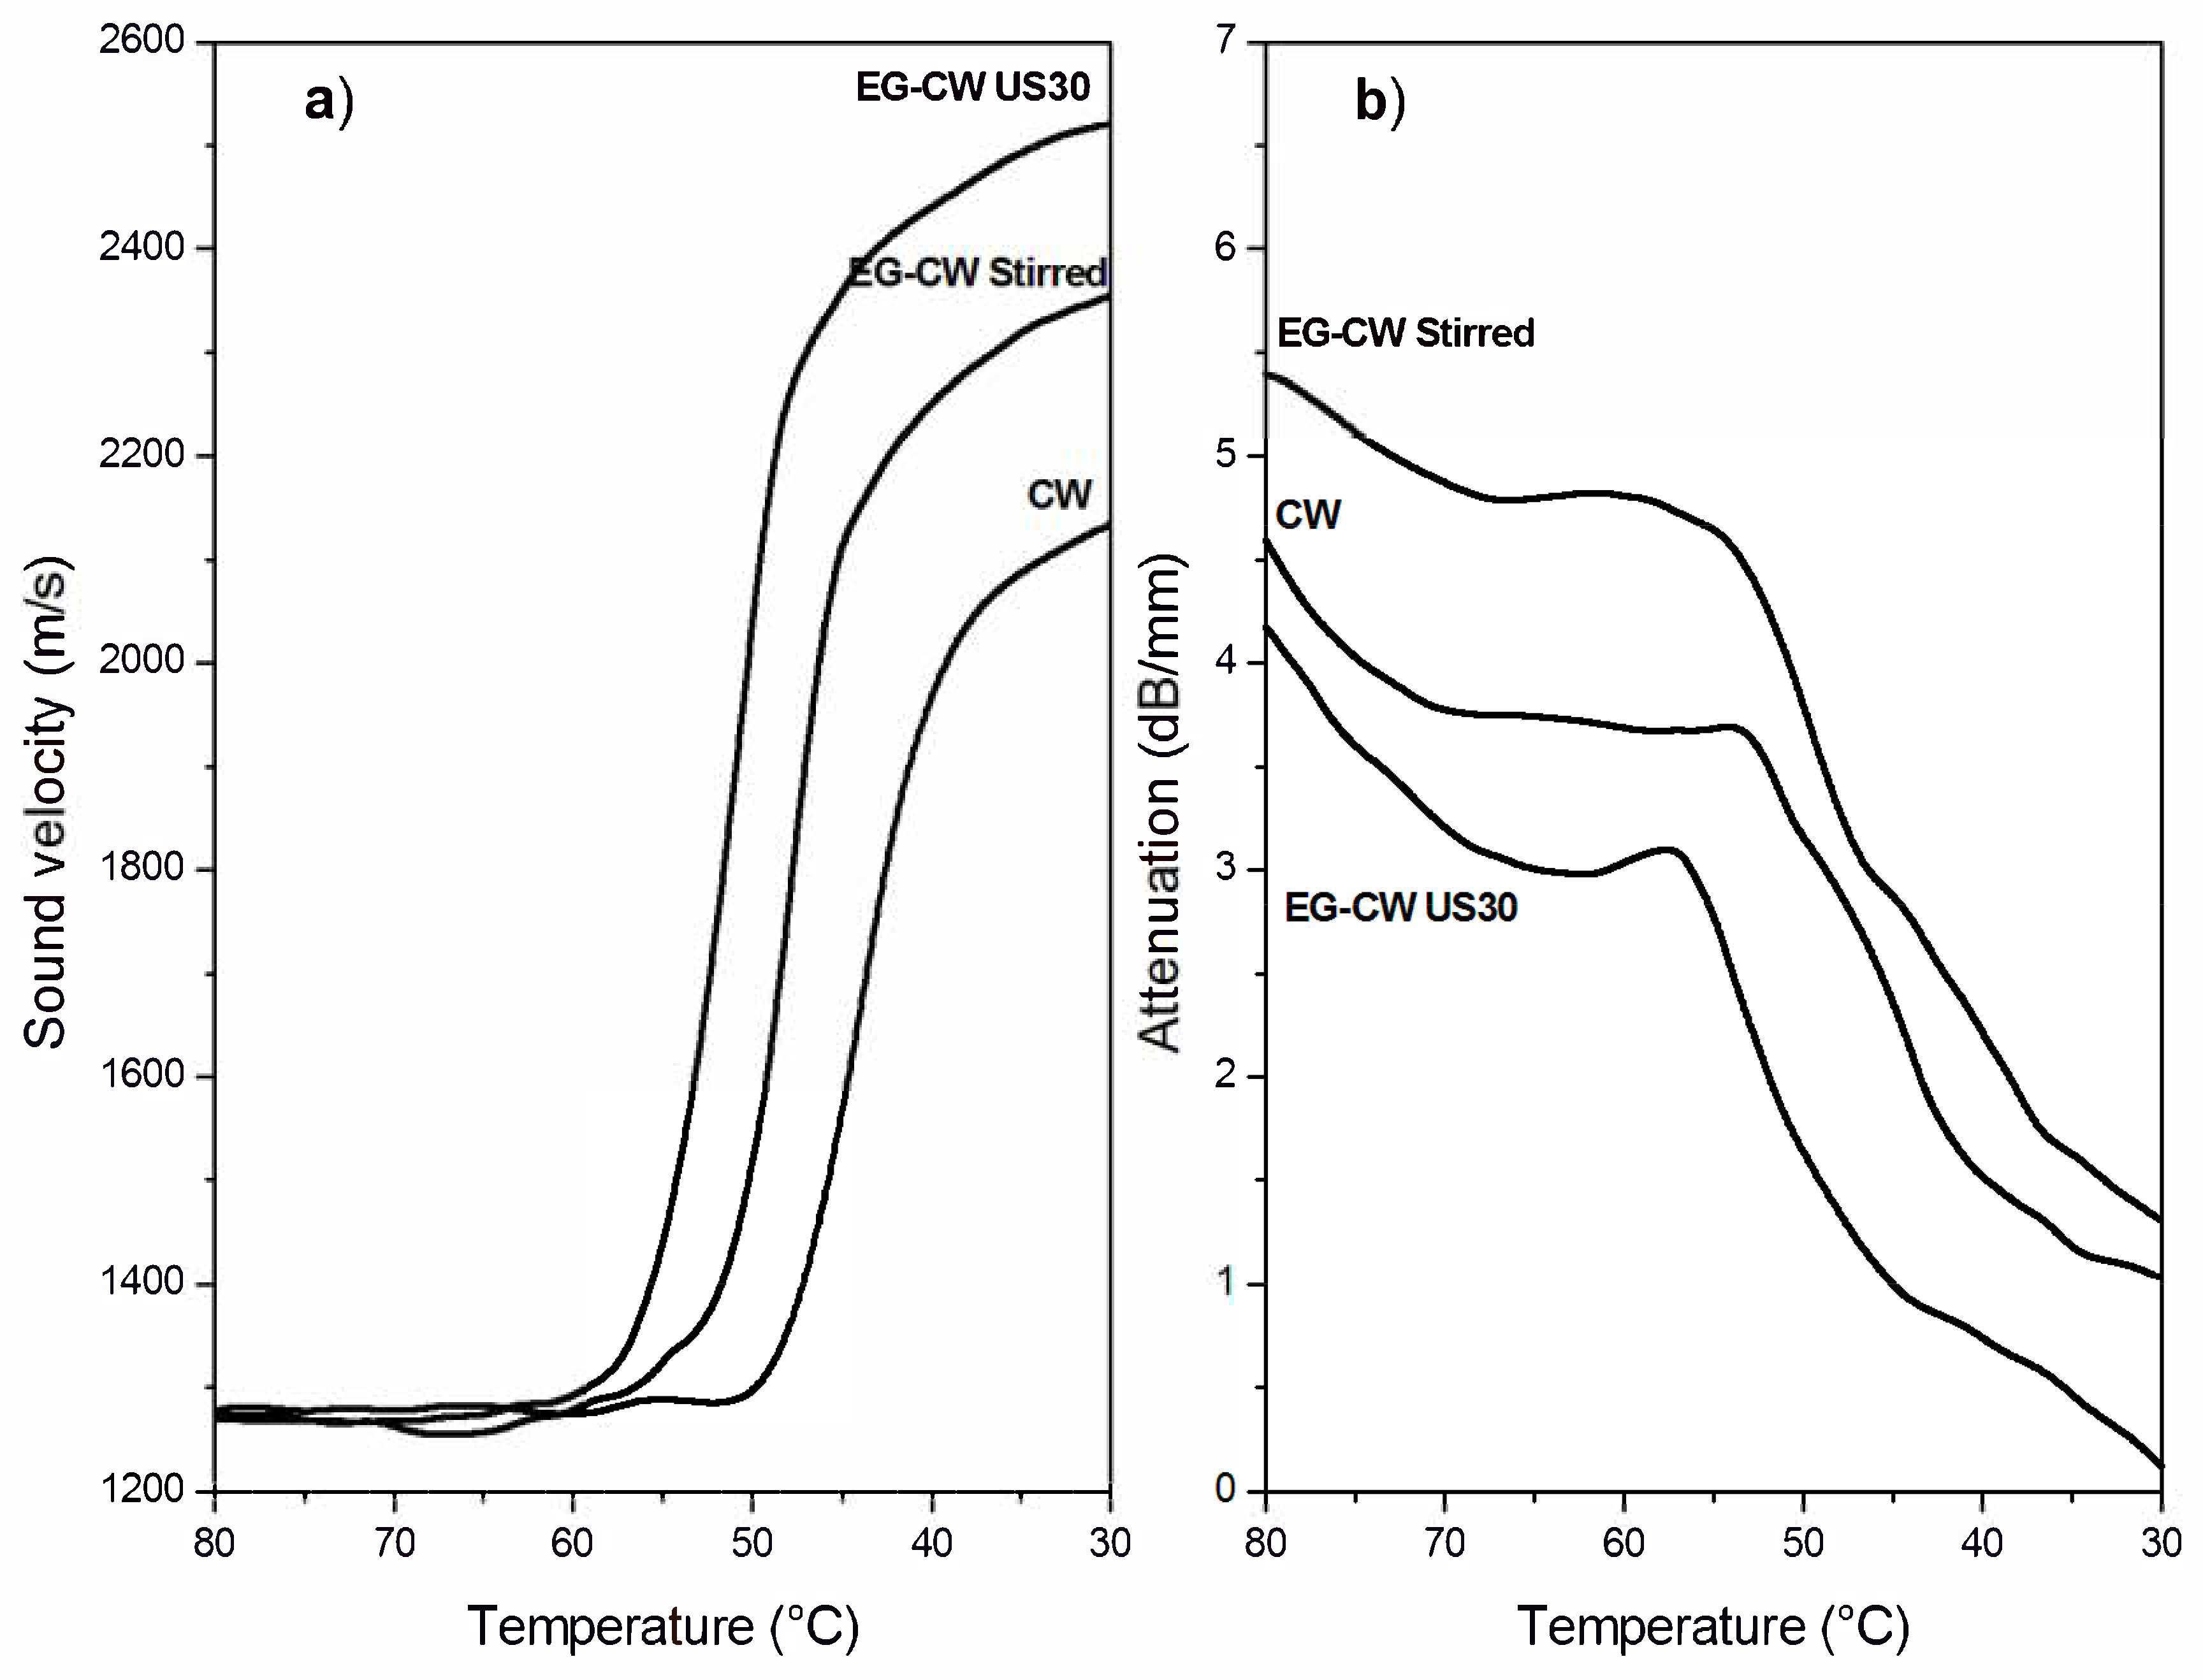
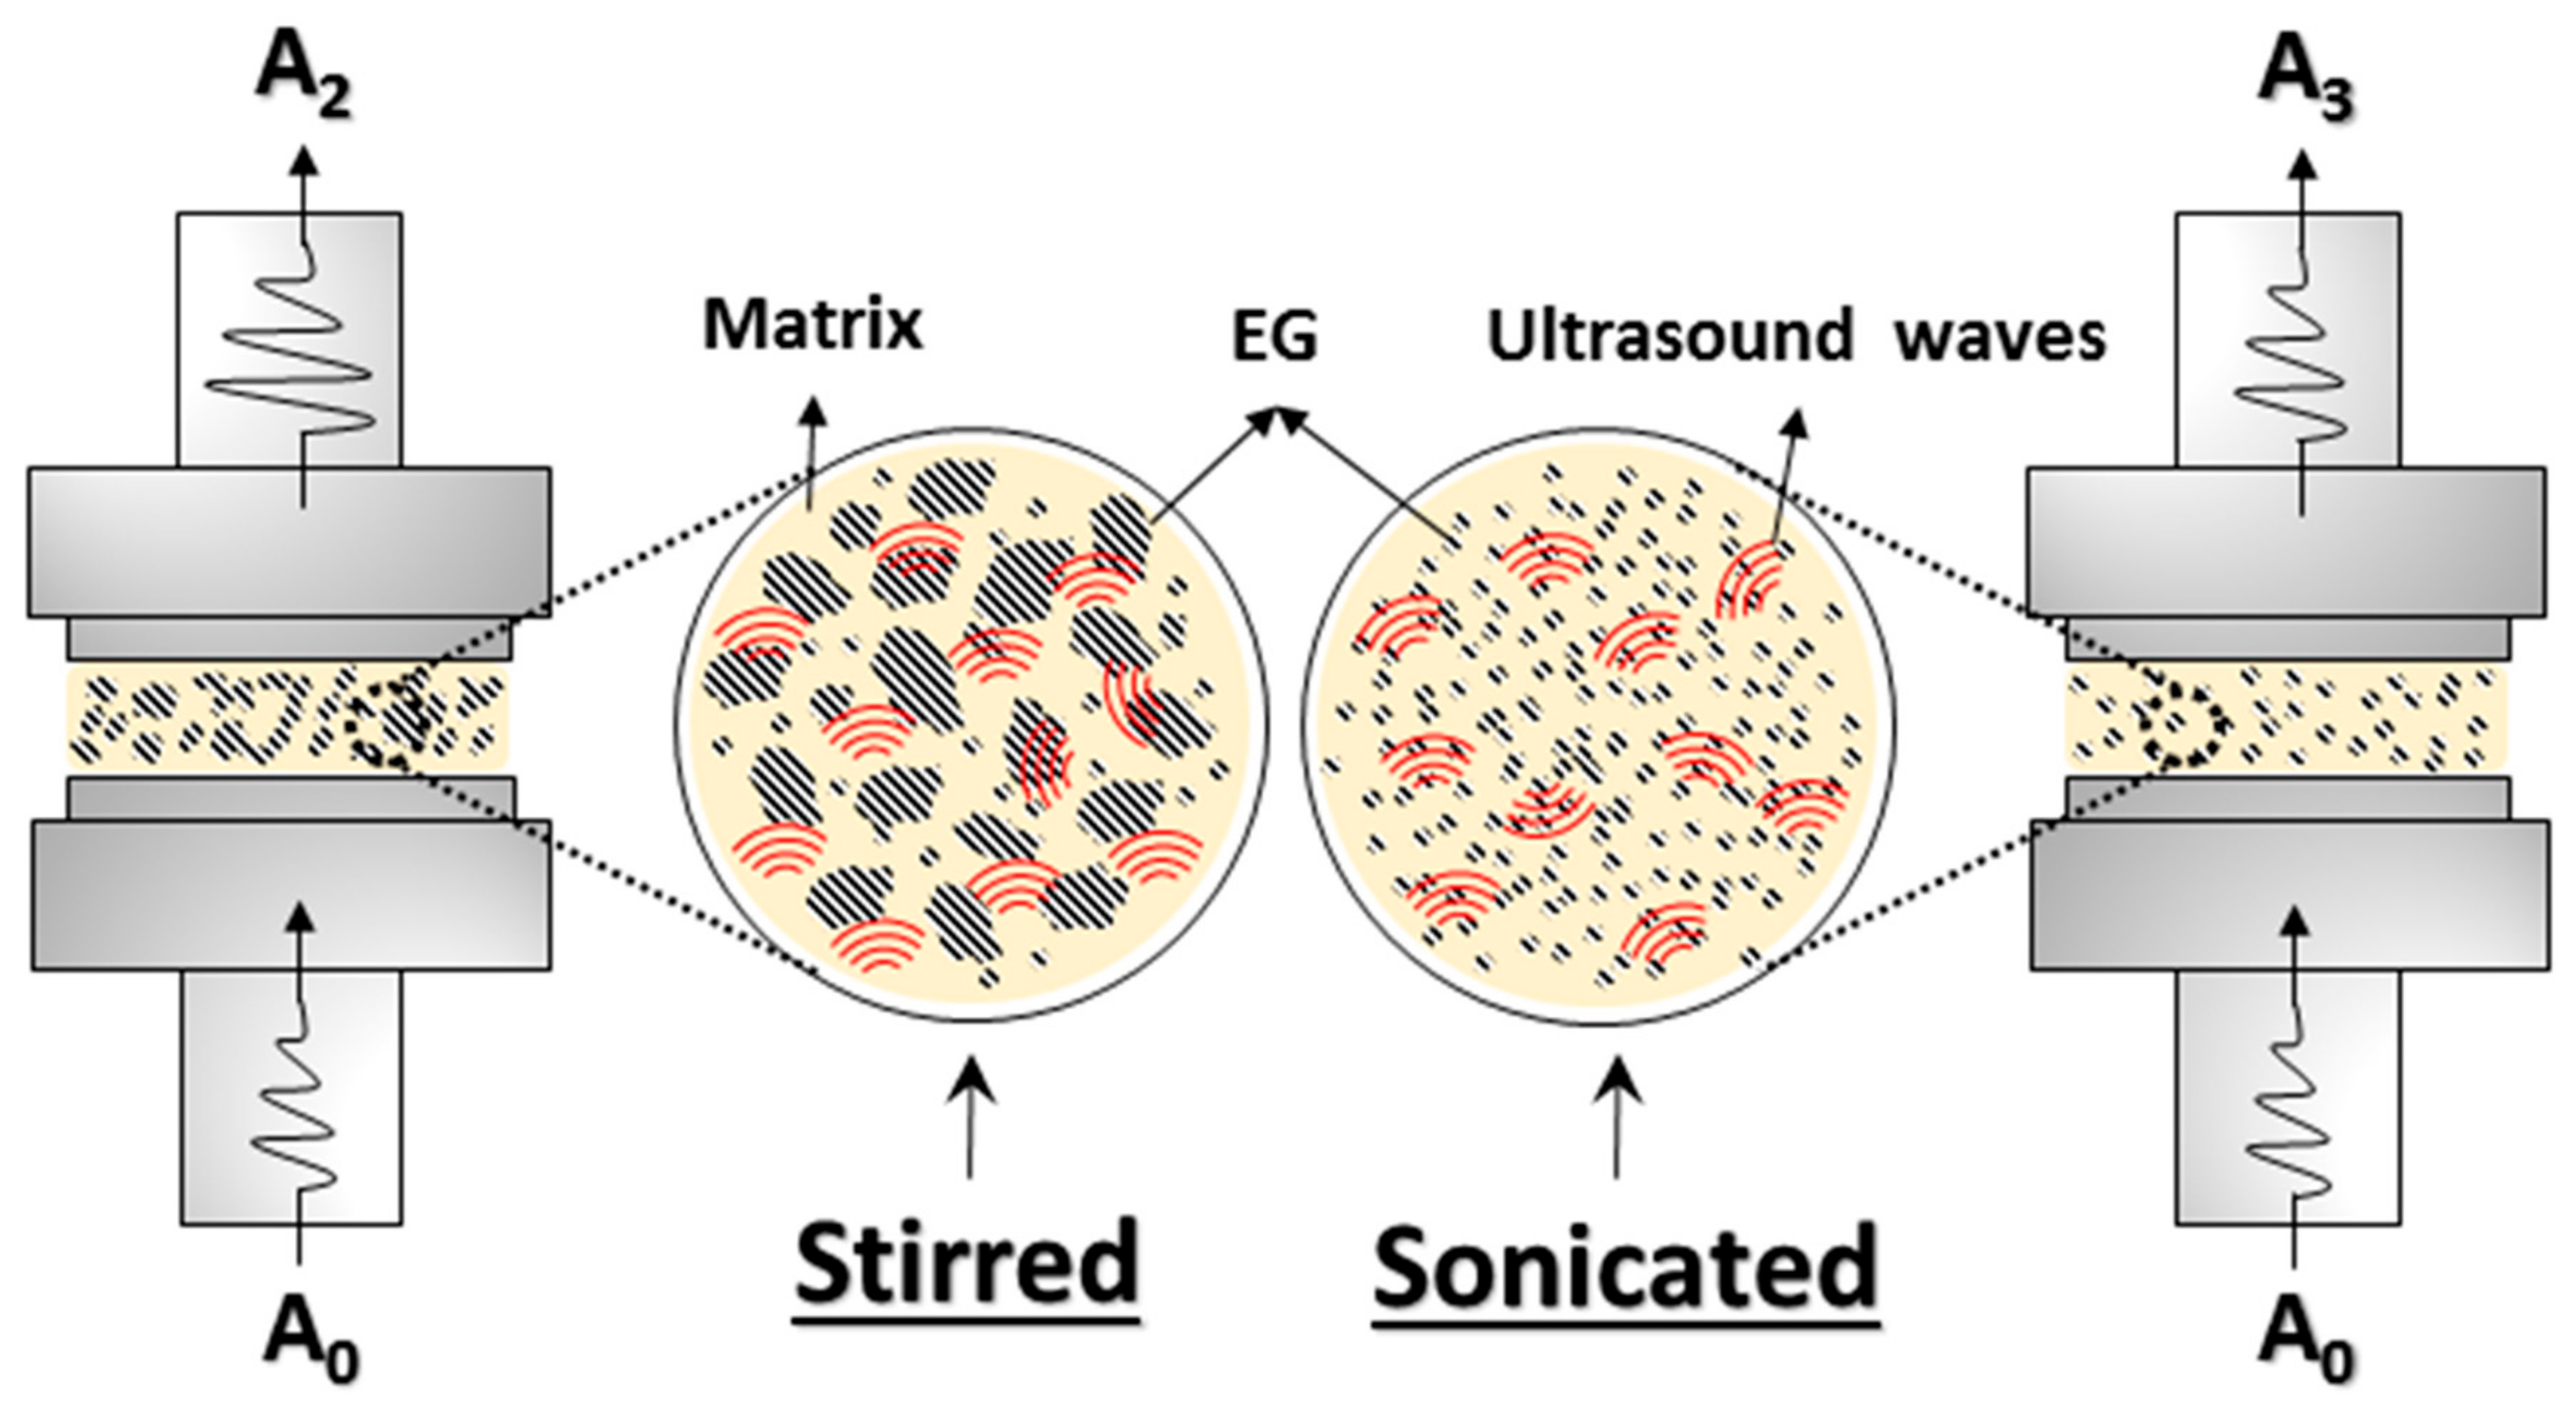
- UDMA results are indicative of the reduction of the cluster size and of a better filler dispersion in the wax matrix promoted by the cavitation caused by ultrasonic treatment.
- XPS analysis indicates that the ultrasonic treatment promotes the grafting of CW compounds with oxygen-containing functional groups on the surface of graphite layers, due to the chemical composition of the natural wax. These grafted groups improve the exfoliation-dispersion of graphite layers, facilitate the formation of a relatively stable suspension, and modify some thermal properties of natural concentrates.
5. Patents
Author Contributions
Funding
Acknowledgments
Conflicts of Interest
References
- Fortunati, E.; Puglia, D.; Iannoni, A.; Terenzi, A.; Kenny, J.M.; Torre, L. Processing conditions, thermal and mechanical responses of stretchable poly (lactic acid)/poly (butylene succinate) films. Materials 2017, 10, 809. [Google Scholar] [CrossRef] [PubMed]
- Rocha, J.C.B.; Lopes, J.D.; Mascarenhas, M.C.N.; Arellano, D.B.; Guerreiro, L.M.R.; da Cunha, R.L. Thermal and rheological properties of organogels formed by sugarcane or candelilla wax in soybean oil. Food Res. Int. 2013, 50, 318–323. [Google Scholar] [CrossRef]
- Li, S.; Boos, T.L.; Parish, E.J. The chemistry of waxes and sterols. In Food Lipids; CRC Press: Boca Raton, FL, USA, 2002; pp. 122–151. [Google Scholar]
- Navarro-Guajardo, N.; García-Carrillo, E.M.; Espinoza-González, C.; Téllez-Zablah, R.; Dávila-Hernández, F.; Romero-García, J.; Ledezma-Pérez, A.; Mercado-Silva, J.A.; Torres, C.A.P.; Pariona, N. Candelilla Wax as Natural Slow-Release Matrix for Fertilizers Encapsulated by Spray Chilling. J. Renew. Mater. 2018, 6, 226–236. [Google Scholar] [CrossRef]
- Toro-Vazquez, J.F.; Alonzo-Macias, M.; Dibildox-Alvarado, E.; Charó-Alonso, M.A. The effect of tripalmitin crystallization on the thermomechanical properties of candelilla wax organogels. Food Biophys. 2009, 4, 199–212. [Google Scholar] [CrossRef]
- Scora, G.A.; Ahmed, M.; Scora, R.W. Epicuticular hydrocarbons of candelilla (Euphorbia antisiphylitica) from three different geographical areas. Ind. Crop. Prod. 1995, 4, 179–184. [Google Scholar] [CrossRef]
- Alvarez-Mitre, F.M.; Toro-Vazquez, J.F.; Moscosa-Santillan, M. Shear rate and cooling modeling for the study of candelilla wax organogels’ rheological properties. J. Food Eng. 2013, 119, 611–618. [Google Scholar] [CrossRef]
- Righetti, M.C.; Cinelli, P.; Mallegni, N.; Massa, C.A.; Aliotta, L.; Lazzeri, A. Thermal, Mechanical, Viscoelastic and Morphological Properties of Poly (lactic acid) based Biocomposites with Potato Pulp Powder Treated with Waxes. Materials 2019, 12, 990. [Google Scholar] [CrossRef]
- Armentano, I.; Puglia, D.; Luzi, F.; Arciola, C.R.; Morena, F.; Martino, S.; Torre, L. Nanocomposites Based on Biodegradable Polymers. Materials 2018, 11, 795. [Google Scholar] [CrossRef]
- García-Quiles, L.; Valdés, A.; Fernández Cuello, Á.; Jiménez, A.; del Garrigós, M.C.; Castell, P. Reducing off-Flavour in Commercially Available Polyhydroxyalkanoate Materials by Autooxidation through Compounding with Organoclays. Polym. Degrad. Stab. 2016, 132, 2–10. [Google Scholar]
- Ramos, M.; Fortunati, E.; Peltzer, M.; Jimenez, A.; Kenny, J.M.; Garrigós, M.C. Characterization and disintegrability under composting conditions of PLA-based nanocomposite films with thymol and silver nanoparticles. Polym. Degrad. Stab. 2016, 132, 2–10. [Google Scholar] [CrossRef]
- Kowalczyk, D.; Baraniak, B. Effect of candelilla wax on functional properties of biopolymer emulsion films–a comparative study. Food Hydrocoll. 2014, 41, 195–209. [Google Scholar] [CrossRef]
- Medina-Jaramillo, C.; Ochoa-Yepes, O.; Bernal, C.; Famá, L. Active and smart biodegradable packaging based on starch and natural extracts. Carbohydr. Polym. 2017, 176, 187–194. [Google Scholar] [CrossRef] [PubMed]
- Said, A.; Salah, A.; Fattah, G. Enhanced thermo-optical switching of paraffin-wax composite spots under laser heating. Materials 2017, 10, 525. [Google Scholar] [CrossRef] [PubMed]
- Hassan, A.; Ismail, N.; Mourad, A.-H.; Rashid, Y.; Laghari, M. Preparation and Characterization of Expanded Clay-Paraffin Wax-Geo-Polymer Composite Material. Materials 2018, 11, 2191. [Google Scholar] [CrossRef] [PubMed]
- Carlos, E.G.; Oliverio, R.F.; Lidia, D.I.; Salvador, F.T.; Layza, A.G. Latent heat storage composites and method therefor. Mexican Patent Application No. MX/a/2018/008923, 20 July 2018. [Google Scholar]
- Hou, P.; Mao, J.; Chen, F.; Li, Y.; Dong, X. Preparation and Thermal Performance Enhancement of Low Temperature Eutectic Composite Phase Change Materials Based on Na2SO4· 10H2O. Materials 2018, 11, 2230. [Google Scholar] [CrossRef] [PubMed]
- Said, A.; Salah, A.; Fattah, G.A. Thermo-optic switching properties of paraffin-wax hosting carbon fillers. J. Energy Storage 2018, 19, 260–271. [Google Scholar] [CrossRef]
- Zhang, B.; Tian, Y.; Jin, X.; Lo, T.; Cui, H. Thermal and mechanical properties of expanded graphite/paraffin gypsum-based composite material reinforced by carbon fiber. Materials 2018, 11, 2205. [Google Scholar] [CrossRef] [PubMed]
- Li, M.; Mu, B. Effect of different dimensional carbon materials on the properties and application of phase change materials: A review. Appl. Energy 2019, 242, 695–715. [Google Scholar] [CrossRef]
- Cheng, F.; Wen, R.; Huang, Z.; Fang, M.; Liu, Y.; Wu, X.; Min, X. Preparation and analysis of lightweight wall material with expanded graphite (EG)/paraffin composites for solar energy storage. Appl. Therm. Eng. 2017, 120, 107–114. [Google Scholar] [CrossRef]
- Mozaffari, S.; Li, W.; Thompson, C.; Ivanov, S.; Seifert, S.; Lee, B.; Kovarik, L.; Karim, A.M. Colloidal nanoparticle size control: experimental and kinetic modeling investigation of the ligand–metal binding role in controlling the nucleation and growth kinetics. Nanoscale 2017, 9, 13772–13785. [Google Scholar] [CrossRef]
- Li, W.; Ivanov, S.; Mozaffari, S.; Shanaiah, N.; Karim, A.M. Palladium Acetate Trimer: Understanding Its Ligand-Induced Dissociation Thermochemistry Using Isothermal Titration Calorimetry, X-ray Absorption Fine Structure, and 31P Nuclear Magnetic Resonance. Organometallics 2018, 38, 451–460. [Google Scholar] [CrossRef]
- Cai, M.; Thorpe, D.; Adamson, D.H.; Schniepp, H.C. Methods of graphite exfoliation. J. Mater. Chem. 2012, 22, 24992–25002. [Google Scholar] [CrossRef]
- Dell’Anna, R.; Lionetto, F.; Montagna, F.; Maffezzoli, A. Lay-up and consolidation of a composite pipe by in situ ultrasonic welding of a thermoplastic matrix composite tape. Materials 2018, 11, 786. [Google Scholar] [CrossRef] [PubMed]
- Lionetto, F.; Dell’Anna, R.; Montagna, F.; Maffezzoli, A. Modeling of continuous ultrasonic impregnation and consolidation of thermoplastic matrix composites. Compos. Part A Appl. Sci. Manuf. 2016, 82, 119–129. [Google Scholar] [CrossRef]
- Arrigo, R.; Teresi, R.; Gambarotti, C.; Parisi, F.; Lazzara, G.; Dintcheva, N. Sonication-induced modification of carbon nanotubes: Effect on the rheological and thermo-oxidative behaviour of polymer-based nanocomposites. Materials 2018, 11, 383. [Google Scholar] [CrossRef] [PubMed]
- Espinoza-Gonzalez, C.; Avila-Orta, C.; Martinez-Colunga, G.; Lionetto, F.; Maffezzoli, A. A Measure of CNTs Dispersion in Polymers with Branched Molecular Architectures by UDMA. IEEE Trans. Nanotechnol. 2016, 15, 731–737. [Google Scholar] [CrossRef]
- Dimoka, P.; Psarras, S.; Kostagiannakopoulou, C.; Kostopoulos, V. Assessing the Damage Tolerance of Out of Autoclave Manufactured Carbon Fibre Reinforced Polymers Modified with Multi-Walled Carbon Nanotubes. Materials 2019, 12, 1080. [Google Scholar] [CrossRef] [PubMed]
- Zakaria, M.; Abdul Kudus, M.; Zamri, M. Improvement of fracture toughness in epoxy nanocomposites through chemical hybridization of carbon nanotubes and alumina. Materials 2017, 10, 301. [Google Scholar] [CrossRef] [PubMed]
- Andrade-Guel, M.; Cabello-Alvarado, C.; Cruz-Delgado, V.J.; Bartolo-Perez, P.; León-Martínez, D.; Sáenz-Galindo, A.; Cadenas-Pliego, G.; Ávila-Orta, C.A. Surface modification of graphene nanoplatelets by organic acids and ultrasonic radiation for enhance uremic toxins adsorption. Materials 2019, 12, 715. [Google Scholar] [CrossRef]
- Donadei, V.; Lionetto, F.; Wielandt, M.; Offringa, A.; Maffezzoli, A. Effects of Blank Quality on Press-Formed PEKK/Carbon Composite Parts. Materials 2018, 11, 1063. [Google Scholar] [CrossRef]
- Greco, A.; Corcione, C.E.; Maffezzoli, A. Diffusion in oriented lamellar nanocomposite: Numerical analysis of the effects of dispersion and intercalation. Comput. Mater. Sci. 2017, 133, 45–51. [Google Scholar] [CrossRef]
- Giuri, A.; Colella, S.; Listorti, A.; Rizzo, A.; Mele, C.; Corcione, C.E. GO/glucose/PEDOT: PSS ternary nanocomposites for flexible supercapacitors. Compos. Part B Eng. 2018, 148, 149–155. [Google Scholar] [CrossRef]
- Greco, A.; Lionetto, F.; Maffezzoli, A. Processing and characterization of amorphous polyethylene terephthalate fibers for the alignment of carbon nanofillers in thermosetting resins. Polym. Compos. 2015, 36, 1096–1103. [Google Scholar] [CrossRef]
- Giuri, A.; Masi, S.; Colella, S.; Listorti, A.; Rizzo, A.; Liscio, A.; Treossi, E.; Palermo, V.; Gigli, G.; Mele, C. GO/PEDOT: PSS nanocomposites: effect of different dispersing agents on rheological, thermal, wettability and electrochemical properties. Nanotechnology 2017, 28, 174001. [Google Scholar] [CrossRef] [PubMed]
- Ramírez, J.A.Á.; Cerrutti, P.; Bernal, C.; Errea, M.I.; Foresti, M.L. Nanocomposites Based on Poly (lactic acid) and Bacterial Cellulose Acetylated by an α-Hydroxyacid Catalyzed Route. J. Polym. Environ. 2019, 27, 510–520. [Google Scholar] [CrossRef]
- Mozaffari, S.; Tchoukov, P.; Mozaffari, A.; Atias, J.; Czarnecki, J.; Nazemifard, N. Capillary driven flow in nanochannels–Application to heavy oil rheology studies. Coll. Surf. A: Physicochem. Eng. Asp. 2017, 513, 178–187. [Google Scholar] [CrossRef]
- Liu, F.; Darjani, S.; Akhmetkhanova, N.; Maldarelli, C.; Banerjee, S.; Pauchard, V. Mixture effect on the dilatation rheology of asphaltenes-laden interfaces. Langmuir 2017, 33, 1927–1942. [Google Scholar] [CrossRef] [PubMed]
- Lavin-Lopez, M.P.; Valverde, J.L.; Sanchez-Silva, L.; Romero, A. Solvent-based exfoliation via sonication of graphitic materials for graphene manufacture. Ind. Eng. Chem. Res. 2016, 55, 845–855. [Google Scholar] [CrossRef]
- Ávila-Orta, C.; Espinoza-González, C.; Martínez-Colunga, G.; Bueno-Baqués, D.; Maffezzoli, A.; Lionetto, F. An overview of progress and current challenges in ultrasonic treatment of polymer melts. Adv. Polym. Technol. 2013, 32, E582–E602. [Google Scholar] [CrossRef]
- Ayán-Varela, M.; Paredes, J.I.; Villar-Rodil, S.; Rozada, R.; Martínez-Alonso, A.; Tascón, J.M.D. A quantitative analysis of the dispersion behavior of reduced graphene oxide in solvents. Carbon 2014, 75, 390–400. [Google Scholar] [CrossRef]
- Toxnet Database. Available online: https://toxnet.nlm.nih.gov (accessed on 20 July 2019).
- Liu, S.; Sun, W.; Jing, H.; Dong, Z. Debonding Detection and Monitoring for CFRP Reinforced Concrete Beams Using Pizeoceramic Sensors. Materials 2019, 12, 2150. [Google Scholar] [CrossRef]
- Roscher, S.; Hoffmann, R.; Ambacher, O. Determination of the graphene–graphite ratio of graphene powder by Raman 2D band symmetry analysis. Anal. Methods 2019, 11, 1224–1228. [Google Scholar] [CrossRef]
- Arao, Y.; Kubouchi, M. High-rate production of few-layer graphene by high-power probe sonication. Carbon 2015, 95, 802–808. [Google Scholar] [CrossRef]
- Sullivan, P.K. Solid-phase behavior of several long-chain n-paraffins, esters, and a ketone. J. Res. NBS A Phys. 1974, 129–141. [Google Scholar] [CrossRef]
- Zhang, Z.; Fang, X. Study on paraffin/expanded graphite composite phase change thermal energy storage material. Energy Convers. Manag. 2006, 47, 303–310. [Google Scholar] [CrossRef]
- Yin, Z.; Huang, Z.; Wen, R.; Zhang, X.; Tan, B.; Liu, Y.; Wu, X.; Fang, M. Preparation and thermal properties of phase change materials based on paraffin with expanded graphite and carbon foams prepared from sucroses. Rsc Adv. 2016, 6, 95085–95091. [Google Scholar] [CrossRef]
- Gao, X.; Zhao, T.; Luo, G.; Zheng, B.; Huang, H.; Han, X.; Ma, R.; Chai, Y. Thermal Property Enhancement of Paraffin-Wax-Based Hydroxyl-Terminated Polybutadiene Binder with a Novel NanoSiO2-Expanded Graphite-PW Ternary Form-Stable Phase Change Material. Energy Fuels 2018, 32, 4016–4024. [Google Scholar] [CrossRef]
- Chiu, C.-W.; Huang, T.-K.; Wang, Y.-C.; Alamani, B.G.; Lin, J.-J. Intercalation strategies in clay/polymer hybrids. Prog. Polym. Sci. 2014, 39, 443–485. [Google Scholar] [CrossRef]
- Di Maio, E.; Iannace, S.; Sorrentino, L.; Nicolais, L. Isothermal crystallization in PCL/clay nanocomposites investigated with thermal and rheometric methods. Polymer 2004, 45, 8893–8900. [Google Scholar] [CrossRef]
- Pavlidou, S.; Papaspyrides, C.D. A review on polymer–layered silicate nanocomposites. Prog. Polym. Sci. 2008, 33, 1119–1198. [Google Scholar] [CrossRef]
- Caruso, M.M.; Davis, D.A.; Shen, Q.; Odom, S.A.; Sottos, N.R.; White, S.R.; Moore, J.S. Mechanically-induced chemical changes in polymeric materials. Chem. Rev. 2009, 109, 5755–5798. [Google Scholar] [CrossRef]
- Lionetto, F.; Maffezzoli, A. Rheological characterization of concentrated nanoclay dispersions in an organic solvent. Appl. Rheol. 2009, 19, 23423. [Google Scholar]
- Wagener, R.; Reisinger, T.J.G. A rheological method to compare the degree of exfoliation of nanocomposites. Polymer 2003, 44, 7513–7518. [Google Scholar] [CrossRef]
- Durmus, A.; Kasgoz, A.; Macosko, C.W. Linear low density polyethylene (LLDPE)/clay nanocomposites. Part I: Structural characterization and quantifying clay dispersion by melt rheology. Polymer 2007, 48, 4492–4502. [Google Scholar] [CrossRef]
- Fischer, D.; Müller, J.; Kummer, S.; Kretzschmar, B. Real time monitoring of morphologic and mechanical properties of polymer nanocomposites during extrusion by near infrared and ultrasonic spectroscopy. In Macromolecular Symposia; Wiley Online Library: Weinheim, Germany, 2011; Volume 305, pp. 10–17. [Google Scholar]
- Al-Malaika, S.; Sheena, H.; Fischer, D.; Masarati, E. Influence of processing and clay type on nanostructure and stability of polypropylene–clay nanocomposites. Polym. Degrad. Stab. 2013, 98, 2400–2410. [Google Scholar] [CrossRef]
- Wang, J.; Calhoun, M.D.; Severtson, S.J. Dynamic rheological study of paraffin wax and its organoclay nanocomposites. J. Appl. Polym. Sci. 2008, 108, 2564–2570. [Google Scholar] [CrossRef]
- Lionetto, F.; Maffezzoli, A.; Ottenhof, M.A.; Farhat, I.A.; Mitchell, J.R. Ultrasonic investigation of wheat starch retrogradation. J. Food Eng. 2006, 75, 258–266. [Google Scholar] [CrossRef]
- Lionetto, F.; Coluccia, G.; D’Antona, P.; Maffezzoli, A. Gelation of waxy crude oils by ultrasonic and dynamic mechanical analysis. Rheol. Acta 2007, 46, 601–609. [Google Scholar] [CrossRef]
- Ahn, E.; Kim, H.; Sim, S.-H.; Shin, S.; Shin, M. Principles and applications of ultrasonic-based nondestructive methods for self-healing in cementitious materials. Materials 2017, 10, 278. [Google Scholar] [CrossRef]
- Skaltsas, T.; Ke, X.; Bittencourt, C.; Tagmatarchis, N. Ultrasonication induces oxygenated species and defects onto exfoliated graphene. J. Phys. Chem. C 2013, 117, 23272–23278. [Google Scholar] [CrossRef]
- Polyakova, E.Y.; Rim, K.T.; Eom, D.; Douglass, K.; Opila, R.L.; Heinz, T.F.; Teplyakov, A.V.; Flynn, G.W. Scanning tunneling microscopy and X-ray photoelectron spectroscopy studies of graphene films prepared by sonication-assisted dispersion. Acs Nano 2011, 5, 6102–6108. [Google Scholar] [CrossRef]
- Yang, D.; Velamakanni, A.; Bozoklu, G.; Park, S.; Stoller, M.; Piner, R.D.; Stankovich, S.; Jung, I.; Field, D.A.; Ventrice Jr, C.A. Chemical analysis of graphene oxide films after heat and chemical treatments by X-ray photoelectron and Micro-Raman spectroscopy. Carbon 2009, 47, 145–152. [Google Scholar] [CrossRef]
- Makino, K.; Mossoba, M.M.; Riesz, P. Chemical effects of ultrasound on aqueous solutions. Formation of hydroxyl radicals and hydrogen atoms. J. Phys. Chem. 1983, 87, 1369–1377. [Google Scholar] [CrossRef]


| Sample | ΔHm (J/g) | Tm (°C) | ΔHc (J/g) | Tc (°C) |
|---|---|---|---|---|
| PW | 148.1 | 61.3 | 154.4 | 56.6 |
| EG–PW Stirred | 142.3 | 61.5 | 147.1 | 56.1 |
| EG–PW US30 | 129.1 | 62.9 | 135.2 | 54.6 |
| CW | 167.4 | 65.5 | 170.4 | 65.7 / 60.8 / 54.8 |
| EG–CW Stirred | 142.1 | 62.6 | 135.5 | 69.2 / 59.3 / 54.5 |
| EG–CW US30 | 144.4 | 61.1 | 139.8 | 68.9 / 58.7 / 55.5 |
| Sample | Residual Weight at 550 °C (%) | TDTG1 (°C) | TDTG2 (°C) |
|---|---|---|---|
| PW | 0.05 | 291.2 | - |
| EG–PW Stirred | 10.1 | 295.7 | - |
| EG–PW US30 | 10.4 | 307.2 | - |
| CW | 0.03 | 285.6 | 381 |
| EG–CW Stirred | 10.3 | 291.6 | 396 |
| EG–CW US30 | 10.2 | 309.9 | 392 |
| Sample | Angle 2θ (°) | d002 (Å) | FWHM (°) | Lc (Å) |
|---|---|---|---|---|
| PW–EGStirred | 26.45 | 3.36 | 0.221 | 385 ± 20 |
| PW–EG Us-3030 | 26.40 | 3.37 | 0.267 | 319 ± 6 |
| CW–EGStirred | 26.46 | 3.36 | 0.326 | 262 ± 3 |
| CW–EGUs-3030 | 26.45 | 3.36 | 0.374 | 228 ± 2 |
| Sample | γcrit (%) | n - | R2 |
|---|---|---|---|
| EG–PW Stirred | 0.057 | 0.73 | 0.998 |
| EG–PW US30 | 0.045 | 0.81 | 0.999 |
| EG–CW Stirred | 0.070 | 0.71 | 0.999 |
| EG–CW US30 | 0.034 | 0.91 | 0.999 |
| Sample | Signal | Assignment | Binding Energy (eV) | Peak Area (%) |
|---|---|---|---|---|
| EG | C1s | C=C | 284.78 | 73.55 |
| C-C | 285.22 | 16.36 | ||
| C-O | 286.36 | 8.86 | ||
| C=O | 287.56 | 1.24 | ||
| EG–PW US30 | C1s | C=C | 284.63 | 60.67 |
| C-C | 285.49 | 30.20 | ||
| C-O | 286.77 | 2.84 | ||
| C=O | 287.62 | 6.29 | ||
| EG–CW US30 | C1s | C=C | 284.67 | 64.37 |
| C-C | 285.31 | 17.45 | ||
| C-O | 285.79 | 12.70 | ||
| C=O | 286.63 | 3.73 | ||
| Other | 1.75 |
© 2019 by the authors. Licensee MDPI, Basel, Switzerland. This article is an open access article distributed under the terms and conditions of the Creative Commons Attribution (CC BY) license (http://creativecommons.org/licenses/by/4.0/).
Share and Cite
Lionetto, F.; López-Muñoz, R.; Espinoza-González, C.; Mis-Fernández, R.; Rodríguez-Fernández, O.; Maffezzoli, A. A Study on Exfoliation of Expanded Graphite Stacks in Candelilla Wax. Materials 2019, 12, 2530. https://doi.org/10.3390/ma12162530
Lionetto F, López-Muñoz R, Espinoza-González C, Mis-Fernández R, Rodríguez-Fernández O, Maffezzoli A. A Study on Exfoliation of Expanded Graphite Stacks in Candelilla Wax. Materials. 2019; 12(16):2530. https://doi.org/10.3390/ma12162530
Chicago/Turabian StyleLionetto, Francesca, Roberto López-Muñoz, Carlos Espinoza-González, Ricardo Mis-Fernández, Oliverio Rodríguez-Fernández, and Alfonso Maffezzoli. 2019. "A Study on Exfoliation of Expanded Graphite Stacks in Candelilla Wax" Materials 12, no. 16: 2530. https://doi.org/10.3390/ma12162530
APA StyleLionetto, F., López-Muñoz, R., Espinoza-González, C., Mis-Fernández, R., Rodríguez-Fernández, O., & Maffezzoli, A. (2019). A Study on Exfoliation of Expanded Graphite Stacks in Candelilla Wax. Materials, 12(16), 2530. https://doi.org/10.3390/ma12162530