A Three-Dimensional Elastic-Plastic Contact Analysis of Vickers Indenter on a Deep Drawing Quality Steel Sheet


Abstract
1. Introduction
2. Theoretical Background
3. Material
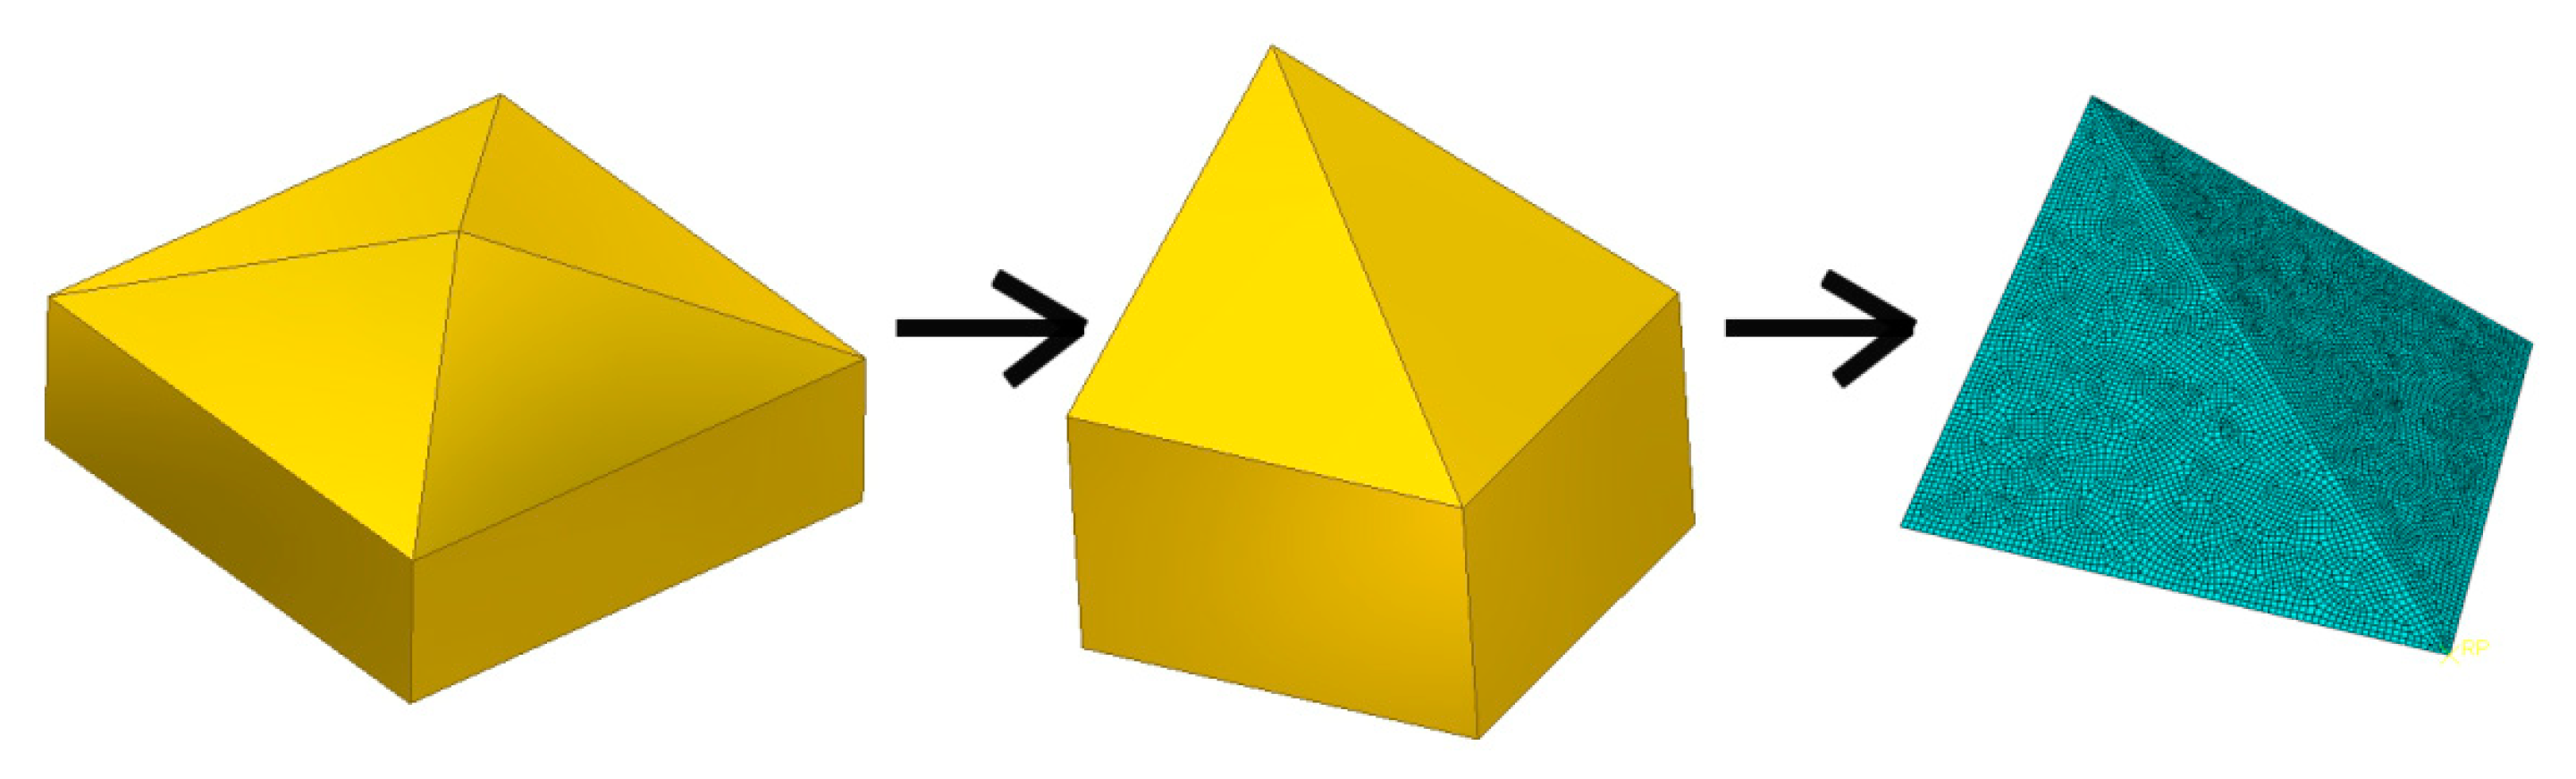
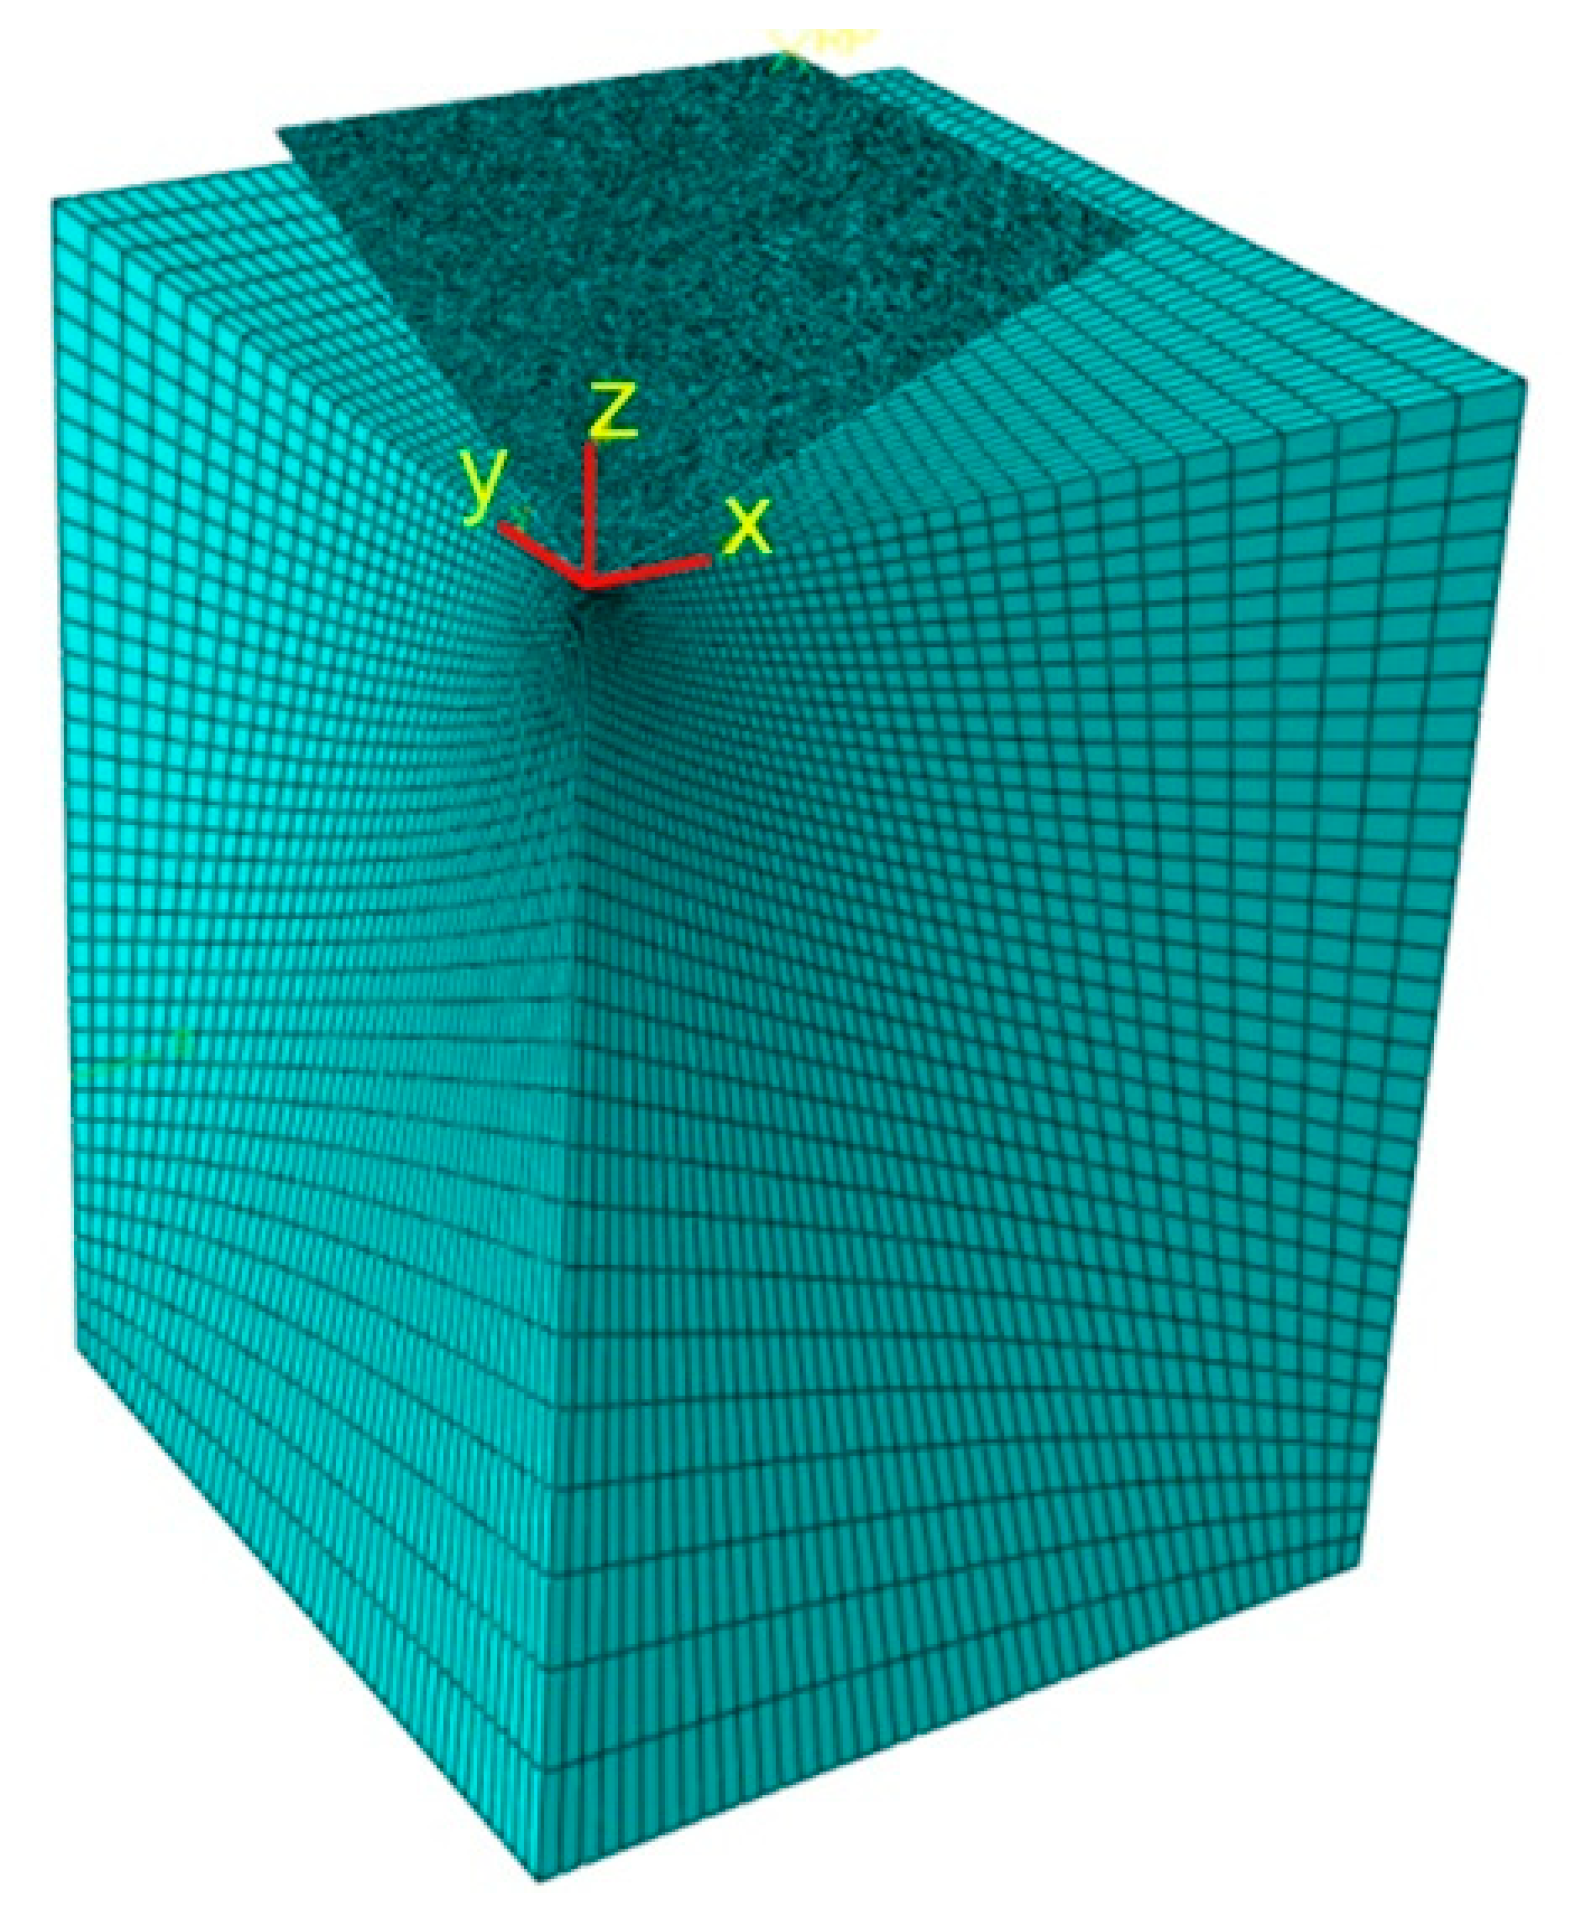
4. Numerical Modeling
4.1. Geometry and Boundary Conditions
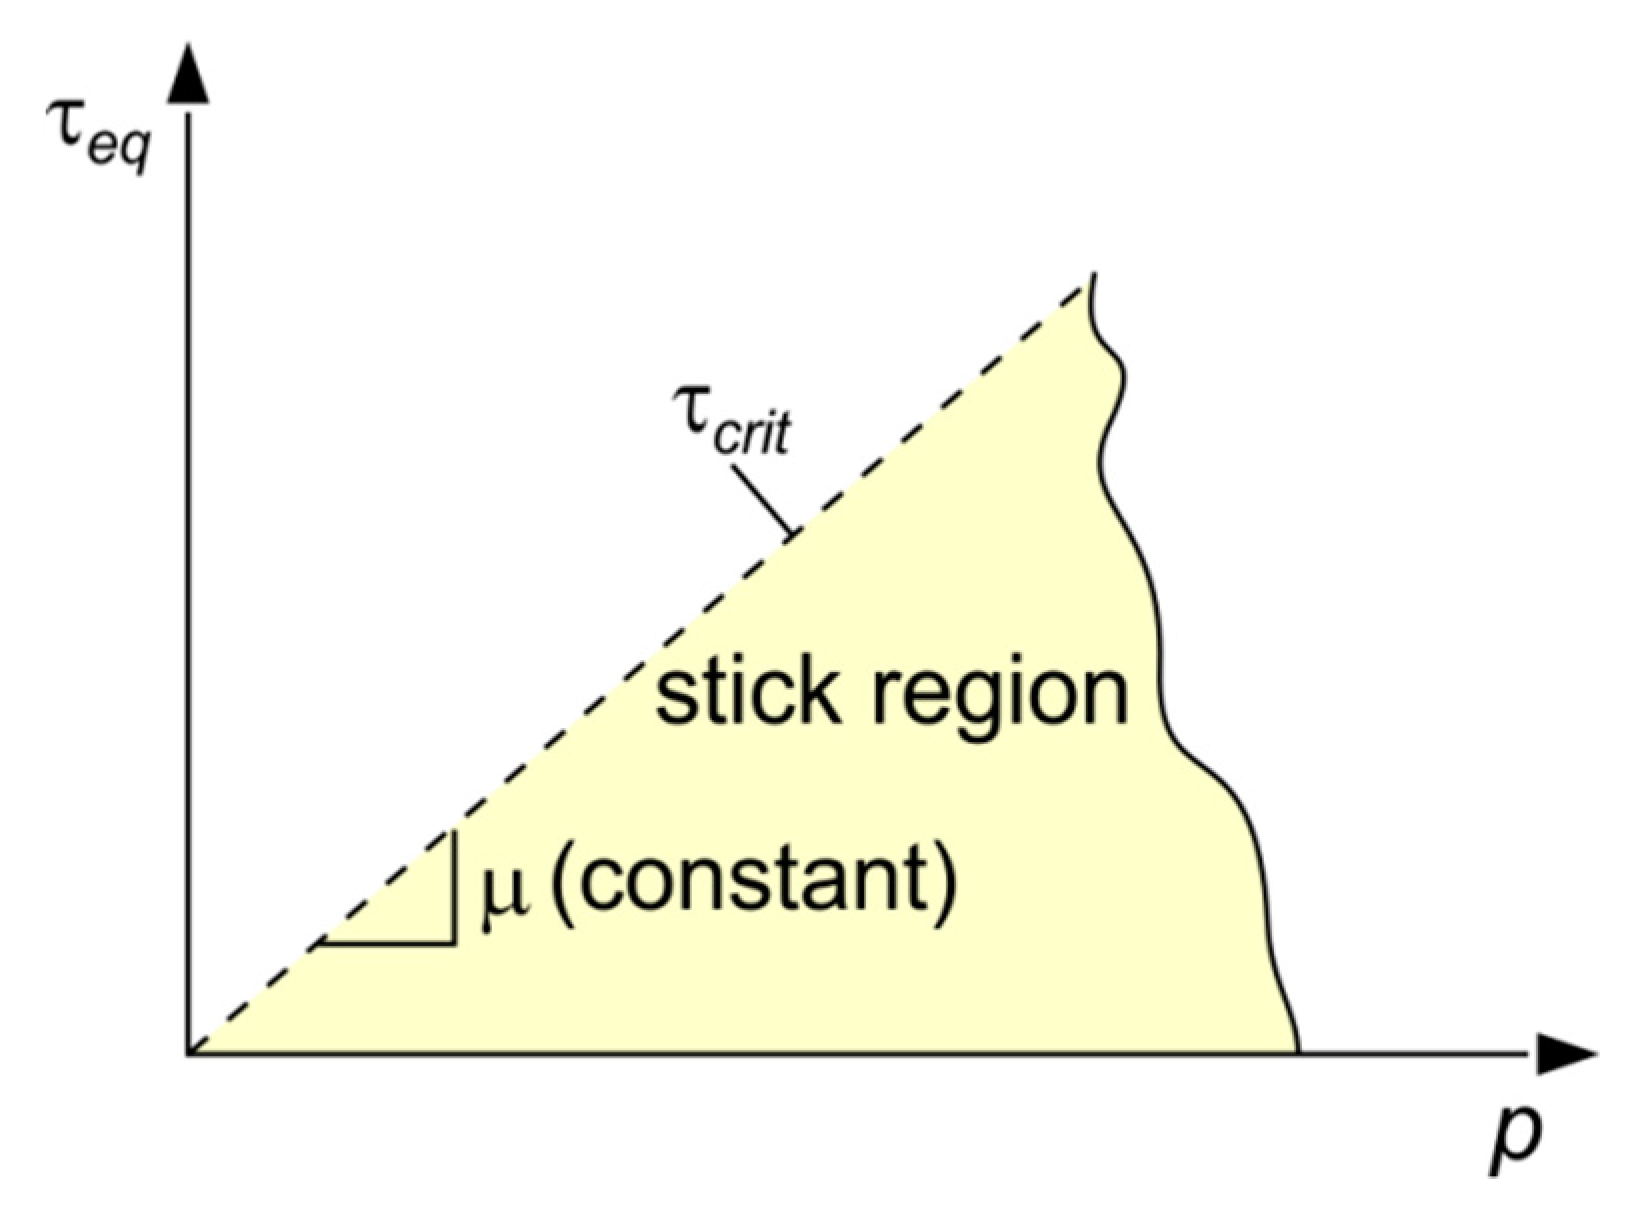
4.2. Contact Conditions
4.3. Material
5. Results and Discussion
6. Conclusions
- The hardness values seem to be influenced by the value of friction coefficient due to the pile-up phenomenon observed;
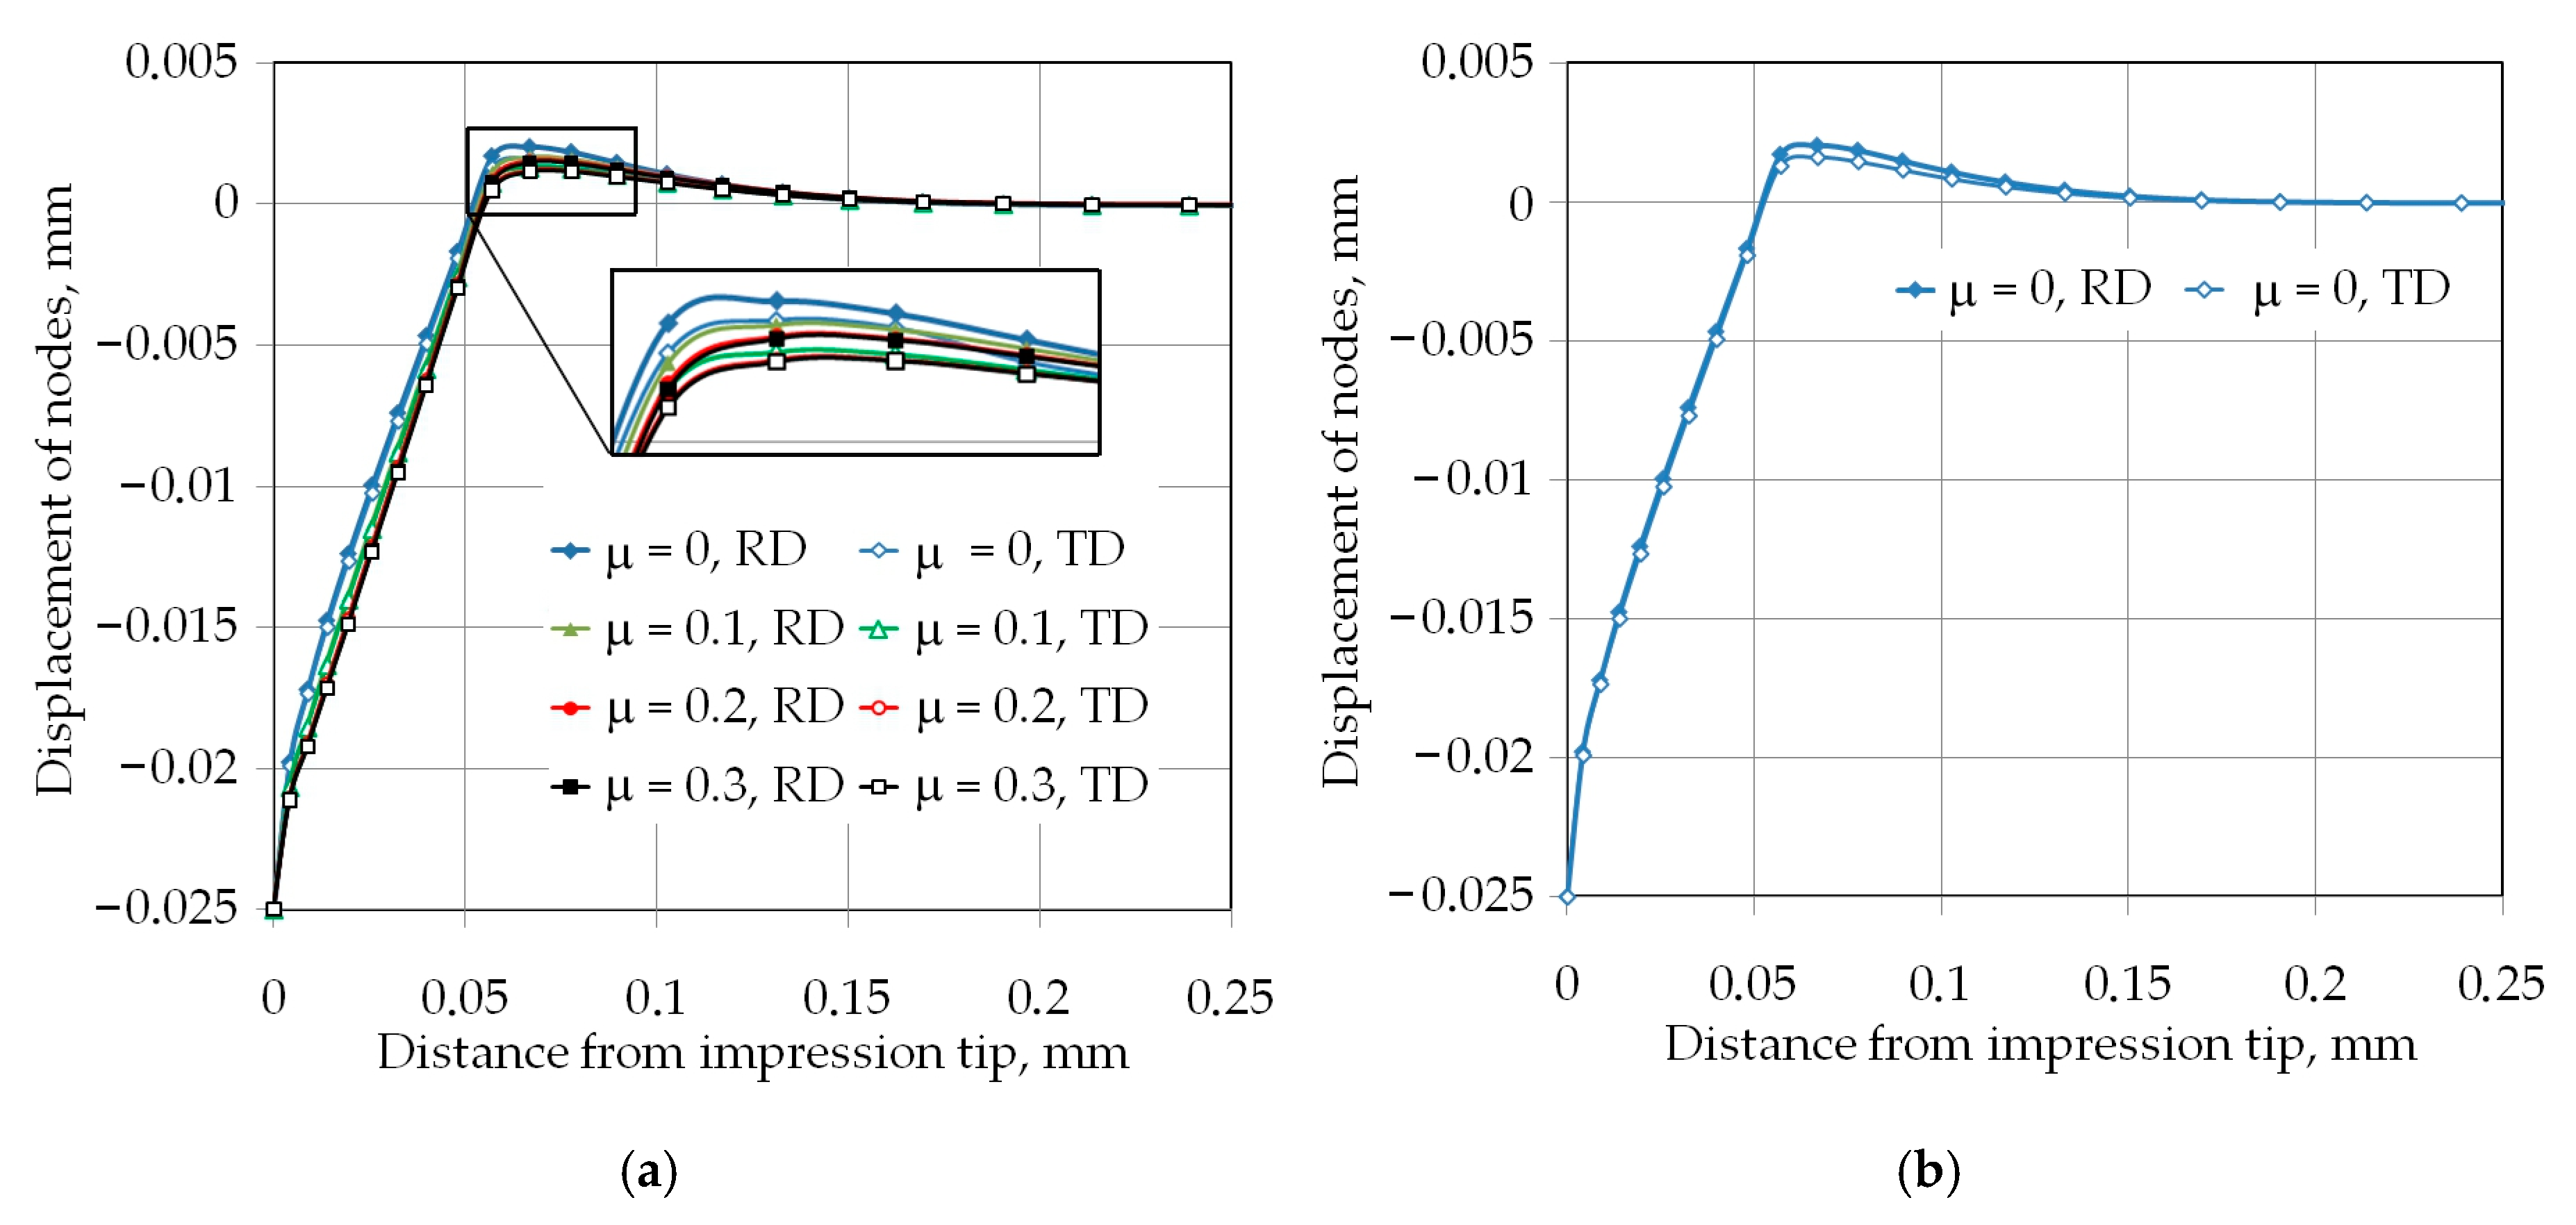
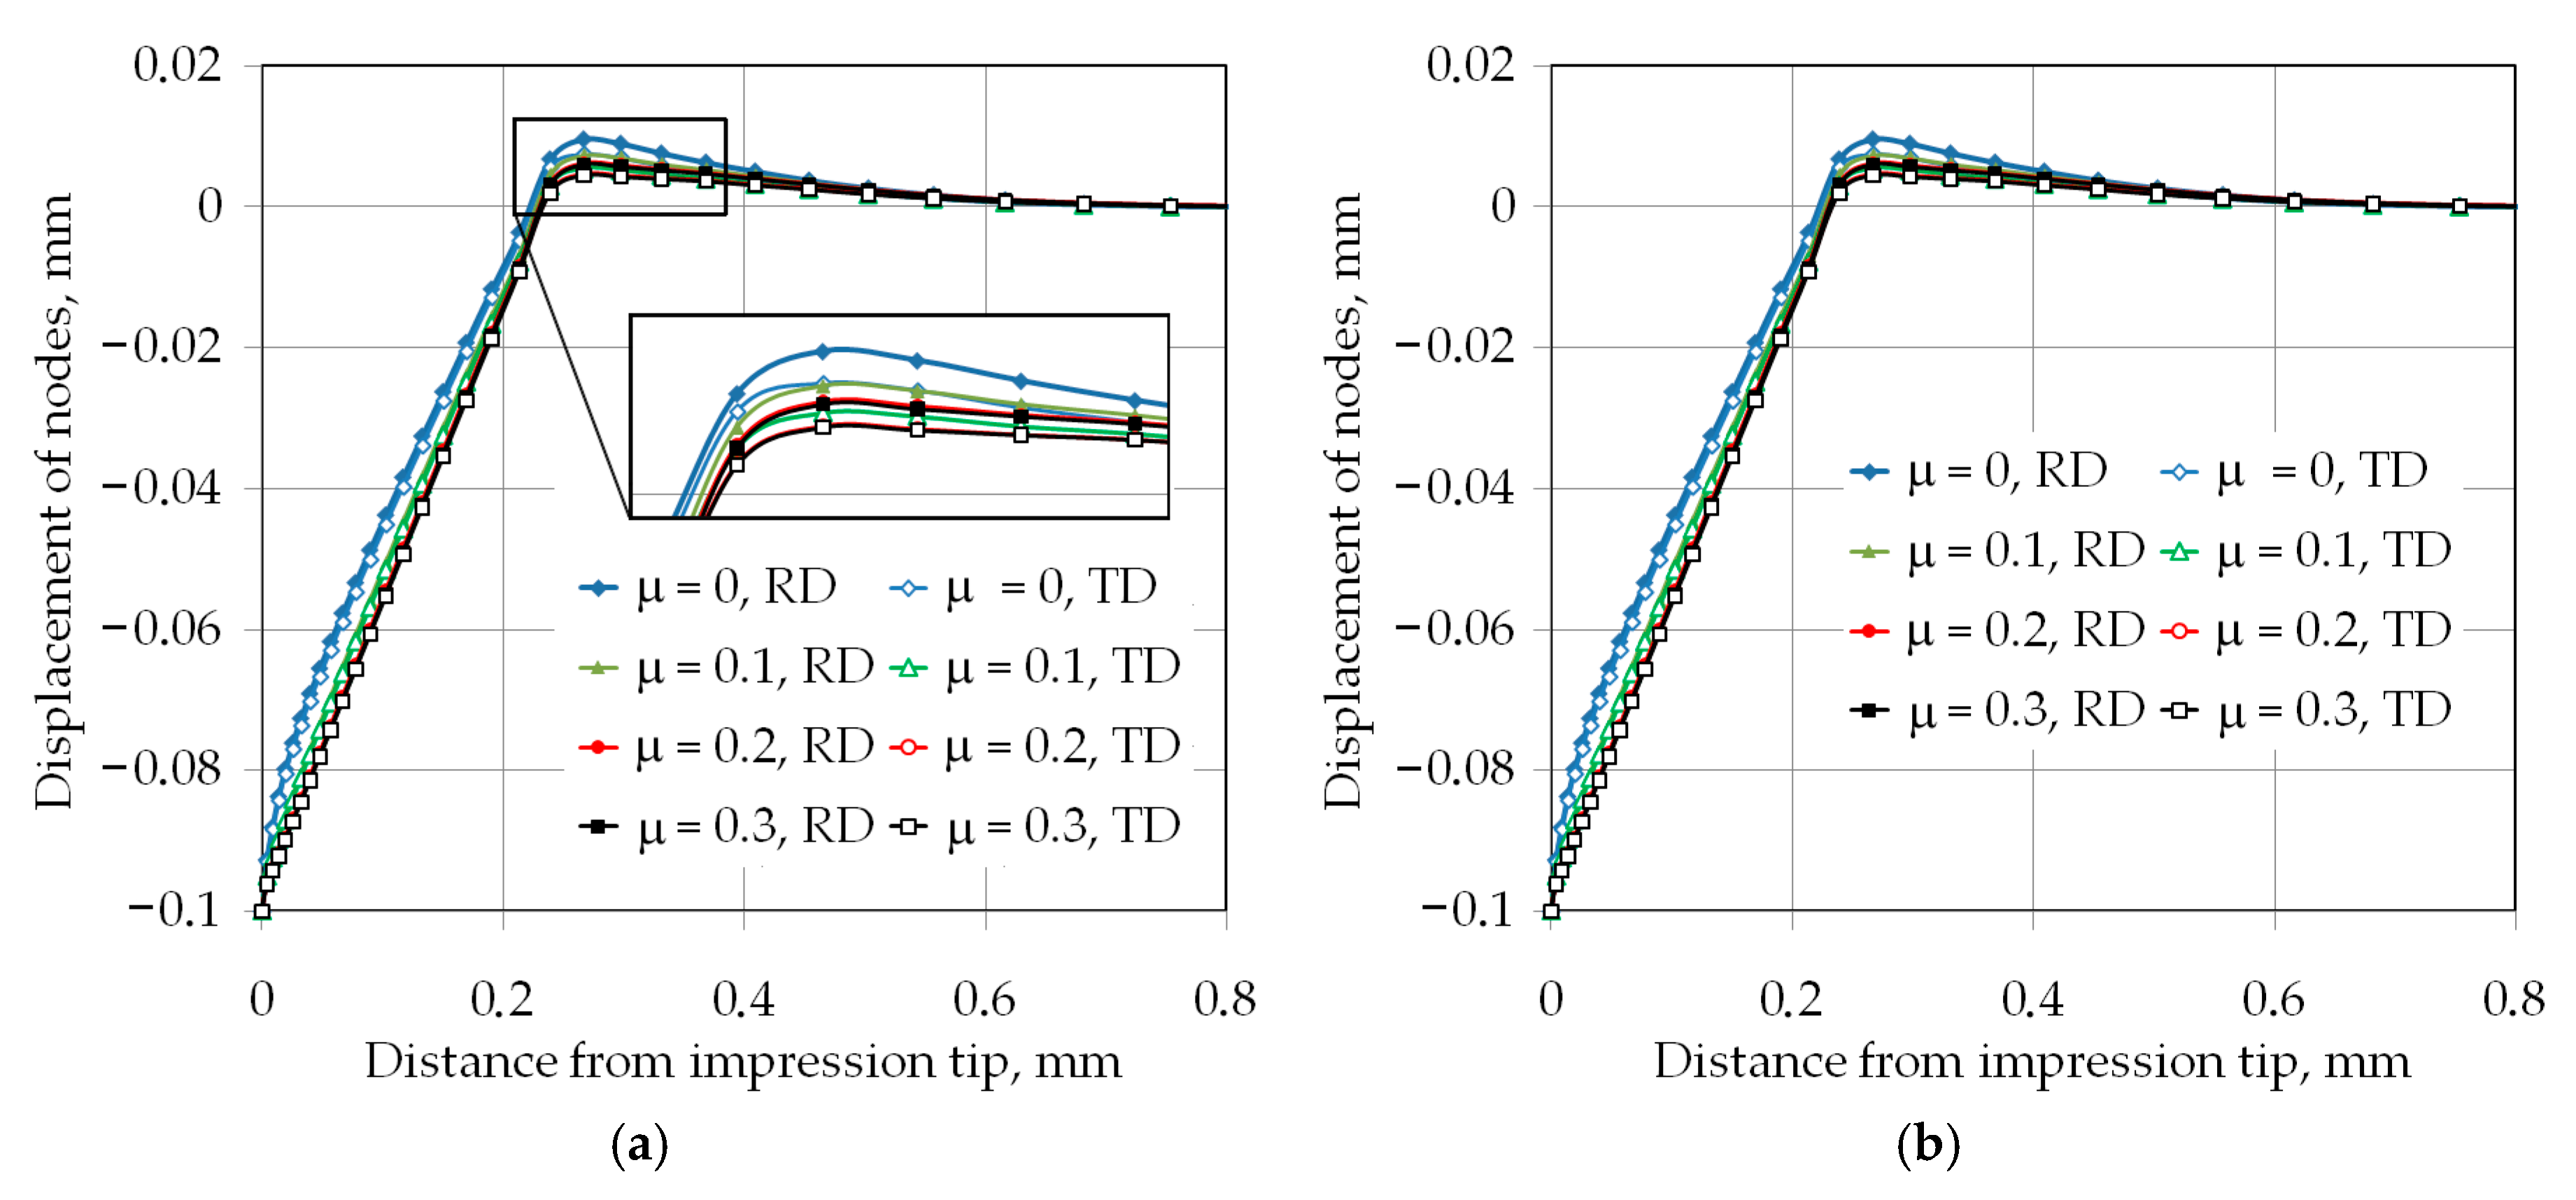
- The increasing of the friction coefficient led to decrease of pile-up value. Moreover, the width of the pile-ups differed from each other at the two perpendicular directions of measurement. This phenomenon may be attributed primarily to the anisotropy of material properties, and in a lesser extent with the friction coefficient value;
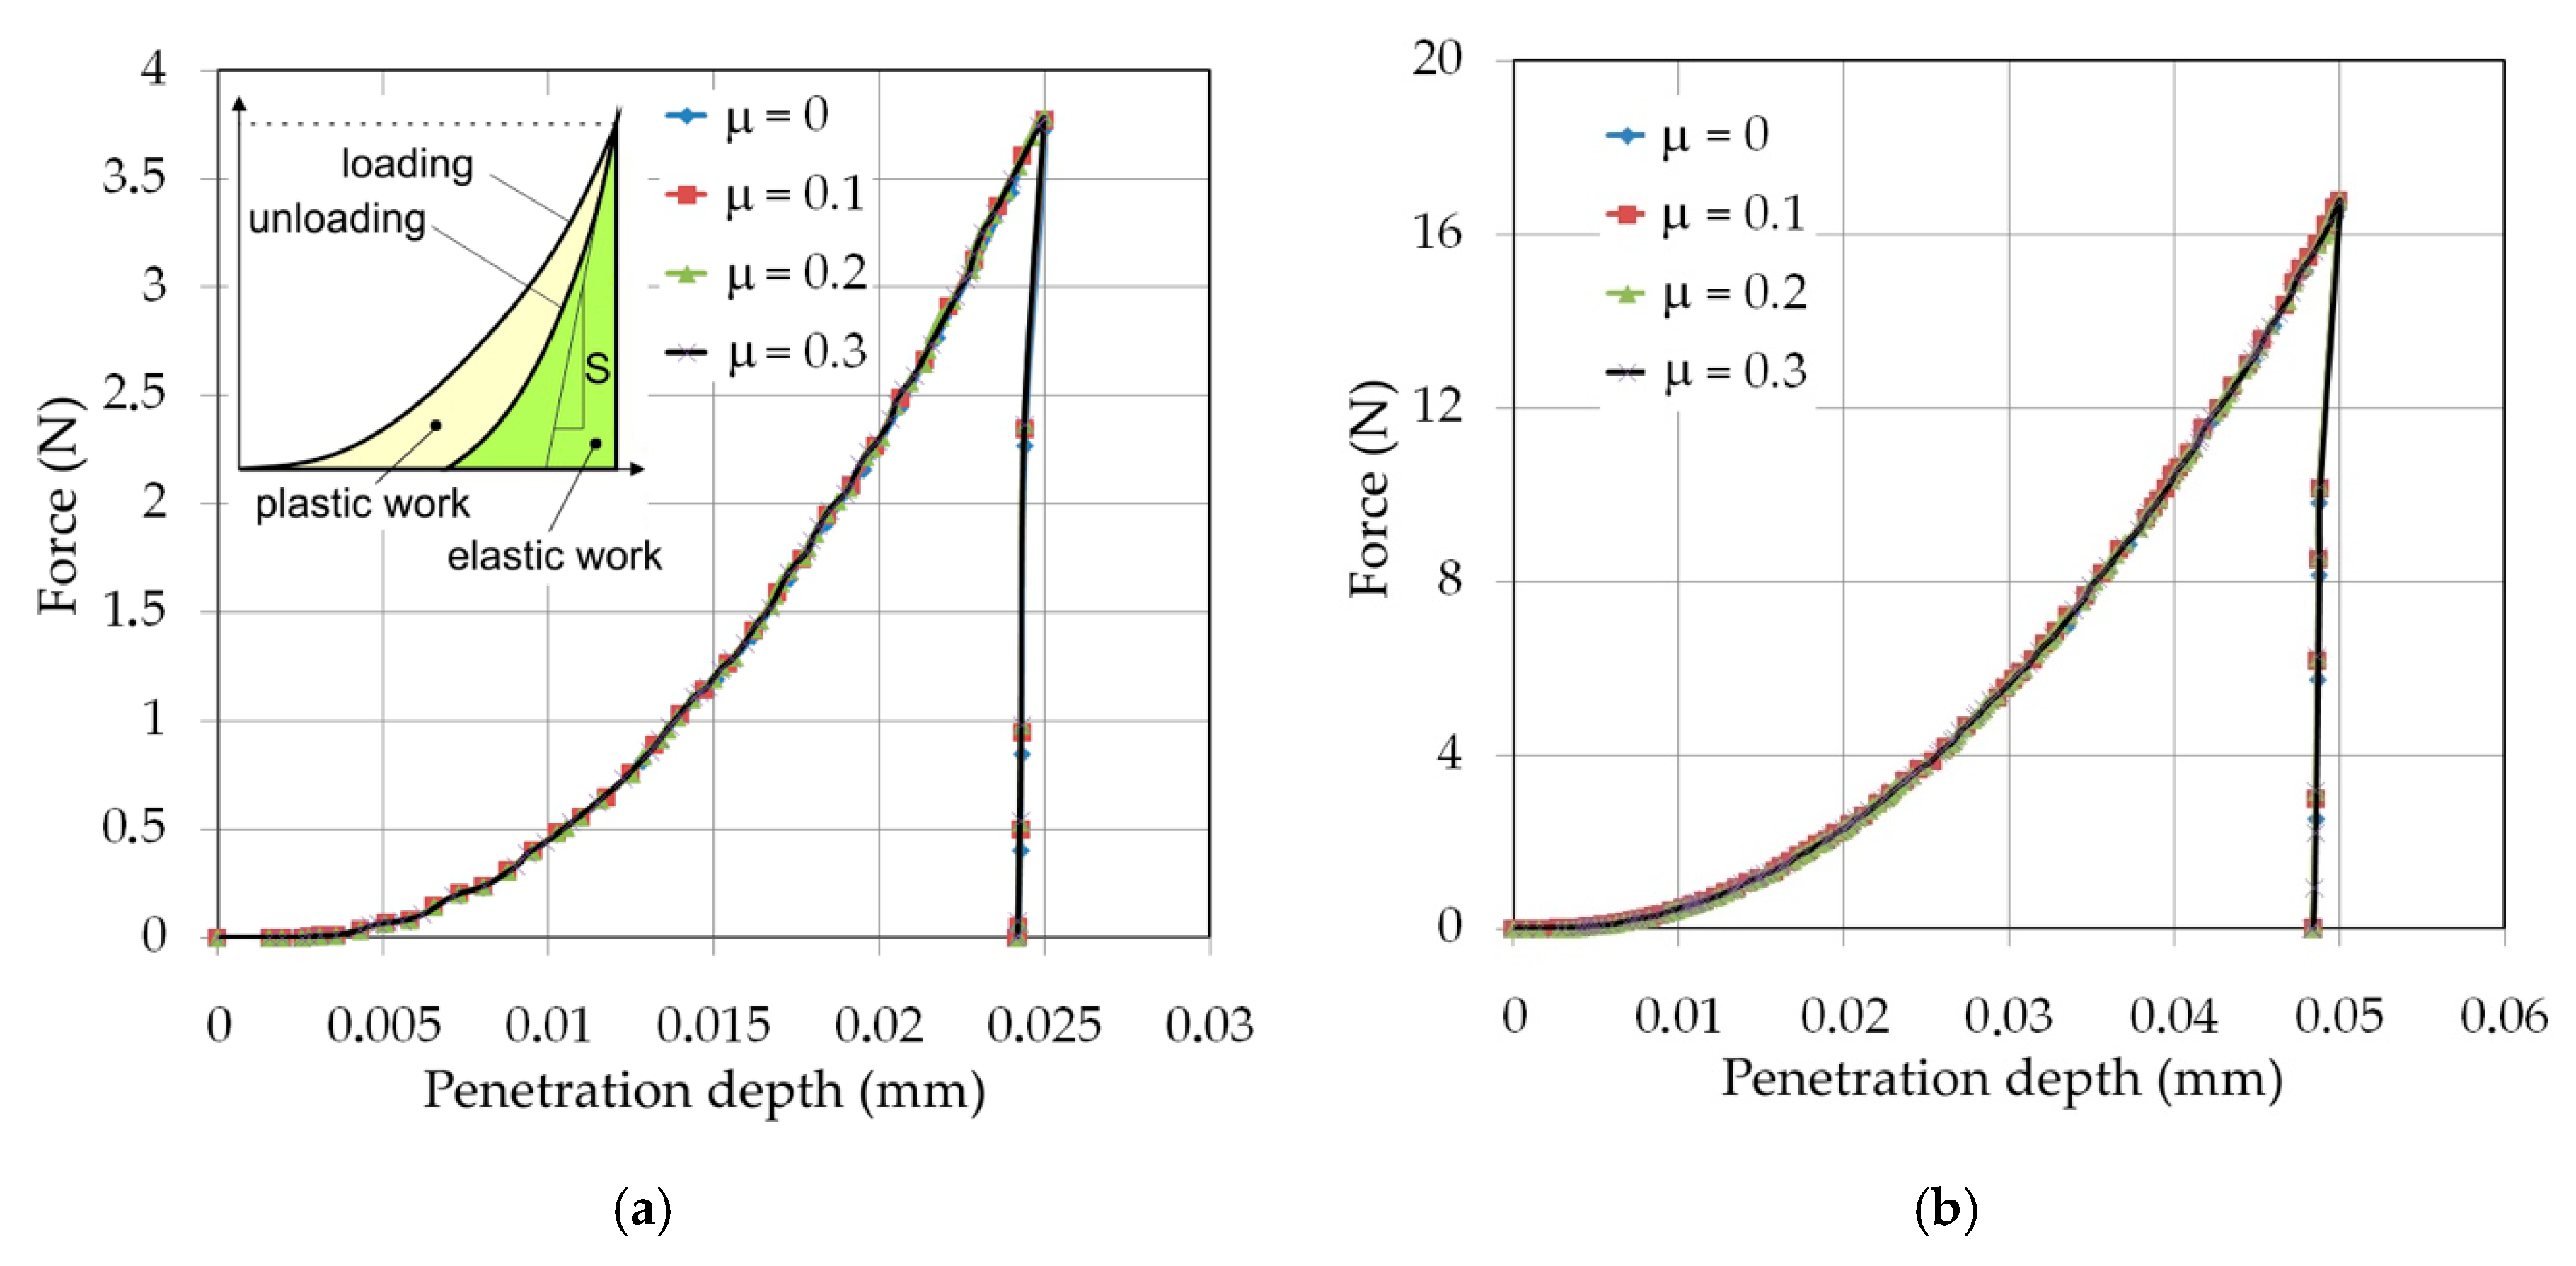
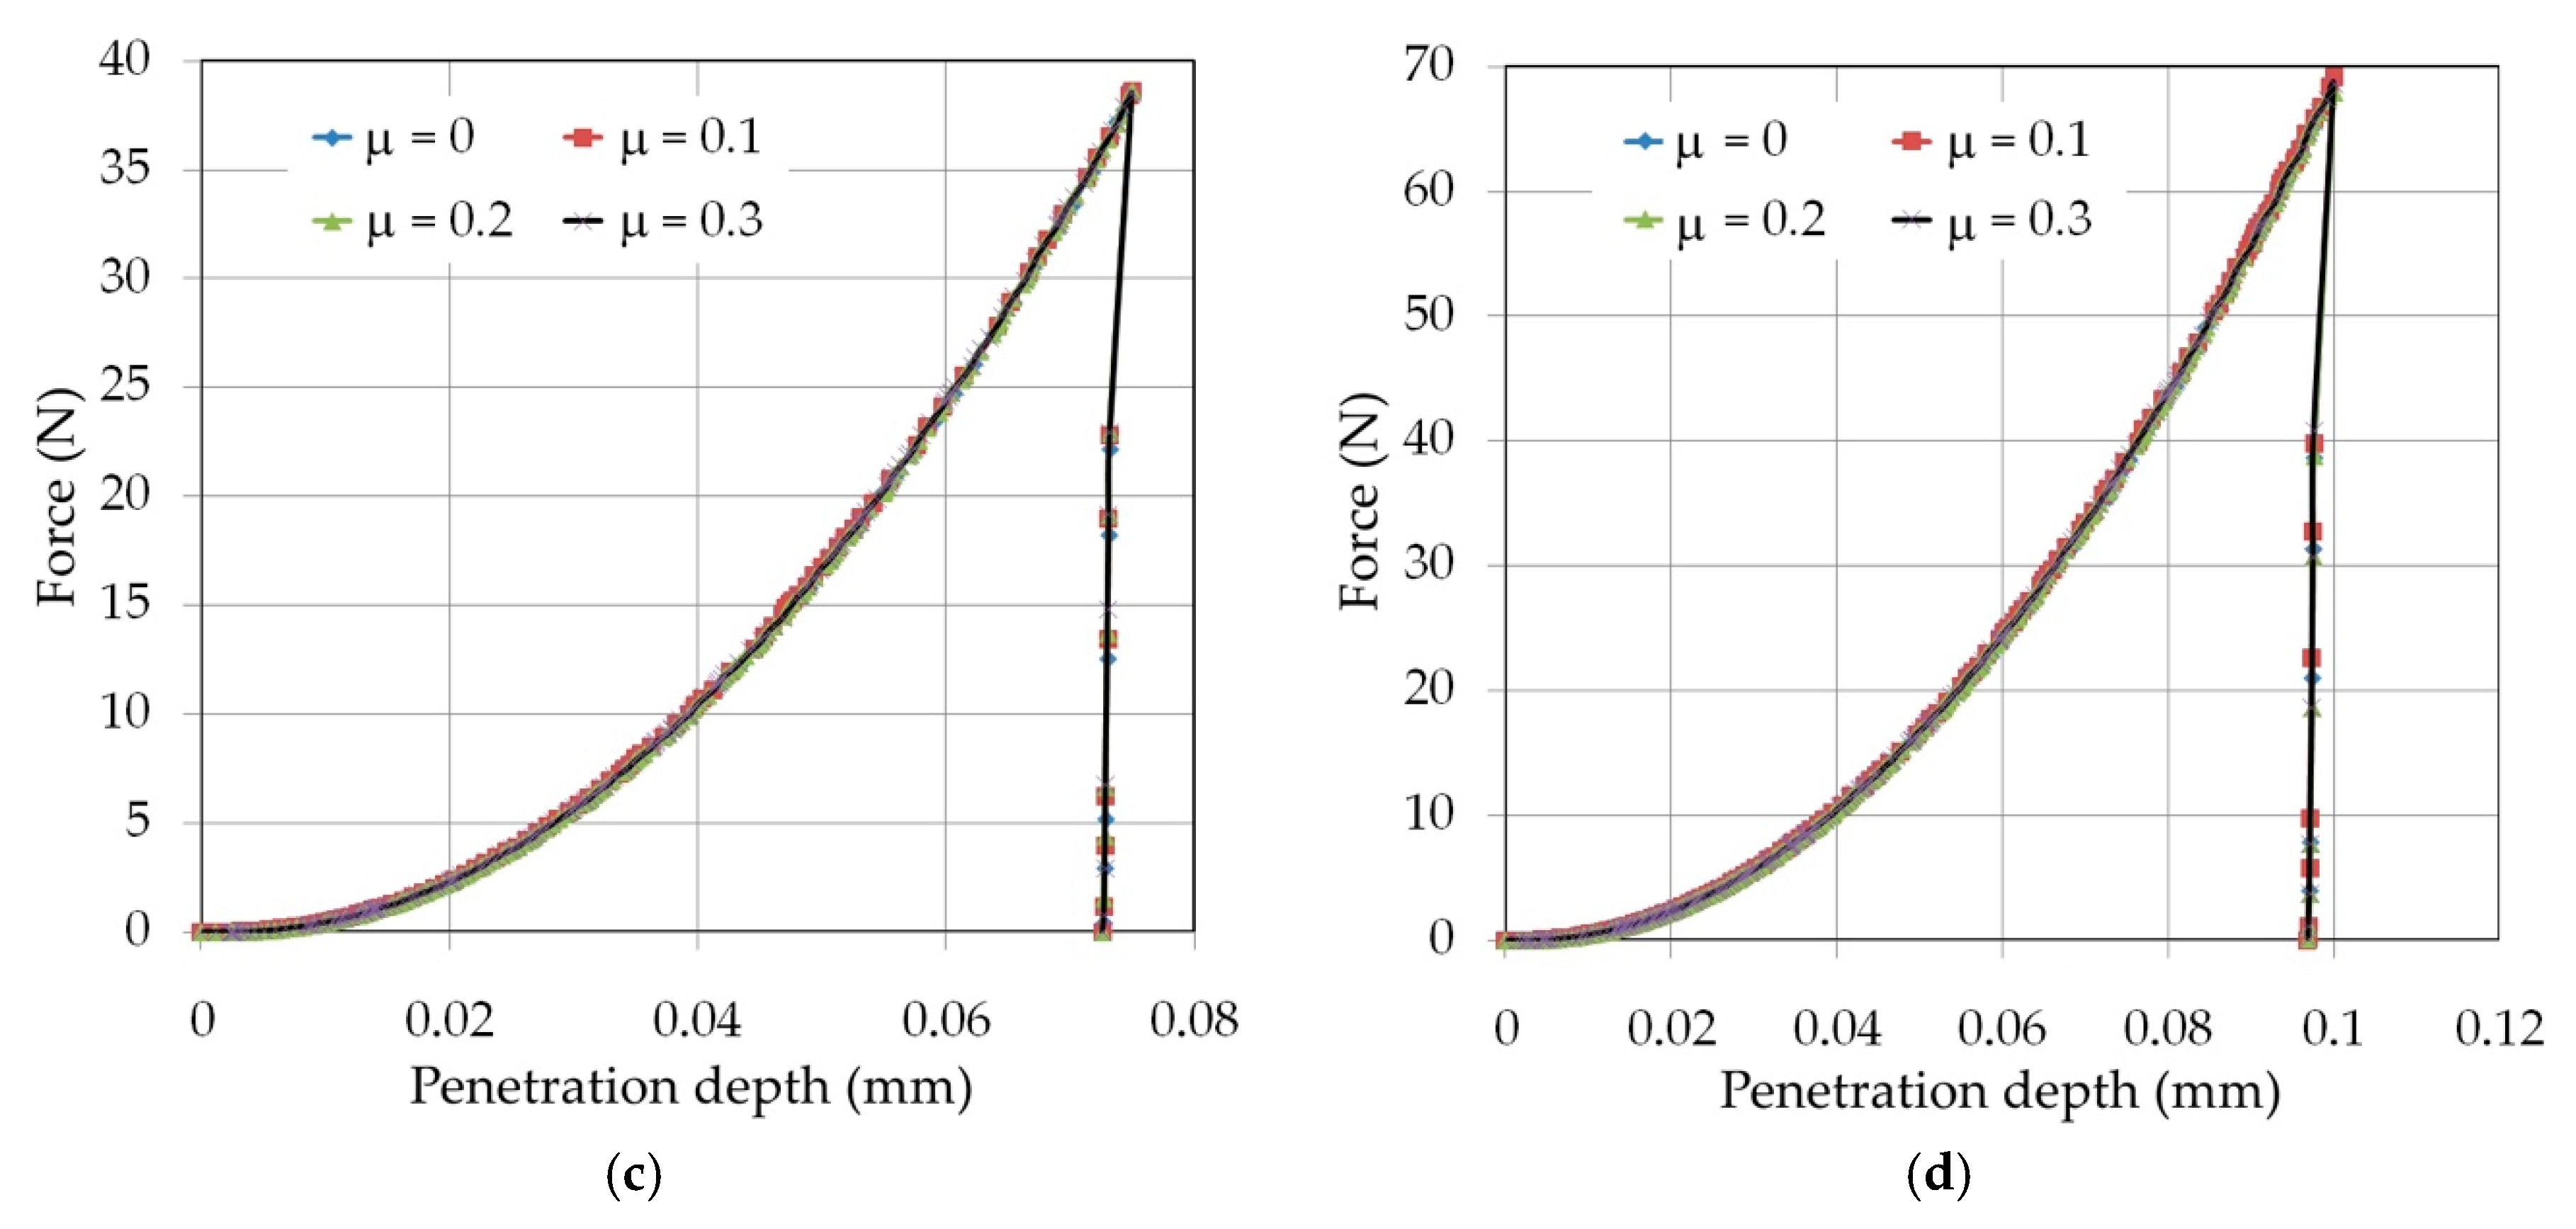
- Frictional conditions did not show a significant effect on the maximum force and the character of load-displacement curves;
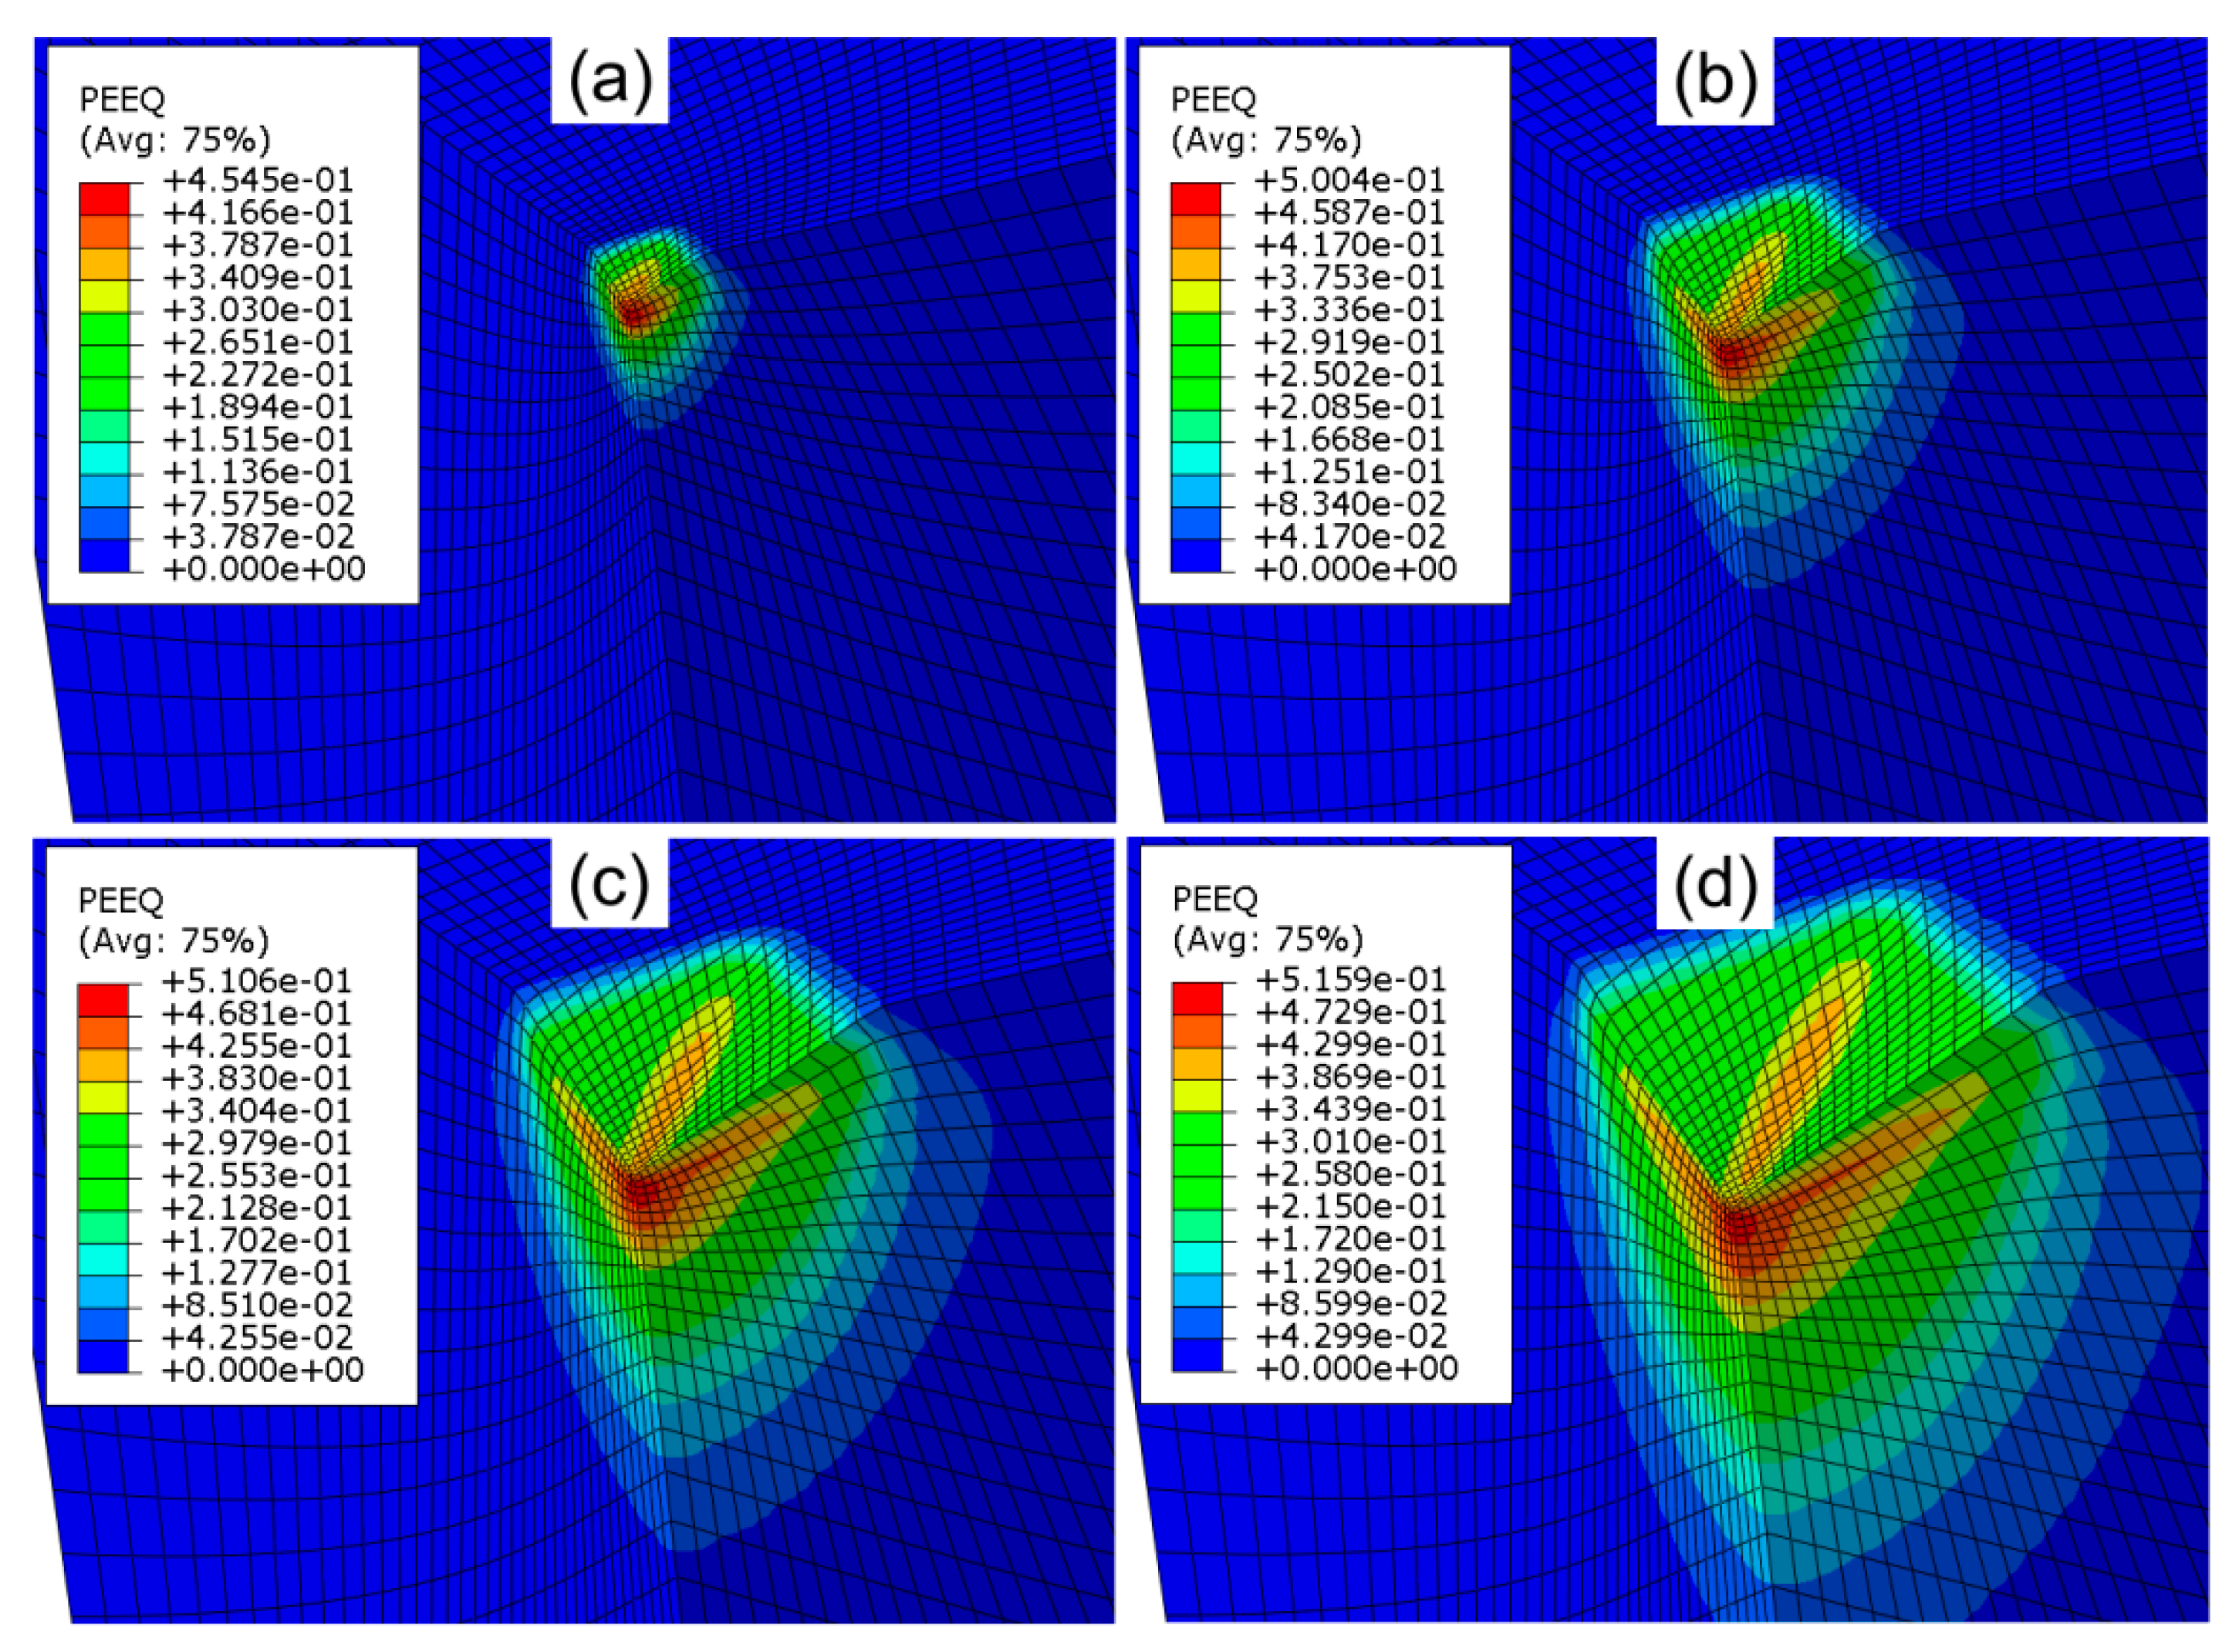
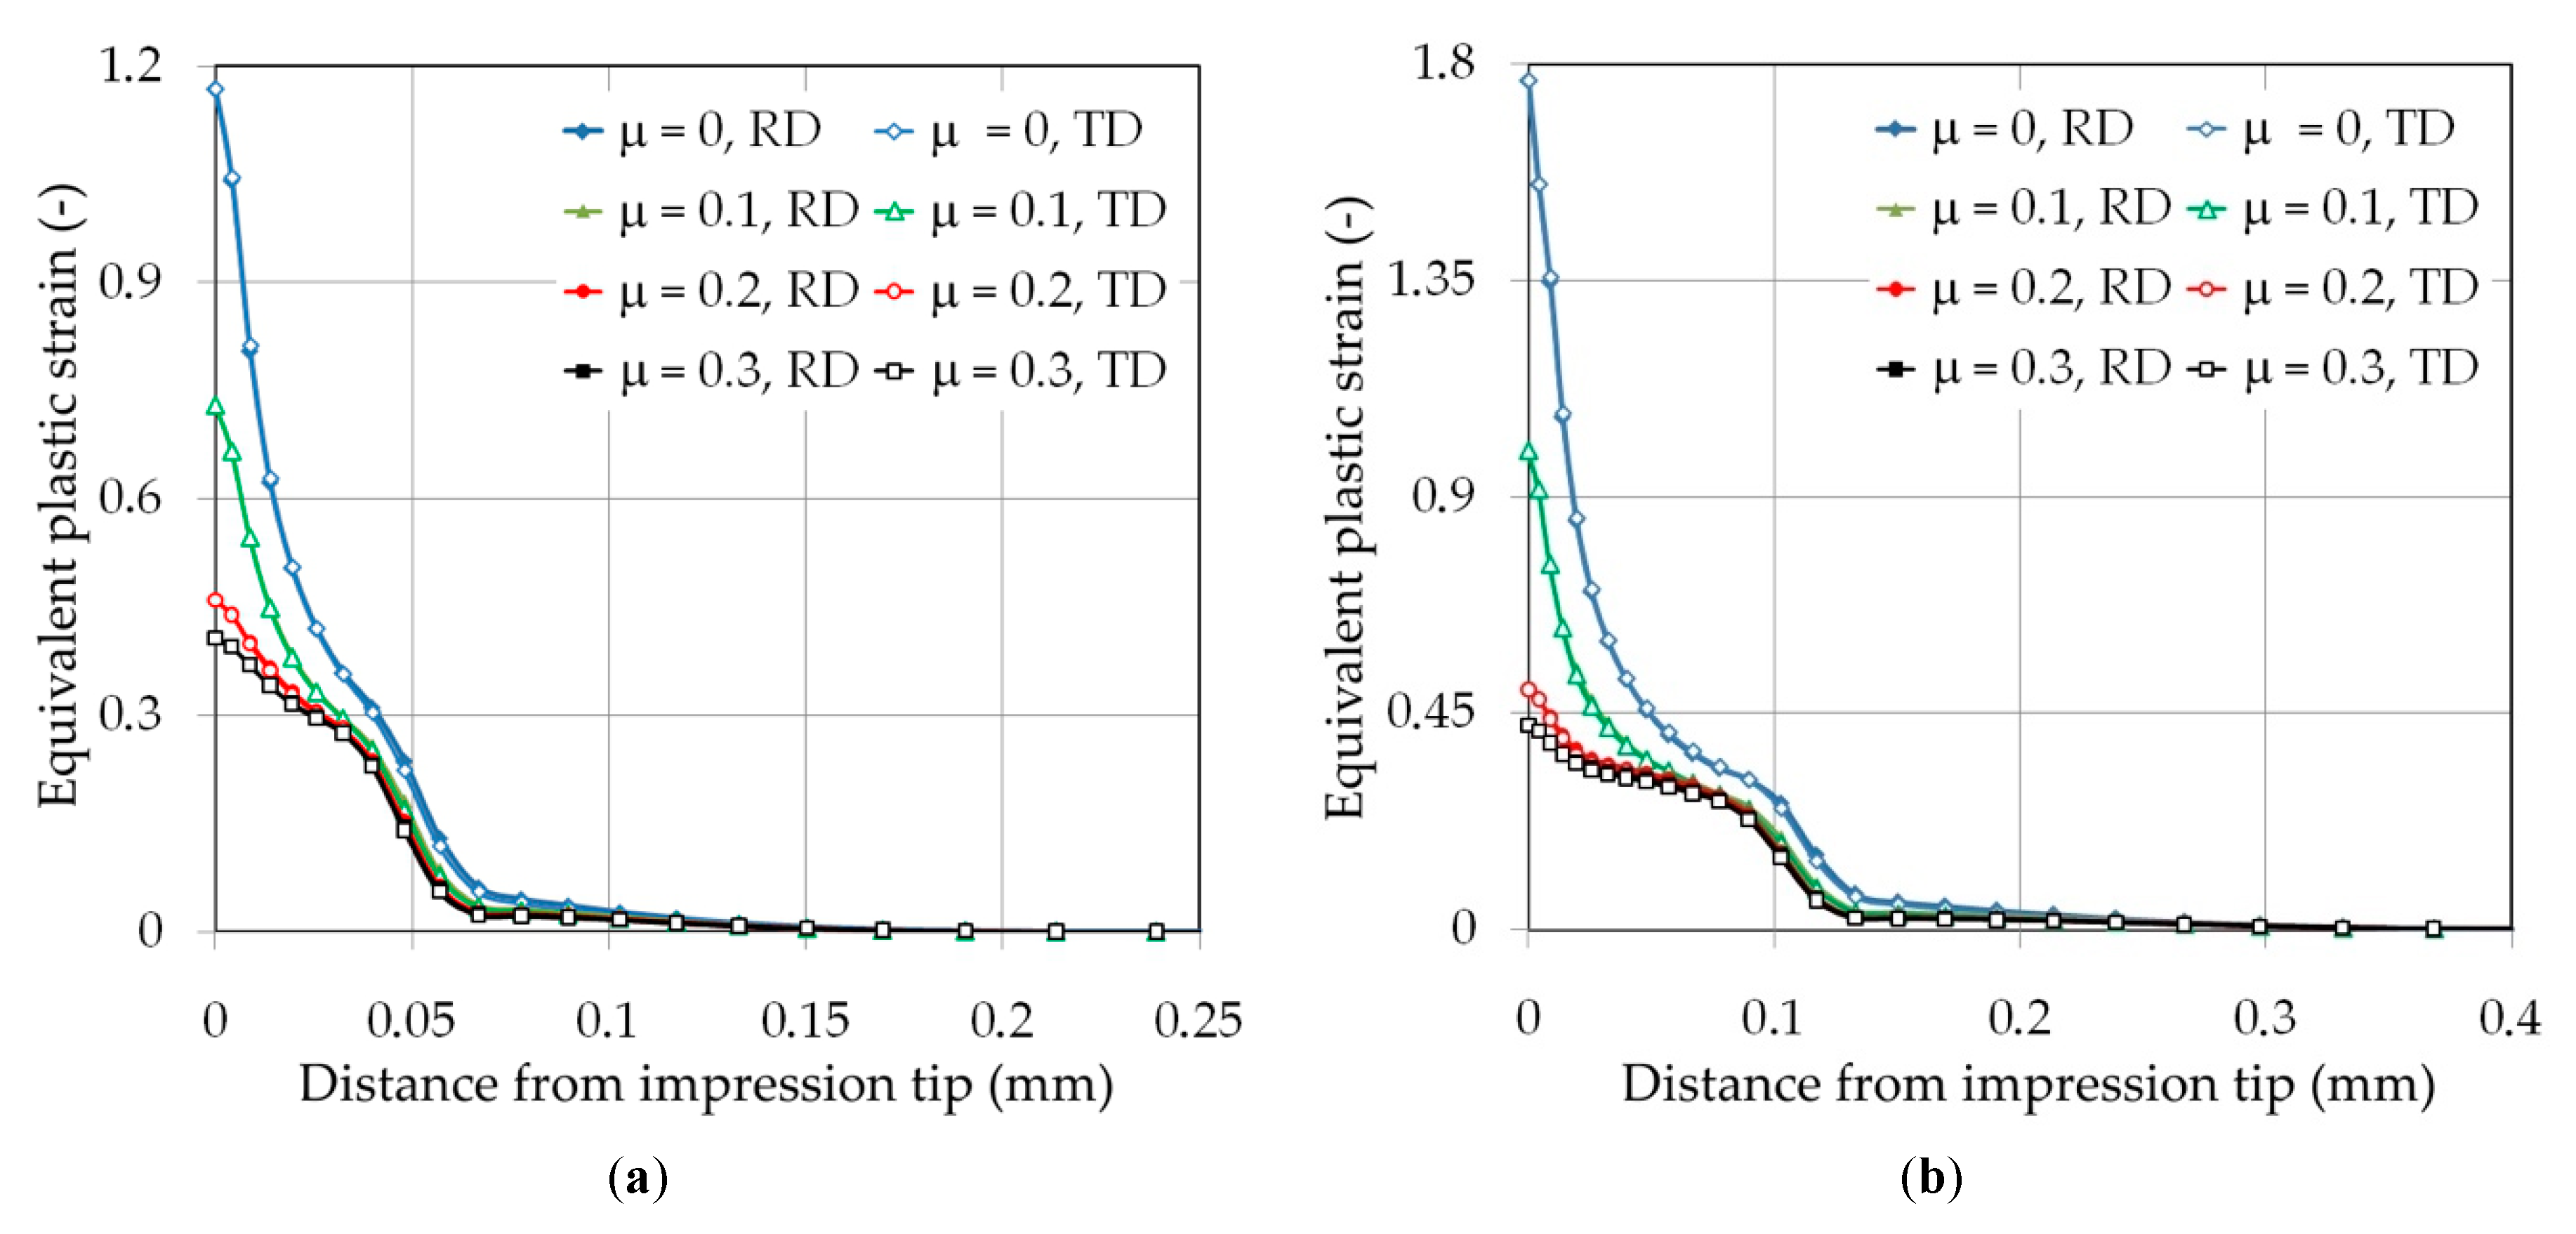
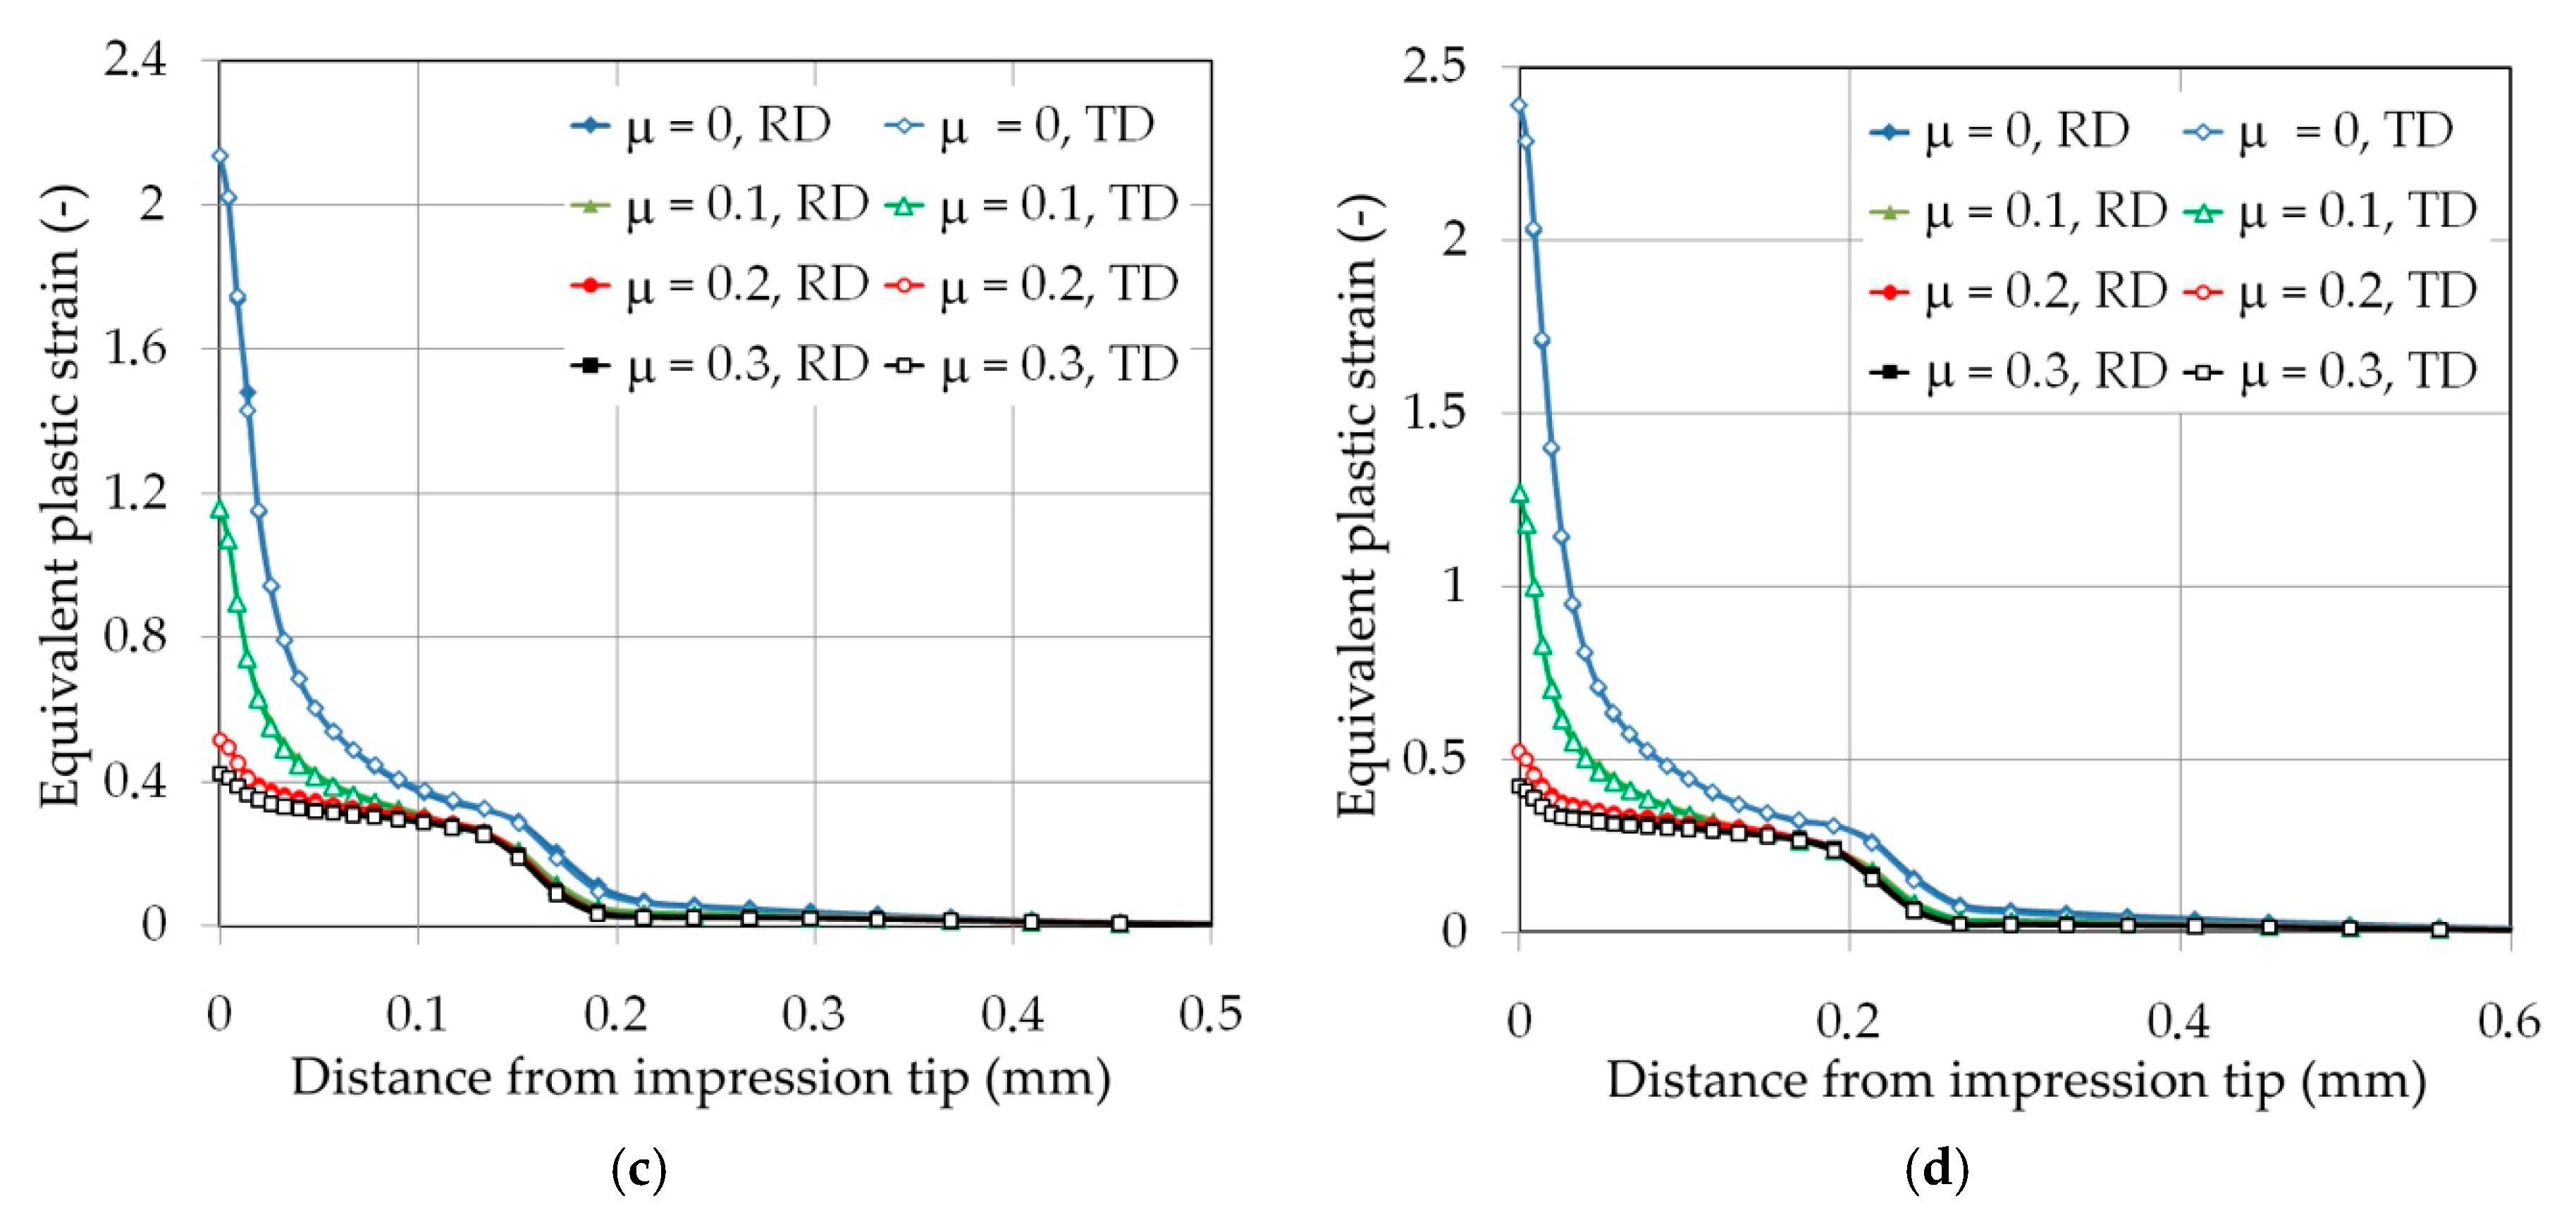
- Although the effect of the friction coefficient value on the value of equivalent plastic strain in the area of impression tip is distinct, the difference between the values of an equivalent plastic strain measured at RD and TD increased with increasing distance from the impression tip and reached 8%–19% depending on friction conditions and indenter displacement;
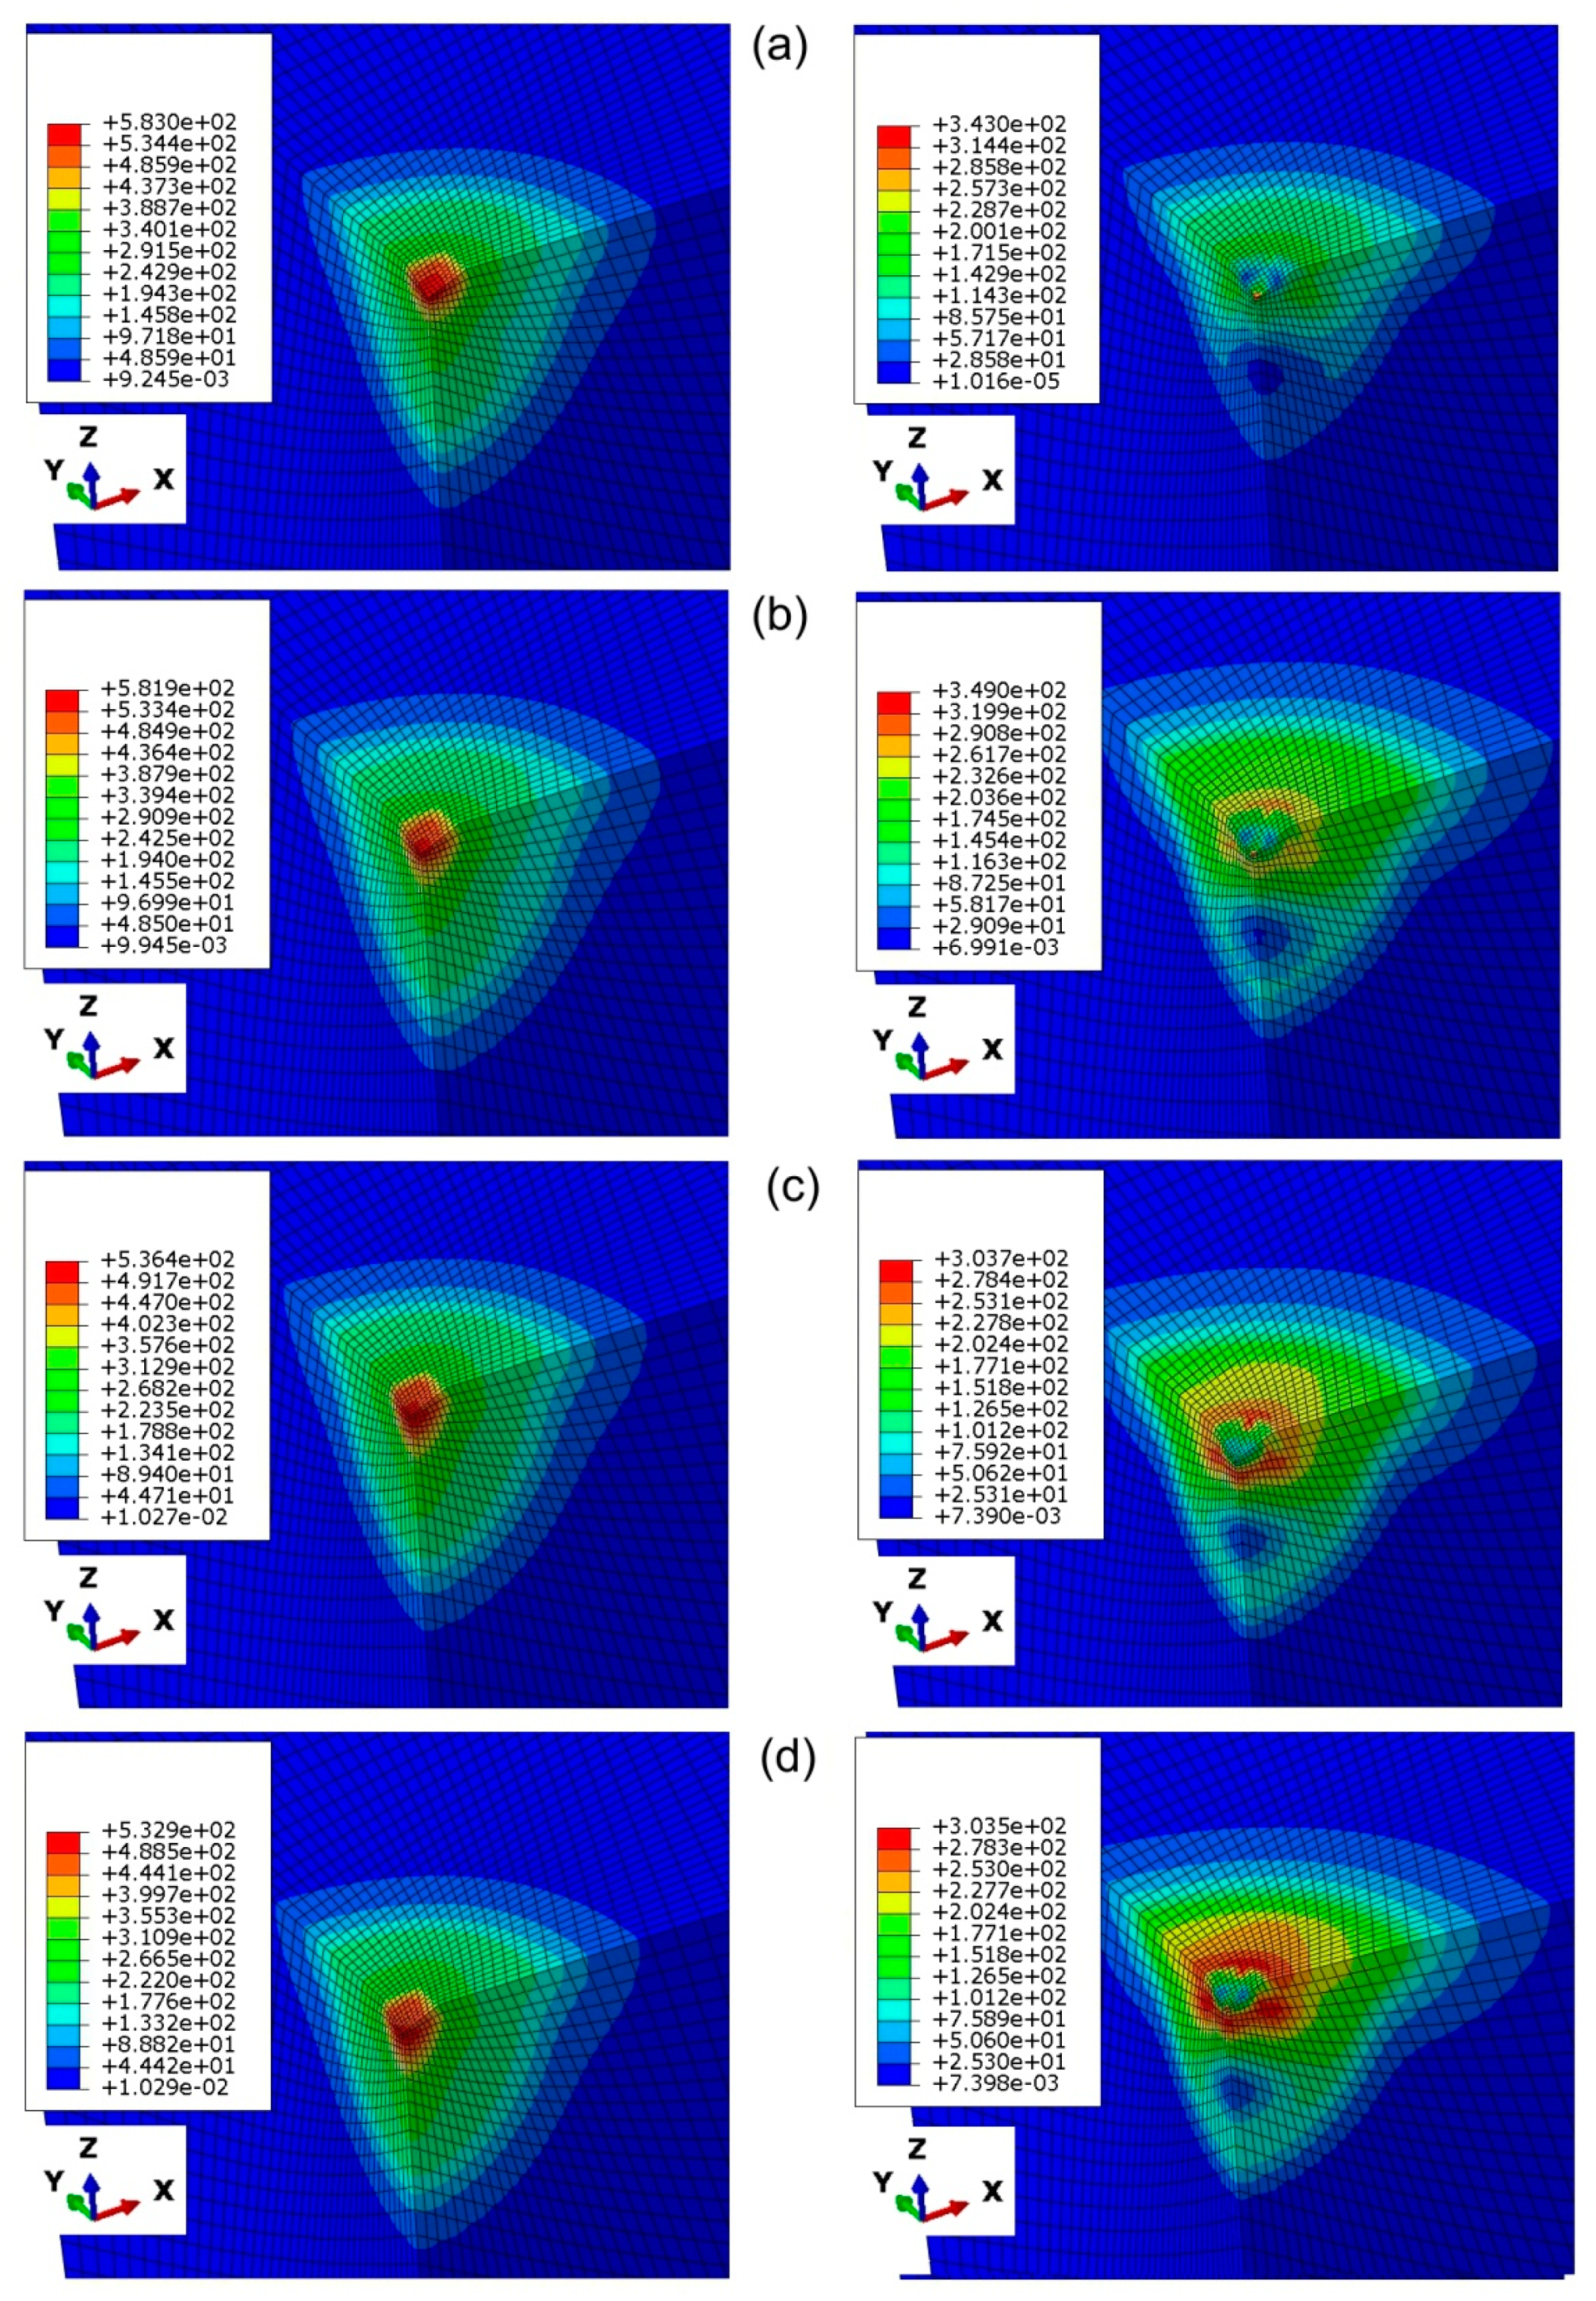
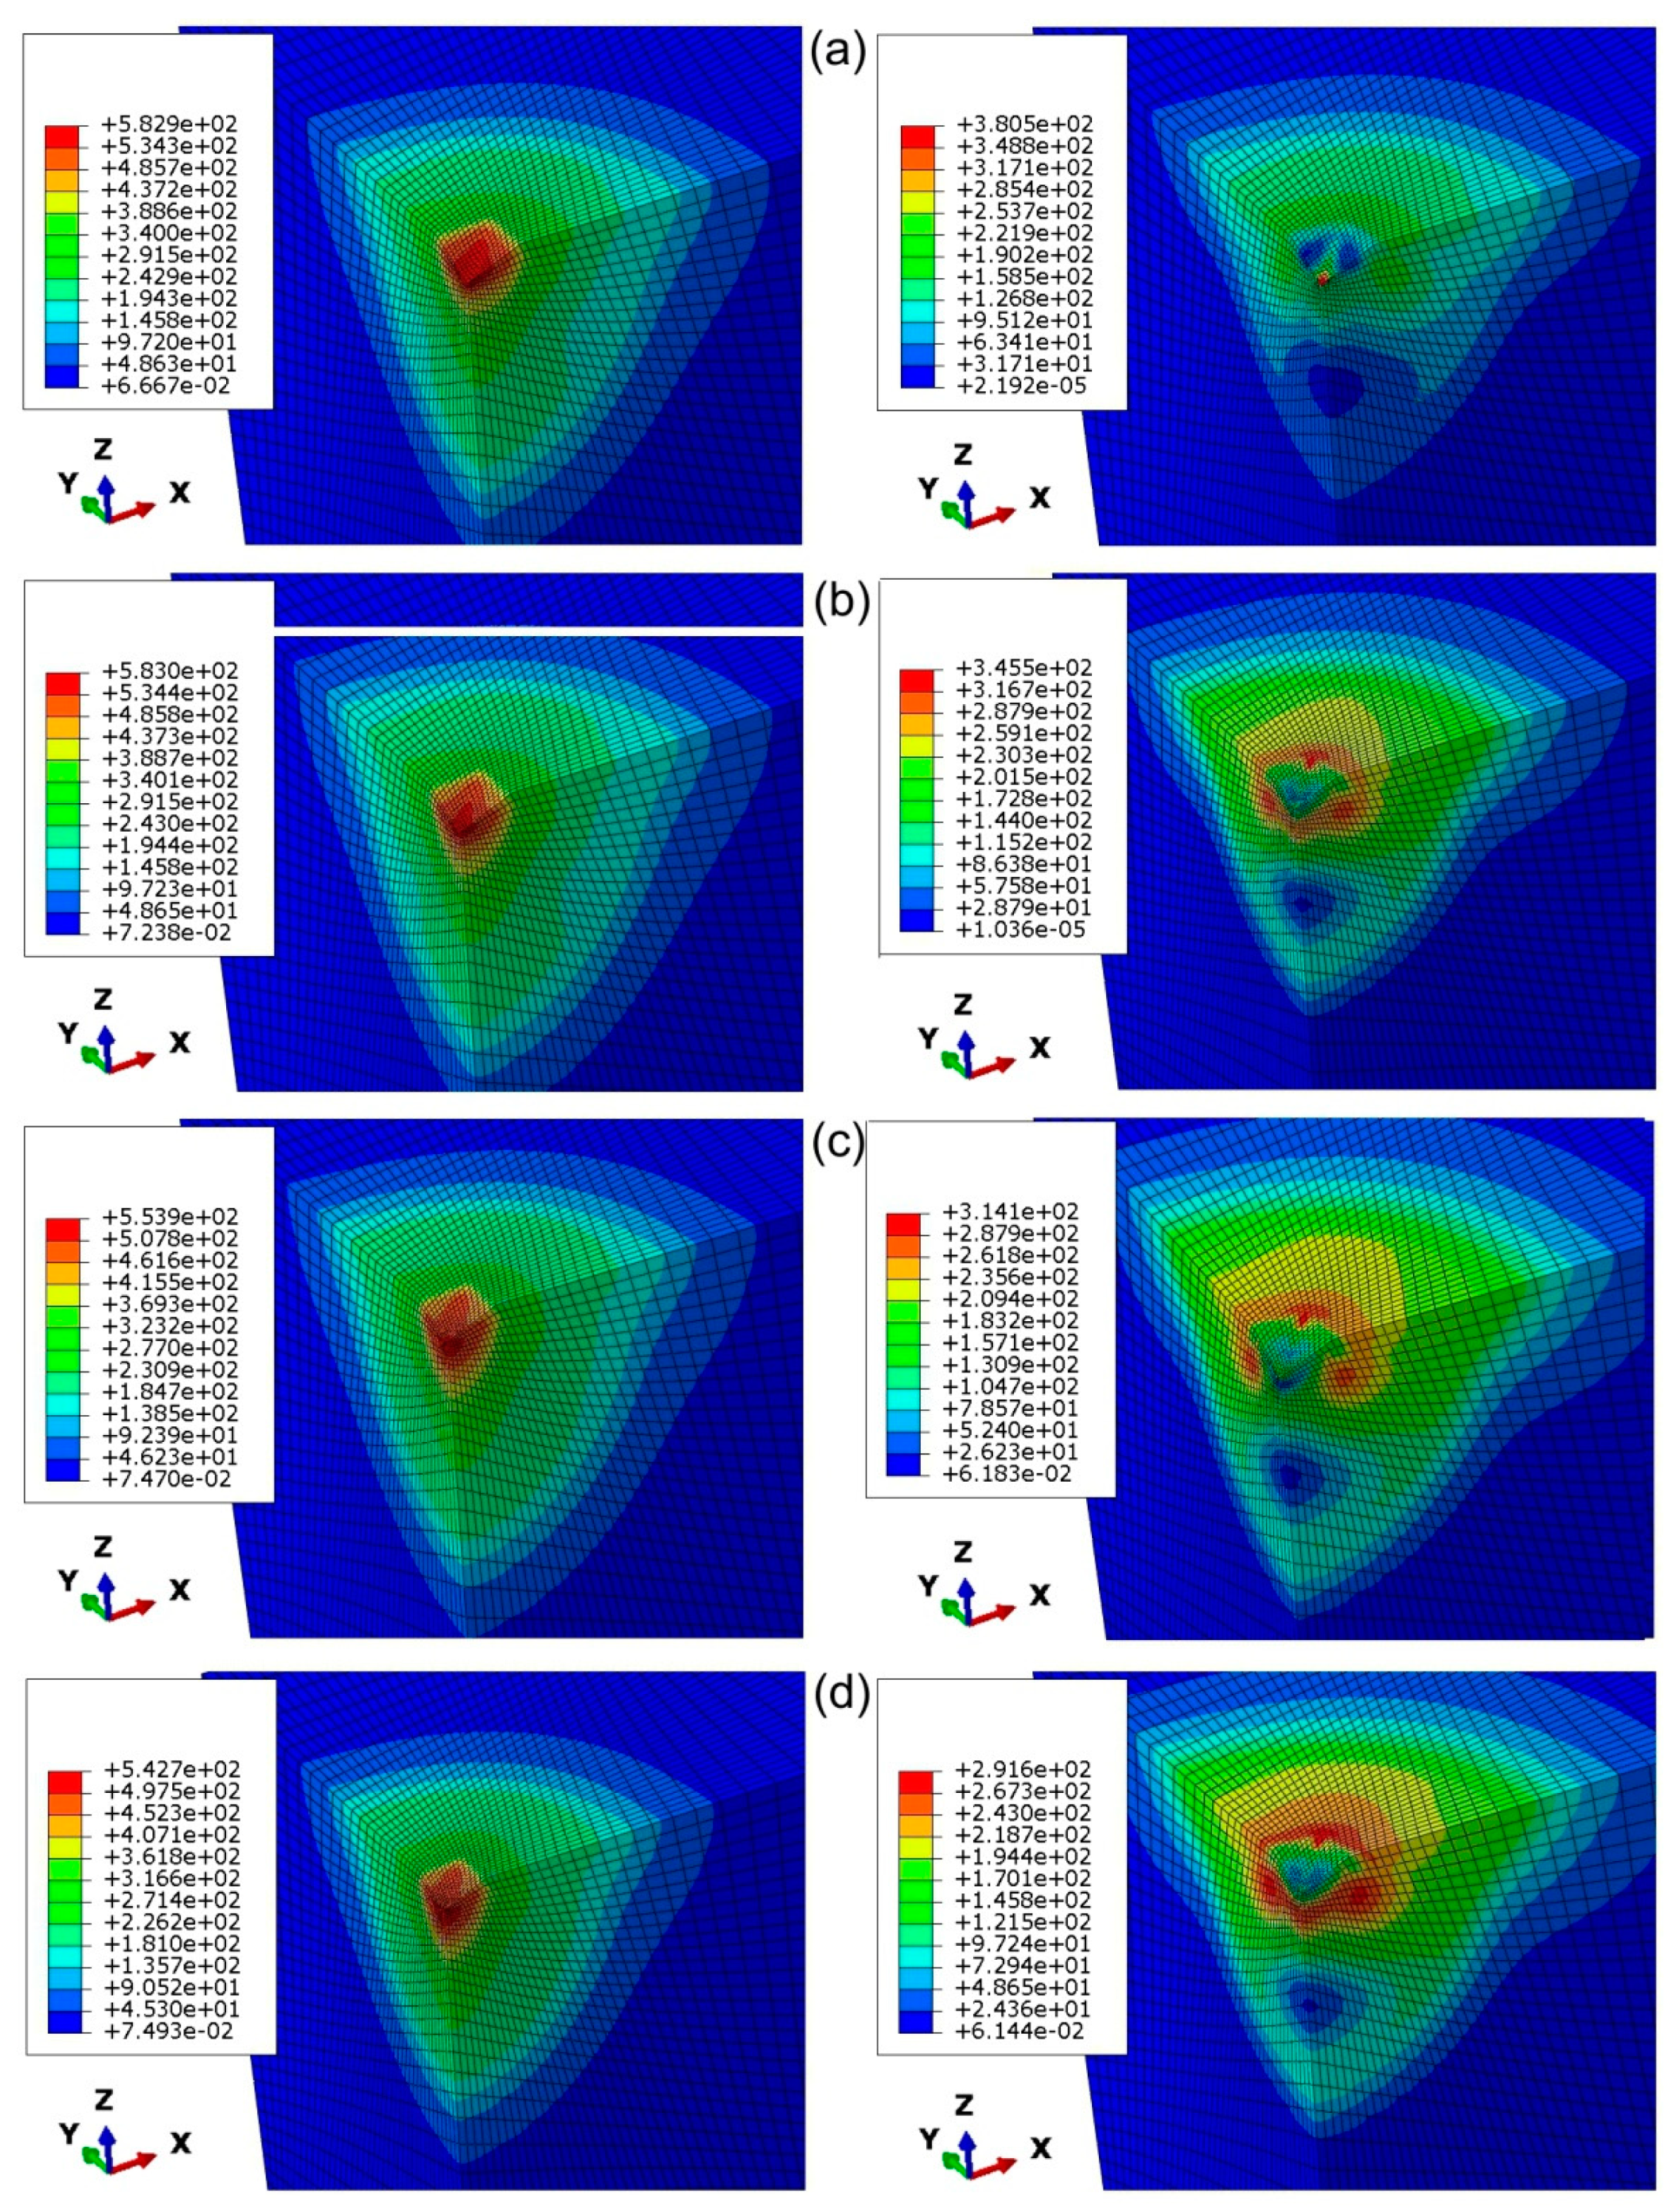
- Increasing the friction coefficient value led to reduction of the maximum equivalent plastic stress observed under maximum load. While unloading, the elastic recovery of the stress distribution caused the springback of the material and anisotropically changed the diagonal dimensions of the imperfection. Frictional regime between indenter and workpiece caused that the region of maximum residual stresses to be located in the subsurface.
Author Contributions
Funding
Acknowledgments
Conflicts of Interest
References
- Zhang, T.; Jiang, F.; Yan, L.; Xu, X. FEM modeling of the relationship between the high-temperature hardness and high-temperature, quasi-static compression experiment. Materials 2018, 11, 34. [Google Scholar] [CrossRef] [PubMed]
- Simões, M.A.; Antunes, J.M.; Fernandes, J.V.; Sakharova, N.A. Numerical simulation of the depth-sensing indentation test with Knoop indenter. Metals 2018, 8, 885. [Google Scholar] [CrossRef]
- Yang, R.; Zhang, T.; Feng, Y. Theoretical analysis of the relationships between hardness, elastic modulus, and the work of indentation for work-hardening materials. J. Mater. Res. 2010, 25, 2072–2077. [Google Scholar] [CrossRef]
- Yang, R.; Zhang, T.; Jiang, P.; Bai, Y. Experimental verification and theoretical analysis of the relationships between hardness, elastic modulus, and the work of indentation. Appl. Phys. Lett. 2008, 92, 231906. [Google Scholar] [CrossRef]
- Wang, W. Reverse Engineering: Technology of Reinvention; CRC Press: Boca Raton, FL, USA, 2010. [Google Scholar]
- Broitman, E. Indentation hardness measurements at micro-, macro-, and nanoscale: A critical overview. Tribol. Lett. 2017, 65, 1–18. [Google Scholar] [CrossRef]
- Cai, X.; Bangert, H. Hardness measurements of thin films-determining the critical ratio of depth to thickness using FEM. Thin Solid Films 1995, 264, 59–71. [Google Scholar] [CrossRef]
- Gîrleanua, M.; Pac, M.J.; Louis, P.; Ersen, O.; Werckmann, J.; Rousselot, C.; Tuilier, M.H. Characterisation of nano-structured titanium and aluminium nitride coatings by indentation, transmission electron microscopy and electron energy loss spectroscopy. Thin Solid Films 2011, 519, 6190–6195. [Google Scholar] [CrossRef]
- Zhai, J.G.; Wang, Y.Q.; Kim, T.G.; Song, J.I. Finite element and experimental analysis of Vickers indentation testing on Al2O3 with diamond-like carbon coating. J. Cent. South Univ. 2012, 19, 1175–1181. [Google Scholar] [CrossRef]
- Dao, M.; Chollacoop, N.; Van Vliet, K.J.; Venkatesh, T.A.; Suresh, S. Computational modelling of the forward reverse problems in instrumented sharp indentation. Acta Mater. 2001, 49, 3899–3918. [Google Scholar] [CrossRef]
- Antunes, J.M.; Menezes, L.F.; Fernandes, J.V. Three dimensional numerical simulation of Vickers tests. Int. J. Solids Struct. 2006, 43, 784–806. [Google Scholar] [CrossRef]
- Liu, M.; Tieu, A.K.; Lu, C.; Zhu, H.; Deng, G. A crystal plasticity study of the effect of friction on the evolution of texture and mechanical behaviour in the nano-indentation of an aluminium single crystal. Comput. Mater. Sci. 2014, 81, 30–38. [Google Scholar] [CrossRef]
- Yeo, A.; Chan, Y.S.; Che, F.; Liu, M.; Zhou, K. A combined experimental and modelling study of indentation damage test on thin-film stacked structures. Thin Solid Films 2016, 615, 74–83. [Google Scholar] [CrossRef]
- Antunes, J.M.; Menezes, L.F.; Fernandes, J.V. Influence of Vickers tip imperfection on depth sensing indentation tests. Int. J. Solids Struct. 2007, 44, 2732–2747. [Google Scholar] [CrossRef]
- Sakharova, N.A.; Fernandes, J.V.; Antunes, J.M.; Oliveira, M.C. Comparison between Berkovich, Vickers and conical indentation tests: A three-dimensional numerical simulation study. Int. J. Solids Struct. 2009, 46, 1095–1104. [Google Scholar] [CrossRef]
- Libório, M.S.; da Silva Dias, A.M.; Souza, R.M. Determination of film thickness through simulation of Vickers hardness testing. Mater. Res. 2017, 20, 755–760. [Google Scholar] [CrossRef][Green Version]
- Simon, M.; Dudescu, M.C.; Chiorean, R. Numerical simulation of Vickers micro-indentation test to estimate micro-hardness. Acta Tech. Napoc. Ser. Appl. Math. Mech. Eng. 2018, 61, 593–602. [Google Scholar]
- Madeiros, E.E.; Dias, A.M.S. Experimental and numerical analysis of Vickers hardness testing. Int. J. Res. Rev. Appl. Sci. 2013, 17, 9–18. [Google Scholar]
- Giannakopoulos, A.E.; Larsson, P.L.; Vestergaard, R. Analysis of Vickers indentation. Int. J. Solids Struct. 1994, 31, 2679–2708. [Google Scholar] [CrossRef]
- Larsson, P.L.; Giannakopoulos, A.E.; Söderlund, E.; Rowcliffe, D.J.; Vestergaard, R. Analysis of Berkovich indentation. Int. J. Solids Struct. 1996, 33, 221–248. [Google Scholar] [CrossRef]
- Tang, Z.; Guo, Y.; Jia, Z.; Li, Y.; Wei, Q. Examining the effect of pileup on the accuracy of sharp indentation testing. Adv. Mater. Sci. Eng. 2015, 2015, 528729. [Google Scholar] [CrossRef]
- Metallic Materials-Vickers Hardness Test—Part 1: Test Method; (EN ISO 6507-1:2018); International Organization for Standardization: Geneva, Switzerland, 2018.
- Oliver, W.C.; Pharr, G.M. An improved technique for determining hardness and elastic modulus using load and displacement sensing indentation experiment. J. Mater. Res. 1992, 7, 1564–1583. [Google Scholar] [CrossRef]
- Oliver, W.C.; Pharr, G.M. Measurement of hardness and elastic modulus by instrumented indentation: advances in understanding and refinements to methodology. J. Mater. Res. 2004, 19, 3–20. [Google Scholar] [CrossRef]
- Casals, O.; Alcalá, J. The ductility in mechanical property extractions from Vickers and Berkovich instrumented indentation experiments. Acta Mater. 2005, 53, 3545–3561. [Google Scholar] [CrossRef]
- Johnson, K.L. Correlation of indentation experiments. J. Mech. Phys. Solids 1970, 18, 115–126. [Google Scholar] [CrossRef]
- Tabor, D. The Hardness of Metals; Clarendon Press: Oxford, UK, 1951. [Google Scholar]
- Sullivan, M.A. Measuring, Evaluating, and Describing Pile-Up and Sink-In During Nanoindentation of Thin Films on Substrates. Ph.D. Thesis, Auburn University, Auburn, AL, USA, 2015. [Google Scholar]
- Chen, X.; Vlassak, J.J. Numerical study of the measurement of thin film mechanical properties by means of nanoindentation. J. Mater. Res. 2001, 16, 2974–2982. [Google Scholar] [CrossRef]
- Saha, R.; Nix, W.D. Effects of the substrate on the determination of thin film mechanical properties by nanoindentation. Acta Mater. 2002, 50, 23–38. [Google Scholar] [CrossRef]
- Cold Rolled Low Carbon Steel Flat Products for Cold Forming-Technical Delivery Conditions; (EN 10130:2009); International Organization for Standardization: Geneva, Switzerland, 2009.
- Metallic Materials-Tensile Testing-Part 1: Method of Test at Room Temperature; (EN ISO 6892-1:2016); International Organization for Standardization: Geneva, Switzerland, 2016.
- Ma, Z.S.; Zhou, Y.C.; Long, S.G.; Lu, C.S. An inverse approach for extracting elastic-plastic properties of thin films for small scale sharp indentation. J. Mater. Sci. Technol. 2012, 28, 626–635. [Google Scholar] [CrossRef]
- Analysis User’s Manual. Volume V: Prescribed Conditions, Constraints & Interactions; Dassault Systèmes: Providence, RI, USA, 2007.
- Hill, R. A theory of the yielding and plastic flow of anisotropic metals. Proc. R. Soc. Lond. Ser. A Math. Phys. Eng. Sci. 1948, 193, 281–297. [Google Scholar]
- Trzepieciński, T. 3D elasto-plastic FEM analysis of the sheet drawing of anisotropic steel sheet. Arch. Civ. Mech. Eng. 2010, 10, 95–106. [Google Scholar] [CrossRef]
- Trzepieciński, T.; Lemu, H.G. Effect of computational parameters on springback prediction by numerical simulation. Metals 2019, 7, 380. [Google Scholar] [CrossRef]
- Trzepiecinski, T.; Lemu, H.G.; Fejkiel, R. Numerical simulation of effect of friction directionality on forming of anisotropic sheets. Int. J. Simul. Model. 2017, 16, 590–602. [Google Scholar] [CrossRef]
- Gale, J.D.; Achuthan, A. The effect of work-hardening and pile-up on nanoindentation measurements. J. Mater. Sci. 2014, 49, 5066–5075. [Google Scholar] [CrossRef]
- Trzepieciński, T.; Bochnowski, W.; Witek, L. Variation of surface roughness, micro-hardness and friction behaviour during sheet-metal forming. Int. J. Surf. Sci. Eng. 2018, 12, 119–136. [Google Scholar] [CrossRef]
- Herrmann, K. Hardness Testing Principles and Applications; ASM International: Materials Park, OH, USA, 2011. [Google Scholar]


| C | Mn | Si | P | S | Al | Cu | Ti | Nb | Fe |
|---|---|---|---|---|---|---|---|---|---|
| 0.04 | 0.28 | 0.012 | 0.008 | 0.006 | 0.017 | 0.012 | 0.0006 | 0.0029 | balance |
| Orientation | Rp0.2, MPa | Rm, MPa | K, MPa | n | r |
|---|---|---|---|---|---|
| 0° | 182.1 | 322.5 | 549.3 | 0.214 | 1.751 |
| 45° | 196 | 336.2 | 564.9 | 0.205 | 1.124 |
| 90° | 190 | 320.9 | 541.6 | 0.209 | 1.846 |
| Average value | 191.2 | 328.95 | 555.17 | 0.208 | 1.461 |
| Number of Elements | ||||
|---|---|---|---|---|
| 46202 | 79507 | 124384 | 238140 | |
| Maximum indentation force, N | 16.7837 | 16.7328 | 16.6964 | 16.6959 |
© 2019 by the authors. Licensee MDPI, Basel, Switzerland. This article is an open access article distributed under the terms and conditions of the Creative Commons Attribution (CC BY) license (http://creativecommons.org/licenses/by/4.0/).
Share and Cite
Trzepiecinski, T.; Lemu, H.G. A Three-Dimensional Elastic-Plastic Contact Analysis of Vickers Indenter on a Deep Drawing Quality Steel Sheet. Materials 2019, 12, 2153. https://doi.org/10.3390/ma12132153
Trzepiecinski T, Lemu HG. A Three-Dimensional Elastic-Plastic Contact Analysis of Vickers Indenter on a Deep Drawing Quality Steel Sheet. Materials. 2019; 12(13):2153. https://doi.org/10.3390/ma12132153
Chicago/Turabian StyleTrzepiecinski, Tomasz, and Hirpa G. Lemu. 2019. "A Three-Dimensional Elastic-Plastic Contact Analysis of Vickers Indenter on a Deep Drawing Quality Steel Sheet" Materials 12, no. 13: 2153. https://doi.org/10.3390/ma12132153
APA StyleTrzepiecinski, T., & Lemu, H. G. (2019). A Three-Dimensional Elastic-Plastic Contact Analysis of Vickers Indenter on a Deep Drawing Quality Steel Sheet. Materials, 12(13), 2153. https://doi.org/10.3390/ma12132153