Abstract
Numerous studies have proven that natural particle-packed granular materials, such as soil and rock, are consistent with the grain-size fractal rule. The majority of existing studies have regarded these materials as ideal fractal structures, while few have viewed them as particle-packed materials to study the pore structure. In this study, theoretical analysis, the discrete element method, and digital image processing were used to explore the general rules of the pore structures of grain-size fractal granular materials. The relationship between the porosity and grain-size fractal dimension was determined based on bi-dispersed packing and the geometric packing theory. The pore structure of the grain-size fractal granular material was proven to differ from the ideal fractal structure, such as the Menger sponge. The empirical relationships among the box-counting dimension, lacunarity, succolarity, grain-size fractal dimension, and porosity were provided. A new segmentation method for the pore structure was proposed. Moreover, a general function of the pore size distribution was developed based on the segmentation results, which was verified by the soil-water characteristic curves from the experimental database.
1. Introduction
In natural environments, various types of materials are formed by grain packing. For example, soil is directly generated by particle packing, while rock is formed by siliceous or calcareous cementation on the basis of sediment packing. Concrete is cemented with cement according to coarse aggregate packing. For such granular materials, let r denote the particle size and denote the number of particles larger than r. The grain size distribution satisfies the grain-size fractal rule if the following relationship exists:
where D is the number-size distribution fractal dimension (also referred as grain-size fractal dimension in this research).
It is well known that fractals play an important role in the natural environment [1]. Numerous studies have reported that soil is a grain-size fractal granular material [2,3,4,5,6]. The grain-size distribution of sedimentary rock has been found to follow power-laws with a fractal dimension in the range of 2 to 3 orders [7,8]. Fragments of a geological body produced by weathering, explosions, and impacts often satisfy a grain-size fractal distribution over a wide range of scales, owing to the scale invariant of the fragmentation mechanism [9,10,11,12,13]. Furthermore, in engineering practice, numerous granular materials are generated by rock fragment packing, such as ore deposits and concrete coarse aggregates, which also follow the grain-size fractal distribution [14]. Therefore, it is important to understand the general properties of grain-size fractal granular materials.
Similar to most basic characteristics, the pore structure determines various physical and mechanical properties of granular materials. The soil-water characteristic curve is mainly determined by the soil pore structure [15]. Therefore, during the early research stages, the pore distribution coefficient was commonly used to represent the effect of the pore structure [16,17,18]. Furthermore, the hydraulic conductivity of granular media is mainly dependent on their pore structure. Numerous studies have been conducted on the prediction of the permeability based on the pore size distribution available in the literature [19,20,21]. The filtration performance of a granular medium is also determined by its pore structure, particularly the constriction distribution [22,23,24]. For suffusion and internal erosion, pore structure also plays a decisive role [25,26]. The pore structure holds the same significance in various other fields, such as shale gas engineering [27], petroleum engineering [28,29], and pollutant transport and reaction in environmental engineering [30,31,32].
At present, numerous studies regarding the pore structure of granular media are available in the literature. Several researchers regard the granular media formed by particle packing as ideal fractal structures, such as Menger sponges [33,34,35,36,37,38]. In these works, the permeability or soil-water characteristics have been studied based on the ideal fractal structures. In reality, the ideal fractal structure is quite different from the grain-size fractal granular media formed by particle packing, because the physical packing process is not considered. Numerous researchers have extracted meso-scopic images of granular media by means of computed tomography (CT) or nuclear magnetic resonance (NMR), and then studied their pore structure using digital image processing technology [39,40,41,42,43,44]. Existing studies on the pore structure based on CT and NMR could only examine several rock or soil samples simultaneously, and were therefore unable to obtain general rules. Certain studies have used the discrete element method (DEM) to generate granular media and investigate their pore structure [24,45,46,47,48,49,50]. These DEM studies focused on the pore structures of mono-sized packing, bi-dispersed packing, and packing with different gradation parameters. To date, except the simple 2D pore-structure studies [51,52], few studies regarding grain-size fractal granular material based on particle packing are available in the literature. Furthermore, the aforementioned DEM studies only presented the pore size distribution curves for several specific cases, and no general law was provided.
The digital image processing approaches used in pore structure studies can be categorized into Delaunay tessellation, medial axis, and watershed-based methods. Each of these approaches exhibits limitations. For example, the Delaunay tessellation-based method [24,45,48,50] can only be applied to spherical particles, and when the number of particles around the pore is greater than four, the results become inaccurate. In the medial axis-based methods [43,44,53,54,55,56], the medial axis of the pore structure needs to be extracted first. For a complex pore structure, particularly with a large protuberance on the pore surface, the extraction of the medial axis is generally inaccurate. In watershed-based methods [42,57], the pore structure first needs to be converted into the Euclidean distance field, which has a relatively large computational cost. Furthermore, over-segmentation of the pore structure often occurs when the pore boundaries are complex. In the aforementioned studies, the identification criteria of the throat and pore are not uniform, and neither are the merging criteria of the pore. Different criteria will lead to varying results [58,59,60], therefore, it is difficult to establish a general rule for pore distribution according to the above methods.
The objective of this study is to investigate the general packing rule and pore structure characteristics of grain-size fractal granular material. By means of theoretical analysis and DEM simulation of the packing process, the relationship between the porosity and number-size distribution fractal dimension was established. Based on the DEM packing pattern, the pore structures of granular materials with different fractal dimensions and compactness were extracted. Thereafter, the fractal features of the pore structure, such as the box-counting dimension, lacunarity, and succolarity, were studied. Moreover, a new method for pore segmentation was proposed, based on the continuous open operation. A general function of the pore size distribution was also obtained in this study according to the segmentation results. Finally, the pore size distribution function was verified by the soil-water characteristic curve.
2. Porosity
2.1. Theoretical Analysis
As one of basic parameters of granular materials, the porosity is determined by the particle size distribution. A certain relationship must exist between the porosity and grain-size fractal dimension (D), which essentially represents the particle size distribution. In this study, a formula for porosity prediction was derived based on the concept of integrating discrete bi-dispersed packing and discrete geometric packing, as proposed by Brouwers [61].
The basic idea to derive the porosity prediction formula can be summarized as follows. There is exact solution of ideal geometric packing. At the same time, the porosity of bi-dispersed packing are easy to be obtained by simulation or experiment. The exact solution of geometric packing is modified to a general form by the results of bi-dispersed packing, which is applicable to real particle packing. According to the particularity of grain-size fractal, the final porosity prediction equation is obtained by modifying the general form.
2.1.1. Bi-Dispersed Packing
Bi-dispersed packing refers to the packing of two different sized particles. Supposing that the radius of large particle is and that of the small particle is , the volume fraction of the large particle is , while that of the small particle is . Then, the size ratio is defined as
and the volume fraction ratio is defined as
The porosity of bi-dispersed packing is dependent on the size ratio and volume fraction ratio .
In this study, the DEM was used to simulate the packing process of a bi-dispersed particle system with different size ratios and volume fraction ratios under the action of gravity. The packing schematic is presented in Figure 1a. The porosity obtained by the DEM simulation is illustrated in Figure 1b. It can be observed that, as the particle size ratio decreases, the porosity increases, and maximum values occur at . Meanwhile, with the increase in the volume fraction ratio , the porosity first decreases and then increases, and minimum values occur when . The variation in the porosity is consistent with the conclusions of Furnas [62]. The porosity of the bi-dispersed packing can be expressed as a function of and :
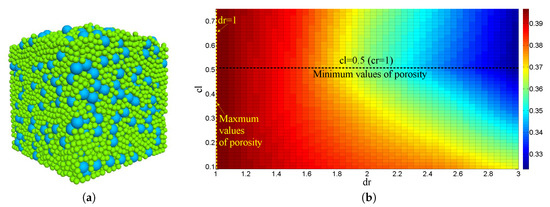
Figure 1.
Schematic of (a) bi-dispersed packing, and (b) its porosity distribution with radius ratio and volume fraction ratio .
As there are maximum values of at and minimum values at , the following relationship can be obtained:
2.1.2. Geometric Packing
As illustrated in Figure 2, geometric packing refers to the packing of large particles, followed by the filling of small particles in the pores of the large particle packing. During the filling of small particles, only the pores formed by the skeleton of the large particles were filled, which had no effect on the packing of the large particles.
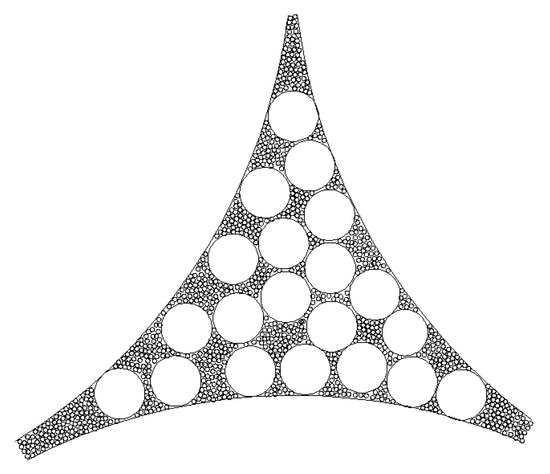
Figure 2.
Schematic of geometric packing (taking 2D as an example).
To satisfy the geometric packing condition, the size ratio of the two adjacent groups ( and ) needs to be greater than a certain value, i.e.,
in which the threshold value is in the range of approximately 7 to 10 according to the study of Furnas [62].
As no interaction between large and small particles occurs in the packing process, the porosity of geometric packing can be strictly derived. Assume that the geometric packing consists of n groups of particles, in which the maximum particle size is and the minimum particle size is . Firstly, the largest particles are stacked. At this time, the volume fraction of the particles is set to and the pore volume fraction can be expressed as
Then, the second group of particles is filled in the pores generated by the packing of the first group. At this time, the volume fraction of the particles of the second group is
After the second group is filled, the total volume fraction of the particles and pores can be expressed as follows:
By analogy, it can be concluded that, when n groups of particles are stacked, the total volume fractions of the particles and pores are
When the size ratio of the two adjacent groups is smaller than the threshold value (), the large and small particles will interact with one another, and the formula derived previously is no longer valid. To obtain the porosity prediction formula in the case of , Equation (4), obtained by bi-dispersed packing, is introduced into (12), i.e., when the second group of particles is stacked based on the packing of the first group, is used to multiply the porosity of the first group packing () instead of . By analogy, the final porosity after the packing of n groups of particles is
2.1.3. Packing of Grain-Size Fractal Granular Material
For grain-size fractal granular media, if the maximum particle size is known, (1) can be changed into the following form [35]:
The total number of particles can be obtained by (14), which is
where denotes the minimum particle size. The differential form of (14) is
From (17), the probability density function for any particle size in grain-size fractal granular material is provided:
It is assumed that continuous fractal porous media are divided into n groups of particles with the same size ratio of two adjacent groups (when , the particle size distribution tends to be continuous), i.e.,
Meanwhile, let the maximum particle size be , and the minimum particle size be . From (19), we can obtain
Let . Then, the size ratio can be expressed as follows, according to (20) and the Taylor expansion:
Thereafter, the volume fraction of the ith group is studied. As illustrated in Figure 3, based on (19), the distribution width of the ith group can be expressed as
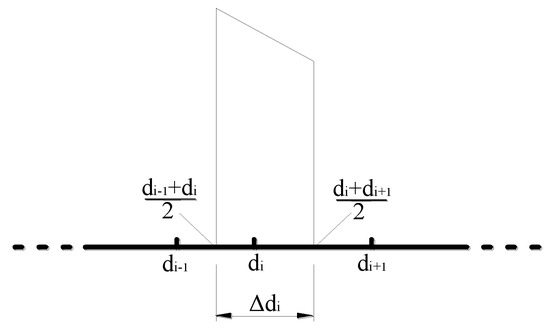
Figure 3.
Schematic of distribution width of ith group.
Let the total volume fraction of particles be , and the volume of a single particle be (B is the shape factor). According to (18) and (22), the volume fraction can be obtained as follows:
From (23), the volume fraction ratio of two adjacent groups is provided:
As can be observed in (24), the volume fraction ratio does not vary with the groups, and is only related to the size ratio and fractal dimension. Thus, is used instead of in the following. The Taylor expansion is applied to (24) at , and the volume fraction ratio can be expressed as
At this time, the size ratio () and volume fraction ratio () of the adjacent groups in the grain-size fractal granular material are expressed as functions of the number of groups (n), fractal dimension (D), and size ratios of the maximum and minimum particles (A), respectively, as indicated in (21) and (26).
Continuous grain-size fractal granular material refers to the case in which the number of groups , which implies that the size ratio and the volume fraction ratio . Based on (21) and (26), the Taylor expansion of (4) is applied near and along the direction indicated in Figure 4, which can be expressed as
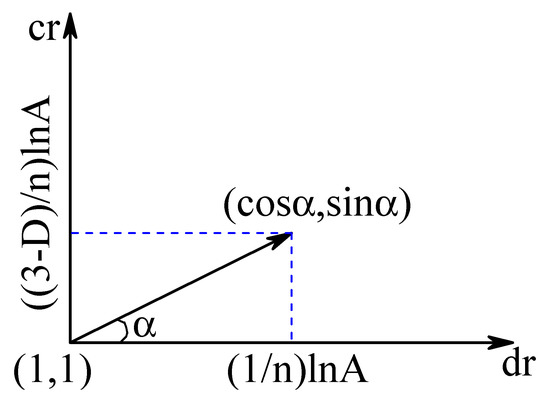
Figure 4.
Direction of Taylor expansion.
According to Figure 4, when takes , the corresponding takes , so that a certain relationship of exists:
Let , and the porosity of the mono-sized packing is (i.e., ). Neglecting the high-order small term (), and substituting (5) and (28) into (27) yields
When , the discrete grain-size fractal granular material is converted into a continuous form. After substituting (29) into (13), the final porosity of the grain-size fractal packing can be obtained by calculating the limit as follows:
As indicated in (30), the porosity of the grain-size fractal granular material is expressed by a function of the porosity of the mono-sized packing (), fractal dimension (D), size ratio of the maximum and minimum particles (A), and porosity partial derivative of the bi-dispersed packing at and (). Equation (30) is a semi-empirical formula, in which the values of and can be obtained by DEM simulation, as discussed in the following section.
2.2. Numerical Simulation
The DEM proposed by Cundall and Strack [63] was used to simulate the packing process of particles under the action of gravity. Although there are some new packaging algorithms which are more efficient and flexible [64], DEM is still the closest algorithm to the real gravity packing process. In this study, the DEM was implemented by the software of PFC. The linear elastic model of PFC was used for the interactions among particles. When the elastic modulus is large, the deformation of particles is very small, and the effect on the porosity can be ignored. Newton’s second law is used in the DEM to describe the movement of particles, which is the same as the packing process in reality.
The friction coefficient of the particles has a significant influence on the packing results [65]. A larger friction coefficient results in a faster kinetic energy loss, which leads to looser packing of particles. In soil mechanics, the relative density is used to represent the soil compactness. According to the study of Huang et al. [65], a certain relationship exists between the friction coefficient and relative density when the DEM is used to simulate particle packing. Therefore, granular material with different compactness values can be produced by changing the friction coefficient of the particles.
In (30), the parameters and of the granular material differ under varying compactness conditions. As illustrated in Figure 5, the porosity of mono-sized packing with different compactness values can be obtained by DEM simulation with different particle friction coefficients. It can be observed from the figure that, with an increase in the friction coefficient, the porosity increases nonlinearly. A fitting formula with a strong fitting degree () was provided, which is expressed as:
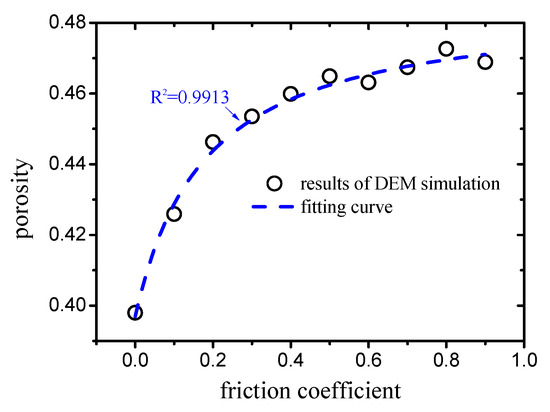
Figure 5.
Relation between friction coefficient and porosity of mono-sized packing.
The parameter was defined as , which indicates the value of the porosity partial derivative with respect to the size ratio () at and under bi-dispersed packing. For each compactness value, the porosity of several discrete points at and was calculated by simulating the bi-dispersed packing. As illustrated in Figure 6, the slope obtained by linear regression of the calculated porosity was the value corresponding to each friction coefficient (compactness). Note here that these two parameters are obtained by PFC which is spherical DEM. In practice, because the shape of the particles is not spherical usually, the coefficient of friction of the particles is different, etc., and needs to be given by experiments.
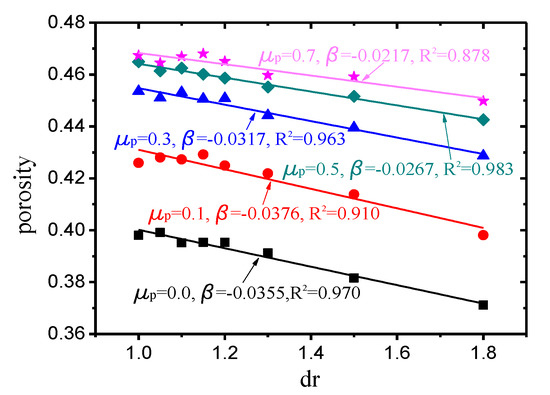
Figure 6.
values of different friction coefficients obtained by bi-dispersed packing.
After obtaining the values of and under the conditions of different friction coefficients, and substituting these into (30), the porosity corresponding to different fractal dimensions could be predicted by (30). To verify (30), the packing process of the grain-size fractal granular material with different fractal dimensions and compactness values was simulated by means of the DEM.
The simulation of the packing process can be divided into three steps. Firstly, according to the probability density function (18) and total number of particles, the numbers of each particle size are calculated. Secondly, as illustrated in Figure 7, particles with different diameters are randomly distributed in the space. Finally, the randomly distributed particles are stacked under the action of gravity until the packing is stable, following which the porosity is calculated. The simulation results are presented in Figure 8.
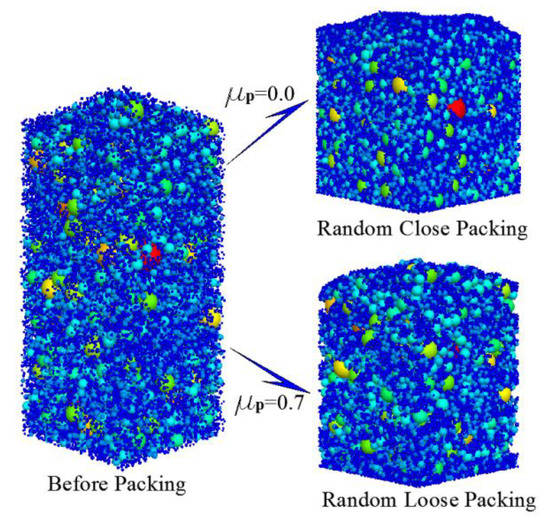
Figure 7.
Packing process of grain-size fractal granular material (taking D = 2.7 as an example).
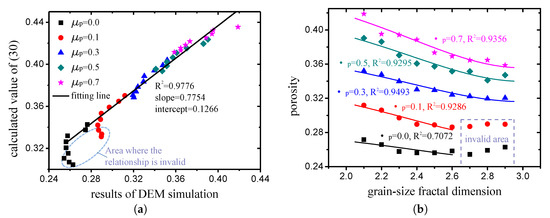
Figure 8.
(a) Comparison of porosity measured from DEM simulation with values calculated by (30); (b) porosity of grain-size fractal granular media with different fractal dimensions and friction coefficients (the scattered points represent the results of the DEM simulation, while the solid lines represent the results calculated by (30)).
The sphere packing problem has attracted the interest of mathematicians and physicists for many centuries, and great names, such as Kepler, Newton, and Descartes, are associated with this problem. A jamming phenomenon occurs in hard-particle packing. Owing to the uncertainty of the jammed structure, it is difficult to obtain an exact solution for the porosity, even for mono-sized particle packing. Jammed bi-dispersed packing and multi-sized packing have received a certain amount of attention, but their characterization is far from complete. It is impossible to precisely predict the porosity of multi-sized particle packing using the currently available techniques [66,67].
As can be observed in Figure 8a, a linear correlation exists between the results of the DEM simulation and calculated values of (30). This demonstrates that (30) can capture the rule of the grain-size fractal packing to a significant extent. Meanwhile, if and are used as fitting parameters, and (30) is used to fit the porosity obtained by the DEM simulation, excellent fitting degrees appear, as indicated in Figure 8b. It can also be observed from Figure 8 that the relationship (30) is invalid in the area where the random packing is close () and the fractal dimension is large (). This is because tighter packing results in a more obvious jamming phenomenon, which implies that the theoretical state of the densest packing cannot be achieved. For the region in which the relationship is invalid (, ), the porosity does not continue to decrease as the fractal dimension increases, so the porosity of can be regarded as the porosity of the cases when . In summary, the relationship between the porosity and fractal dimension of the grain-size fractal granular material was established by means of theoretical analysis and DEM simulation, which can be used to predict the porosity.
3. Geometric Characteristics of Pore Structure
Based on the packing results presented in Section 2.2, the pore structure of each grain-size fractal granular material was extracted by MATLAB programming for geometric feature analysis. Taking three cases (, ; , ; and , ) as examples, the final pattern of the packing particles and extracted pore structure are illustrated in Figure 9. In this study, the voxel matrix size of the pore structure was . Then, based on the three-dimensional (3D) binary image of the pore structure, digital image processing technology was applied to study the fractal properties and pore size distribution.
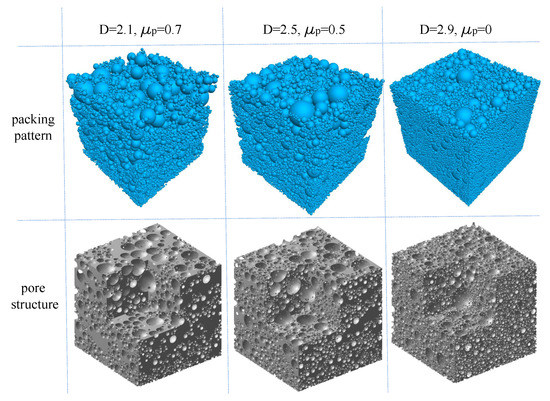
Figure 9.
Packing patterns and pore structures of three typical cases.
3.1. Fractal Properties
3.1.1. Box-Counting Dimension
The box-counting dimension, also known as the Minkowski dimension, is the natural structural property of a fractal object, representing the amount of measurement space occupied by the object, i.e., the object complexity (fragmentation degree). The 3D box-counting fractal dimension used in this study can be described as follows [1]:
where is the number of boxes covering the pore space, is the side of a box, and k is a constant which has no effect on the box-counting dimension. Moreover, is the slope of the linear part within the cutoff lengths in the log-log plot.
As illustrated in Figure 10, taking two cases (, and , ) as examples, the log-log plots of the box side () and corresponding number of boxes covering pore are provided. It can be observed that the linear fitting degrees are very high. The results of the other cases are same as the two cases presented in Figure 10 with a fitting degree of , which implies that the pore structures of grain-size fractal granular materials are typical fractal objects.
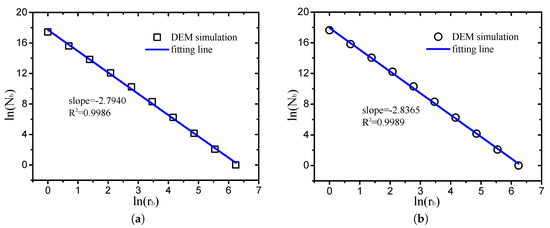
Figure 10.
Log-log plots of box size and number of boxes covering pore ((a) , ; (b) , ).
The calculated box-counting dimensions of the pore structures with different grain-size fractal dimensions and friction coefficients (compactness) are illustrated in Figure 11. Overall, the variation in the box-counting dimension of the pore structure is very small. The friction coefficient is more sensitive to the box-counting dimension than the grain-size fractal dimension. When the friction coefficient is small (), the box-counting dimension tends to increase with an increase in the grain-size fractal dimension. There are no obvious trends of the box-counting dimension with the increase in the grain-size fractal dimension when .
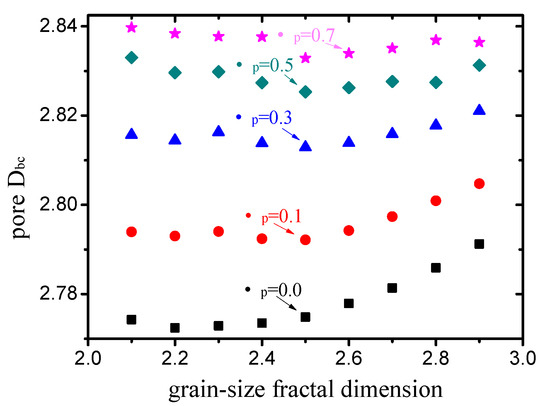
Figure 11.
Box-counting dimensions of pore structures with different grain-size fractal dimensions and friction coefficients.
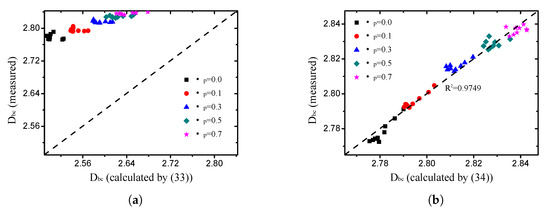
For an ideal fractal structure (such as the Menger sponge), a certain relationship exists between the porosity and box-counting dimension of the pore, obtained by Yu and Li [35]:
in which denotes the minimum pore size and represents the maximum pore size. As illustrated in Figure 12a, (33) is not accurate for the grain-size fractal granular material. The relationship between the fractal dimension and calculated value of (33) is discrete. Therefore, it is impossible to obtain the fractal dimension of the pore from the porosity directly, and other geometric information, such as the grain-size fractal dimension, is needed. In this study, a new relationship, which meets the grain-size fractal granular material, was proposed according to multiple regression:
3.1.2. Lacunarity
The lacunarity, from the Latin “lacuna” meaning “gap” or “lake,” can reflect the clustering degree (gappiness), heterogeneity, and texture of a fractal structure. Patterns with more or larger gaps generally exhibit higher lacunarity. Beyond providing an intuitive measure of gappiness, it can indicate the differences between structures that have the same or very close fractal dimensions [1].
In this study, the gliding box method described by Allain and Cloitre [68] was used to calculate the lacunarity. A box with a side was glided along all possible directions of the binary image of the pore structure. If the sliding box contains M points of which the voxel values are 1, the box mass is M. The number of boxes with mass M is denoted by . The probability density function can be obtained by dividing by the total number of gliding boxes. To analyze the probability density function conveniently, the statistical moments function is constructed as follows:
The lacunarity can be defined as the statistical moments function of divided by the square of the statistical moments function of :
The lacunarities of the pore structures with different grain-size fractal dimensions and friction coefficients were calculated by the approach described previously. The calculated lacunarity differs when using different gliding box sizes. The effects of the box size on the lacunarity is illustrated in Figure 13. Figure 13a presents the results of the cases in which the grain-size fractal dimension with different compactness values. Figure 13b illustrates the results of the cases in which the friction coefficient with different fractal dimensions. It can be observed from the log-log figures that the curve can be divided into two parts by the minimum particle size, which implies the smallest gap for the pore structure, and the lacunarity decreases linearly with the box size in the two parts with different slopes. With the increase in the gliding box size, the distinction of the lacunarity of the pore structure with different compactness values becomes less obvious. Meanwhile, the distinction of the lacunarity of the pore structure with different fractal dimensions becomes more obvious.
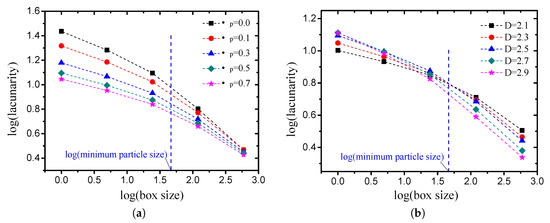
Figure 13.
Variation in lacunarity with sliding box size ((a) the fractal dimension D is , while the friction coefficient takes different values; (b) the friction coefficient is , while the fractal dimension takes different values).
The lacunarity values of the pore structures with different grain-size fractal dimensions and friction coefficients (compactness) are presented in Figure 14. As discussed in Section 3.1.1, the box-counting dimension of each pore structure is very close. It can be observed that the variation in the lacunarity is obvious. When the box size is small (<minimum particle size), the lacunarity can reflect the compactness characteristics effectively, and it decreases obviously with the increase in the friction coefficient (see Figure 14a). When the box size is large (>minimum particle size), the lacunarity can reflect the grain-size gradation characteristics effectively, and it decreases obviously with the increase in the grain-size fractal dimensions (see Figure 14b).
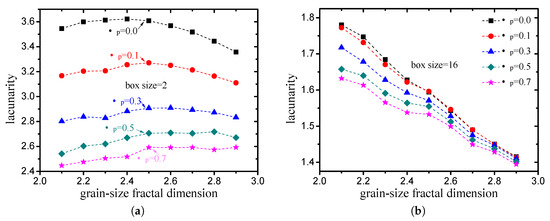
Figure 14.
Lacunarity of pore structures with different grain-size fractal dimensions and friction coefficients ((a) box size (<minimum particle size); (b) box size (>minimum particle size)).
By means of multiple regression, the empirical relationship between the lacunarity () and porosity (), and the fractal dimension (D) was obtained in this study. When the box size is small (<minimum particle size), the lacunarity is mainly related to the porosity, which can be expressed as:
As indicated in Figure 15a, the fitting degree of (37) is 0.9993. When the box size is large (>minimum particle size), the empirical expression of the lacunarity obtained in this study is:
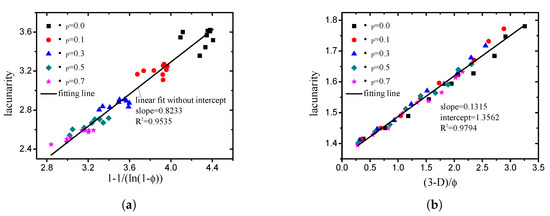
Figure 15.
Comparison of lacunarity measured from DEM simulation with values calculated by two empirical relationships provided in this study ((a) box size (<minimum particle size); (b) box size (>minimum particle size)).
The fitting degree of (38) is 0.9794, as illustrated in Figure 15b. Note here that it is difficult to get a box size smaller than the minimum particle size in practice. Therefore, the lacunarity calculated by large box size (>minimum particle size) is more reasonable and important.
In this study, the lacunarity was proven to be a reasonable parameter for distinguishing pore structures with close fractal dimensions. Moreover, the lacunarity can measure the clustering degree of the pore structure. It is generally known that various granular materials are formed by cementation based on particle packing, such as concrete and sedimentary rock. Areas in which the pore concentration of the packing structure before cementation is more pronounced tend to be more vulnerable in these materials. Therefore, it can be stated with certainty that the conclusions regarding lacunarity obtained in this study offer great application potential in the strength theory of these materials.
3.1.3. Succolarity
Succolarity is used to measure the connectivity of the fractal structure in different directions, and can represent the ability of the fluid passing through the medium [69]. In this study, the box counting-based approach proposed by de Melo and Conci [69] was used to calculate the succolarity. The 3D granular media should have six succolarity values in six different directions, owing to the directionality of succolarity. In this study, the particles were arranged randomly in the packing process. Thus, the granular media should be isotropic, and the succolarity should be the same in all directions. The succolarity along the positive direction of z was calculated. Briefly, the pore structure was divided into sub-boxes with a side length of b. As with the calculation of the lacunarity, the pore coverage () was calculated based on the pore mass of each box:
Then, the “pressure” () exerted on each box was stored in an array of pressures. The pressure increases from layer to layer along the positive z direction, which can be expressed as
in which l represents the layer of the ith box in the z positive direction. Finally, the succolarity for the z positive direction was calculated by
where is the total number of boxes.
The effect of the box size on the lacunarity is presented in Figure 16. Similar to lacunarity, the succolarity-log(box size) curve of each case can be divided into two parts according to the minimum particle size. The succoularity takes two different invariant values in each part, and these values are not independent. Therefore, It can be concluded that the succoularity is not affected by the box size.
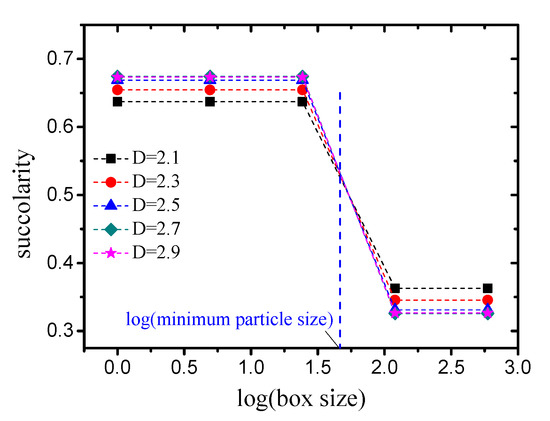
Figure 16.
Variation in succolarity with box size (taking as an example).
The succolarity values of pore structures with different grain-size fractal dimensions and friction coefficients (compactness) are presented in Figure 17a (box size takes large value which is larger than the minimum particle size). It can be observed that the variation in the succolarity is highly consistent with the variation in the porosity. Taking the relationship between the succolarity and porosity as
the fitting degree is equal to , as indicated in Figure 17b, i.e., a strict linear correlation exists between the succolarity and porosity.
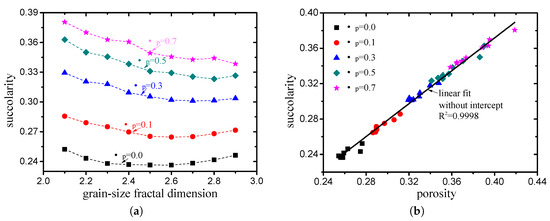
Figure 17.
Variation in succolarity with (a) grain size fractal dimension and (b) porosity.
Because the particles used in this study were spherical and the packing was random, the pore structure was isotropic and all of the pore locations were interconnected. Therefore, the ability of the fluid passing through was mainly determined by the porosity, which is why the strict linear correlation appeared.
3.2. Pore Size Distribution
3.2.1. Pore Segmentation Method
At present, numerous studies exist concentrating on the pore size distribution of the granular material from the pore scale [42,43,44,48,50,53,60]. Several methods have been proposed in these studies, each with its own limitations, as described in Section 1. One of the core issues in these studies is the manner in which to distinguish between pore throats and pores. Different identification criteria can lead to significant variations in the results. In fact, in many cases, it is very difficult to distinguish the throat and pore, particularly for porous media formed by particle packing. For example, as illustrated in Figure 18, there is no doubt that is a pore and is a throat. However, is a throat as it is a constriction to . Meanwhile, is a pore as it is an enlarged part to . Therefore, it is difficult to define whether is a pore or a throat. In many cases, the artificial distinction between a pore and throat makes no sense. Whether for hydraulics or filtration, the movement of fluid or particles in the channel is only sensitive to the size of the cross-section through which they are passing, regardless of whether the size belongs to a pore or throat. Therefore, in many cases, a general segmentation is required, without distinguishing between the pore and throat.
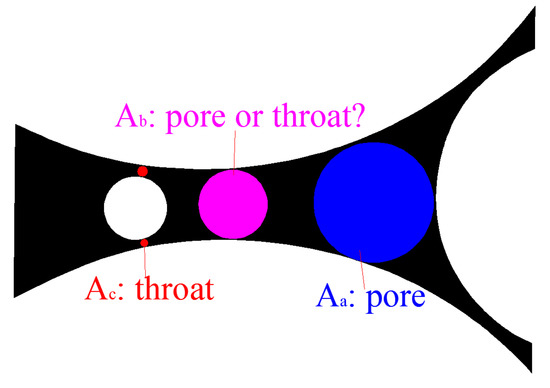
Figure 18.
Example of dilemma of distinguishing between pore and throat.
To obtain reasonable segmentation without identifying the pore and throat, a new approach based on continuous morphological open operation was proposed in this study. The mathematical expression for open operation in morphology is
in which is the origin image (the 3D binary image of the pore structure in this study), is the structuring element object (a sphere with radius in this study), and is the binary matrix after open operating. Taking the two-dimensional (2D) structure as an example, herein, the physical meaning of the morphological open operation is described, as illustrated in Figure 19. Taking a disk with a radius as the structuring element, the open operation of the pore channel can be regarded as the disk rolling in the channel with the area that the disk cannot roll through being deleted and area that the disk can roll through being retained. As expressed in (43), represents the part of through which the structuring ball can roll. Let ; then, represents the part of through which cannot pass.
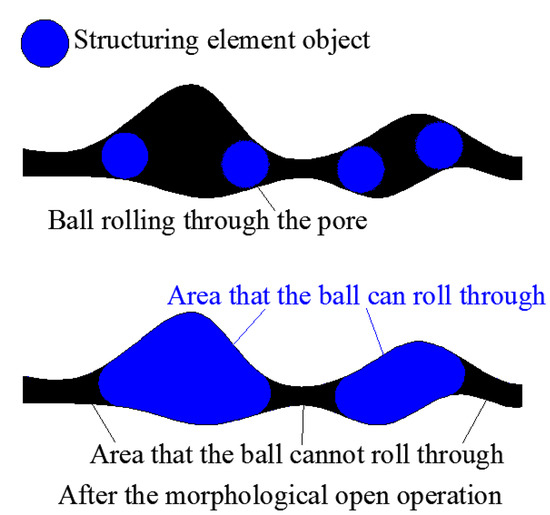
Figure 19.
Physical meaning of open operation.
By changing the radius of the structuring ball from the minimum to maximum, the continuous open operation is applied to the pore structure, recording the radius of the maximum ball that can pass through at each pore structure point. Taking the 2D structure as an example, as illustrated in Figure 20, the distribution contour of the maximum passing ball radius of two types of 2D granular media formed by circular and irregular particles, respectively, are obtained by the continuous morphological open operation. It can be observed that a reasonable segmentation appears after the continuous open operation, following the physical process of filtration. The radius of the maximum ball that can pass through is regarded as the pore size () of each point in the pore structure, without identifying the pore and throat. Then, the pore size distribution can be obtained based on the segmentation. The pore segmentation process was implemented by MATLAB programming in this study.
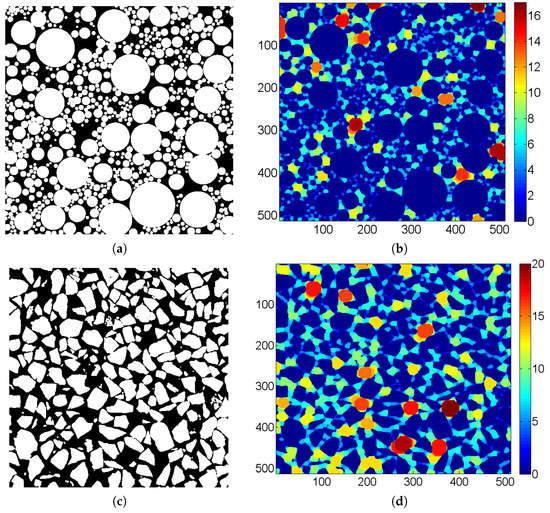
Figure 20.
Results of continuous morphological open operation (taking 2D as example) ((a) is the origin image and (b) is the pore segmentation of the granular media formed by circular particles; (c) is the origin image and (d) is the pore segmentation of the granular media formed by irregular particles).
In the introduction to the continuous open operation method described previously, 2D binary images were used as an example, while the pore structure calculated in this study was 3D (see Figure 9). For a 3D binary image, the calculation principle is the same, and only the operation into the 3D open operation needs to be changed, with the 3D sphere as the structuring element. Based on the segmentation methods proposed in this study, the pore size distribution of the pore structures with different grain-size fractal dimensions and friction coefficients were calculated.
3.2.2. Results and Discussion
The volume accumulation curves for the pore size are presented in Figure 21. Figure 21a illustrates the results of the cases in which the grain-size fractal dimension D was with different compactness values. When the fractal dimensions are the same, the compactness is smaller, while the maximum pore size is larger, i.e., the pore size has a larger distribution range. Figure 21b presents the results of the cases in which the friction coefficient was with different fractal dimensions. When the friction coefficients are the same, the fractal dimension is larger, the content of small pores is larger, and the content of the large pores is smaller. Although the differences between these curves are obvious, the variation law of the curves is consistent, which can be described by a general function.
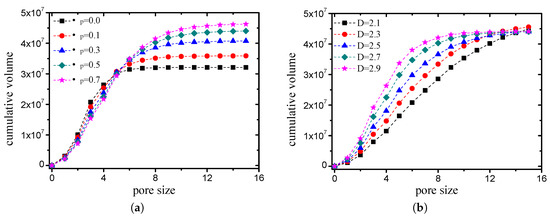
Figure 21.
Volume accumulation curves for pore size ((a) D is , while the friction coefficient takes different values; (b) is , while the fractal dimension takes different values).
In this study, the rule whereby the pore size distribution accords with the well-known two-parameter Weibull distribution [70] was established. The expression of the two-parameter Weibull cumulative function is as follows:
where denotes the cumulative volume fraction of the pore size in the range, is the distribution scale parameter, and is the shape parameter. To determine the rule, the normalized process was applied to the results presented in Figure 21 by first dividing each total pore volume, following which curve fitting was performed on the normalized results using (44). As indicated in Figure 22, the fitting degree of each curve was over . All other cases not presented in the figure also exhibited a fitness of more than . Therefore, there is no doubt that the pores of the grain-size fractal granular material following segmentation conform to the two-parameter Weibull distribution.
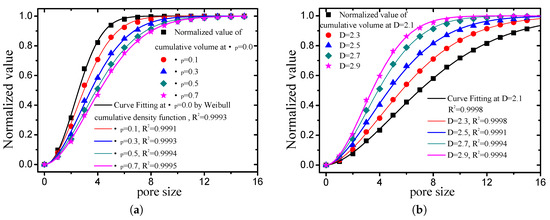
Figure 22.
Curve fitting of normalized value of cumulative volume by Weibull cumulative density function ((a) D is , while the friction coefficient takes different values; (b) is , while the fractal dimension takes different values).
It must be pointed out that the conclusion of this section is not inconsistent with that of Section 3.1.1, which shows that the pore structures of grain-size fractal granular materials are fractal objects. The box-counting dimension only measures the complexity of the pore structure, but the real pore size distribution is obtained in this section by the pore segmentation method which has strict physical meaning. The curve shape of pore size distribution obtained in this paper is consistent with the theoretical estimation results of Rouault and Assouline [71]. However, Rouault and Assouline [71] just gave the shape of the curves based on some rough theoretical assumptions. In this paper, the pore structure of the particle-packed material is measured directly, and it is proved that the pore distribution of the grain-size fractal granular material satisfies the weibull distribution.
In the Weibull distribution, a change in the scale parameter has the same effect on the distribution as a change in the abscissa scale (see Figure 23a). In this study, the scale parameter is mainly related to the average pore size. The shape parameter is equal to the slope of the regressed line in a probability plot, which determines the shape of the volume probability density function of the pore size (see Figure 23b). The two Weibull parameters of pore structures with different grain-size fractal dimensions and friction coefficients (compactness) are presented in Figure 24. It can be observed that the scale parameter decreases with an increase in the fractal dimension and increases with an increase in the compactness. The shape parameter increases with an increase in the fractal dimension and decreases with an increase in the compactness.
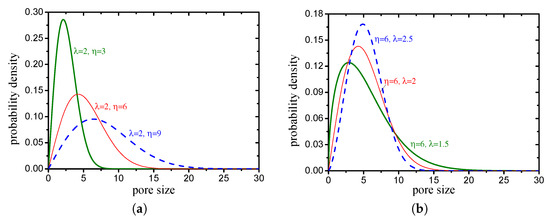
Figure 23.
Effects of parameters on Weibull probability density function ((a) scale parameter ; (b) shape parameter ).
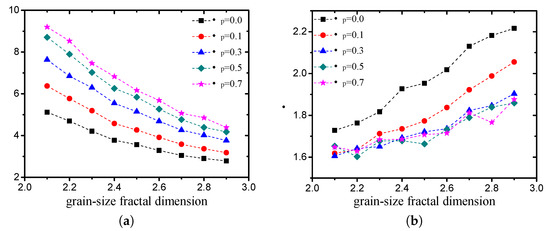
Figure 24.
Variation in parameters with fractal dimension and friction coefficient ((a) scale parameter ; (b) shape parameter ).
By means of multiple regression, the empirical relationships between the two Weibull parameters (, ) and porosity (), and the fractal dimension (D) were obtained:
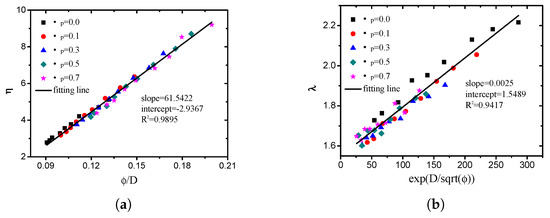
Figure 25.
Comparison of values of two parameters obtained from DEM simulation with values calculated by two empirical relationships provided in this study ((a) scale parameter ; (b) shape parameter ).
3.2.3. Verification of General Pore Distribution Function
The pore structure of soil has a decisive effect on the soil-water characteristic curve [15,72]. The soil-water characteristic curve is a macro relationship, which can easily be measured in the field or laboratory. However, the real pore structure is difficult to measure. Therefore, an alternative method involves reflecting the pore structure characteristics through the soil-water characteristic curve. To verify the general pore distribution function (44) proposed in this study, a new equation for the soil-water characteristic curve was derived based on (44). Then, the correctness of the new soil-water characteristic equation was verified by comparison with experimental data, which implies that the pore distribution function was verified.
According to the Young-Laplace equation, the relationship between the pore radius and capillary pressure is expressed as follows:
in which , denotes the water surface tension, and denotes the contact angle. According to the local equilibrium assumption [73], for a specific capillary pressure , pores with sizes greater than in the pore structure are filled with air, while pores with sizes less than are filled with water. At this point, the relative saturation is the percentage of the volume of the pores with sizes less than to the total volume of pores, which is the precise physical meaning of (44). Therefore, based on (44), the relative saturation corresponding to the capillary pressure can be expressed as
Substituting (47) into (48), the new general equation for the soil-water characteristic curve can be derived, which is
where denotes the water content corresponding to the capillary pressure , and and denote the saturated and residual water contents, respectively.
There are many empirical equations of soil-water characteristic curves, such as van Genuchten equation [17], lognormal-type equation [74] and Weibull-type equation [75,76]. The equation obtained in this paper is similar to the Weibull-type equation proposed by Assouline et al. [75] which can be expressed as follows:
There are two basic assumptions in the derivation of Equation (50): the particle size conforms to the Weibull distribution and the pore size is proportional to the particle size. This research does not have these theoretical assumptions, and analysis the pore structure generated by particle packing directly. Furthermore, the physical meaning of pore segmentation in this paper is consistent with that of Young-Laplace equation. Therefore, the calculation in this paper is more accurate than that of Assouline et al. [75]. It can be proved that among these empirical equations, the Weibull-type equation is most reasonable, and the Equation (49) obtained in this paper is simpler than (50).
The experimental dataset for validating the new general Equation (49) of the soil-water characteristic curve was obtained from the UNsaturated SOil hydraulic property DAtabase (UNSODA) [77]. UNSODA is a database of unsaturated soil hydraulic properties (water retention, hydraulic conductivity, and soil water diffusivity), basic soil properties (particle-size distribution, bulk density, organic matter content, etc.), and additional information regarding the soil and the experimental procedures. There are 790 soil samples from different regions of the world in UNSODA. Eight sets of cases with relatively complete experimental data were randomly selected from the UNSODA. Curve fitting was applied to the drying branch of the data points of these cases by the function (49). It can be observed from Figure 26 that the fitting degrees were all above , which indicates that (49) is a reasonable and general function for expressing the soil-water characteristic curves. As (49) was derived on the basis of (44), it can be stated that the correctness and generality of (44) were also verified.
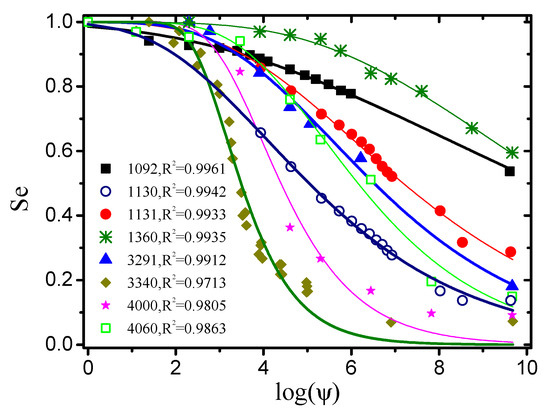
Figure 26.
Curve fitting of experimental data from UNSODA by new general soil-water characteristic function derived in this study (numbers such as 1092 represent the sample number in UNSODA).
4. Conclusions
Grain-size fractal granular materials are common in natural environments, such as general soil, sedimentary rock, and concrete. It is inappropriate to treat these stacked materials as ideal fractal structures. In this study, the general rules of the pore structures of grain-size fractal materials were explored by means of theoretical analysis, DEM simulation, and digital image processing. Several important conclusions were obtained, as follows:
- Based on bi-dispersed packing and the geometric packing theory, the relationship between the porosity and fractal dimension of grain-size fractal granular material was established, which can be used to predict the porosity. The rationality of the relationship was verified by means of simulation of the packing processes under the conditions of different fractal dimensions and compactness values using DEM.
- The fractal properties were studied based on the 3D binary image of the pore structure extracted from the DEM packing simulation. The pore structure of grain-size fractal granular material conforms to the fractal law, but the box-counting dimension differs from the ideal fractal structure, such as the Menger sponge. The empirical relationship between the box-counting dimensions, lacunarity, succolarity, and grain-size fractal dimension, and the porosity were provided in this study.
- Whether for hydraulics or filtration, the movement of fluid or particles in the channel is only sensitive to the size of the cross-section through which they are passing, regardless of whether the size belongs to a pore or throat. A new segmentation method for the pore structure without distinguishing between the pore and throat was proposed based on the continuous morphological open operation. According to the segmentation results, a general function of the pore size distribution was established, of which the generality and correctness were verified by the soil-water characteristic curves from the experimental database.
These conclusions were obtained by continuously graded materials and they cannot be applied to gap-graded materials. Any materials can use these conclusions as long as they satisfy the following conditions: (1) The materials are formed by particle packing; (2) The size distribution of particles satisfies the number-size fractals law.
Author Contributions
Conceptualization, Y.L. and D.-S.J.; methodology, Y.L. and D.-S.J.; investigation, Y.L. and D.-S.J.; writing—original draft preparation, Y.L.; writing—review and editing, D.-S.J.; visualization, Y.L.; supervision, D.-S.J.
Funding
National 1000 Talent Project (No: A1920502051907-3).
Conflicts of Interest
The authors declare no conflict of interest.
References
- Mandelbrot, B.B. The fractal Geometry of Nature; W. H. Freeman: San Francisco, CA, USA, 1982. [Google Scholar]
- Tyler, S.W.; Wheatcraft, S.W. Fractal scaling of soil particle-size distributions: Analysis and limitations. Soil Sci. Soc. Am. J. 1992, 56, 362–369. [Google Scholar] [CrossRef]
- Wu, Q.; Borkovec, M.; Sticher, H. On particle-size distributions in soils. Soil Sci. Soc. Am. J. 1993, 57, 883–890. [Google Scholar] [CrossRef]
- Perfect, E. Fractal models for the fragmentation of rocks and soils: A review. Eng. Geol. 1997, 48, 185–198. [Google Scholar] [CrossRef]
- Hyslip, J.P.; Vallejo, L.E. Fractal analysis of the roughness and size distribution of granular materials. Eng. Geol. 1997, 48, 231–244. [Google Scholar] [CrossRef]
- Su, Y.Z.; Zhao, H.L.; Zhao, W.Z.; Zhang, T.H. Fractal features of soil particle size distribution and the implication for indicating desertification. Geoderma 2004, 122, 43–49. [Google Scholar] [CrossRef]
- Storti, F.; Billi, A.; Salvini, F. Particle size distributions in natural carbonate fault rocks: insights for non-self-similar cataclasis. Earth Planet. Sci. Lett. 2003, 206, 173–186. [Google Scholar] [CrossRef]
- Billi, A. Grain size distribution and thickness of breccia and gouge zones from thin (< 1m) strike-slip fault cores in limestone. J. Struct. Geol. 2005, 27, 1823–1837. [Google Scholar]
- Turcotte, D.L. Fractals and fragmentation. J. Geophys. Res. Solid Earth 1986, 91, 1921–1926. [Google Scholar] [CrossRef]
- Steacy, S.J.; Sammis, C.G. An automaton for fractal patterns of fragmentation. Nature 1991, 353, 250–252. [Google Scholar] [CrossRef]
- Hooke, R.L.; Iverson, N.R. Grain-size distribution in deforming subglacial tills: Role of grain fracture. Geology 1995, 23, 57–60. [Google Scholar] [CrossRef]
- McDowell, G.R.; Bolton, M.D.; Robertson, D. The fractal crushing of granular materials. J. Mech. Phys. Solids 1996, 44, 2079–2101. [Google Scholar] [CrossRef]
- Crosta, G.B.; Frattini, P.; Fusi, N. Fragmentation in the Val Pola rock avalanche, Italian alps. J. Geophys. Res. Earth Surf. 2007, 112, F01006. [Google Scholar] [CrossRef]
- Yang, X.; Wang, F.; Yang, X.; Zhou, Q. Fractal dimension in concrete and implementation for meso-simulation. Constr. Build. Mater. 2017, 143, 464–472. [Google Scholar] [CrossRef]
- Berkowitz, B.; Ewing, R.P. Percolation theory and network modeling applications in soil physics. Surv. Geophys. 1998, 19, 23–72. [Google Scholar] [CrossRef]
- Brooks, R.H.; Corey, A.T. Hydraulic properties of porous media. Colo. State Univ. Hydro Pap. 1964, 3, 27. [Google Scholar]
- Genuchten, M.T.V. A closed form equation for predicting the hydraulic conductivity of unsaturated soils. Soil Sci. Soc. Am. J. 1980, 44, 892–898. [Google Scholar] [CrossRef]
- Fredlund, D.G.; Xing, A. Equations for the soil-water characteristic curve. Can. Geotech. J. 1994, 31, 521–532. [Google Scholar] [CrossRef]
- Garcia-Bengochea, I.; Altschaeffl, A.G.; Lovell, C.W. Pore distribution and permeability of silty clays. J. Geotech. Eng. Div. 1979, 105, 839–856. [Google Scholar]
- Juang, C.H.; Holtz, R.D. A probabilistic permeability model and the pore size density function. Int. J. Numer. Anal. Methods Geomech. 1986, 10, 543–553. [Google Scholar] [CrossRef]
- Taylor, H.F.; O’Sullivan, C.; Sim, W.W. Geometric and hydraulic void constrictions in granular media. J. Geotech. Geoenviron. Eng. 2016, 142, 04016057. [Google Scholar] [CrossRef]
- Kenney, T.C.; Chahal, R.; Chiu, E.; Ofoegbu, G.I.; Omange, G.N.; Ume, C.A. Controlling constriction sizes of granular filters. Can. Geotech. J. 1985, 22, 32–43. [Google Scholar] [CrossRef]
- Fannin, J. Karl Terzaghi: From theory to practice in geotechnical filter design. J. Geotech. Geoenviron. Eng. 2008, 134, 267–276. [Google Scholar] [CrossRef]
- Shire, T.; O’Sullivan, C. Constriction size distributions of granular filters: A numerical study. Géotechnique 2016, 66, 826–839. [Google Scholar] [CrossRef]
- Indraratna, B.; Nguyen, V.T.; Rujikiatkamjorn, C. Assessing the potential of internal erosion and suffusion of granular soils. J. Geotech. Geoenviron. Eng. 2011, 137, 550–554. [Google Scholar] [CrossRef]
- To, H.D.; Scheuermann, A.; Galindo-Torres, S.A. Probability of transportation of loose particles in suffusion assessment by self-filtration criteria. J. Geotech. Geoenviron. Eng. 2015, 142, 04015078. [Google Scholar] [CrossRef]
- Ross, D.J.K.; Bustin, R.M. The importance of shale composition and pore structure upon gas storage potential of shale gas reservoirs. Mar. Pet. Geol. 2009, 26, 916–927. [Google Scholar] [CrossRef]
- Chen, J.D.; Wilkinson, D. Pore-scale viscous fingering in porous media. Phys. Rev. Lett. 1985, 55, 1892. [Google Scholar] [CrossRef] [PubMed]
- Valvatne, P.H.; Blunt, M.J. Predictive pore-scale modeling of two-phase flow in mixed wet media. Water Resour. Res. 2004, 40, W07406. [Google Scholar] [CrossRef]
- Willingham, T.W.; Werth, C.J.; Valocchi, A.J. Evaluation of the effects of porous media structure on mixing-controlled reactions using pore-scale modeling and micromodel experiments. Environ. Sci. Technol. 2008, 42, 3185–3193. [Google Scholar] [CrossRef] [PubMed]
- Sakoda, A.; Ishimori, Y.; Hanamoto, K.; Kataoka, T.; Kawabe, A.; Yamaoka, K. Experimental and modeling studies of grain size and moisture content effects on radon emanation. Radiat. Meas. 2010, 45, 204–210. [Google Scholar] [CrossRef]
- Wu, S.; Jeng, D.S. Numerical modeling of solute transport in deformable unsaturated layered soil. Water Sci. Eng. 2017, 10, 184–196. [Google Scholar] [CrossRef]
- Tyler, S.W.; Wheatcraft, S.W. Fractal processes in soil water retention. Water Resour. Res. 1990, 26, 1047–1054. [Google Scholar] [CrossRef]
- Rieu, M.; Sposito, G. Fractal fragmentation, soil porosity, and soil water properties: I. Theory. Soil Sci. Soc. Am. J. 1991, 55, 1231–1238. [Google Scholar] [CrossRef]
- Yu, B.; Li, J. Some fractal characters of porous media. Fractals 2001, 9, 365–372. [Google Scholar] [CrossRef]
- Russell, A. How water retention in fractal soils depends on particle and pore sizes, shapes, volumes and surface areas. Géotechnique 2014, 64, 379. [Google Scholar] [CrossRef]
- Chen, X.; Yao, G.; Herrero-Bervera, E.; Cai, J.; Zhou, K.; Luo, C.; Jiang, P.; Lu, J. A new model of pore structure typing based on fractal geometry. Mar. Pet. Geol. 2018, 98, 291–305. [Google Scholar] [CrossRef]
- Cousins, T.A.; Ghanbarian, B.; Daigle, H. Three-Dimensional Lattice Boltzmann Simulations of Single-Phase Permeability in Random Fractal Porous Media with Rough Pore–Solid Interface. Transp. Porous Media 2018, 122, 527–546. [Google Scholar] [CrossRef]
- Lindquist, W.B.; Venkatarangan, A.; Dunsmuir, J.; Wong, T.f. Pore and throat size distributions measured from synchrotron X-ray tomographic images of Fontainebleau sandstones. J. Geophys. Res. Solid Earth 2000, 105, 21509–21527. [Google Scholar] [CrossRef]
- Blunt, M.J.; Bijeljic, B.; Dong, H.; Gharbi, O.; Iglauer, S.; Mostaghimi, P.; Paluszny, A.; Pentland, C. Pore-scale imaging and modelling. Adv. Water Resour. 2013, 51, 197–216. [Google Scholar] [CrossRef]
- Lee, B.H.; Lee, S.K. Effects of specific surface area and porosity on cube counting fractal dimension, lacunarity, configurational entropy, and permeability of model porous networks: Random packing simulations and NMR micro-imaging study. J. Hydrol. 2013, 496, 122–141. [Google Scholar] [CrossRef]
- Taylor, H.F.; O’Sullivan, C.; Sim, W.W. A new method to identify void constrictions in micro-CT images of sand. Comput. Geotech. 2015, 69, 279–290. [Google Scholar] [CrossRef]
- Yi, Z.; Lin, M.; Jiang, W.; Zhang, Z.; Li, H.; Gao, J. Pore network extraction from pore space images of various porous media systems. Water Resour. Res. 2017, 53, 3424–3445. [Google Scholar] [CrossRef]
- Jiang, Z.; van Dijke, M.; Geiger, S.; Ma, J.; Couples, G.; Li, X. Pore network extraction for fractured porous media. Adv. Water Resour. 2017, 107, 280–289. [Google Scholar] [CrossRef]
- Reboul, N.; Vincens, E.; Cambou, B. A computational procedure to assess the distribution of constriction sizes for an assembly of spheres. Comput. Geotech. 2010, 37, 195–206. [Google Scholar] [CrossRef]
- Narsilio, G.A.; Kress, J.; Yun, T.S. Characterisation of conduction phenomena in soils at the particle-scale: Finite element analyses in conjunction with synthetic 3D imaging. Comput. Geotech. 2010, 37, 828–836. [Google Scholar] [CrossRef]
- Kress, J.; Yun, T.S.; Narsilio, G.A.; Evans, T.M.; Lee, D.S. Evaluation of hydraulic conductivity in 3D random and heterogeneous particulate materials using network model. Comput. Geotech. 2012, 40, 45–52. [Google Scholar] [CrossRef]
- Gao, S.; Meegoda, J.N.; Hu, L. Two methods for pore network of porous media. Int. J. Numer. Anal. Methods Geomech. 2012, 36, 1954–1970. [Google Scholar] [CrossRef]
- Mahmoodlu, M.G.; van Genuchten, M.T.; Sweijen, T.; Raoof, A. Unsaturated hydraulic properties of heterogeneously packed sands: A pore-scale computational study. J. Hydrol. 2018, 565, 570–580. [Google Scholar] [CrossRef]
- Van der Linden, J.H.; Sufian, A.; Narsilio, G.A.; Russell, A.R.; Tordesillas, A. A computational geometry approach to pore network construction for granular packings. Comput. Geosci. 2018, 112, 133–143. [Google Scholar] [CrossRef]
- Martín, M.A.; Muñoz, F.J.; Reyes, M.; Taguas, F.J. Computer simulation of random packings for self-similar particle size distributions in soil and granular materials: Porosity and pore size distribution. Fractals 2014, 22, 1440009. [Google Scholar] [CrossRef]
- Martín, M.A.; Muñoz, F.J.; Reyes, M.; Taguas, F.J. Computer simulation of packing of particles with size distributions produced by fragmentation processes. Pure Appl. Geophys. 2015, 172, 141–148. [Google Scholar] [CrossRef]
- Silin, D.; Patzek, T. Pore space morphology analysis using maximal inscribed spheres. Phys. A Stat. Mech. Its Appl. 2006, 371, 336–360. [Google Scholar] [CrossRef]
- Dong, H. Micro-CT Imaging and Pore Network Extraction. Ph.D. Thesis, Department of Earth Science and Engineering, Imperial College London, London, UK, 2008. [Google Scholar]
- Dong, H.; Blunt, M.J. Pore-network extraction from micro-computerized-tomography images. Phys. Rev. E 2009, 80, 036307. [Google Scholar] [CrossRef] [PubMed]
- Homberg, U.; Baum, D.; Wiebel, A.; Prohaska, S.; Hege, H.C. Definition, extraction, and validation of pore structures in porous materials. In Topological Methods in Data Analysis and Visualization III; Springer: Berlin, Germany, 2014; pp. 235–248. [Google Scholar]
- Roozbahani, M.M.; Borela, R.; Frost, J.D. Pore Size Distribution in Granular Material Microstructure. Materials 2017, 10, 1237. [Google Scholar] [CrossRef] [PubMed]
- Al-Raoush, R.; Thompson, K.; Willson, C.S. Comparison of network generation techniques for unconsolidated porous media. Soil Sci. Soc. Am. J. 2003, 67, 1687–1700. [Google Scholar] [CrossRef]
- Vincens, E.; Witt, K.J.; Homberg, U. Approaches to determine the constriction size distribution for understanding filtration phenomena in granular materials. Acta Geotech. 2015, 10, 291–303. [Google Scholar] [CrossRef]
- Seblany, F.; Homberg, U.; Vincens, E.; Winkler, P.; Witt, K.J. Merging criteria for defining pores and constrictions in numerical packing of spheres. Granul. Matter 2018, 20, 37. [Google Scholar] [CrossRef]
- Brouwers, H.J.H. Particle-size distribution and packing fraction of geometric random packings. Phys. Rev. E 2006, 74, 031309. [Google Scholar] [CrossRef]
- Furnas, C.C. Grading aggregates-I.-Mathematical relations for beds of broken solids of maximum density. Ind. Eng. Chem. 1931, 23, 1052–1058. [Google Scholar] [CrossRef]
- Cundall, P.A.; Strack, O.D.L. A discrete numerical model for granular assemblies. Geotechnique 1979, 29, 47–65. [Google Scholar] [CrossRef]
- To, H.D.; Galindo-Torres, S.A.; Scheuermann, A. Sequential sphere packing by trilateration equations. Granul. Matter 2016, 18, 70. [Google Scholar] [CrossRef]
- Huang, Q.F.; Zhan, M.L.; Sheng, J.C.; Luo, Y.L.; Zhang, X. Numerical method to generate granular assembly with any desired relative density based on DEM. Chin. J. Geotech. Eng. 2015, 37, 537–543. [Google Scholar]
- Torquato, S.; Truskett, T.M.; Debenedetti, P.G. Is random close packing of spheres well defined? Phys. Rev. Lett. 2000, 84, 2064–2067. [Google Scholar] [CrossRef] [PubMed]
- Torquato, S.; Stillinger, F.H. Jammed hard-particle packings: From Kepler to Bernal and beyond. Rev. Mod. Phys. 2010, 82, 2633. [Google Scholar] [CrossRef]
- Allain, C.; Cloitre, M. Characterizing the lacunarity of random and deterministic fractal sets. Phys. Rev. A 1991, 44, 3552–3558. [Google Scholar] [CrossRef] [PubMed]
- De Melo, R.H.C.; Conci, A. How succolarity could be used as another fractal measure in image analysis. Telecommun. Syst. 2013, 52, 1643–1655. [Google Scholar] [CrossRef]
- Weibull, W. Wide applicability. J. Appl. Mechan. 1951, 103, 293–297. [Google Scholar]
- Rouault, Y.; Assouline, S. A probabilistic approach towards modeling the relationships between particle and pore size distributions: The multicomponent packed sphere case. Powder Technol. 1998, 96, 33–41. [Google Scholar] [CrossRef]
- Simms, P.H.; Yanful, E.K. Predicting soil—Water characteristic curves of compacted plastic soils from measured pore-size distributions. Géotechnique 2002, 52, 269–278. [Google Scholar] [CrossRef]
- Liu, H.H.; Wei, M.Y.; Rutqvist, J. Normal-stress dependence of fracture hydraulic properties including two-phase flow properties. Hydrogeol. J. 2013, 21, 371–382. [Google Scholar] [CrossRef]
- Kosugi, K. Lognormal distribution model for unsaturated soil hydraulic properties. Water Resour. Res. 1996, 32, 2697–2703. [Google Scholar] [CrossRef]
- Assouline, S.; Tessier, D.; Bruand, A. A conceptual model of the soil water retention curve. Water Resour. Res. 1998, 34, 223–231. [Google Scholar] [CrossRef]
- Assouline, S.; Selker, J. Introduction and evaluation of a Weibull hydraulic conductivity-pressure head relationship for unsaturated soils. Water Resour. Res. 2017, 53, 4956–4964. [Google Scholar] [CrossRef]
- Nemes, A.D.; Schaap, M.G.; Leij, F.J.; Wösten, J.H.M. Description of the unsaturated soil hydraulic database UNSODA version 2.0. J. Hydrol. 2001, 251, 151–162. [Google Scholar] [CrossRef]
© 2019 by the authors. Licensee MDPI, Basel, Switzerland. This article is an open access article distributed under the terms and conditions of the Creative Commons Attribution (CC BY) license (http://creativecommons.org/licenses/by/4.0/).