Article

A Comparative Study between Knocked-Down Aligned Carbon Nanotubes and Buckypaper-Based Strain Sensors

1
IPC/i3N-Institute for Polymers and Composites, University of Minho, 4800-058 Guimarães, Portugal
2
CMEMS—Center for MicroElectroMechanical Systems, University of Minho, 4800-058 Guimarães, Portugal
*
Author to whom correspondence should be addressed.
Materials 2019, 12(12), 2013; https://doi.org/10.3390/ma12122013
Submission received: 6 May 2019 / Revised: 18 June 2019 / Accepted: 19 June 2019 / Published: 23 June 2019
(This article belongs to the Special Issue Electrical, Thermal and Optical Properties of Nanocarbon Materials)

Abstract

:
Carbon nanotubes (CNTs) are one of the most promising materials in sensing applications due to their electrical and mechanical properties. This paper presents a comparative study between CNT Buckypaper (BP) and aligned CNT-based strain sensors. The Buckypapers were produced by vacuum filtration of commercial CNTs dispersed in two different solvents, N,N-Dimethylformamide (DMF) and ethanol, forming freestanding sheets, which were cut in 10 × 10 mm squares and transferred to polyimide (PI) films. The morphology of the BP was characterized by scanning electron microscopy (SEM). The initial electrical resistivity of the samples was measured, and then relative electrical resistance versus strain measurements were obtained. The results were compared with the knocked-down vertically aligned CNT/PI based sensors previously reported. Although both types of sensors were sensitive to strain, the aligned CNT/PI samples had better mechanical performance and the advantage of inferring strain direction due to their electrical resistivity anisotropic behavior.

Graphical Abstract

1. Introduction

From aerospace to microelectronic applications, the growing demand for multifunctional materials with a set of outstanding properties put carbon nanotubes (CNTs) on the map of the most promising ones [1,2]. While CNTs mechanical performance and piezoresistive response make them suitable for sensing applications, the electric anisotropy of aligned CNTs can be used to infer strain directions [3]. This nanomaterial can be incorporated into polymer-based sensors in several ways:
(1)
As conductive fillers in polymer nanocomposites [4,5], through mechanical mixing and deposition methods, such as coating, dip casting, and filtration, among others;
(2)
As Buckypaper films (BP), produced by dispersion and deposition methods, such as vacuum filtration (the most common method), drop casting, or hot-press compression, among others [6,7];
(3)
As vertically aligned CNT forests (VA-CNTs), synthesized by chemical vapor deposition (CVD), incorporated into polymeric matrices and substrates [8,9]; and
(4)
As vertically aligned CNT forests (VA-CNTs), synthesized by laser-oriented deposition (LOD) method directly into the matrices, allowing the incorporation of CNTs due to the covalent bounds formed during the process [10]. Furthermore, a dramatic change of materials resistivity via LOD application is reported in the literature [11].
Despite being widely adopted, these methods have some manufacturing limitations regarding the homogeneity of CNT dispersion, the impregnation efficiency, and CNT alignment [12,13]. Moreover, solutions for these drawbacks can be time consuming and complex.
CNT Buckypapers, for instance, have their electrical conductivity and mechanical performance intimately dependent upon the homogeneity of the CNT dispersion [14]. To accomplish that, appropriated surfactants (whose removal can be time-consuming) and some extra manufacturing steps have to be considered. Several authors [13,15,16] produced BP-based sensors with high sensitivity and found a linear dependence between the relative electric resistance and the applied strain. Moreover, some authors studied the effect of CNT sonication parameters [17] in the quality of CNT dispersion and the use of different solvents [18,19] on the performance of the BP-based sensors, which highly depends on the homogeneity of the BP. However, the advantages that can rise from the CNT alignment in a sensor are always borne in mind.
Several techniques for CNT alignment [8,20,21,22], namely, by mechanical stretching, electric and magnetic fields, flow assisted, drawn from VA-CNT forests, fall short due to their complexity. Alternatively, VA-CNTs, widely produced by CVD, can be knocked down and form a kind of aligned CNT Buckypaper. Recently, this technique was used to produce microheaters [23], to improve inter-laminar facture toughness on laminated composites [24], and to develop CNT/polymer strain sensors [3]. In this latter case, a patch of knocked-down VA-CNTs was laid down over a polymeric film substrate, and four conductive electrodes of Ag ink were placed for electrical connections, allowing the measurement of electrical resistance over orthogonal axes.
In this work, two types of CNT/polymer strain sensors are compared, based on:
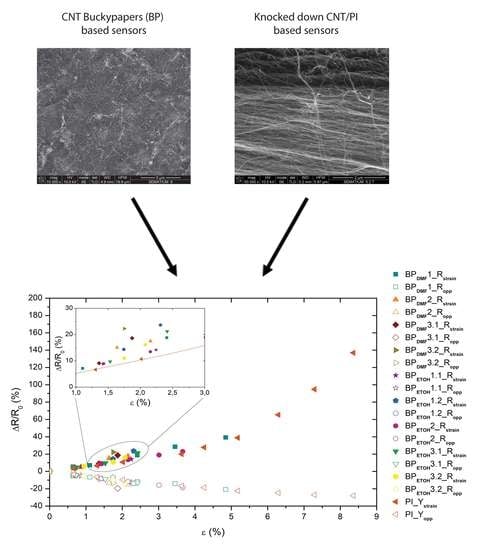
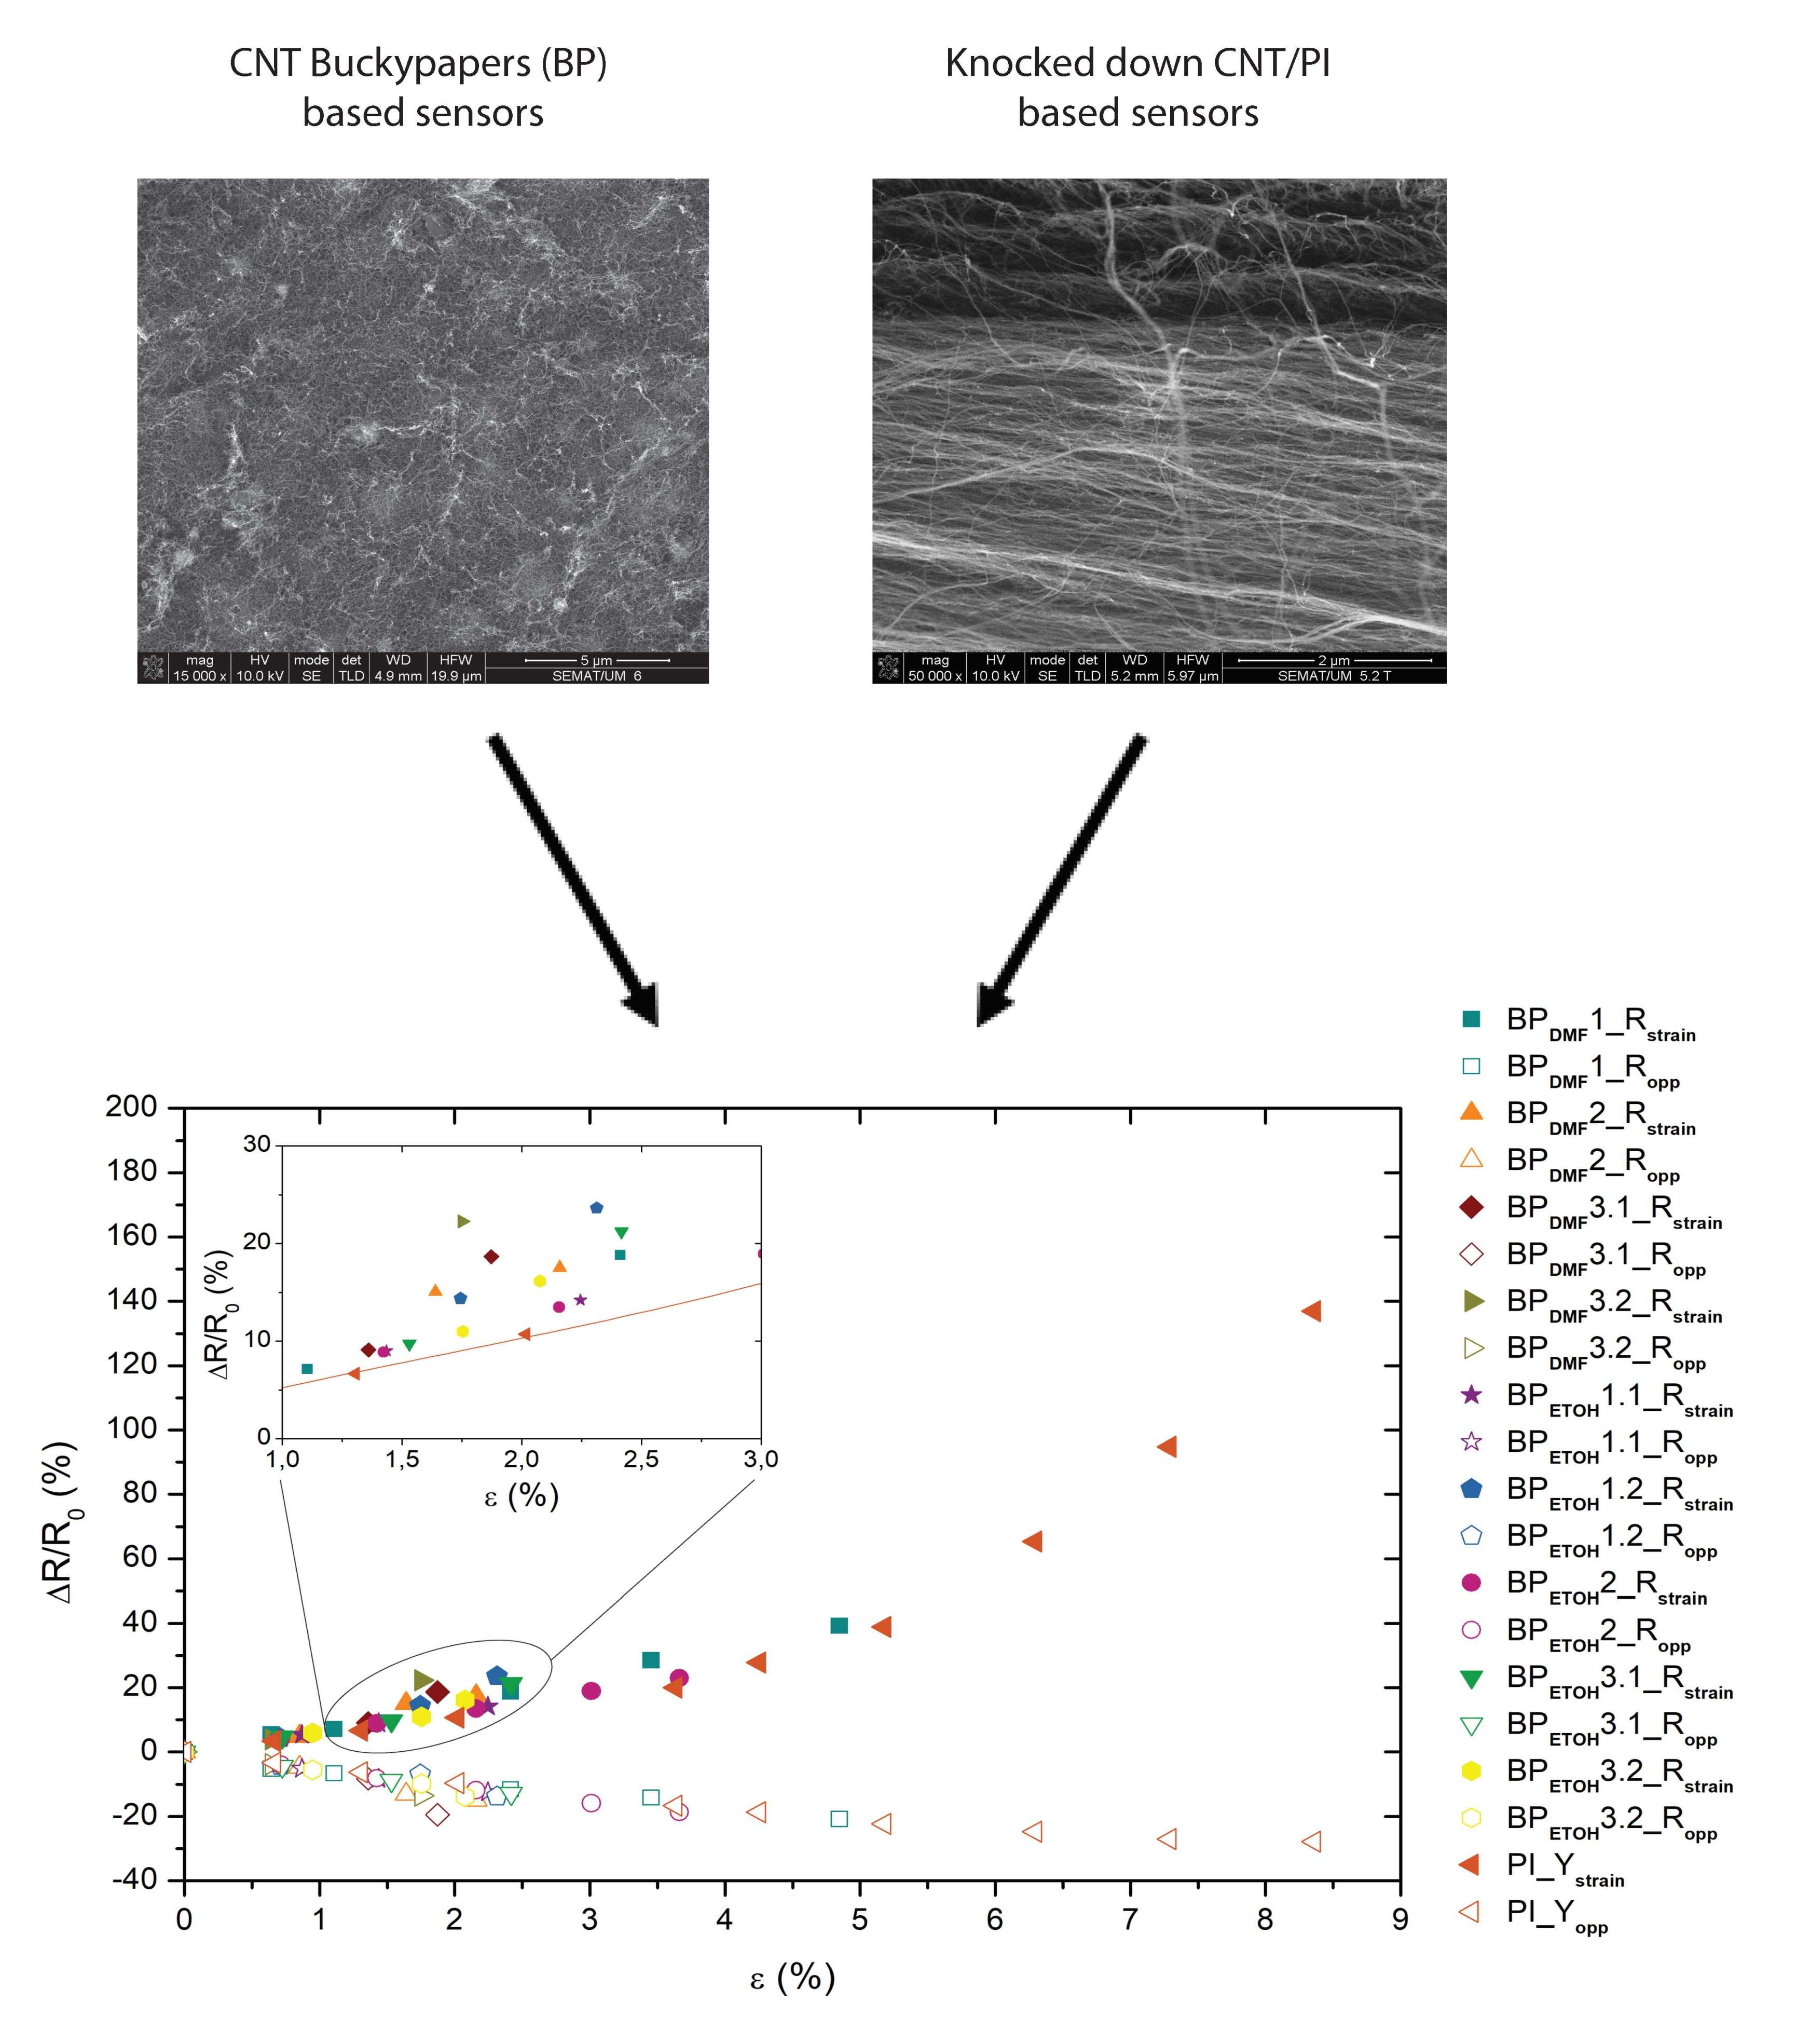
  • Buckypapers, in which CNTs are randomly dispersed with two different solvents and show an isotropic electrical behavior, and;
  • Knocked-down VA-CNTs, which are highly aligned in one direction and show anisotropic electrical properties (and were developed in our previous work [3]).
The aim is to assess the effect of the isotropic/anisotropic electrical properties on strain sensor behavior. For this purpose, commercial multi-wall carbon nanotubes (MWCNTs) were dispersed in N,N-Dimethylformamide (DMF) and ethanol, which were chosen in order to avoid the use of organic solvents (e.g., Triton X) and, thus, extra washing steps, and then vacuum filtrated to form freestanding Buckypapers, BPDMF and BPETOH, respectively. After being transferred to polyimide (PI) films, relative electrical resistance and Gauge factor versus strain measurements were obtained. The results are compared with the knocked-down VA-CNT/PI-based sensor.

2. Materials and Methods

2.1. Aligned CNT/PI Samples Preparation

VA-CNTs were synthesized via CVD, at 750 °C, with a flown gas mixture of ethylene/hydrogen/helium (100/200/55 sccm), in a 10 × 10 mm size silicon patch, previously patterned with Fe/Al2O3 catalyst. The CNT forests were manually knocked down onto PI films by a 10 mm diameter rod. Also, a silver conductive epoxy adhesive (8330S from MG Chemicals) was used as electrodes between the samples and the copper wires and placed at the corners of the CNT patch. A detailed description of this procedure can be found can elsewhere [3].

2.2. CNT Buckypaper Samples Preparation
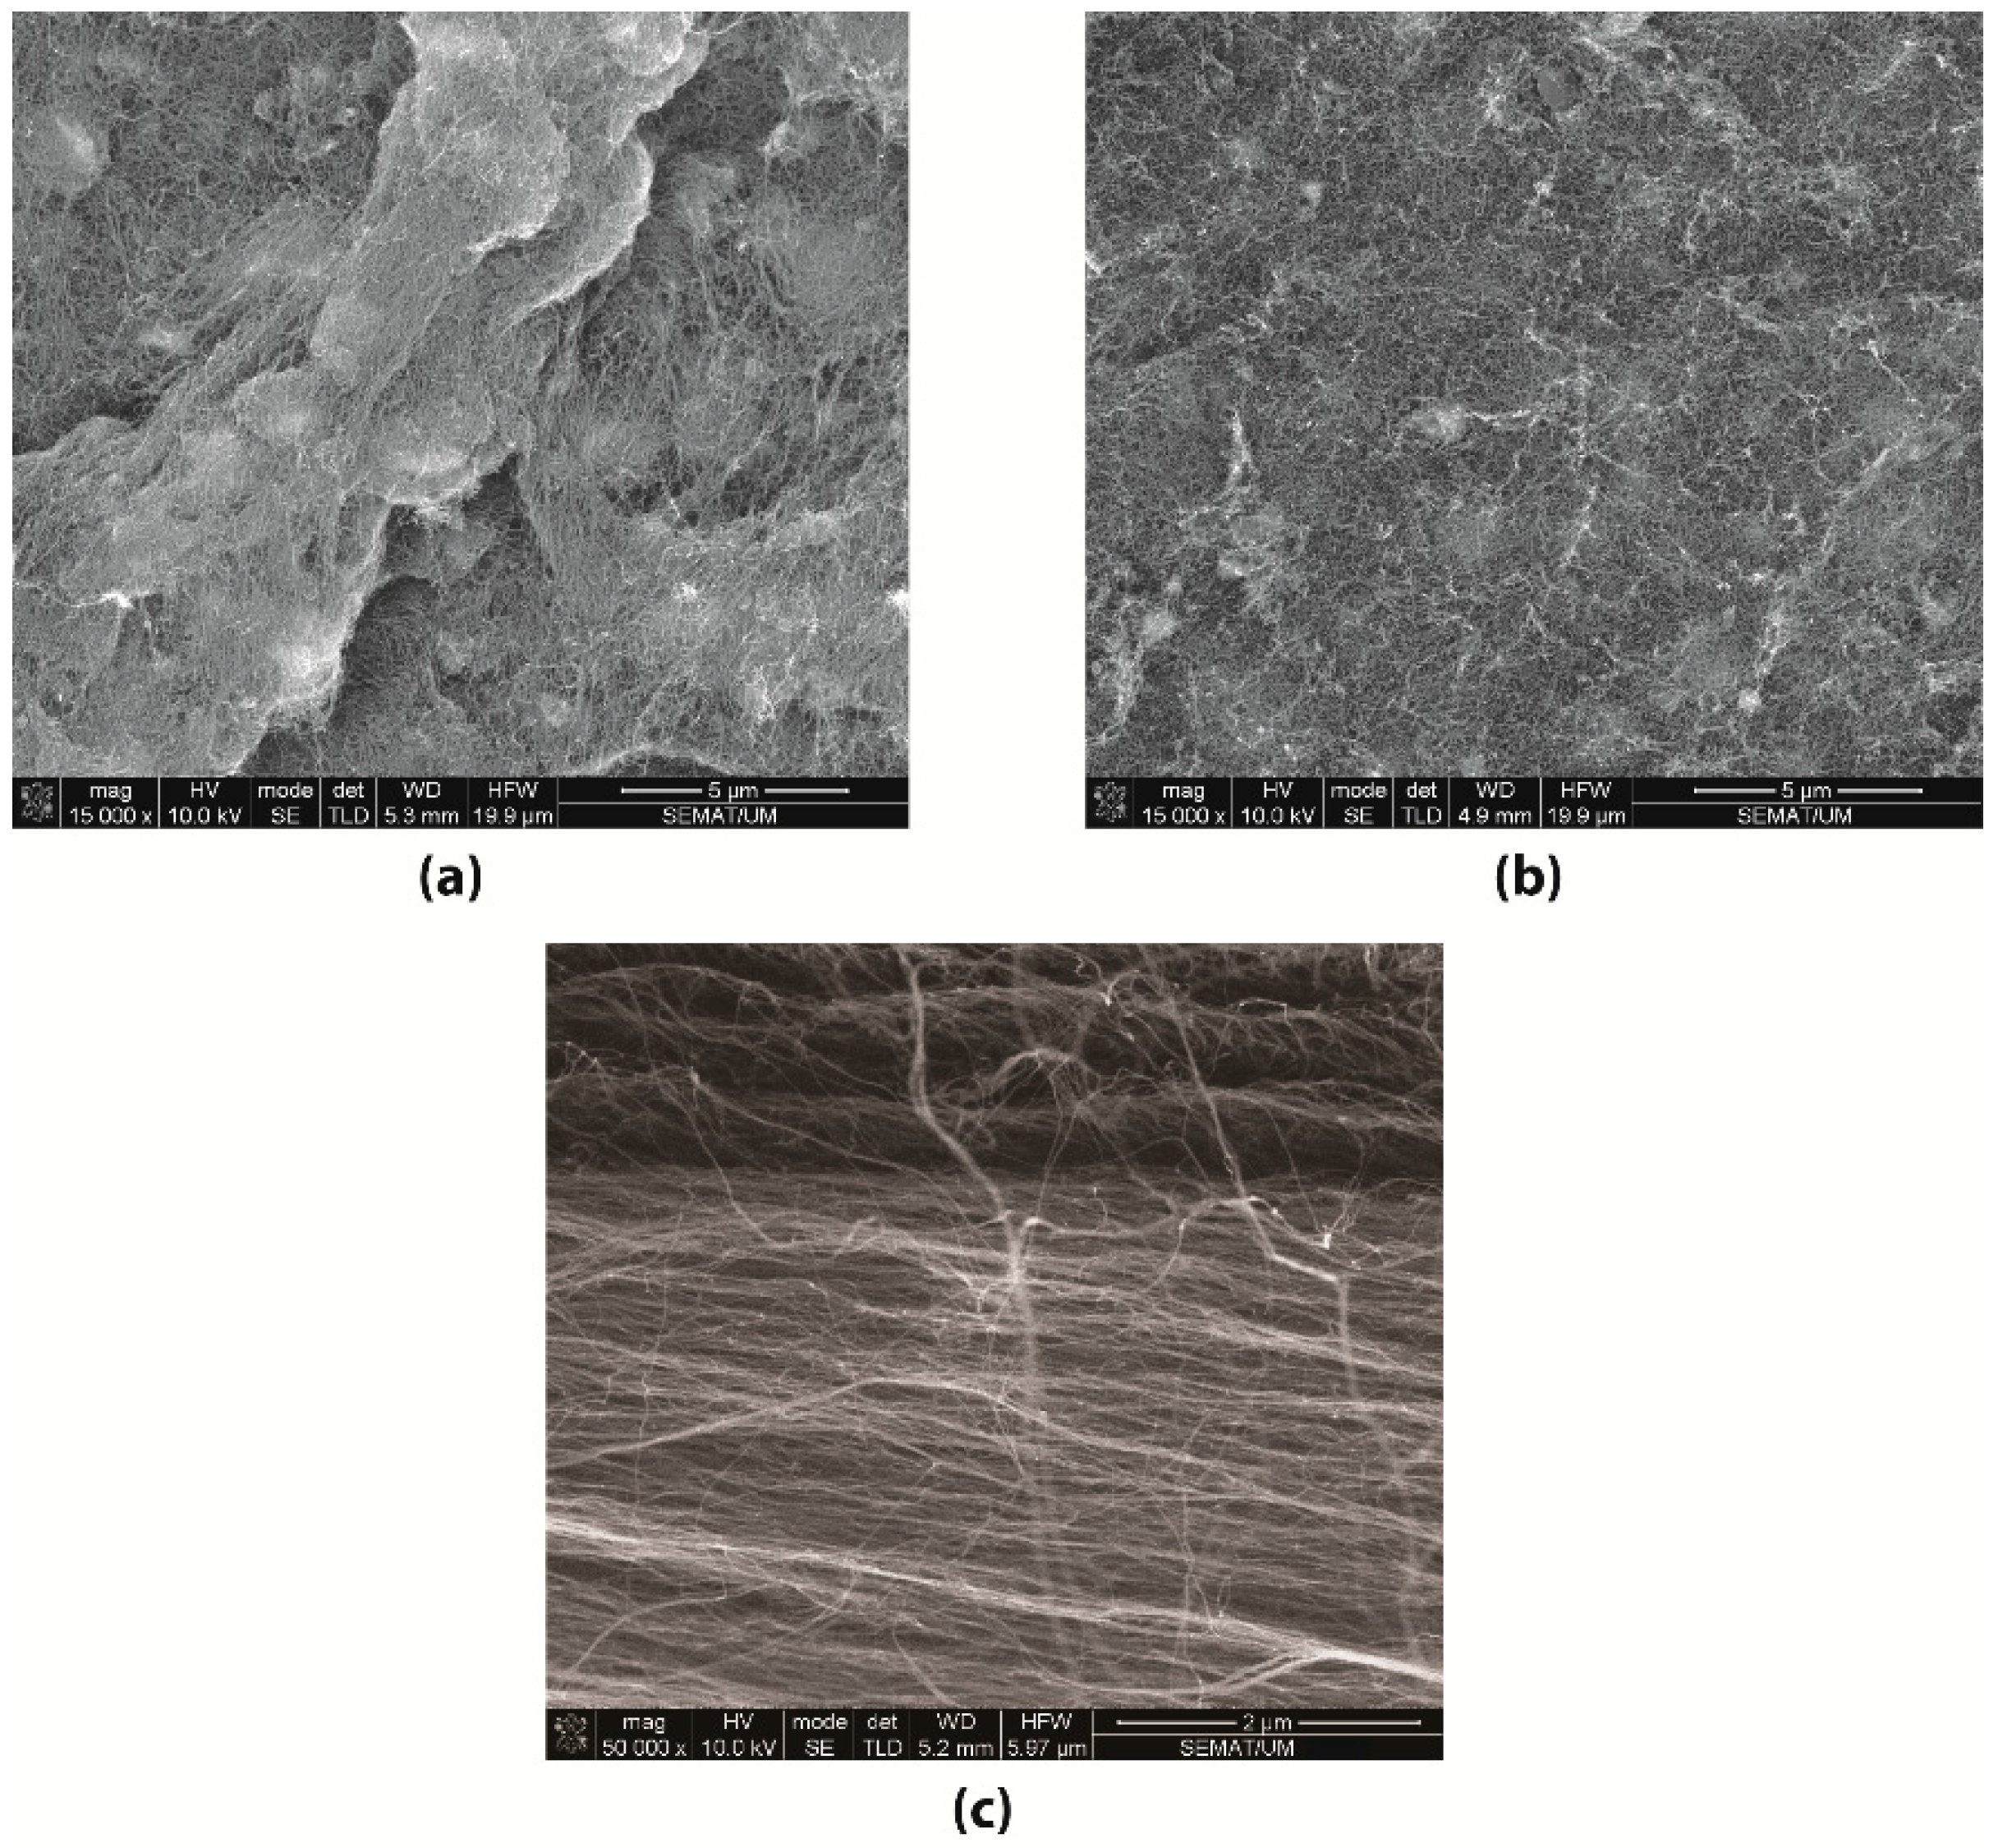
Vacuum filtration was the method used to produce the CNT Buckypapers with different dispersing agents. First, 0.025 g of commercial multiwall carbon nanotubes (NC7000TM from Nanocyl) were dispersed in 100 mL of DMF. The solution was stirred for 5 h and left in an ultrasonic bath (CREST ultrasonics, 240 V, 50/60 Hz) for 2 h [6]. Also, 0.025 g of CNTs were dispersed in 50 mL of ethanol with an ultrasonic tip (Hielscher UP200Ht) at 50% speed during 30 min [18]. The dispersions were filtrated through a porous nylon membrane (45 µm), washed with Millipore water, and then dried at 60 °C. The freestanding Buckypapers, BPDMF and BPETOH, respectively, were peeled off from the membrane and 10 × 10 mm squares were cut off and transferred onto the center of a polyimide film, PI (75 µm Kapton MP film). To measure the electrical resistivity of the samples, a silver conductive epoxy adhesive (8330S from MG Chemicals) was used as electrodes, as shown in Figure 1.

2.3. SEM Analysis

In order to characterize the surface morphology of the obtained CNT Buckypapers and the alignment of the knocked-down VA-CNTs, a scanning electron microscopy (SEM) analysis was carried out in a NanoSEM-200 apparatus from FEI Nova (FEI Europe, Eindhoven, The Netherlands).

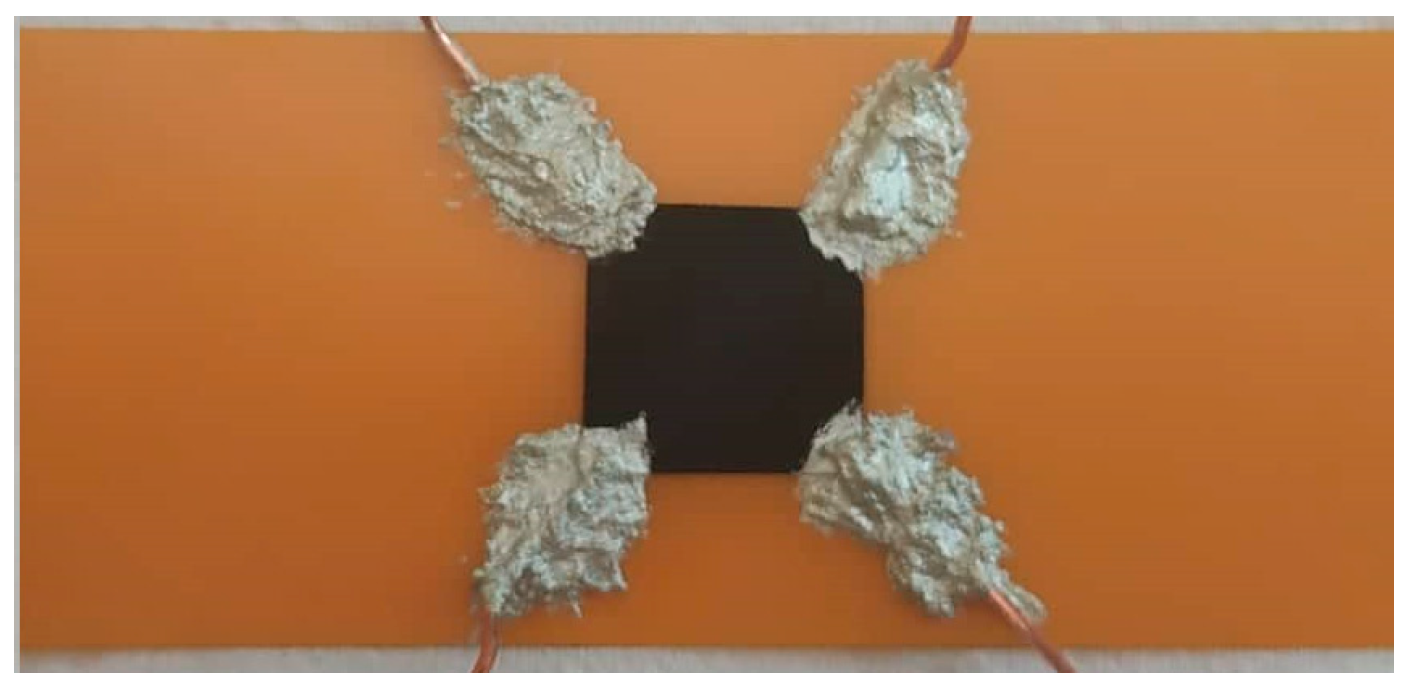
2.4. Electrical Resistivity versus Strain Measurements

A MATLAB software (R2018a, Mathworks, Natick, MA, USA) was used to determine the electrical properties of the samples with an adapted Van der Pauw method. The electrical resistivity, ρ, of the BP and aligned CNT-based sensors were calculated by Equation (1):
ρ = R s d
where d is the average thickness of the BP or of the aligned CNT patch, and the RS is a sheet electrical resistance experimental value obtained by a simple adaptation of a Van der Pauw equation (Equation (2)):
e π R v e r t i c a l / R s + e π R h o r i z o n t a l / R s = 1
where R v e r t i c a l and R h o r i z o n t a l are the means of the electrical resistance experimental values obtained in the strain and opposite directions, respectively. The electrical resistance values in axial strain and opposite (transverse) directions, Rstrain and Ropp, respectively, were determined using R s t r a i n R o p p = R s 2 and R s t r a i n / R o p p   values. Specifically, R s t r a i n / R o p p was obtained from Equation (3):
a 2 b R s t r a i n / R o p p = 0 π / 2 d φ 1 k 2 ( s i n φ ) 2 0 π / 2 d φ 1 ( s i n φ ) 2 + k 2 ( s i n φ ) 2
where a and b are the CNT patches square dimensions, which varies with the deformation of the polymeric film. Initially, a0 = b0 = 10 mm, and upon deformation increment, in strain direction: a = a0 + Δll is the elongation of the film considering the perfect adhesion between the electrodes and the film), and in the transverse direction: b = b0 − vεlt0 considering the Poisson ratio, v, of 0.34 for PI film, where ε is the mechanical strain and lt0 is the initial width of the film. The k value is obtained from Equation (4):
α = V D C / I A B V B C / I A D = l n 4 / k ( 1 / k + 1 ) 2 l n ( 1 / k 1 ) 2 ( 1 / k + 1 ) 2
where IAB and IAD are the injected currents in the CNT patch in two different directions and VDC and VBC are the respective voltages measured. A more detailed description can be found elsewhere [3].
The samples’ process of measuring the electrical resistivity versus strain was quite similar to that described previously [3]. The BPDMF/PI and BPETOH/PI samples were strained using a manual microtester and the elongation of the samples (∆l) was measured by a digital calliper (Mitutoyo). The relative electrical resistance, ∆R/R0, and gauge factor, GF (Equation (5)), which is the ratio between the relative electrical resistance and mechanical deformation, ε = ∆l/l0, were evaluated upon increased strain levels:
G F = Δ R / R 0 ε
where R0 is the initial (unstrained sample) electrical resistance. It is important to note that the GF values in the opposite direction of the applied strain were calculated using transverse deformation values and plotted versus axial strain deformation.

3. Results

3.1. SEM Analysis

From the SEM images of the BPDMF and BPETOH samples shown in Figure 2a,b, the CNTs appeared to be randomly dispersed within the Buckypapers. However, considerable CNT agglomerates can be seen in the BPDMF samples in comparison to the more homogenous surface of the BPETOH samples, which was also confirmed visually. The nonhomogeneous CNT dispersion observed in those BPDMF samples was what led to the production of Buckpapers using ethanol, BPETOH.
To assess the alignment of the knocked-down CNTs, an SEM analysis was also performed. As shown in Figure 2c, the CNTs were aligned almost in the horizontal direction (parallel to the PI substrate), despite some squashing of the sample due to the knocked down process.

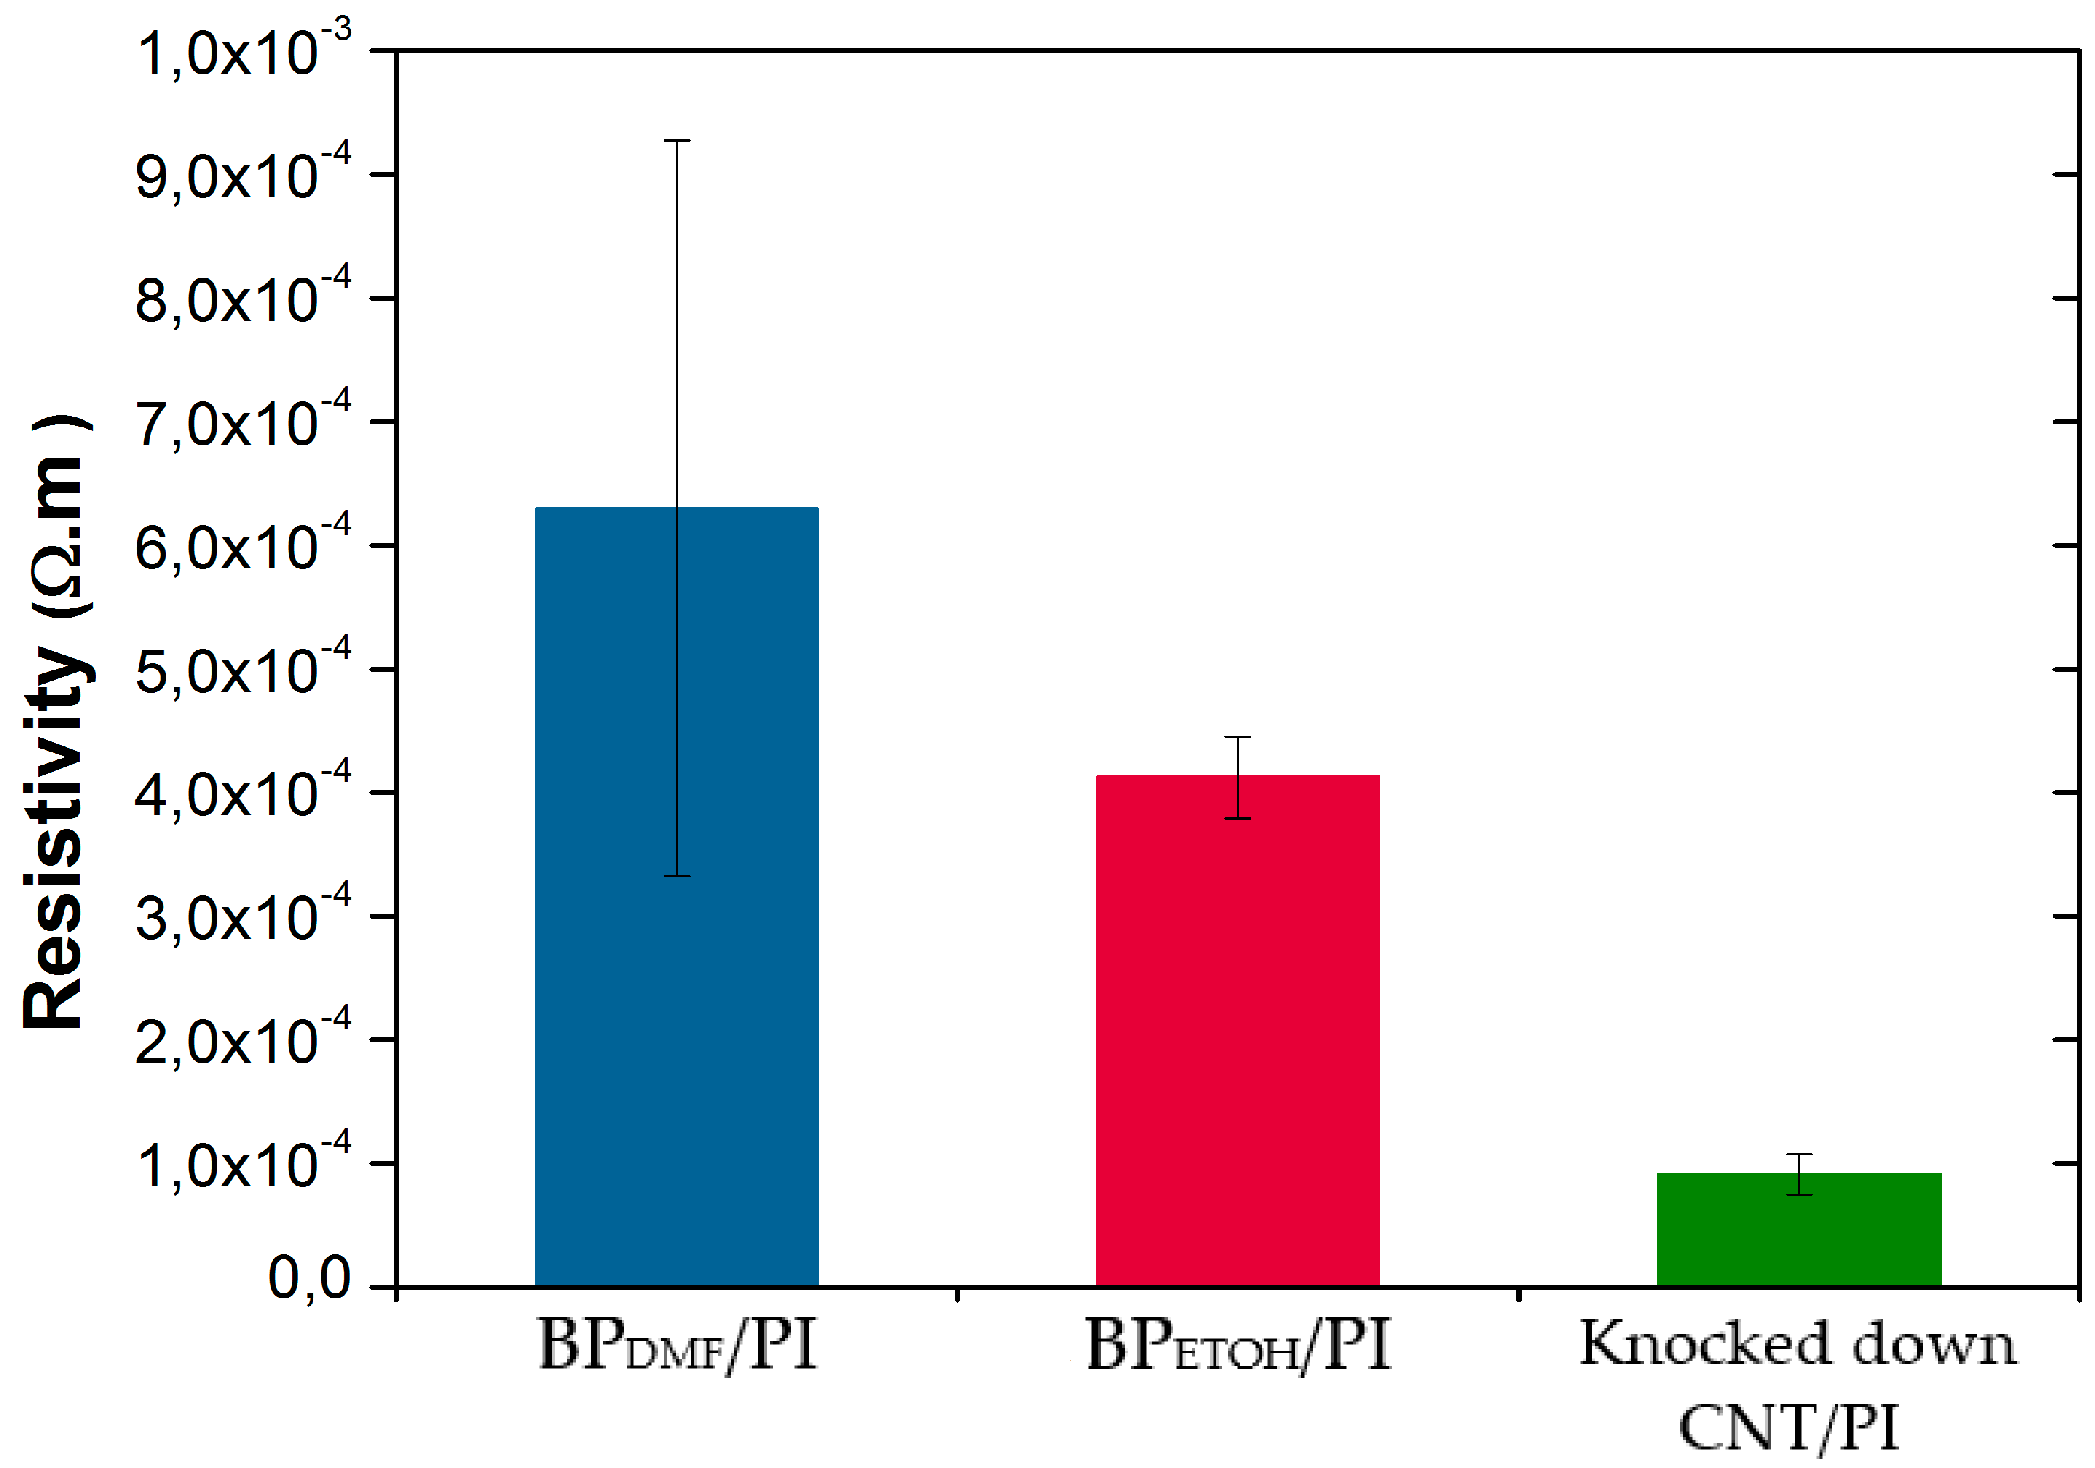
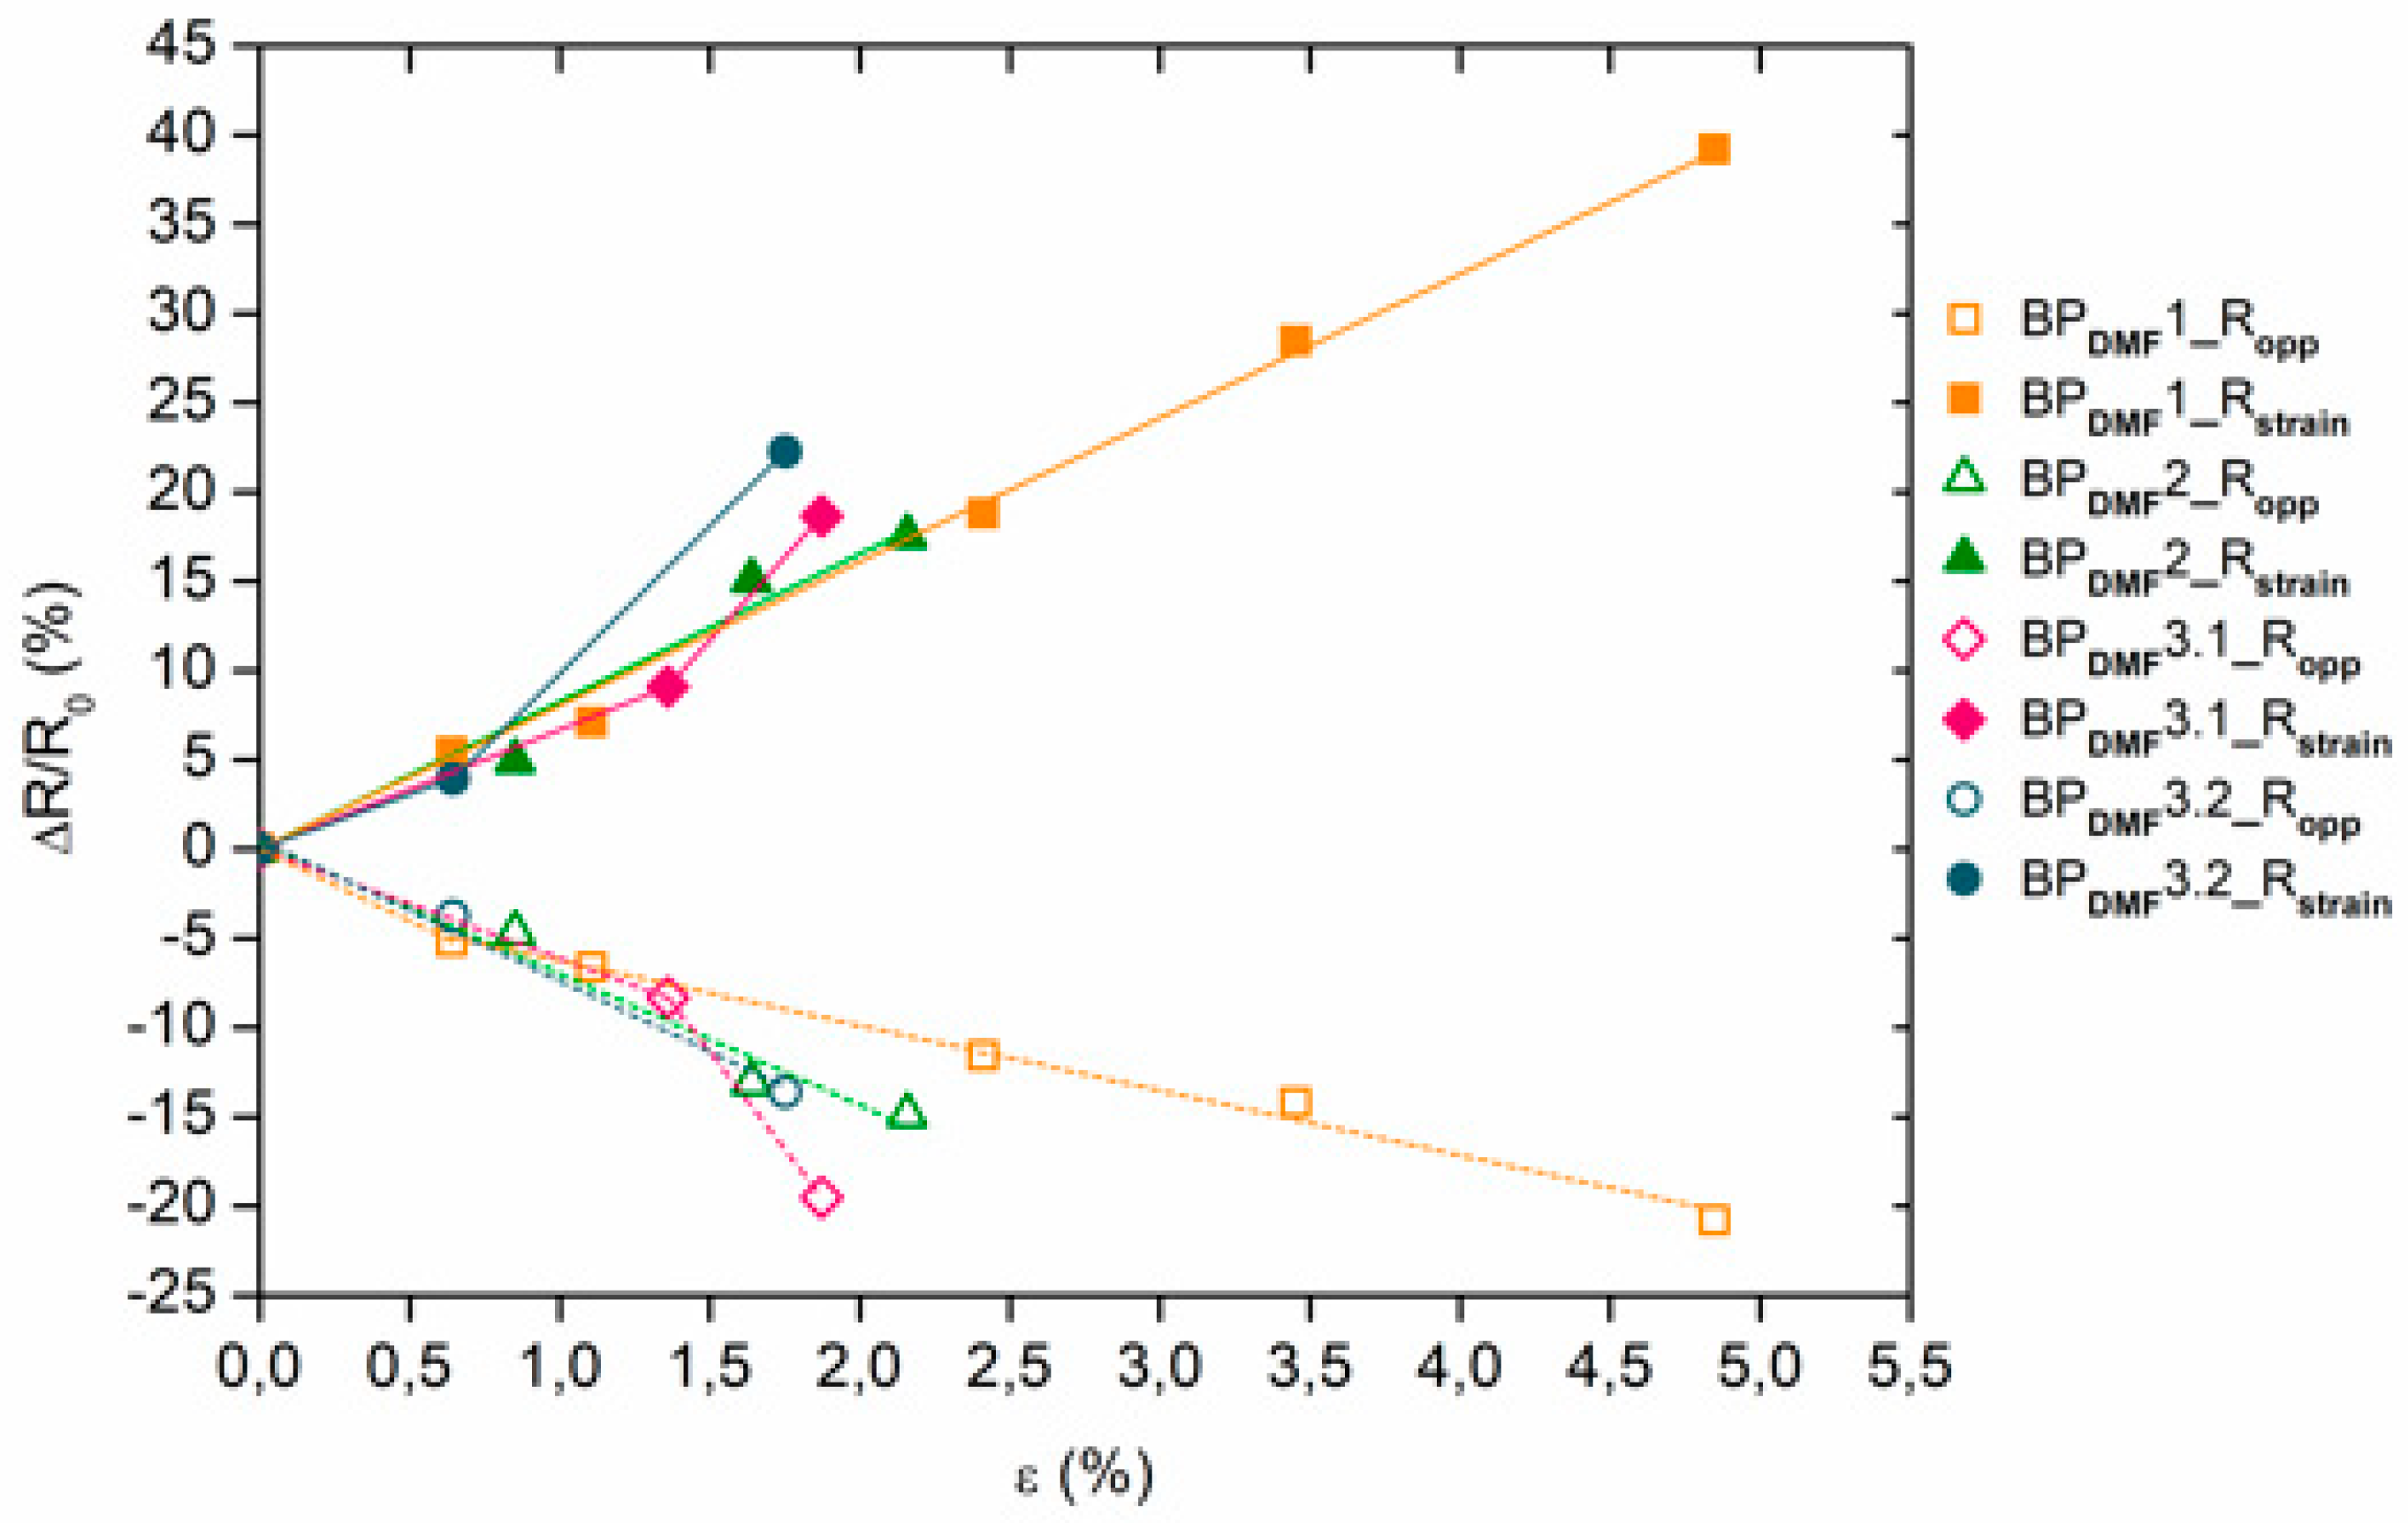
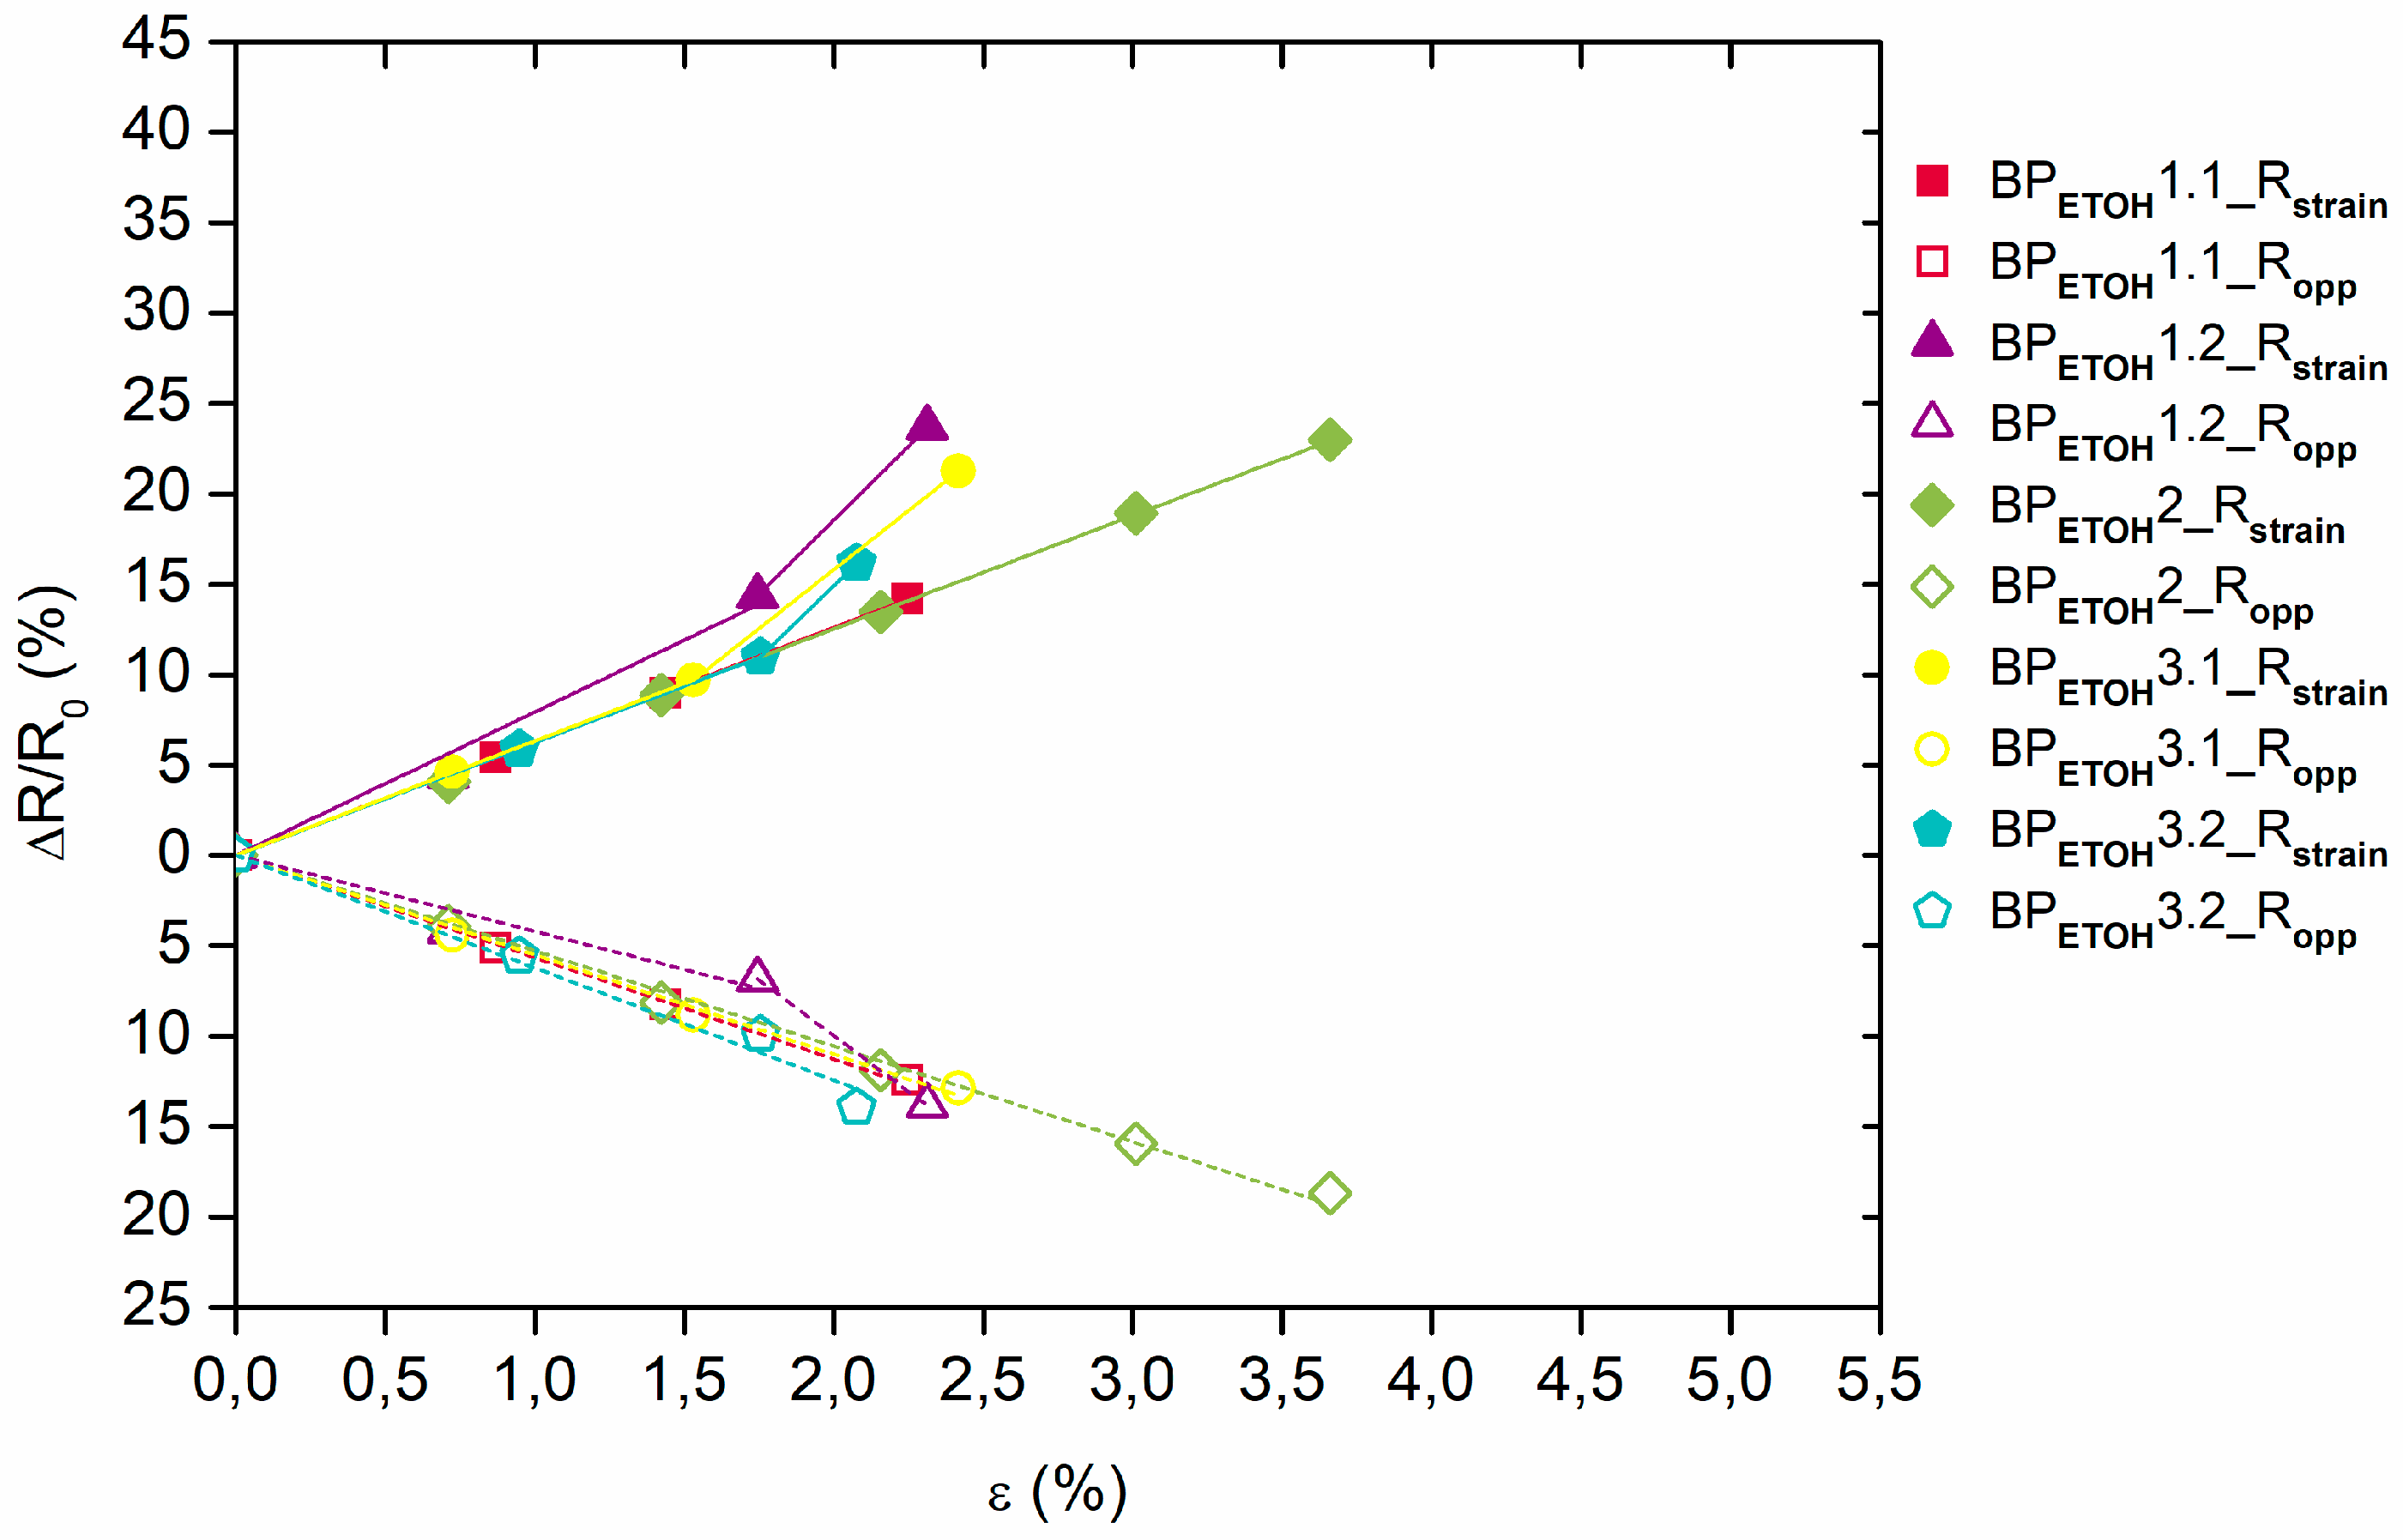
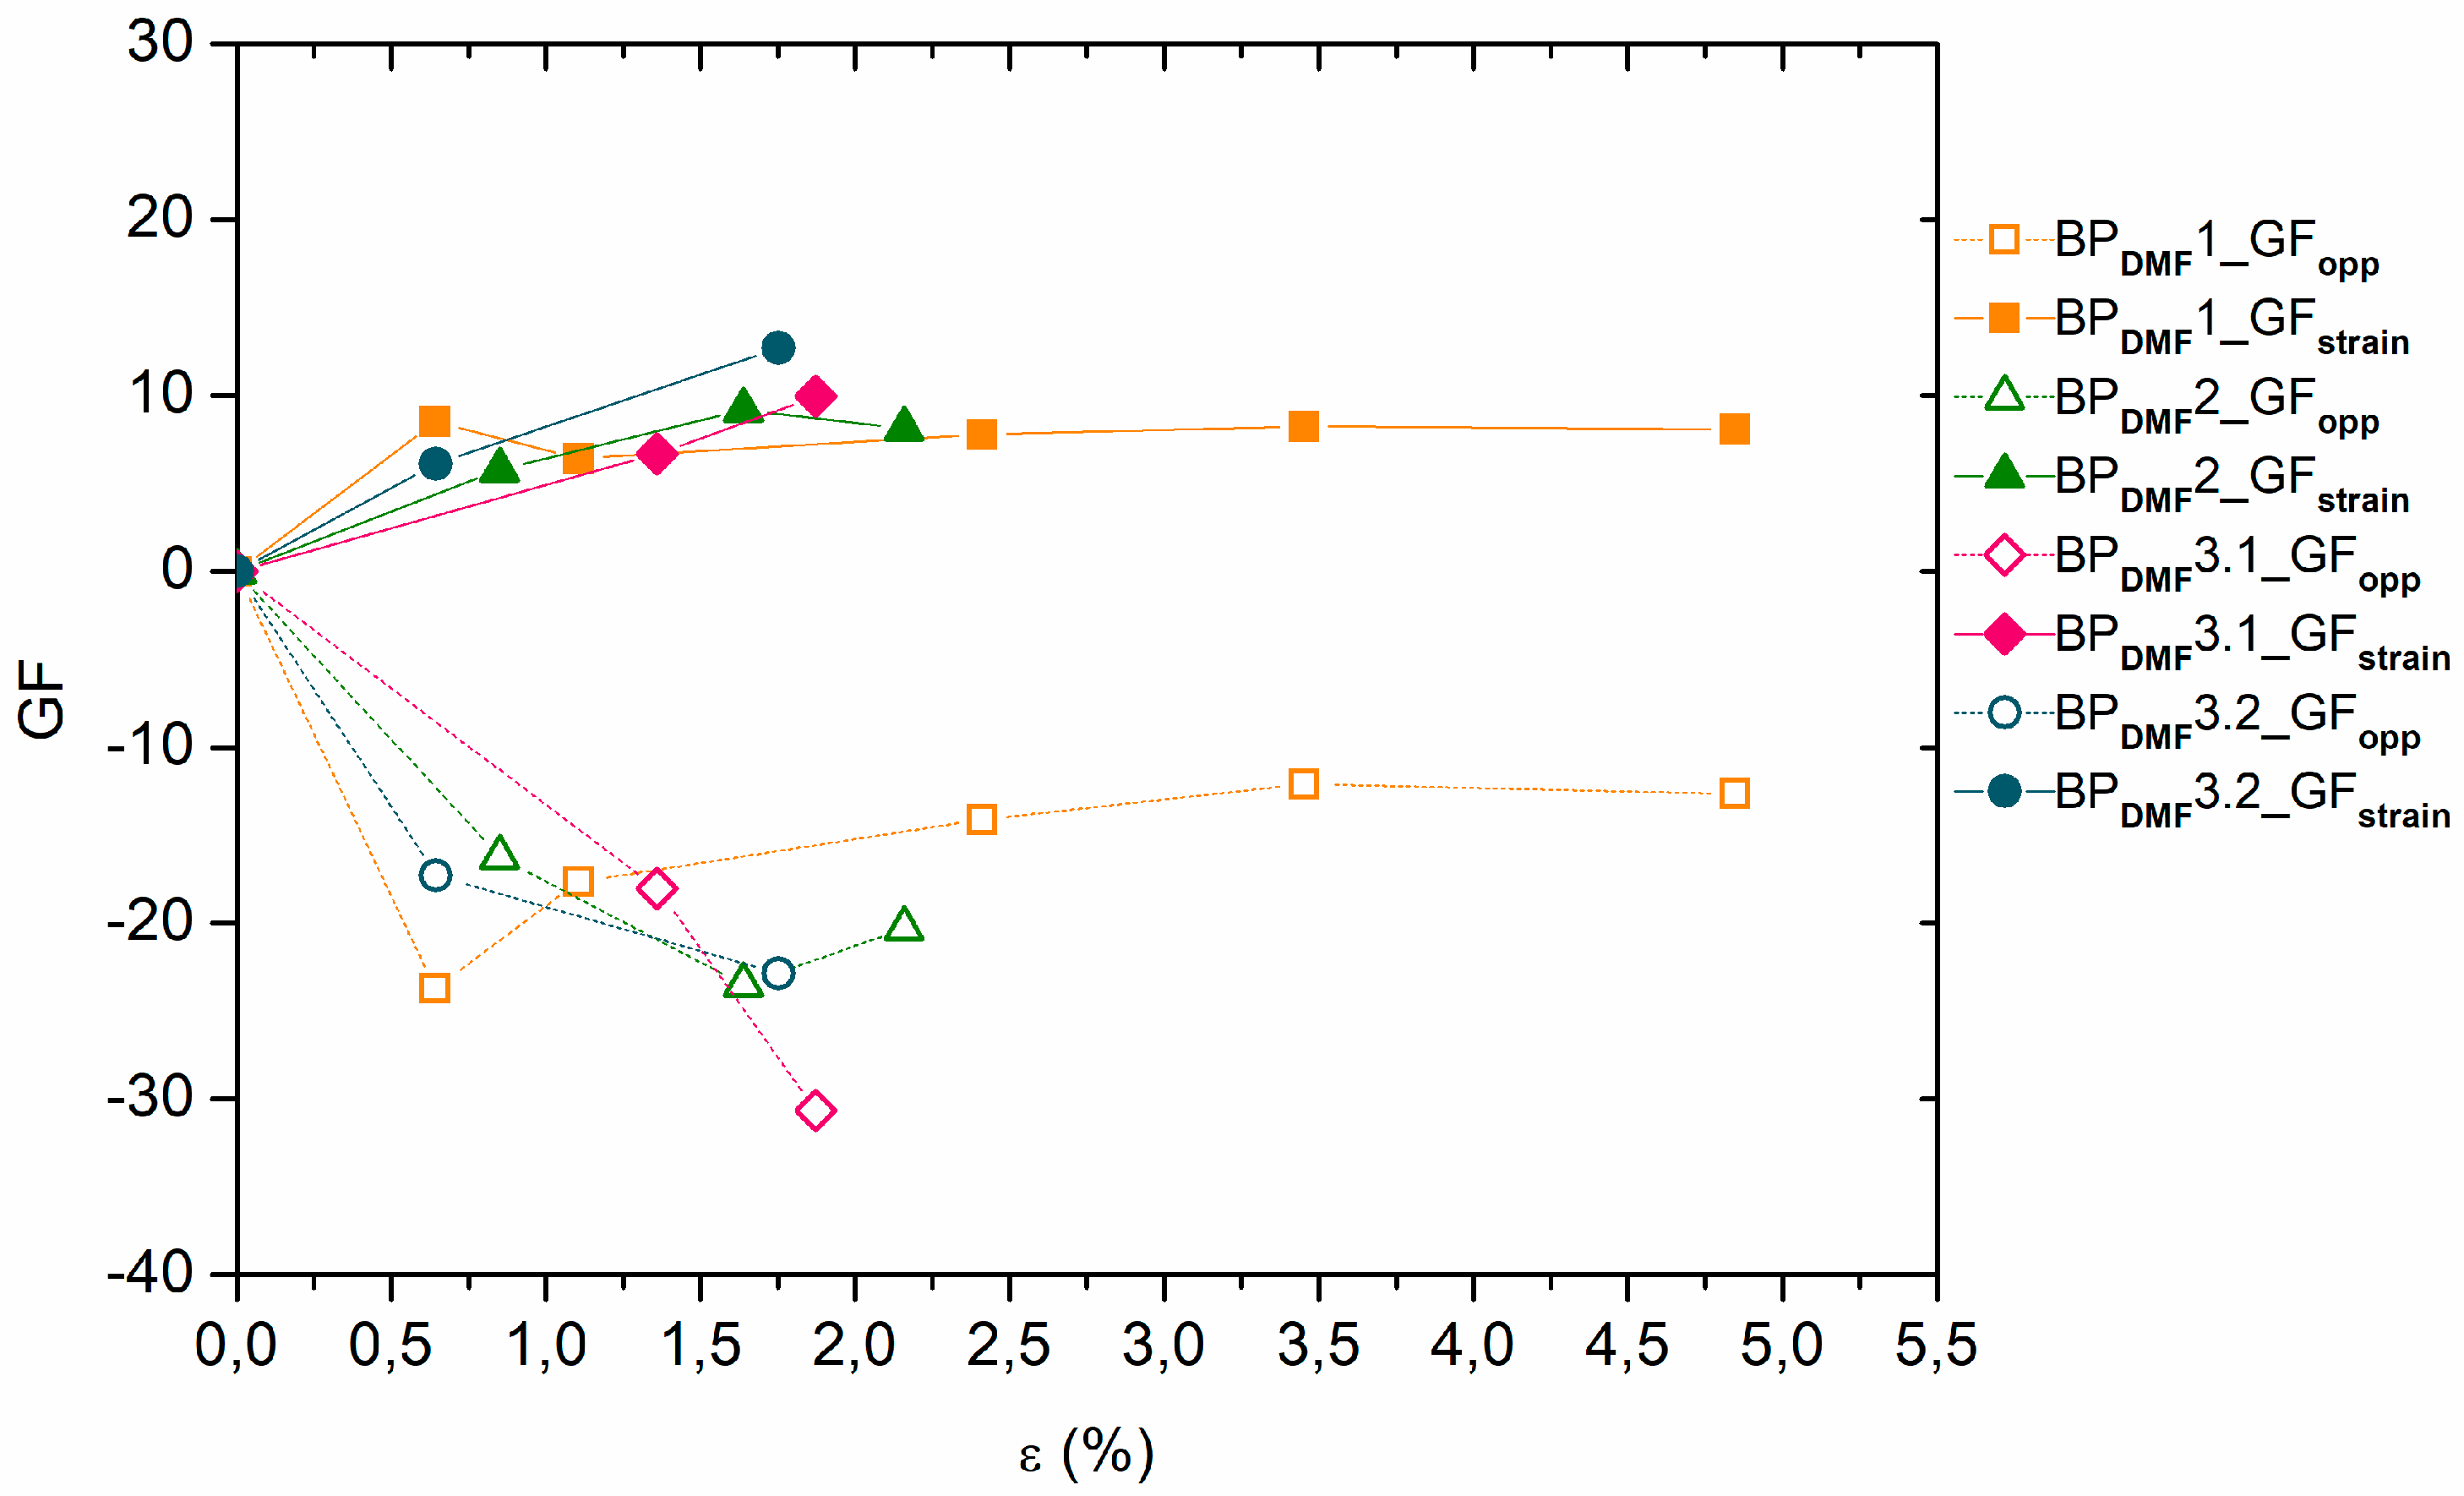
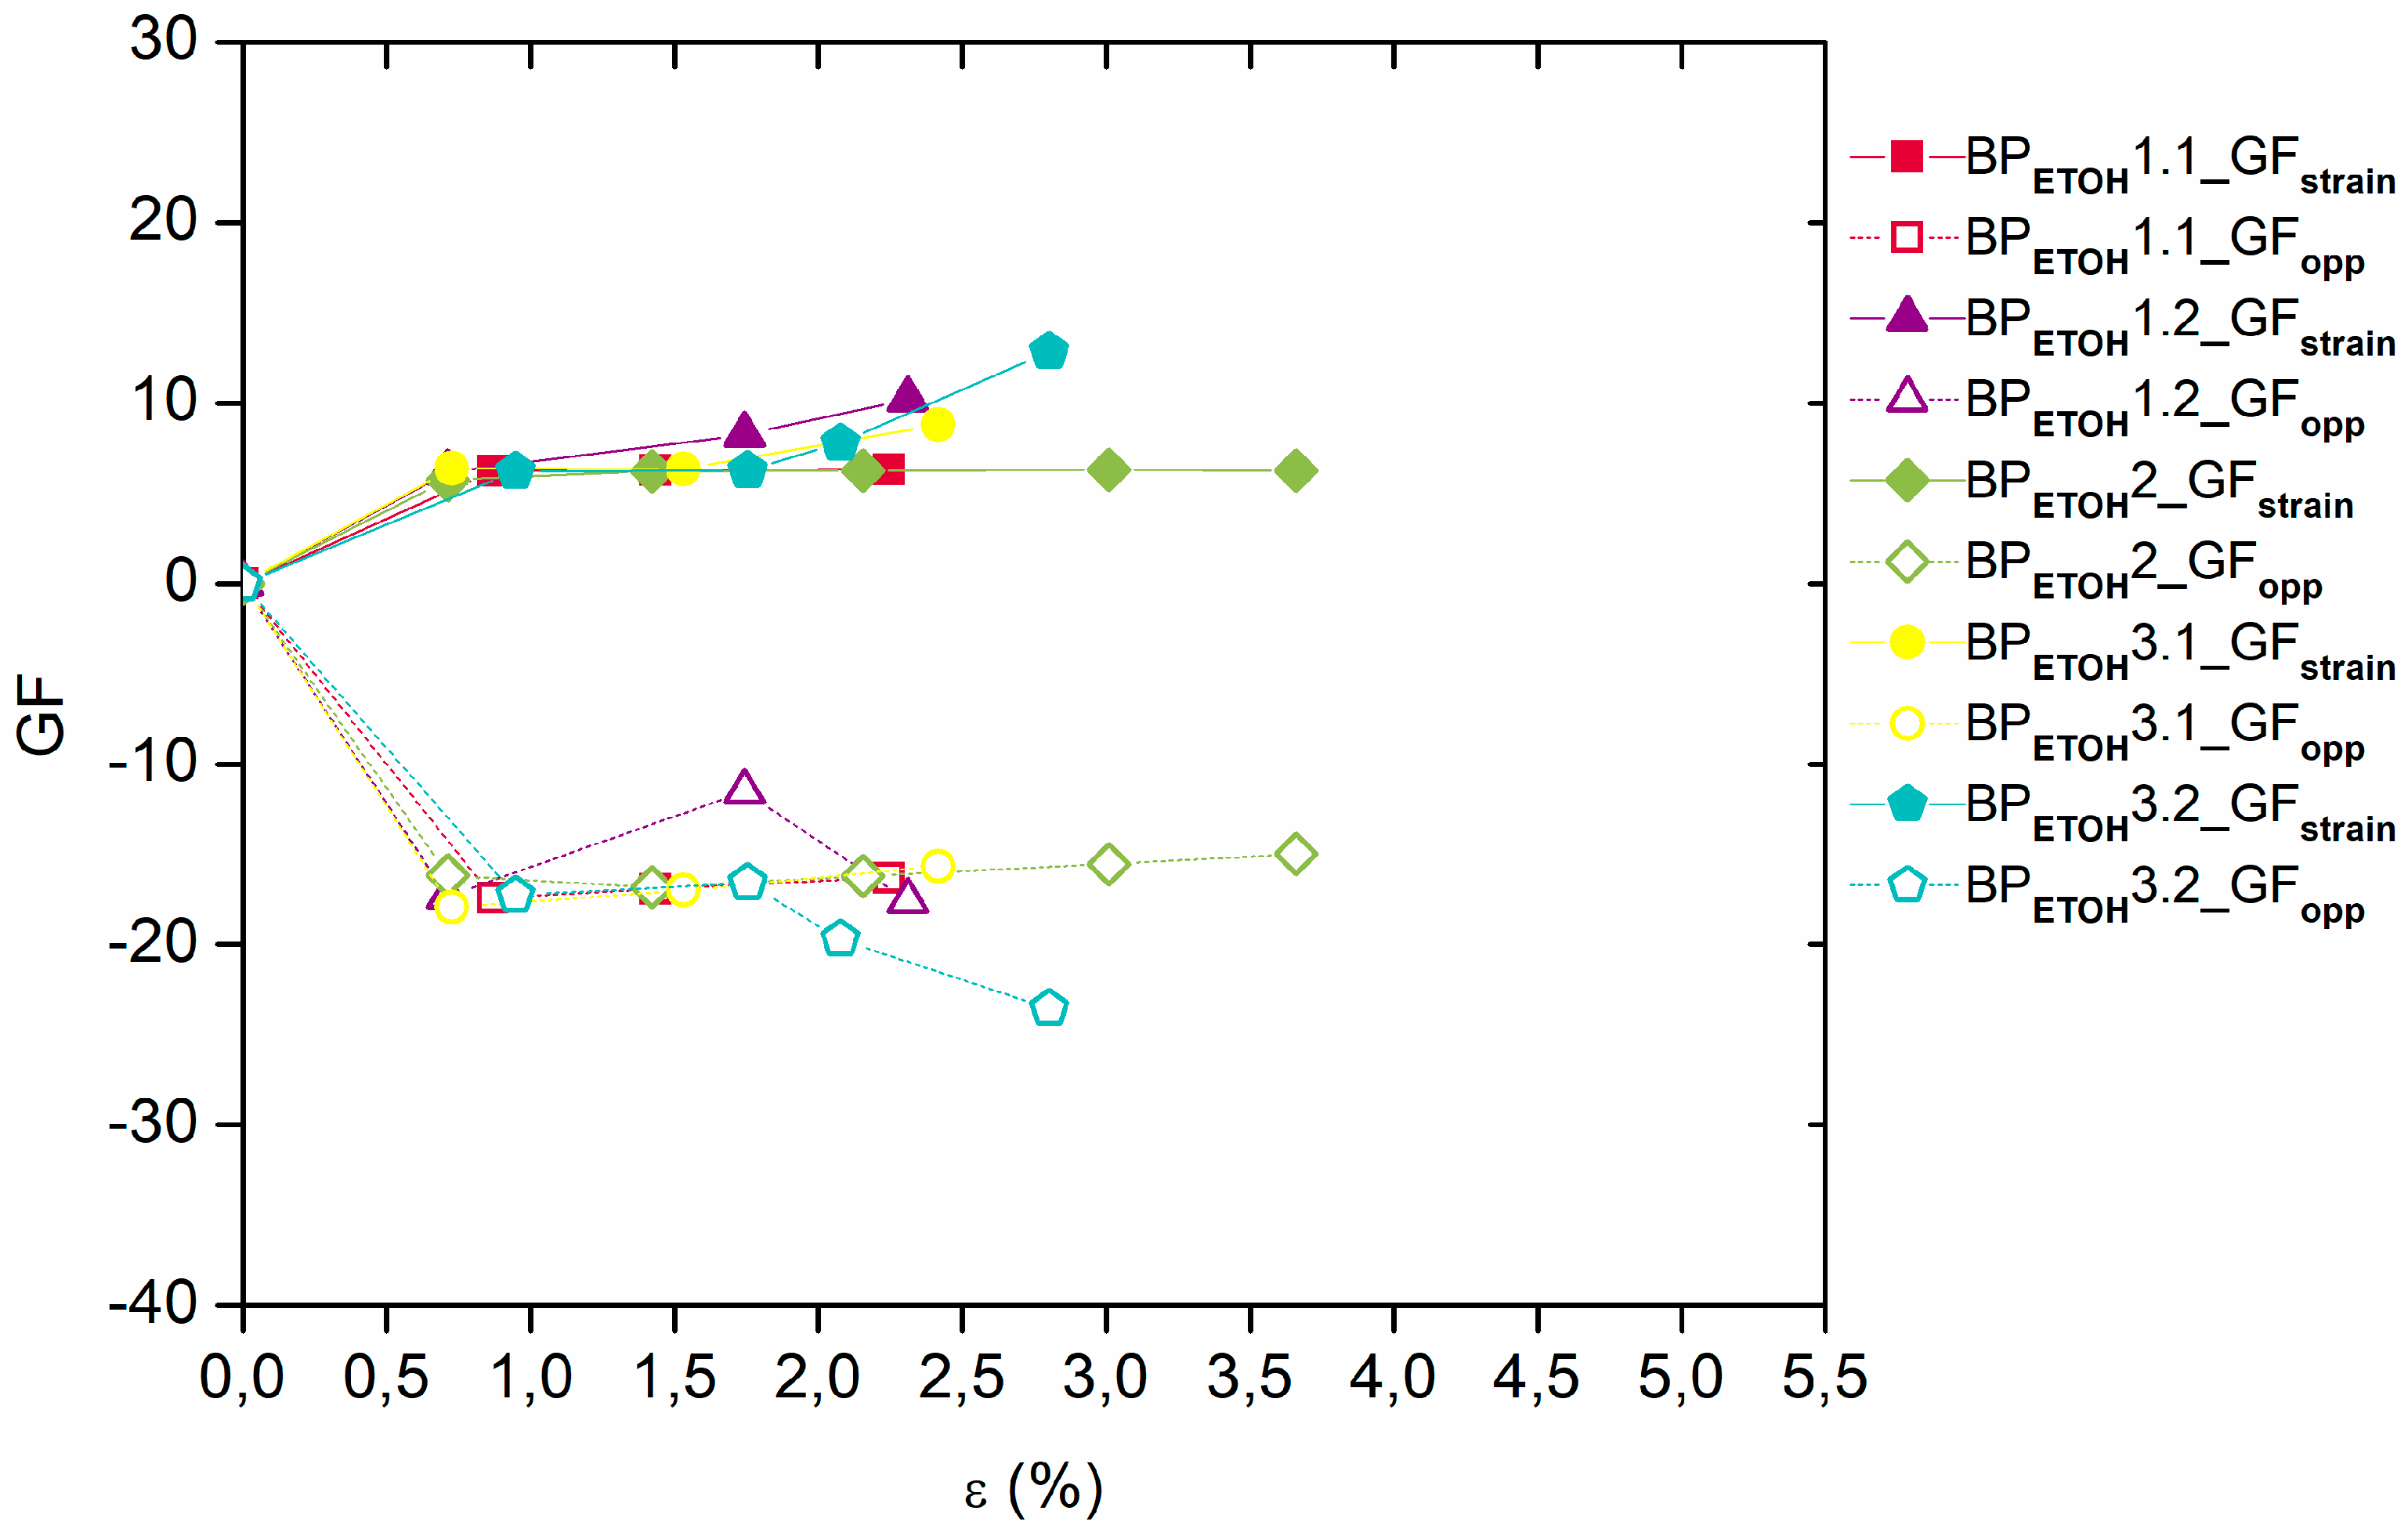
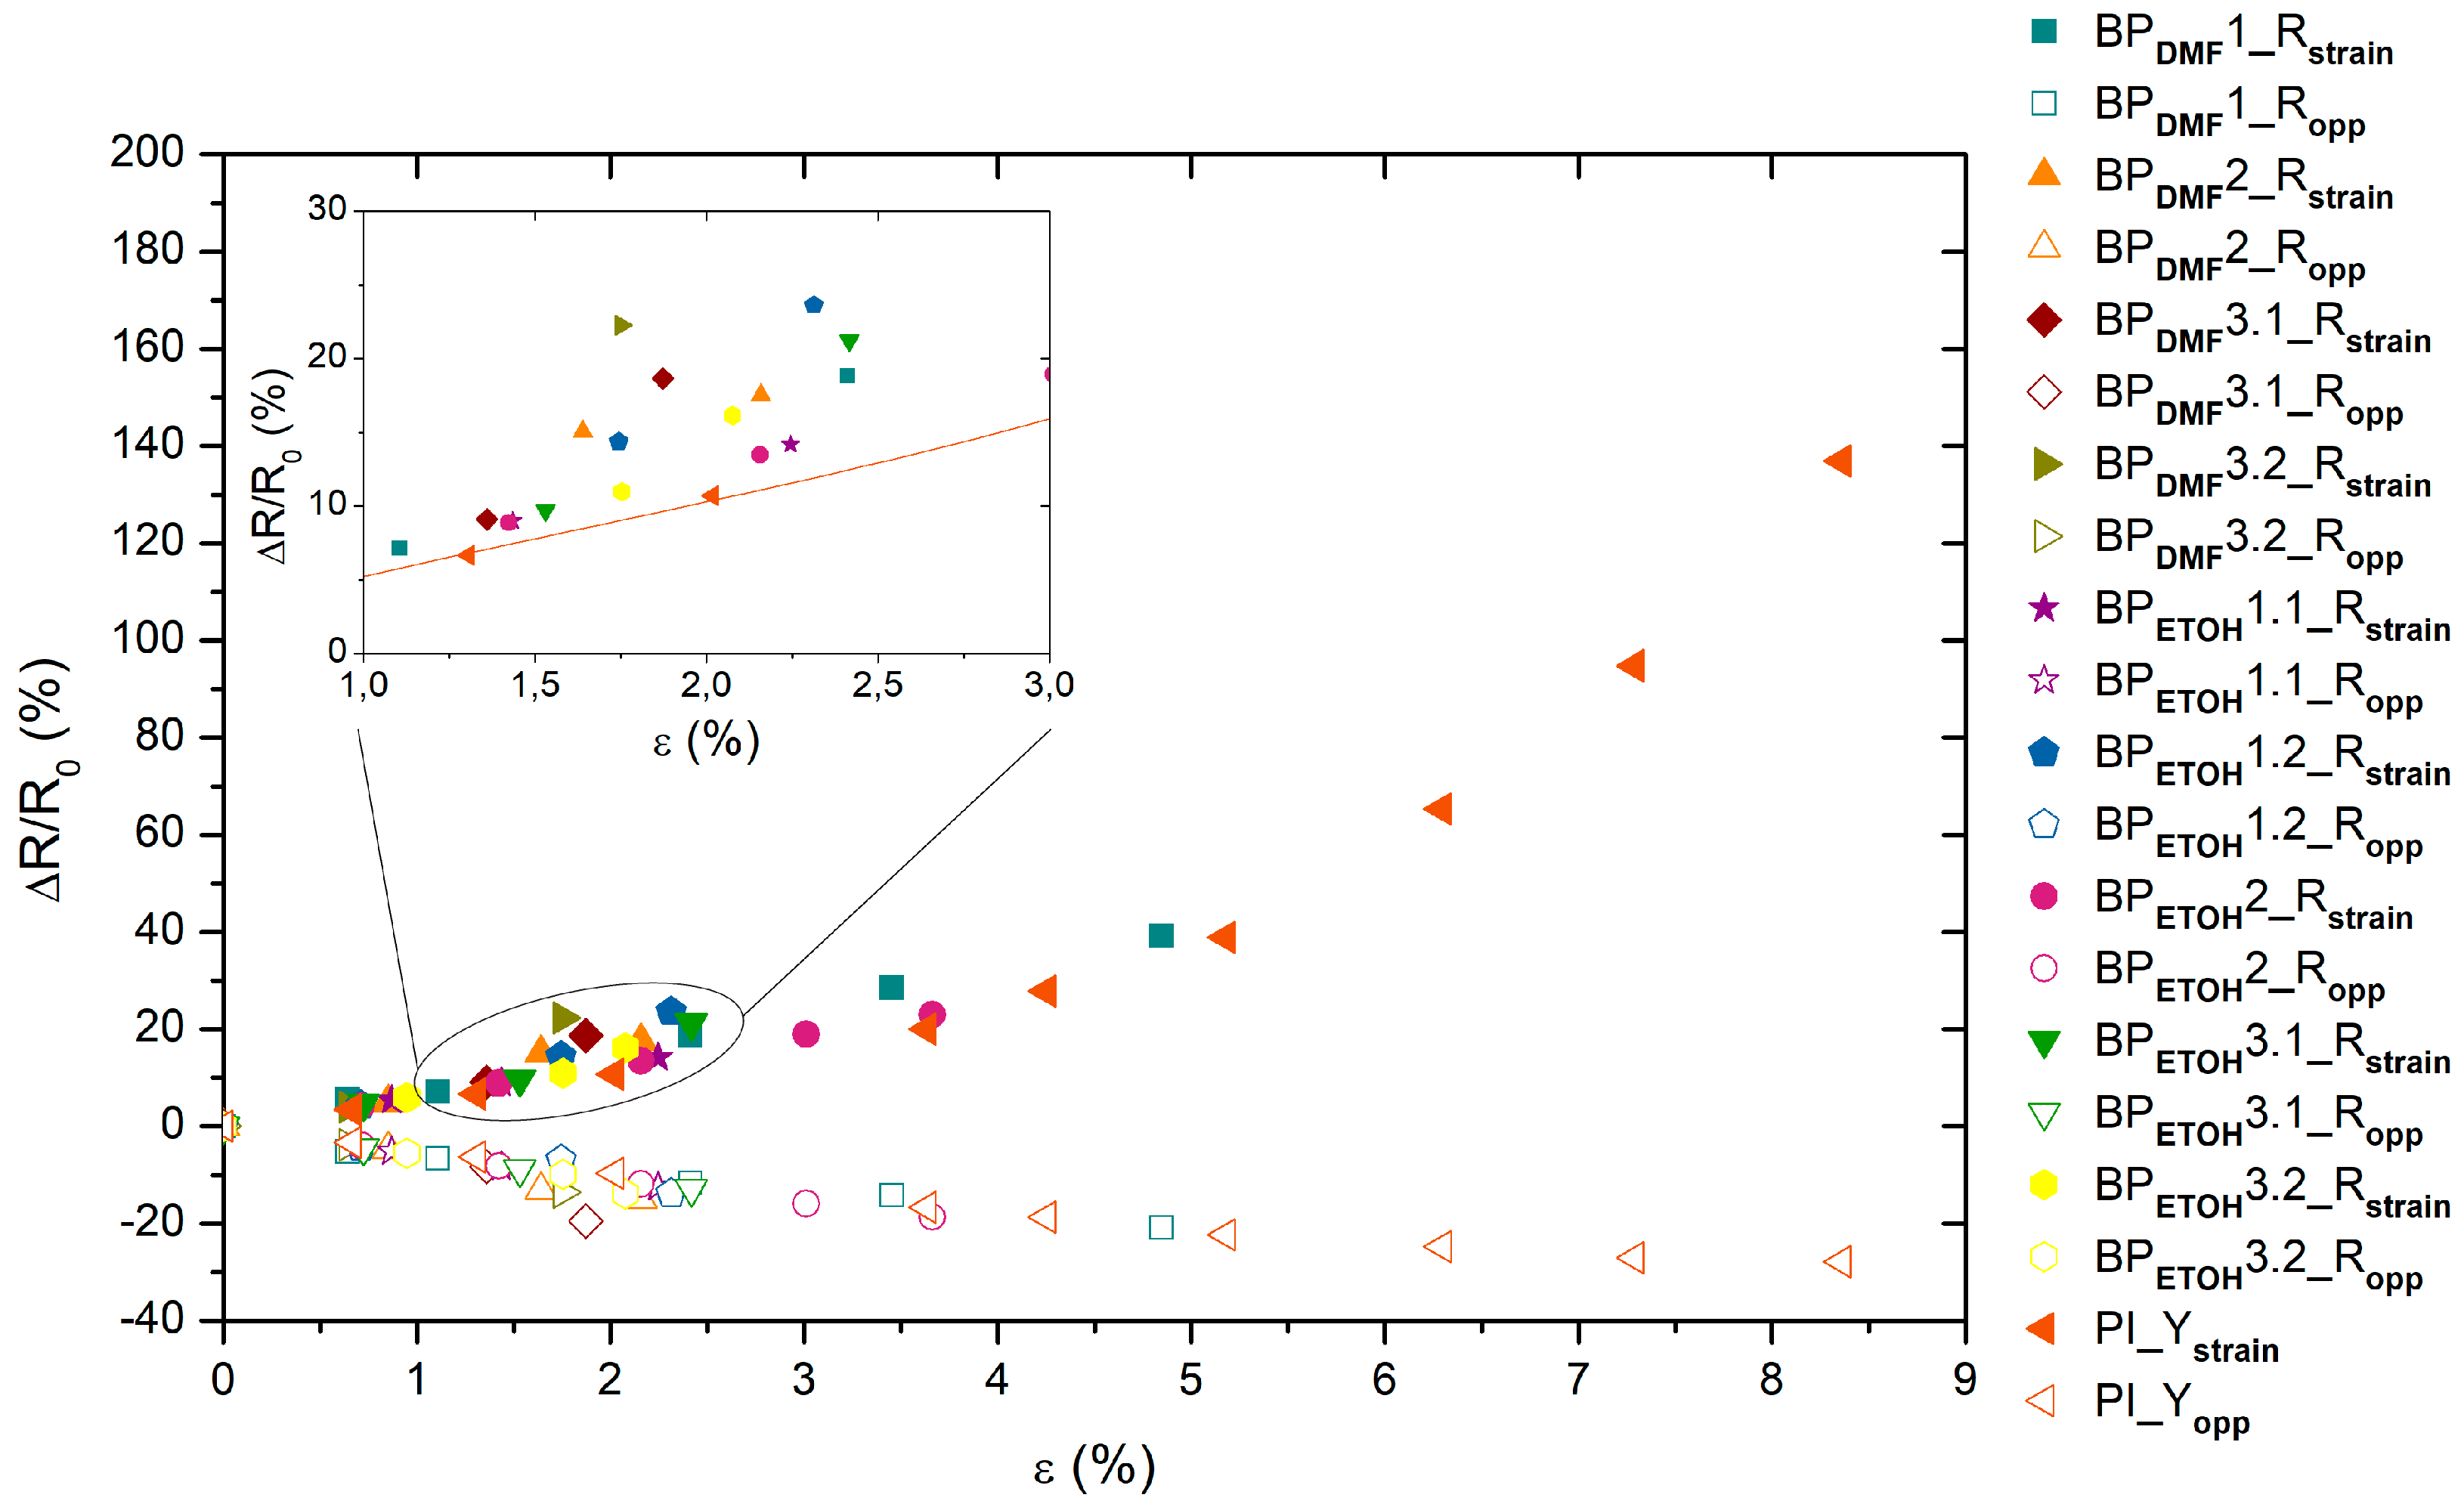
3.2. Electrical Resistivity versus Strain Measurements

As plotted in Figure 3, the initial electrical resistivity of the BPDMF/PI was higher than BPETOH/PI samples and showed more variability, probably due to the nonhomogeneous CNT distribution (as revealed by the SEM images), which compromises the number of conductive paths in the CNT network, thus increasing the electrical resistance. As expected, the knocked-down VA-CNT/PI samples showed the lowest electrical resistivity value due to the high CNT alignment. All these values were according to the ones reported elsewhere [6,18,25].
As shown in Figure 4 and Figure 5, the relative electrical resistance values in the strain direction of the BPDMF/PI and BPETOH/PI samples always increased, almost linearly, with the strain increments, while they decreased in the opposite direction. The BPDMF/PI samples that reached a mechanical breaking point at approximately 2% of deformation with a sudden steeper slope presented relative electrical resistance values between 17% and 22% in the strain direction and had similar behavior in the opposite direction. The relative electrical resistance of one of the BPDMF/PI samples reached, with a steady slope, values of 40% and −20% in strain and opposite directions, respectively, and higher deformations at break of 5%. These differences between relative electrical resistances in opposite directions are probably due to the Poisson contraction effect. In a similar way, most of the BPETOH/PI samples reached a deformation at break below 2.5%, with a sudden steeper slope, presenting relative electrical resistance values between 14% and 24% in strain direction and had also similar behavior in the opposite direction. One sample showed higher deformations at break of almost 4%, reaching a steady slope, approximately, 23% and −19% of relative electrical resistance in strain and opposite directions, respectively.
These results are according to the CNT–CNT junctions model for electrical conduction [26]: When stretched in the strain direction, the number of CNT–CNT junctions decreases with strain, resulting in a linear increase of the electrical resistance, while in the opposite direction, this number increases due to the Poisson contraction effect and the electrical resistance decreases.
As shown in Figure 6, the values of the gauge factor, GF, of the BPDMF/PI samples are almost constant between 7.7 and 9.4 in the strain direction, while in the opposite direction, a higher variability was observed, with values approximately between −24.3 and −16 (Table 1). Regarding BPETOH/PI samples (Figure 7), the values of the gauge factor, GF, are also almost constant in the axial strain direction, varying between 7.2 and 8.2, while in the opposite direction, a higher variability was observed, with values between −17.9 and −15.5 (Table 1). Both BP sensors showed higher sensitivity in opposite direction of strain (transverse) due to the fact that the GF values in that direction were calculated using transverse deformation despite being plotted against axial deformation. Therefore, a correction of these values with the Poisson ratio, ν, was presented in Table 1 and a similar sensitivity is then observed in the two different directions. Although, in the BPETOH/PI samples, the CNTs were much more homogeneously dispersed than in BPDMF/PI, the slight differences observed in the electrical properties are probably due to the presence of random agglomerates in both types of Buckypapers, as already reported elsewhere [19].
In Figure 8, the previous results are compared with the values for the knocked-down VA-CNT/PI-based sensor. Both sensor types are strain sensitive even at low strains, presenting relative electrical resistance values higher than some reported in the literature [6] (see also Table 2). The Buckypapers-based sensors show, with a linear trend, higher relative electric resistance values and, consequently, a higher sensitivity between approximately 1.5% and 2.5% of deformation (inset graph in Figure 8). However, the aligned CNT/PI sensors present an almost exponential trend, due to tunneling effect conductive mechanisms that become dominant, and thus, higher sensitivity to higher strains, and as seen in Table 1, their GF values in strain and opposite directions highlighted the sensitive differences due to CNT alignment.
In Table 2, the GF of the CNT-based sensors of this work are compared with others in the literature. The different fabrication methods and polymer matrices are also referred to.

4. Conclusions

Carbon nanotube Buckypaper-based strain sensors were successfully produced. Morphological differences between BPDMF and BPETOH were observed by SEM analysis, specifically the presence of CNT agglomerates in BPDMF. However, these CNT non-homogeneities did not seem to significantly influence the electrical properties, which did not present considerable variability between the two types of BP. Nevertheless, BPDMF-based sensors showed slightly higher GF values (7.7–9.4) compared with BPETOH-based sensors (7.2–8.2). These values are somewhat lower in the transverse direction, showing the quasi-isotropic electrical behavior of BP-based sensors. Despite showing higher relative electrical resistances (at low strain level) compared to the knocked-down VA-CNT/PI-based strain sensors, these latter showed higher mechanical performance and improved electrical properties. The deformation at break are much higher (8.4%) as compared with BP sensors (2.5%–2.7%). The GF of the knocked-down VA-CNT-based sensors are the highest (16.4) when stretched in the CNT direction. On the opposite direction, GF values are remarkably lower, evidencing the unique electrical anisotropic behavior of VA-CNT/PI-based sensors. Although the electrical conduction mechanisms in BP and knocked-down CNTs are dependent on the number of CNT–CNT junctions, the alignment of CNTs causes a variation of these numbers in opposite directions. Moreover, these aligned CNT sensors also show a tunneling effect that becomes predominant at higher strains. In the case of the isotropic BP sensors, the number of CNT–CNT junctions are identical in orthogonal directions, resulting in similar relative electrical resistance. Specifically, for VA-CNT sensors, in the CNT alignment direction, this number decreases with strain, increasing the electrical resistance, whereas in the opposed direction, this number increases, decreasing the electrical resistance at a slower rate.
This electrical anisotropic behavior of VA-CNT/PI sensors can be a huge advantage, potentially allowing us to identify the direction of applied strain. Their higher deformation capabilities also allow their use as large strain sensors, despite the loss of the linearity behavior.

Author Contributions

Conceptualization, A.S., L.A., J.P.N., J.C.V.; methodology, A.S., J.C.V.; software, A.S., L.A.R.; formal analysis, A.S.; investigation, A.S., A.F.S.; data curation, A.S.; writing—original draft preparation, A.S.; writing—review and editing, J.P.N., A.F.S., J.C.V.; visualization, A.S.; supervision, J.C.V., J.P.N.; project administration, J.C.V.; funding acquisition, J.C.V., please turn to the CRediT taxonomy for the term explanation.

Funding

This research was funded by the project “IAMAT—Introduction of advanced materials technologies into new product development for the mobility industries”, with reference MITP-TB/PFM/0005/2013, under the MIT-Portugal program exclusively financed by FCT—Fundação para a Ciência e Tecnologia.

Conflicts of Interest

The authors declare no conflict of interest. The funders had no role in the design of the study; in the collection, analyses, or interpretation of data; in the writing of the manuscript, or in the decision to publish the results.

References

  1. Bandaru, P.R. Electrical Properties and Applications of Carbon Nanotube Structures. J. Nanosci. Nanotechnol. 2007, 7, 1239–1267. [Google Scholar] [CrossRef] [PubMed]
  2. Shearer, C.J.; Cherevan, A.; Eder, D. Application and Future Challenges of Functional Nanocarbon Hybrids. Adv. Mater. 2014, 26, 2296–2318. [Google Scholar] [CrossRef] [PubMed]
  3. Santos, A.; Amorim, L.; Nunes, J.P.; Rocha, L.A.; Silva, A.F.; Viana, J.C. Aligned carbon nanotube based sensors for strain sensing applications. Sens. Actuators A Phys. 2019, 289, 157–164. [Google Scholar] [CrossRef]
  4. Bouhamed, A.; Müller, C.; Choura, S.; Kanoun, O. Processing and characterization of MWCNTs/epoxy nanocomposites thin films for strain sensing applications. Sens. Actuators A Phys. 2017, 257, 65–72. [Google Scholar] [CrossRef]
  5. Selvan, N.T.; Eshwaran, S.B.; Das, A.; Stöckelhuber, K.W.; Wießner, S. Piezoresistive natural rubber-multiwall carbon nanotube nanocomposite for sensor applications. Sens. Actuators A Phys. 2016, 239, 102–113. [Google Scholar] [CrossRef]
  6. Rein, M.D.; Breuer, O.; Wagner, H.D. Sensors and sensitivity: Carbon nanotube buckypaper films as strain sensing devices. Compos. Sci. Technol. 2011, 71, 373–381. [Google Scholar] [CrossRef]
  7. Zhang, L.; Zhang, G.; Liu, C.; Fan, S. High-Density Carbon Nanotube Buckypapers with Superior Transport and Mechanical Properties. Nano Lett. 2012, 12, 4848–4852. [Google Scholar] [CrossRef] [PubMed]
  8. Li, A.; Bogdanovich, A.E.; Bradford, P.D. Aligned Carbon Nanotube Sheet Piezoresistive Strain Sensors. Smart Mater. Struct. 2015, 24, 095004. [Google Scholar] [CrossRef]
  9. García, B.E.J.; Hart, A.J.; Wardle, B.L.; Slocum, A.H. Fabrication and Nanocompression Testing of Aligned Carbon-Nanotube—Polymer Nanocomposites. Adv. Mater. 2007, 19, 2151–2156. [Google Scholar] [CrossRef]
  10. Kamanina, N.V.; Likhomanova, S.V.; Kuzhakov, P.V. Advantages of the surface structuration of KBr materials for spectrometry and sensors. Sensors 2018, 18, 3013. [Google Scholar] [CrossRef]
  11. Adiloğlu, S. Perspective of the Structuration Process use in the Optoelectronics, Solar Energy, and Biomedicine. In Nanomechanics; IntechOpen: London, UK, 2017; Volume 8, pp. 167–183. [Google Scholar]
  12. Kanoun, O.; Müller, C.; Benchirouf, A.; Sanli, A.; Dinh, T.; Al-Hamry, A.; Bu, L.; Gerlach, C.; Bouhamed, A. Potential of Flexible Carbon Nanotube Films for High Performance Strain and Pressure Sensors. Nanotechnol. Opt. Sens. 2014, 14, 148–183. [Google Scholar]
  13. Kanoun, O.; Müller, C.; Benchirouf, A.; Sanli, A.; Dinh, T.N.; Al-Hamry, A.; Bu, L.; Gerlach, C.; Bouhamed, A. Flexible Carbon Nanotube Films for High Performance Strain Sensors. Sensors 2014, 14, 10042–10071. [Google Scholar] [CrossRef] [PubMed] [Green Version]
  14. Li, Y.; Kröger, M. A theoretical evaluation of the effects of carbon nanotube entanglement and bundling on the structural and mechanical properties of buckypaper. Carbon 2012, 50, 1793–1806. [Google Scholar] [CrossRef]
  15. Wang, X.; Lu, S.; Ma, K.; Xiong, X.; Zhang, H.; Xu, M. Tensile strain sensing of buckypaper and buckypaper composites. Mater. Des. 2015, 88, 414–419. [Google Scholar] [CrossRef]
  16. Li, C.; Zhang, D.; Deng, C.; Wang, P.; Hu, Y.; Bin, Y.; Fan, Z.; Pan, L. High performance strain sensor based on buckypaper for full-range detection of human motions. Nanoscale 2018, 10, 14966–14975. [Google Scholar] [CrossRef] [PubMed]
  17. Bu, L.; Steiz, J.; Kanoun, O. Influence of processing parameters on properties of strain sensors based on carbon nanotube films. In Proceedings of the 7th International Multi-Conference on Systems, Signals and Devices—Sensors, Circuits & Instrumentation Systems, Amman, Jordan, 27–30 June 2010. [Google Scholar]
  18. Tan, S.H.; Mariatti, M.; Mohamed, A.R.; Wan Dalina, W.A.D.; Mohd Ishak, Z.A. Fabrication and Properties of Multi-Walled Carbon Nanotubes Buckypaper. Adv. Mater. Res. 2015, 1108, 33–38. [Google Scholar]
  19. Dinh, T.N.; Steitz, J.; Bu, L.; Kaunoun, O. Influence of the composition of MWCNTs layers on the properties of strain gauges. In Proceedings of the 9th IEEE Conference on Nanotechnology, Genoa, Italy, 26–30 July 2009; pp. 477–480. [Google Scholar]
  20. Vennerberg, D.; Kessler, M.R. Anisotropic buckypaper through shear-induced mechanical alignment of carbon nanotubes in water. Carbon 2014, 80, 433–439. [Google Scholar] [CrossRef] [Green Version]
  21. Oh, J.Y.; Yang, S.J.; Park, J.Y.; Kim, T.; Lee, K.; Kim, Y.S.; Han, H.N.; Park, C.R. Easy preparation of self-assembled high-density buckypaper with enhanced mechanical properties. Nano Lett. 2015, 15, 190–197. [Google Scholar] [CrossRef]
  22. Yu, G.; Cao, A.; Lieber, C.M. Large-area blown bubble films of aligned nanowires and carbon nanotubes. Nat. Nanotechnol. 2007, 2, 372–377. [Google Scholar] [CrossRef]
  23. Lee, J.; Stein, I.Y.; Kessler, S.S.; Wardle, B.L. Aligned Carbon Nanotube Film Enables Thermally Induced State Transformations in Layered Polymeric Materials. ACS Appl. Mater. Interfaces 2015, 7, 8900–8905. [Google Scholar] [CrossRef] [Green Version]
  24. Stahl, J.J.; Bogdanovich, A.E.; Bradford, P.D. Carbon nanotube shear-pressed sheet interleaves for Mode i interlaminar fracture toughness enhancement. Compos. Part A Appl. Sci. Manuf. 2016, 80, 127–137. [Google Scholar] [CrossRef]
  25. Chen, G.; Futaba, D.N.; Hata, K. Interplay of wall number and diameter on the electrical conductivity of carbon nanotube thin films. Carbon 2014, 67, 318–325. [Google Scholar] [CrossRef]
  26. Hu, N.; Karube, Y.; Arai, M.; Watanabe, T.; Yan, C. Investigation on sensitivity of a polymer/carbon nanotube composite strain sensor. Carbon 2009, 48, 680–687. [Google Scholar] [CrossRef]
  27. Vertuccio, L.; Guadagno, L.; Spinelli, G.; Lamberti, P.; Tucci, V.; Russo, S. Piezoresistive properties of resin reinforced with carbon nanotubes for health-monitoring of aircraft primary structures. Compos. Part B Eng. 2016, 107, 192–202. [Google Scholar] [CrossRef]
  28. Pham, G.T.; Park, Y.B.; Liang, Z.; Zhang, C.; Wang, B. Processing and modeling of conductive thermoplastic/carbon nanotube films for strain sensing. Compos. Part B Eng. 2008, 39, 209–216. [Google Scholar] [CrossRef]
  29. Oliva-Avilés, A.I.; Avilés, F.; Sosa, V. Electrical and piezoresistive properties of multi-walled carbon nanotube/polymer composite films aligned by an electric field. Carbon 2011, 49, 2989–2997. [Google Scholar] [CrossRef]
  30. Park, M.; Kim, H.; Youngblood, J.P. Strain-dependent electrical resistance of multi-walled carbon nanotube/polymer composite films. Nanotechnology 2008, 19, 055705. [Google Scholar] [CrossRef] [PubMed]
Figure 1. Appearance of a test sample.
Materials 12 02013 g001
Figure 2. SEM images of the BPDMF (a), BPETOH (b), and knocked-down carbon nanotubes (CNTs) (c) samples.
Materials 12 02013 g002
Figure 3. Electrical resistivity values of the BPDMF, BPETOH, and knocked-down CNT samples.
Materials 12 02013 g003
Figure 4. Relative electrical resistance ∆R/R0 as function of the strain ε for the BPDMF/PI samples (Rstrain and Ropp values in axial strain and opposite (transverse) directions, respectively).
Materials 12 02013 g004
Figure 5. Relative electrical resistance ∆R/R0 as function of the strain ε for the BPETOH/PI samples (Rstrain and Ropp values in axial strain and opposite (transverse) directions, respectively).
Materials 12 02013 g005
Figure 6. Gauge factor (GF) versus strain ε for the BPDMF/PI samples (GFstrain and GFopp values in axial strain and opposite (transverse) directions, respectively).
Materials 12 02013 g006
Figure 7. Gauge factor (GF) versus strain ε for the BPETOH/PI samples (GFstrain and GFopp values in axial strain and opposite (transverse) directions, respectively).
Materials 12 02013 g007
Figure 8. Relative electrical resistance ∆R/R0 as function of the strain ε for the BPDMF/PI, BPETOH/PI and knocked down VA-CNT/PI sample strained in direction of CNT alignment (PI_Ystrain and PI_Yopp represent the value in strain and opposite directions, respectively).
Materials 12 02013 g008
Table 1. Summary of the sensitivity, electrical properties, and deformation at break (εb) of the BP and knocked-down VA-CNT-based sensors in the axial (strain) and transverse directions.
Sensor Typeεb (%)∆R/R0 (%)GFGFν *
AxialTransverseAxialTransverseTransverse
BPDMF/PI2.7 ± 1.3[17.5; 39.2][−20.8; −13.6][7.7; 9.4][−24.3; −16][−8.3; −5.5]
BPETOH/PI2.5 ± 0.6[14.2; 23.7][−18.7; −12.4][7.2; 8.2][−17.9; −15.5][−6.1; −5.3]
Knocked down VA-CNT/PI8.4137−27.816.4−9.8−3.3
* correction of GF values with the Poisson ratio, ν.
Table 2. Gauge factor (GF) values for CNT/polymer-based strain sensors. Acronyms: PMMA (polymethyl methacrylate), PSF (Polysulfone), PEO (polyethylene oxide).
Sensor TypeFabrication MethodGFReferences
AxialTransverse
BPDMF/PIDispersion; Vacuum filtration[7.7; 9.4][−24.3; −16]Present work
BPETOH/PIDispersion; Vacuum filtration[7.2; 8.2][−17.9; −15.5]Present work
Knocked down VA-CNT/PICVD; knock down16.4−9.8[3]
MWCNT BP/epoxyDispersion; Vacuum filtration; incorporation within the matrix≈0.85[6]
MWCNT/epoxySolution mixing; isothermal curing≈0.6[27]
MWCNT/PMMABulk mixing; melt processing15.32 (1 wt.% MWCNT)[28]
MWCNT/PSFSolution mixing; mould casting (AC alignment)2.68 (0.5 wt.% MWCNT)[29]
MWCNT/PEOSolution mixing; mould casting50 (2.9 wt.% MWCNT)[30]

