Article

Evaluating the Effects of KCl on Thermal Behavior and Reaction Kinetics of Medium Density Fiberboard Pyrolysis

State Key Laboratory of Fire Science, University of Science and Technology of China, Hefei 230027, China
*
Author to whom correspondence should be addressed.
Materials 2019, 12(11), 1826; https://doi.org/10.3390/ma12111826
Submission received: 16 May 2019 / Revised: 2 June 2019 / Accepted: 3 June 2019 / Published: 5 June 2019

Abstract

:
The effects of potassium chloride (KCl) on the pyrolysis of medium density fiberboard (MDF) were investigated by using thermogravimetry/Fourier-transfer infrared spectroscopy (TG-FTIR). Five MDF samples treated with different KCl concentrations (0%, 0.5%, 1%, 2% and 3%) were heated with a heating rate of 20 °C/min. The thermogravimetry (TG) results showed that KCl caused the primary pyrolysis stage towards lower temperatures. The FTIR results indicated that with the concentrations of KCl, the formation of CH4 and C=O functional groups decreased while the formation of CO2 and CO increased. To figure out the reason for the observed phenomena, the kinetic parameters in primary pyrolysis and the secondary charring reaction were estimated by a differential evolution (DE) optimization algorithm. The prediction indicated that KCl shifted the initial degradation temperature of each component of MDF towards a lower temperature. Char and gas yields increased with the concentration of KCl, whereas the tar yield reduced. The changes in activation energies revealed that KCl played a catalyst role in the reaction of resin, hemicellulose and cellulose in primary pyrolysis. For lignin, KCl had little effect. In the secondary charring reaction, KCl apparently promoted the reaction of tar. The catalytic effect of KCl on MDF pyrolysis was the combination of primary pyrolysis and the secondary charring reaction. Finally, the optimal catalytic concentration for KCl on MDF pyrolysis was analyzed.

1. Introduction

Medium density fiberboard (MDF) is extensively applied as an eco-friendly material in the fields of buildings, furniture and decoration in China. Global MDF production was more than 100 million m3 in 2017 and over 59 million m3 was produced by China [1]. However, there are some disadvantages exhibited by MDF. Firstly, the raw materials of MDF are derived from wood or other plants, which make it flammable. It is well known that solid combustion undergoes a pyrolysis process first. Secondly, a large amount of waste MDF is generated, owing to its unsteady structure. As a type of biomass, it is an ideal choice to recycle MDF waste as a renewable source [2]. Therefore, thermochemical conversion technologies are attracting increased attention due to the advantages in waste management [3,4]. Pyrolysis is a promising thermochemical technology used to transform these considerable amounts of waste into bio-oil, bio-char and gaseous products [5,6]. Thus, from the perspective of fire prevention and biomass energy recycling, it is very essential to study MDF pyrolysis characteristics and reaction kinetics.
Biomass is composed of extractives, hemicellulose, cellulose, lignin and a certain amount of inorganic species [7]. Alkali and alkali-earth metal (AAEM) present the major inorganic species in biomass, accounting for more than 85% [8]. The inorganic species have an obvious effect on the pyrolysis behavior of biomass and product yields [9,10]. A number of studies have been performed to investigate the effects of inorganic species on biomass pyrolysis. As observed by Raveendran et al., AAEM species influenced both the pyrolysis behaviors and the product yields strongly [9]. Scott et al. first conducted research into the effect of lime (CaO) on liquid products of biomass pyrolysis [11]. Nowakowski et al. suggested that the presence of potassium made the char yields increase from the short rotation willow coppice pyrolysis [12]. Shimada et al. found that potassium chloride and sodium chloride reduced the levoglucose yield, as well as promoted water, carbon monoxide and char formation [13]. As reported by Pan and Richards, potassium played a catalyst role in the process of pyrolysis reactions [14]. Patwardhan et al. compared the effects of different inorganic species on biomass pyrolysis and found that the presence of potassium and sodium reduced the yields of levoglucose, while calcium and magnesium had a much weaker effect [15]. Feng et al. observed that the gas and char yields increased with the increasing concentration of potassium and calcium, while tar yield decreased [8]. Despite these studies, the underlying reason of the observed changes in pyrolysis behaviors and product yields of biomass remains unclear. There is a necessity to figure out whether the observed changes are due to primary pyrolysis or secondary charring reactions.
As argued by Trendewicz et al., the major AAEM found in biomass are potassium, sodium, calcium and magnesium [16], which exist mainly in water soluble salts [17]. Compared with other inorganic species, potassium has a relatively large weight fraction in biomass [18,19,20]. In this paper, potassium was selected to investigate its effect on the pyrolysis of MDF. The aim of this paper was to determine the cause of the influence of potassium on the pyrolysis of MDF. First, the thermal behavior of MDF pyrolysis was observed by heating samples with varying potassium chloride (KCl) concentrations using a thermogravimetric analyzer (TG). Then, the effects of KCl on the gaseous pyrolysis products were studied by using Fourier-transfer infrared (FTIR) spectroscopy. The differential evolution (DE) algorithm coupled with the experimental data was employed to evaluate the reaction kinetics parameters. Finally, some empirical formulas of the reactions in MDF pyrolysis process were obtained based on the analysis of the changes in activation energies caused by potassium.

2. Materials and Methods

2.1. Material Samples

The MDF applied to performing this study was identical to that in the previous study [21]. The MDF particles sized less than 125 μm were derived from a Tyler sieve series. Proximate analysis was conducted using a TGA 701 thermogravimetric analyzer (LECO, San Jose, Michigan, USA). Ultimate analysis was performed using a TruSpec CHN (LECO, San Jose, Michigan, USA) and TruSpec S (LECO, San Jose, Michigan, USA) to detect the content of carbon, hydrogen, nitrogen and sulfur. The content of oxygen was calculated by difference. The proximate and ultimate analysis results of the MDF sample are shown in Table 1, where the values are the mean results obtained from three repeated tests.
In order to remove minerals from the MDF sample, a hot water wash procedure was applied. Firstly, 10 g of MDF was stirred with 200 ml of deionized water in a beaker for 5 h at 100 °C. Next, the washed MDF was filtrated and washed with 200 ml of deionized water again. Then, the wet sample was dehydrated in a drying oven at 100 °C for at least 24 h. The ash compositions of both raw and washed MDF samples were detected by XRF (FLUOROLOG-3-TAU, Jobin Yvon, Paris, France). All samples were tested for three times and the average results are presented in Table 2. This revealed that the content of potassium and chlorine in the ash decreased from 10.66 wt% to 1.25 wt% and from 0.53 wt% to 0.20 wt%, respectively. Thus, the removal rates of potassium and chlorine were 94.2% and 81.3% by water washing, respectively, since the ash content of the washed sample was about 2.32%.
To add potassium to the washed MDF sample, the sample was impregnated with KCl. In this work, based on the typical range of the potassium content in biomass [22,23], the washed MDF was doped with four KCl concentrations of 0.5, 1, 2 and 3 wt%. Taking 1 wt% loading concentration of KCl in the washed sample as an example, 0.005 g of KCl and 0.495 g washed sample were first added into 3 ml of deionized water in a beaker. Secondly, the mixture was stirred for 12 h to distribute the potassium salt uniformly. Then, the solution was dehydrated in an oven at 100 °C for at least 24 h. Finally, a total of five MDF samples with 0, 0.5, 1, 2 and 3 wt% KCl were derived.

2.2. TG-FTIR

The pyrolysis of samples were carried out using a TG-FTIR system comprised of a NETZSCH STA 449 F3 Jupiter (NETZSCH, Selb, Germany) thermal analyzer and a Fourier transform infrared (FTIR) spectrometer (PerkinElmer Frontier, Waltham, Massachusetts, USA). The samples of 8 ± 0.5 mg were heated from 30 to 800 °C at a heating rate of 20 °C/min with a gas flow of 80 ml/min under a nitrogen atmosphere. Aside from this, the transfer pipe connecting the TG analyzer and FTIR was heated to a constant temperature of 280 °C to minimize the condensation of gases during the pyrolysis process. FTIR spectra were recorded from 4000 to 450 cm−1 with a scan frequency of 20 times per minute to identify the composition of the gas products. There was a delay of about 2 minutes between the FTIR record and TG results because it required time for gas to fill the spectrometer. All of the experiments were repeated at least three times to achieve a good repeatability.

2.3. Kinetic Reaction Scheme

In our previous study [21], MDF was considered as being comprised of resin, hemicellulose, cellulose, and lignin. Each component reacts as an nth order Arrhenius-type reaction: Component i γ i T a r + δ i G a s e s + σ i C h a r , step 1; Tar τ G a s e s + θ C h a r , step 2, where step 1 represents the primary pyrolysis, and step 2 denotes the secondary charring reaction; γi, δi and σi indicate the yield coefficient of tar, gases and char for component i, respectively. τ and θ refer to as the yield coefficient of gases and char for tar, respectively. Based on the scheme, the associate equations can be expressed as follows:
The reaction rates and decomposition rates for reactions in step 1 can be expressed by
d W i d t = A i e x p ( E i R T ) W i , 0 ( W i W i , 0 ) n i ,
d α i d t = A i e x p ( E i R T ) ( 1 α i ) n i ,
where Wi and Wi,0 represent the instantaneous and the initial mass fraction of component i, respectively. Ai, Ei and ni denote the pre-exponential factor, activation energy and reaction order of the reactions of component i, respectively; R stands for the gas constant; αi indicates the conversion rate which can be described as
α = m 0 m t m 0 m ,
where m0, mt, and m refer to the initial, instantaneous and the final solid mass of samples, respectively.
Thus, the mass loss rate (dW/dt)1 and the solid mass fraction W1 of step 1 can be estimated as follows:
( d W d t ) 1 = i n ( d W i d t + d W c h a r , i d t ) = i n ( d W i d t + σ i W i , 0 d α i d t ) ,
W 1 = 1 i n ( 1 σ i ) α i W i , 0 .
The reaction rate for secondary charring reaction can be evaluated by
d W t a r d t = A t a r e x p ( E t a r R T ) W t a r , 0 ( W t a r W t a r , 0 ) n t a r ,
d α t a r d t = A t a r e x p ( E t a r R T ) ( 1 α t a r ) n t a r ,
where Wtar,0 represents the initial mass fraction of tar which is calculated from step 1:
d W t a r , 0 d t = i n γ i W i , 0 d α i d t .
Therein, Wtar, Atar, Etar, ntar denote the instantaneous mass fraction, the pre-exponential factor, the activation energy and the reaction order of reaction for tar generated by step 1, respectively.
Thus, the mass of char generated by step 2 Wchar,2 is calculated as
d W c h a r , 2 d t = θ W t a r , o d α t a r d t .
Therefore, the total solid mass fraction in the whole process can be expressed as
W t o t = W 1 + W c h a r , 2 .
The total mass loss rate of whole process is then deduced as
( d W d t ) t o t = i n ( d W i d t + σ i W i , 0 d α i d t ) + θ W t a r , o d α t a r d t .
The yields of pyrolysis products can be predicted by the equations above. The yield of char can be expressed as
W c h a r = i n σ i W i , 0 α i + θ W t a r , o α t a r .
The yield of gas can be calculated by
W g a s = i n ( 1 σ i γ i ) W i , 0 α i + ( 1 θ ) W t a r , o α t a r .
The yield of tar is calculated by the solid mass fraction and gas mass fraction:
W t a r = 1 W t o t W g a s .

2.4. Optimization Technique—Differential Evolution Algorithm

When analyzing kinetic problems of biomass pyrolysis, two traditional methods—model-free and model-fitting—are usually involved to estimate kinetic parameters. However, when the reaction scheme above is applied, it is difficult to address the problem by traditional methods because of the large number of unknown parameters. Therefore, some optimization methods are used. Differential evolution (DE) is a sort of global optimization algorithm which has been applied in various research fields [24]. Assuming there are M individuals in a random population, which can be expressed as X i = ( x i , 1 , x i , 2 , x i , n ) , each individual undergoes initialization, variation, crossover and selection operations to determine the optimized value [25]. The implementation of DE in the MATLAB program is one-to-one correspondence with the steps of the algorithm.
1: Define constants. The constants in the algorithm should be defined, including the population size, crossover probability, scaling factor and the maximum iteration number.
2: Initialization. The initial value of the individual Xi is calculated by
X i ( g ) = X i L + r a n d ( 0 , 1 ) ( X i U X i L ) ,
where X i U , X i L refer to the upper and lower bands of Xi, respectively, rand (0, 1) denotes a random number distributed in [0, 1], and g indicates the number of iteration.
3: Variation. A variation individual is determined by
V i ( g ) = X r 1 + F ( X r 2 X r 3 ) ,
where F indicates the scaling factor, and Xr1, Xr2, Xr3 represent three different random numbers that are different to Xi.
4: Crossover. The individual is updated via
X i ( g ) = { V i ( g ) , r a n d ( 0 , 1 ) C r X i ( g ) , o t h e r w i s e ,
where Cr denotes the crossover probability.
5: Selection. The individual in the next iteration is selected by
X i ( g + 1 ) = { X i ( g ) , f ( X i ) < f ( X i ) X i ( g ) , o t h e r w i s e ,
where f(x) denotes the fitness function of the individuals. In this study, the fitness function φ is the error between model outputs and experimental results, which can be calculated as
φ = 1 k c 1 n j | W c a l , j W e x p , j | 1 n j W e x p , j + 1 k ( 1 c ) 1 n j | ( d W d t ) c a l , j ( d W d t ) e x p , j | 1 n j ( d W d t ) e x p , j ,
where cal denotes the calculated results, exp refers to the corresponding experimental data, nj indicates the number of data points and k represents the number of heating rates. In order to make the weight of mass and mass loss rate equal, the weight coefficient c is set to 0.5. In respect to the algorithm parameters, population size, crossover probability, scaling factor and maximum iteration number are set as 60, 0.2, 0.5 and 1000 in this work, respectively. The update process is repeated until a satisfactory solution is obtained.

3. Results and Discussion

3.1. Thermogravimetric Analysis

Some characteristic parameters observed in mass fraction (TG)-mass loss rate (DTG) curves are shown in Table 3. Ti indicates the initial temperature of the primary pyrolysis stage, Tmax represents the temperature corresponding to the maximum mass loss rate, Tf denotes the terminal temperature of the primary pyrolysis stage and tmax refers to the time corresponding to the maximum mass loss rate.

3.1.1. Effects of Water Washing on Weight Loss

The mass fraction (TG) and mass loss rate (DTG) profiles of raw MDF and water washed MDF are compared in Figure 1. It shows that both the TG and DTG curve of washed MDF shifted to a high temperature. As indicated in Table 3, the primary pyrolysis stage of raw MDF started at 182.6 °C, reached its maximum mass loss rate at 365.3 °C and ended at 395.1 °C. After water washing, the initial and ending primary pyrolysis stage temperatures were 192.5 °C and 416.5 °C, respectively, indicating that the primary pyrolysis stage started later and became wider after water washing. In addition, the final char yield of raw MDF was shown to be higher than that of water washed MDF. Analyzing these differences, it can be concluded that the minerals play a positive role in decomposition and char formation of MDF pyrolysis.

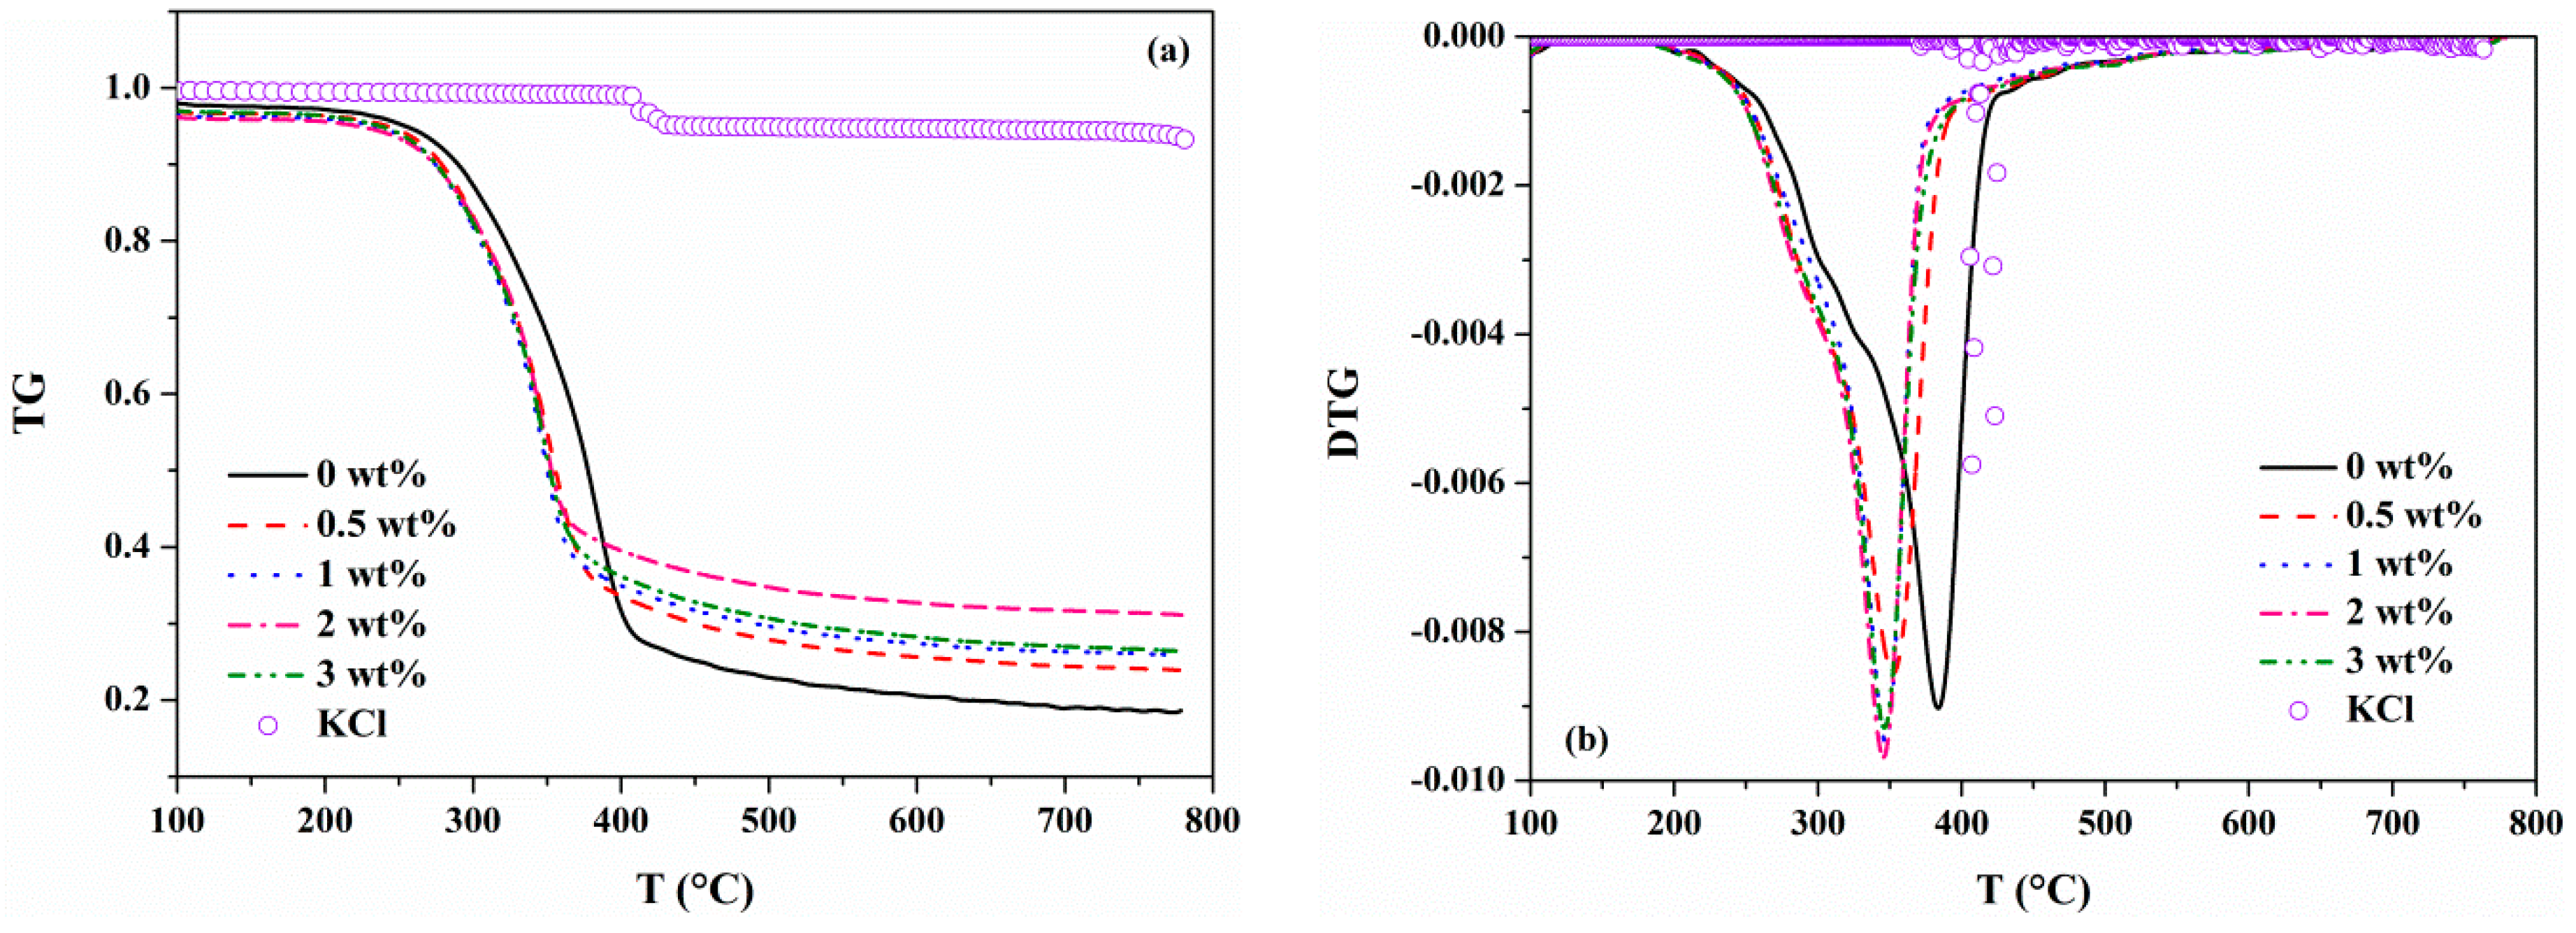
3.1.2. Effects of KCl on the Weight Loss Profile
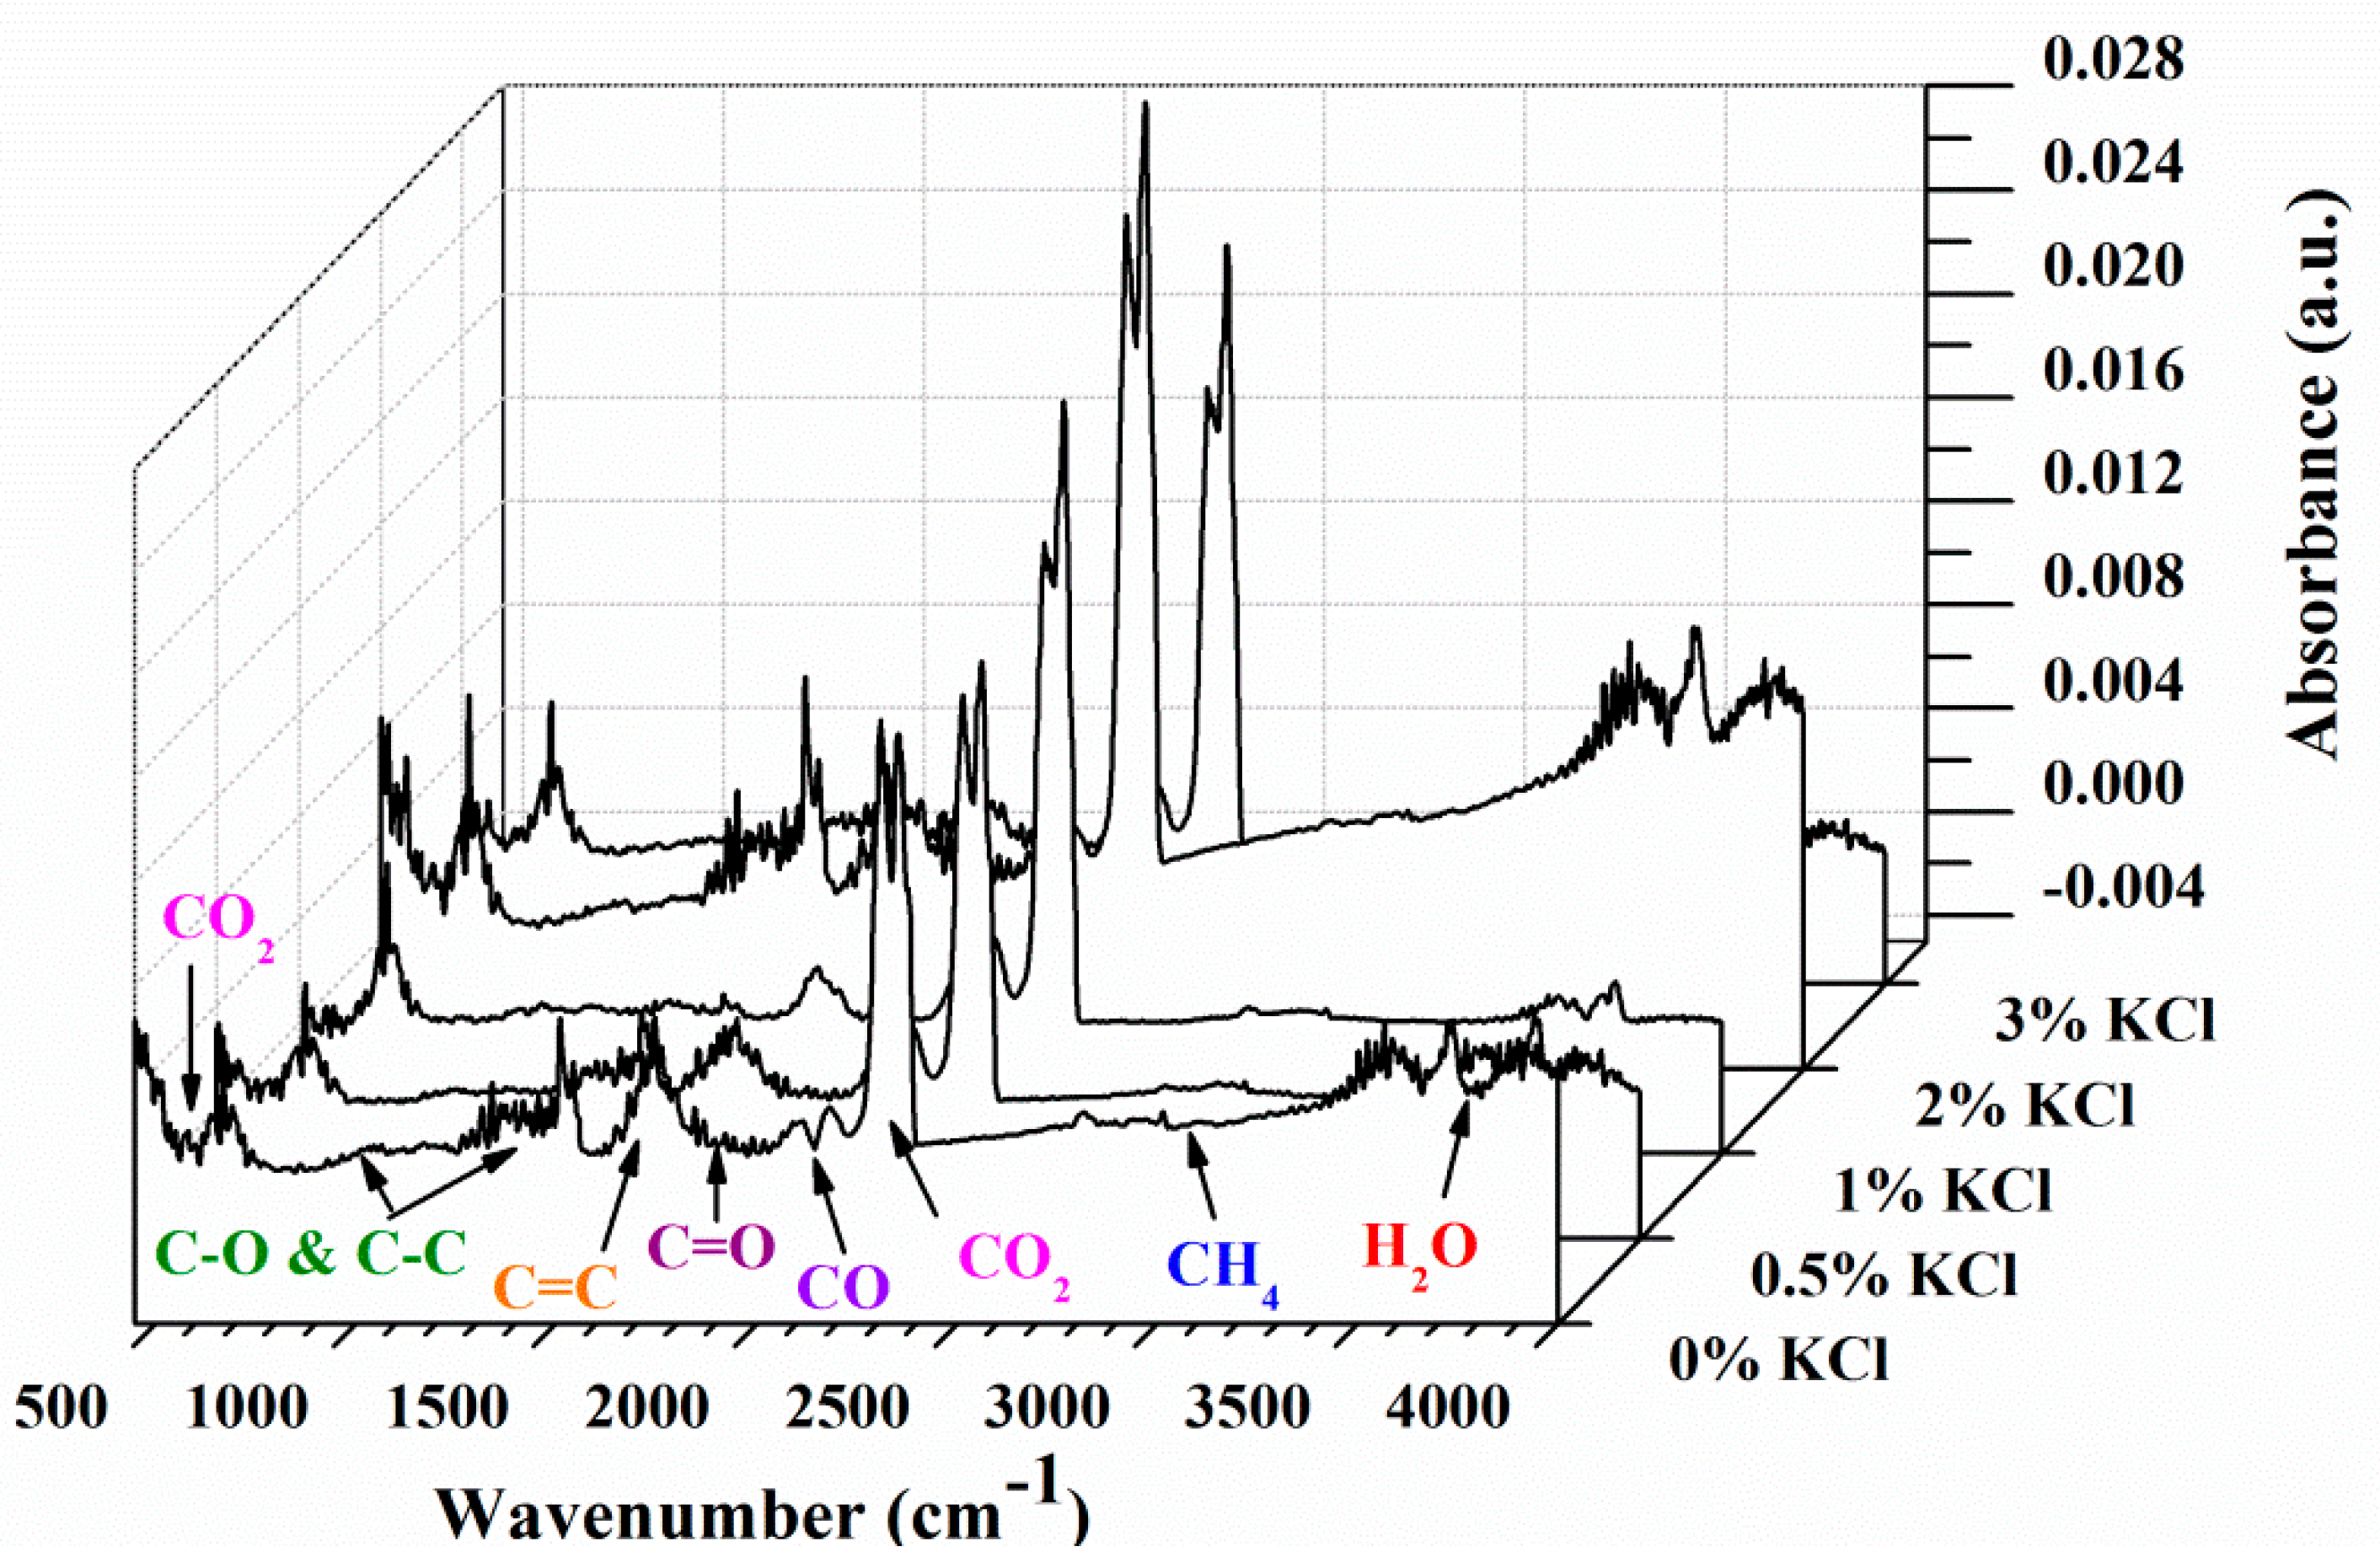
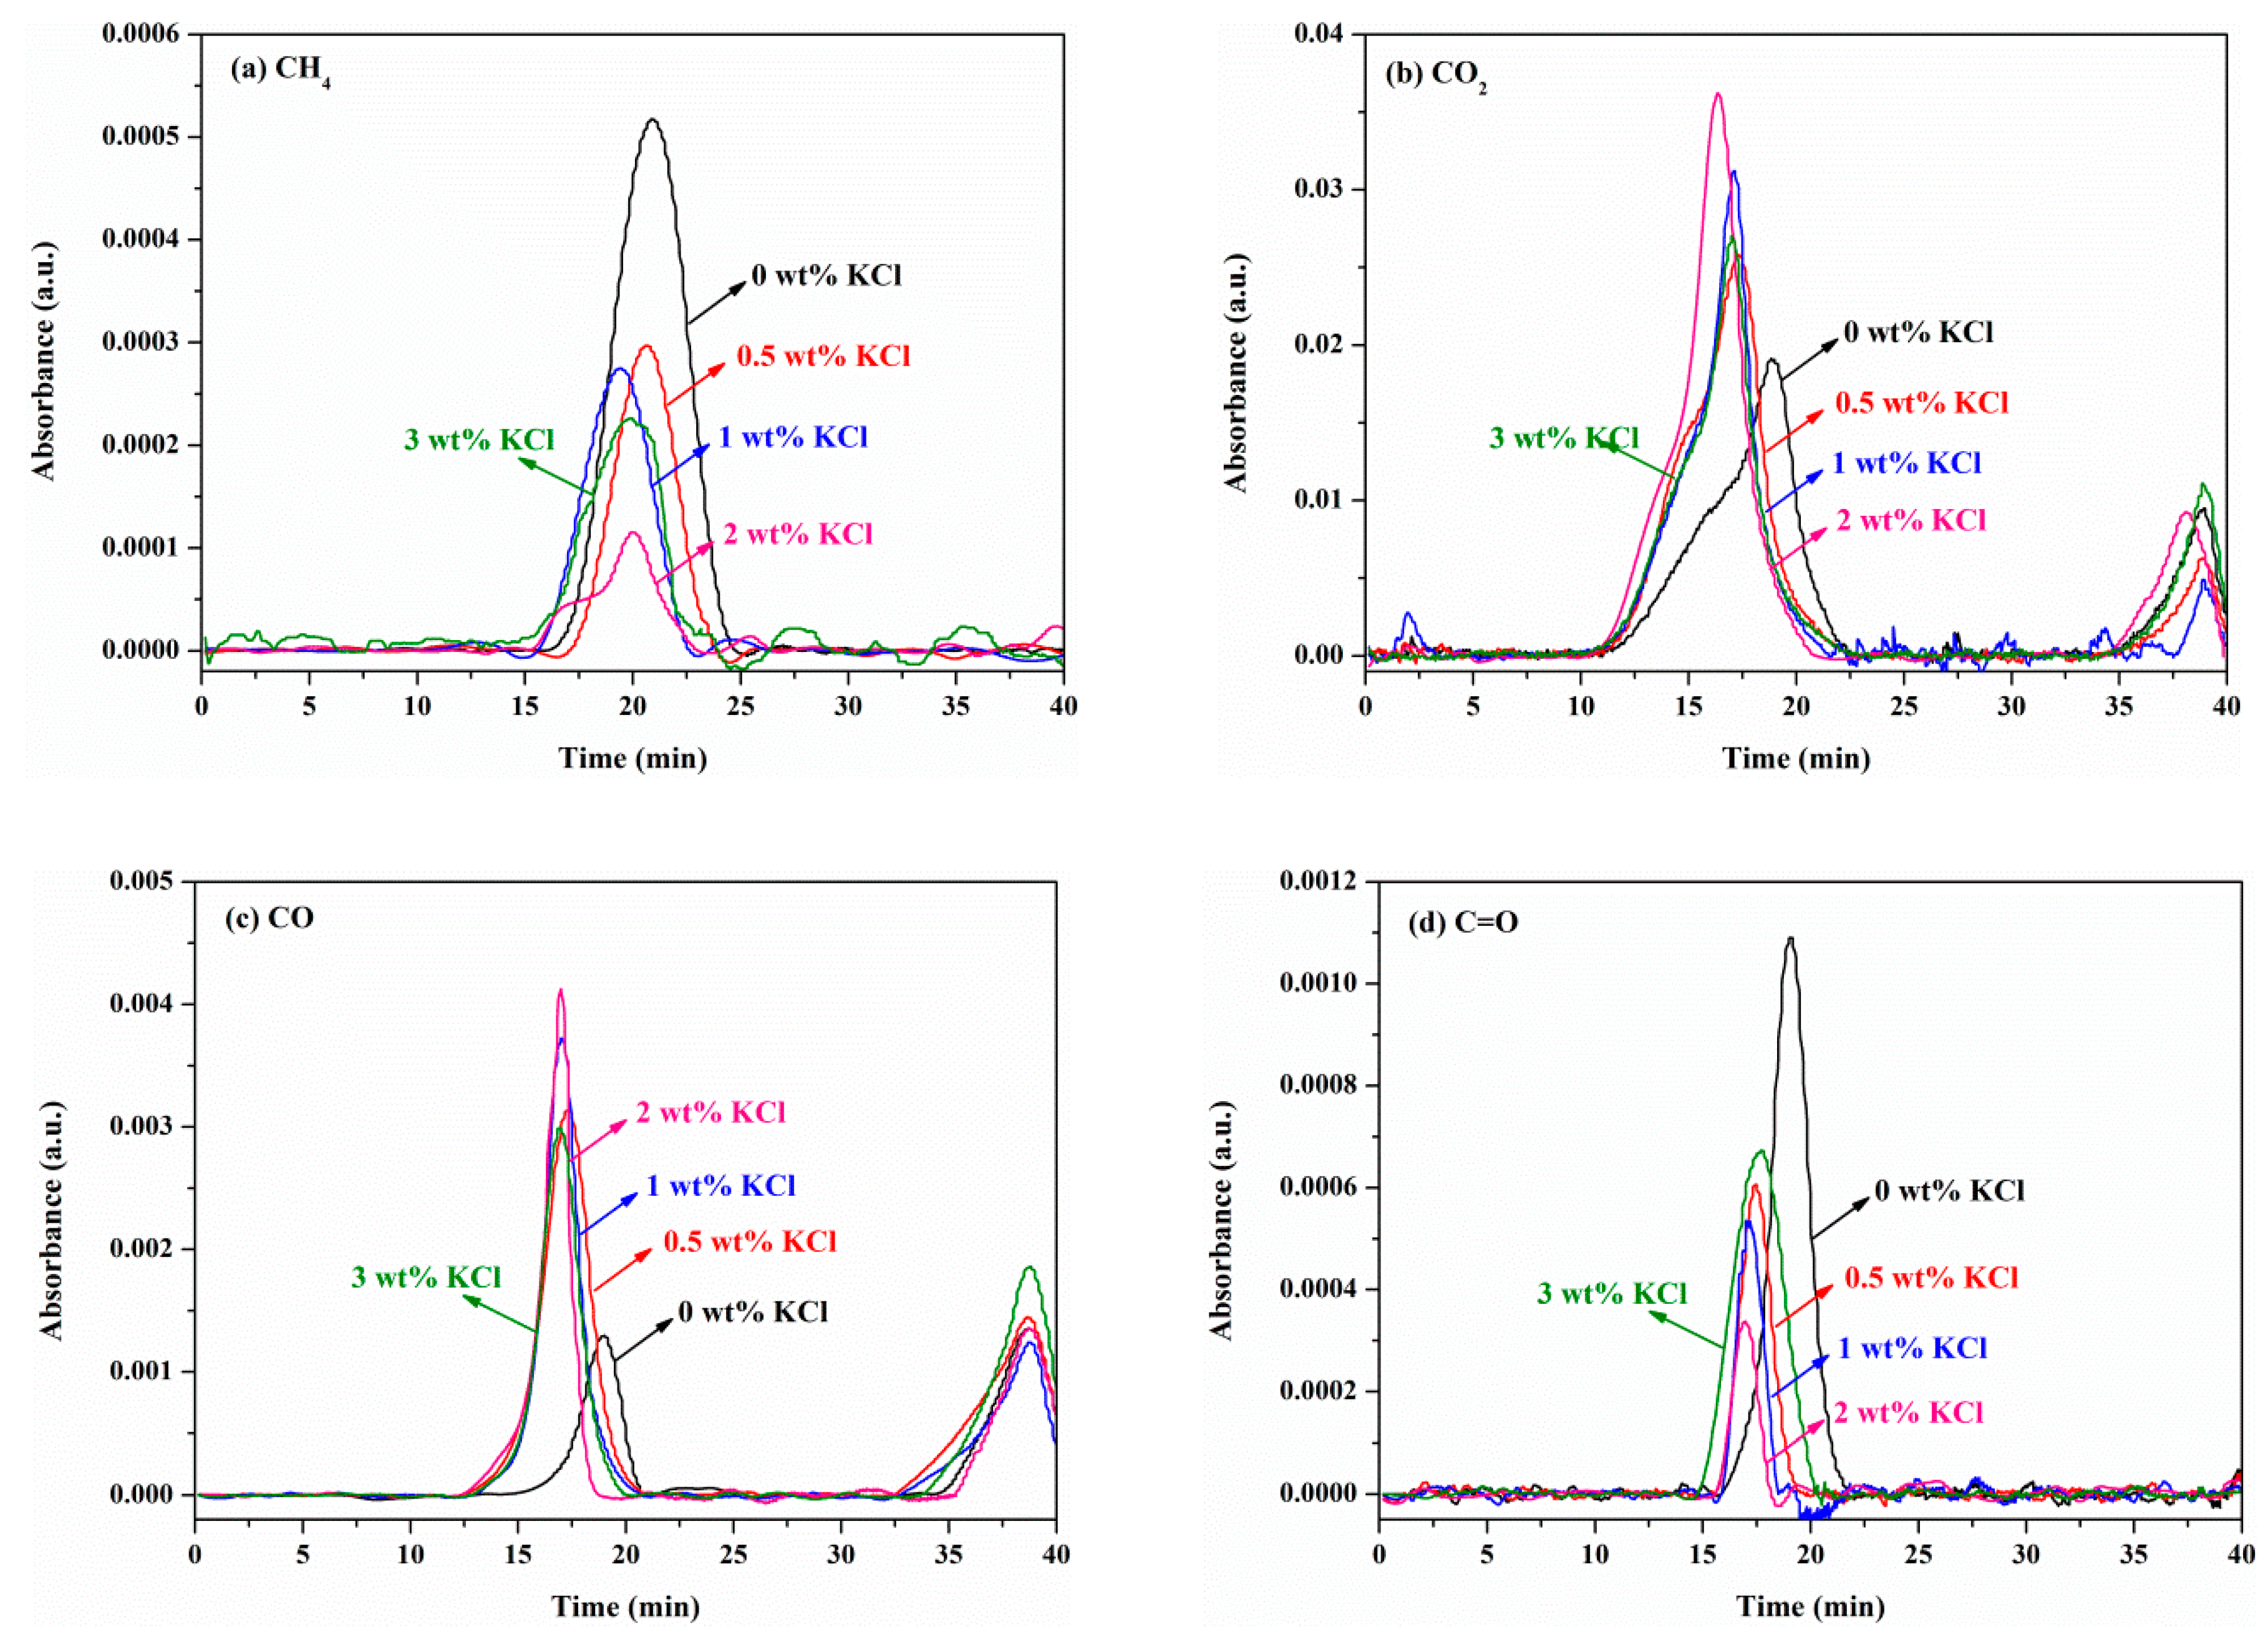
Figure 2 shows the TG-DTG curves of MDF samples with varying KCl loading concentrations. The TG-DTG curves of pure KCl are also presented. It can be seen that the mass of pure KCl exhibited a slight loss above 400 °C. Therefore, there was little influence of the degradation of KCl on the MDF samples since the maximum weight percent of KCl added to the MDF samples was 3 wt%. As shown in Figure 2a, the main mass loss of 0 wt% KCl sample started at 192.5 °C, reached its maximum value at 383.5 °C and ended at 416.5 °C. Then, the mass loss slightly decayed until 800 °C. The former stage corresponding to the primary pyrolysis occurred at lower temperatures, whereas the latter corresponded to the secondary pyrolysis stage [26]. When MDF was doped with KCl, there was a notable change to the characteristic parameters. The final temperatures were reduced as the KCl concentration increased, whereas KCl had a much weaker influence on the initial temperatures. The temperature range for the primary stage of MDF pyrolysis was narrowed by almost 24–36 °C. In addition, Tmax decreased with the increasing concentration of KCl, from 383.5 °C of 0 wt% KCl to 345.7 °C of 3 wt% KCl. This revealed that the presence of KCl makes the pyrolysis reach the maximum mass loss rate in advance, and thus potassium had a catalytic effect on the MDF pyrolysis [22,27,28,29]. The final char yields of the different samples doped with 0, 0.5, 1, 2 and 3 wt% KCl were 18.6%, 23.9%, 25.9%, 31.1% and 26.4%, respectively. This suggests that the presence of KCl promoted the formation of char. Similar results were obtained from previous studies [8,22,30]. It is worth noting that when the addition of KCl increased to 3 wt%, the characteristic temperatures changed slightly and the final char yield was less than 2 wt% KCl sample. The most likely reason was that excessive KCl might have a negative effect on the mass and heat transfer, thus influencing the pyrolysis products [31,32].

3.2. FTIR Analysis

FTIR was involved to characterize the gases the escaped in the pyrolysis process of MDF samples. With the temperature fixed at Tmax, the strongest characteristic absorbance can be obtained. Some possible compounds from FTIR characteristics absorbance bands, as summarized in Table 4 [33,34,35,36,37,38], were observed. Figure 3 shows the characteristics of absorbance of gaseous pyrolysis products of raw MDF at Tmax. The main gases released during raw MDF pyrolysis were obtained based on Table 4. Figure 4 indicates the absorbance at various wavenumbers of MDF samples with varying KCl loading concentrations at Tmax. It was observed that the presence of KCl had effects on the amounts of pyrolysis gaseous products instead of the composition, which is consistent with the result reported by Feng et al. [8].
According to the Lambert−Beer law, the gas concentration is linearly dependent on the absorbance at a specific wavenumber [39,40]. Therefore, the trends in the concentrations of gas products can be analyzed by the variations in the absorbance. As demonstrated in Figure 3, the absorbance peak at 3014 cm−1 corresponded to the release of methane (CH4). The absorbance peak at 2358 cm−1 was attributed to the release of carbon dioxide (CO2). The absorbance peak at 2182 cm−1 indicated the release of carbon monoxide (CO). The absorbance peak at 1748 cm−1 represented the release of aldehydes, ketones and acids (C=O). The absorbance at the corresponding wavenumber were normalized to evaluate the effect of KCl concentration on pyrolysis gas products CH4, CO2, CO and C=O.
Figure 5 shows the changes in absorbance of gas products of the MDF sample with varying KCl concentrations with time. The presence of KCl significantly affected the release of CH4, CO2, CO and C=O. For each gas product, the evolution profile shifted to an earlier time with the KCl concentration, which was consistent with the trends of Tf shown in Table 3. Similar to the findings in TG-DTG curves above, the trend of 3 wt% KCl remained an exception. For CH4 and C=O compounds, the peak absorbance dropped with the increase in KCl concentrations. On the contrary, as shown in Figure 5b, the peak absorbance of CO2 increased when the concentration of KCl increased. The trend of CO peak absorbance was similar to that of CO2. In addition, relatively high amounts of CO2 were released for each sample. Meanwhile, the release of CH4 was the minimum. As shown in Figure 5, the peak absorbance of all gas products appeared at low temperatures (early time), while CO2 and CO showed another peak at higher temperatures. It implies that there was more CO2 and CO evolved in the secondary pyrolysis stage [8,26].

3.3. Kinetic Analysis

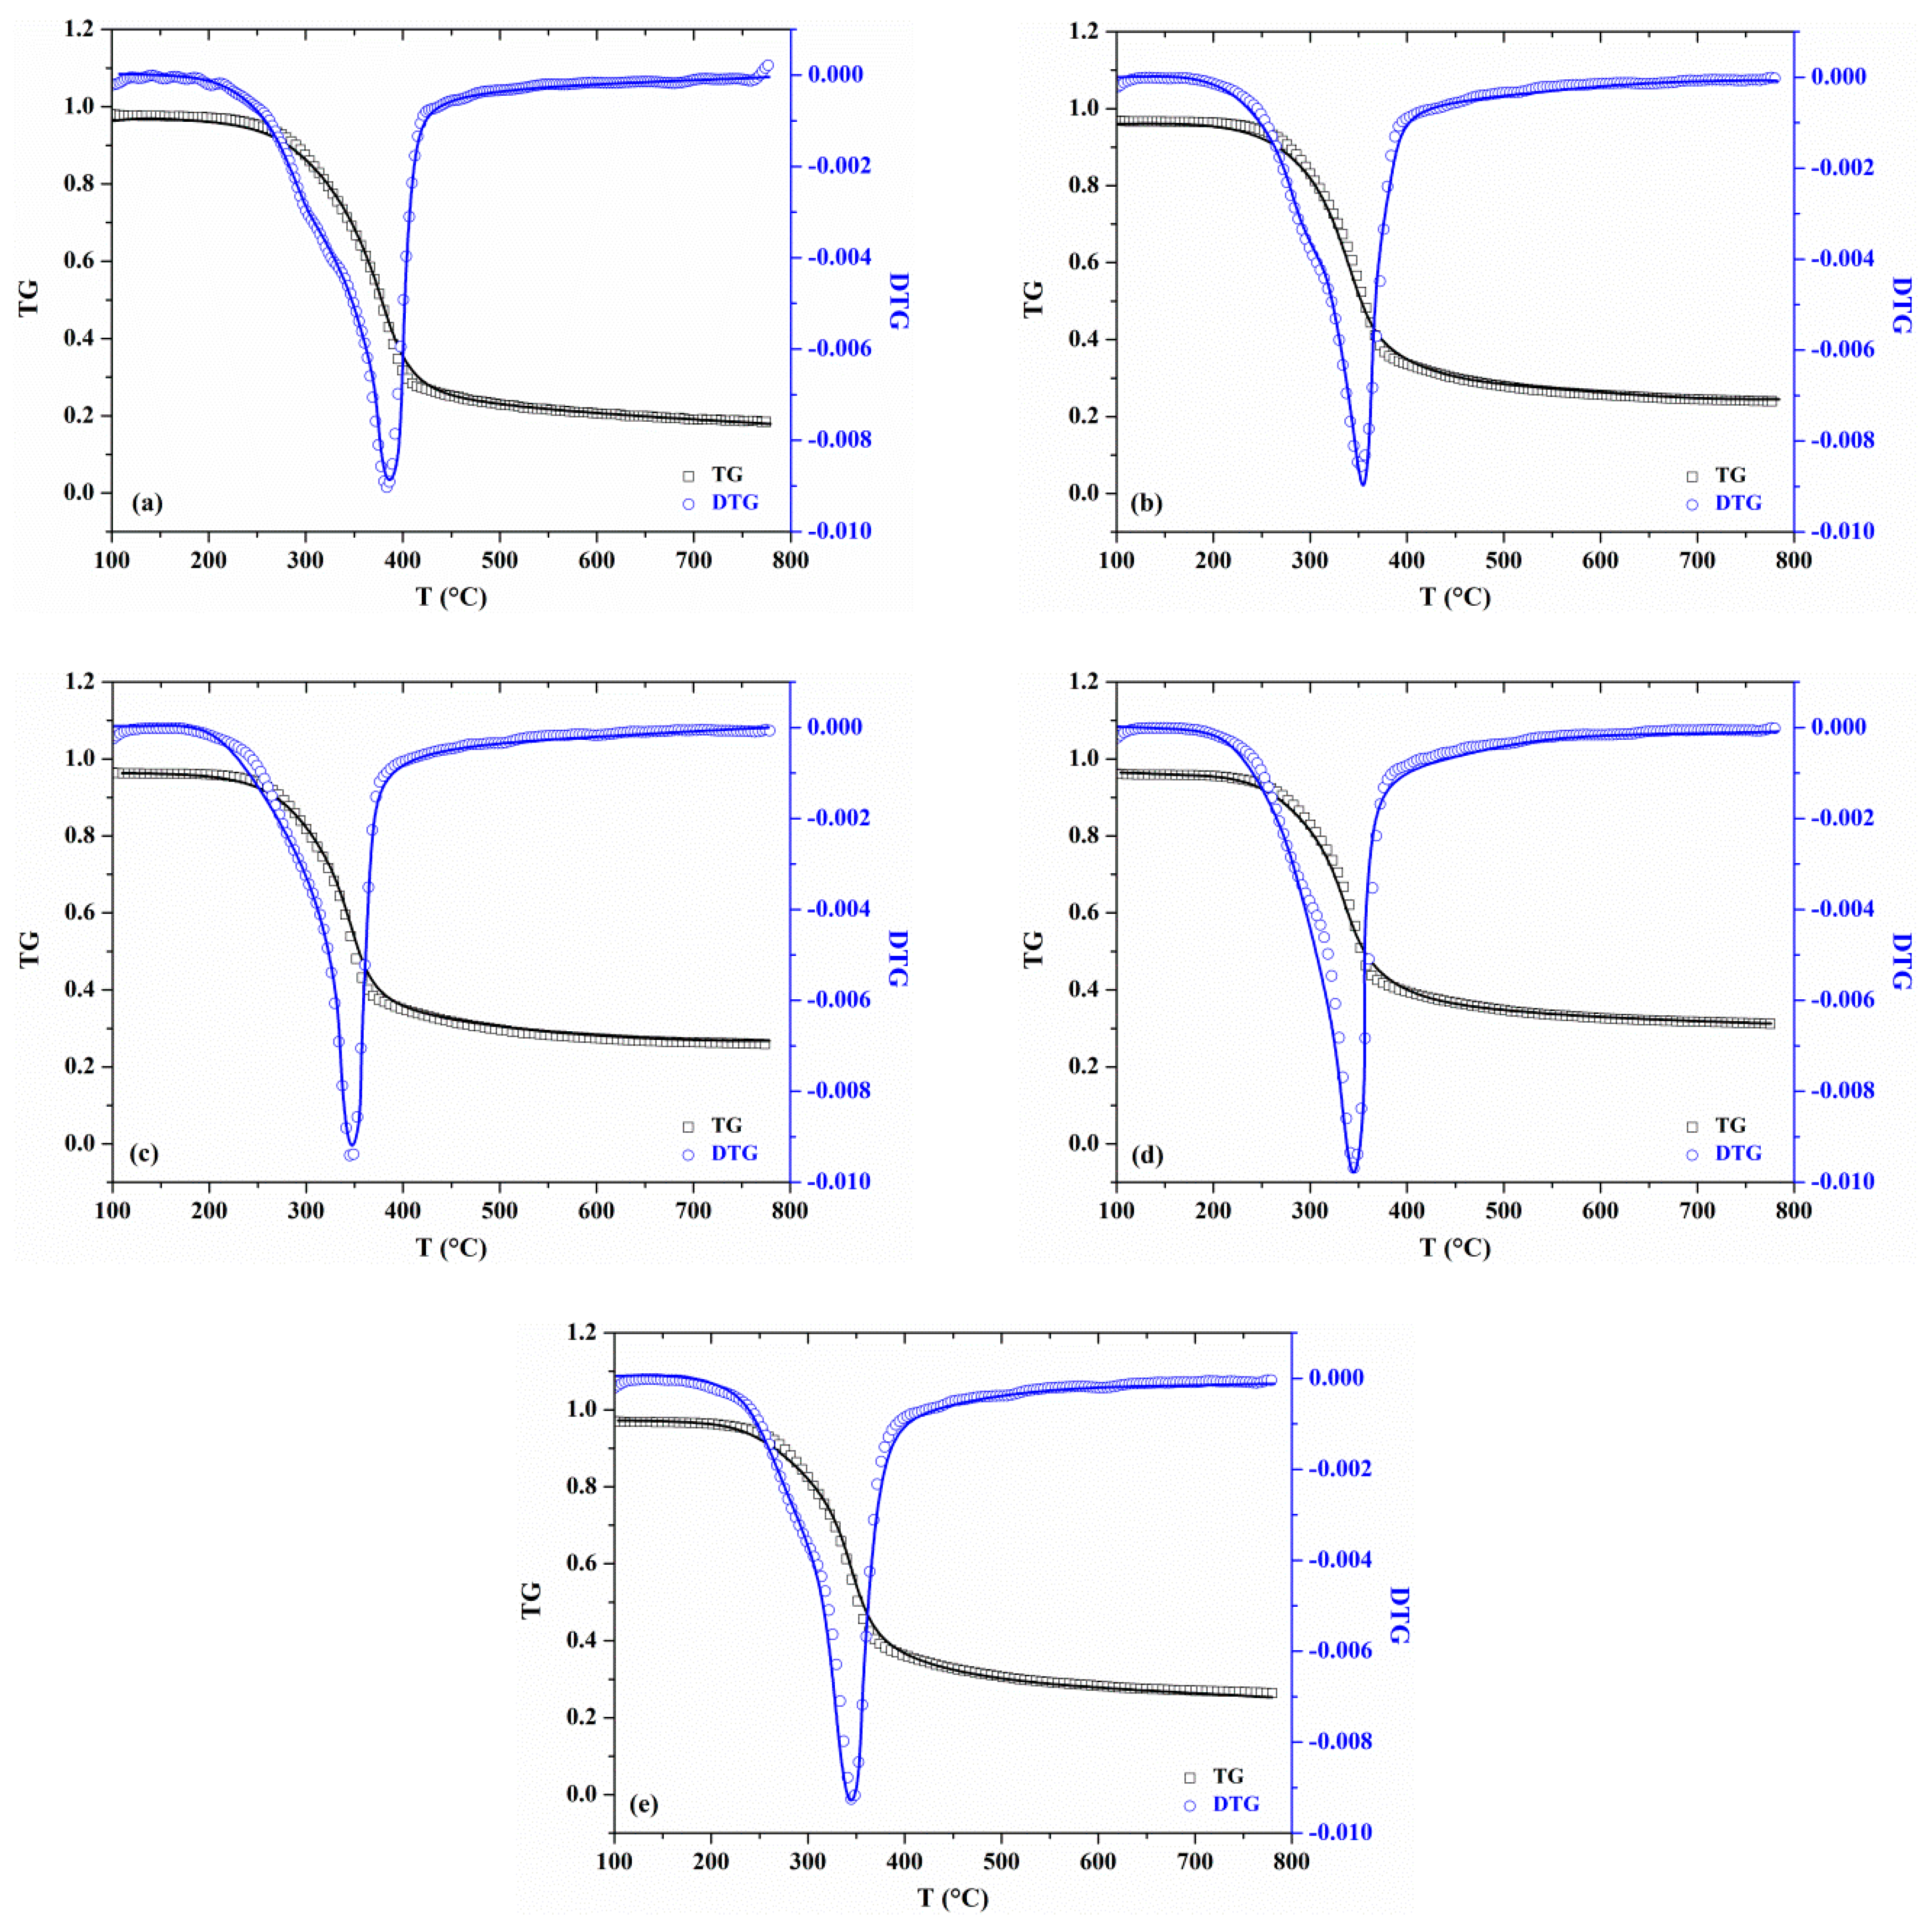
3.3.1. Model Parameters Optimization

In previous research [21], the process of estimating the optimization value of model parameters was introduced in detail. Put simply, an appropriate search range of each parameter should be clarified, and then the DE algorithm should be applied to estimate the optimal value of for every single parameter. When performing a calculation of the fitness function φ in Equation (19), the experimental data from heating rates of 20 and 30 °C/min were utilized. Making an adjustment of the search ranges for parameters listed in [21], the optimized values of model parameters of different MDF samples were obtained and listed in Table 5.
Comparisons between the experimental TG/DTG data and calculated values of MDF samples with varying KCl loading concentrations at the heating rate of 20 °C/min are presented in Figure 6. An excellent consistency between predicted results and experimental data are observed for both TG and DTG curves. These optimized parameters can satisfy not only the heating rates of 20 °C/min but also the heating rate of 30 °C/min. Therefore, the optimized parameters obtained can be validated as appropriate for other heating rates.

3.3.2. Effects of KCl on MDF Components and Pyrolysis Products

Figure 7 shows the predicted TG curves of each component for different MDF samples. According to the analysis above, when the KCl was increased to 3 wt%, the trends of TG and the absorbance of gas products were discovered to be inconsistent with other KCl loading concentrations. A similar phenomenon can be observed in Figure 7. Thus, the effects of KCl on MDF components and pyrolysis products were analyzed without the case of 3 wt% KCl. Obviously, the initial mass fraction of each component decreased as KCl increased. A trend of mass fraction decreasing with the temperature was spotted for each component. For resin, when the addition of KCl increased, the temperature at which the resin started to decompose decreased. That is, the initial decomposition temperature shifted forward, from 172 °C of 0 wt% KCl to 100 °C of 2 wt% KCl. Similarly, as can be seen from Figure 7b−d, the initial decomposition temperatures of hemicellulose, cellulose and lignin moved forward as the KCl concentration increased. The initial degradation temperatures of these three components dropped from 300 °C, 354 °C and 370 °C of 0 wt% KCl to 248 °C, 310 °C and 357 °C of 2 wt% KCl, respectively. In contrast to hemicellulose and cellulose, KCl had a relatively weak effect on the initial degradation temperature of lignin. Therefore, it can be predicted that the addition of potassium increases the reaction rates of resin, hemicellulose and cellulose. In comparison, the catalytic effect of potassium on the reaction of lignin was relatively weak. The analysis about cellulose conforms to the study performed by Trendewicz et al. [16].
Figure 8 shows the predicted yields of pyrolysis products of different MDF samples. Obviously, the yields of char and gas increased with the concentration of KCl. Conversely, the yield of tar reduced. This phenomenon was found to be consistent with the study conducted on the effect of KCl on cellulose pyrolysis products in [22]. Aside from this, as the KCl concentration increased, the temperature at which the pyrolysis products reached their respective maximum yields decreased. For tar, it was observed from Figure 8b that the temperatures corresponding to the peak yields were about 416 °C, 391 °C, 383 °C and 379 °C of samples with 0 wt%, 0.5 wt%, 1 wt% and 2 wt% KCl. Moreover, these temperatures were consistent with Tf in Table 3, indicating that tar yield reached its peak value at the end of the primary pyrolysis. When the temperature was above Tf, there would be a reduction in tar yield curve. This was most likely when T > Tf, the secondary charring reaction occurred, and the generation rate of tar in primary pyrolysis was low, as compared with the consumption rate of tar in the secondary reaction.
Figure 9 shows a comparison of the yields of pyrolysis products at the final temperature of 800 °C. The addition of KCl increased the yields of gas and char obviously. For gas, the yield increased from 49.3% of 0 wt% KCl to 60.8% of 2 wt% KCl. For char, the yield increased from 17.2% of 0 wt% KCl to 29.3% of 2 wt% KCl. On the contrary, tar yield was reduced from 30.8% of 0 wt% KCl to 8.1% of 2 wt% KCl. The experimental char yield could be determined by weighing the residue amount after the experiment [16,31]. In comparison with the predicted char yield with the experimental data, the experimental char yield was slightly larger than the predicted value. The most probable reason was that the experimental char yield was actually the residual solid mass, including the unreacted mass of each component.

3.3.3. Effects of KCl on Activation Energies

In order to find out the underlying reason of the observed changes in MDF components and pyrolysis products due to potassium, the changes in activation energies of primary reactions and secondary charring reaction were analyzed.
Figure 10a−d shows the activation energies for the reactions of resin, hemicellulose, cellulose and lignin change with potassium concentrations, respectively. Figure 11 indicates the activation energy of the secondary charring reaction change with potassium concentrations. As the activation energies of reactions of resin, hemicellulose, cellulose and tar vary depending on the potassium treatment mass fraction (%), by fitting the evaluated data presented in Figure 10 and Figure 11, some functions are derived:
E r = 157.14 42.44 x 8.71 x 2 + 6.43 x 3 , R 2 = 0.99 ,
E h = 197.62 64.62 x + 7.23 x 2 + 0.63 x 3 , R 2 = 0.98 ,
E c = 225.25 41.78 x + 11.32 x 2 0.03 x 3 , R 2 = 0.99 ,
E t a r = 127.83 7.59 x 24.4 x 2 + 6.64 x 3 , R 2 = 0.96 ,
where E represents the activation energy, and r, h, c denote the reactions of resin, hemicellulose and cellulose in primary pyrolysis, respectively. tar denotes the secondary charring reaction and x indicates the mass fraction of potassium (%).
As demonstrated in Figure 10, when the potassium mass fraction was less than 2 wt%, with the increasing of the addition of KCl, the activation energy of the reaction of resin reduced, indicating that the energy required for resin reaction was reduced. Similarly, the activation energies of reactions of hemicellulose and cellulose reduced with the KCl concentration. However, there was yet to be a consistent trend shown between the KCl concentration and activation energy of lignin reaction. The potassium had little effect on the activation energy of lignin. The most probably reason was that the potassium had little influence on the generation of free radicals which was the main reaction to occur during the lignin pyrolysis process [31]. Thus, the addition of potassium catalyzed the reaction of resin, hemicellulose and cellulose, but it had little effect on the reaction of lignin.
According to the fitting curve shown in Figure 11, when the potassium mass fraction was less than approximately 2.5 wt%, the activation energy of the secondary charring reaction decreased with the concentration of KCl. Potassium thus played a catalytic role in the reaction of tar. Therefore, the catalytic effect of KCl on MDF pyrolysis was the combination of the primary pyrolysis and the secondary charring reaction.
In this work, the impact of 3 wt% KCl was an extraordinary one. When the addition of KCl increased to 3 wt%, the trends of characteristic parameters, including the initial decomposition temperature of each component, the yields of products and the activation energies of pyrolysis reactions, were found to be distinct from other cases. A limit on the concentration of KCl may exist to achieve the best catalytic effects on MDF pyrolysis. Based on the fitting curves shown in Figure 10 and Figure 11, it is reasonable to conclude that 2 wt% and 2.5 wt% are the optimal concentrations of KCl for the catalytic effects exerted on MDF pyrolysis in the primary pyrolysis and secondary charring reaction, respectively.

4. Conclusions

In the present study, five MDF samples treated with varying potassium chloride (KCl) concentrations were heated by thermogravimetry/Fourier-transfer infrared spectroscopy (TG-FTIR) to investigate the effects of potassium chloride on the pyrolysis of medium density fiberboard (MDF). The kinetic parameters were estimated through a procedure based on experimental data and a differential evolution optimization algorithm. The major results and conclusions are summarized as follows:
(1)
The presence of KCl shifted the primary pyrolysis stage towards lower temperatures. As the addition of KCl increased, the characteristic initial temperature showed little change while the final temperature decreased. The temperature range of the primary pyrolysis process was narrowed by nearly 24−36 °C. The mass loss rate of the whole pyrolysis process reached its peak in advance with the concentration of KCl.
(2)
KCl affected the release of pyrolysis gaseous products in terms of amounts instead of composition. KCl inhibited the formation of CH4 and C=O functional groups while promoting the formation of CO2 and CO.
(3)
KCl changed the initial degradation temperature for each component of MDF. With the increasing concentration of KCl, the initial degradation temperature of resin, hemicellulose and cellulose dropped. For lignin, the effect of KCl on the initial degradation temperature was relatively weak.
(4)
Char and gas yields increased with the increasing concentration of KCl, whereas the tar yield was reduced.
(5)
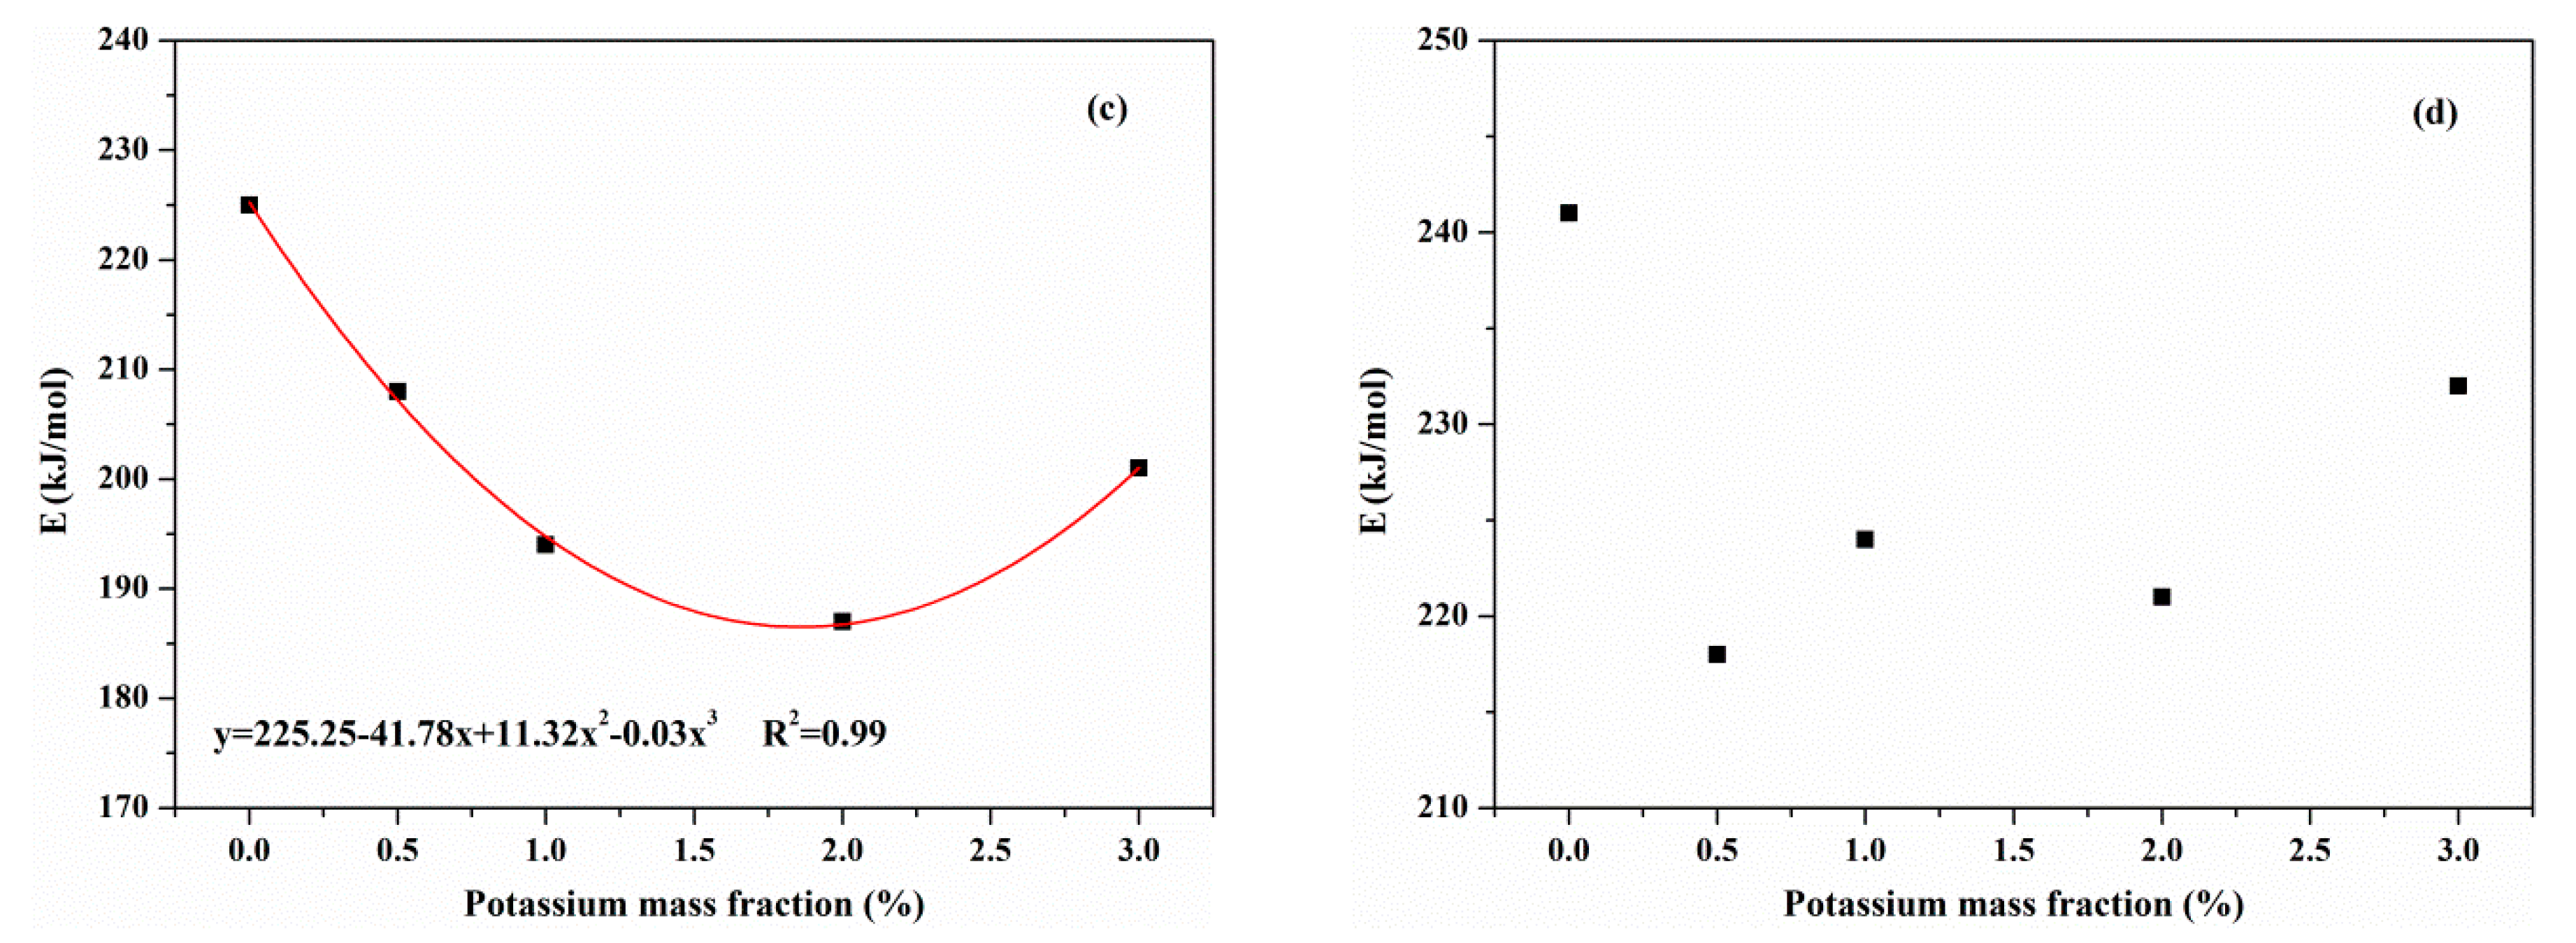
KCl had an effect on the activation energies of reactions during the pyrolysis process. In the primary pyrolysis stage, the activation energies of resin, hemicellulose and cellulose decreased with the concentration of KCl. Aside from this, KCl had little effect on the activation energy of lignin. In the secondary charring reaction, KCl reduced the activation energy of tar. The catalytic effect of KCl on MDF pyrolysis manifested in the combination of the primary pyrolysis and secondary charring reaction.
(6)
It is reasonable to take 2 wt% and 2.5 wt% as the optimal concentrations of KCl for the catalytic effects on MDF pyrolysis in primary pyrolysis and the secondary charring reaction, respectively.

Author Contributions

Yong Jiang managed the project; Longwei Pan conceived and designed the experiments, performed the experiments, analyzed the data and wrote the paper.

Funding

This research was funded by [the National Natural Science Foundation of China] grant number [51576183]; [the Postdoctoral Science Foundation of China] grant number [2018M632550]; and [the Fundamental Research Funds for the Central Universities of China] grant number [WK2320000041].

Conflicts of Interest

The authors declare no conflict of interest.

References

  1. FAO. Food and Agriculture Organization of the United Nations. Forestry Production and Trade. Available online: http://www.fao.org/faostat/en/#data/FO (accessed on 16 September 2018).
  2. Jahromi, H.; Agblevor, F.A. Hydrodeoxygenation of aqueous-phase catalytic pyrolysis oil to liquid hydrocarbons using multifunctional nickel catalyst. Ind. Eng. Chem. Res. 2018, 57, 13257–13268. [Google Scholar] [CrossRef]
  3. Ozsin, G.; Putun, A.E. TGA/MS/FT-IR study for kinetic evaluation and evolved gas analysis of a biomass/PVC co-pyrolysis process. Energy Convers. Manag. 2019, 182, 143–153. [Google Scholar] [CrossRef]
  4. Sipra, A.T.; Gao, N.; Sarwar, H. Municipal solid waste (MSW) pyrolysis for bio-fuel production: A review of effects of MSW components and catalysts. Fuel Process. Technol. 2018, 175, 131–147. [Google Scholar] [CrossRef]
  5. Niu, B.; Chen, Z.; Xu, Z. Application of pyrolysis to recycling organics from waste tantalum capacitors. J. Hazard. Mater. 2017, 335, 39–46. [Google Scholar] [CrossRef] [PubMed]
  6. Xu, L.; Jiang, Y.; Wang, L. Thermal decomposition of rape straw: Pyrolysis modeling and kinetic study via particle swarm optimization. Energy Convers. Manag. 2017, 146, 124–133. [Google Scholar] [CrossRef]
  7. Anca-Couce, A. Reaction mechanisms and multi-scale modelling of lignocellulosic biomass pyrolysis. Prog. Energy Combust. Sci. 2016, 53, 41–79. [Google Scholar] [CrossRef]
  8. Feng, D.; Zhang, Y.; Zhao, Y.; Sun, S. Catalytic effects of ion-exchangeable K+ and Ca2+ on rice husk pyrolysis behavior and its gas-liquid-solid product properties. Energy 2018, 152, 166–177. [Google Scholar] [CrossRef]
  9. Raveendran, K.; Ganesh, A.; Khilar, K.C. Pyrolysis characteristics of biomass and biomass components. Fuel 1996, 75, 987–998. [Google Scholar] [CrossRef]
  10. Perander, M.; DeMartini, N.; Brink, A.; Kramb, J.; Karlstrom, O.; Hemming, J.; Moilanen, A.; Konttinen, J.; Hupa, M. Catalytic effect of Ca and K on CO2 gasification of spruce wood char. Fuel 2015, 150, 464–472. [Google Scholar] [CrossRef]
  11. Scott, D.S.; Piskorz, J.; Radlein, D. Liquid products from the continuous flash pyrolysis of biomass. Ind. Eng. Chem. Proc. Des. Dev. 1985, 24, 581–588. [Google Scholar] [CrossRef]
  12. Nowakowski, D.J.; Jones, J.M.; Brydson, R.M.D.; Ross, A.B. Potassium catalysis in the pyrolysis behaviour of short rotation willow coppice. Fuel 2007, 86, 2389–2402. [Google Scholar] [CrossRef]
  13. Shimada, N.; Kawamoto, H.; Saka, S. Different action of alkali/alkaline earth metal chlorides on cellulose pyrolysis. J. Anal. Appl. Pyrolysis 2008, 81, 80–87. [Google Scholar] [CrossRef] [Green Version]
  14. Pan, W.P.; Richards, G.N. Influence of metal ions on volatile products of pyrolysis of wood. J. Anal. Appl. Pyrolysis 1989, 16, 117–126. [Google Scholar] [CrossRef]
  15. Patwardhan, P.R.; Satrio, J.; Brown, R.; Shanks, B. Influence of inorganic salts on the primary pyrolysis products of cellulose. Bioresour. Technol. 2010, 101, 4646–4655. [Google Scholar] [CrossRef] [PubMed]
  16. Trendewicz, A.; Evans, R.; Dutta, A.; Sykes, R.; Carpenter, D.; Braun, R. Evaluating the effect of potassium on cellulose pyrolysis reaction kinetics. Biomass Bioenergy 2015, 74, 15–25. [Google Scholar] [CrossRef] [Green Version]
  17. Olsson, J.G.; Jaglid, U.; Pettersson, J.B.C.; Hald, P. Alkali metal emission during pyrolysis of biomass. Energy Fuel 1997, 11, 779–784. [Google Scholar] [CrossRef]
  18. Shafizadeh, F.; Wolfrom, M.L.; Tipson, R.S. Pyrolysis and combustion of cellulosic materials. Adv. Carbohydr. Chem. 1968, 23, 419–474. [Google Scholar]
  19. Vassilev, S.V.; Baxter, D.; Andersen, L.K.; Vassileva, C.G. An overview of the composition and application of biomass ash. Part 1. Phase-mineral and chemical composition and classification. Fuel 2013, 105, 40–76. [Google Scholar] [CrossRef]
  20. Zhao, Y.; Cheng, G.; Long, F.; Liu, L.; Dong, C.; Wang, X.; Zhao, J. Analysis and prediction of corrosion of refractory materials by potassium during biomass combustion-thermodynamic study. Materials 2018, 11, 2584. [Google Scholar] [CrossRef]
  21. Pan, L.; Jiang, Y.; Wang, L.; Xu, W. Kinetic study on the pyrolysis of medium density fiberboard: Effects of secondary charring reactions. Energies 2018, 11, 2481. [Google Scholar] [CrossRef]
  22. Ferreiro, A.I.; Rabaçal, M.; Costa, M.; Giudicianni, P.; Grottola, C.M.; Ragucci, R. Modeling the impact of the presence of KCl on the slow pyrolysis of cellulose. Fuel 2018, 215, 57–65. [Google Scholar] [CrossRef]
  23. Tortosa Masia, A.A.; Buhre, B.J.P.; Gupta, R.P.; Wall, T.F. Characterising ash of biomass and waste. Fuel Process. Technol. 2007, 88, 1071–1081. [Google Scholar] [CrossRef]
  24. Storn, R. On the usage of differential evolution for function optimization. In Proceedings of the 1996 Biennial Conference of the North American Fuzzy Information Processing Society, Berkeley, CA, USA, 19–22 June 1996; IEEE Press: Piscataway, NJ, USA, 1996; pp. 519–523, ISBN 0780332261. [Google Scholar]
  25. Storn, R.; Price, K. Differential evolution—A Simple and efficient heuristic for global optimization over continuous spaces. J. Glob. Optim. 1997, 11, 341–359. [Google Scholar] [CrossRef]
  26. Biagini, E.; Barontini, F.; Tognotti, L. Devolatilization of biomass fuels and biomass components studied by TG/FTIR Technique. Ind. Eng. Chem. Res. 2006, 45, 4486–4493. [Google Scholar] [CrossRef]
  27. Leng, E.; Wang, Y.; Gong, X.; Zhang, B.; Zhang, Y.; Xu, M. Effect of KCl and CaCl2 loading on the formation of reaction intermediates during cellulose fast pyrolysis. Proc. Combust. Inst. 2017, 36, 2263–2270. [Google Scholar] [CrossRef]
  28. Gargiulo, V.; Giudicianni, P.; Alfe, M.; Ragucci, R. Influence of possible interactions between biomass organic components and alkali metal ions on steam assisted pyrolysis: A case study on Arundodonax. J. Anal. Appl. Pyrolysis 2015, 112, 244–252. [Google Scholar] [CrossRef]
  29. Jensen, A.; Dam-Johansen, K.; Wojtowicz, M.A.; Serio, M.A. TG-FTIR study of the influence of potassium chloride on wheat straw pyrolysis. Energy Fuels 1998, 12, 929–938. [Google Scholar] [CrossRef]
  30. Deng, S.; Wang, X.; Zhang, J.; Liu, Z.; Mikulcic, H.; Vujanovic, M.; Tan, H.; Duic, N. A kinetic study on the catalysis of KCl, K2SO4, and K2CO3 during oxy-biomass combustion. J. Environ. Manag. 2018, 218, 50–58. [Google Scholar] [CrossRef] [PubMed]
  31. Hao, Q.L.; Li, B.L.; Liu, L.; Zhang, Z.B.; Dou, B.J.; Wang, C. Effect of potassium on pyrolysis of rice husk and its components. J. Fuel Chem. Technol. 2015, 43, 34–41. [Google Scholar] [CrossRef]
  32. Yang, H.; Rong, Y.; Chen, H.; Dong, H.L.; Zheng, C. Characteristics of hemicellulose, cellulose and lignin pyrolysis. Fuel 2007, 86, 1781–1788. [Google Scholar] [CrossRef]
  33. Quan, C.; Ma, Z.; Gao, N.; He, C. Pyrolysis and combustion characteristics of corncob hydrolysis residue. J. Anal. Appl. Pyrolysis 2018, 130, 72–78. [Google Scholar] [CrossRef]
  34. Ding, W.; Zhang, X.; Zhao, B.; Zhou, W.; Xu, A.; Chen, L.; Sun, L.; Yang, S.; Guan, H.; Xie, X.; et al. TG-FTIR and thermodynamic analysis of the herb residue pyrolysis with in-situ CO2 capture using CaO catalyst. J. Anal. Appl. Pyrolysis 2018, 134, 389–394. [Google Scholar] [CrossRef]
  35. Liang, F.; Wang, R.; Hongzhong, X.; Yang, X.; Zhang, T.; Hu, W.; Mi, B.; Liu, Z. Investigating pyrolysis characteristics of moso bamboo through TG-FTIR and Py-GC/MS. Bioresour. Technol. 2018, 256, 53–60. [Google Scholar] [CrossRef] [PubMed]
  36. Liu, Y.; Yang, L.; Ma, C.; Zhang, Y. Thermal behavior of sweet potato starch by non-isothermal thermogravimetric analysis. Materials 2019, 12, 699. [Google Scholar] [CrossRef] [PubMed]
  37. Vecchio Ciprioti, S.; Tuffi, R.; Dell’Era, A.; Dal Poggetto, F.; Bollino, F. Thermal behavior and structural study of SiO(2)/Poly(epsilon-caprolactone) hybrids synthesized via sol-gel method. Materials 2018, 11, 275. [Google Scholar] [CrossRef] [PubMed]
  38. Wang, Z.; Wei, R.; Wang, X.; He, J.; Wang, J. Pyrolysis and combustion of polyvinyl chloride (PVC) sheath for new and aged cables via thermogravimetric analysis-fourier transform infrared (TG-FTIR) and calorimeter. Materials 2018, 11, 1997. [Google Scholar] [CrossRef] [PubMed]
  39. Tao, L.; Zhao, G.-B.; Qian, J.; Qin, Y.-K. TG–FTIR characterization of pyrolysis of waste mixtures of paint and tar slag. J. Hazard. Mater. 2010, 175, 754–761. [Google Scholar] [CrossRef] [PubMed]
  40. Chen, R.; Lu, S.; Zhang, Y.; Lo, S. Pyrolysis study of waste cable hose with thermogravimetry/Fourier transform infrared/mass spectrometry analysis. Energy Convers. Manag. 2017, 153, 83–92. [Google Scholar] [CrossRef]
Figure 1. TG and DTG profiles of raw MDF and water washed MDF.
Materials 12 01826 g001
Figure 2. TG (a) and DTG (b) profiles of pure KCl sample and of MDF samples with different KCl loading concentrations.
Materials 12 01826 g002
Figure 3. Characteristics absorbance of gaseous pyrolysis products of raw MDF at Tmax.
Materials 12 01826 g003
Figure 4. FTIR analysis of MDF samples with different KCl loading concentrations at Tmax.
Materials 12 01826 g004
Figure 5. Changes in absorbance of gas products of MDF samples with different KCl concentrations with time: (a) CH4; (b) CO2; (c) CO; and (d) C=O.
Materials 12 01826 g005
Figure 6. Comparisons between experimental TG/DTG data and predictions based on optimized parameters of different MDF samples at heating rate of 20 °C/min: (a) 0 wt%; (b) 0.5 wt%; (c) 1 wt%; (d) 2 wt%; (e) 3 wt%. Experimental data are shown in scatters; prediction results are shown in solid lines.
Materials 12 01826 g006
Figure 7. Comparisons of components mass fraction at different KCl loading concentration: (a) resin; (b) hemicellulose; (c) cellulose; (d) lignin.
Materials 12 01826 g007
Figure 8. Comparisons of pyrolysis product yields at different KCl loading concentrations: (a) gas; (b) tar; (c) char.
Materials 12 01826 g008
Figure 9. Comparisons of pyrolysis product yield at the final temperature.
Materials 12 01826 g009
Figure 10. The effect of potassium concentration on activation energy of (a) resin; (b) hemicellulose; (c) cellulose; (d) lignin in primary reactions.
Materials 12 01826 g010aMaterials 12 01826 g010b
Figure 11. The effect of potassium concentration on activation energy of secondary charring reaction.
Materials 12 01826 g011
Table 1. Proximate and ultimate analysis of raw medium density fiberboard (MDF) sample.
Proximate Analysis (wt%)Ultimate Analysis (wt%)
MoistureAshVolatilesFixed CarbonerrorCHOaNSerror
8.284.6981.25.830.98%44.966.2644.873.350.561.48%
a Calculated by difference.
Table 2. Composition analysis of raw MDF ash and water washed MDF ash.
SamplesAsh Chemical Compositions (wt%)
CaKSSiMgPAlFeNaClMean Error
Raw MDF22.8710.663.453.112.521.531.090.910.620.531.82%
Water washed MDF18.011.251.646.411.730.482.621.291.190.201.46%
Table 3. Characteristic parameters of the mass fraction (TG) and mass loss rate (DTG) curves.
SampleTi (°C)Tmax (°C)Tf (°C)tmax (min)
raw MDF182.6365.3395.118.6
0 wt% KCl (water washed MDF)192.5383.5416.519.5
0.5 wt% KCl192.4352.0391.517.9
1 wt% KCl191.4347.1383.717.7
2 wt% KCl191.3345.3379.917.6
3 wt% KCl188.9345.7387.117.6
Table 4. A summary of the possible compounds from characteristics absorbtion bands of FTIR.
Wavenumbers, cm−1Chemical BondVibrationsCompounds
4000−3400O−HstretchingH2O
3050−2650C−HstretchingCH4
2400−2240C=OstretchingCO2
2230−2000C−OstretchingCO
1880−1620C=Ostretchingaldehydes, ketones, acids
1600−1420C=Cstretchingaromatics
1300−950C−O, C−Cstretchingalkanes & ethers
750−560C=ObendingCO2
Table 5. Optimized values of kinetic parameters for different KCl loading concentrations.
Component Parameter Range0 wt% KCl0.5 wt% KCl 1 wt% KCl2 wt% KCl3 wt% KCl
ResinlnAr (ln s−1)(2.4, 47.6)21.8224.3420.924.1222
Er (kJ/mol)(6.9, 200)157.5136.5611289125.3
nr(0.1, 8)2.052.072.222.5
Wr,o (%)(1, 20)9.809.759.79.69.51
φrr (%)(5, 95)31.84223.6558.3253.21
γr (%)(5, 95)7.08.7821.3616.858.7
HemicelluloselnAh (ln s−1)(3.1, 62.4)3233.0439.9529.9633.9
Eh (kJ/mol)(11.3, 225.3)198181172.35162.56176
nh(0.1, 8)1.91.71.891.781.49
Wh,o (%)(1.8, 36)20.2320.2220.0319.8319.64
φhh (%)(5, 95)10.416.721.4611.3617.58
γh (%)(5, 95)49.548.361.150.3230.36
CelluloselnAc (ln s−1)(3.9, 78.2)3540.438.0635.6939.4
Ec (kJ/mol)(16, 319.4)225208.65194.63187.53201.64
nc(0.1, 8)2.51.92.262.412.42
Wc,o (%)(4.8, 96)42.942.6842.4842.0641.65
φcc (%)(5, 95)12.313.412.9430.5825.64
γc (%)(5, 95)42.927.243.8552.2528.33
LigninlnAl (ln s−1)(5, 100.7)393539.0142.2438.83
El (kJ/mol)(22.6, 451.8)241218224.36221.43232.96
nl(0.1, 8)1.422.241.822.27
Wl,o (%) 2726.8926.7326.4726.21
φll (%)(5, 95)3.48.17.3212.255.39
γl (%)(5, 95)69.27873.2563.0238.65
TarlnAt (ln s−1)(1.8, 35.8)33.433.8533.833.9333.5
Et (kJ/mol)(12.4, 248)129.3115.85106.6567.7465.69
nt(0.1, 8)2.872.291.441.571.46
θ (%)(5, 95)14.118.215.205.6523.02

