A Study into the Effect of Different Nozzles Shapes and Fibre-Reinforcement in 3D Printed Mortar


Abstract
1. Introduction
2. Experimental Program
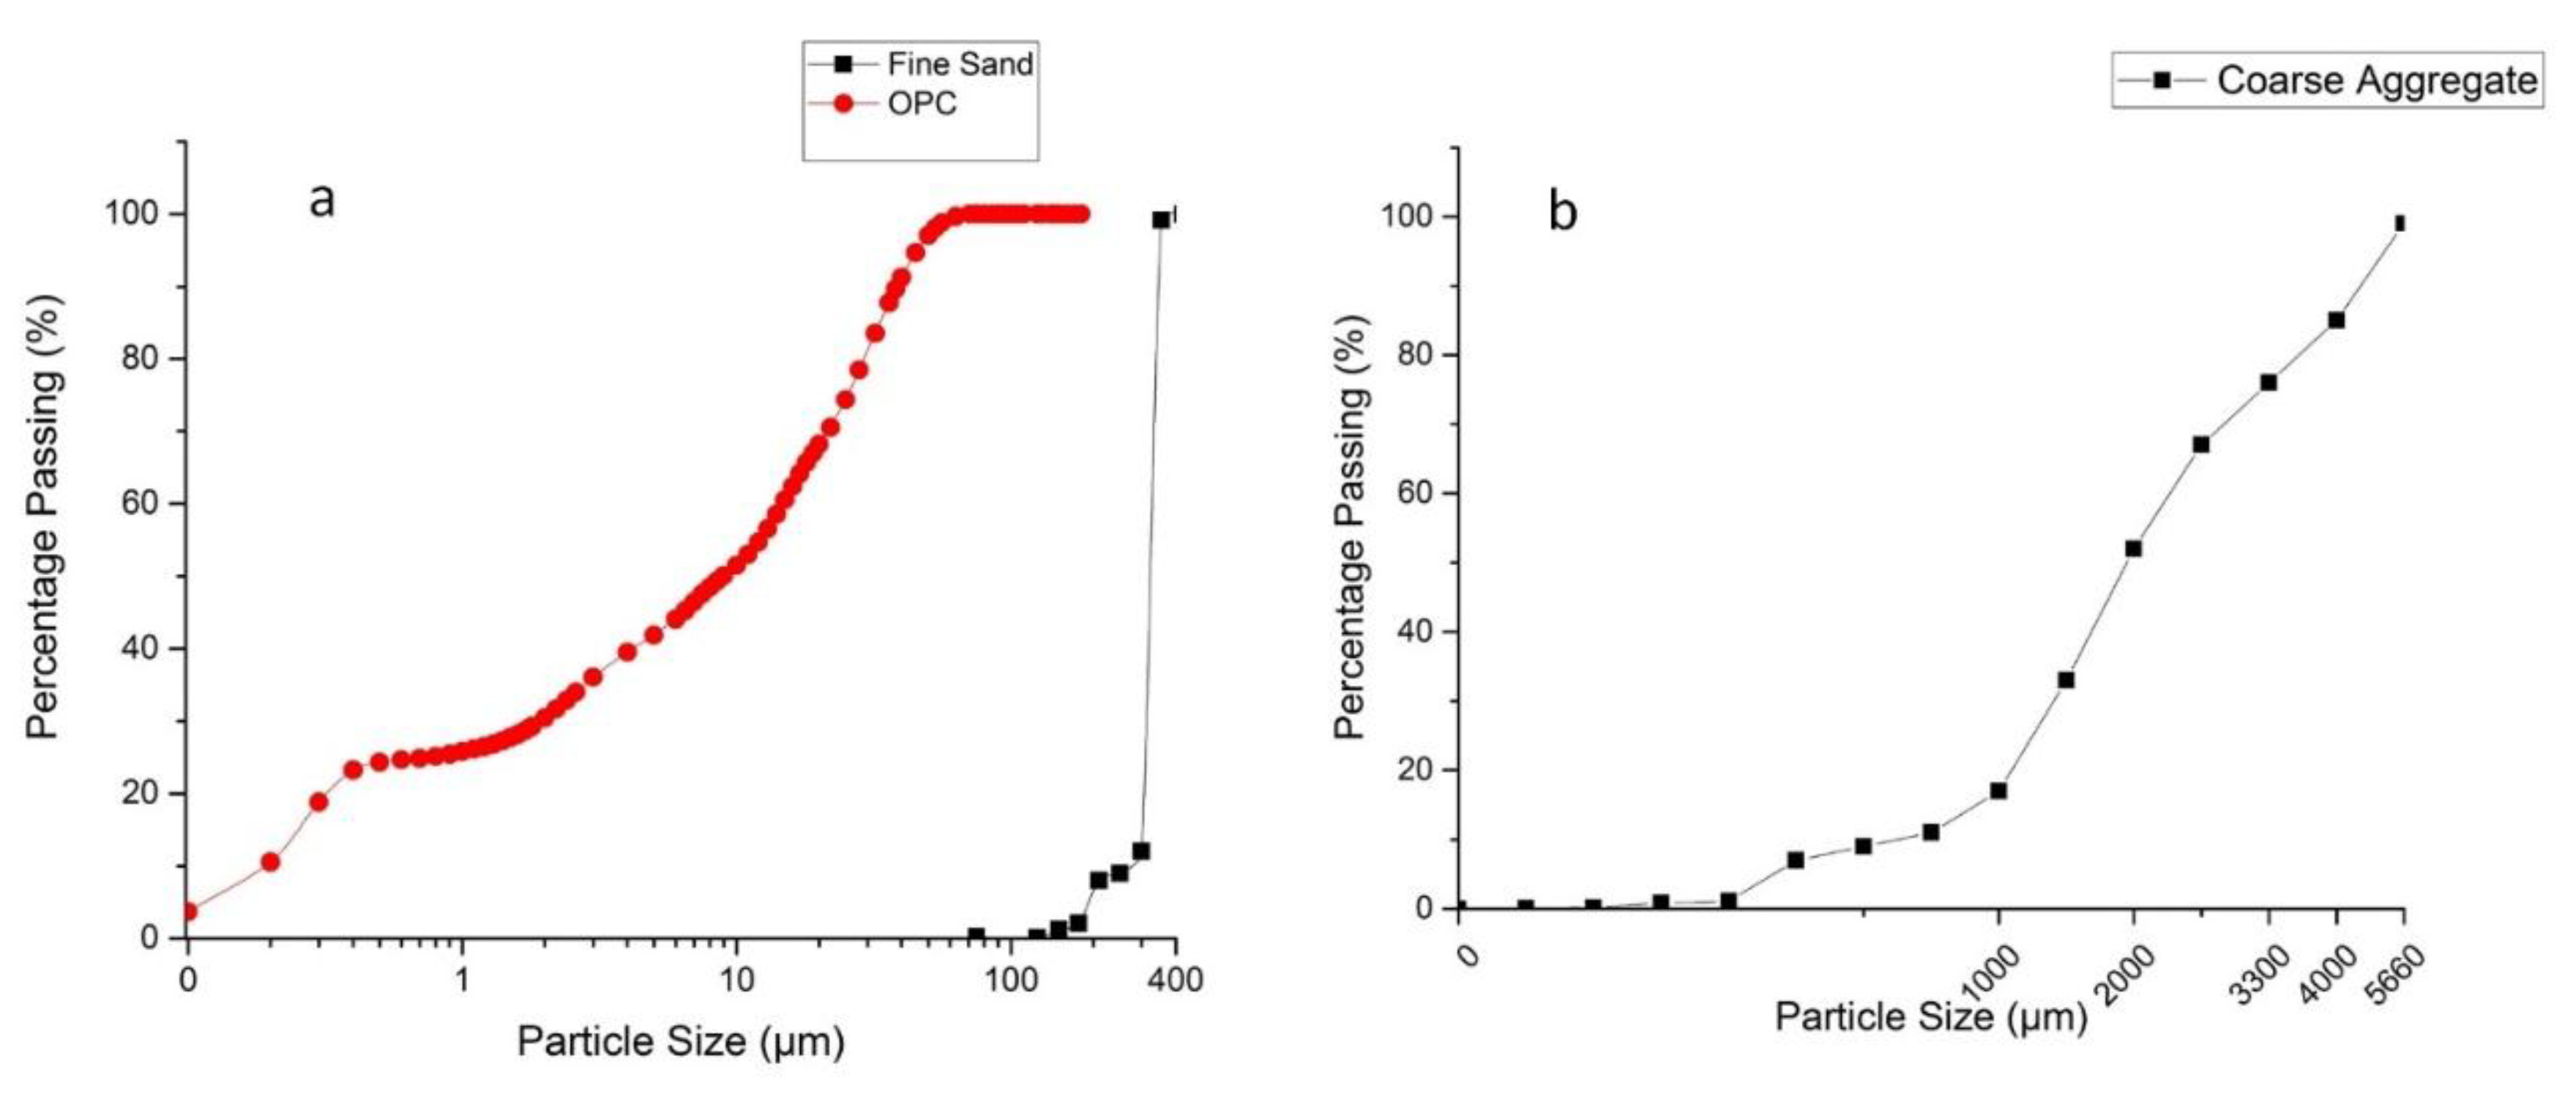
2.1. Materials
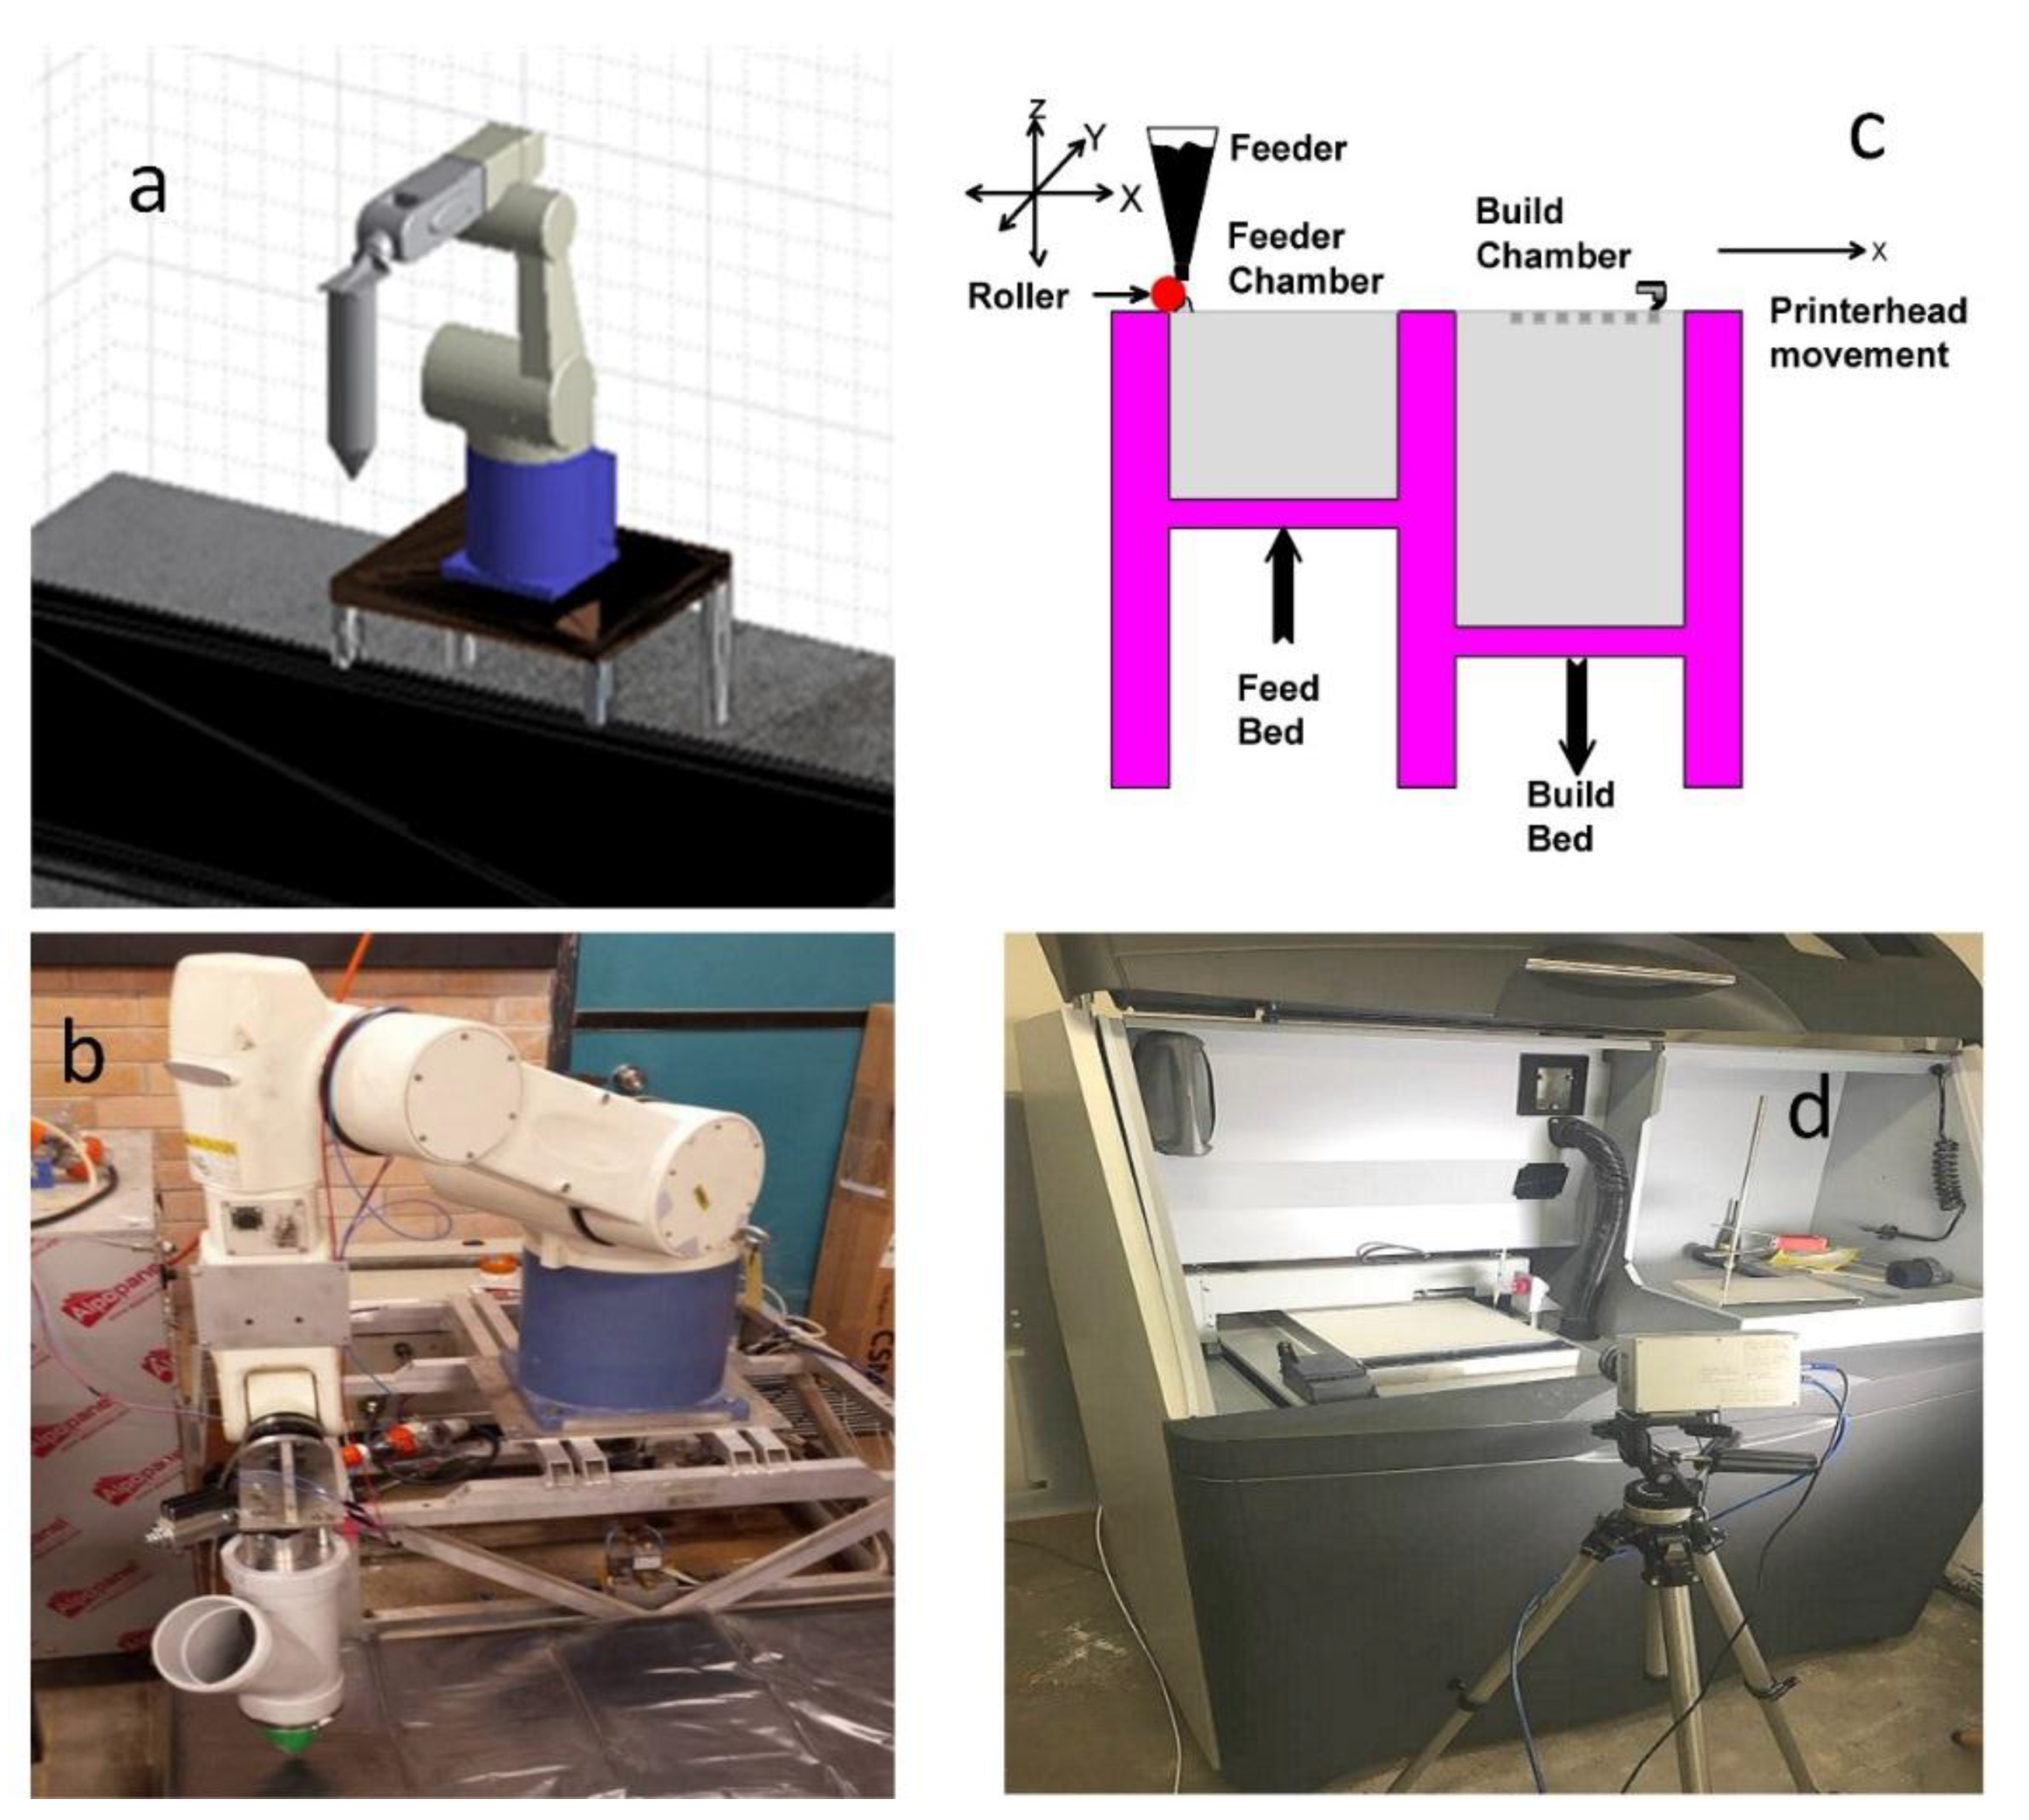
2.2. Design and Fabrication
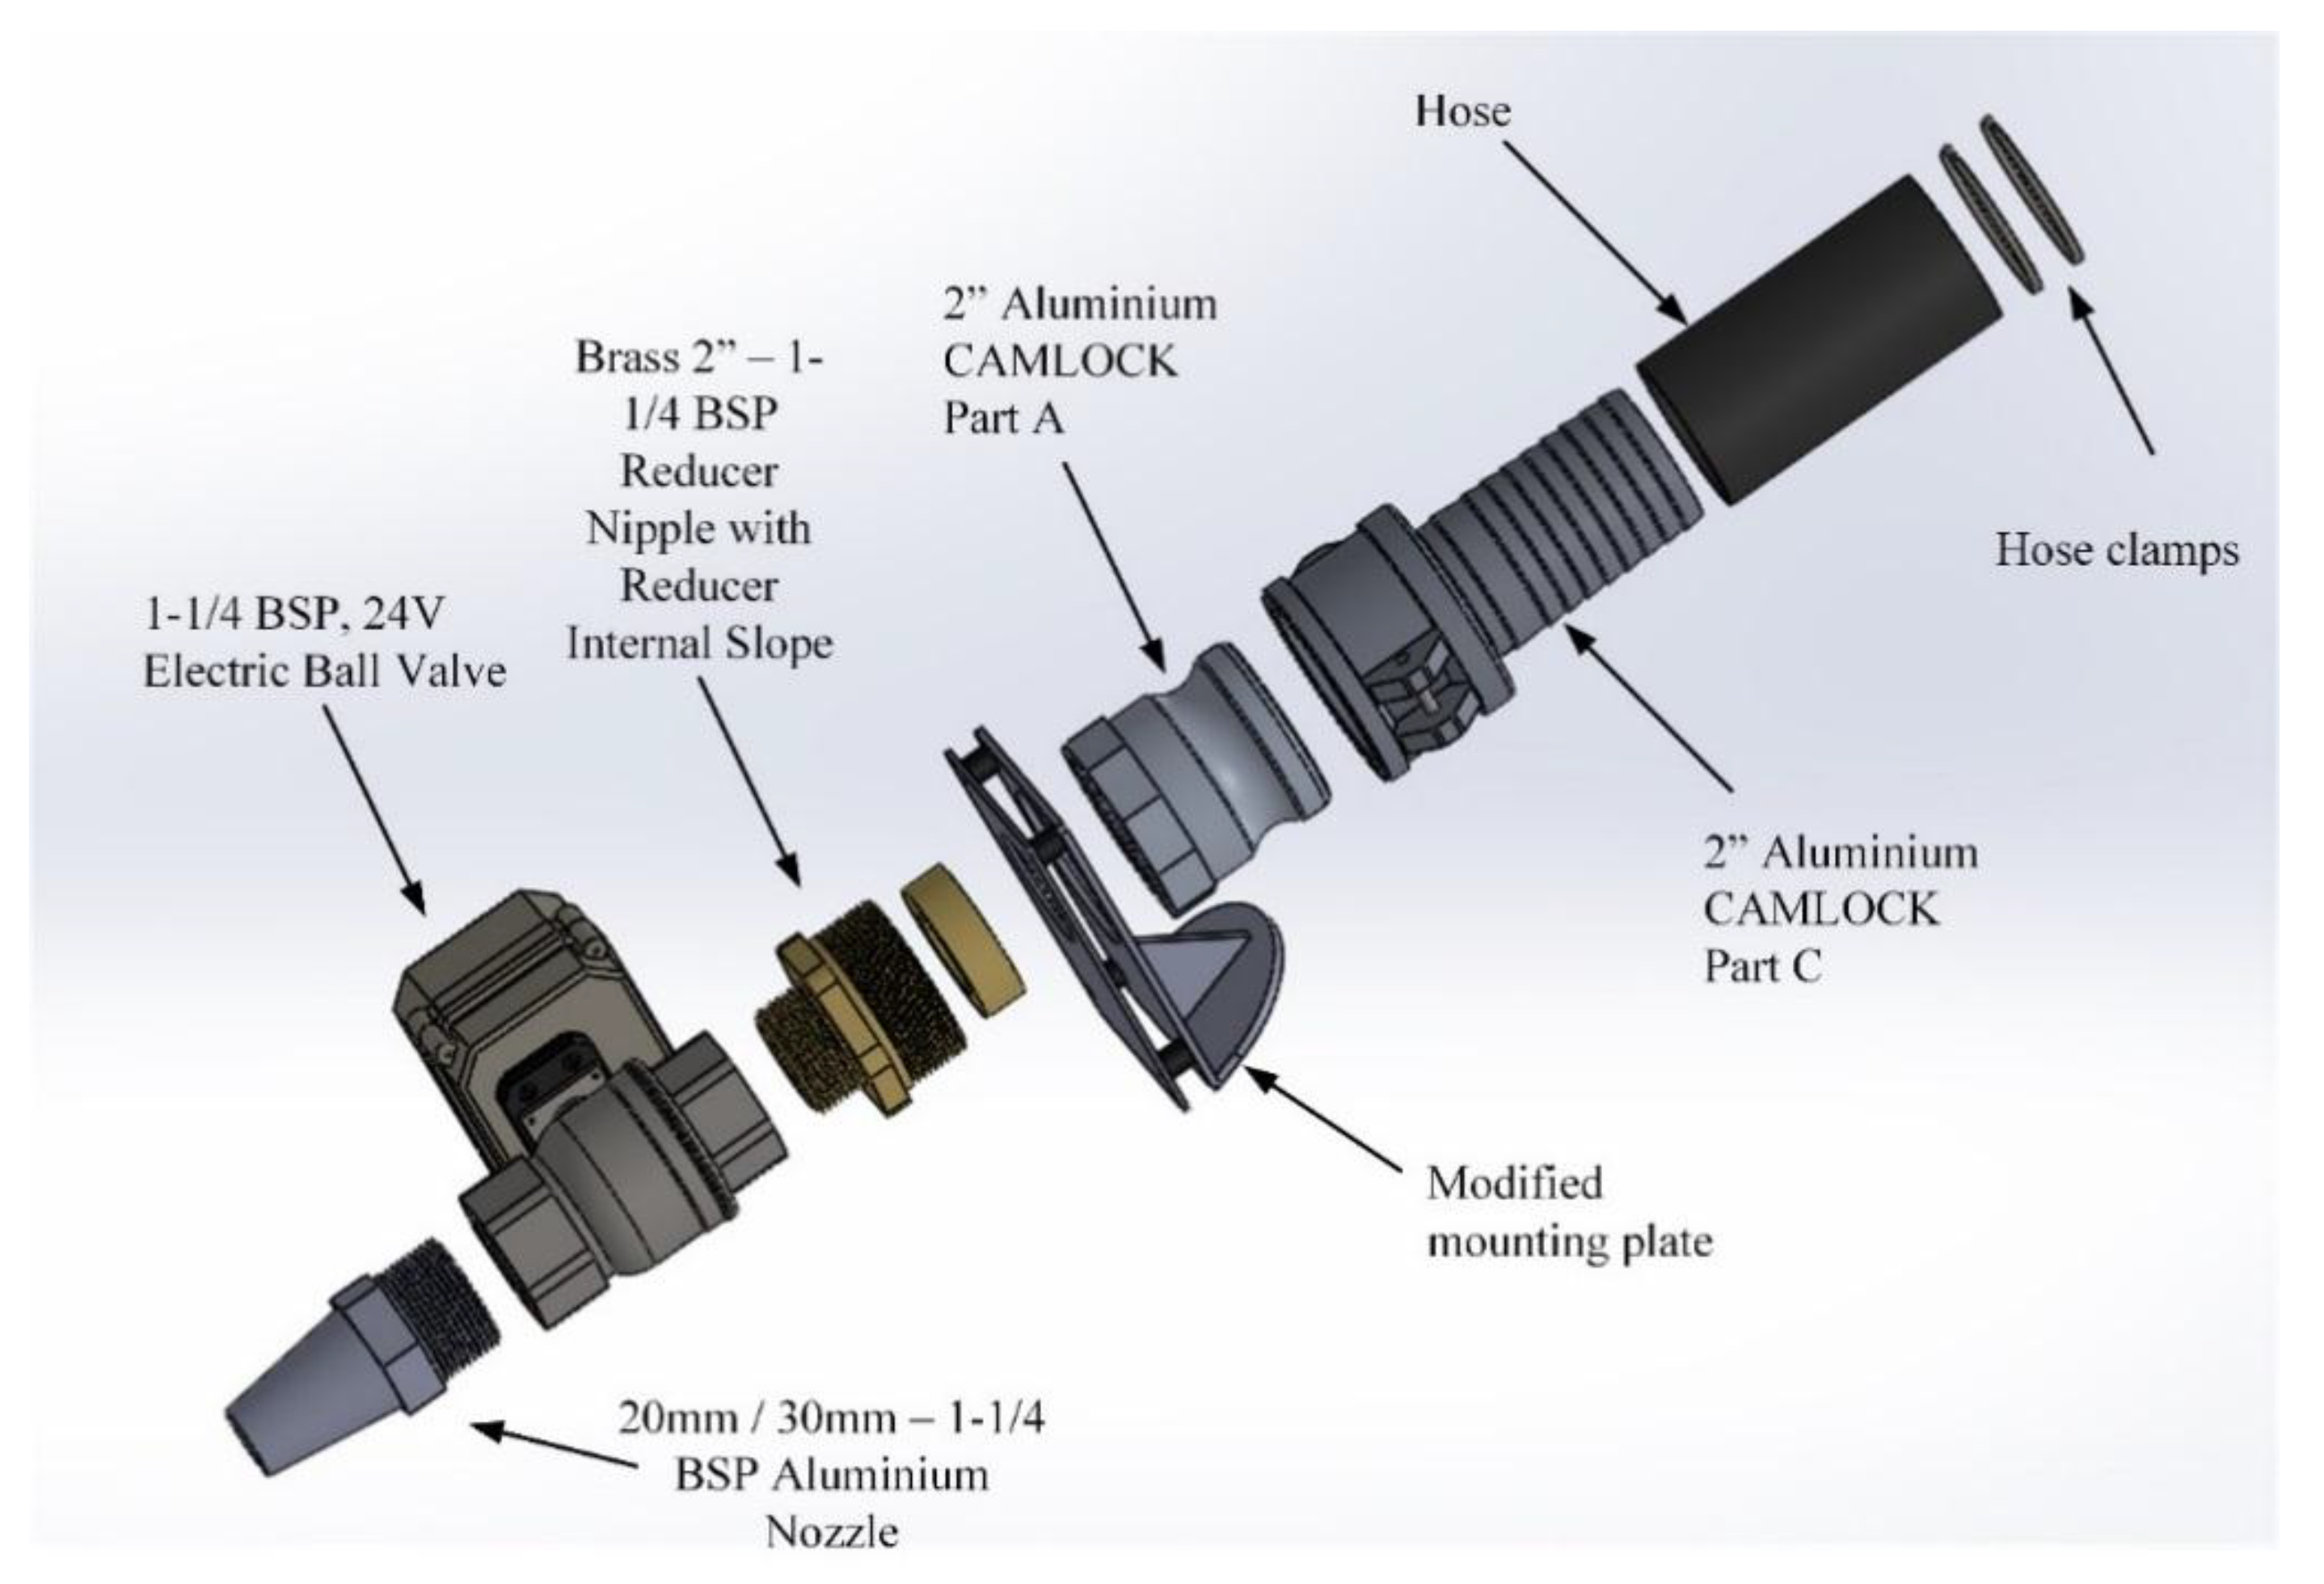
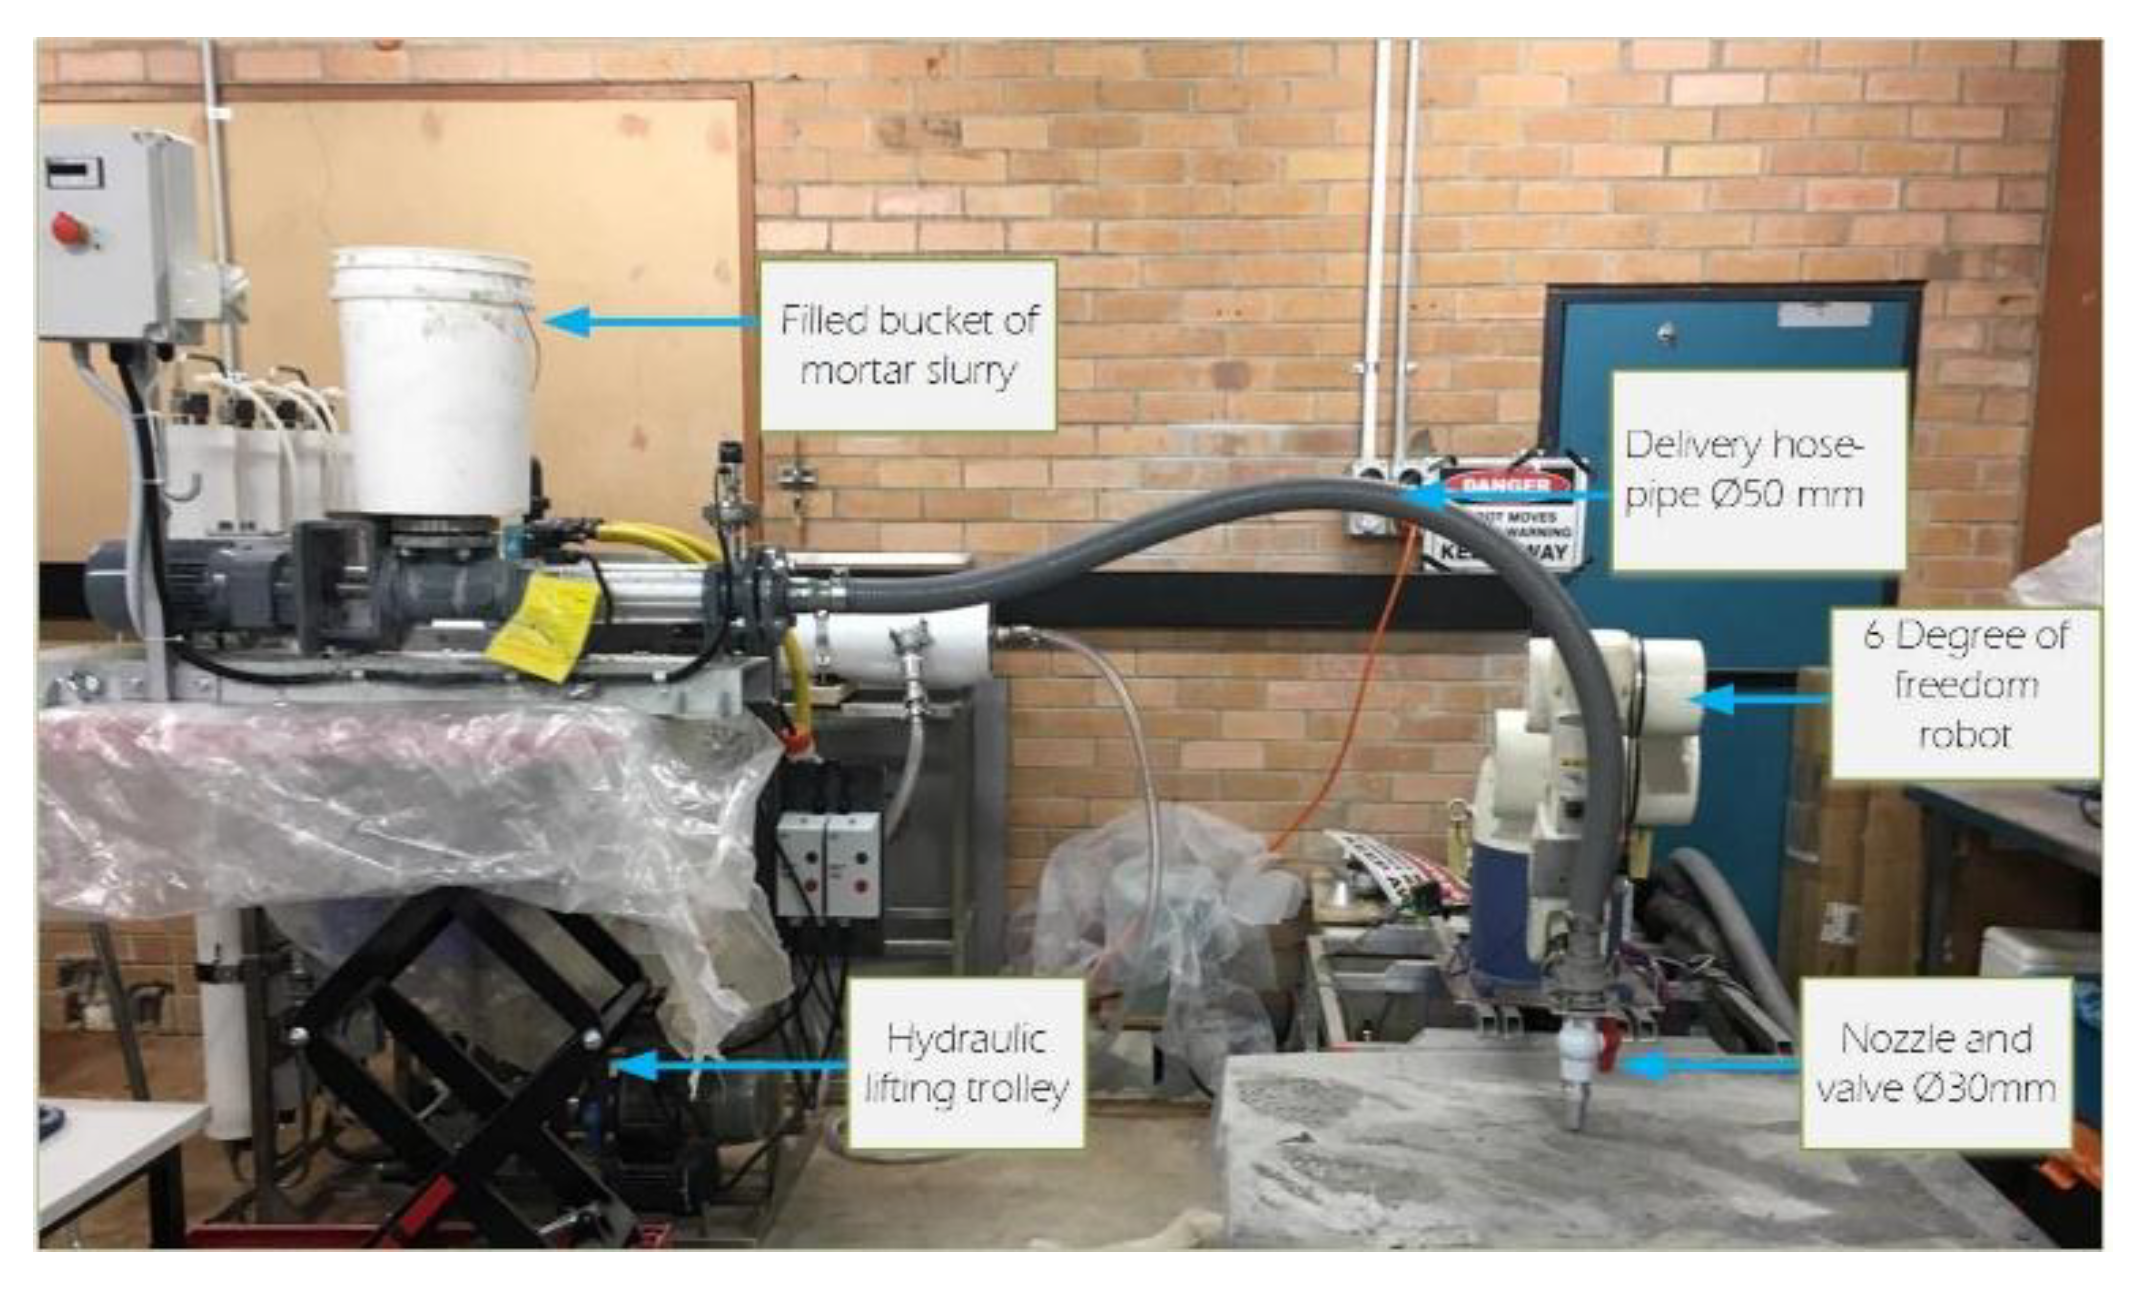
2.2.1. Extruder Adaptation and Delivery System
2.2.2. Mix Designs for Cementitious Materials
3. Fresh and Hardened Properties Tests
3.1. Fresh Properties Tests
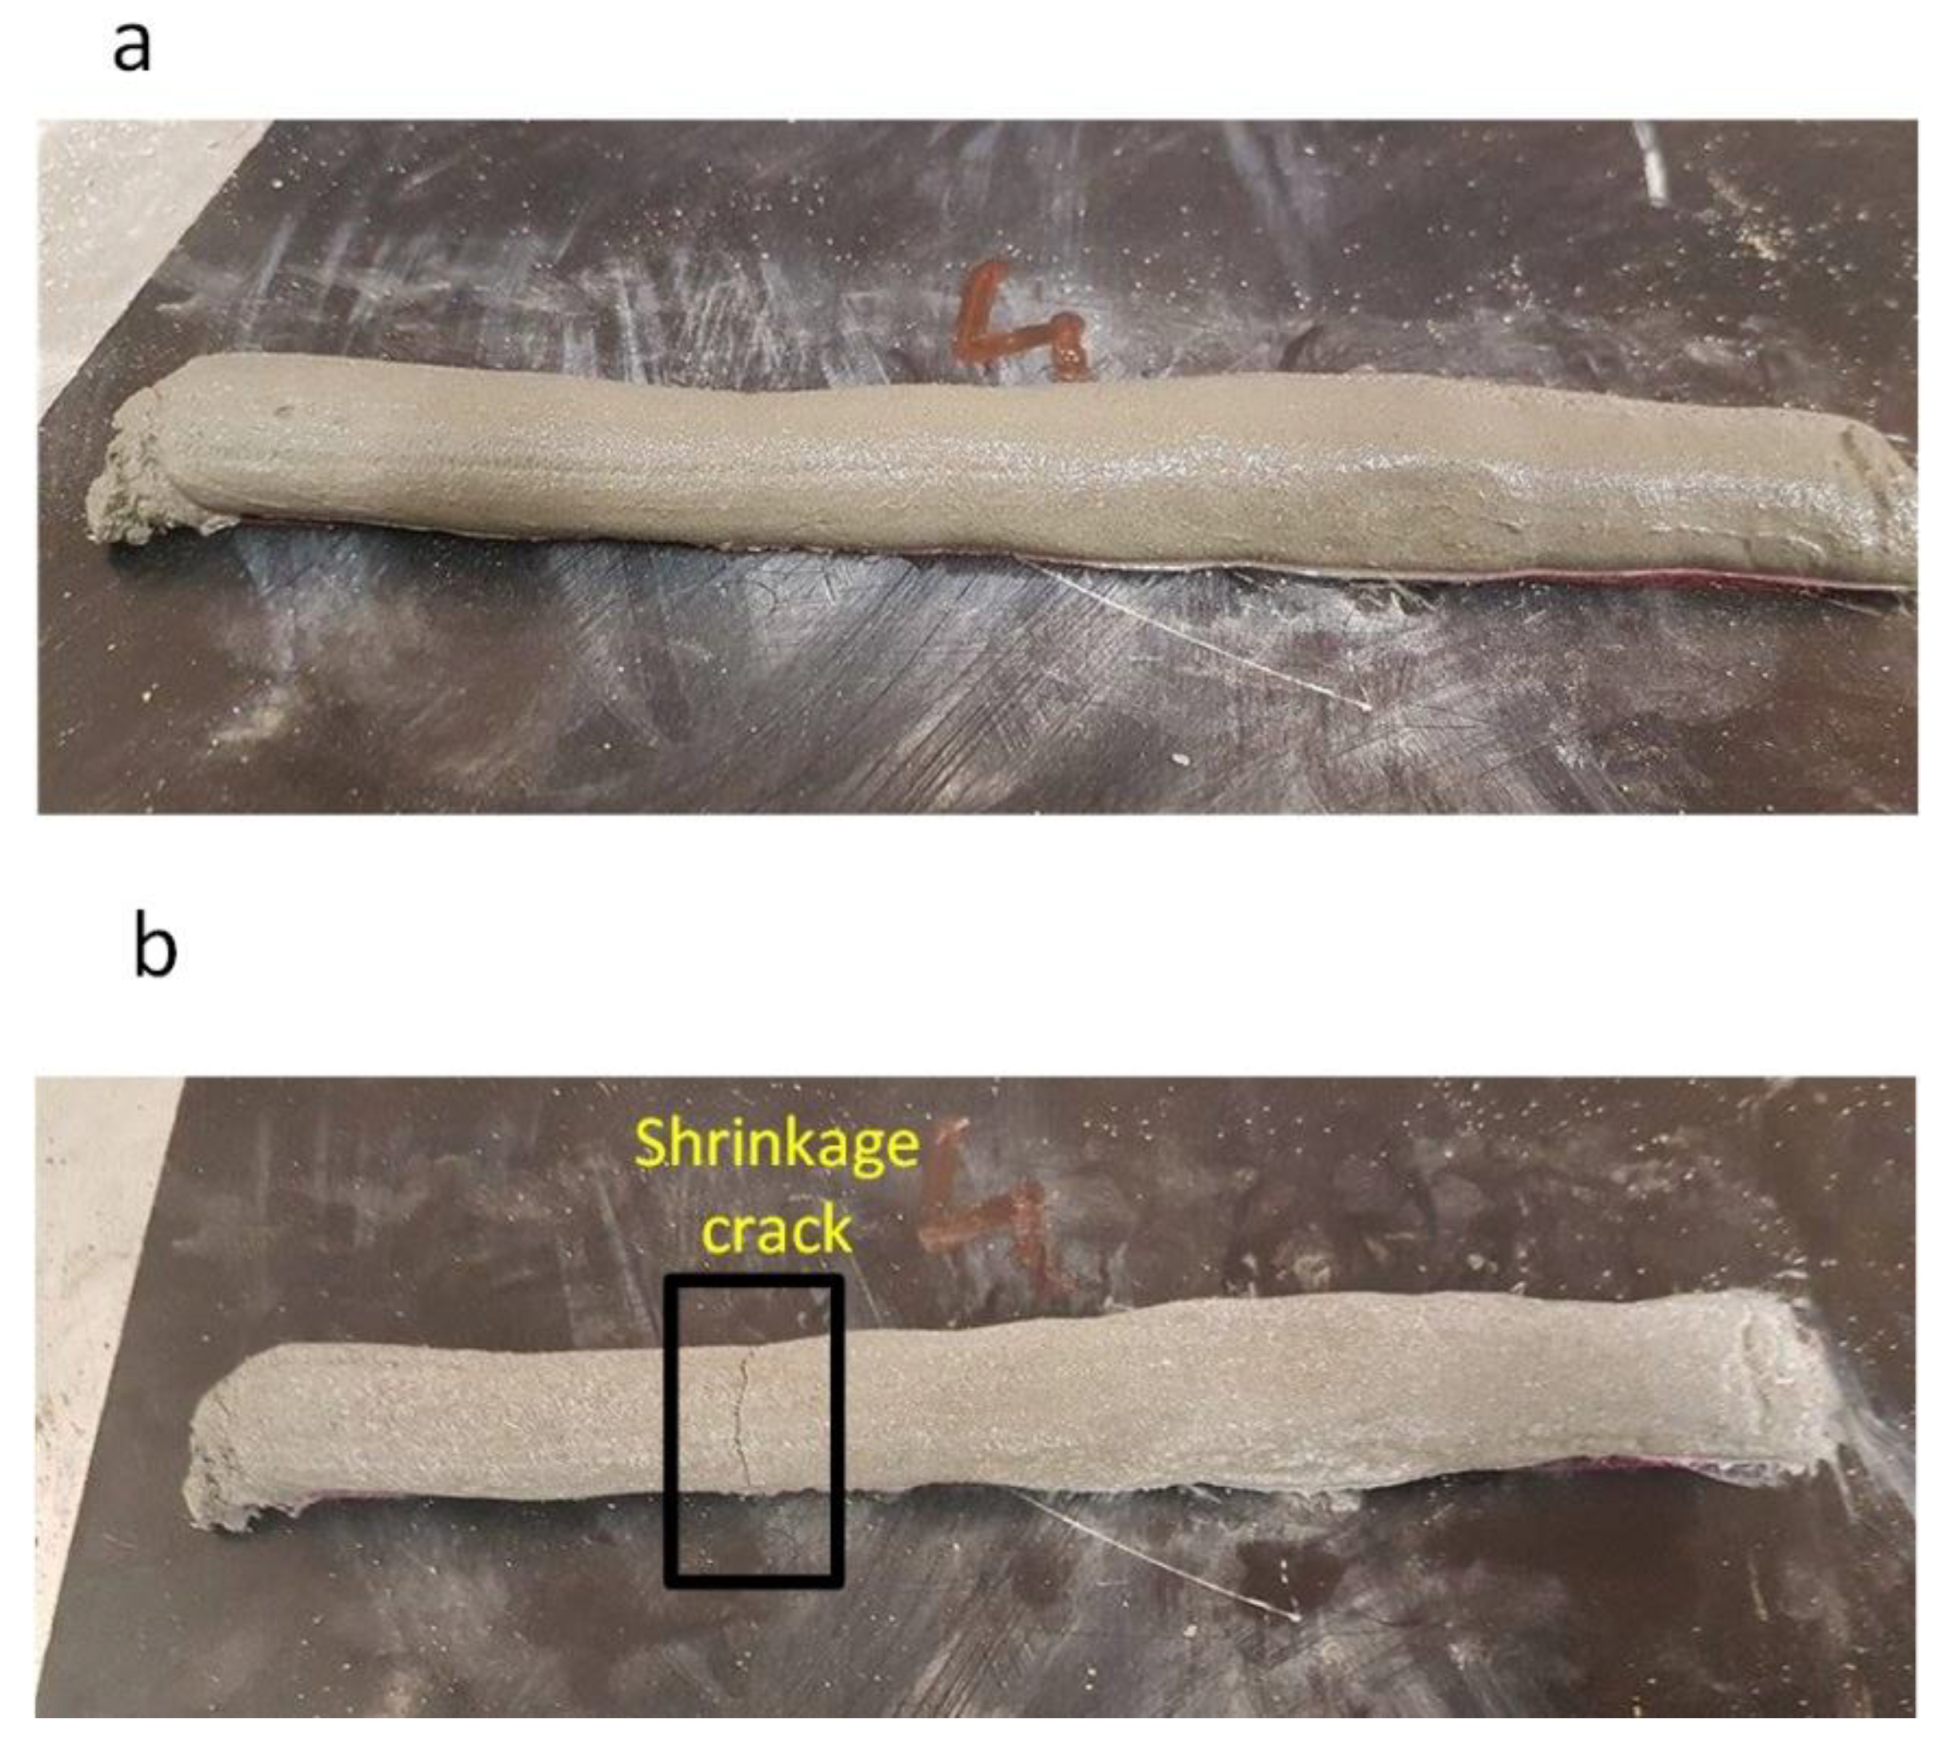
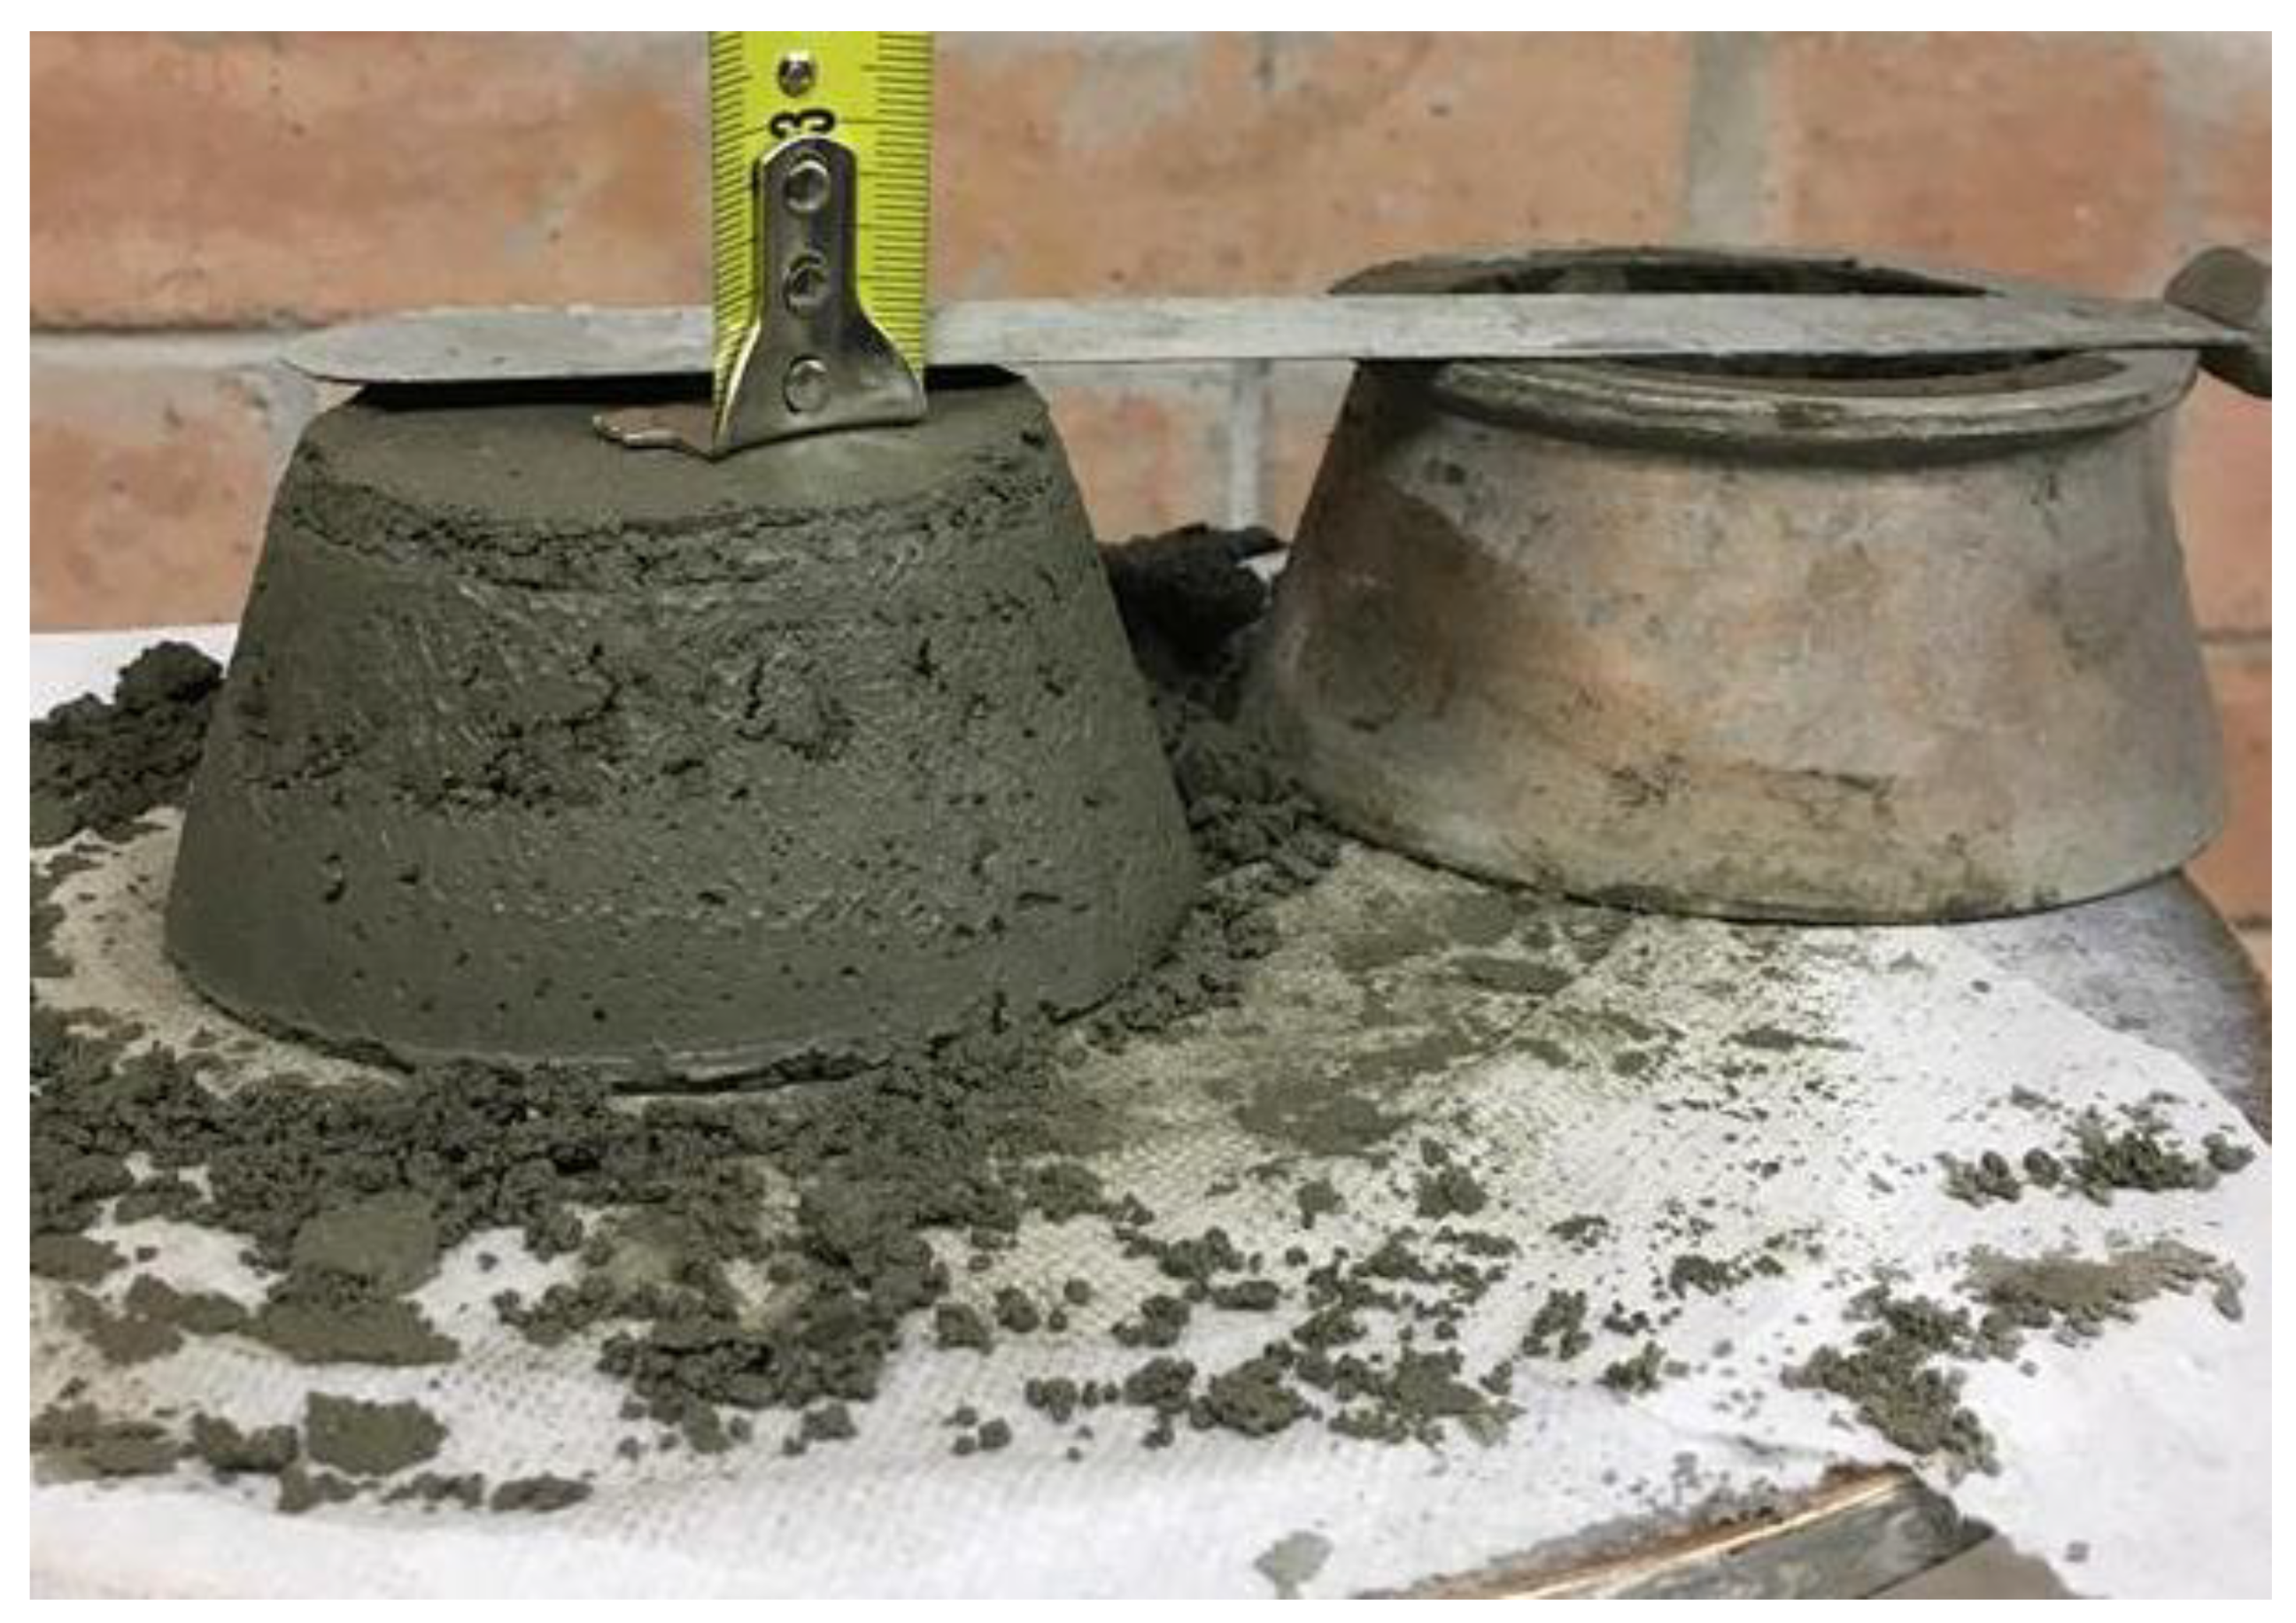
3.1.1. Slump Test
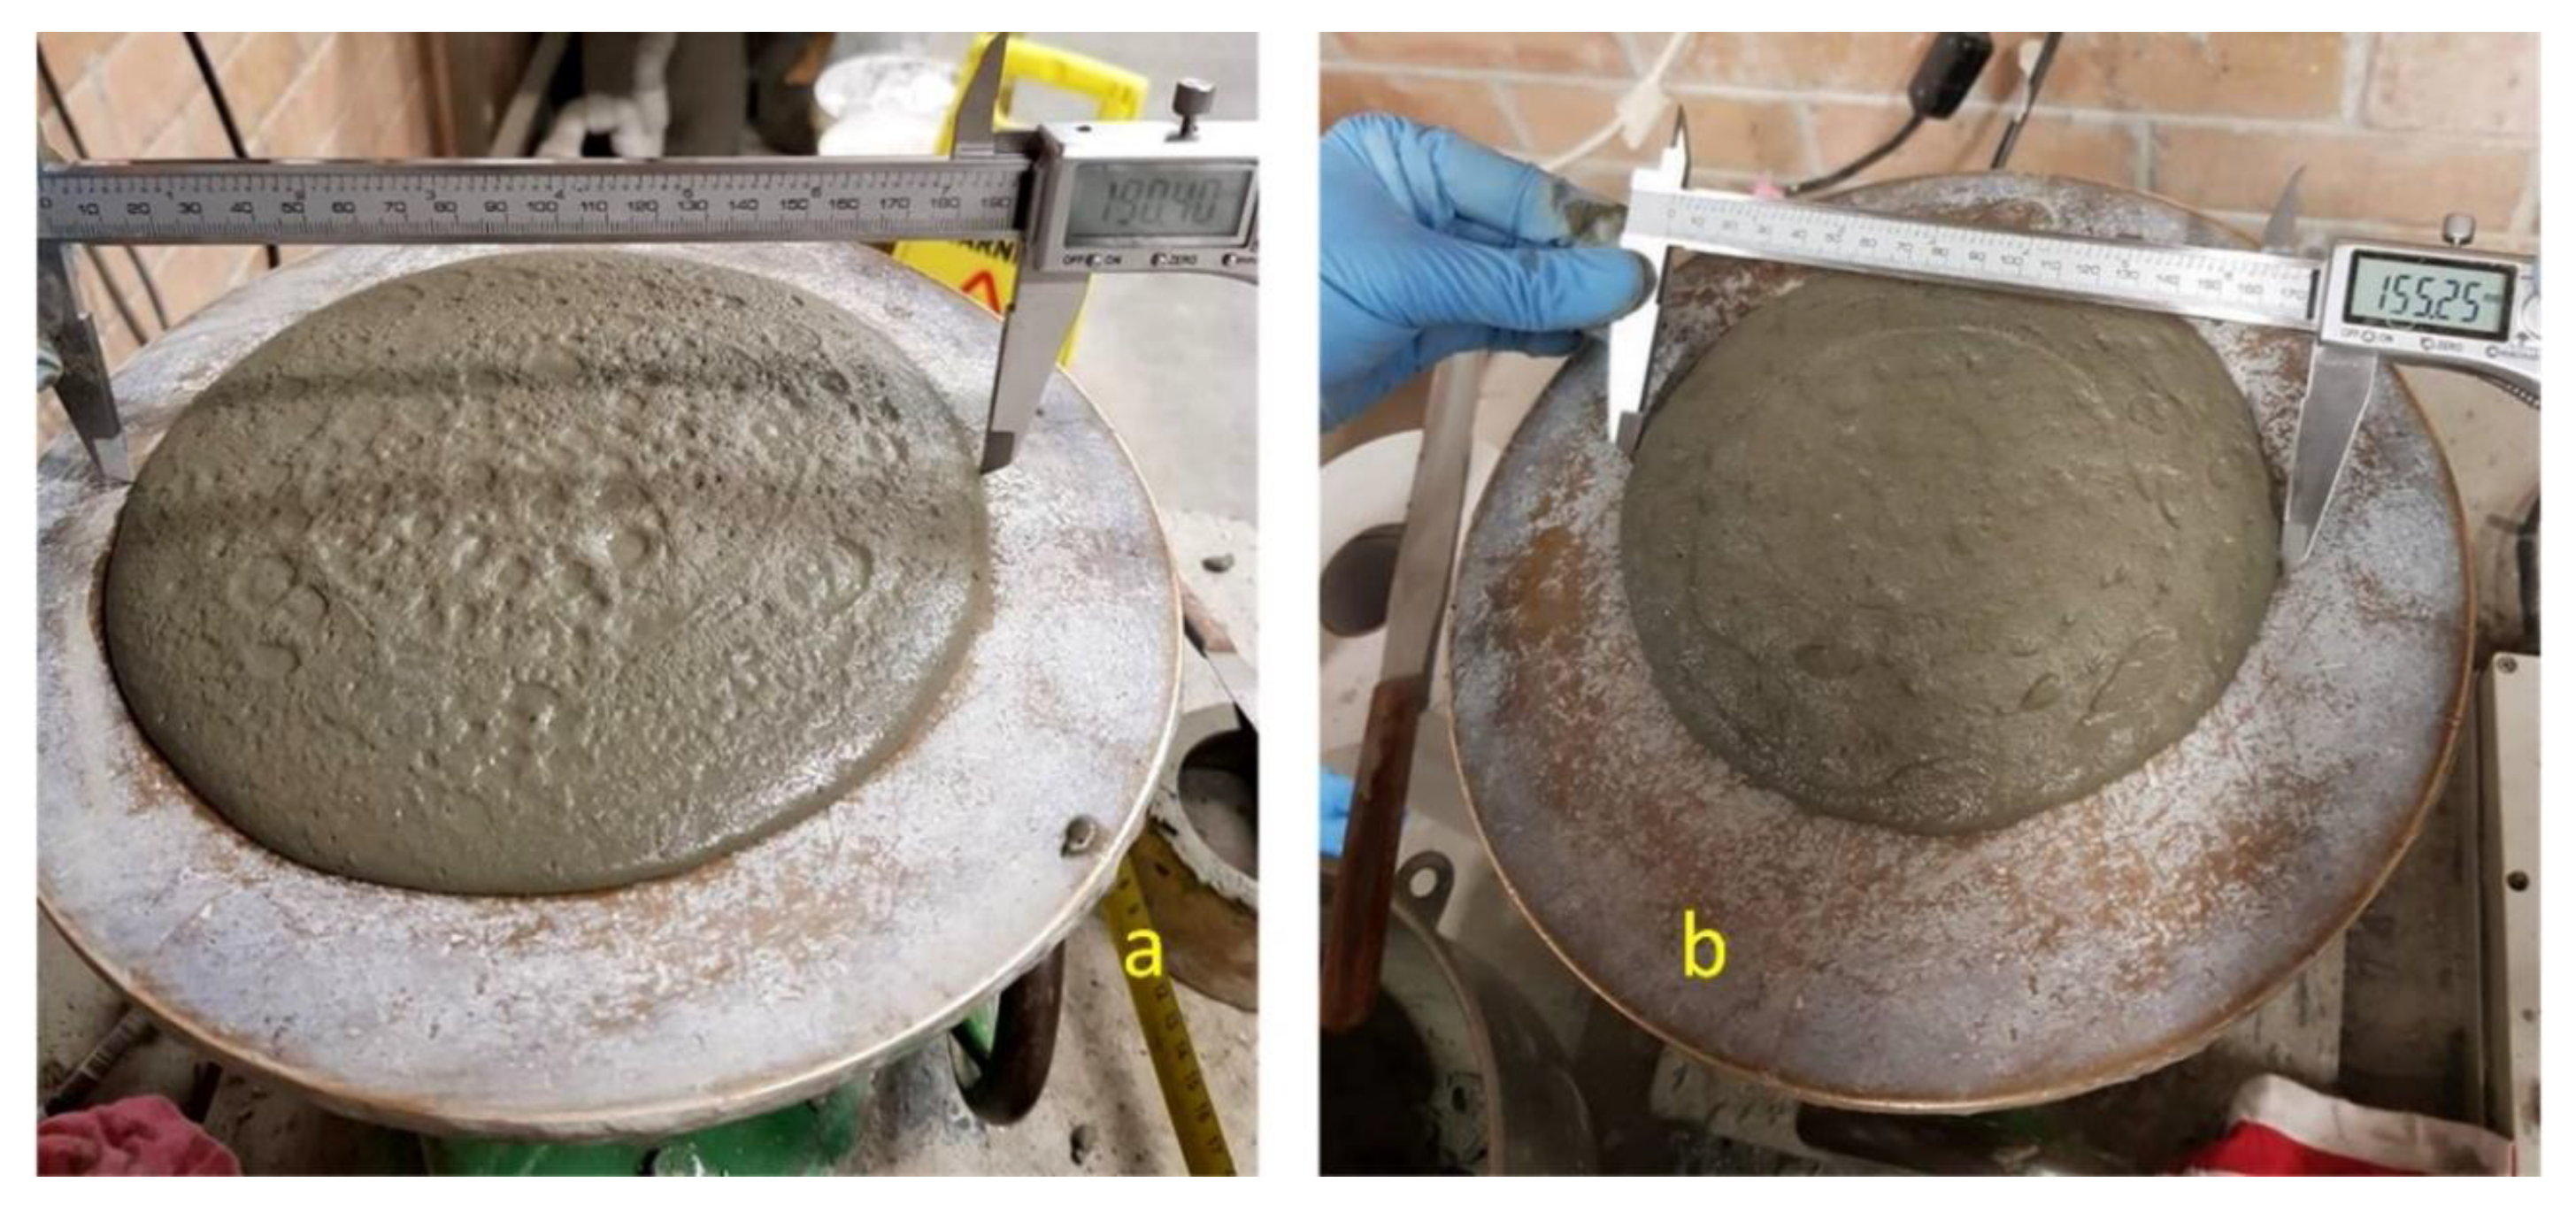
3.1.2. Squeeze Flow Test
3.1.3. Setting Time
3.2. Hardened Properties Test
3.2.1. Compressive Strength Test
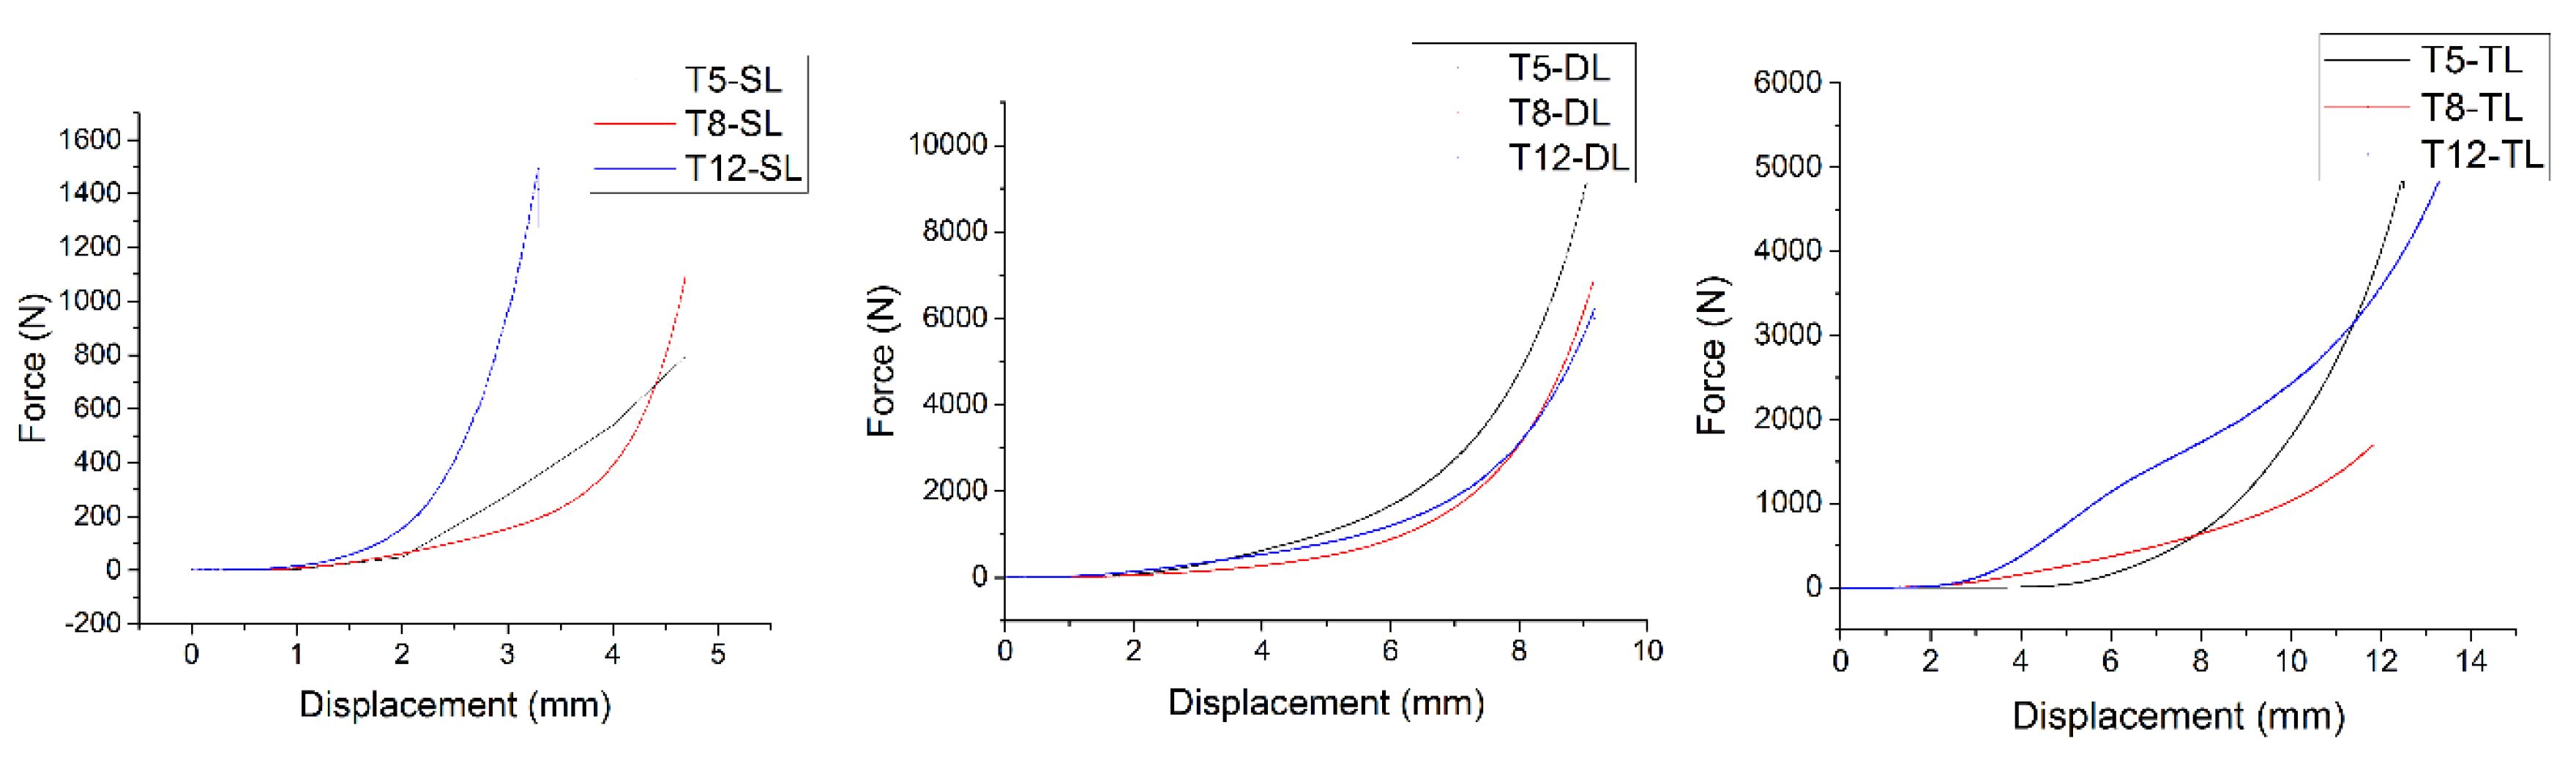
3.2.2. Flexural Strength Test
4. Results and Discussion
4.1. Mechanical Tests and Materials Properties
4.1.1. Slump Test
4.1.2. Squeeze Flow Test
4.1.3. Setting Time
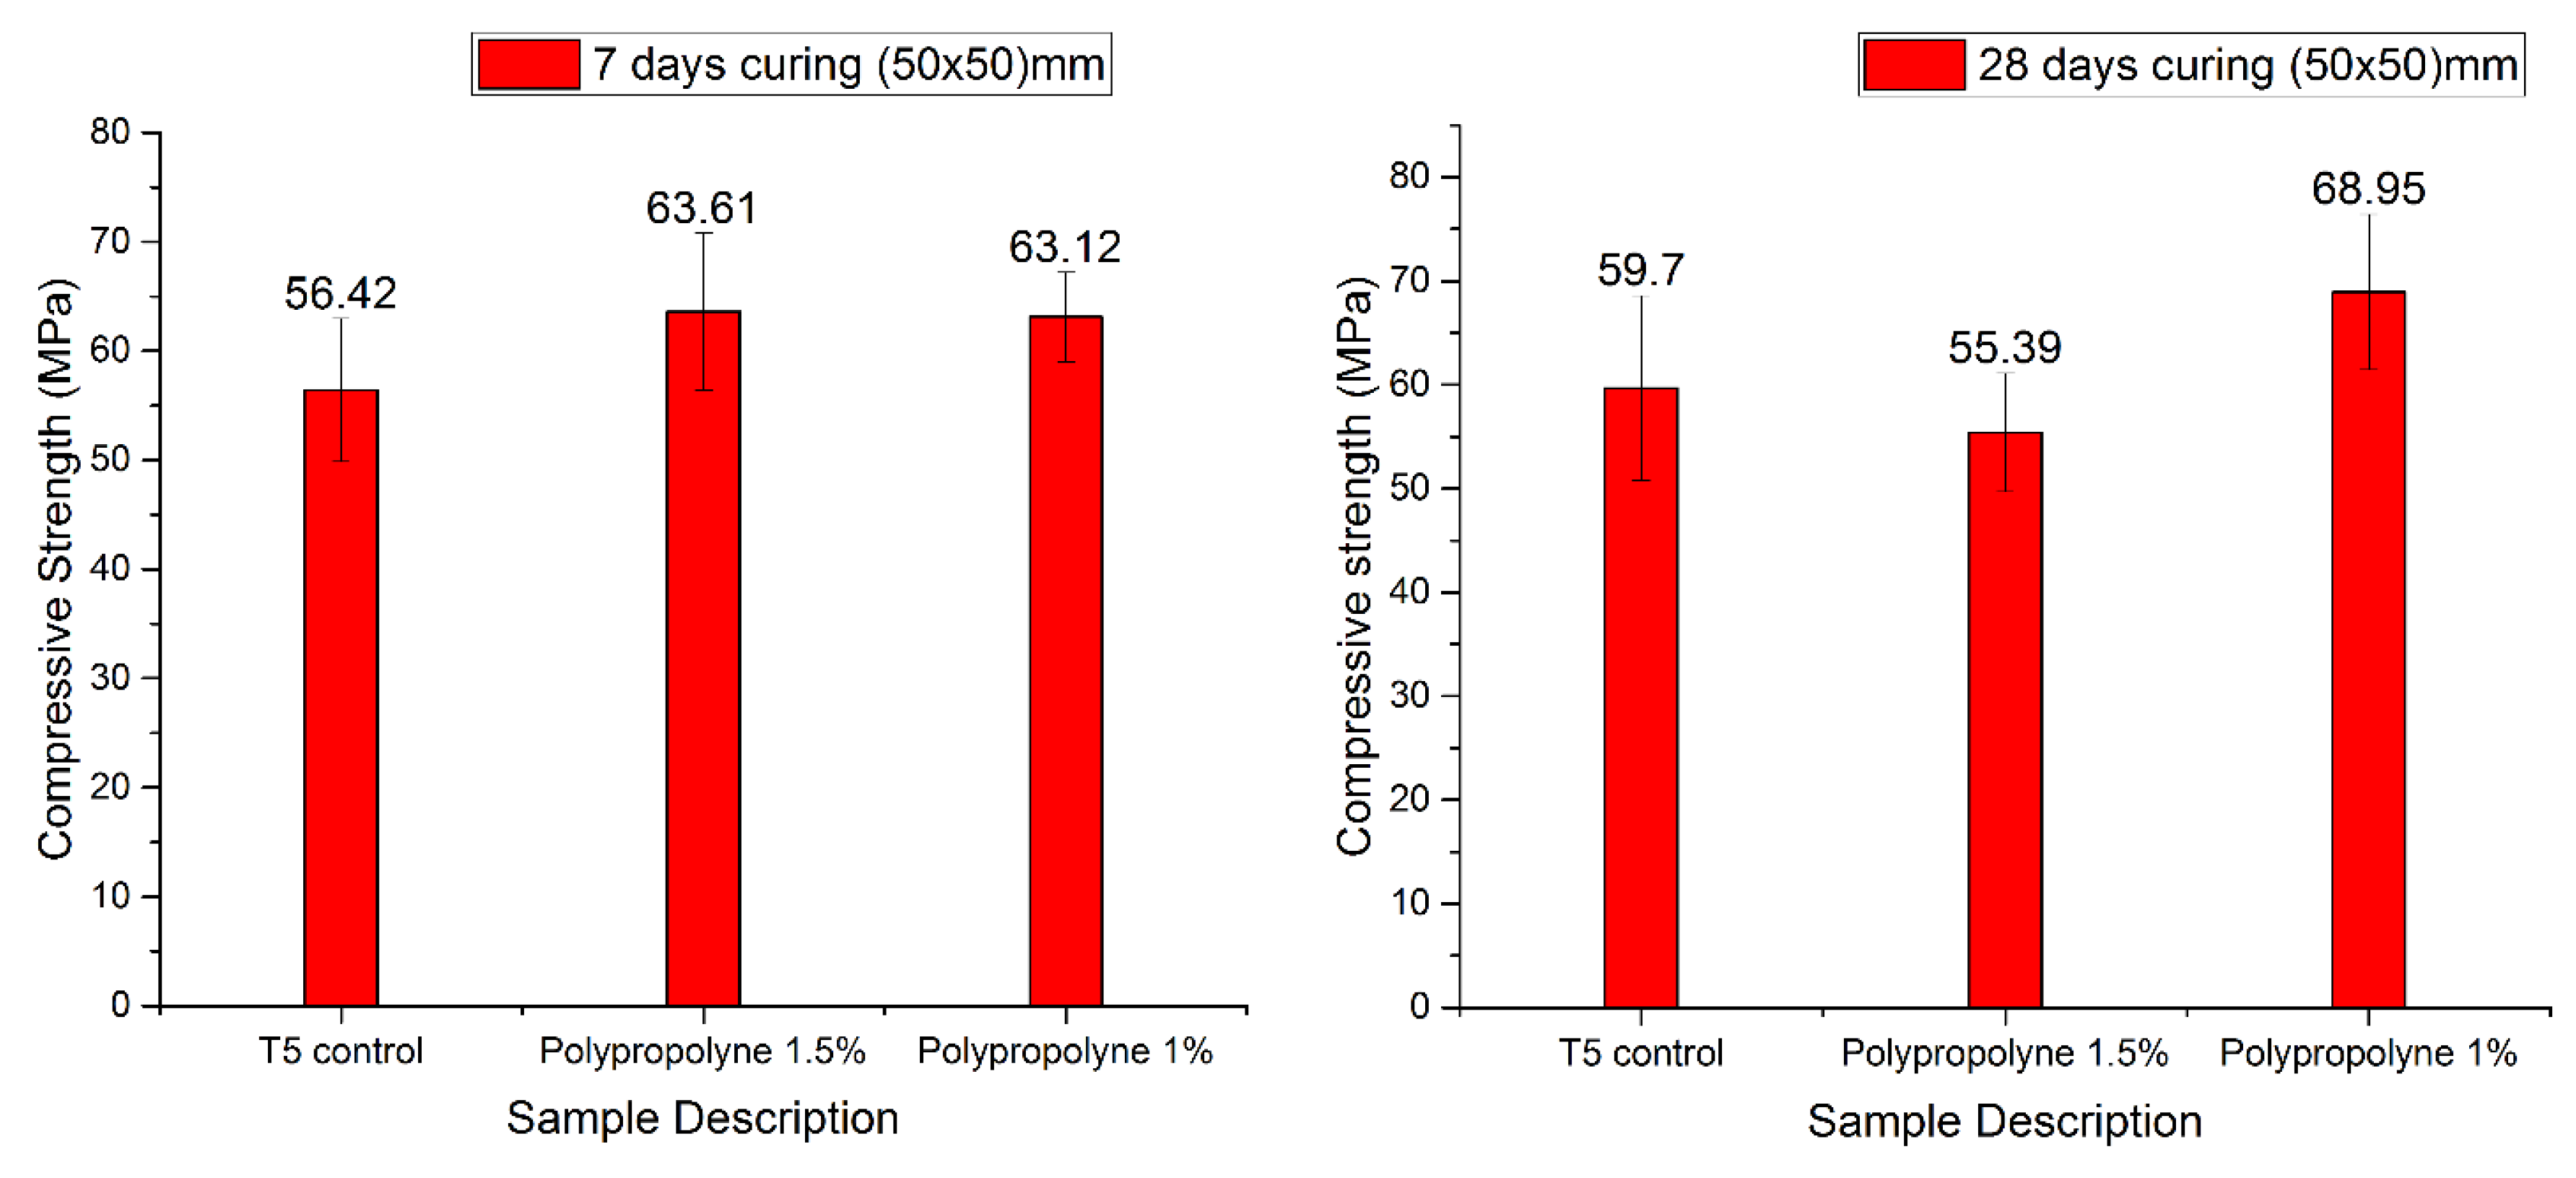
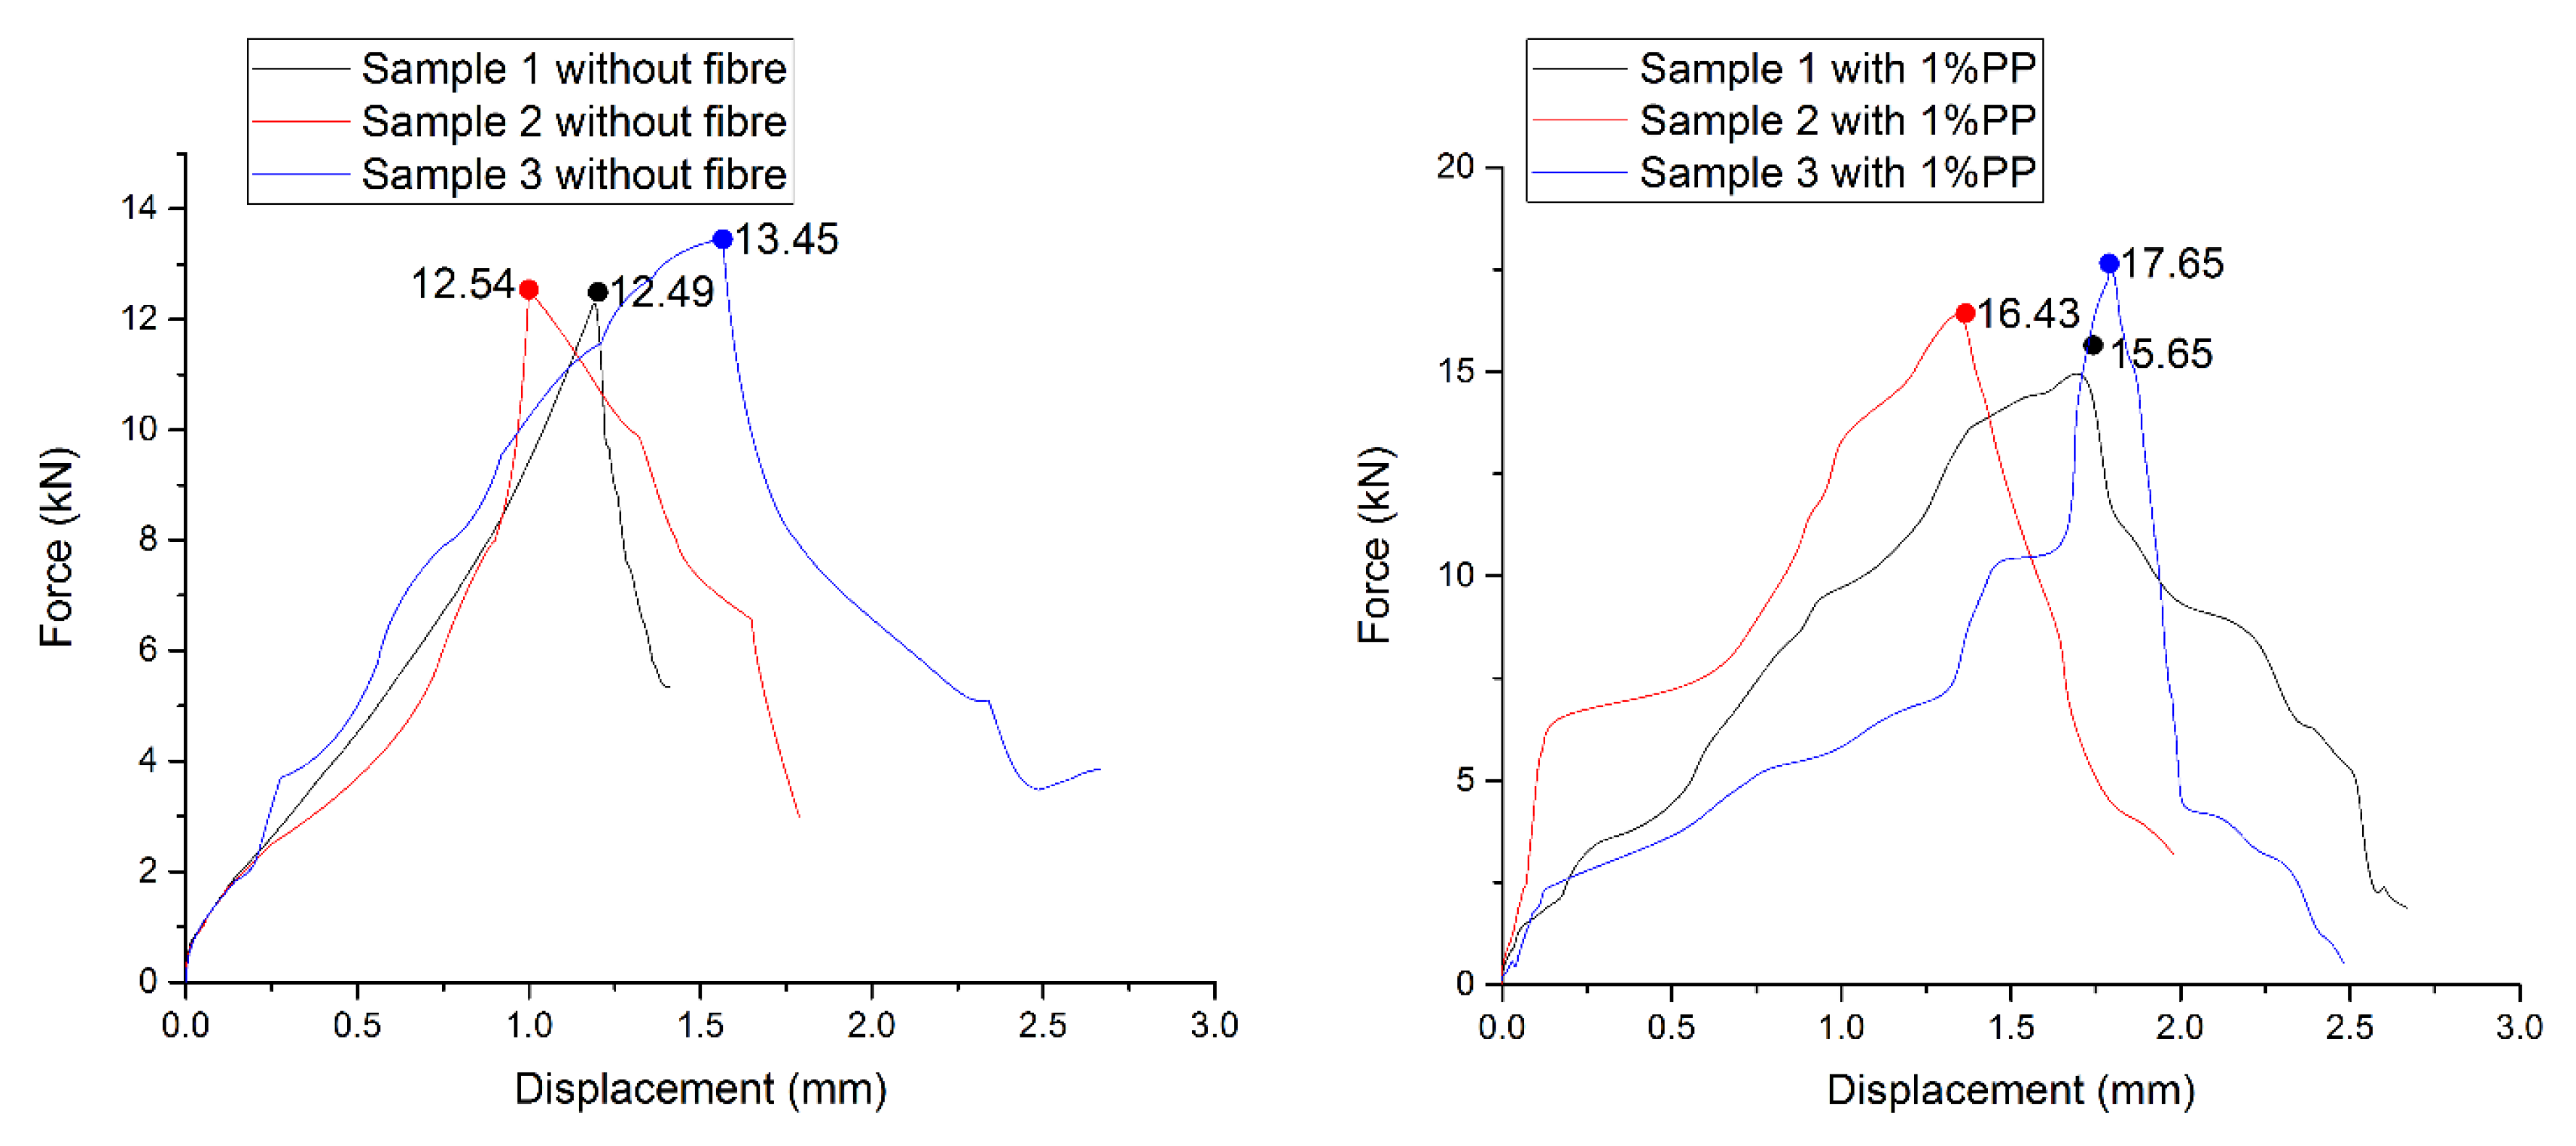
4.1.4. Compressive Strength Test
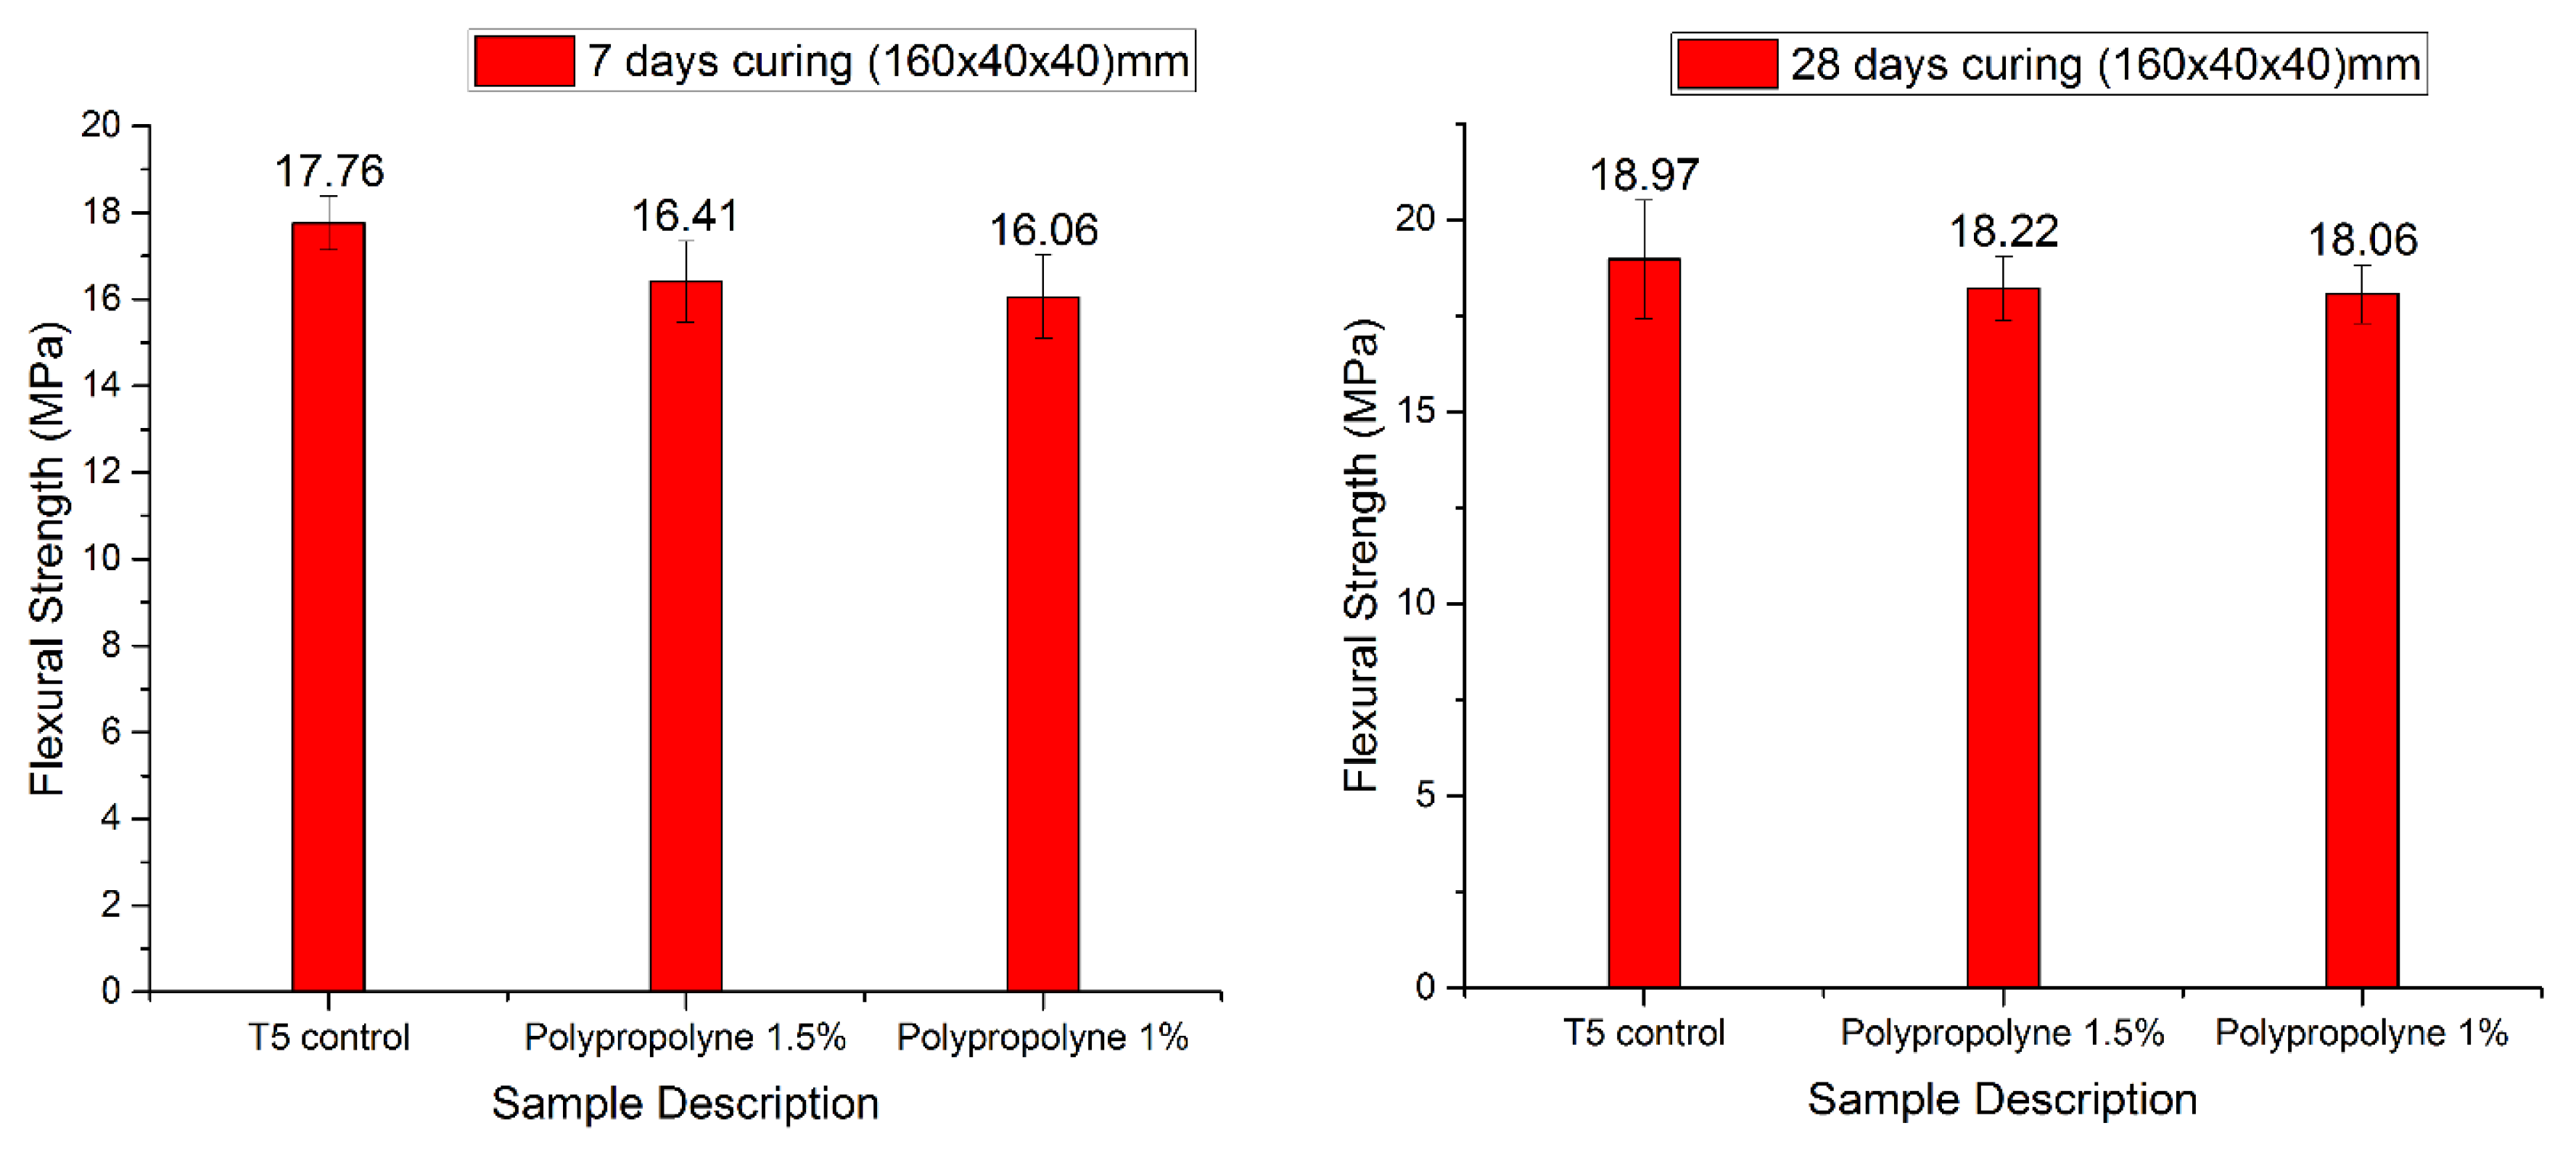
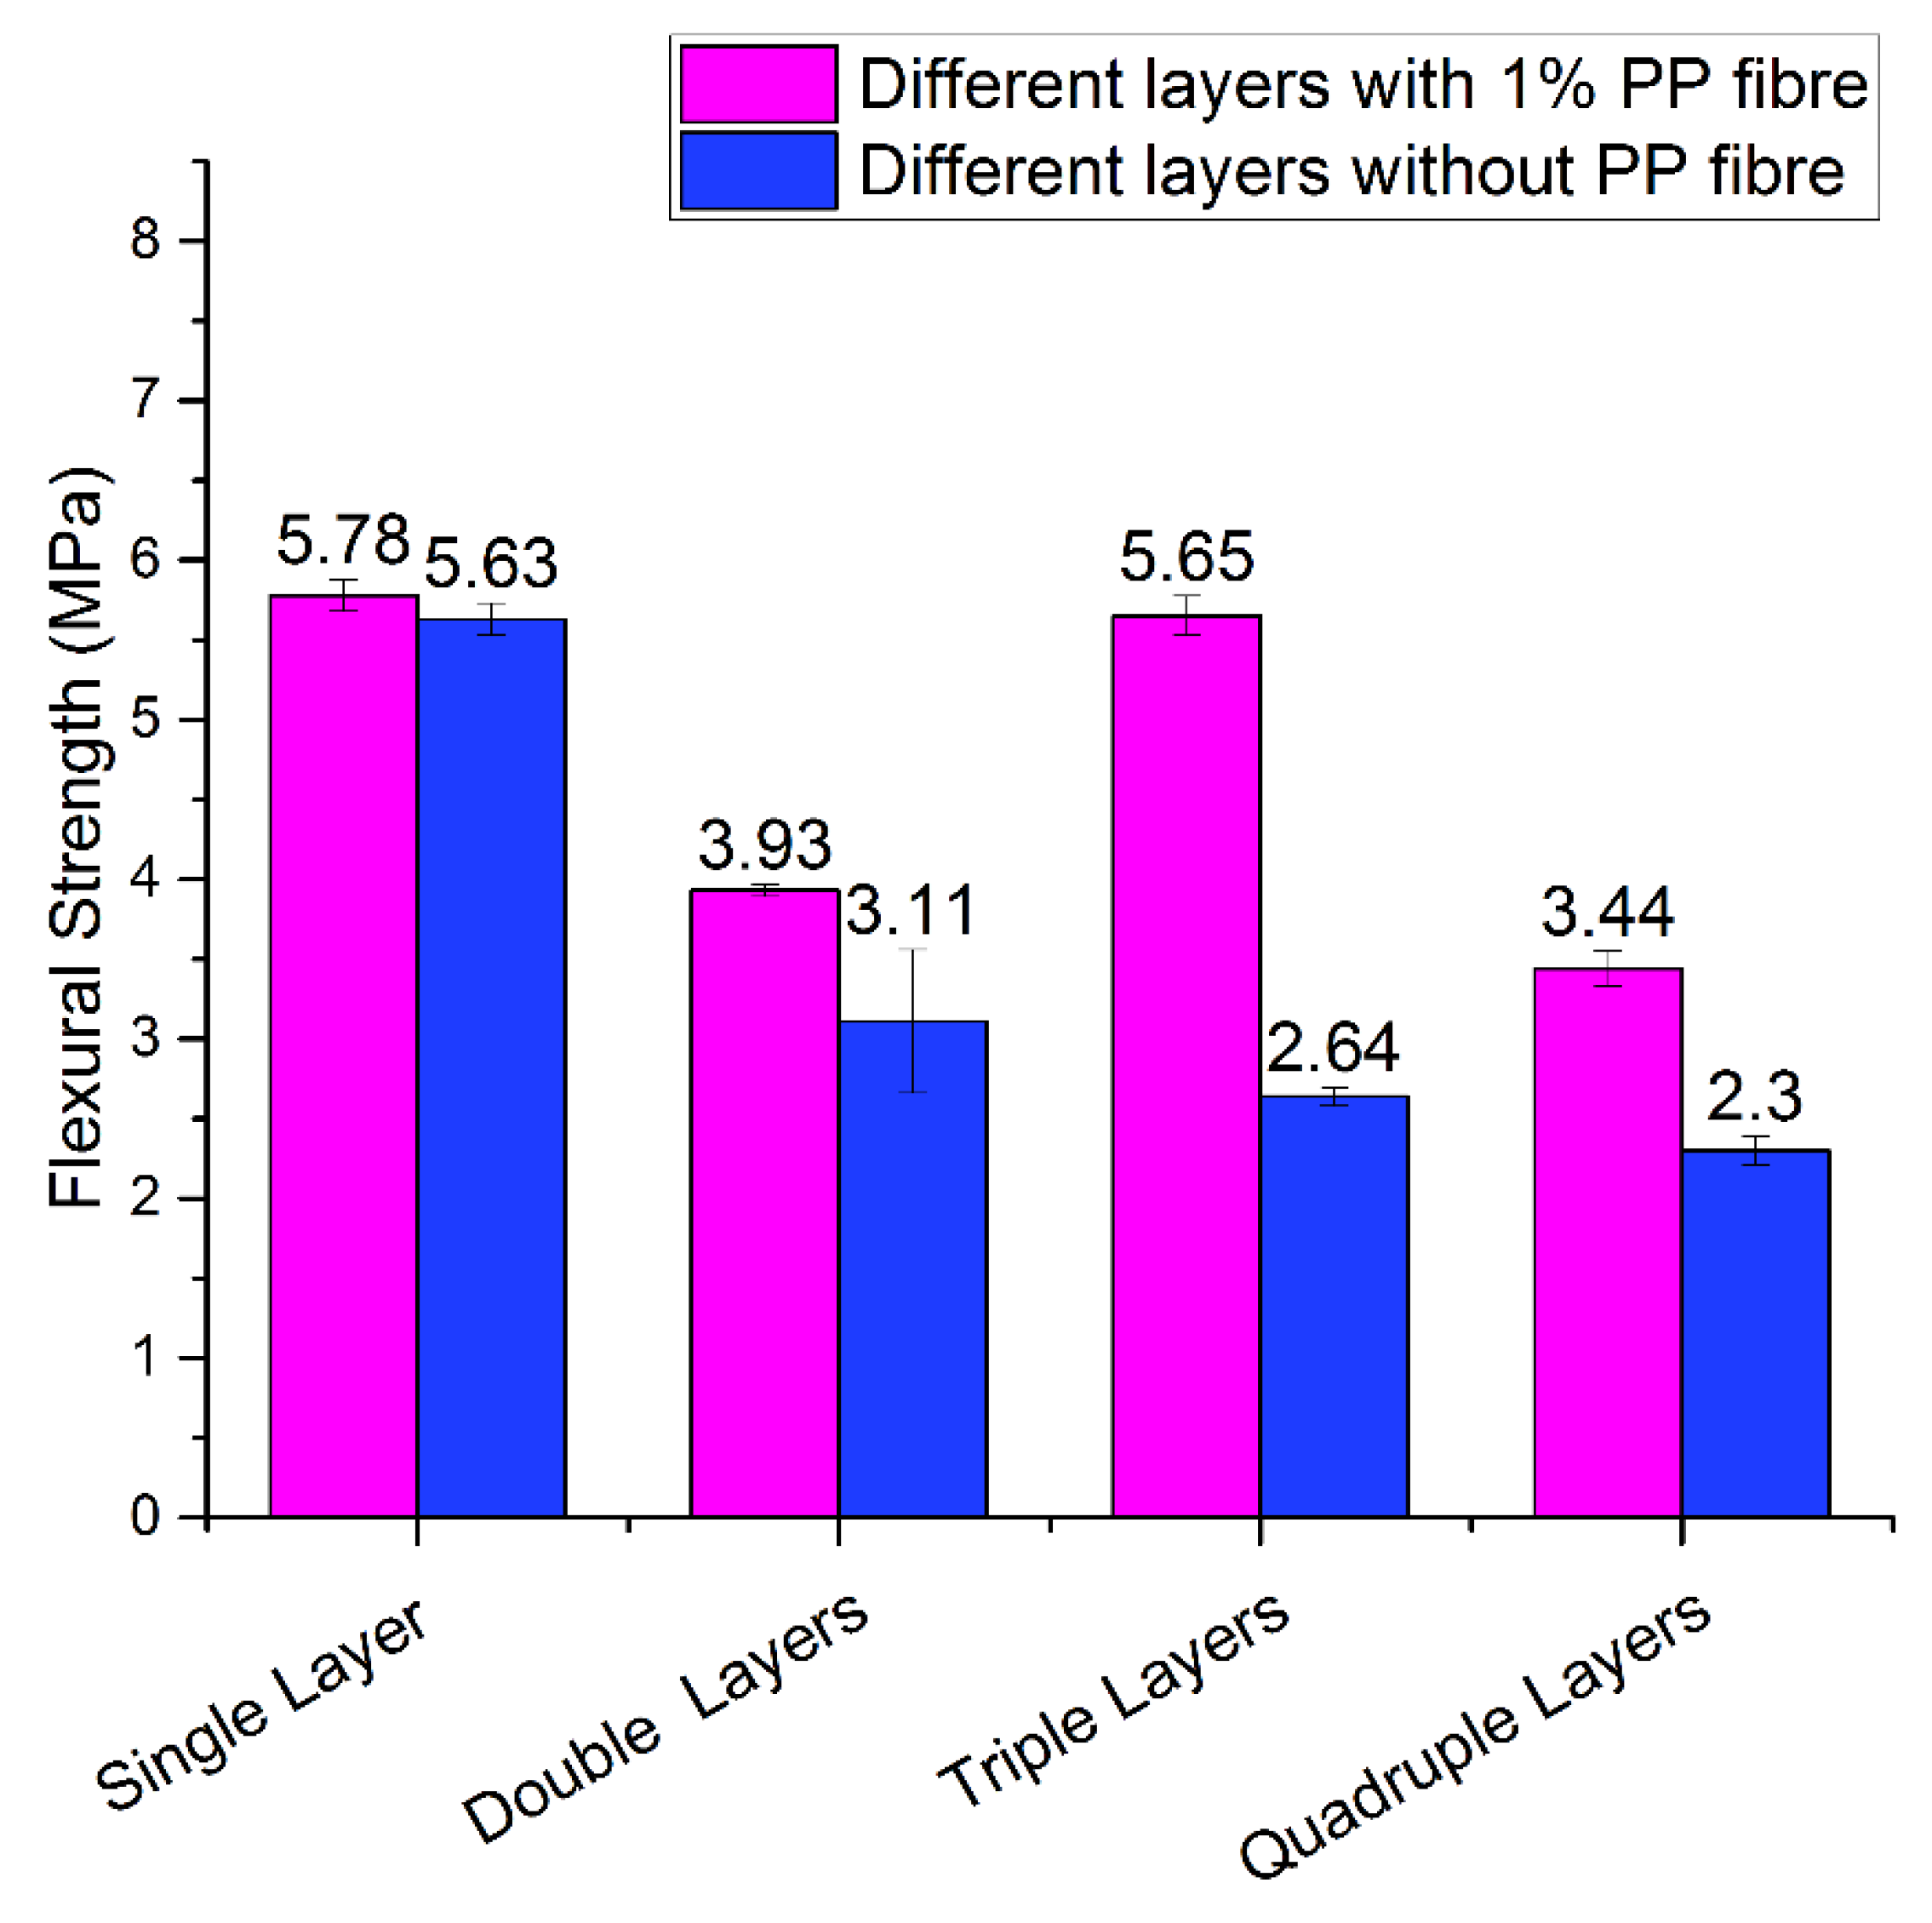
4.1.5. Flexural Strength Test
5. Conclusions
Author Contributions
Funding
Acknowledgments
Conflicts of Interest
References
- Buswell, R.A.; Soar, R.; Gibb, A.G.; Thorpe, T. The potential of freeform construction processes. In Proceedings of the 16th International Symposium on Solid Freeform Fabrication, Austin, TX, USA, 1–3 August 2005; pp. 503–512. [Google Scholar]
- Edwards, L.; Holt, C.; Keyte, L.; Lloyd, R. Construction 3D Printing. In Concrete 2013; Concrete Institute of Australia: Gold Coast, Australia, 2015. [Google Scholar]
- Junk, S.; Sämann-Sun, J.; Niederhofer, M. Application of 3D Printing for the Rapid Tooling of Thermoforming Moulds. In Proceedings of the 36th International MATADOR Conference; Springer: Manchester, UK, 2010; pp. 369–372. [Google Scholar]
- Kwon, H. Experimentation and Analysis of Contour Crafting (CC) Process Using Uncured Ceramic Materials; University Of Southern California: Los Angeles, CA, USA, 2002. [Google Scholar]
- Lipson, H.; Kurman, M. Fabricated: The New World of 3D Printing; John Wiley & Sons: New York, NY, USA, 2013. [Google Scholar]
- Sachs, E.; Cima, M.; Williams, P.; Brancazio, D.; Cornie, J. Three dimensional printing: Rapid tooling and prototypes directly from a CAD model. J. Eng. Ind. 1992, 114, 481–488. [Google Scholar] [CrossRef]
- Buswell, R.A.; Leal de Silva, W.R.; Jones, S.Z.; Dirrenberger, J. 3D printing using concrete extrusion: A roadmap for research. Cem. Concr. Res. 2018, 112, 37–49. [Google Scholar] [CrossRef]
- Lowke, D.; Dini, E.; Perrot, A.; Weger, D.; Gehlen, C.; Dillenburger, B. Particle-bed 3D printing in concrete construction – Possibilities and challenges. Cem. Concr. Res. 2018, 112, 50–65. [Google Scholar] [CrossRef]
- Le, T.T.; Austin, S.A.; Lim, S.; Buswell, R.A.; Gibb, A.G.F.; Thorpe, T. Mix design and fresh properties for high-performance printing concrete. Mater. Struct. 2012, 45, 1221–1232. [Google Scholar] [CrossRef]
- Pegna, J. Exploratory investigation of solid freeform construction. Autom. Constr. 1997, 5, 427–437. [Google Scholar] [CrossRef]
- Khoshnevis, B.; Bukkapatnam, S.; Kwon, H.; Saito, J. Experimental investigation of contour crafting using ceramics materials. Rapid Prototyp. J. 2001, 7, 32–42. [Google Scholar] [CrossRef]
- Christ, S.; Schnabel, M.; Vorndran, E.; Groll, J.; Gbureck, U. Fiber reinforcement during 3D printing. Mater. Lett. 2015, 139, 165–168. [Google Scholar] [CrossRef]
- Shakor, P.; Sanjayan, J.; Nazari, A.; Nejadi, S. Modified 3D printed powder to cement-based material and mechanical properties of cement scaffold used in 3D printing. Constr. Build. Mater. 2017, 138, 398–409. [Google Scholar] [CrossRef]
- Shakor, P.; Nejadi, S.; Paul, G.; Sanjayan, J.; Nazari, A. Mechanical Properties of Cement-Based Materials and Effect of Elevated Temperature on Three-Dimensional (3-D) Printed Mortar Specimens in Inkjet 3-D Printing. Mater. J. 2019, 116, 55–67. [Google Scholar]
- Compton, B.G.; Lewis, J.A. 3D-printing of lightweight cellular composites. Adv. Mater. 2014, 26, 5930–5935. [Google Scholar] [CrossRef] [PubMed]
- Hambach, M.; Volkmer, D. Properties of 3D-printed fiber-reinforced Portland cement paste. Cem. Concr. Compos. 2017, 79, 62–70. [Google Scholar] [CrossRef]
- Ogura, H.; Nerella, V.; Mechtcherine, V. Developing and testing of strain-hardening cement-based composites (SHCC) in the context of 3D-printing. Materials 2018, 11, 1375. [Google Scholar] [CrossRef] [PubMed]
- Bos, F.; Wolfs, R.; Ahmed, Z.; Salet, T. Additive manufacturing of concrete in construction: Potentials and challenges of 3D concrete printing. Virtual Phys. Prototyp. 2016, 11, 209–225. [Google Scholar] [CrossRef]
- Paul, S.C.; van Zijl, G.P.; Tan, M.J.; Gibson, I. A review of 3D concrete printing systems and materials properties: Current status and future research prospects. Rapid Prototyp. J. 2018, 24, 784–798. [Google Scholar] [CrossRef]
- Lim, S.; Buswell, R.A.; Le, T.T.; Wackrow, R.; Austin, S.A.; Gibb, A.G.F.; Thorpe, T. Development of a viable concrete printing process. In Proceedings of the 28th International Symposium on Automation and Robotics in Construction, (ISARC2011), Seoul, Korea, 29 June–2 July 2011; pp. 665–670. [Google Scholar]
- Le, T.T.; Austin, S.A.; Lim, S.; Buswell, R.A.; Law, R.; Gibb, A.G.; Thorpe, T. Hardened properties of high-performance printing concrete. Cem. Concr. Res. 2012, 42, 558–566. [Google Scholar] [CrossRef]
- Perrot, A.; Rangeard, D.; Courteille, E. 3D printing of earth-based materials: Processing aspects. Constr. Build. Mater. 2018, 172, 670–676. [Google Scholar] [CrossRef]
- Gosselin, C.; Duballet, R.; Roux, P.; Gaudillière, N.; Dirrenberger, J.; Morel, P. Large-scale 3D printing of ultra-high performance concrete – a new processing route for architects and builders. Mater. Des. 2016, 100, 102–109. [Google Scholar] [CrossRef]
- Hamad, A.J. Size and shape effect of specimen on the compressive strength of HPLWFC reinforced with glass fibres. J. King Saud Univ. Eng. Sci. 2017, 29, 373–380. [Google Scholar] [CrossRef]
- Anell, L. Concrete 3d Printer. Master Thesis, Lund University, Lund, Sweden, 2015. [Google Scholar]
- Al-Qutaifi, S.; Nazari, A.; Bagheri, A. Mechanical properties of layered geopolymer structures applicable in concrete 3D-printing. Constr. Build. Mater. 2018, 176, 690–699. [Google Scholar] [CrossRef]
- Soltan, D.G.; Li, V.C. A self-reinforced cementitious composite for building-scale 3D printing. Cem. Concr. Compos. 2018, 90, 1–13. [Google Scholar] [CrossRef]
- Shakor, P.; Renneberg, J.; Nejadi, S.; Paul, G. Optimisation of Different Concrete Mix Designs for 3D Printing by Utilising 6DOF Industrial Robot. In ISARC. Proceedings of the International Symposium on Automation and Robotics in Construction; Vilnius Gediminas Technical University, Department of Construction Economics & Property: Taipei, Taiwan, 2017; Volume 34. [Google Scholar]
- ASTMC1437. Standard Test Method for Flow of Hydraulic Cement Mortar. 2015. Available online: https://infostore.saiglobal.com/store/details.aspx/details.aspx?ProductID=1834850 (accessed on 24 May 2019).
- ABNT-NBR15839. Argamassa de assentamento e revestimento de paredes e tetos—Caracterização reológica pelo método Squeeze-flow. 2010. Available online: https://www.abntcatalogo.com.br/norma.aspx?ID=59321 (accessed on 24 May 2019).
- ASTMC191-13. Standard Test Methods for Time of Setting of Hydraulic Cement by Vicat Needle; ASTM: West Conshohocken, NY, USA, 2013. [Google Scholar]
- Sleiman, H.; Perrot, A.; Amziane, S. A new look at the measurement of cementitious paste setting by Vicat test. Cem. Concr. Res. 2010, 40, 681–686. [Google Scholar] [CrossRef]
- AS1012.9:2014. Methods of testing concrete—Compressive strength tests—Concrete, mortar and grout specimens; Standards Australia: Sydney, Australia, 2014. [Google Scholar]
- ASTMC293/C293M. 293 Standard Test Method for Flexural Strength of Concrete (Using Simple Beam With Center-Point Loading). ASTM Stand. 2002. [Google Scholar] [CrossRef]
- Cyr, M.; Legrand, C.; Mouret, M. Study of the shear thickening effect of superplasticizers on the rheological behaviour of cement pastes containing or not mineral additives. Cem. Concr. Res. 2000, 30, 1477–1483. [Google Scholar] [CrossRef]
- Shakor, P.; Nejadi, S.; Paul, G.; Malek, S. Review of Emerging Additive Manufacturing Technologies in 3D Printing of Cementitious Materials in the Construction Industry. Front. Built Environ. 2019, 4. [Google Scholar] [CrossRef]
- Li, X.; Zhou, R.; Yao, W.; Fan, X. Flow characteristic of highly underexpanded jets from various nozzle geometries. Appl. Therm. Eng. 2017, 125 (Suppl. C), 240–253. [Google Scholar] [CrossRef]
- Cwalina, C.D.; Harrison, K.J.; Wagner, N.J. Rheology of cubic particles suspended in a Newtonian fluid. Soft Matter 2016, 12, 4654–4665. [Google Scholar] [CrossRef]
- Böhmer, M.R.; Schroeders, R.; Steenbakkers, J.A.M.; de Winter, S.H.P.M.; Duineveld, P.A.; Lub, J.; Nijssen, W.P.M.; Pikkemaat, J.A.; Stapert, H.R. Preparation of monodisperse polymer particles and capsules by ink-jet printing. Colloids Surf. A: Physicochem. Eng. Asp. 2006, 289, 96–104. [Google Scholar] [CrossRef]
- Crowley, S.V.; Gazi, I.; Kelly, A.L.; Huppertz, T.; O’Mahony, J.A. Influence of protein concentration on the physical characteristics and flow properties of milk protein concentrate powders. J. Food Eng. 2014, 135 (Suppl. C), 31–38. [Google Scholar] [CrossRef]
- Feys, D.; Verhoeven, R.; De Schutter, G. Why is fresh self-compacting concrete shear thickening? Cem. Concr. Res. 2009, 39, 510–523. [Google Scholar] [CrossRef]
- Fitzpatrick, J.J.; Barringer, S.A.; Iqbal, T. Flow property measurement of food powders and sensitivity of Jenike’s hopper design methodology to the measured values. J. Food Eng. 2004, 61, 399–405. [Google Scholar] [CrossRef]
- Marchment, T.; Sanjayan, J. Method of Enhancing Interlayer Bond Strength in 3D Concrete Printing. In Proceedings of the 1st RILEM International Conference on Concrete and Digital Fabrication, Zurich, Switzerland, 10–12 September 2018; Springer: Zurich, Switzerland, 2019; pp. 148–156. [Google Scholar]
- Surendra, P.S.; Yilmaz, A.; Thomas, V. Determination of Early Age Mortar and Concrete Strength by Ultrasonic Wave Reflections. J. Mater. Civil Eng. 2003, 15, 247–254. [Google Scholar]
- Mindess, S.; Young, J.F.; Darwin, D. Concrete, Prentice Hall. Englewood CliffsNJ. Available online: https://trove.nla.gov.au/work/9840756?q&versionId=45251401 (accessed on 25 May 2019).
- Kurda, R.; de Brito, J.; Silvestre, J.D. Combined influence of recycled concrete aggregates and high contents of fly ash on concrete properties. Constr. Build. Mater. 2017, 157, 554–572. [Google Scholar] [CrossRef]


| Fibre Type | Length/Diameter | Thickness | Specific Gravity (g/cm3) | Tensile Strength (MPa) | Tensile Modulus (GPa) |
|---|---|---|---|---|---|
| Polypropylene | 6 mm | 100 µm | 0.91 | 1300 | 7.2 |
| Trial No. | Fine Sand (g) | Cement (g) | Coarse Aggregate (g) | Retarder (mL) | Accelerator (mL) | Water (mL) | Superplasticizer (mL) | PP Fibre |
|---|---|---|---|---|---|---|---|---|
| T5 | 375 | 375 | - | 2 | 2.5 | 125 | 2.5 | 0% |
| T5 * | 375 | 375 | - | 2 | 2.5 | 125 | 2.5 | 1% |
| T8 | 500 | 500 | - | 2.66 | 3.3 | 171.5 | 3.33 | 0% |
| T12 | 375 | 375 | 125 | 2 | 2.5 | 125 | 2.5 | 0% |
| Sample Description | Number of the Samples | Size of Samples (mm) | Delivery Method |
|---|---|---|---|
| Hollow column | 6 | (300 × 300) | Cavity pump |
| Printed without Fibre Reinforced mortar | 6 | (160 × 40 × 8) | Caulking gun (160 × 35× 10 mm) |
| 6 | (160 × 40 × 16) | ||
| 6 | (160 × 40 × 24) | ||
| 6 | (160 × 40 × 32) | ||
| Printed with/without Fibre Reinforced mortar | 6 | (160 × 14 × 12) | Caulking gun (14 mm) |
| 6 | (160 × 14 × 24) | ||
| 6 | (160 × 14 × 36) | ||
| 6 | (160 × 14 × 48) | ||
| Printed without Fibre Reinforced mortar | 6 | (160 × 24 × 18) | Caulking gun (20 mm) |
| 6 | (160 × 24 × 36) | ||
| 6 | (160 × 24 × 54) | ||
| 6 | (160 × 24 × 72) | ||
| Casted prisms | 18 | (160 × 40 × 40) | Conventional method |
| Casted cubes | 18 | (50 × 50 × 50) | Conventional method |
| Trial no. | Height of Slump (mm) | Average Diameter no. 1 (mm) | Average Diameter no. 2 (mm) | Average Relative Slump Value |
|---|---|---|---|---|
| Trial 5 | 8.5 ± 0.54 | 190.63 | 184.65 | 2.52 |
| Trial 5 (with 1% PP fibre) | 6 ± 0.16 | 148.27 | 155.25 | 1.30 |
| Trial 8 | 8.8 ± 0.61 | 199.52 | 201.84 | 3.02 |
| Trail 12 | 12 ± 0.58 | 201 | 201 | 3.04 |
| Trial No | Initial Setting Time (min) | Final Setting Time (min) |
|---|---|---|
| T5 | 75 ± 10 | 120 ± 5 |
| T8 | 85 ± 14 | 225 ± 6 |
| T12 | 75 ± 9 | 90 ± 4 |
| Interval Time (min) ** | Buildability | Height (mm) | ||||||||||
|---|---|---|---|---|---|---|---|---|---|---|---|---|
| 1 | 2 | 3 | 4 | 5 | 6 | 1 | 2 | 3 | 4 | 5 | 6 | |
| 3 | × | × | × | × | × | × | 12 | 11.5 | 12 | 12 | 12.5 | 8 * |
| 7 | × | × | × | × | × | - | 12.5 | 12 | 12 | 12.1 | 12 | - |
| 10 | ✓ | ✓ | ✓ | ✓ | ✓ | - | 12 | 12.4 | 12.1 | 12.1 | 12.2 | - |
© 2019 by the authors. Licensee MDPI, Basel, Switzerland. This article is an open access article distributed under the terms and conditions of the Creative Commons Attribution (CC BY) license (http://creativecommons.org/licenses/by/4.0/).
Share and Cite
Shakor, P.; Nejadi, S.; Paul, G. A Study into the Effect of Different Nozzles Shapes and Fibre-Reinforcement in 3D Printed Mortar. Materials 2019, 12, 1708. https://doi.org/10.3390/ma12101708
Shakor P, Nejadi S, Paul G. A Study into the Effect of Different Nozzles Shapes and Fibre-Reinforcement in 3D Printed Mortar. Materials. 2019; 12(10):1708. https://doi.org/10.3390/ma12101708
Chicago/Turabian StyleShakor, Pshtiwan, Shami Nejadi, and Gavin Paul. 2019. "A Study into the Effect of Different Nozzles Shapes and Fibre-Reinforcement in 3D Printed Mortar" Materials 12, no. 10: 1708. https://doi.org/10.3390/ma12101708
APA StyleShakor, P., Nejadi, S., & Paul, G. (2019). A Study into the Effect of Different Nozzles Shapes and Fibre-Reinforcement in 3D Printed Mortar. Materials, 12(10), 1708. https://doi.org/10.3390/ma12101708