n-i-p Nanocrystalline Hydrogenated Silicon Solar Cells with RF-Magnetron Sputtered Absorbers

 ,
,  ,
, 
Abstract
:1. Introduction
2. Experimental Details
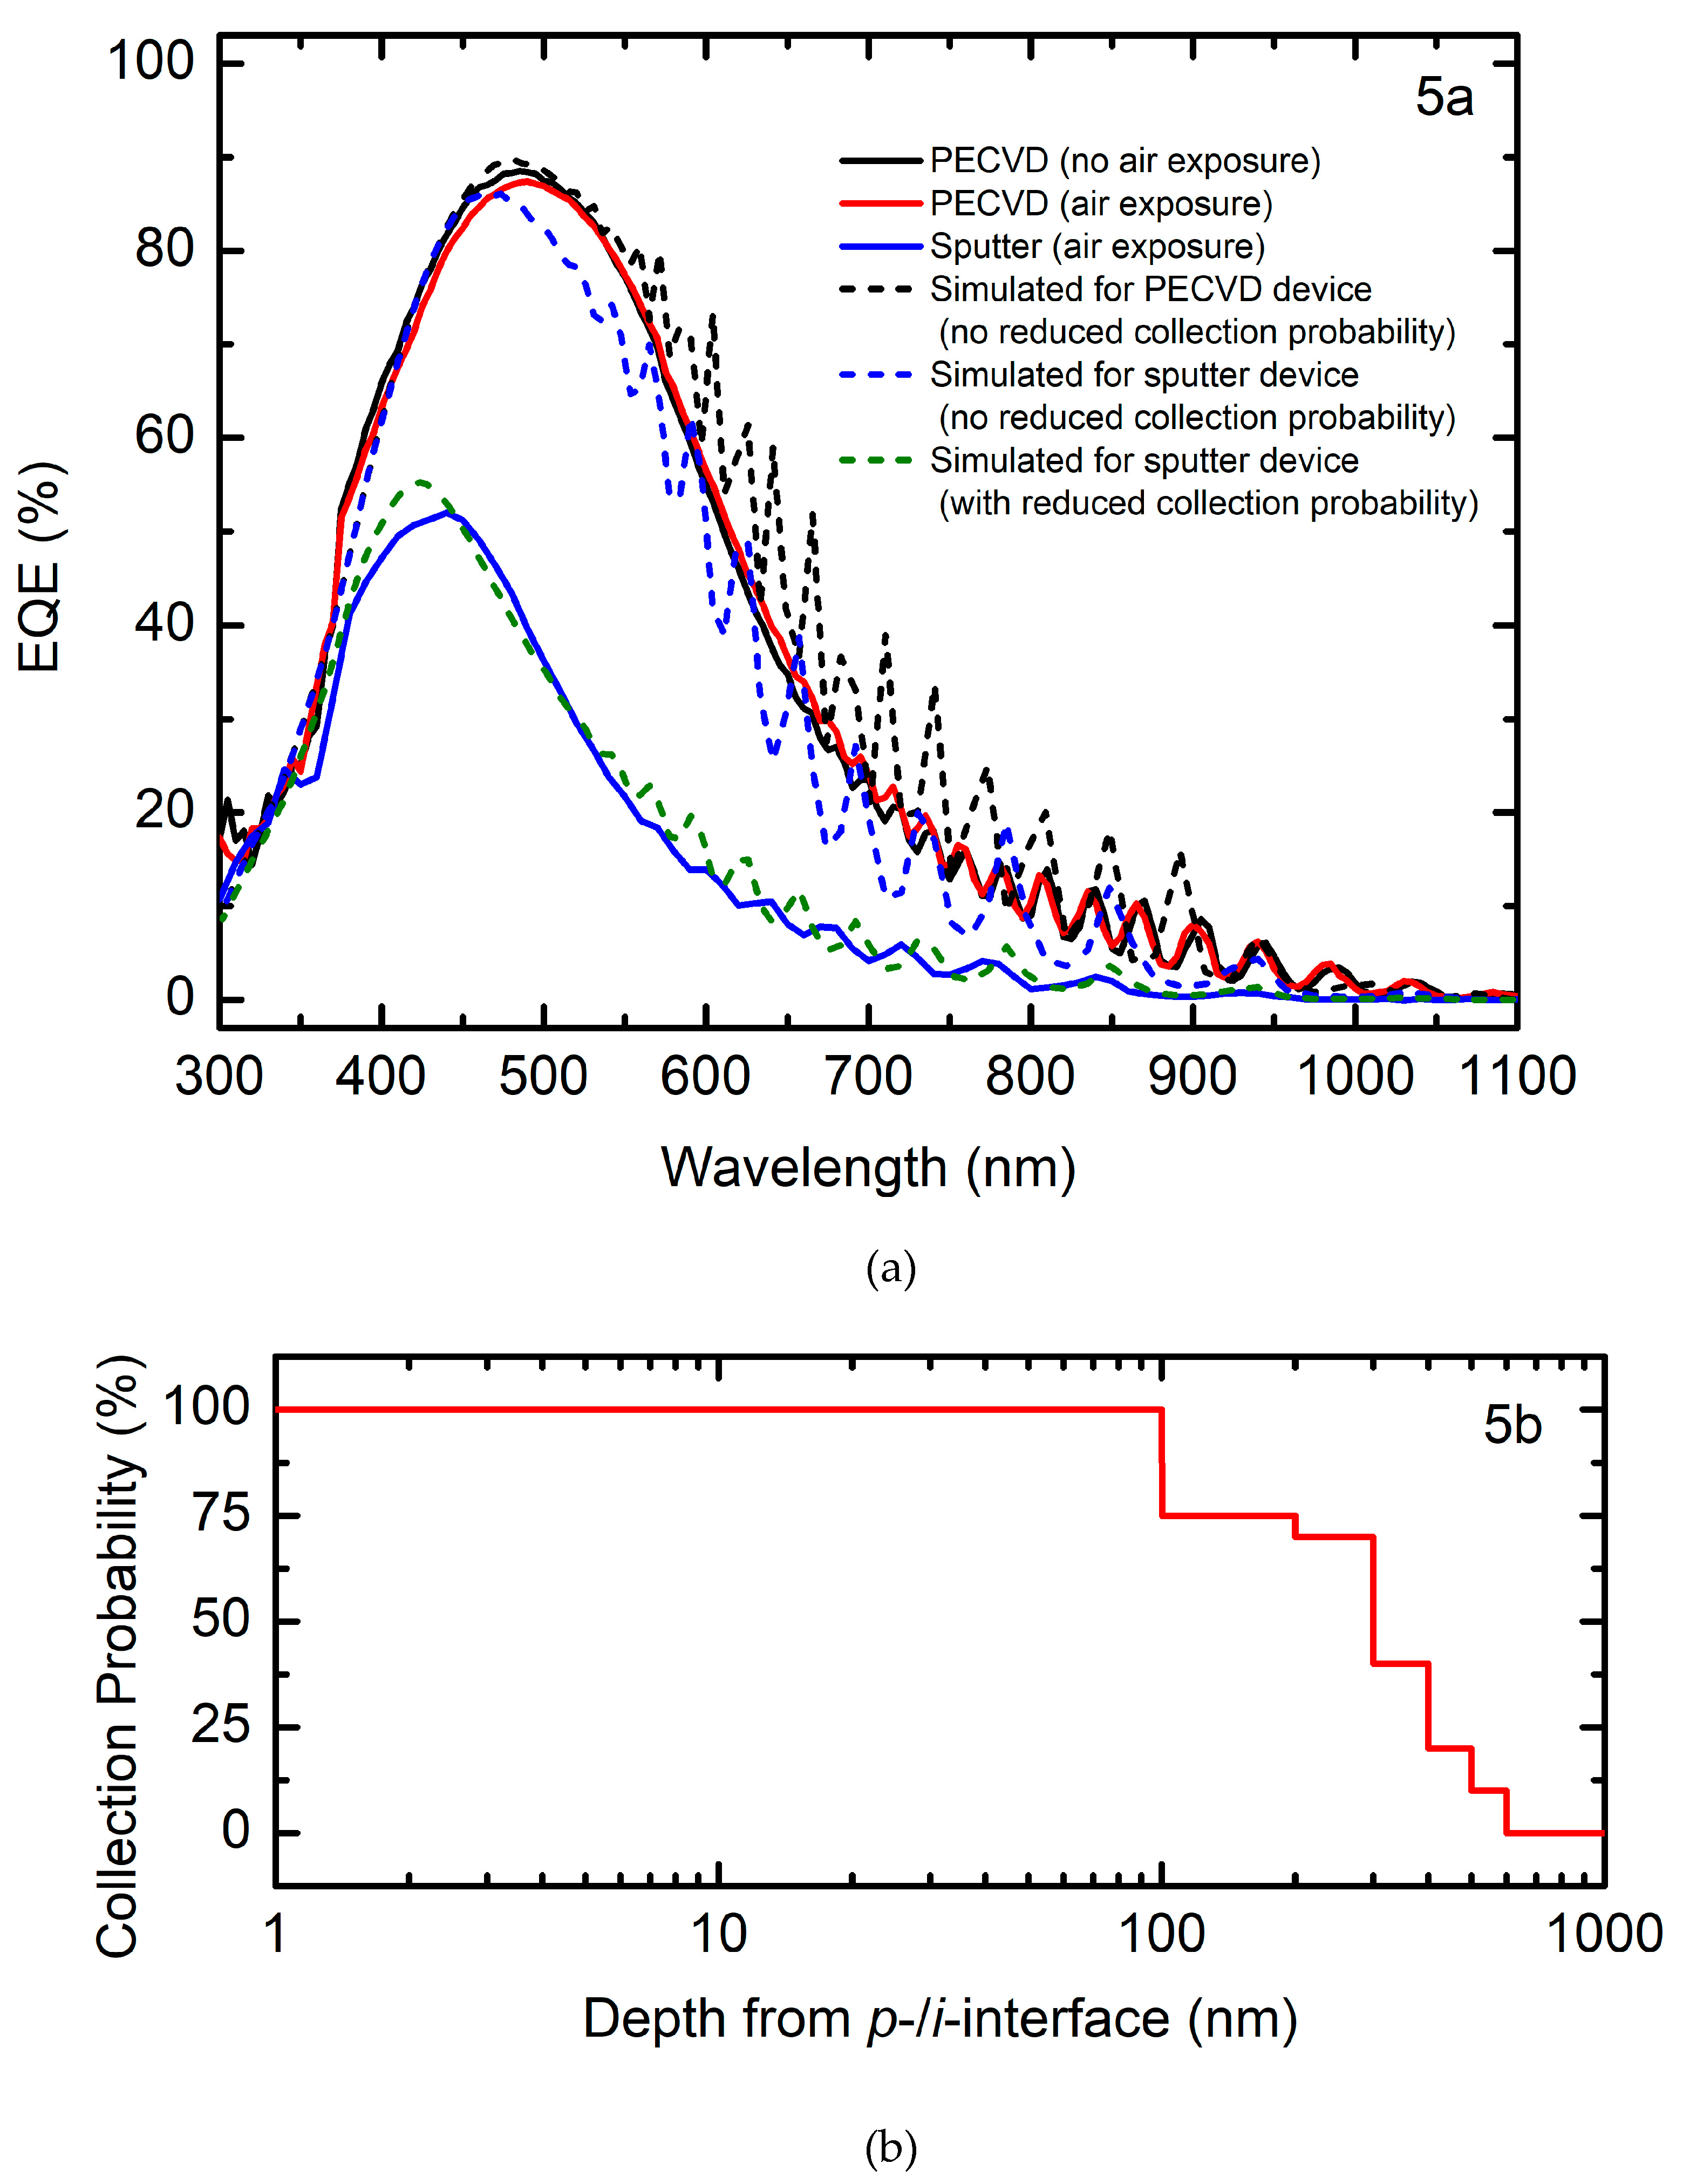
3. Results
4. Conclusions
Author Contributions
Funding
Conflicts of Interest
References
- Staebler, D.L.; Wronski, C.R. Reversible conductivity changes in discharge-produced amorphous Si. Appl. Phys. Lett. 1977, 31, 292–294. [Google Scholar] [CrossRef]
- Koh, J.; Ferlauto, A.S.; Rovira, P.I.; Koval, R.J.; Wronski, C.R.; Collins, R.W. Optimization of hydrogenated amorphous silicon p–i–n solar cells with two-step i layers guided by real-time spectroscopic ellipsometry. J. Non-Cryst. Solids 2000, 43, 266–269. [Google Scholar] [CrossRef]
- Huang, Z.; Dahal, L.R.; Junda, M.M.; Aryal, P.; Marsillac, S.; Collins, R.W.; Podraza, N.J. Characterization of structure and growth evolution for nc-Si:H in the tandem photovoltaic device configuration. IEEE J. Photovolt. 2015, 5, 1516–1522. [Google Scholar] [CrossRef]
- Gautam, L.K.; Junda, M.M.; Haneef, H.F.; Collins, R.W.; Podraza, N.J. Spectroscopic ellipsometry studies of n-i-p hydrogenated amorphous silicon based photovoltaic devices. Materials 2016, 9, 128. [Google Scholar]
- Podraza, N.J.; Wronski, C.R.; Collins, R.W. Model for the amorphous roughening transition in amorphous semiconductor deposition. J. Non-Cryst. Solids 2006, 352, 950–954. [Google Scholar] [CrossRef]
- Pearce, J.M.; Podraza, N.; Collins, R.W.; Al-Jassim, M.M.; Jones, K.M.; Deng, J.; Wronski, C.R. Optimization of open circuit voltage in amorphous silicon solar cells with mixed-phase (amorphous + nanocrystalline) p-type contacts of low nanocrystalline content. J. Appl. Phys. 2007, 101, 114301–114307. [Google Scholar]
- Collins, R.W.; Ferlauto, A.S.; Ferreira, G.M.; Chen, C.; Koh, J.; Koval, R.J.; Lee, Y.; Pearce, J.M.; Wronski, C.R. Evolution of microstructure and phase in amorphous, protocrystalline, and microcrystalline silicon studied by real time spectroscopic ellipsometry. Sol. Energy Mater. Sol. Cells 2003, 78, 143–180. [Google Scholar] [CrossRef]
- Junda, M.M.; Shan, A.; Koirala, P.; Collins, R.W.; Podraza, N.J. Spectroscopic ellipsometry applied in the full p-i-n a-Si:H solar cell device configuration. IEEE J. Photovolt. 2015, 5, 307–312. [Google Scholar] [CrossRef]
- Adhikari, D.; Junda, M.M.; Marsillac, S.X.; Collins, R.W.; Podraza, N.J. Nanostructure evolution of magnetron sputtered hydrogenated silicon thin films. J. Appl. Phys. 2017, 122, 075302–075308. [Google Scholar] [CrossRef]
- Adhikari, D.; Junda, M.M.; Marsillac, S.X.; Collins, R.W.; Podraza, N.J. Magnetron sputtered hydrogenated silicon thin films: assessment for application in photovoltaics. In Proceedings of the 44th IEEE Photovoltaic Specialists Conference, Washington, DC, USA, 25–30 June 2017; pp. 1–6. [Google Scholar]
- Moustakas, T.D.; Maruska, H.P.; Friedman, R. Properties and photovoltaic applications of microcrystalline silicon films prepared by rf reactive sputtering. J. Appl. Phys. 1985, 58, 983–986. [Google Scholar] [CrossRef]
- Dutta, P.; Paul, S.; Tripathi, S.; Chen, Y.; Chatterjee, S.; Bommisetty, V.; Galipeau, D.; Liu, A. Comparative study of nc-Si:H deposited by reactive sputtering using crystalline and polycrystalline silicon targets. In Proceedings of the 33rd IEEE Photovoltaic Specialists Conference, San Diego, CA, USA, 11–16 May 2008; pp. 1–4. [Google Scholar]
- Tiedje, T.; Moustakas, T.D.; Cebulka, J.M. Effect of hydrogen on the density of gap states in reactively sputtered amorphous silicon. Phys. Rev. B 1981, 23, 5634–5637. [Google Scholar] [CrossRef]
- Mahan, A.H.; Carapella, J.; Nelson, B.P.; Crandall, R.S.; Balberg, I. Deposition of device quality, low H content amorphous silicon. J. Appl. Phys. 1991, 69, 6728–6730. [Google Scholar] [CrossRef]
- Heintze, M.; Zedlitz, R.; Wanka, H.N.; Schubert, M.B. Amorphous and microcrystalline silicon by hot wire chemical vapor deposition. J. Appl. Phys. 1996, 79, 2699–2706. [Google Scholar] [CrossRef]
- Matsumura, H. Catalytic chemical vapor deposition (CTL-CVD) method producing high quality hydrogenated amorphous silicon. Jpn. J. Appl. Phys. 1986, 25, L949–L951. [Google Scholar] [CrossRef]
- Masuda, T.; Sotani, N.; Hamada, H.; Matsuki, Y.; Shimoda, T. Fabrication of solution-processed hydrogenated amorphous silicon single-junction solar cells. Appl. Phys. Lett. 2012, 100, 253908. [Google Scholar] [CrossRef]
- Shindo, M.; Sato, S.; Myokan, I.; Mano, S.; Shibata, T. High rate preparation of a-Si:H by reactive evaporation method. Jpn. J. Appl. Phys. 1984, 23, 273–276. [Google Scholar] [CrossRef]
- Zhao, Z.X.; Cui, R.Q.; Meng, F.Y.; Zhao, B.C.; Yu, H.C.; Zhou, Z.B. Nanocrystalline silicon thin films prepared by RF sputtering at low temperature and heterojunction solar cell. Mater. Letter 2004, 58, 3963–3966. [Google Scholar] [CrossRef]
- Rajan, G.; Miryala, T.; Karki, S.; Collins, R.W.; Podraza, N.; Marsillac, S. Influence of deposition parameters on silicon thin films deposited by magnetron sputtering. In Proceedings of the 44th IEEE Photovoltaic Specialists Conference, Washington, DC, UAS, 25–30 June 2017; pp. 1–3. [Google Scholar]
- Hanabusa, M.; Liu, Z.; Nakamura, N.; Hasegawa, H. Pulsed laser deposition of silicon films for solar cell applications. Nucl. Instrum. Methods Phys. Res. Sect. B 1997, 121, 367–370. [Google Scholar] [CrossRef]
- Greene, J.E. Review Article: Tracing the recorded history of thin-film sputter deposition: From the 1800s to 2017. J. Vac. Sci. Technol. A 2017, 35, 1–60. [Google Scholar] [CrossRef]
- Chen, C.; An, I.; Ferreira, G.M.; Podraza, N.J.; Zapien, J.A.; Collins, R.W. Multichannel Mueller matrix ellipsometer based on the dual rotating compensator principle. Thin Solid Films 2004, 14, 455–456. [Google Scholar] [CrossRef]
- Cao, X.; Stoke, J.A.; Li, J.; Podraza, N.J.; Du, W.; Yang, X.; Attygalle, D.; Liao, X.; Collins, R.W.; Deng, X. Fabrication and optimization of single-junction nc-Si:H n–i–p solar cells using Si:H phase diagram concepts developed by real time spectroscopic ellipsometry. J. Non-Cryst. Solids 2008, 354, 2397–2402. [Google Scholar] [CrossRef]
- Mai, Y.; Klein, S.; Carius, R.; Wolff, J.; Lambertz, A.; Finger, F.; Geng, X. Microcrystalline silicon solar cells deposited at high rates. J. Appl. Phys. 2005, 97, 114913. [Google Scholar] [CrossRef] [Green Version]
- Lee, J.; Rovira, P.I.; An, I.; Collins, R.W. Rotating-compensator multichannel ellipsometry: applications for real time stokes vector spectroscopy of thin film growth. Rev. Sci. Instrum. 1998, 69, 1800–1810. [Google Scholar] [CrossRef]
- Fujiwara, H.; Koh, J.; Rovira, P.I.; Collins, R.W. Assessment of effective-medium theories in the analysis of nucleation and microscopic surface roughness evolution for semiconductor thin films. Phys. Rev. B Condens. Matter 2000, 61, 10832–10844. [Google Scholar] [CrossRef]
- Herzinger, C.M.; Johs, B.; McGahan, W.A.; Woollam, J.A.; Paulson, W. Ellipsometric determination of optical constants for silicon and thermally grown silicon dioxide via a multi-sample, multi-wavelength, multi-angle investigation. J. Appl. Phys. 1998, 83, 3323–3336. [Google Scholar] [CrossRef]
- Ferlauto, A.S.; Ferreira, G.M.; Pearce, J.M.; Wronski, C.R.; Collins, R.W. Deng, X.; Ganguly, G. Analytical model for the optical functions of amorphous semiconductors from the near-infrared to ultraviolet: Applications in thin film photovoltaics. J. Appl. Phys. 2002, 92, 2424–2436. [Google Scholar] [CrossRef]
- Koh, J.; Lu, Y.; Wronski, C.R.; Kuang, Y.; Collins, R.W.; Tsong, T.T.; Strausser, Y.E. Correlation of real time spectroellipsometry and atomic force microscopy measurements of surface roughness on amorphous semiconductor thin films. App. Phys. Lett. 1996, 69, 1297–1299. [Google Scholar] [CrossRef]
- Koh, J.; Fujiwara, H.; Lu, Y.; Wronski, C.R.; Collins, R.W. Real time spectroscopy ellipsometry for characterization and optimization of amorphous silicon-based solar cell structures. Thin Solid Films 1998, 313, 469–473. [Google Scholar] [CrossRef]
- Sivec, L.; Yan, B.; Yue, G.; Owens-Mawson, J.; Yang, J.; Guha, S. Advances in light trapping for hydrogenated nanocrystalline silicon solar cells. IEEE J. Photovolt. 2013, 3, 27–34. [Google Scholar] [CrossRef]
- Vetterl, O.; Finger, F.; Carius, R.; Hapke, P.; Houben, L.; Kluth, O.; Lambertz, A.; Muck, A.; Rech, B.; Wagner, H. Intrinsic microcrystalline silicon: A new material for photovoltaics. Sol. Energy Mater. Sol. Cells 2000, 62, 97–108. [Google Scholar] [CrossRef]
- Sai, H.; Maejima, K.; Matsui, T.; Koida, T.; Kondo, M.; Nakao, S.; Takeuchi, Y.; Katayama, H.; Yoshida, I. High-efficiency microcrystalline silicon solar cells on honeycomb textured substrates grown with high-rate VHF plasma-enhanced chemical vapor deposition. Jpn. J. Appl. Phys. 2015, 54, 08KB05. [Google Scholar] [CrossRef]
- Matsui, T.; Bidiville, A.; Maejima, K.; Sai, H.; Koida, T.; Suezaki, T.; Matsumoto, M.; Saito, K.; Yoshida, I.; Kondo, M. High-efficiency amorphous silicon solar cells: Impact of deposition rate on metastability. Appl. Phys. Lett. 2015, 106, 053901. [Google Scholar] [CrossRef]
- Sai, H.; Saito, K.; Kondo, M. Enhanced photocurrent and conversion efficiency in thin-film microcrystalline silicon solar cells using periodically textured back reflectors with hexagonal dimple arrays. Appl. Phys. Lett. 2012, 101, 173901. [Google Scholar]
- Green, M.A.; Hishikawa, Y.; Dunlop, E.D.; Levi, D.H.; Hohl-Ebinger, J.; Ho-Baillie, A.W.Y. Solar cell efficiency tables (version 52). Prog. Photovolt. Res. Appl. 2018, 26, 427–436. [Google Scholar] [CrossRef]
- Sai, H.; Kondo, M. Effect of self-orderly textured back reflectors on light trapping in thin-film microcrystalline silicon solar cells. J. Appl. Phys. 2009, 105, 094511. [Google Scholar]
- Kim, D.Y.; Santbergen, R.; Jäger, K.; Sever, M.; Krč, J.; Topič, M.; Hänni, S.; Zhang, C.; Heidt, A.; Meier, M.; van Swaaij, R.A.C.M.M.; Zeman, M. Effect of substrate morphology slope distributions on light scattering, nc-Si:H film growth, and solar cell performance. ACS Appl. Mater. Interfaces 2014, 6, 22061–22068. [Google Scholar] [CrossRef]
- Ge, J.; Jiang, J.; Yang, P.; Peng, C.; Huang, Z.; Zuo, S.; Yang, L.; Chu, J. A 5.5% efficient co-electrodeposited ZnO/CdS/Cu2ZnSnS4/Mo thin film solar cell. Sol. Energy Mater. Sol. Cells 2014, 125, 20–26. [Google Scholar] [CrossRef]
- Ahmed, S.; Reuter, K.B.; Gunawan, O.; Guo, L.; Romankiw, L.T.; Deligianni, H. A high efficiency electrodeposited Cu2ZnSnS4 solar cell. Adv. Energy Mater. 2012, 2, 253–259. [Google Scholar] [CrossRef]
- Smets, A.H.M.; Matsui, T.; Kondo, M. Infrared analysis of the bulk silicon-hydrogen bonds as an optimization tool for high-rate deposition of microcrystalline solar cells. Appl. Phys. Lett. 2008, 92, 033506. [Google Scholar] [CrossRef]
- Smets, A.H.M.; Matsui, T.; Kondo, M. High-rate deposition of microcrystalline silicon p-i-n solar cells in the high pressure depletion regime. J. Appl. Phys. 2008, 104, 034508. [Google Scholar] [CrossRef] [Green Version]
- Stoke, J.A.; Podraza, N.J.; Li, J.; Cao, X.; Deng, X.; Collins, R.W. Advanced deposition phase diagrams for guiding Si:H-based multijunction solar cells. J. Non-Cryst. Solids 2008, 354, 2435–2439. [Google Scholar] [CrossRef]
- Ibdah, A.R.A.; Koirala, P.; Aryal, P.; Pradhan, P.; Heben, M.J.; Podraza, N.J.; Marsillac, S.; Collins, R.W. Optical simulation of external quantum efficiency spectra of CuIn1−xGaxSe2 solar cells from spectroscopic ellipsometry inputs. J. Energy Chem. 2018, 27, 1151–1169. [Google Scholar] [CrossRef]
- Yuguchi, T.; Kanie, Y.; Matsuki, N.; Fujiwara, H. Complete parameterization of the dielectric function of microcrystalline silicon fabricated by plasma-enhanced chemical vapor deposition. J. Appl. Phys. 2012, 111, 083509–083516. [Google Scholar] [CrossRef]
- Fujiwara, H.; Kondo, M.; Matsuda, A. Real-time spectroscopic ellipsometry studies of the nucleation and grain growth processes in microcrystalline silicon thin films. Phys. Rev. B Condens. Matter 2001, 63, 115306–115314. [Google Scholar] [CrossRef]
- Tong, G.B.; Aspanut, Z.; Muhamad, M.R.; Rahman, S.A. Optical properties and crystallinity of hydrogenated nanocrystalline silicon (nc-Si:H) thin films deposited by rf-PECVD. Vacuum 2012, 86, 1195–1202. [Google Scholar] [CrossRef]
- Shah, A.V.; Meier, J.; Vallat-Sauvain, E.; Wyrsch, N.; Kroll, U.; Droz, C.; Graf, U. Material and solar cell research in microcrystalline silicon. Sol. Energy Mater. Sol. Cells 2003, 78, 469–491. [Google Scholar] [CrossRef] [Green Version]


| Layer | Substrate Temperature (°C) | Deposition Pressure (mTorr) | RF Plasma Power (W/cm2) | Gas Flow (SCCM) | |||||
|---|---|---|---|---|---|---|---|---|---|
| Ar | 5% O2 in Ar | SiH4 | 5% PH3 or B2H6 in H2 | H2 | R = H2/SiH4 | ||||
| Cr | RT | 15 | 0.920 | 10 | - | - | - | - | - |
| Ag | RT | 15 | 0.920 | 10 | - | - | - | - | - |
| ZnO | RT | 5 | 0.920 | 10 | - | - | - | - | - |
| n | 200 | 1500 | 0.031 | - | - | 2 | 0.5 PH3 | 200 | 100 |
| i | 200 | 1500 | 0.043 | - | - | 5 | - | 125 | 25 |
| p | 100 | 1500 | 0.086 | - | - | 2 | 0.5 B2H6 | 500 | 250 |
| ITO | 150 | 4 | 0.582 | 10 | 3 | - | - | - | - |
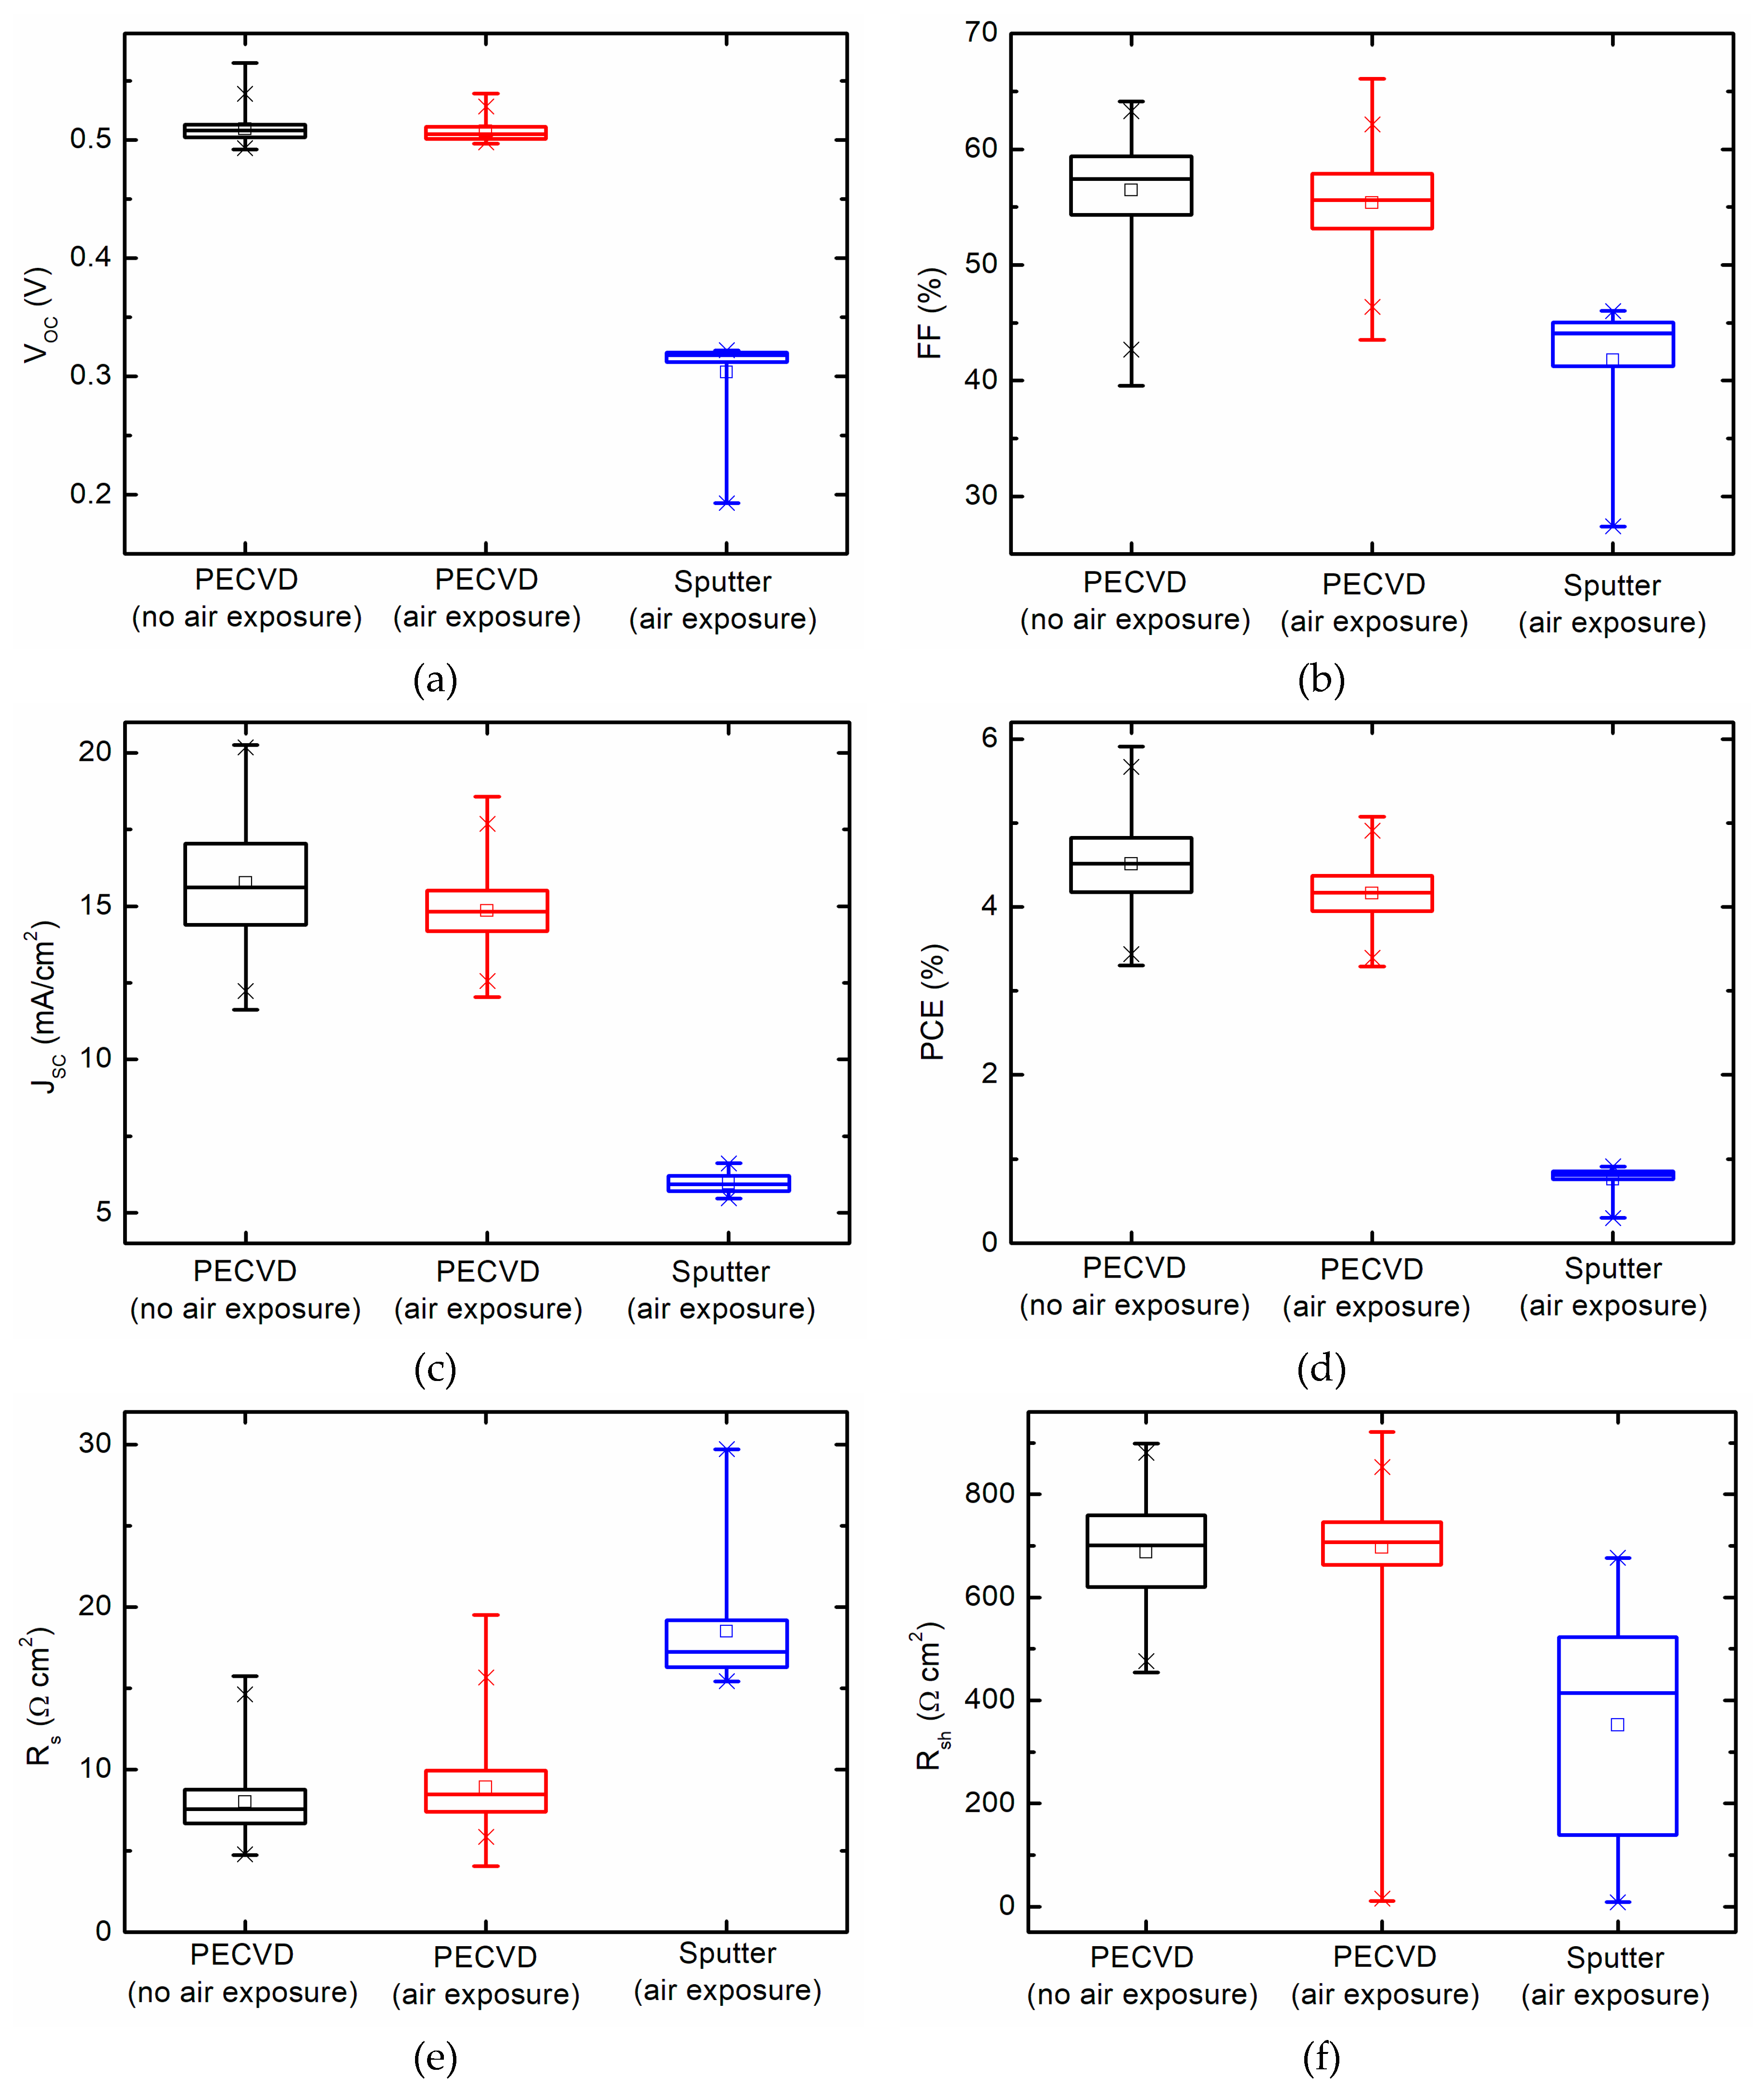
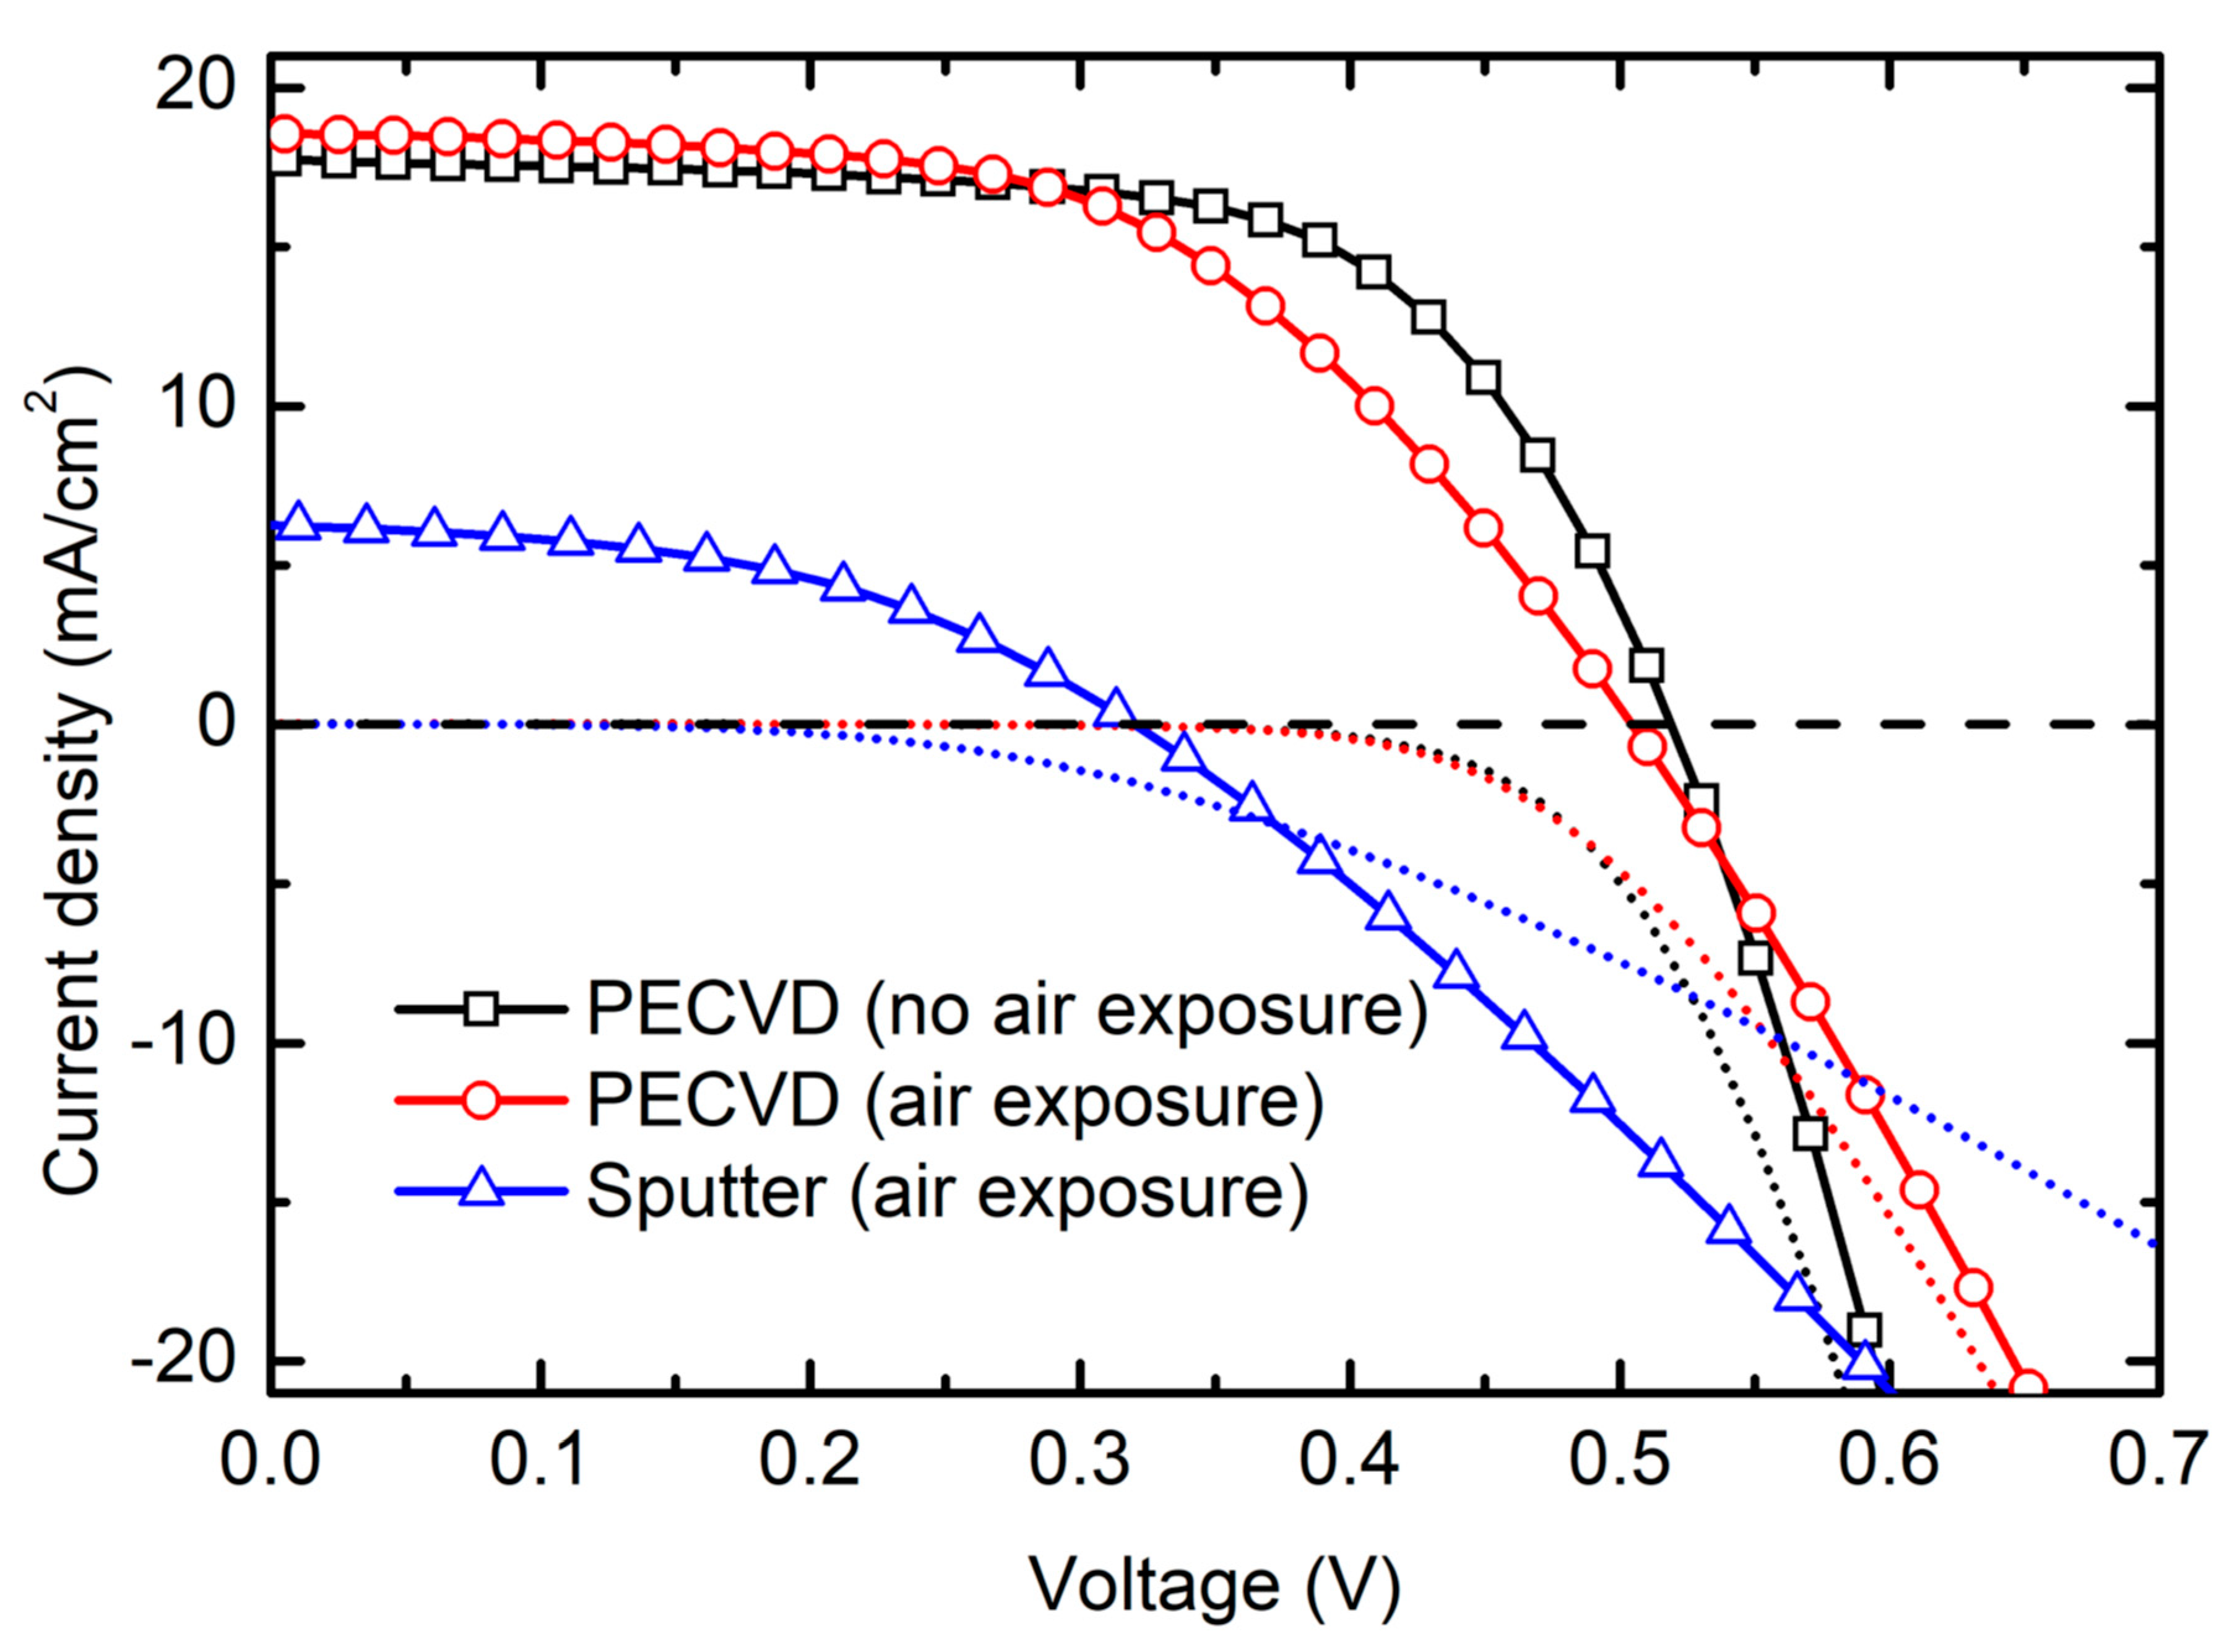
| Absorber i-Layer Preparation | JSC (mA/cm2) | VOC (V) | FF (%) | PCE (%) | Rs (Ω cm2) | Rsh (Ω cm2) |
|---|---|---|---|---|---|---|
| PECVD (no air exposure) | 17.7 | 0.52 | 64.1 | 5.91 | 6.6 | 573.4 |
| PECVD (air exposure) | 18.5 | 0.50 | 54.2 | 5.08 | 7.3 | 574.1 |
| Sputtered (air exposure) | 6.2 | 0.32 | 45.6 | 0.92 | 15.4 | 445.6 |
© 2019 by the authors. Licensee MDPI, Basel, Switzerland. This article is an open access article distributed under the terms and conditions of the Creative Commons Attribution (CC BY) license (http://creativecommons.org/licenses/by/4.0/).
Share and Cite
Adhikari, D.; Junda, M.M.; Grice, C.R.; Marsillac, S.X.; Collins, R.W.; Podraza, N.J. n-i-p Nanocrystalline Hydrogenated Silicon Solar Cells with RF-Magnetron Sputtered Absorbers. Materials 2019, 12, 1699. https://doi.org/10.3390/ma12101699
Adhikari D, Junda MM, Grice CR, Marsillac SX, Collins RW, Podraza NJ. n-i-p Nanocrystalline Hydrogenated Silicon Solar Cells with RF-Magnetron Sputtered Absorbers. Materials. 2019; 12(10):1699. https://doi.org/10.3390/ma12101699
Chicago/Turabian StyleAdhikari, Dipendra, Maxwell M. Junda, Corey R. Grice, Sylvain X. Marsillac, Robert W. Collins, and Nikolas J. Podraza. 2019. "n-i-p Nanocrystalline Hydrogenated Silicon Solar Cells with RF-Magnetron Sputtered Absorbers" Materials 12, no. 10: 1699. https://doi.org/10.3390/ma12101699
APA StyleAdhikari, D., Junda, M. M., Grice, C. R., Marsillac, S. X., Collins, R. W., & Podraza, N. J. (2019). n-i-p Nanocrystalline Hydrogenated Silicon Solar Cells with RF-Magnetron Sputtered Absorbers. Materials, 12(10), 1699. https://doi.org/10.3390/ma12101699