Characterization of Titanium Nanotube Reinforced Cementitious Composites: Mechanical Properties, Microstructure, and Hydration

 ,
,  ,
,
Abstract
:1. Introduction
2. Materials and Methods
2.1. Synthesis of TNTs
2.2. Specimen Preparation
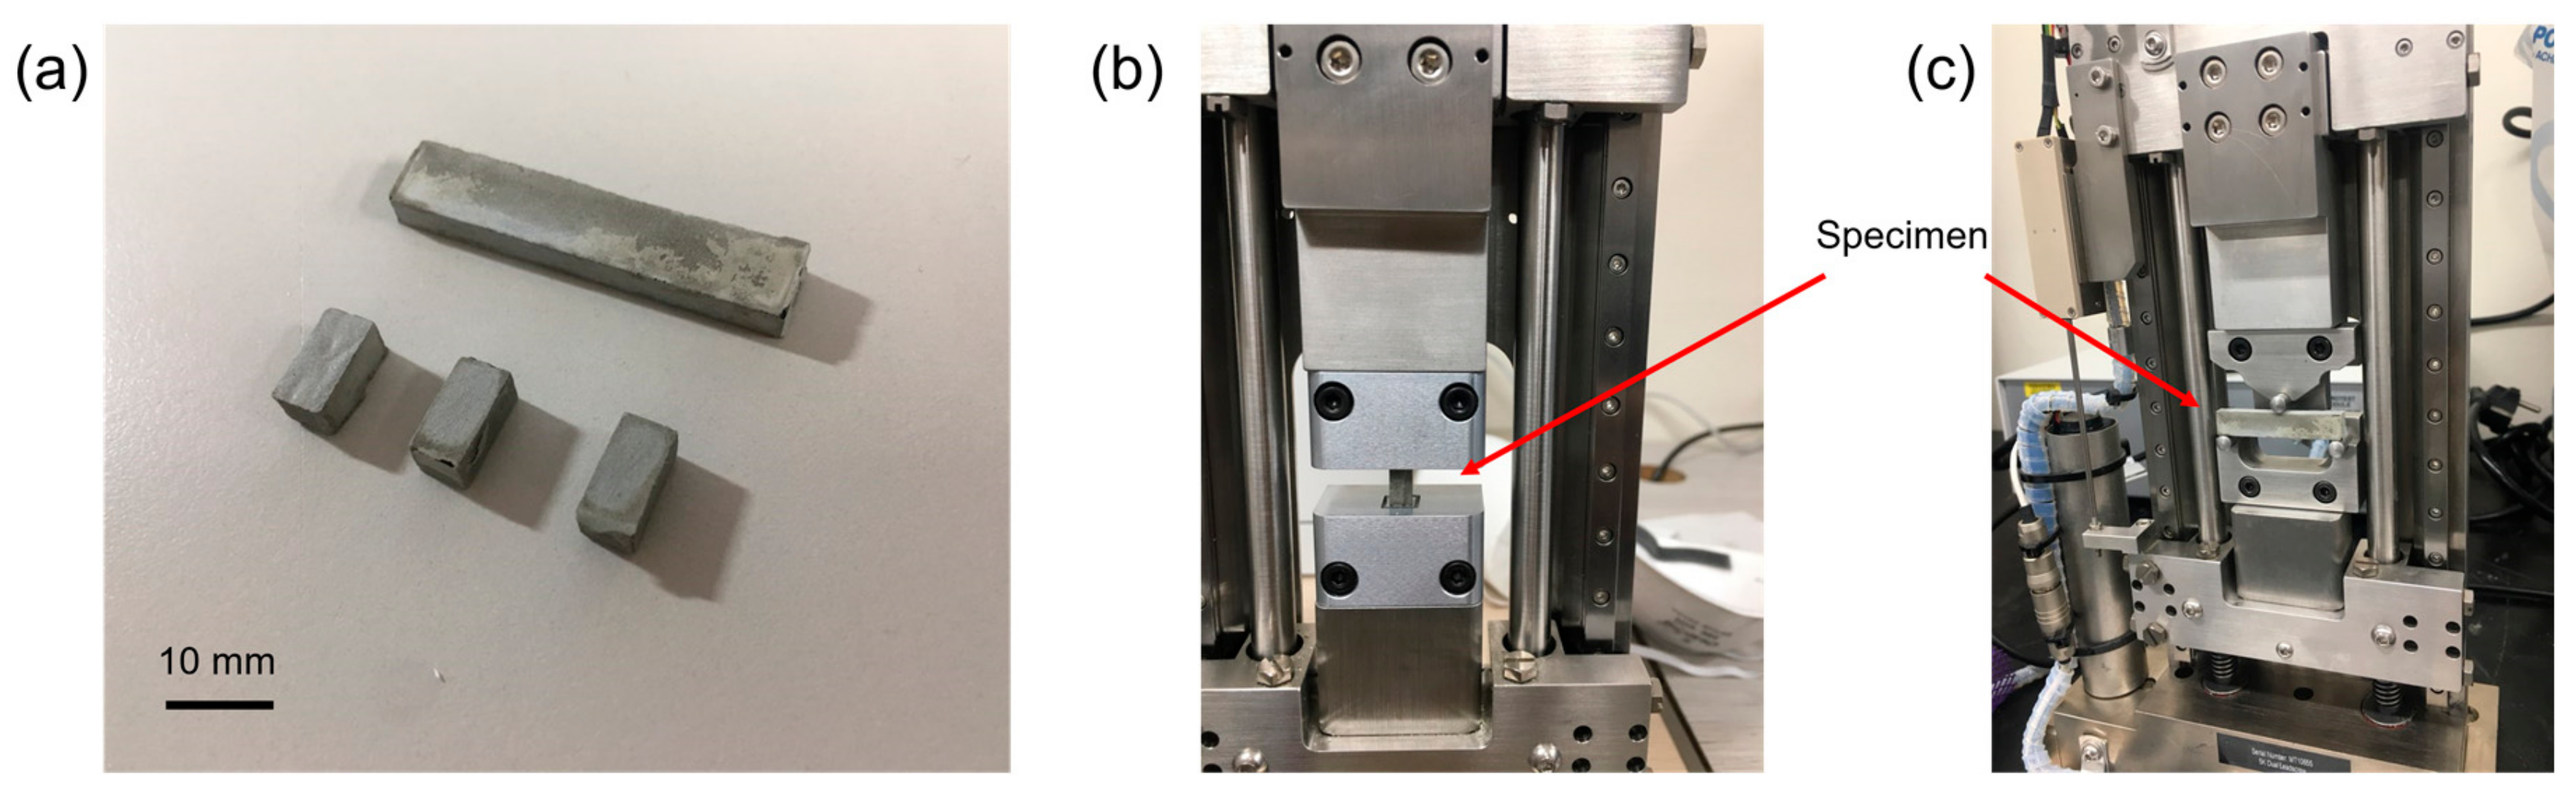
2.3. Mechanical Strength Tests
2.4. Mercury Intrusion Porosimetry (MIP) Analysis
2.5. BET Analysis
2.6. Electron Microscopy Analysis
2.7. Isothermal Conduction Calorimetry Analysis
2.8. X-Ray Diffraction Analysis
3. Theoretical Background
4. Results and Discussion
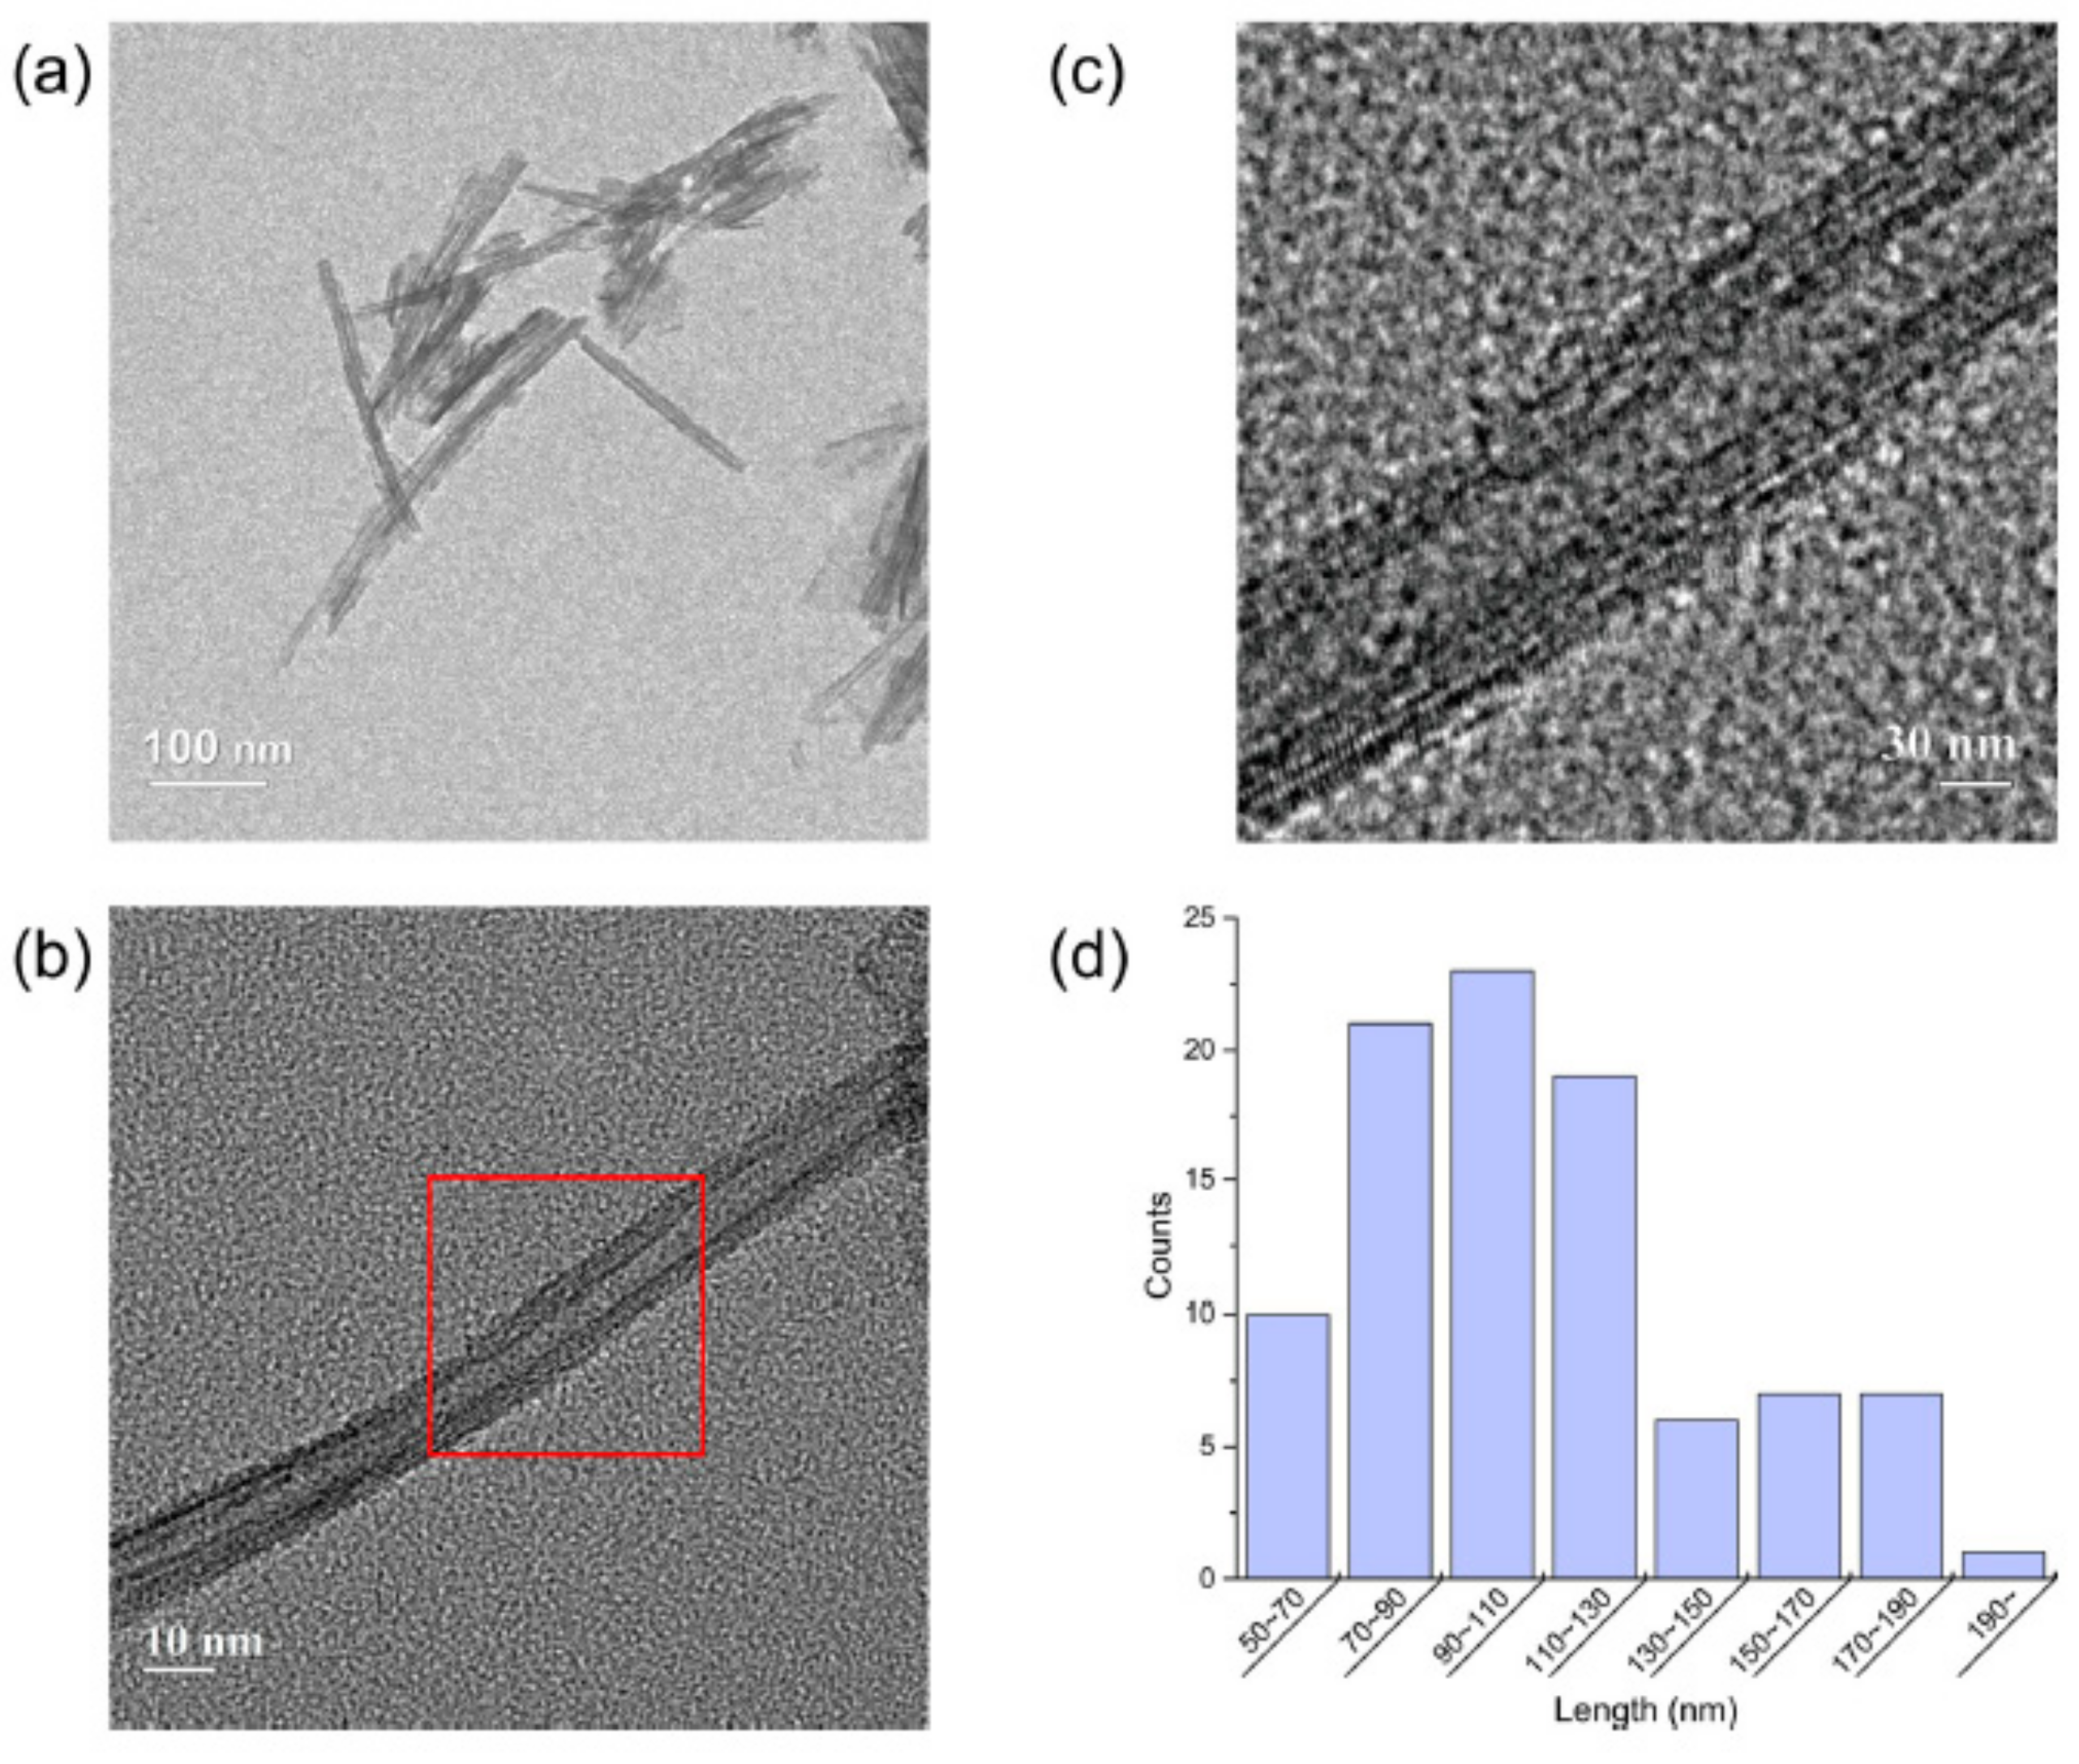
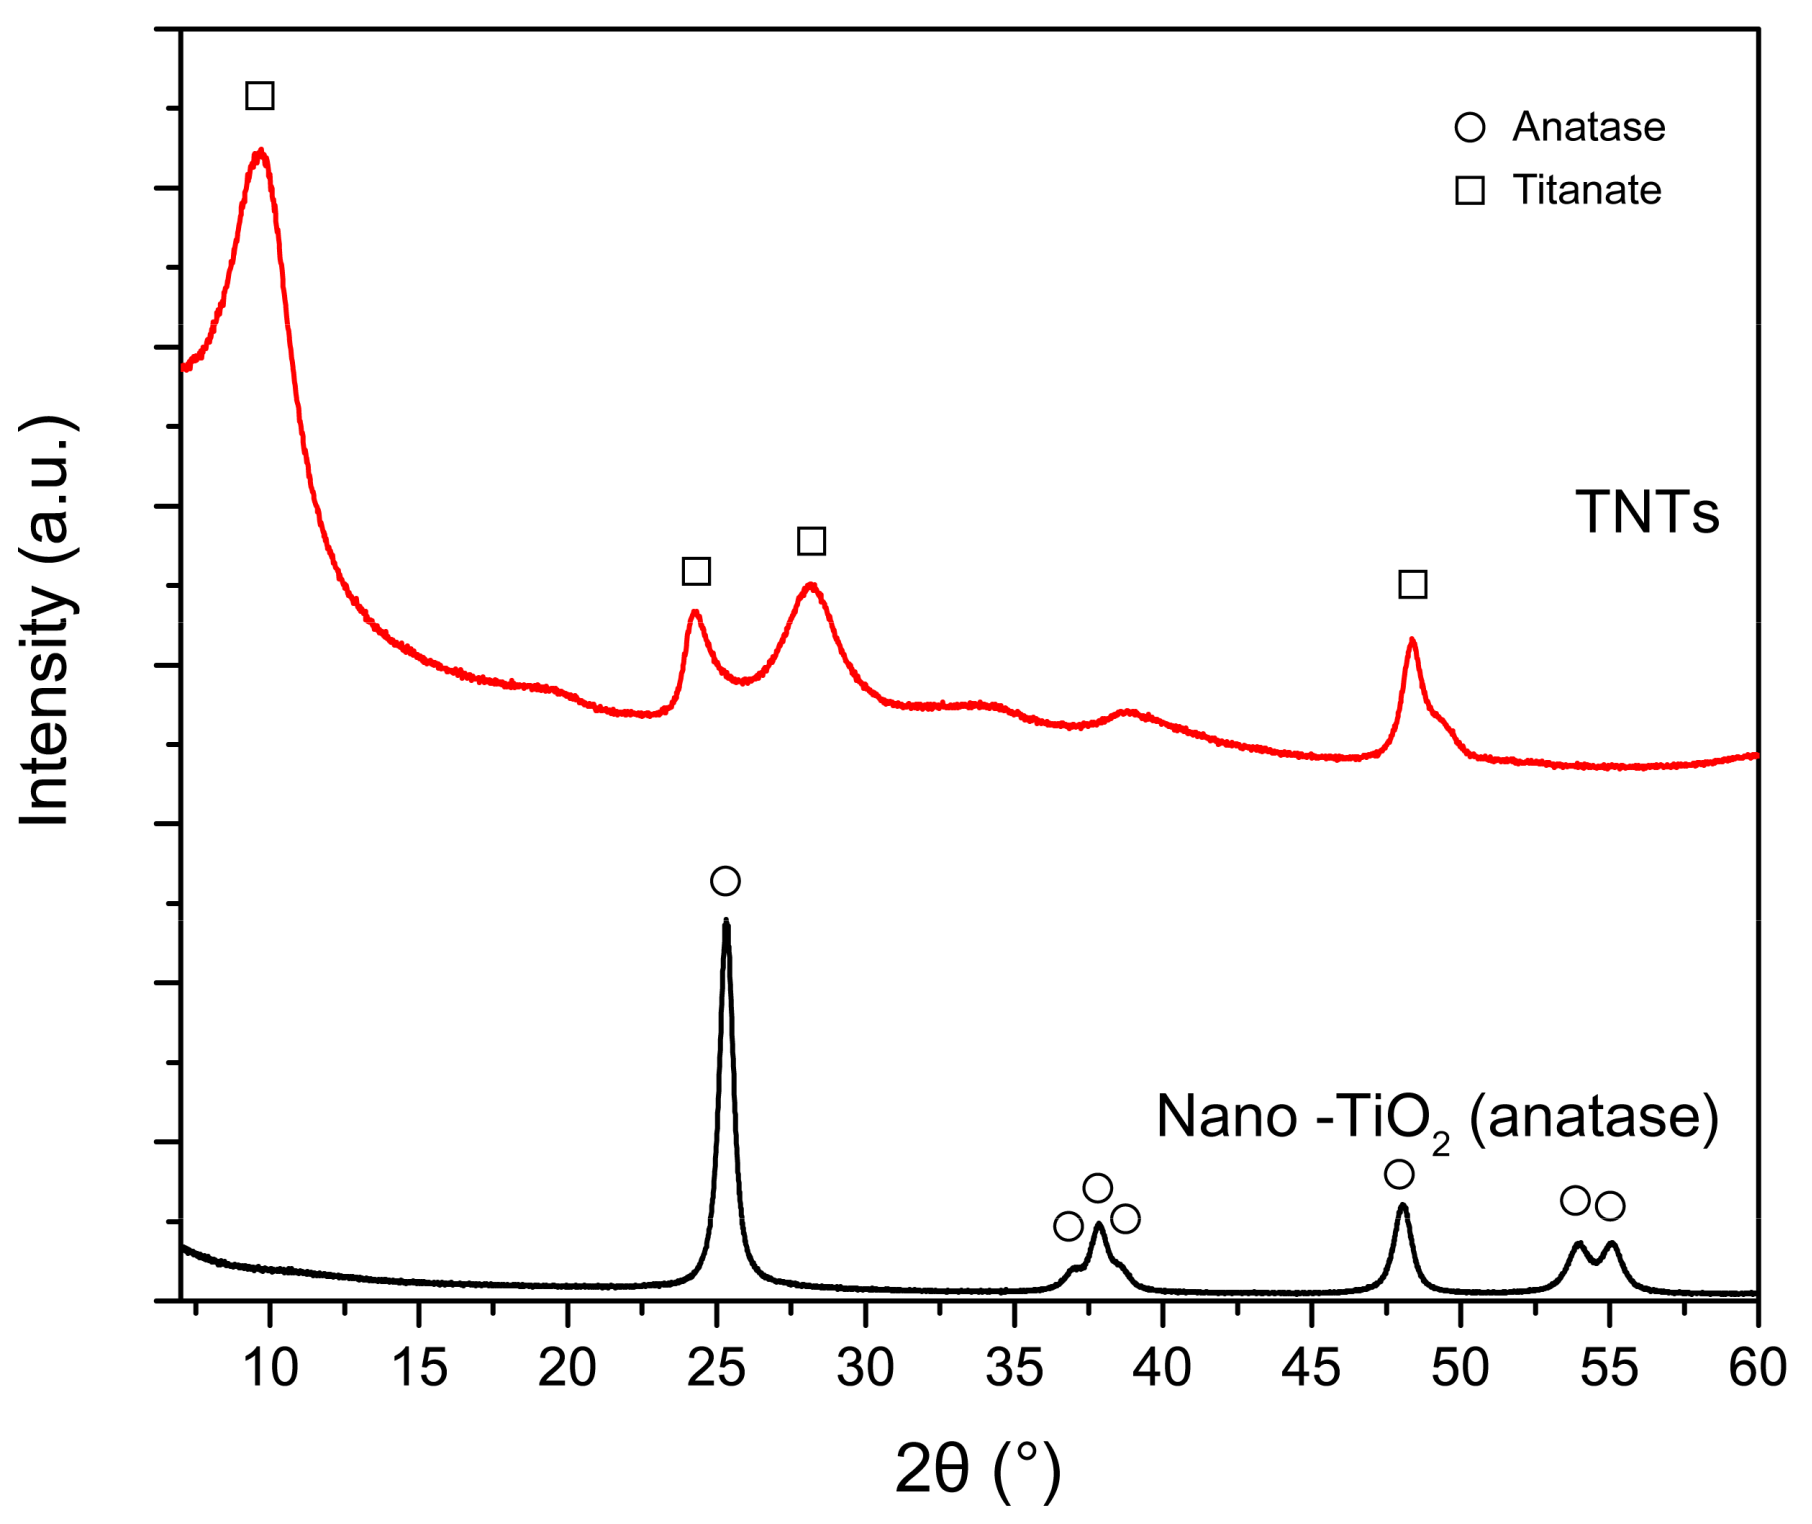
4.1. Properties of Synthesized TNTs
4.2. Effect of TNTs on the Hydration of Cement Paste and Tricalcium Silicate (C3S)
4.3. Mechanical Properties and Microstructure of TNTs-Cement Composites
5. Conclusions
- (1)
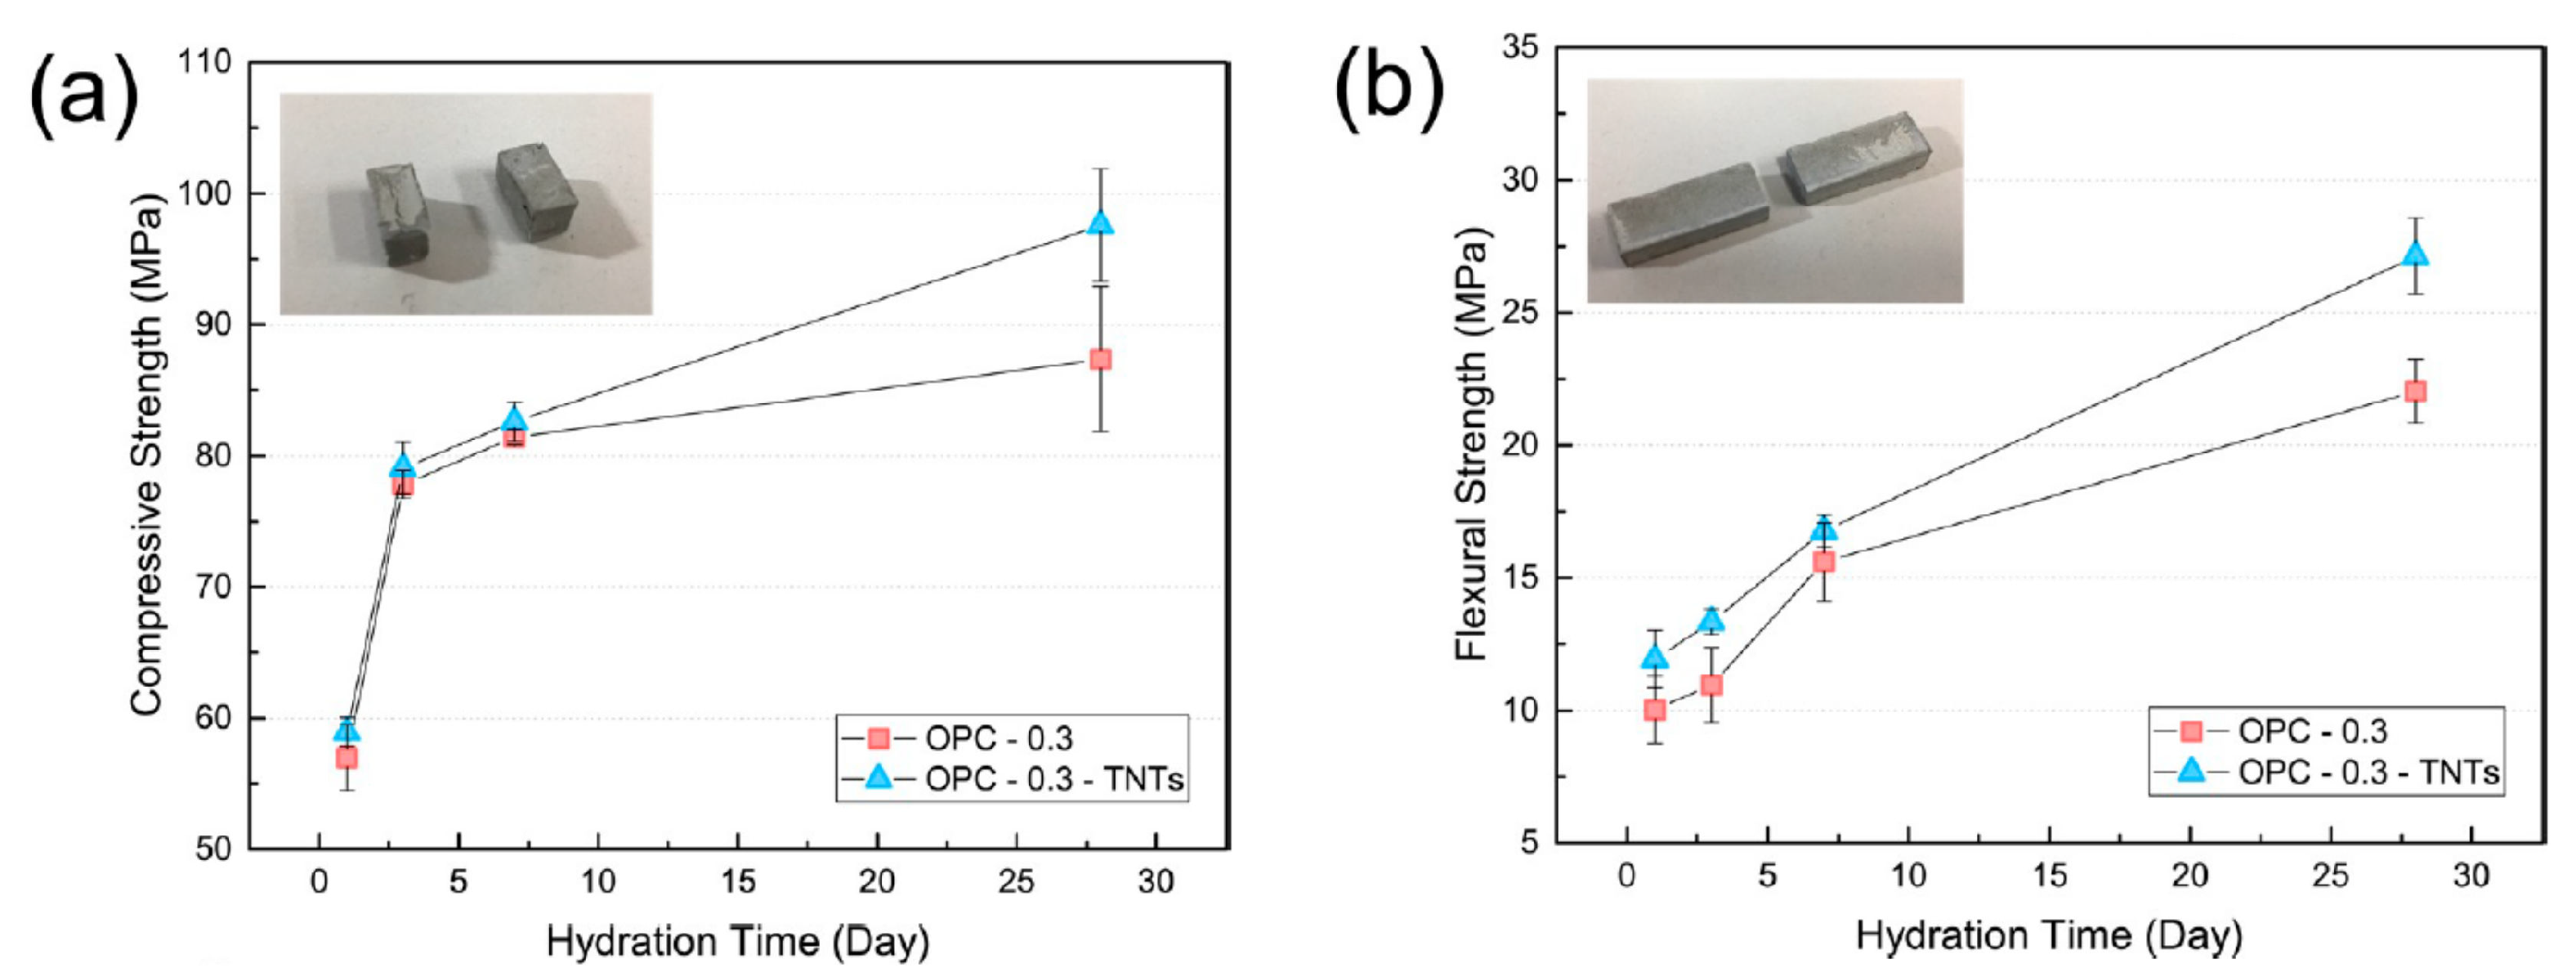
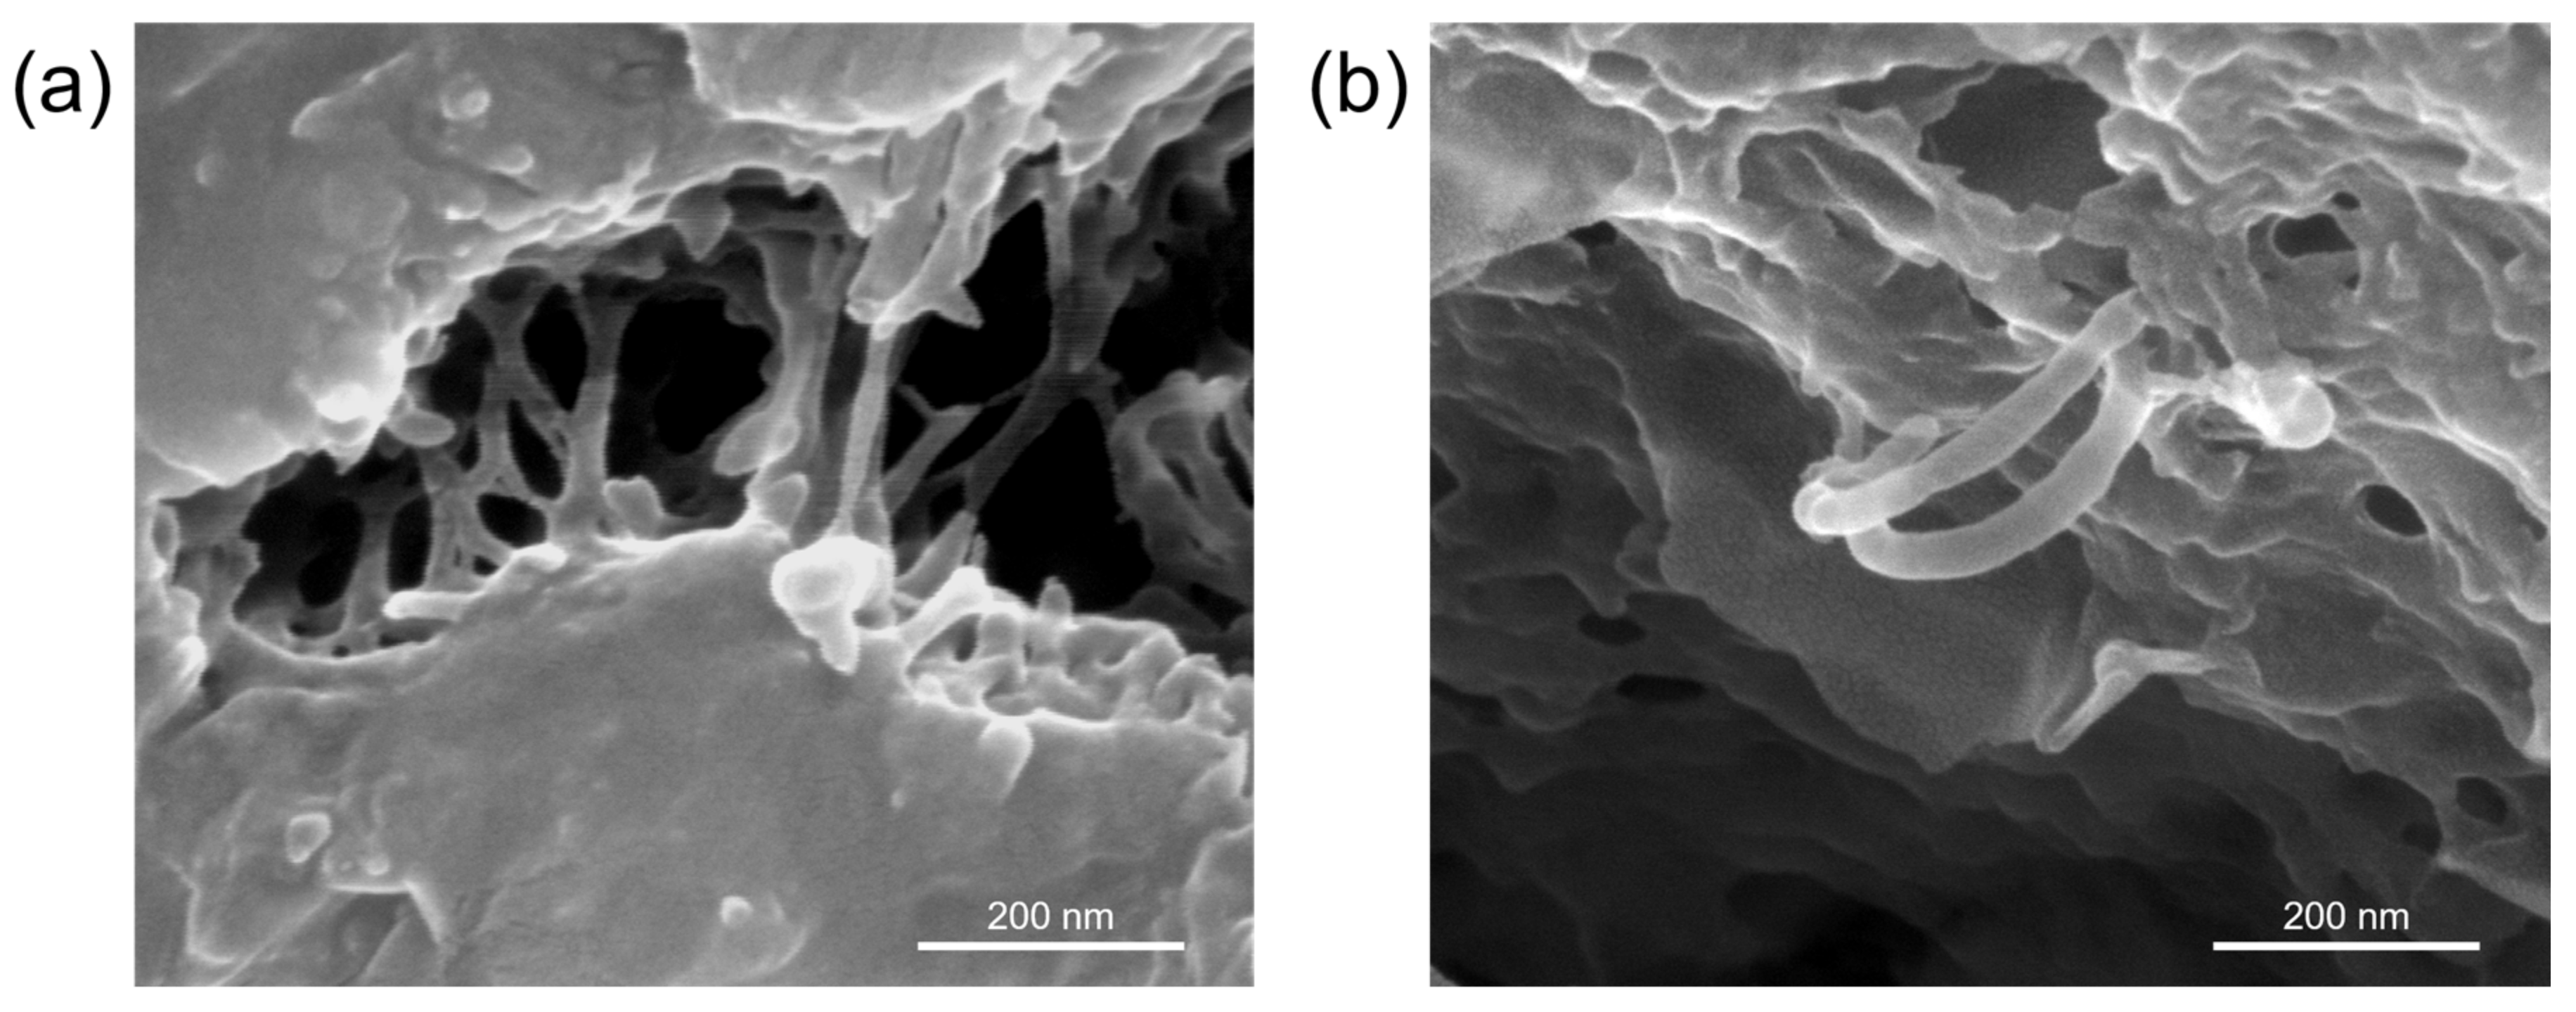
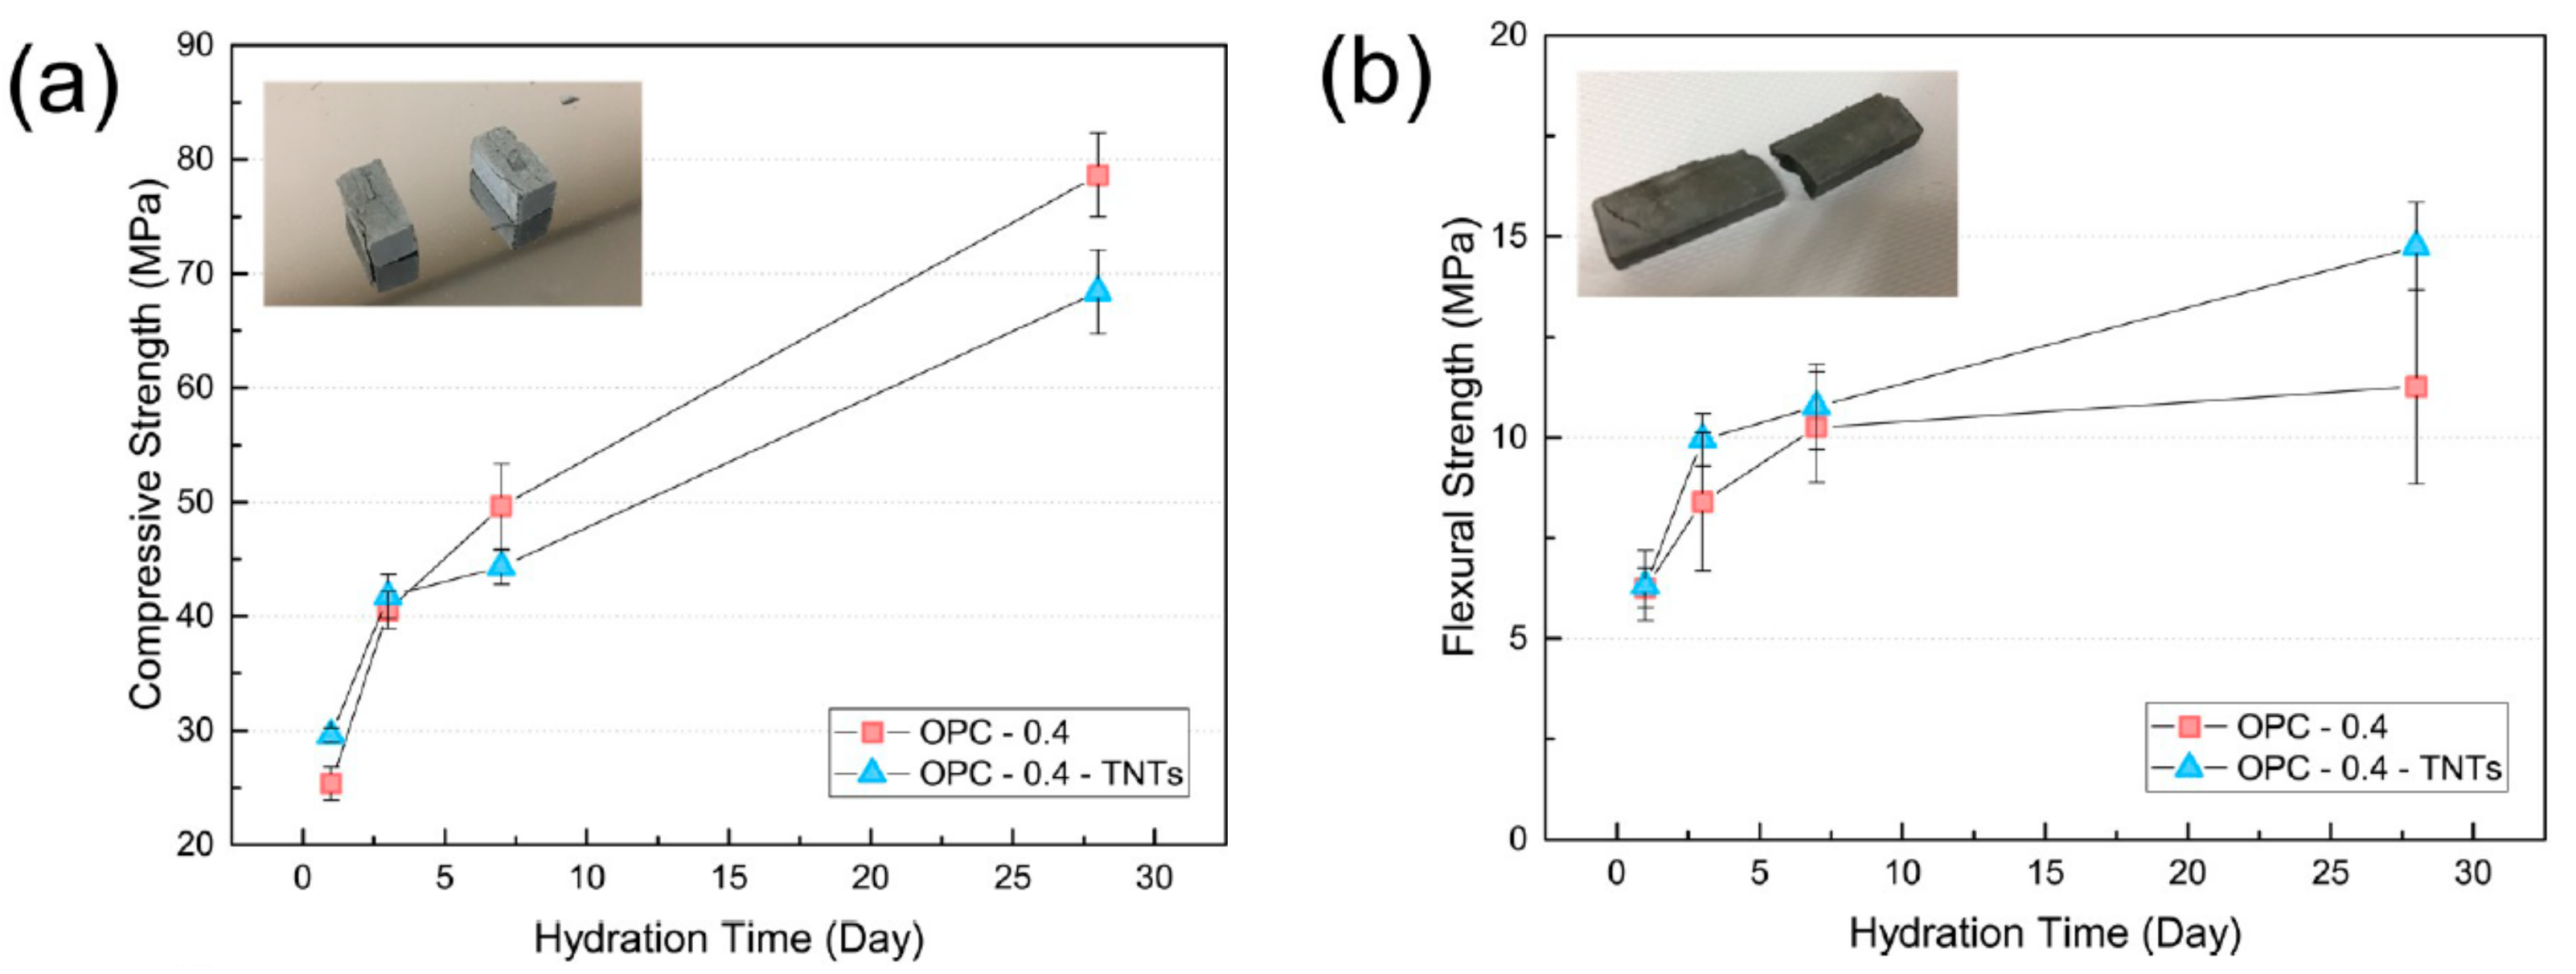
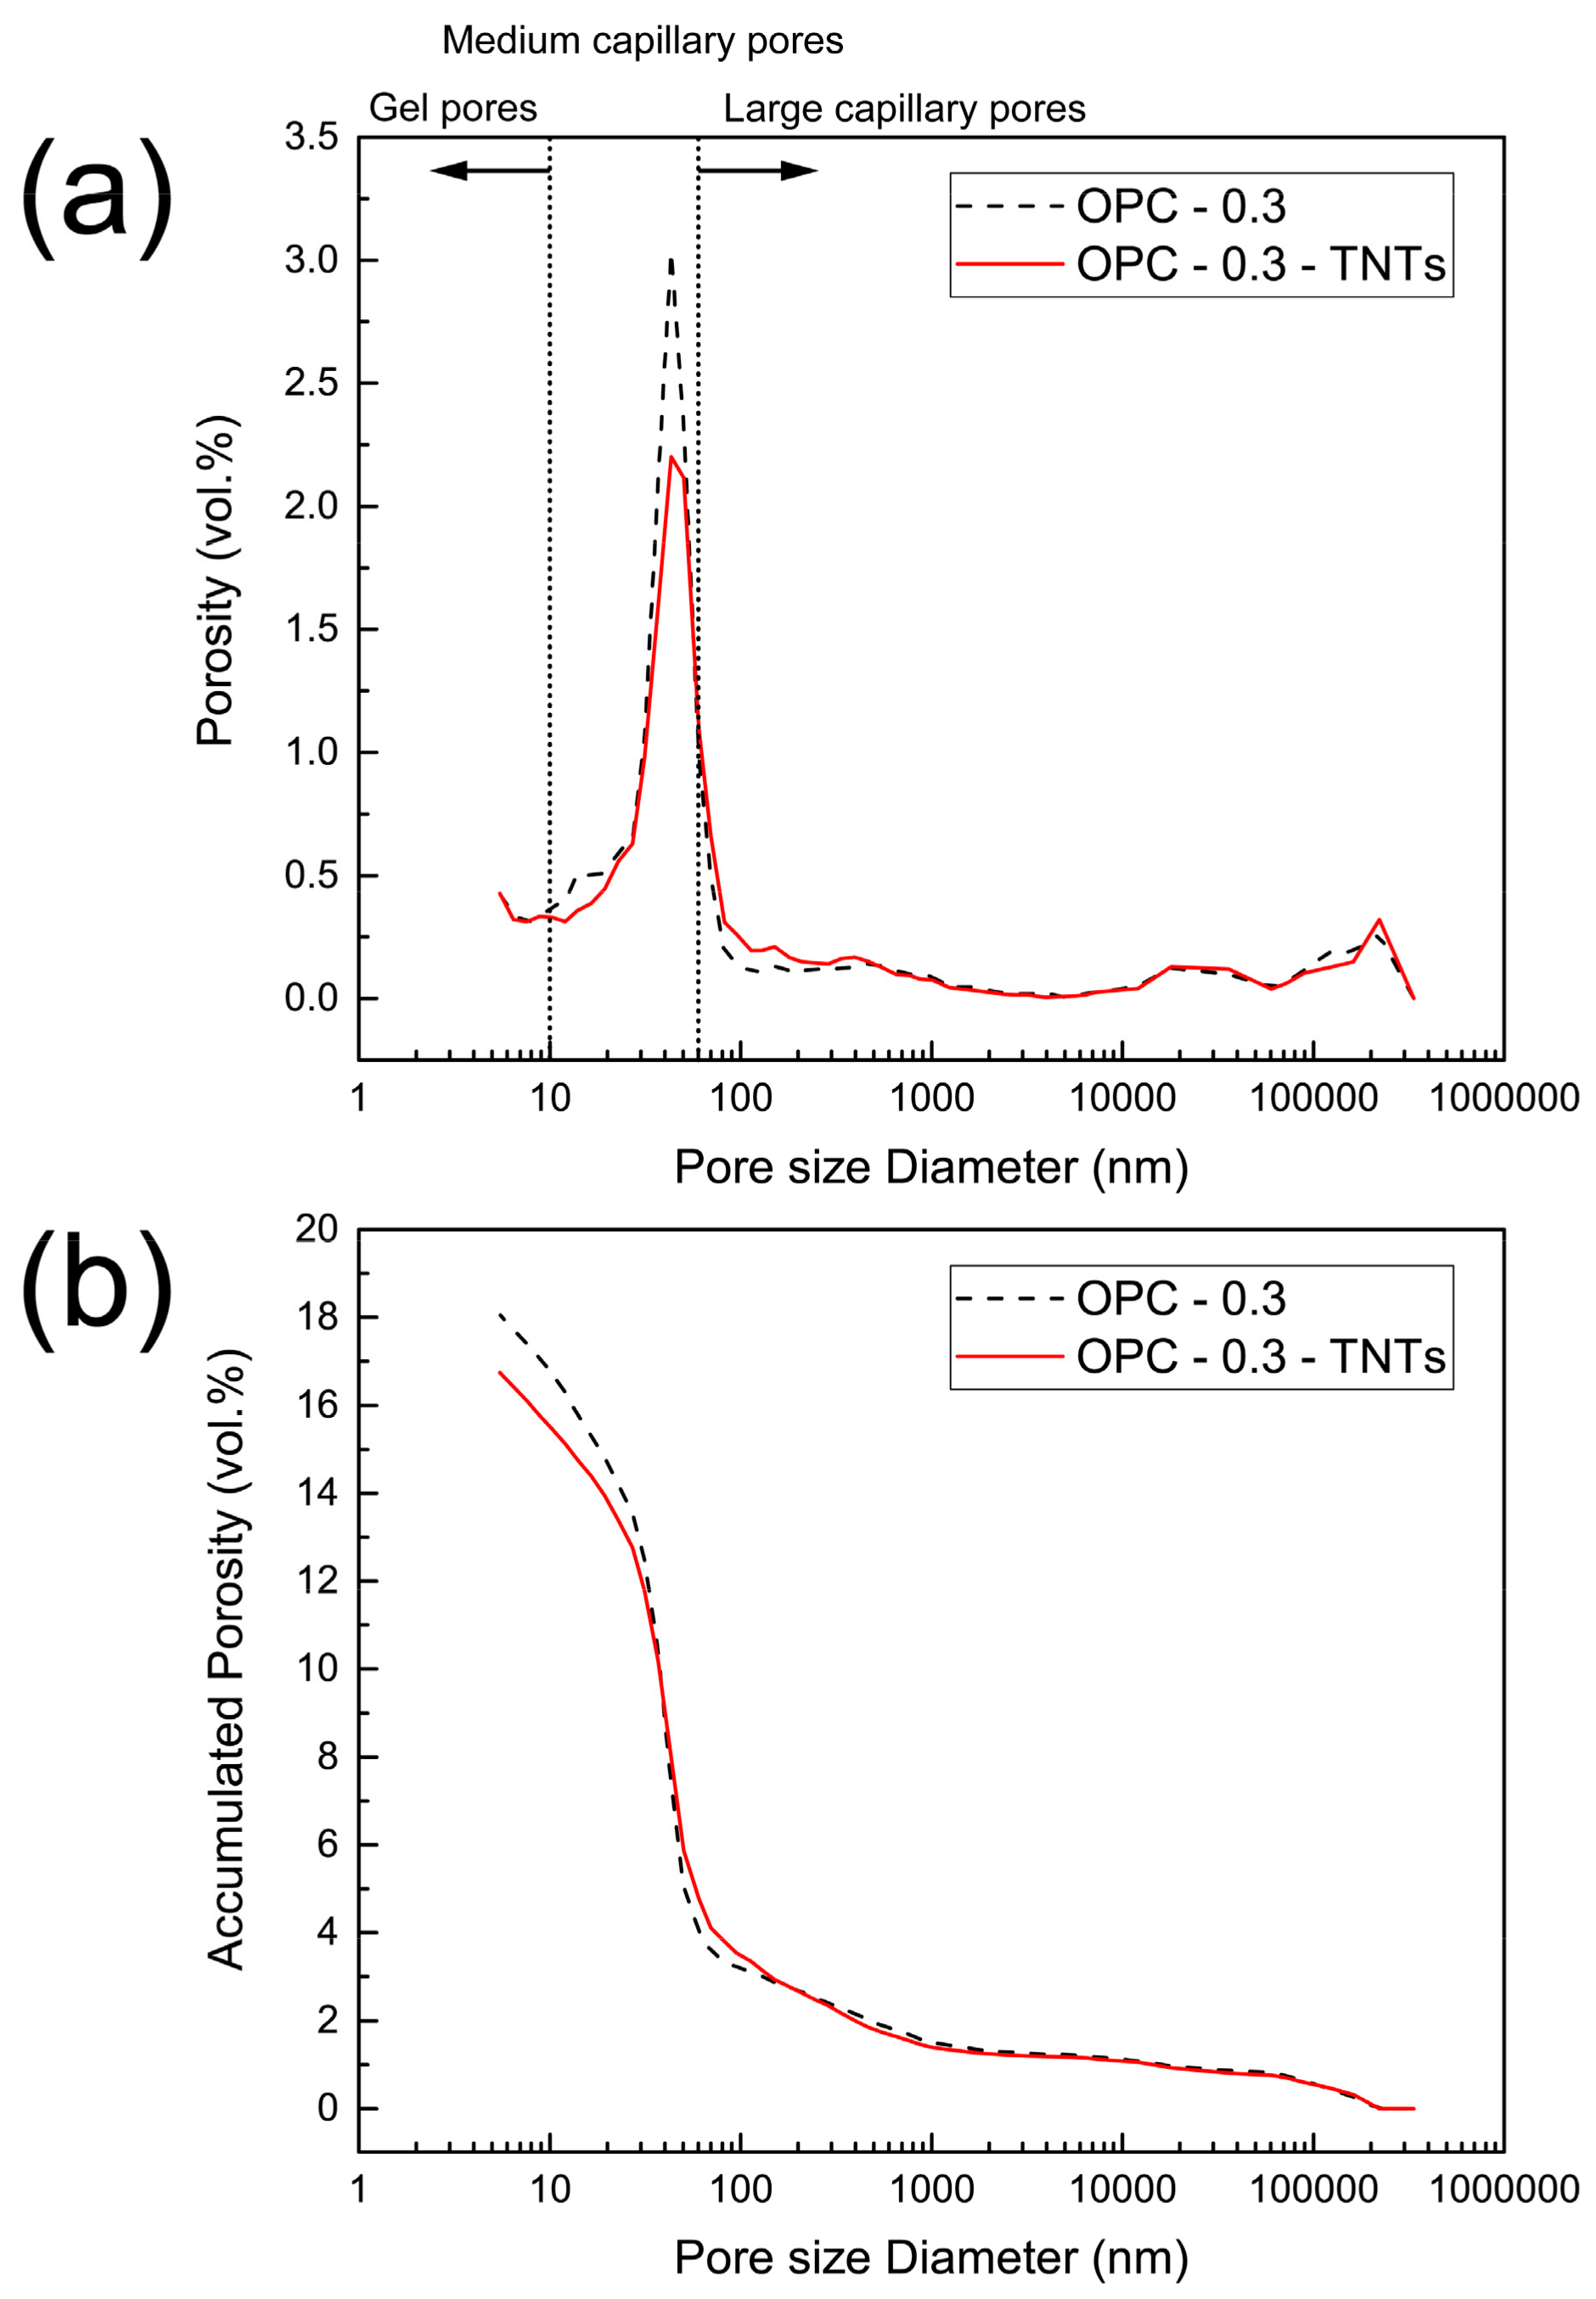
- Analysis of the mechanical properties of cement pastes with added TNTs confirmed the reinforcing effect of the TNTs. The TNTs increased the strength of the cement pastes at most ages and particularly the later age strength. Thus, addition of TNTs was considered to be more effective for increasing flexural strength than compressive strength. The strength enhancement was a result of the nano-sized fine TNTs decreasing the porosity of cement paste in the pore size range of 10 to 100 nm. The SEM measurements of the fractured surfaces of cement paste clearly showed the bridge effect of TNTs between the microcracks of cement paste.
- (2)
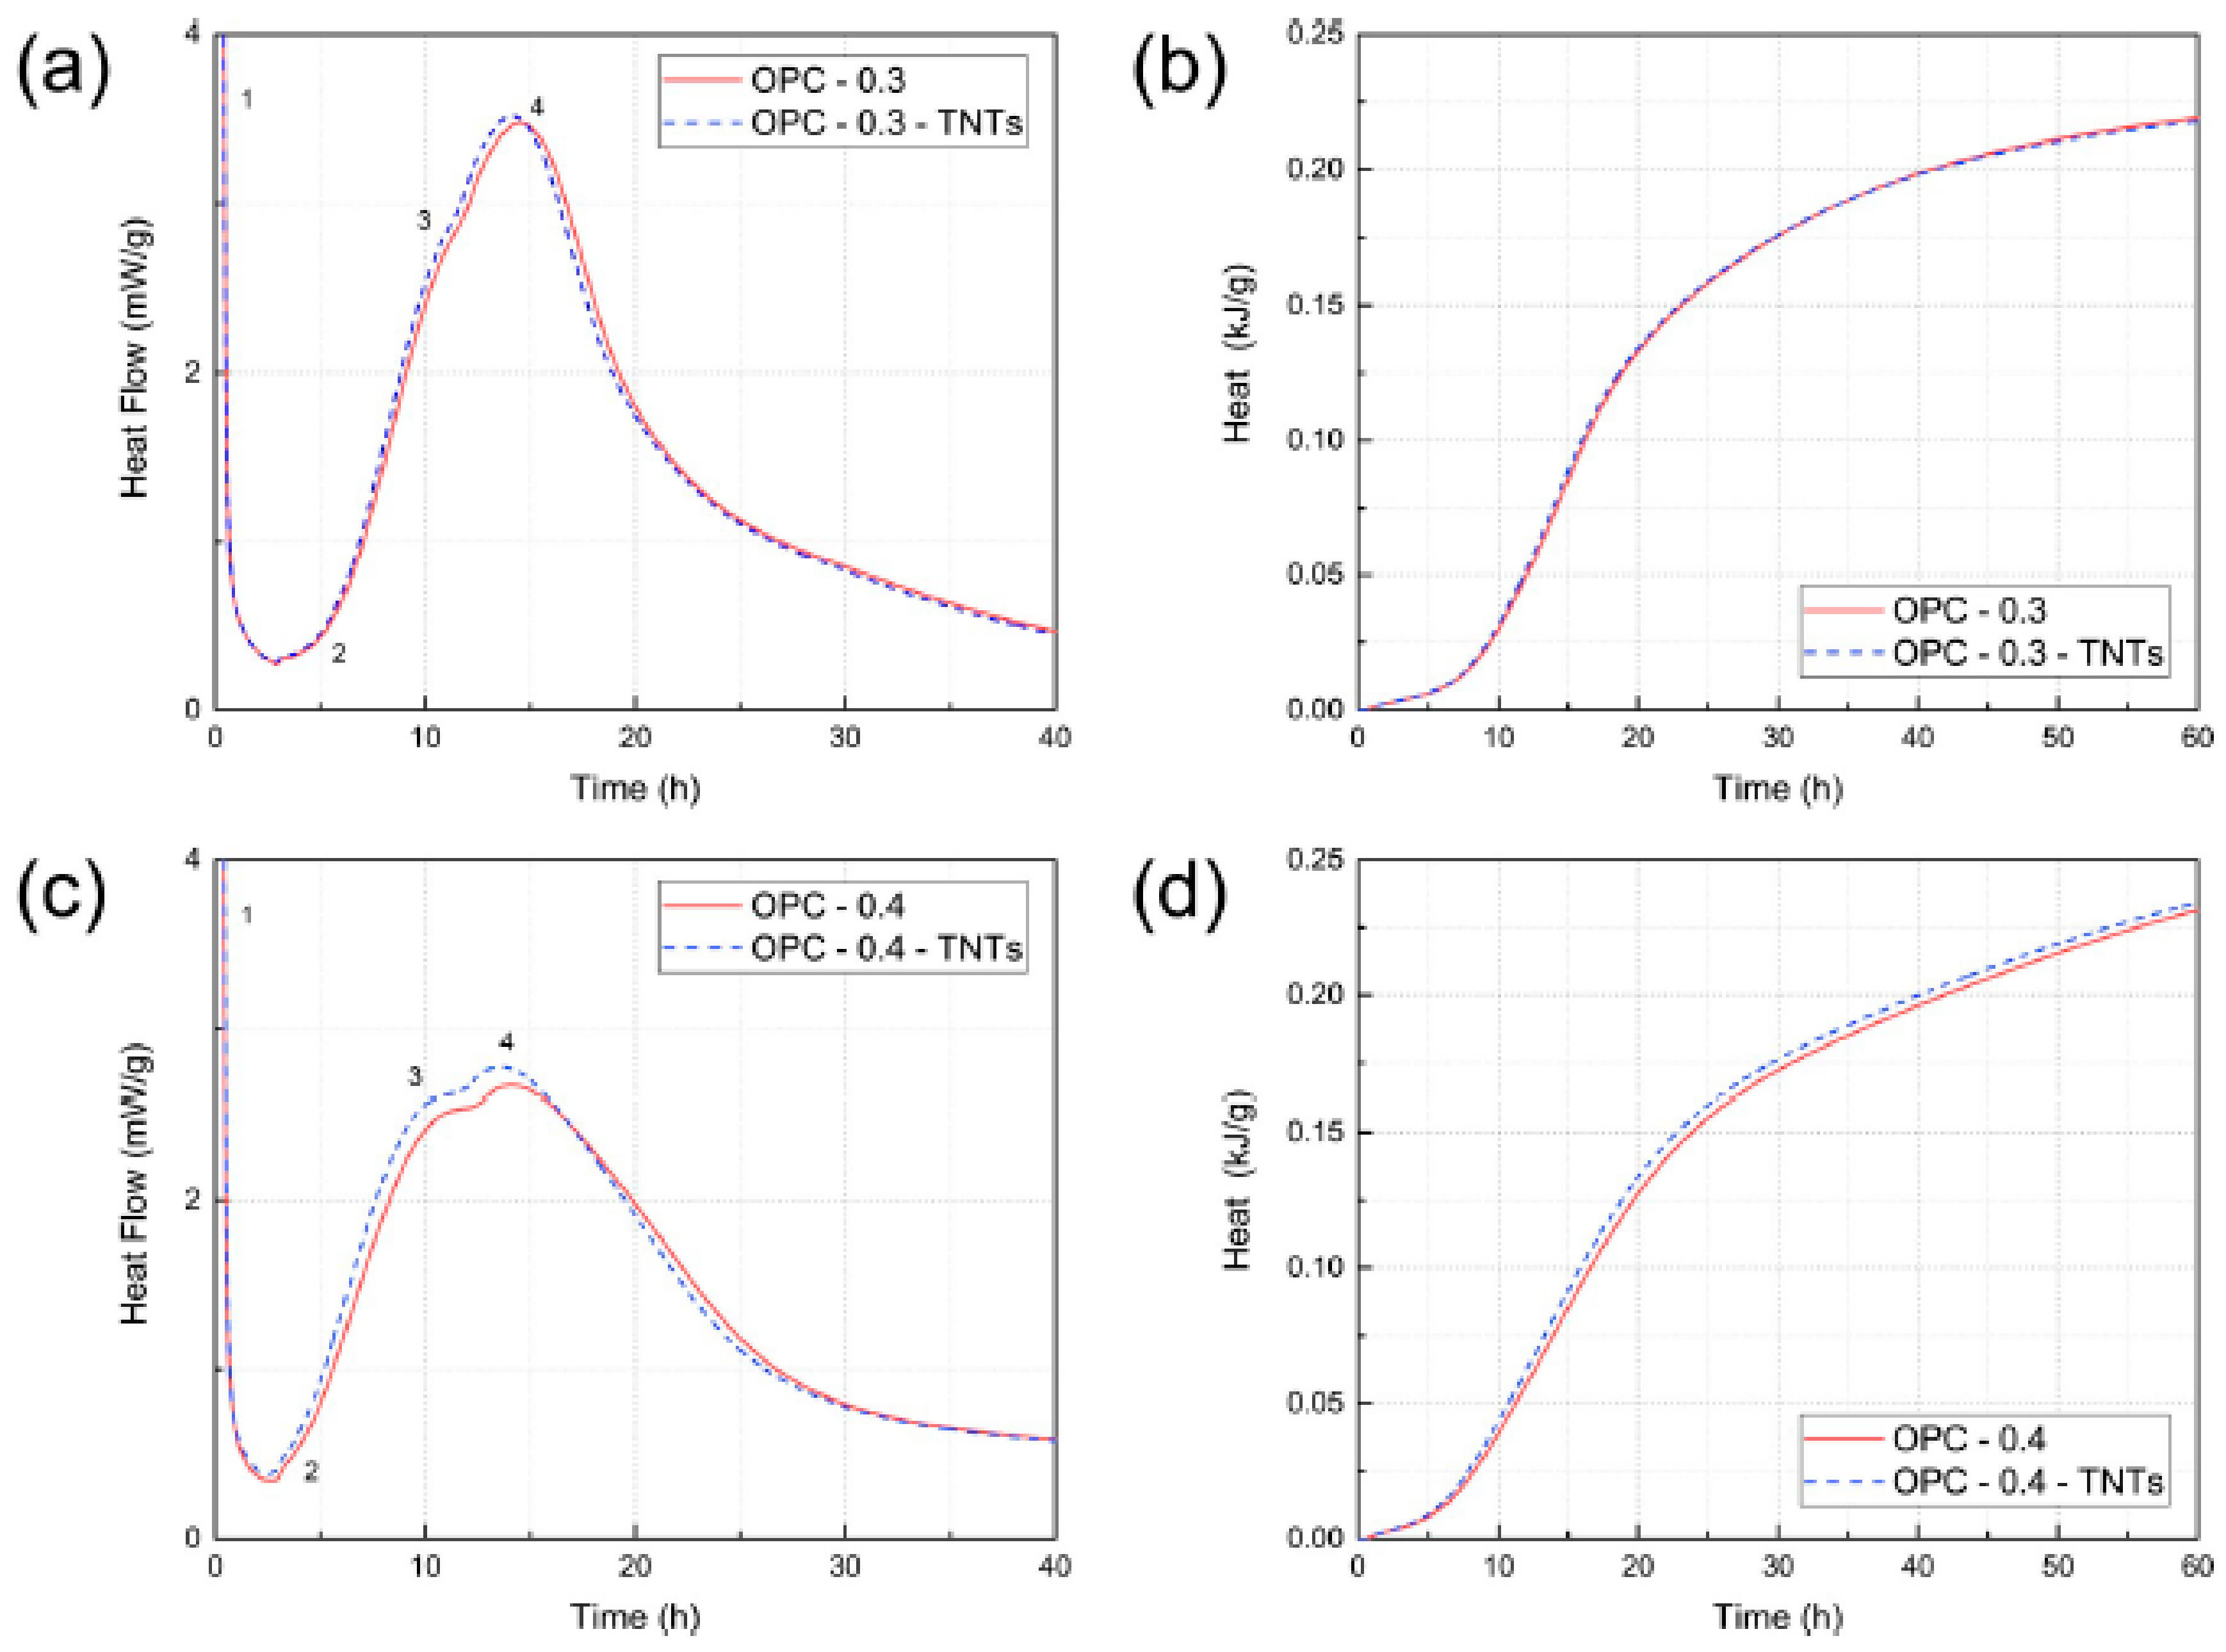
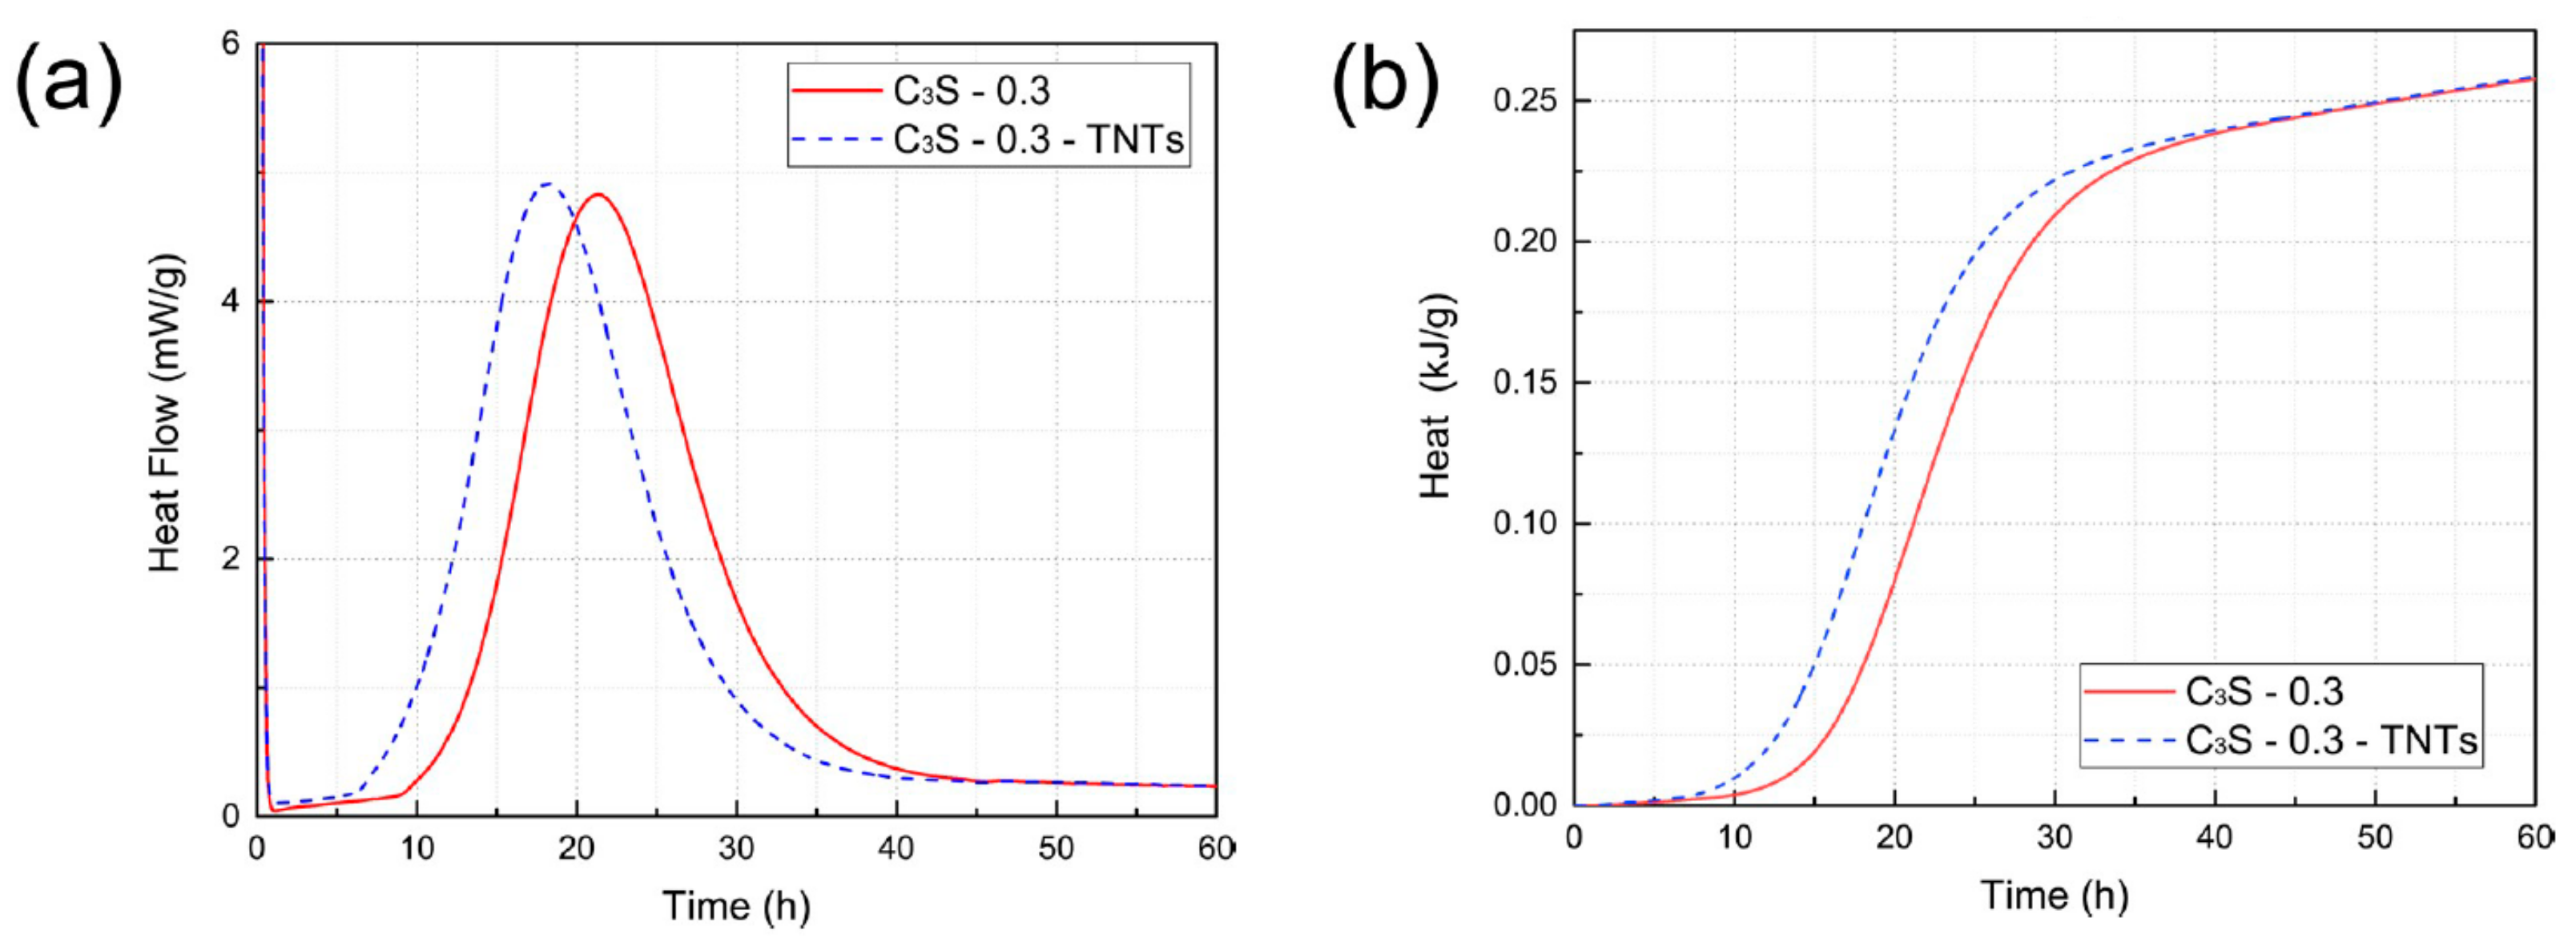
- In the case of ordinary Portland cement paste, the initial hydration properties of the paste did not show any significant change with the addition of TNTs regardless of the w/c ratio. In contrast, in the case of C3S, it was confirmed that the addition of TNTs accelerated the hydration by several hours. There was no significant difference in the total hydration rate between the control and TNT-incorporated samples.
Author Contributions
Funding
Conflicts of Interest
References
- Balaguru, P.; Chong, K. Nanotechnology and concrete: Research opportunities. In Proceedings of the ACI Session on “Nanotechnology of Concrete: Recent Developments and Future Perspectives”, Denver, CO, USA, 7 November 2006. [Google Scholar]
- Xu, L.; Li, B.; Ding, X.; Chi, Y.; Li, C.; Huang, B.; Shi, Y. Experimental Investigation on Damage Behavior of Polypropylene Fiber Reinforced Concrete under Compression. Int. J. Concr. Struct. Mater. 2018, 12, 68. [Google Scholar] [CrossRef]
- Cho, C.-G.; Cheong, S.-H.; Moon, H.-J.; Kim, H.-Y.; Lee, K.-S. Experimental Study on Seismic Capacity of Reinforced Concrete Composite Columns Based on a High-ductile Fiber Cementitious Composite. Int. J. Concr. Struct. Mater. 2019, 13, 16. [Google Scholar] [CrossRef]
- Hwang, J.-H.; Lee, D.H.; Ju, H.; Kim, K.S.; Kang, T.H.-K.; Pan, Z. Shear deformation of steel fiber-reinforced prestressed concrete beams. Int. J. Concr. Struct. Mater. 2016, 10, 53–63. [Google Scholar] [CrossRef]
- Shah, S.P.; Ouyang, C. Mechanical Behavior of Fiber-Reinforced Cement-Based Composites. J. Am. Ceram. Soc. 1991, 74, 2727–2953. [Google Scholar] [CrossRef]
- Song, P.; Hwang, S. Mechanical properties of high-strength steel fiber-reinforced concrete. Constr. Build. Mater. 2004, 18, 669–673. [Google Scholar] [CrossRef]
- Yu, M.F.; Files, B.S.; Arepalli, S.; Ruoff, R.S. Tensile loading of ropes of single wall carbon nanotubes and their mechanical properties. Phys. Rev. Lett. 2000, 84, 5552–5555. [Google Scholar] [CrossRef] [PubMed]
- Walters, D.A.; Ericson, L.M.; Casavant, M.J.; Liu, J.; Colbert, D.T.; Smith, K.A.; Smalley, R.E. Elastic strain of freely suspended single-wall carbon nanotube ropes. Appl. Phys. Lett. 1999, 74, 3803–3805. [Google Scholar] [CrossRef]
- Li, V.C. Engineered Cementitious Composites-Tailored Composites through Micromechanical Modeling. 1998. Available online: https://deepblue.lib.umich.edu/bitstream/handle/2027.42/84667/csce_tailoredecc_98.pdf?sequence=1 (accessed on 15 May 2019).
- Zollo, R.F. Fiber-reinforced concrete: An overview after 30 years of development. Cem. Concr. Compos. 1997, 19, 107–122. [Google Scholar] [CrossRef]
- Chuah, S.; Pan, Z.; Sanjayan, J.G.; Wang, C.M.; Duan, W.H. Nano reinforced cement and concrete composites and new perspective from graphene oxide. Constr. Build. Mater. 2014, 73, 113–124. [Google Scholar] [CrossRef]
- Li, Q.; Liu, Q.; Peng, B.; Chai, L.; Liu, H. Self-cleaning performance of TiO2-coating cement materials prepared based on solidification/stabilization of electrolytic manganese residue. Constr. Build. Mater. 2016, 106, 236–242. [Google Scholar] [CrossRef]
- Loh, K.; Gaylarde, C.; Shirakawa, M. Photocatalytic activity of ZnO and TiO2 ‘nanoparticles’ for use in cement mixes. Constr. Build. Mater. 2018, 167, 853–859. [Google Scholar] [CrossRef]
- Yousefi, A.; Allahverdi, A.; Hejazi, P. Effective dispersion of nano-TiO2 powder for enhancement of photocatalytic properties in cement mixes. Constr. Build. Mater. 2013, 41, 224–230. [Google Scholar] [CrossRef]
- Fujishima, A.; Zhang, X.; Tryk, D.A. TiO2 photocatalysis and related surface phenomena. Surf. Sci. Rep. 2008, 63, 515–582. [Google Scholar] [CrossRef]
- Meng, T.; Yu, Y.; Qian, X.; Zhan, S.; Qian, K. Effect of nano-TiO2 on the mechanical properties of cement mortar. Constr. Build. Mater. 2012, 29, 241–245. [Google Scholar] [CrossRef]
- Jayapalan, A.; Lee, B.; Kurtis, K. Effect of nano-sized titanium dioxide on early age hydration of Portland cement. In Nanotechnology in Construction 3; Springer: Berlin/Heidelberg, Germany; pp. 267–273.
- Lucas, S.; Ferreira, V.; de Aguiar, J.B. Incorporation of titanium dioxide nanoparticles in mortars—Influence of microstructure in the hardened state properties and photocatalytic activity. Cem. Concr. Res. 2013, 43, 112–120. [Google Scholar] [CrossRef]
- Peng, Y.-P.; Lo, S.-L.; Ou, H.-H.; Lai, S.-W. Microwave-assisted hydrothermal synthesis of N-doped titanate nanotubes for visible-light-responsive photocatalysis. J. Hazard. Mater. 2010, 183, 754–758. [Google Scholar] [CrossRef]
- Song, Z.; Xu, H.; Li, K.; Wang, H.; Yan, H. Hydrothermal synthesis and photocatalytic properties of titanium acid H2Ti2O5· H2O nanosheets. J. Mol. Catal. A Chem. 2005, 239, 87–91. [Google Scholar] [CrossRef]
- Xiong, L.; Sun, W.; Yang, Y.; Chen, C.; Ni, J. Heterogeneous photocatalysis of methylene blue over titanate nanotubes: Effect of adsorption. J. Colloid Interface Sci. 2011, 356, 211–216. [Google Scholar] [CrossRef] [PubMed]
- Ratan, J.K.; Saini, A. Enhancement of photocatalytic activity of self-cleaning cement. Mater. Lett. 2019, 244, 178–181. [Google Scholar] [CrossRef]
- Grätzel, M. Dye-sensitized solar cells. J. Photochem. Photobiol. C Photochem. Rev. 2003, 4, 145–153. [Google Scholar] [CrossRef]
- Li, B.; Wang, L.; Kang, B.; Wang, P.; Qiu, Y. Review of recent progress in solid-state dye-sensitized solar cells. Sol. Energy Mater. Sol. Cells 2006, 90, 549–573. [Google Scholar] [CrossRef]
- Mor, G.K.; Varghese, O.K.; Paulose, M.; Shankar, K.; Grimes, C.A. A review on highly ordered, vertically oriented TiO2 nanotube arrays: Fabrication, material properties, and solar energy applications. Sol. Energy Mater. Sol. Cells 2006, 90, 2011–2075. [Google Scholar] [CrossRef]
- Jin, Z.; Zhang, X.; Li, Y.; Li, S.; Lu, G. 5.1% Apparent quantum efficiency for stable hydrogen generation over eosin-sensitized CuO/TiO2 photocatalyst under visible light irradiation. Catal. Commun. 2007, 8, 1267–1273. [Google Scholar] [CrossRef]
- Mardare, D.; Iftimie, N.; Luca, D. TiO2 thin films as sensing gas materials. J. Non Cryst. Solids 2008, 354, 4396–4400. [Google Scholar] [CrossRef]
- Yamashita, H.; Nakao, H.; Takeuchi, M.; Nakatani, Y.; Anpo, M. Coating of TiO2 photocatalysts on super-hydrophobic porous teflon membrane by an ion assisted deposition method and their self-cleaning performance. Nucl. Instrum. Methods Phys. Res. B 2003, 206, 898–901. [Google Scholar] [CrossRef]
- Anandan, S.; Narasinga Rao, T.; Sathish, M.; Rangappa, D.; Honma, I.; Miyauchi, M. Superhydrophilic graphene-loaded TiO2 thin film for self-cleaning applications. ACS Appl. Mater. Interfaces 2012, 5, 207–212. [Google Scholar] [CrossRef] [PubMed]
- Peigney, A.; Laurent, C.; Flahaut, E.; Bacsa, R.R.; Rousset, A. Specific surface area of carbon nanotubes and bundles of carbon nanotubes. Carbon 2001, 39, 507–514. [Google Scholar] [CrossRef]
- Van Tonder, P.; Mafokoane, T. Effects of multi-walled carbon nanotubes on strength and interfacial transition zone of concrete. 2014. Available online: https://ujcontent.uj.ac.za/vital/access/services/Download/uj:5057/CONTENT1 (accessed on 15 May 2019).
- Jang, S.-H.; Hochstein, D.P.; Kawashima, S.; Yin, H. Experiments and micromechanical modeling of electrical conductivity of carbon nanotube/cement composites with moisture. Cem. Concr. Compos. 2017, 77, 49–59. [Google Scholar] [CrossRef]
- Campillo, I.; Dolado, J.; Porro, A. High-performance nanostructured materials for construction. Spec. Publ. R. Soc. Chem. 2004, 292, 215–226. [Google Scholar]
- Li, G.Y.; Wang, P.M.; Zhao, X. Mechanical behavior and microstructure of cement composites incorporating surface-treated multi-walled carbon nanotubes. Carbon 2005, 43, 1239–1245. [Google Scholar] [CrossRef]
- Coppola, L.; Cadoni, E.; Forni, D.; Buoso, A. In Mechanical characterization of cement composites reinforced with fiberglass, carbon nanotubes or glass reinforced plastic (GRP) at high strain rates. In Applied Mechanics and Materials; Trans Tech Publications: Stafa-Zurich, Switzerland, 2011. [Google Scholar]
- Grobert, N. Carbon nanotubes–becoming clean. Mater. Today 2007, 10, 28–35. [Google Scholar] [CrossRef]
- Konsta-Gdoutos, M.S.; Metaxa, Z.S.; Shah, S.P. Highly dispersed carbon nanotube reinforced cement based materials. Cem. Concr. Res. 2010, 40, 1052–1059. [Google Scholar] [CrossRef]
- Bastos, G.; Patino-Barbeito, F.; Patino-Cambeiro, F.; Armesto, J. Nano-Inclusions Applied in Cement-Matrix Composites: A Review. Materials 2016, 9, 1015. [Google Scholar] [CrossRef] [PubMed]
- Xie, X.-L.; Mai, Y.-W.; Zhou, X.-P. Dispersion and alignment of carbon nanotubes in polymer matrix: A review. Mater. Sci. Eng. R Rep. 2005, 49, 89–112. [Google Scholar] [CrossRef]
- Kasuga, T.; Hiramatsu, M.; Hoson, A.; Sekino, T.; Niihara, K. Formation of titanium oxide nanotube. Langmuir 1998, 14, 3160–3163. [Google Scholar] [CrossRef]
- Wang, W.; Zhang, J.; Huang, H.; Wu, Z.; Zhang, Z. Investigation of monolayer dispersion of benzoic acid supported on the surface of H-titanate nanotubes. Appl. Surface Sci. 2007, 253, 5393–5399. [Google Scholar] [CrossRef]
- Yu, J.; Yu, H.; Cheng, B.; Trapalis, C. Effects of calcination temperature on the microstructures and photocatalytic activity of titanate nanotubes. J. Mol. Catal. A Chem. 2006, 249, 135–142. [Google Scholar] [CrossRef]
- Ou, H.-H.; Lo, S.-L. Review of titania nanotubes synthesized via the hydrothermal treatment: Fabrication, modification, and application. Sep. Purif. Technol. 2007, 58, 179–191. [Google Scholar] [CrossRef]
- An’amt, M.; Huang, N.; Radiman, S.; Lim, H.; Muhamad, M. Triethanolamine solution for rapid hydrothermal synthesis of titanate nanotubes. Sains Malays. 2014, 43, 137–144. [Google Scholar]
- Khaled, S.; Miron, R.J.; Hamilton, D.W.; Charpentier, P.A.; Rizkalla, A.S. Reinforcement of resin based cement with titania nanotubes. Dent. Mater. 2010, 26, 169–178. [Google Scholar] [CrossRef]
- Sreekantan, S.; Wei, L.C. Study on the formation and photocatalytic activity of titanate nanotubes synthesized via hydrothermal method. J. Alloys Compd. 2010, 490, 436–442. [Google Scholar] [CrossRef]
- Kim, J.-Y.; Sekino, T.; Park, D.J.; Tanaka, S.-I. Morphology modification of TiO2 nanotubes by controlling the starting material crystallite size for chemical synthesis. J. Nanopart. Res. 2011, 13, 2319–2327. [Google Scholar] [CrossRef]
- Park, J.; Suh, H.; Woo, S.M.; Jeong, K.; Seok, S.; Bae, S. Assessment of neutron shielding performance of nano-TiO2-incorporated cement paste by Monte Carlo simulation. Prog. Nucl. Energy 2019, 117, 103043. [Google Scholar] [CrossRef]
- Bae, S.; Kanematsu, M.; Hernández-Cruz, D.; Moon, J.; Kilcoyne, D.; Monteiro, P. In situ soft X-ray spectromicroscopy of early tricalcium silicate hydration. Materials 2016, 9, 976. [Google Scholar] [CrossRef] [PubMed]
- Bae, S.; Taylor, R.; Kilcoyne, D.; Moon, J.; Monteiro, P. Effects of incorporating high-volume fly ash into tricalcium silicate on the degree of silicate polymerization and aluminum substitution for silicon in calcium silicate hydrate. Materials 2017, 10, 131. [Google Scholar] [CrossRef] [PubMed]
- Cahn, J.W. The kinetics of grain boundary nucleated reactions. Acta Metall. 1956, 4, 449–459. [Google Scholar] [CrossRef]
- Thomas, J.J. A new approach to modeling the nucleation and growth kinetics of tricalcium silicate hydration. J. Am. Ceram. Soc. 2007, 90, 3282–3288. [Google Scholar] [CrossRef]
- Lee, B.Y.; Kurtis, K.E. Influence of TiO2 nanoparticles on early C3S hydration. J. Am. Ceram. Soc. 2010, 93, 3399–3405. [Google Scholar] [CrossRef]
- Qamar, M.; Yoon, C.; Oh, H.; Lee, N.; Park, K.; Kim, D.; Lee, K.; Lee, W.; Kim, S. Preparation and photocatalytic activity of nanotubes obtained from titanium dioxide. Catal. Today 2008, 131, 3–14. [Google Scholar] [CrossRef]
- Cinke, M.; Li, J.; Chen, B.; Cassell, A.; Delzeit, L.; Han, J.; Meyyappan, M. Pore structure of raw and purified HiPco single-walled carbon nanotubes. Chem. Phys. Lett. 2002, 365, 69–74. [Google Scholar] [CrossRef]
- Eswaramoorthy, M.; Sen, R.; Rao, C. A study of micropores in single-walled carbon nanotubes by the adsorption of gases and vapors. Chem. Phys. Lett. 1999, 304, 207–210. [Google Scholar] [CrossRef]
- Inoue, S.; Ichikuni, N.; Suzuki, T.; Uematsu, T.; Kaneko, K. Capillary condensation of N2 on multiwall carbon nanotubes. J. Phys. Chem. B 1998, 102, 4689–4692. [Google Scholar] [CrossRef]
- Wang, B.; Han, Y.; Liu, S. Effect of highly dispersed carbon nanotubes on the flexural toughness of cement-based composites. Constr. Build. Mater. 2013, 46, 8–12. [Google Scholar] [CrossRef]
- Makar, J.M.; Chan, G.W. Growth of cement hydration products on single-walled carbon nanotubes. J. Am. Ceram. Soc. 2009, 92, 1303–1310. [Google Scholar] [CrossRef]
- Thomas, J.J.; Jennings, H.M.; Chen, J.J. Influence of nucleation seeding on the hydration mechanisms of tricalcium silicate and cement. J. Phys. Chem. C 2009, 113, 4327–4334. [Google Scholar] [CrossRef]
- Jayapalan, A.; Lee, B.; Fredrich, S.; Kurtis, K. Influence of additions of anatase TiO2 nanoparticles on early-age properties of cement-based materials. Transp. Res. Rec. 2010, 2141, 41–46. [Google Scholar] [CrossRef]
- Zhang, R.; Cheng, X.; Hou, P.; Ye, Z. Influences of nano-TiO2 on the properties of cement-based materials: Hydration and drying shrinkage. Constr. Build. Mater. 2015, 81, 35–41. [Google Scholar] [CrossRef]
- Nochaiya, T.; Chaipanich, A. Behavior of multi-walled carbon nanotubes on the porosity and microstructure of cement-based materials. Appl. Surface Sci. 2011, 257, 1941–1945. [Google Scholar] [CrossRef]
- Patel, R.; Killoh, D.; Parrott, L.; Gutteridge, W. Influence of curing at different relative humidities upon compound reactions and porosity in Portland cement paste. Mater. Struct. 1988, 21, 192–197. [Google Scholar] [CrossRef]
- Sobolkina, A.; Mechtcherine, V.; Khavrus, V.; Maier, D.; Mende, M.; Ritschel, M.; Leonhardt, A. Dispersion of carbon nanotubes and its influence on the mechanical properties of the cement matrix. Cem. Concr. Compos. 2012, 34, 1104–1113. [Google Scholar] [CrossRef]
- Collins, F.; Lambert, J.; Duan, W.H. The influences of admixtures on the dispersion, workability, and strength of carbon nanotube–OPC paste mixtures. Cem. Concr. Compos. 2012, 34, 201–207. [Google Scholar] [CrossRef]
- Sun, J.; Xu, K.; Shi, C.; Ma, J.; Li, W.; Shen, X. Influence of core/shell TiO2@ SiO2 nanoparticles on cement hydration. Constr. Build. Mater. 2017, 156, 114–122. [Google Scholar] [CrossRef]
- Nadiv, R.; Shtein, M.; Refaeli, M.; Peled, A.; Regev, O. The critical role of nanotube shape in cement composites. Cem. Concr. Compos. 2016, 71, 166–174. [Google Scholar] [CrossRef]
- Miyauchi, M.; Tokudome, H. Low-reflective and super-hydrophilic properties of titanate or titania nanotube thin films via layer-by-layer assembly. Thin Solid Films 2006, 515, 2091–2096. [Google Scholar] [CrossRef]


| SiO2 | Al2O3 | Fe2O3 | CaO | MgO | K2O | SO3 | TiO2 | LOI * | Total |
|---|---|---|---|---|---|---|---|---|---|
| 18.43 | 2.83 | 2.17 | 68.17 | 2.37 | 1.11 | 3.03 | 0.15 | 1.72 | 100 |
| Sample | w/c * | TNTs | Superplasticizer |
|---|---|---|---|
| OPC-0.3 | 0.3 | 0 | 0.40 wt.% |
| OPC-TNTs-0.3 | 0.3 | 0.50 wt.% | 0.40 wt.% |
| OPC-0.4 | 0.4 | 0 | 0 |
| OPC-TNTs-0.4 | 0.4 | 0.50 wt.% | 0 |
| Products | Outer Diameter (nm) | Inner Diameter (nm) | Length (nm) | Surface Area (m2/g) |
|---|---|---|---|---|
| TNTs | 11 ± 1.9 | 5 ± 0.8 | 100 ± 36 | ~200 |
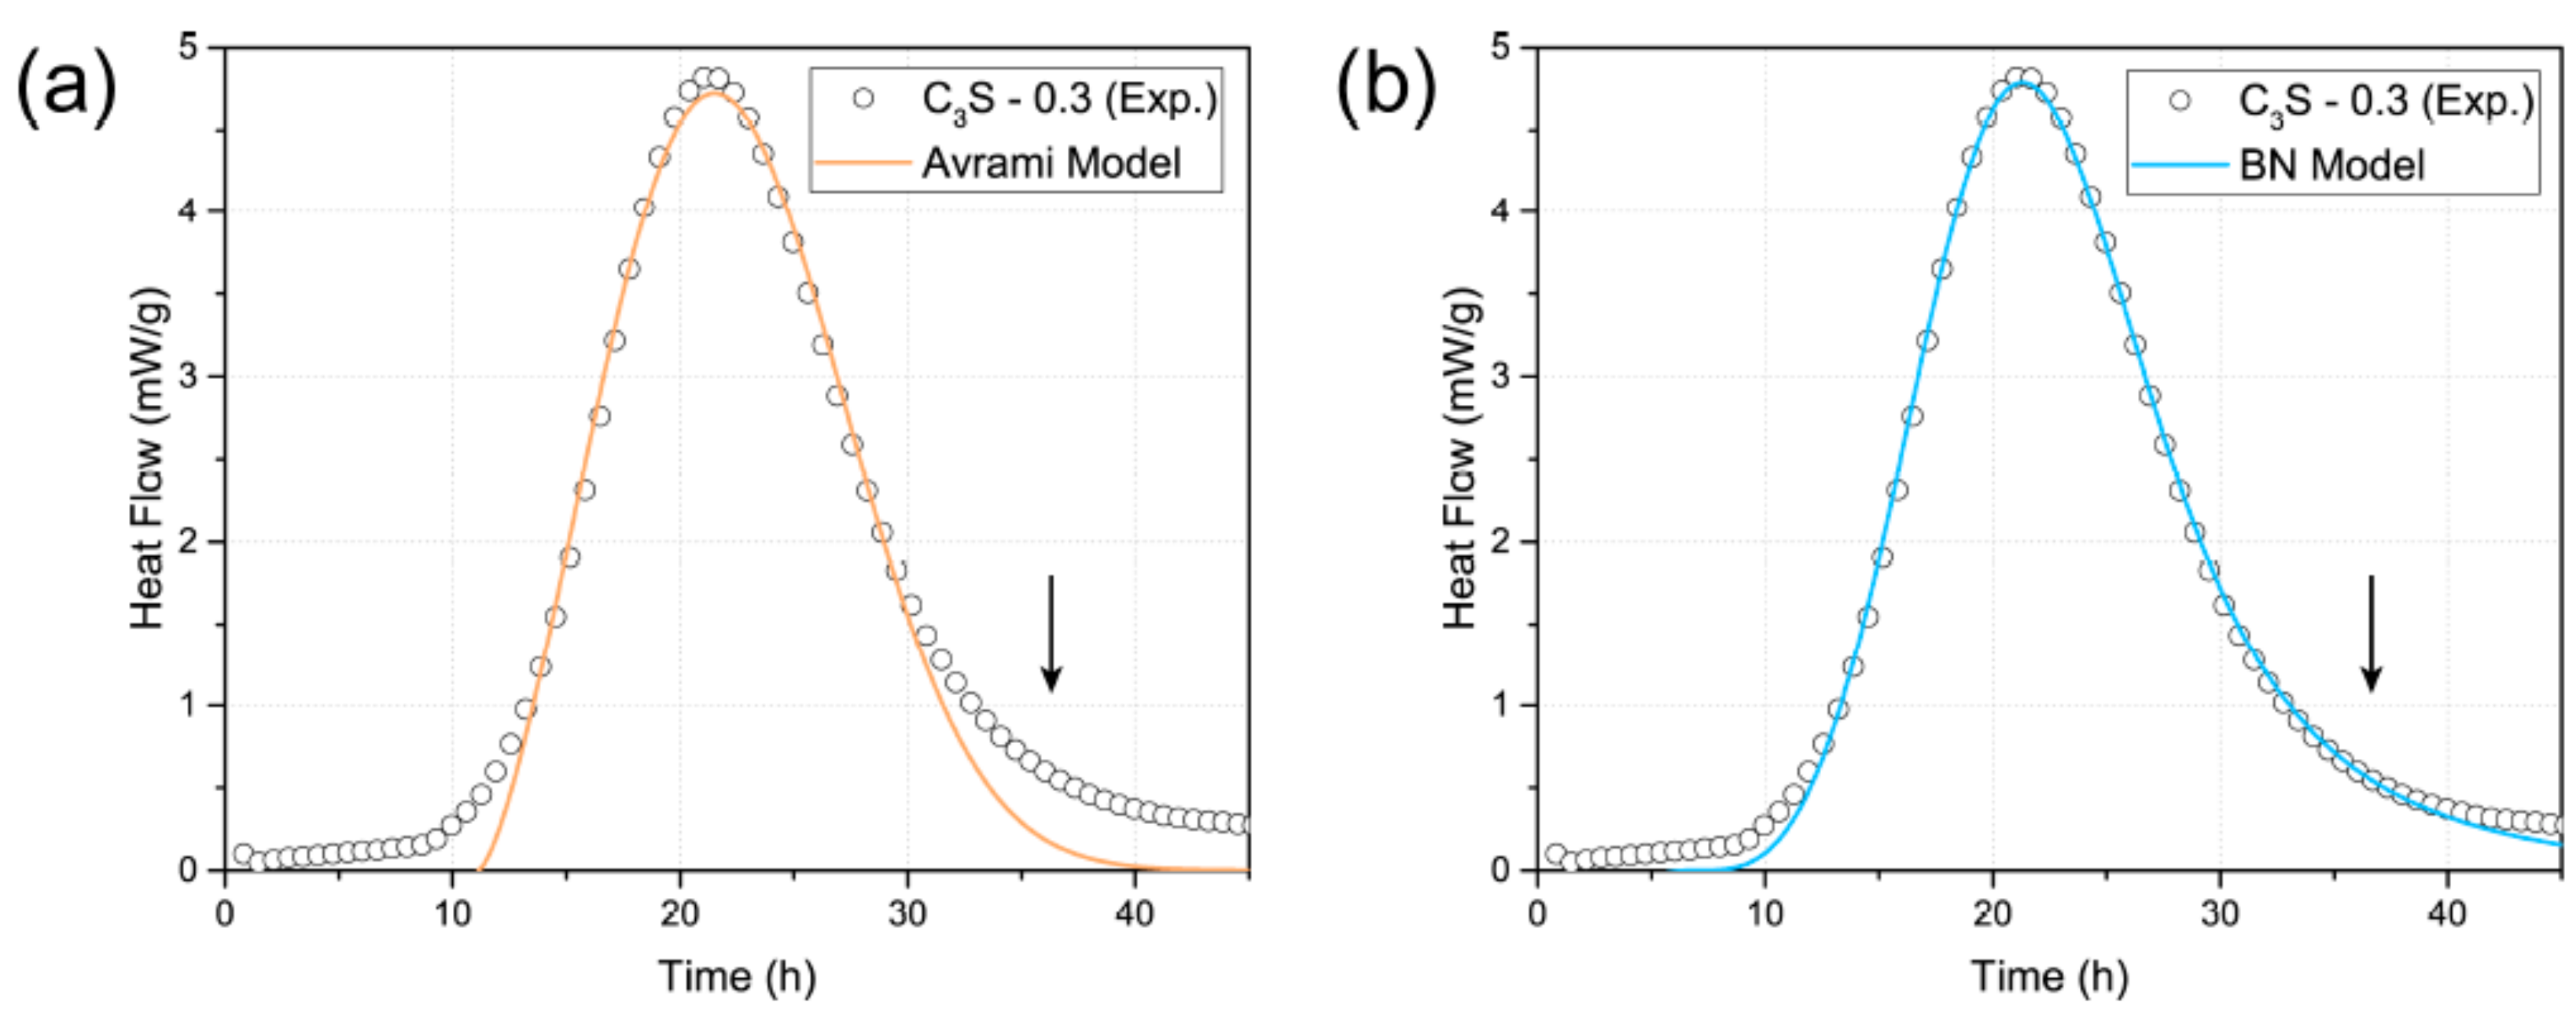
| Specimen | A (kJ/mol) | t0 (h) | kB (h−1) | kG (h−1) | kB/kG |
|---|---|---|---|---|---|
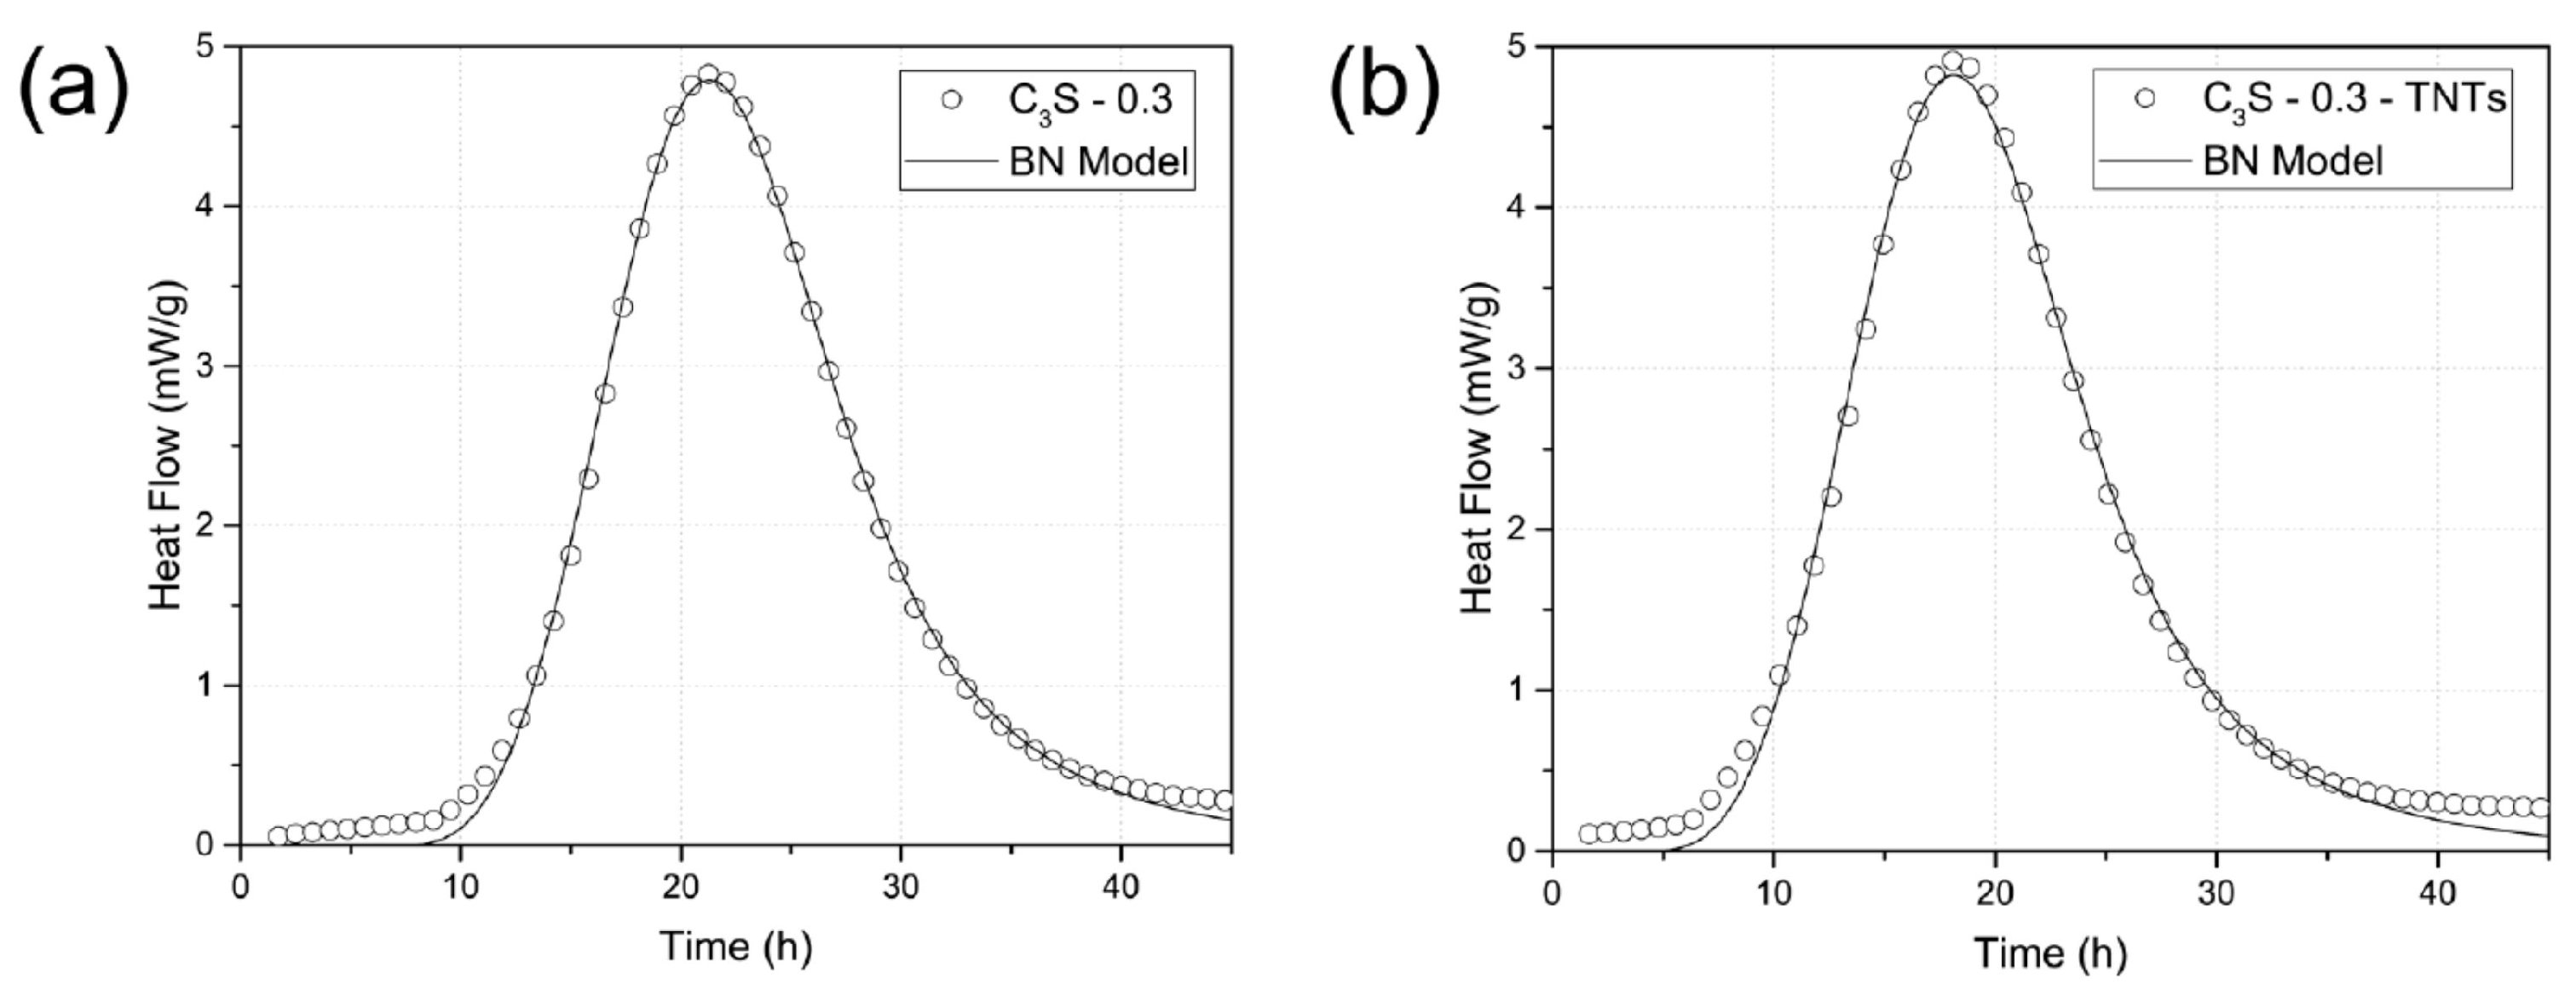
| C3S- 0.3 | 67.47 | 7.12 | 0.06314 | 0.06262 | 1.0083 |
| C3S-0.3-TNTs | 66.76 | 4.19 | 0.06419 | 0.06381 | 1.006 |
© 2019 by the authors. Licensee MDPI, Basel, Switzerland. This article is an open access article distributed under the terms and conditions of the Creative Commons Attribution (CC BY) license (http://creativecommons.org/licenses/by/4.0/).
Share and Cite
Jee, H.; Park, J.; Zalnezhad, E.; Jeong, K.; Woo, S.M.; Seok, S.; Bae, S. Characterization of Titanium Nanotube Reinforced Cementitious Composites: Mechanical Properties, Microstructure, and Hydration. Materials 2019, 12, 1617. https://doi.org/10.3390/ma12101617
Jee H, Park J, Zalnezhad E, Jeong K, Woo SM, Seok S, Bae S. Characterization of Titanium Nanotube Reinforced Cementitious Composites: Mechanical Properties, Microstructure, and Hydration. Materials. 2019; 12(10):1617. https://doi.org/10.3390/ma12101617
Chicago/Turabian StyleJee, Hyeonseok, Jaeyeon Park, Erfan Zalnezhad, Keunhong Jeong, Seung Min Woo, Seungwook Seok, and Sungchul Bae. 2019. "Characterization of Titanium Nanotube Reinforced Cementitious Composites: Mechanical Properties, Microstructure, and Hydration" Materials 12, no. 10: 1617. https://doi.org/10.3390/ma12101617
APA StyleJee, H., Park, J., Zalnezhad, E., Jeong, K., Woo, S. M., Seok, S., & Bae, S. (2019). Characterization of Titanium Nanotube Reinforced Cementitious Composites: Mechanical Properties, Microstructure, and Hydration. Materials, 12(10), 1617. https://doi.org/10.3390/ma12101617