On the Statistical Size Effect of Cast Aluminium


Abstract
1. Introduction
2. Investigated Material
3. Results
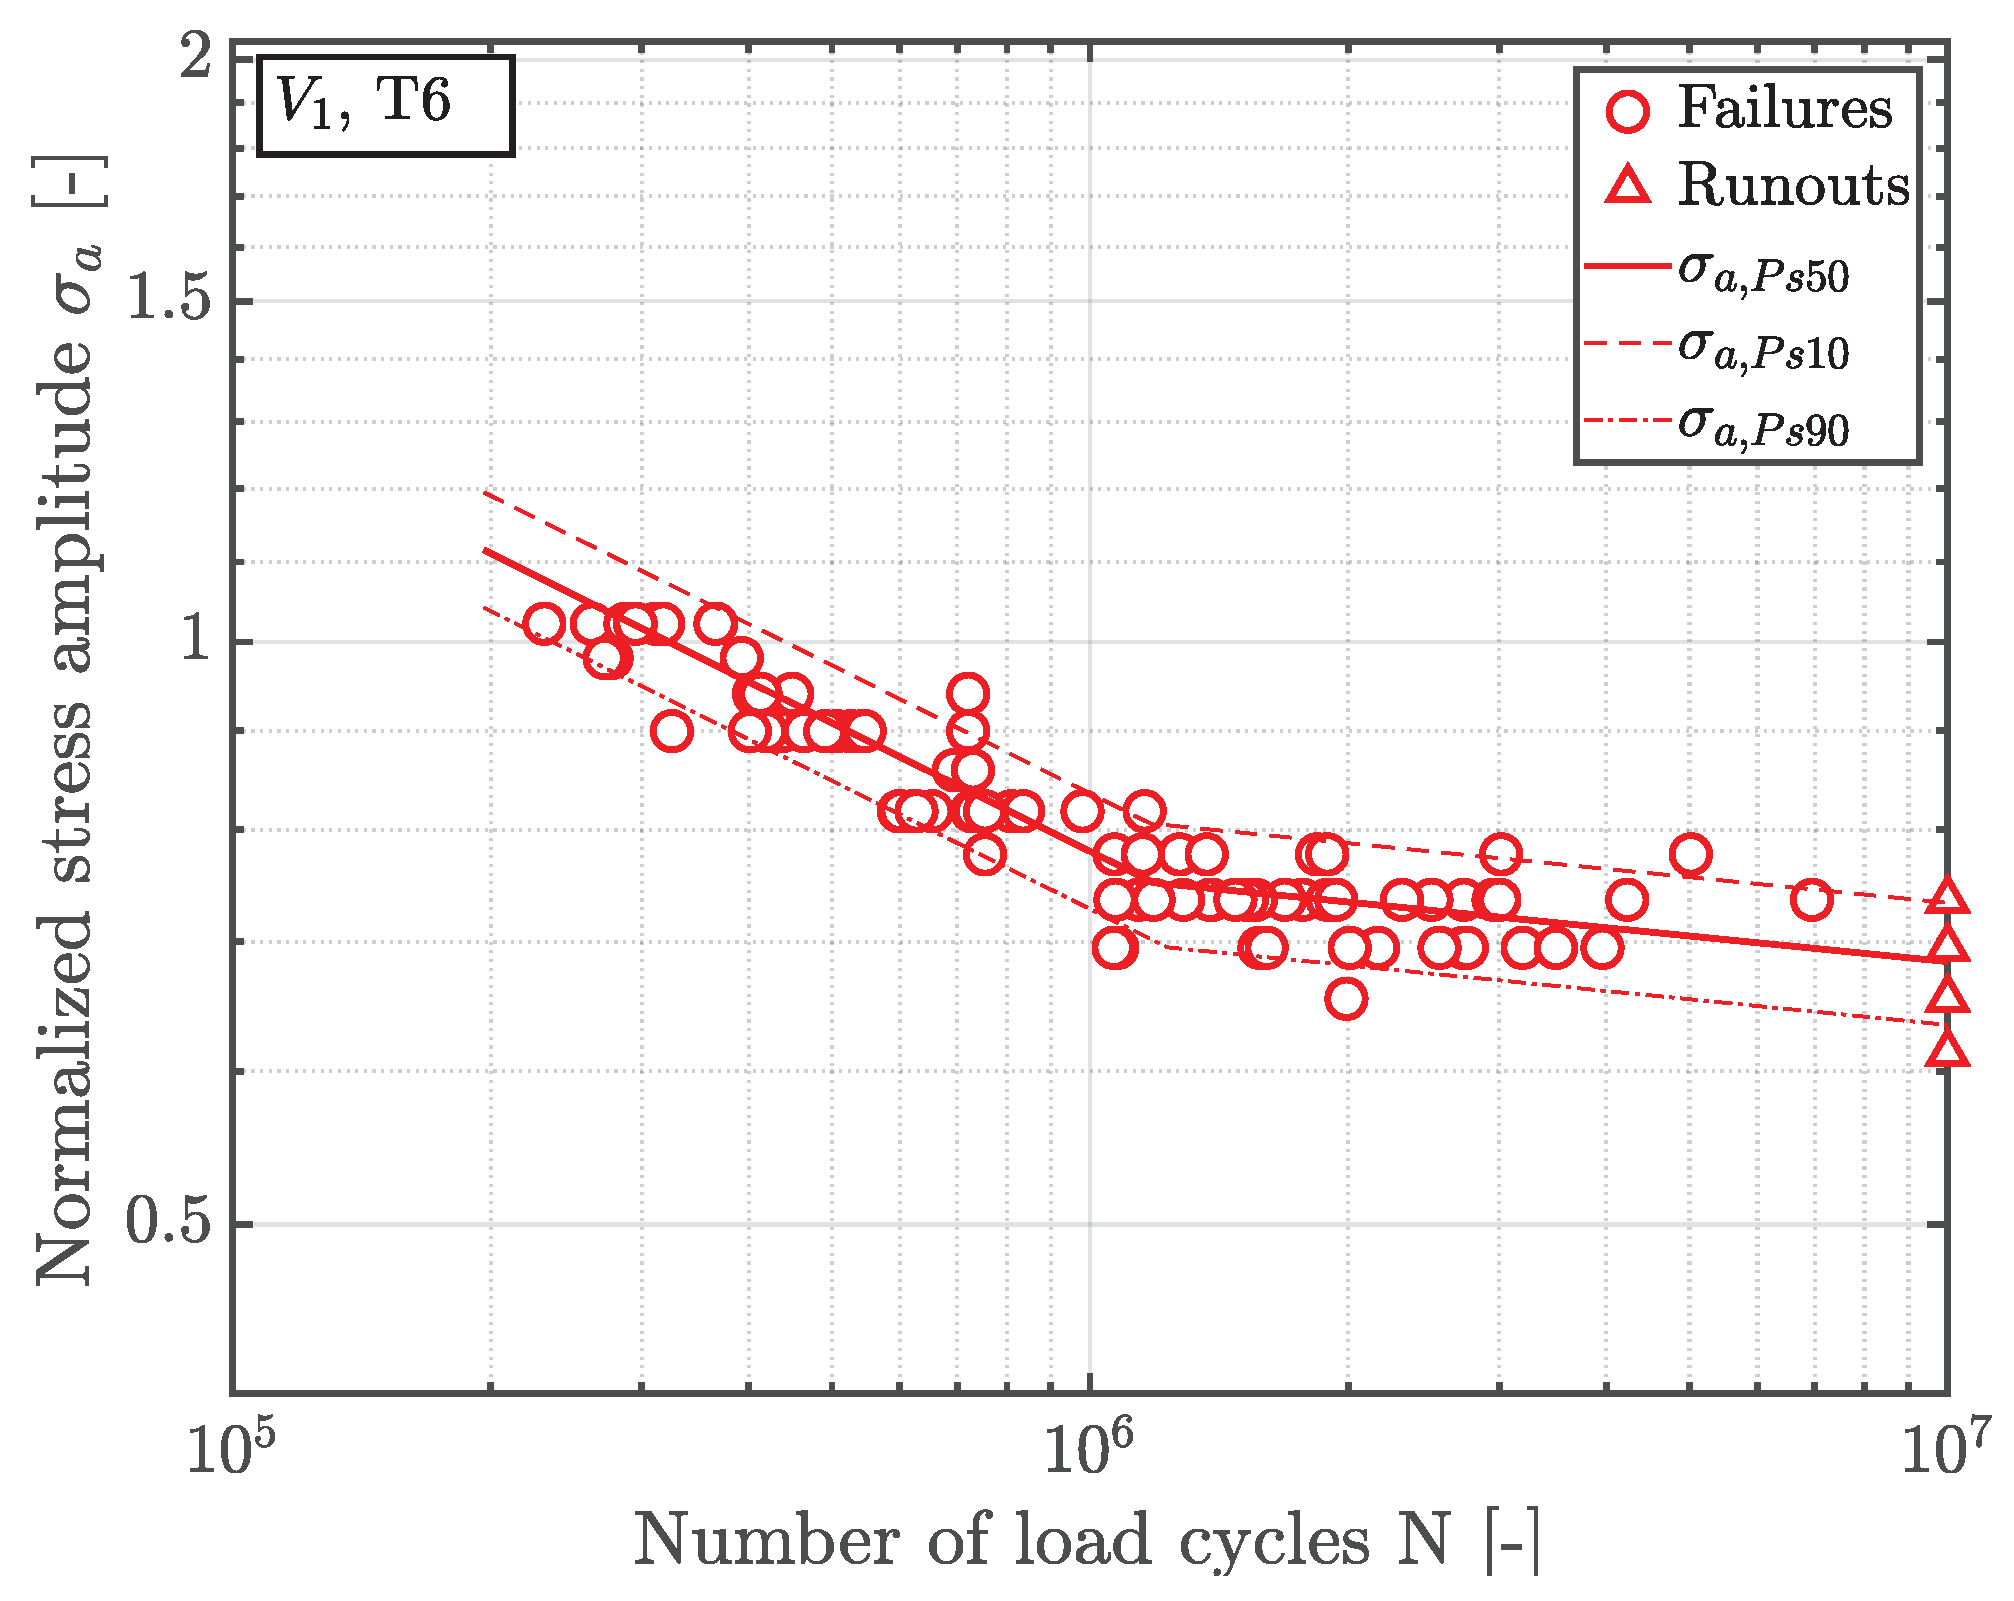
3.1. Fatigue Strength
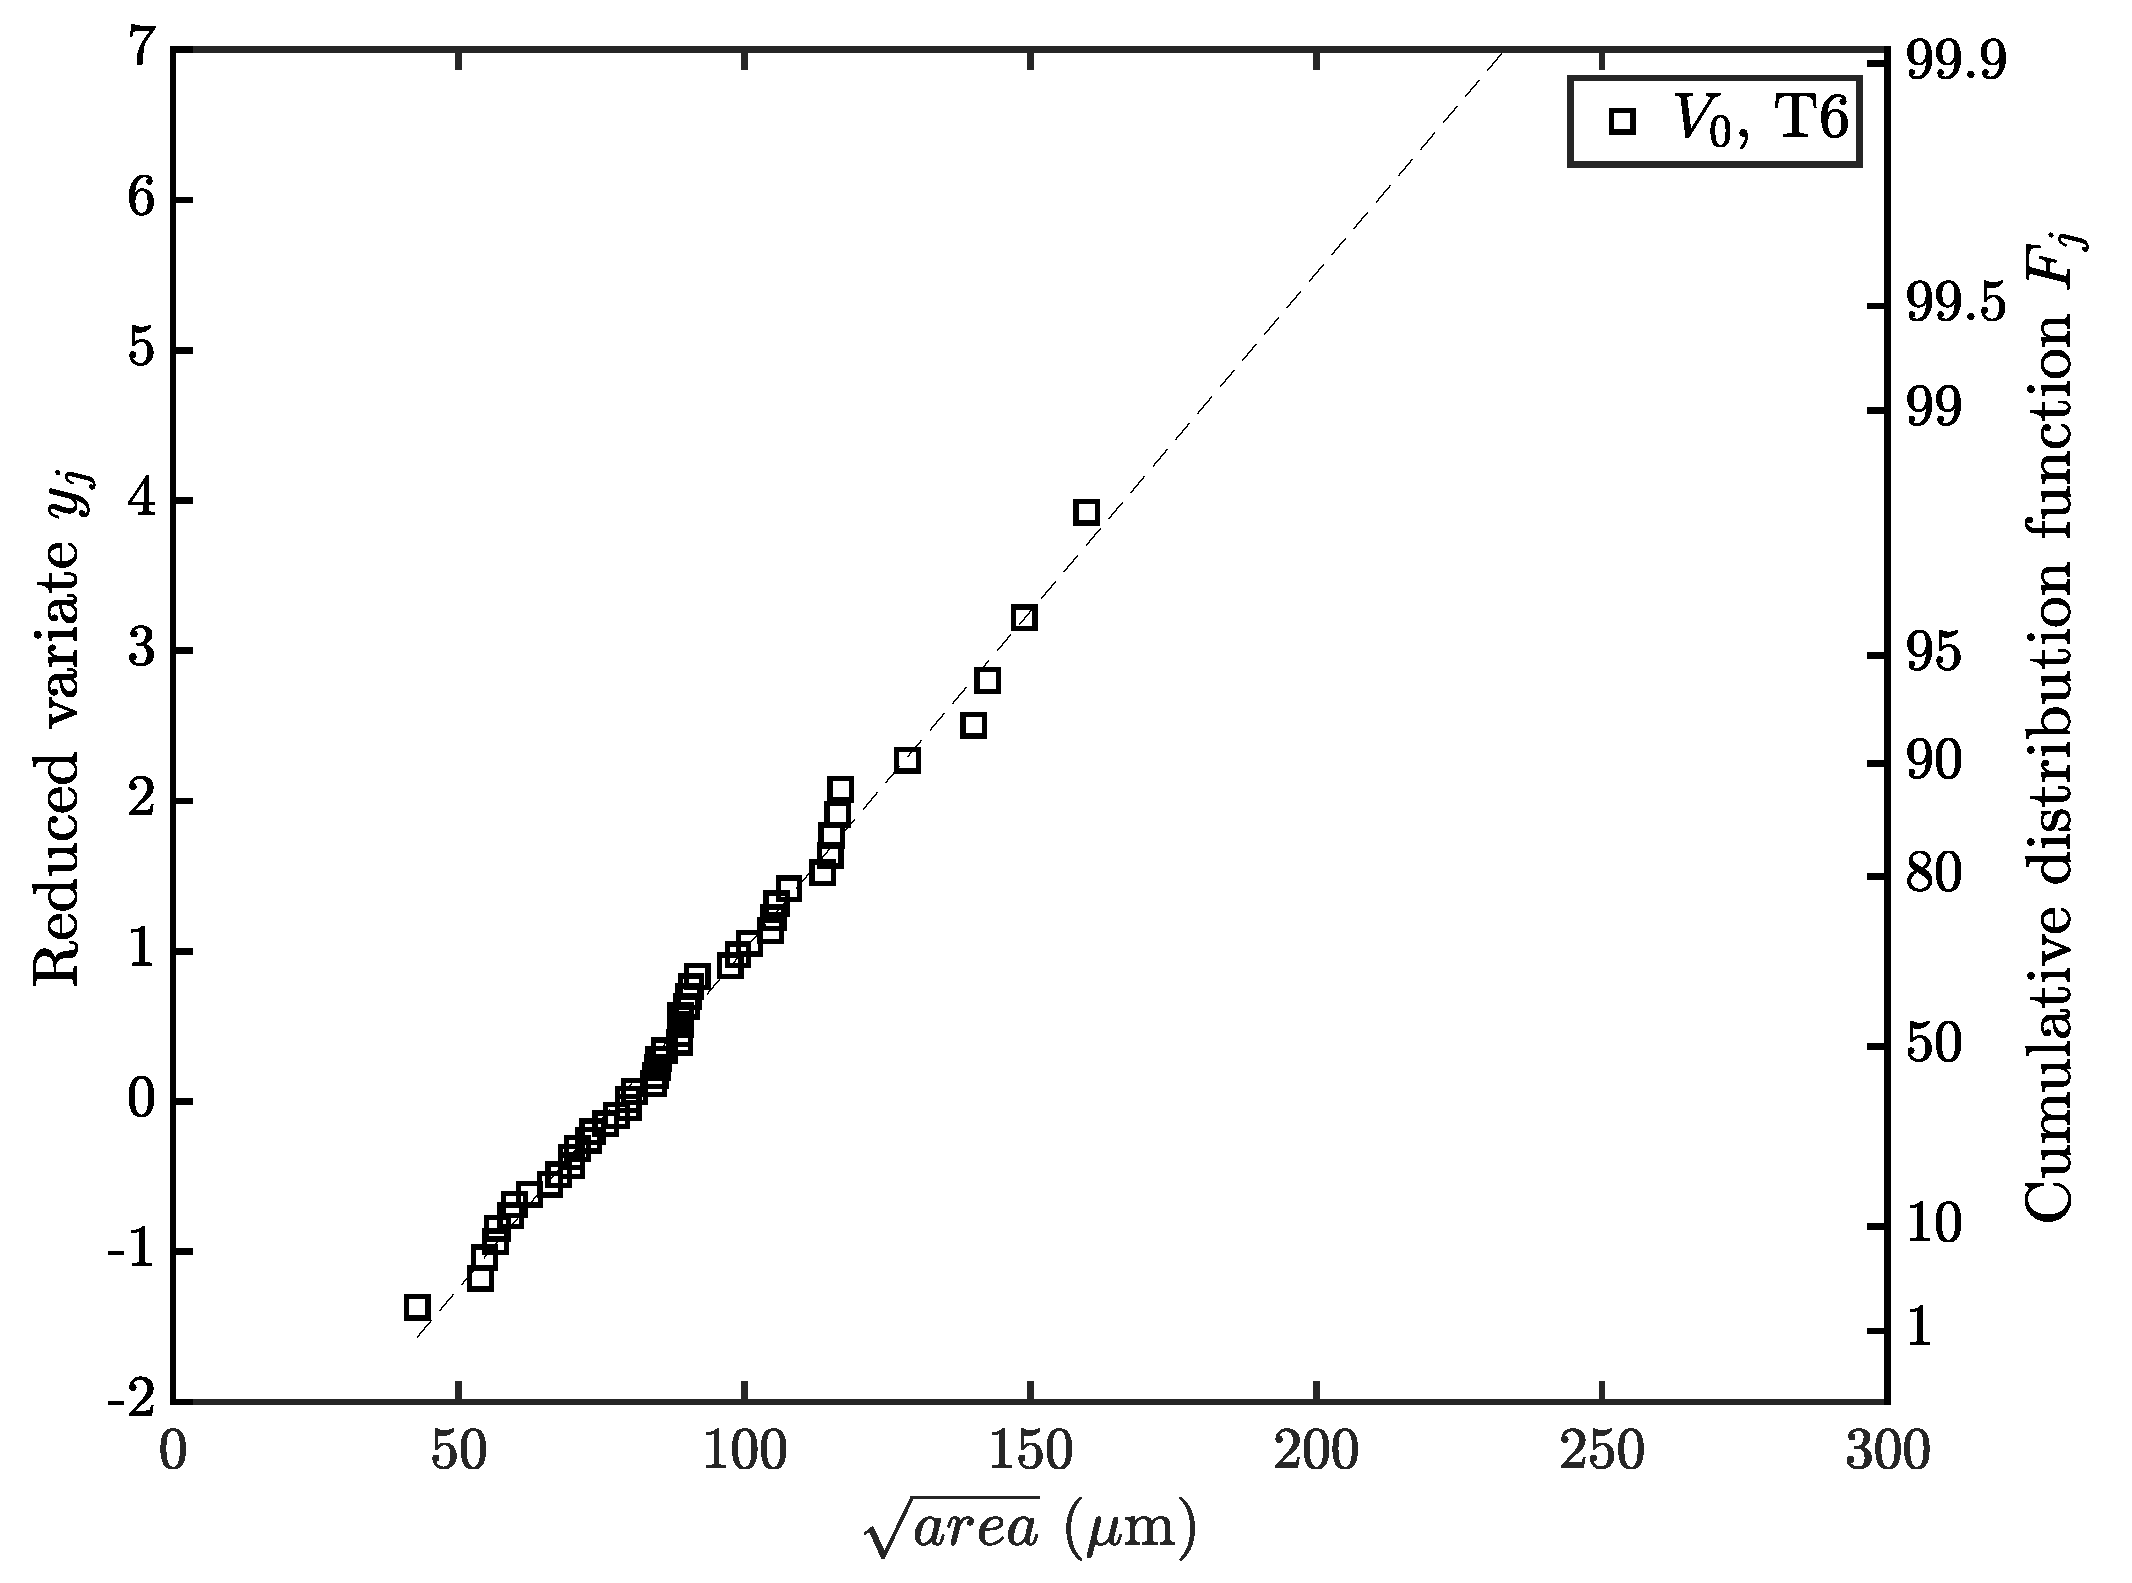
3.2. Fractography
3.3. Fatigue Assessment
4. Conclusions
- The return period possesses a value of approximately ten utilizing the numerically determined highly-stressed volumes of the two specimen geometries A and B.
- Extensive high cycle fatigue tests are statistically evaluated in both the finite as well as the long life region. The fatigue assessment of the empirical HCF data reveals a significant statistical size effect with a decrease in fatigue strength of about in terms of specimen geometry B compared to the reference geometry A.
- The theoretical probability of occurrence of fatigue fracture initiating defect sizes for a given highly-stressed volume is evaluated based on the distribution of critical heterogeneities in a reference volume. The validation of the theoretical distribution with the estimated spatial extents of crack-initiating flaws reveals a minor deviation of just two percent, evaluated for a probability of occurrence of .
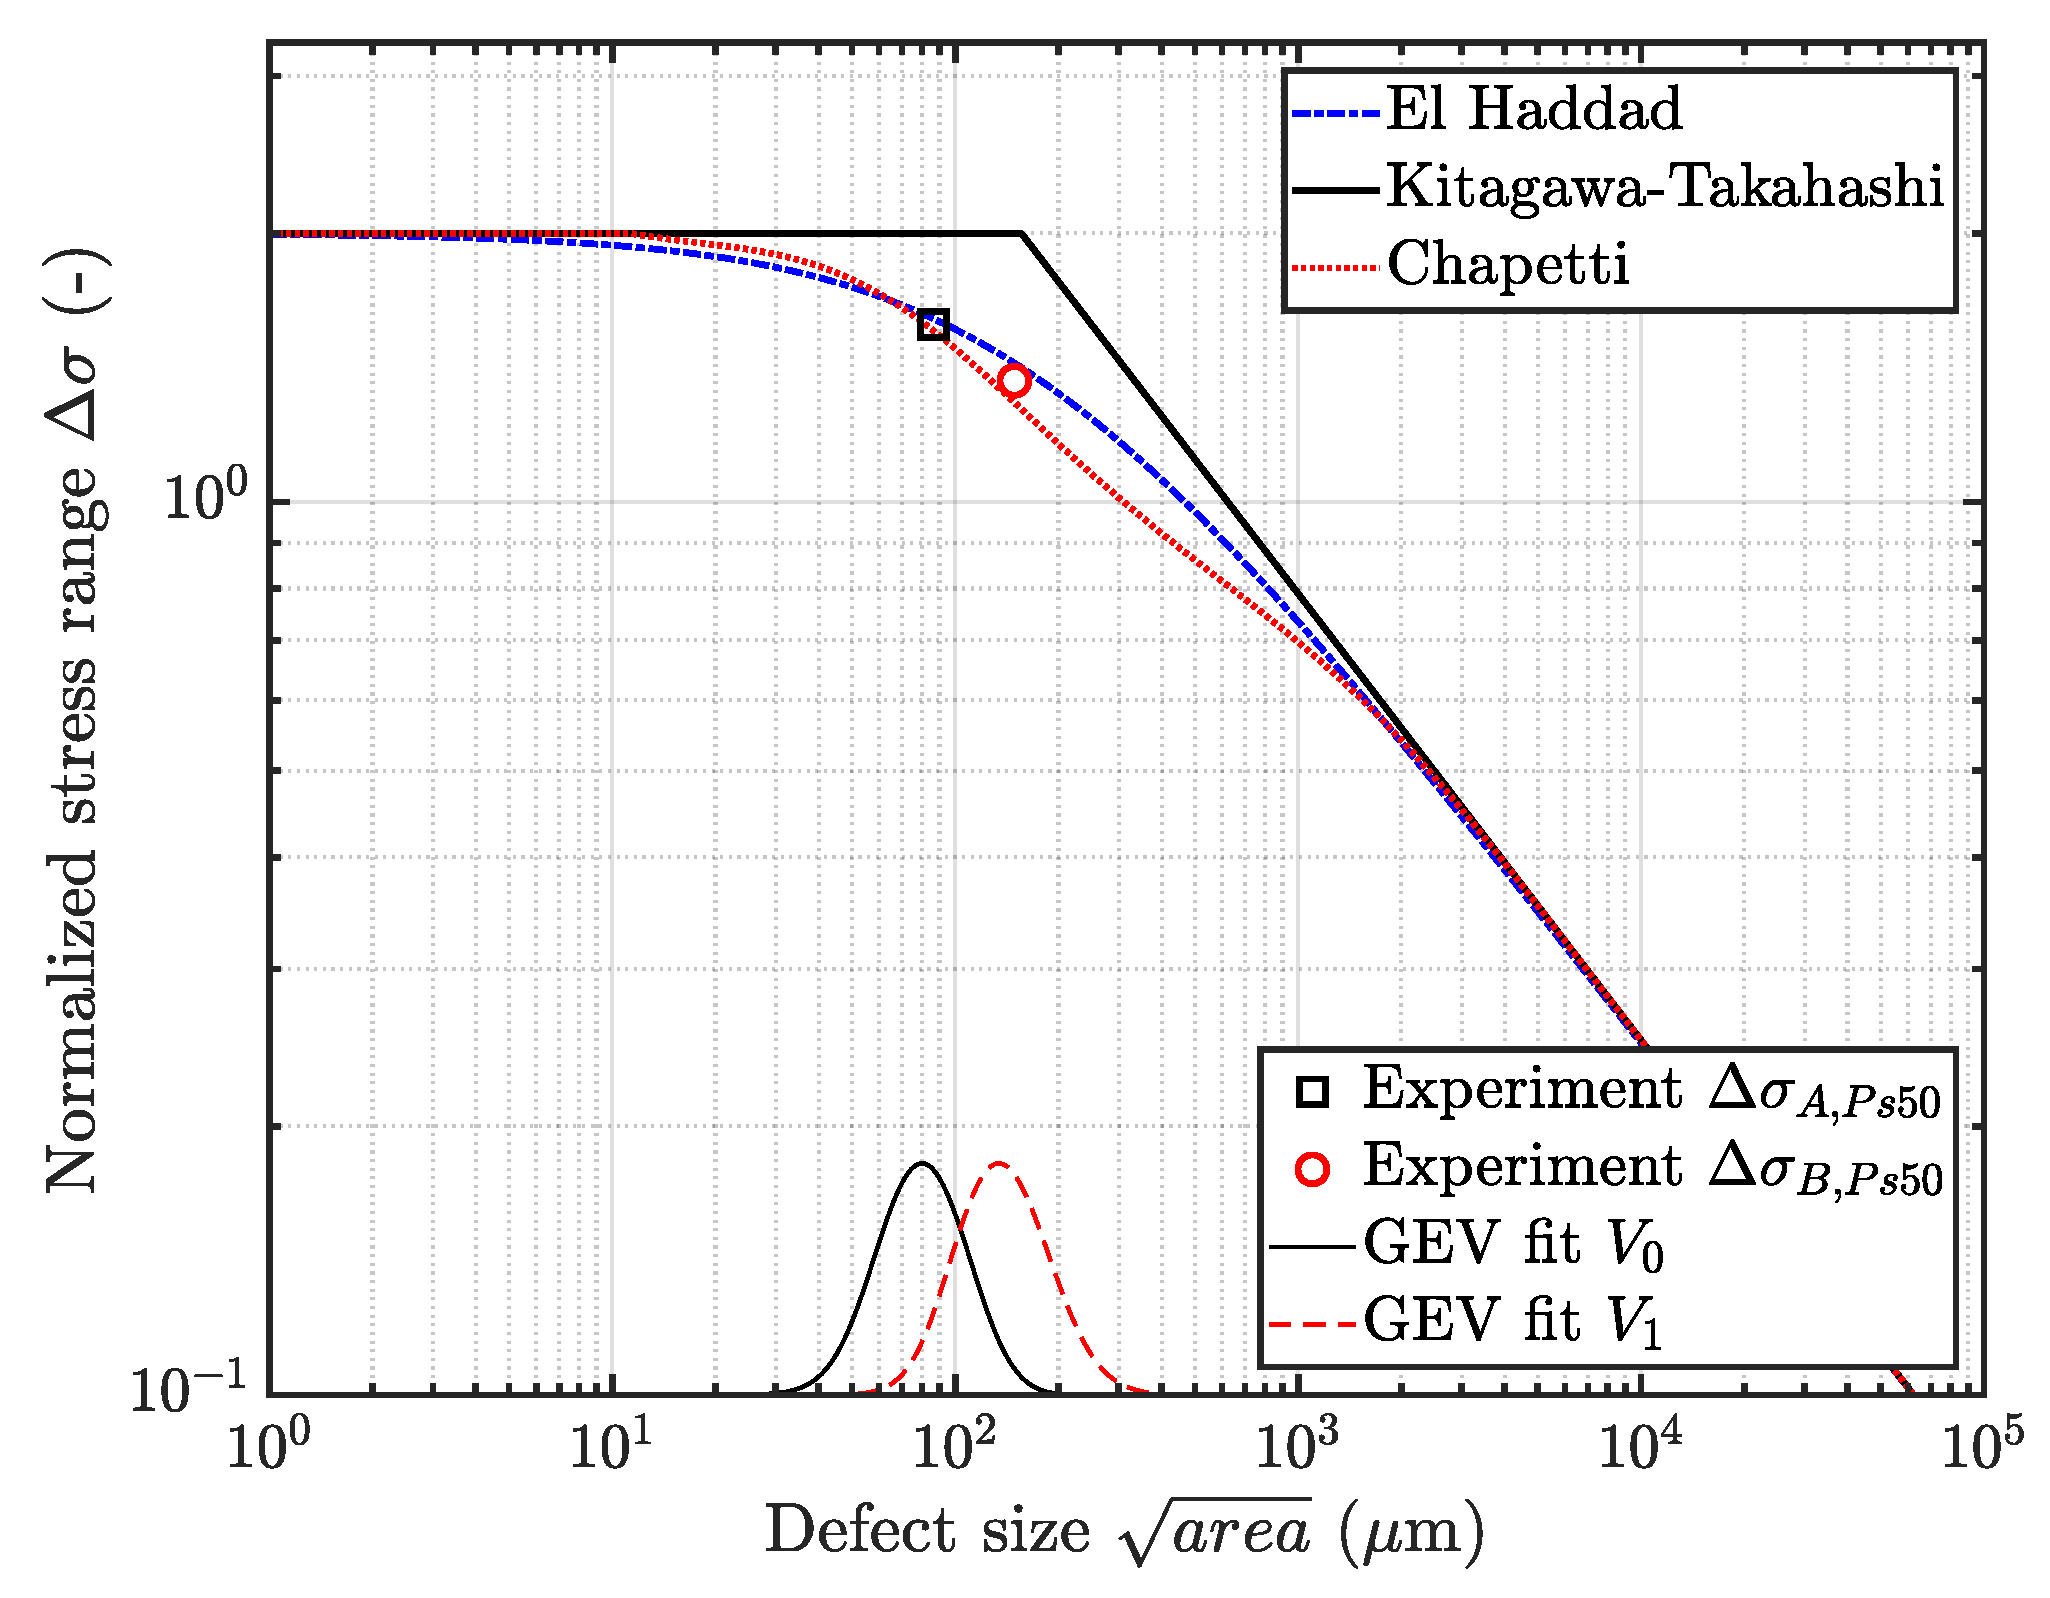
- The defect size at a subsequently acts as equivalent crack size for the fatigue assessment invoking the Kitagawa–Takahashi diagram with respect to its extensions for short crack growth.
- The validation of the defect based probabilistic fatigue assessment model with the empirical fatigue data of both specimen types with varying highly-stressed volumes reveals that the introduced R-curve concept to assess the fatigue strength best has a conservative deviation of just five percent.
Author Contributions
Funding
Acknowledgments
Conflicts of Interest
Abbreviations
| Abbreviation | Description |
| VHCF | Very high cycle fatigue |
| Long-life fatigue strength | |
| Material dependent coefficients of the Kuguel approach | |
| 95% highly-stressed volume | |
| 90% highly-stressed volume | |
| Weibull coefficient | |
| Threshold volume | |
| Fatigue strength range of the defect free material | |
| Long crack threshold | |
| Y | Geometry factor |
| a | Crack length |
| KTD | Kitagawa–Takahashi diagram |
| Effective crack threshold | |
| Crack extension | |
| Stress intensity factor range | |
| Maximum stress intensity factor | |
| Minimum stress intensity factor | |
| Effective stress intensity factor range | |
| Opening stress intensity factor | |
| Crack threshold range in respect of the crack extension | |
| Weighting factor for crack closure effects | |
| Necessary crack elongation for complete build-up of crack closure | |
| Defect size parameter | |
| LN | Lognormal distribution |
| EV | Extreme Value distribution type one |
| GEV | Generalized Extreme Value distribution |
| Cumulative distribution function | |
| Location parameter of the GEV | |
| Scale parameter of the GEV | |
| Shape parameter of the GEV | |
| Probability of occurrence | |
| Reference volume | |
| Extreme value inclusion rating | |
| Control volume | |
| T | Return period |
| Cumulative probability | |
| j | Index variable |
| n | Maximum index variable |
| Reduced variate | |
| HV | Vickers hardness |
| Coefficients of Murakami’s concept | |
| HIP | Hot isostatic pressing |
| DAS | Dendrite arm spacing |
| Length of constant specimen diameter | |
| HCF | High cycle fatigue |
| Slope of S/N-curve in finite life region | |
| Slope of S/N-curve in long-life region | |
| Number of load cycles for transition point | |
| Scatter band in the long-life region | |
| Experimentally evaluated Weibull factor | |
| Probability of survival | |
| Return period of reference volume | |
| p-Value of Kolmogorov-Smirnov test | |
| Defect size with a probability of occurrence of 50% | |
| Reference defect distribution location parameter | |
| Deviation of model to experiment |
References
- Hertel, O.; Vormwald, M. Statistical and geometrical size effects in notched members based on weakest-link and short-crack modelling. Eng. Fract. Mech. 2012, 95, 72–83. [Google Scholar] [CrossRef]
- Makkonen, M. Statistical size effect in the fatigue limit of steel. Int. J. Fatigue 2001, 23, 395–402. [Google Scholar] [CrossRef]
- Bazios, I.; Gudladt, H.J. The fatigue lifetime estimation in consideration of the statistical size effect as example for the AlMgSi0,7 alloy. Materialwiss. Werkstofftech. 2004, 35, 21–28. [Google Scholar] [CrossRef]
- Leitner, M.; Garb, C.; Remes, H.; Stoschka, M. Microporosity and statistical size effect on the fatigue strength of cast aluminium alloys EN AC-45500 and 46200. Mater. Sci. Eng. A 2017, 707, 567–575. [Google Scholar] [CrossRef]
- Kloos, K.H.; Buch, A.; Zankov, D. Pure Geometrical Size Effect in Fatigue Tests with Constant Stress Amplitude and in Programme Tests. Materialwiss. Werkstofftech. 1981, 12, 40–50. [Google Scholar] [CrossRef]
- Taylor, D. Geometrical effects in fatigue: A unifying theoretical model. Int. J. Fatigue 1999, 21, 413–420. [Google Scholar] [CrossRef]
- Savaidis, G.; Savaidis, A.; Tsamasphyros, G.; Zhang, C. On size and technological effects in fatigue analysis and prediction of engineering materials and components. Inter. J. Mech. Sci. 2002, 44, 521–543. [Google Scholar] [CrossRef]
- Shirani, M.; Härkegård, G. Fatigue life distribution and size effect in ductile cast iron for wind turbine components. Eng. Failure Anal. 2011, 18, 12–24. [Google Scholar] [CrossRef]
- Pavlov, V.F.; Kirpichev, V.A.; Vakulyuk, V.S.; Sazanov, V.P. Surface hardening influence on the fatigue limit for cylindrical parts of different diameter. Russ. Aeronaut. 2014, 57, 324–326. [Google Scholar] [CrossRef]
- Griffith, A.A. The Phenomena of Rupture and Flow in Solids. Philos. Trans. R. Soc. Math. Phys. Eng. Sci. 1921, 221, 163–198. [Google Scholar] [CrossRef]
- Weibull, W. Zur Abhängigkeit der Festigkeit von der Probengröße. Arch. Appl. Mech. 1959, 28, 360–362. [Google Scholar]
- Carpinteri, A. Decrease of apparent tensile and bending strength with specimen size: Two different explanations based on fracture mechanics. Inter. J. Solids Struct. 1989, 25, 407–429. [Google Scholar] [CrossRef]
- Heckel, K.; Köhler, J.; München, T. Experimental Investigation of the Statistical Size-Effect in Fatigue Tests with Unnotched Specimens. Materialwiss. Werkstofftech. 1975, 6, 52–54. [Google Scholar] [CrossRef]
- Furuya, Y. Notable size effects on very high cycle fatigue properties of high-strength steel. Mater. Sci. Eng. A 2011, 528, 5234–5240. [Google Scholar] [CrossRef]
- Carpinteri, A.; Spagnoli, A.; Vantadori, S. An approach to size effect in fatigue of metals using fractal theories. Fract. Eng. Mater. Struct. 2002, 25, 619–627. [Google Scholar] [CrossRef]
- Carpinteri, A.; Puzzi, S. A fractal approach to indentation size effect. Eng. Fract. Mech. 2006, 73, 2110–2122. [Google Scholar] [CrossRef]
- Carpinteri, A.; Puzzi, S. The fractal-statistical approach to the size-scale effects on material strength and toughness. Probab. Eng. Mech. 2009, 24, 75–83. [Google Scholar] [CrossRef]
- Basquin, O.H. The exponential law of endurance tests. Am Soc. Test. Mater. Proc. 1910, 10, 625–630. [Google Scholar]
- Kuguel, R. A relation between theoretical stress concentration factor and fatigue notch factor deduced from the concept of highly stressed volume. Proc. ASTM 1961, 61, 732–748. [Google Scholar]
- Diemar, A.; Thumser, R.; Bergmann, J.W. Statistischer Größeneinfluss und Bauteilfestigkeit. Mater. Test. 2004, 46, 16–21. [Google Scholar] [CrossRef]
- Sonsino, C.M. Zur Bewertung des Schwingfestigkeitsverhaltens von Bauteilen mit Hilfe örtlicher Beanspruchungen. Konstruktion 1993, 45, 25–33. [Google Scholar]
- Rennert, R.; Maschinenbau, F.F. Rechnerischer Festigkeitsnachweis für Maschinenbauteile aus Stahl, Eisenguss- und Aluminiumwerkstoffen, 6th ed.; FKM-Richtlinie, VDMA-Verl.: Frankfurt am Main, Germany, 2012. [Google Scholar]
- Sonsino, C.M.; Ziese, J. Fatigue strength and applications of cast aluminium alloys with different degrees of porosity. Int. J. Fatigue 1993, 15, 75–84. [Google Scholar] [CrossRef]
- Böhm, J.; Heckel, K. The Prediction of the Fatigue Strength with Regard to the Statistical Size Effect. Materialwiss. Werkstofftech. 1982, 13, 120–128. [Google Scholar] [CrossRef]
- Kuwazuru, O.; Murata, Y.; Hangai, Y.; Utsunomiya, T.; Kithara, S.; Yoshikawa, N. X-Ray CT Inspection for Porosities and Its Effect on Fatigue of Die Cast Aluminium Alloy. J. Solid Mech. Mater. Eng. 2008, 2, 1220–1231. [Google Scholar] [CrossRef]
- Rotella, A.; Nadot, Y.; Piellard, M.; Augustin, R.; Fleuriot, M. Fatigue limit of a cast Al-Si-Mg alloy (A357-T6) with natural casting shrinkages using ASTM standard X-ray inspection. Int. J. Fatigue 2018, 114, 177–188. [Google Scholar] [CrossRef]
- González, R.; González, A.; Talamantes-Silva, J.; Valtierra, S.; Mercado-Solís, R.D.; Garza-Montes-de Oca, N.F.; Colás, R. Fatigue of an aluminium cast alloy used in the manufacture of automotive engine blocks. Int. J. Fatigue 2013, 54, 118–126. [Google Scholar] [CrossRef]
- González, R.; Martínez, D.I.; González, J.A.; Talamantes, J.; Valtierra, S.; Colás, R. Experimental investigation for fatigue strength of a cast aluminium alloy. Int. J. Fatigue 2011, 33, 273–278. [Google Scholar] [CrossRef]
- Gänser, H.P. Some notes on gradient, volumetric and weakest link concepts in fatigue. Comput. Mater. Sci. 2008, 44, 230–239. [Google Scholar] [CrossRef]
- Abroug, F.; Pessard, E.; Germain, G.; Morel, F.; Hénaff, G. Fatigue size effect due to defects in an AA7050 alloy. MATEC Web Conf. 2018, 165, 14015. [Google Scholar] [CrossRef]
- Abroug, F.; Pessard, E.; Germain, G.; Morel, F. A probabilistic approach to study the effect of machined surface states on HCF behavior of a AA7050 alloy. Int. J. Fatigue 2018, 116, 473–489. [Google Scholar] [CrossRef]
- Kitagawa, H.; Takahashi, S. Applicability of fracture mechanics to very small cracks or the cracks in the early stage. In Proceedings of the 2nd International Conference on Mechanical Behaviour of Materials, Boston, MA, USA, 16–20 August 1976; pp. 627–631. [Google Scholar]
- Garb, C.; Leitner, M.; Stauder, B.; Schnubel, D.; Grün, F. Application of modified Kitagawa-Takahashi diagram for fatigue strength assessment of cast Al-Si-Cu alloys. Int. J. Fatigue 2018, 111, 256–268. [Google Scholar] [CrossRef]
- Iben Houria, M.; Nadot, Y.; Fathallah, R.; Roy, M.; Maijer, D.M. Influence of casting defect and SDAS on the multiaxial fatigue behaviour of A356-T6 alloy including mean stress effect. Int. J. Fatigue 2015, 80, 90–102. [Google Scholar] [CrossRef]
- Tenkamp, J.; Koch, A.; Knorre, S.; Krupp, U.; Michels, W.; Walther, F. Defect-correlated fatigue assessment of A356-T6 aluminum cast alloy using computed tomography based Kitagawa-Takahashi diagrams. Int. J. Fatigue 2018, 108, 25–34. [Google Scholar] [CrossRef]
- Roy, M.J.; Nadot, Y.; Nadot-Martin, C.; Bardin, P.G.; Maijer, D.M. Multiaxial Kitagawa analysis of A356-T6. Int. J. Fatigue 2011, 33, 823–832. [Google Scholar] [CrossRef]
- Aigner, R.; Pusterhofer, S.; Pomberger, S.; Leitner, M.; Stoschka, M. A probabilistic Kitagawa-Takahashi diagram for fatigue strength assessment of cast aluminium alloys. Mater. Sci. Eng. A 2019, 745, 326–334. [Google Scholar] [CrossRef]
- Radaj, D. Geometry correction for stress intesity at elliptical cracks. Weld. Cut. 1977, 29, 198–402. [Google Scholar]
- Groza, M.; Nadot, Y.; Varadi, K. Defect size map for nodular cast iron components with ellipsoidal surface defects based on the defect stress gradient approach. Int. J. Fatigue 2018, 112, 206–215. [Google Scholar] [CrossRef]
- El Haddad, M.H.; Smith, K.N.; Topper, T.H. Fatigue Crack Propagation of Short Cracks. J. Eng. Mater. Technol. 1979, 101, 42. [Google Scholar] [CrossRef]
- El Haddad, M.H.; Topper, T.H.; Smith, K.N. Prediction of non propagating cracks. Eng. Fract. Mech. 1979, 11, 573–584. [Google Scholar] [CrossRef]
- Chapetti, M.D. Fatigue propagation threshold of short cracks under constant amplitude loading. Int. J. Fatigue 2003, 25, 1319–1326. [Google Scholar] [CrossRef]
- Zerbst, U.; Vormwald, M.; Pippan, R.; Gänser, H.P.; Sarrazin-Baudoux, C.; Madia, M. About the fatigue crack propagation threshold of metals as a design criterion—A review. Eng. Fract. Mech. 2016, 153, 190–243. [Google Scholar] [CrossRef]
- Suresh, S.; Ritchie, R.O. A geometric model for fatigue crack closure induced by fracture surface roughness. Metall. Trans. A 1982, 13, 1627–1631. [Google Scholar] [CrossRef]
- Wasén, J.; Heier, E. Fatigue crack growth thresholds—the influence of Young’s modulus and fracture surface roughness. Int. J. Fatigue 1998, 20, 737–742. [Google Scholar] [CrossRef]
- Elber, W. Fatigue crack closure under cyclic tension. Eng. Fract. Mech. 1970, 2, 37–45. [Google Scholar] [CrossRef]
- Kim, J.H.; Lee, S.B. Behavior of plasticity-induced crack closure and roughness-induced crack closure in aluminum alloy. Int. J. Fatigue 2001, 23, 247–251. [Google Scholar] [CrossRef]
- Suresh, S.; Zamiski, G.F.; Ritchie, D.R.O. Oxide-Induced Crack Closure: An Explanation for Near-Threshold Corrosion Fatigue Crack Growth Behavior. Metall. Mater. Trans. A 1981, 12, 1435–1443. [Google Scholar] [CrossRef]
- Newman, J.A.; Piascik, R.S. Interactions of plasticity and oxide crack closure mechanisms near the fatigue crack growth threshold. Int. J. Fatigue 2004, 26, 923–927. [Google Scholar] [CrossRef]
- McEvily, A.J.; Endo, M.; Murakami, Y. On the relationship and the short fatigue crack threshold. Fatigue Fract. Eng. Mater. Struct. 2003, 26, 269–278. [Google Scholar] [CrossRef]
- Maierhofer, J.; Pippan, R.; Gänser, H.P. Modified NASGRO equation for physically short cracks. Int. J. Fatigue 2014, 59, 200–207. [Google Scholar] [CrossRef]
- Ishihara, S.; Sugai, Y.; McEvily, A.J. On the Distinction Between Plasticity- and Roughness-Induced Fatigue Crack Closure. Metall. Mater. Trans. A 2012, 43, 3086–3096. [Google Scholar] [CrossRef]
- Aigner, R.; Leitner, M.; Stoschka, M. On the mean stress sensitivity of cast aluminium considering imperfections. Mater. Sci. Eng. A 2019. [Google Scholar] [CrossRef]
- Kolitsch, S.; Gänser, H.P.; Maierhofer, J.; Pippan, R. Fatigue crack growth threshold as a design criterion - statistical scatter and load ratio in the Kitagawa-Takahashi diagram. IOP Conf. Ser. Mater. Sci. Eng. 2016, 119, 012015. [Google Scholar] [CrossRef]
- Murakami, Y.; Endo, M. Effects of defects, inclusions and inhomogeneities on fatigue strength. Int. J. Fatigue 1994, 16, 163–182. [Google Scholar] [CrossRef]
- Li, P.; Lee, P.D.; Maijer, D.M.; Lindley, T.C. Quantification of the interaction within defect populations on fatigue behavior in an aluminum alloy. Acta Mater. 2009, 57, 3539–3548. [Google Scholar] [CrossRef]
- Aigner, R.; Leitner, M.; Stoschka, M. Fatigue strength characterization of Al-Si cast material incorporating statistical size effect. MATEC Web Conf. 2018, 165, 14002. [Google Scholar] [CrossRef]
- Aigner, R.; Garb, C.; Leitner, M.; Stoschka, M.; Grün, F. Application of a √ area -Approach for Fatigue Assessment of Cast Aluminum Alloys at Elevated Temperature. Metals 2018, 8, 1033. [Google Scholar] [CrossRef]
- Aigner, R.; Leitner, M.; Stoschka, M.; Hannesschläger, C.; Wabro, T.; Ehart, R. Modification of a Defect-Based Fatigue Assessment Model for Al-Si-Cu Cast Alloys. Materials 2018, 11, 2546. [Google Scholar] [CrossRef] [PubMed]
- Tiryakioğlu, M. On the size distribution of fracture-initiating defects in Al- and Mg-alloy castings. Mater. Sci. Eng. A 2008, 476, 174–177. [Google Scholar] [CrossRef]
- Anderson, K.V.; Daniewicz, S.R. Statistical analysis of the influence of defects on fatigue life using a Gumbel distribution. Int. J. Fatigue 2018, 112, 78–83. [Google Scholar] [CrossRef]
- Gumbel, E.J. Statistics of Extremes; Columbia University Press: New York, NY, USA, 1958. [Google Scholar]
- Gnedenko, B. Sur la distribution limite du terme maximum d’une serie aleatoire. Ann. Math. 1943, 44. [Google Scholar] [CrossRef]
- Jenkinson, A.F. The frequency distribution of the annual maximum (or minimum) values of meteorological elements. Q. J. R. Meteorolog. Soc. 1955, 87, 145–158. [Google Scholar] [CrossRef]
- Tiryakioğlu, M. Statistical distributions for the size of fatigue-initiating defects in Al–7%Si–0.3%Mg alloy castings: A comparative study. Mater. Sci. Eng. A 2008, 497, 119–125. [Google Scholar] [CrossRef]
- Beretta, S.; Murakami, Y. Statistical analysis of defects for fatigue strength prediction and quality control of materials. Fatigue Fract. Eng. Mater. Struct. 1998, 21, 1049–1065. [Google Scholar] [CrossRef]
- Raynal-Villasenor, J.A.; Raynal-Gutierrez, M.E. Estimation procedures for the GEV distribution for the minima. J. Hydrol. 2014, 519, 512–522. [Google Scholar] [CrossRef]
- Murakami, Y. Metal Fatigue: Effects of Small Defects and Nonmetallic Inclusions; Elsevier: Amsterdam, The Netherlands, 2002. [Google Scholar]
- Murakami, Y. Material defects as the basis of fatigue design. Int. J. Fatigue 2012, 41, 2–10. [Google Scholar] [CrossRef]
- Garb, C.; Leitner, M.; Grün, F. Application of √area-concept to assess fatigue strength of AlSi7Cu0.5Mg casted components. Eng. Fract. Mech. 2017, 185, 61–71. [Google Scholar] [CrossRef]
- DIN EN 1706. Aluminium and Aluminium Alloys-Castings-Chemical Composition and Mechanical Propertie; EN 1706:2010; German version; NSAI: Dublin, Ireland, 2010.
- Vandersluis, E.; Ravindran, C. Comparison of Measurement Methods for Secondary Dendrite Arm Spacing. Metall. Microstruct. Anal. 2017, 6, 89–94. [Google Scholar] [CrossRef]
- Boileau, J.M.; Zindel, J.W.; Allison, J.E. The Effect of Solidification Time on the Mechanical Properties in a Cast A356-T6 Aluminum Alloy. SAE Trans. 1997, 106, 63–74. [Google Scholar]
- Zhang, L.Y.; Jiang, Y.H.; Ma, Z.; Shan, S.F.; Jia, Y.Z.; Fan, C.Z.; Wang, W.K. Effect of cooling rate on solidified microstructure and mechanical properties of aluminium-A356 alloy. J. Mater. Process. Technol. 2008, 207, 107–111. [Google Scholar] [CrossRef]
- Ceschini, L.; Boromei, I.; Morri, A.; Seifeddine, S.; Svensson, I.L. Microstructure, tensile and fatigue properties of the Al–10%Si–2%Cu alloy with different Fe and Mn content cast under controlled conditions. J. Mater. Process. Technol. 2009, 209, 5669–5679. [Google Scholar] [CrossRef]
- Zhang, B.; Chen, W.; Poirier, D.R. Effect of solidification cooling rate on the fatigue life of A356.2-T6 cast aluminium alloy. Fatigue Fract. Eng. Mater. Struct. 2000, 23, 417–423. [Google Scholar] [CrossRef]
- Boileau, J.M.; Allison, J.E. The effect of solidification time and heat treatment on the fatigue properties of a cast 319 aluminum alloy. Metall. Trans. 2003, 34, 1807–1820. [Google Scholar] [CrossRef]
- Leitner, H. Simulation des Ermüdungsverhaltens von Aluminiumgusslegierungen. Ph.D. Thesis, Montanuniversität Leoben, Leoben, Austria, 2001. [Google Scholar]
- ASTM International E 739. Standard Practice for Statistical Analysis of Linear or Linearized Stress-Life (S-N) and Strain Life (E-N) Fatigue Data; ASTM International: West Conshohocken, PA, USA, 1998. [Google Scholar]
- Dengel, D.; Harig, H. Estimation of the fatigue limit by progressively-increasing load tests. Fatigue Fract. Eng. Mater. Struct. 1980, 3, 113–128. [Google Scholar] [CrossRef]
- DIN 50100. Load Controlled Fatigue Testing-Execution and Evaluation of Cyclic Tests at Constant Load Amplitudes on Metallic Specimens and Components; DIN: Berlin, Germany, 2016. [Google Scholar]
- Massey, F.J., Jr. The Kolmogorov-Smirnov test for goodness of fit. J. Am. Stat. Assoc. 1951, 46, 68–78. [Google Scholar] [CrossRef]
- Le, V.D.; Morel, F.; Bellett, D.; Saintier, N.; Osmond, P. Simulation of the Kitagawa-Takahashi diagram using a probabilistic approach for cast Al-Si alloys under different multiaxial loads. Int. J. Fatigue 2016, 93, 109–121. [Google Scholar] [CrossRef]
- Linder, J.; Axelsson, M.; Nilsson, H. The influence of porosity on the fatigue life for sand and permanent mould cast aluminium. Int. J. Fatigue 2006, 28, 1752–1758. [Google Scholar] [CrossRef]
- Makkonen, L.; Rabb, R.; Tikanmäki, M. Size effect in fatigue based on the extreme value distribution of defects. Mater. Sci. Eng. A 2014, 594, 68–71. [Google Scholar] [CrossRef]


| Alloy | Si (%) | Cu (%) | Fe (%) | Mn (%) | Mg (%) | Ti (%) | Al (-) |
|---|---|---|---|---|---|---|---|
| EN AC-46200 | 7.5–8.5 | 2.0–3.5 | 0.8 | 0.15–0.65 | 0.05–0.55 | 0.25 | balance |
| Position | HT | Volume | [-] | [-] | [-] | [-] | |
|---|---|---|---|---|---|---|---|
| A | HIP | 7.10 | 1.00 | 438.627 | 1:1.27 | ||
| A | T6 | 4.70 | 0.79 | 780.732 | 1:1.23 | ||
| B | T6 | 4.54 | 0.68 | 11,184.783 | 1:1.16 |
| Position | Volume | (μm) | ||||
|---|---|---|---|---|---|---|
| A | 78.6 | 21.6 | 0.11 | 86 | ||
| B | 134.6 | 38.6 | 0.01 | 148 | ||
| B | 135.0 | 27.7 | 0.11 | 145 |
| Position | V | Experiment | Volumetric | ElHaddad | Chapetti | Murakami | ||||
|---|---|---|---|---|---|---|---|---|---|---|
| A | 0 | 0.79 | Basis | Basis | 0.80 | +2% | 0.78 | −2% | 0.68 | −14% |
| B | 1 | 0.68 | 0.63 | −8% | 0.72 | +5% | 0.65 | −5% | 0.64 | −7% |
© 2019 by the authors. Licensee MDPI, Basel, Switzerland. This article is an open access article distributed under the terms and conditions of the Creative Commons Attribution (CC BY) license (http://creativecommons.org/licenses/by/4.0/).
Share and Cite
Aigner, R.; Pomberger, S.; Leitner, M.; Stoschka, M. On the Statistical Size Effect of Cast Aluminium. Materials 2019, 12, 1578. https://doi.org/10.3390/ma12101578
Aigner R, Pomberger S, Leitner M, Stoschka M. On the Statistical Size Effect of Cast Aluminium. Materials. 2019; 12(10):1578. https://doi.org/10.3390/ma12101578
Chicago/Turabian StyleAigner, Roman, Sebastian Pomberger, Martin Leitner, and Michael Stoschka. 2019. "On the Statistical Size Effect of Cast Aluminium" Materials 12, no. 10: 1578. https://doi.org/10.3390/ma12101578
APA StyleAigner, R., Pomberger, S., Leitner, M., & Stoschka, M. (2019). On the Statistical Size Effect of Cast Aluminium. Materials, 12(10), 1578. https://doi.org/10.3390/ma12101578