Effect of Oxygen Nonstoichiometry on Electrical Conductivity and Thermopower of Gd0.2Sr0.8FeO3−δ Ferrite Samples

 , , , ,

Abstract
1. Introduction
2. Materials and Methods
3. Results
4. Conclusions
Author Contributions
Funding
Acknowledgments
Conflicts of Interest
References
- Ioffe, A.F. Semiconductor Thermoelements, and Thermoelectric Cooling (Infosearch, London 1957); Rowe, D.M., Ed.; CRC Handbook of Thermoelectrics; CRC Press: Boca Raton, FL, USA, 1995. [Google Scholar]
- Shiand, X.; Chenand, L.; Uher, C. Recent advances in high-performance bulk thermoelectric materials. Int. Mater. Rev. 2016, 61, 379–415. [Google Scholar]
- Terasaki, I.; Sasago, Y.; Uchinokura, K. Large thermoelectric power in NaCo2O4 single crystals. Phys. Rev. B 1997, 56, R12685. [Google Scholar] [CrossRef]
- Weidenkaff, A.; Aguirre, M.H.; Bocher, L.; Trottmann, M.; Tomes, P.; Robert, R. Development of Perovskite-type Cobaltates and Manganates for Thermoelectric Oxide Modules. J. Korean Ceram. Soc. 2010, 47, 47–53. [Google Scholar] [CrossRef]
- Harizanova, S.G.; Zhecheva, E.N.; Valchev, V.D.; Khristova, M.G.; Stoyanova, R.K. Improving the thermoelectric efficiency of Co based ceramics. Mater. Today Proc. 2015, 2, 4256–4261. [Google Scholar] [CrossRef]
- Zlati´c, V.; Boyd, G.R.; Freericks, J.K. Universal thermopower of bad metals. Phys. Rev. B 2014, 89, 155101. [Google Scholar] [CrossRef]
- Blasco, J.; Stankiewicz, J.; García, J. Phase segregation in the Gd1−xSrxFeO3−δ series. J. Solid State Chem. 2006, 179, 898–908. [Google Scholar] [CrossRef]
- Vereshchagin, S.N.; Dudnikov, V.A.; Solovyov, L.A. Study of Mobile Oxygen in Ordered/Disordered Nonstoichiometric Sr-Gd-Cobaltate by Simultaneous Thermal Analysis. J. Sib. Fed. Univ. Chem. 2017, 10, 346–357. [Google Scholar] [CrossRef]
- Chick, L.A.; Pederson, L.R.; Maupin, G.D.; Bates, J.L.; Thomas, L.E.; Exarhos, G. Glycine-nitrate combustion synthesis of oxide ceramic powders. J. Mamep Lett. 1990, 10, 6. [Google Scholar] [CrossRef]
- Solovyov, L.A. Full-Profile Refinement by Derivative Difference Minimization. J. Appl. Crystallogr. 2004, 37, 743–749. [Google Scholar] [CrossRef]
- Burkov, A.T.; Heinrich, A.; Konstantinov, P.P.; Nakama, T.; Yagasaki, K. Experimental set-up for thermopower and resistivity measurements at 100–1300 K. Meas. Sci. Technol. 2001, 12, 264–272. [Google Scholar] [CrossRef]
- Burkov, A.T.; Fedotov, A.I.; Kasyanov, A.A.; Panteleev, R.I.; Nakama, T. Methods and technique of thermopower and electricalconductivity measurements of thermoelectric materials at high temperatures. Sci. Tech. J. Inf. Technol. Mech. Opt. 2015, 15, 173–195. [Google Scholar] [CrossRef]
- James, M.; Tedesco, T.; Cassidy, D.J.; Withers, R.L. Oxygen vacancy ordering in strontium doped rare earth cobaltate perovskites Ln1−xSrxCoO3−δ (Ln = La, Pr and Nd; x > 0.60). Mater. Res. Bull. 2005, 40, 990. [Google Scholar] [CrossRef]
- James, M.; Morales, L.; Wallwork, K. Structure and Magnetism in Rare Eath Strontium-Doped Cobaltates. Phys. B 2006, 199, 385–386. [Google Scholar]
- Vereshchagin, S.N.; Dudnikov, V.A.; Shishkina, N.N.; Solovyov, L.A. Phase transformation behavior of Sr0.8Gd0.2CoO3−δ perovskite in the vicinity of order-disorder transition. Thermochim. Acta 2017, 655, 34–41. [Google Scholar] [CrossRef]
- Vereshchagin, S.N.; Solovyov, L.A.; Rabchevskii, E.V.; Dudnikov, V.A.; Ovchinnikov, S.G.; Anshits, A.G. Methane oxidation over A-site ordered and disordered Sr0.8Gd0.2CoO3−δ perovskites. Chem. Commun. 2014, 50, 6112–6115. [Google Scholar] [CrossRef]
- Yoshida, S.; Kobayashi, W.; Nakano, T.; Terasaki, I.; Matsubayashi, K.; Uwatoko, Y.; Grigoraviciute, I.; Karppinen, M.; Yamauchi, H. Chemical and physical pressure effects on the magnetic and transport properties of the A-site ordered perovskite Sr3YCo4O10.5. J. Phys. Soc. Jpn. 2009, 78, 094711. [Google Scholar] [CrossRef]
- Fukushima, S.; Sato, T.; Akahoshi, D.; Kuwahara, H. Comparative study of ordered and disordered Y1−xSrxCoO3−δ. J. Appl. Phys. 2008, 103, 07F705. [Google Scholar] [CrossRef]
- Dann, S.E.; Currie, D.B.; Weller, M.T.; Thomas, M.F.; Al-Rawwas, A.D. The Effect of Oxygen Stoichiometry on Phase Relations and Structure in the System La1−xSrxFeO3−δ (0 <= x <= 1, 0 <= δ <= 0.5). J. Solid State Chem. 1994, 109, 134–144. [Google Scholar] [CrossRef]
- Battle, P.D.; Gibb, T.C.; Lightfoot, P. The structural consequences of charge disproportionation in mixed-valence iron oxides. The crystal structure of Sr2LaFe3O8.94 at room temperature and 50 K. J. Solid State Chem. 1990, 84, 271–279. [Google Scholar] [CrossRef]
- Robert, R.; Aguirre, M.H.; Bocher, L.; Trottmann, M.; Heiroth, S.; Lippert, T.; Döbeli, M.; Weidenkaff, A. Thermoelectric Properties of LaCo1−xNixO3 Polycrystalline Samples and Epitaxial Thin Films. Solid State Sci. 2008, 10, 502–507. [Google Scholar] [CrossRef]
- Robert, R.; Bocher, L.; Trottmann, M.; Reller, A.; Weidenkaff, A. Synthesis and High-Temperature Thermoelectric Properties of Ni and Ti Substituted LaCoO3. J. Solid State Chem. 2006, 179, 3893–3899. [Google Scholar] [CrossRef]
- Behera, S.; Kamble, V.B.; Vitta, S.; Umarji, A.M.; Shivakumara, C. Synthesis Structure and Thermoelectric Properties of La1−xNaxCoO3 Perovskite Oxides. Bull. Mater. Sci. 2017, 40, 1291–1299. [Google Scholar] [CrossRef]
- Moser, D.; Karvonen, L.; Populoh, S.; Trottmann, M.; Weidenkaff, A. Influence of the Oxygen Content on Thermoelectric Properties of Ca3−xBixCo4O9+δ System. Solid State Sci. 2011, 13, 2160–2164. [Google Scholar] [CrossRef]


| Atom | Position | Occupancy | x | y | z | Uiso [Å2] |
|---|---|---|---|---|---|---|
| Sr | 1a | 0.800(4) | 0 | 0 | 0 | 0.0092(7) |
| Gd | 6e | 0.0334(7) | 0.080(4) | 0 | 0 | 0.0092(7) |
| Fe | 1b | 1 | 1/2 | 1/2 | 1/2 | 0.0082(5) |
| O | 12h | 0.232(1) | 0.452(2) | 1/2 | 0 | 0.0211(14) |
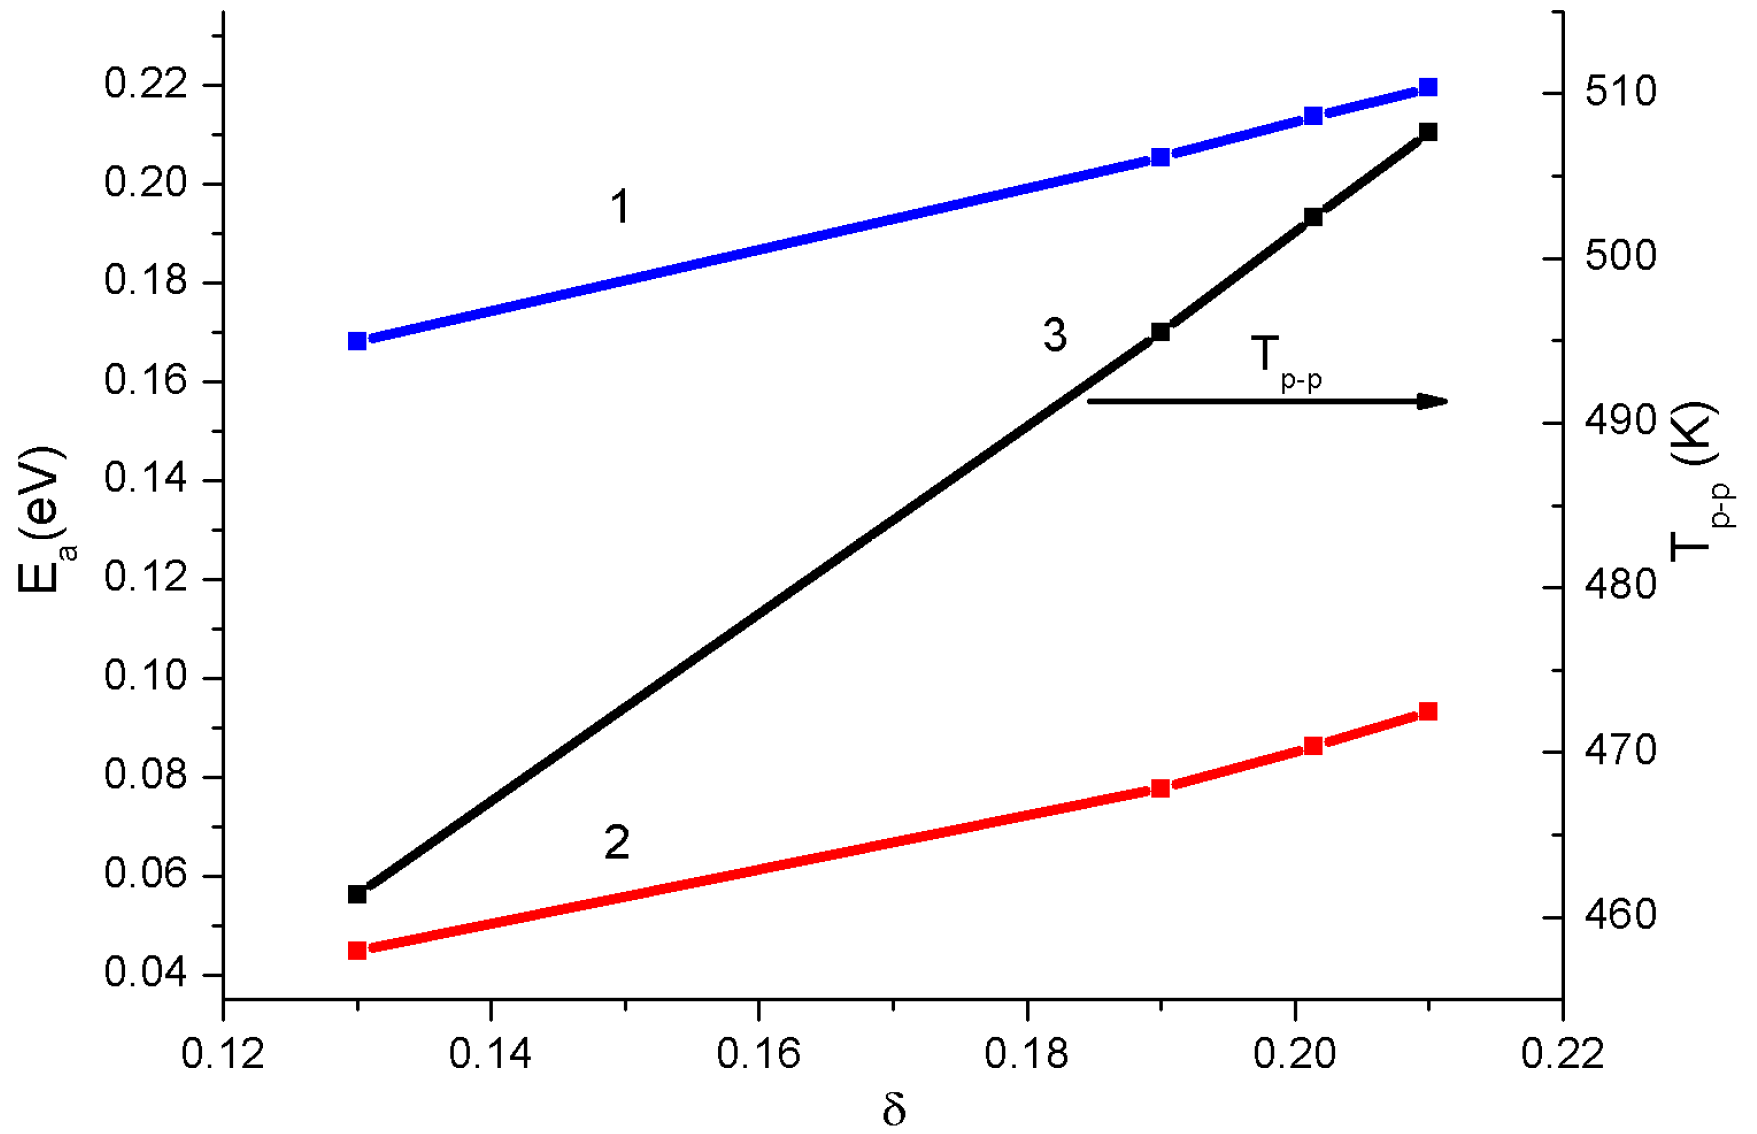
| Regime | δ | Ea (T < Tp-p) (eV) | Tp-p (K) | Ea (T > Tp-p) (eV) |
|---|---|---|---|---|
| First heating | 0.13 ± 0.01 | 0.16 ± 0.01 | 461 ± 1 | 0.04 ± 0.01 |
| First cooling | 0.19 ± 0.01 | 0.20 ± 0.01 | 495 ± 1 | 0.07 ± 0.01 |
| Second cooling | 0.20 ± 0.01 | 0.21 ± 0.01 | 502 ± 1 | 0.08 ± 0.01 |
| Third cooling | 0.21 ± 0.01 | 0.22 ± 0.01 | 507 ± 1 | 0.09 ± 0.01 |
© 2018 by the authors. Licensee MDPI, Basel, Switzerland. This article is an open access article distributed under the terms and conditions of the Creative Commons Attribution (CC BY) license (http://creativecommons.org/licenses/by/4.0/).
Share and Cite
Dudnikov, V.; Orlov, Y.; Fedorov, A.; Solovyov, L.; Vereshchagin, S.; Burkov, A.; Novikov, S.; Ovchinnikov, S. Effect of Oxygen Nonstoichiometry on Electrical Conductivity and Thermopower of Gd0.2Sr0.8FeO3−δ Ferrite Samples. Materials 2019, 12, 74. https://doi.org/10.3390/ma12010074
Dudnikov V, Orlov Y, Fedorov A, Solovyov L, Vereshchagin S, Burkov A, Novikov S, Ovchinnikov S. Effect of Oxygen Nonstoichiometry on Electrical Conductivity and Thermopower of Gd0.2Sr0.8FeO3−δ Ferrite Samples. Materials. 2019; 12(1):74. https://doi.org/10.3390/ma12010074
Chicago/Turabian StyleDudnikov, Vyacheslav, Yury Orlov, Aleksandr Fedorov, Leonid Solovyov, Sergey Vereshchagin, Alexander Burkov, Sergey Novikov, and Sergey Ovchinnikov. 2019. "Effect of Oxygen Nonstoichiometry on Electrical Conductivity and Thermopower of Gd0.2Sr0.8FeO3−δ Ferrite Samples" Materials 12, no. 1: 74. https://doi.org/10.3390/ma12010074
APA StyleDudnikov, V., Orlov, Y., Fedorov, A., Solovyov, L., Vereshchagin, S., Burkov, A., Novikov, S., & Ovchinnikov, S. (2019). Effect of Oxygen Nonstoichiometry on Electrical Conductivity and Thermopower of Gd0.2Sr0.8FeO3−δ Ferrite Samples. Materials, 12(1), 74. https://doi.org/10.3390/ma12010074