Thickening of T1 Precipitates during Aging of a High Purity Al–4Cu–1Li–0.25Mn Alloy


Abstract
1. Introduction
2. Materials and Methods
2.1. Material and Sample Preparation
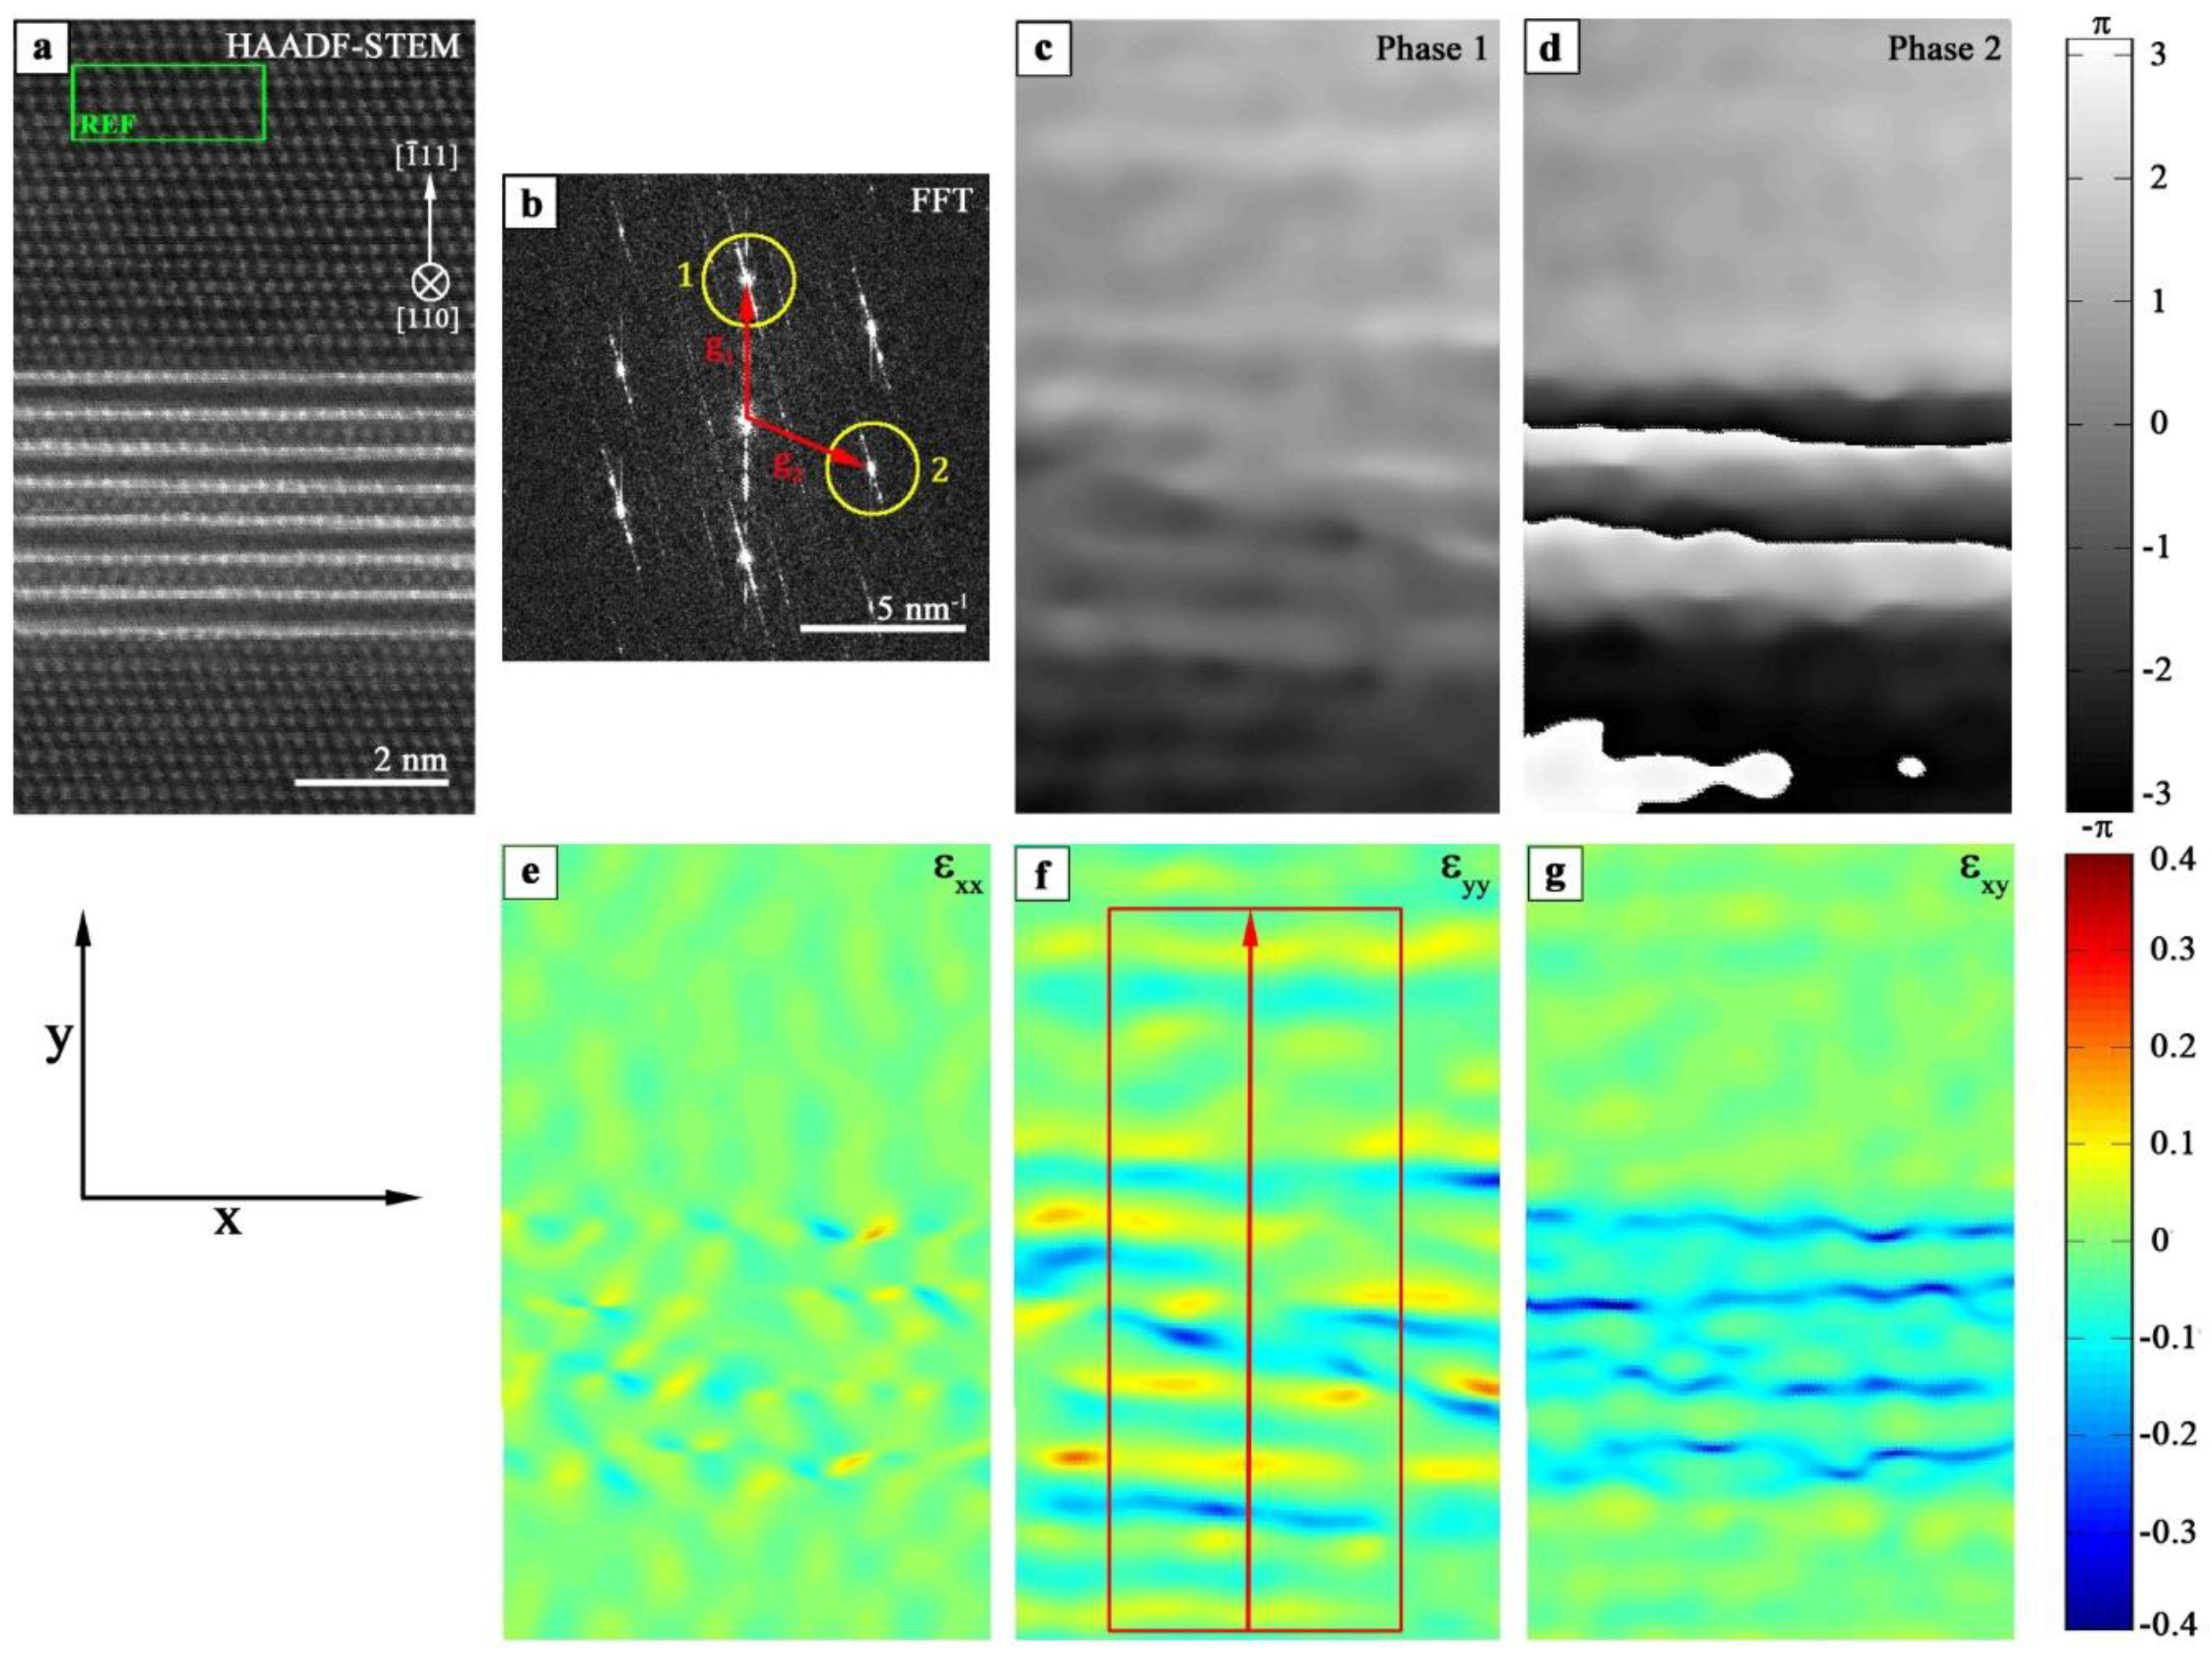
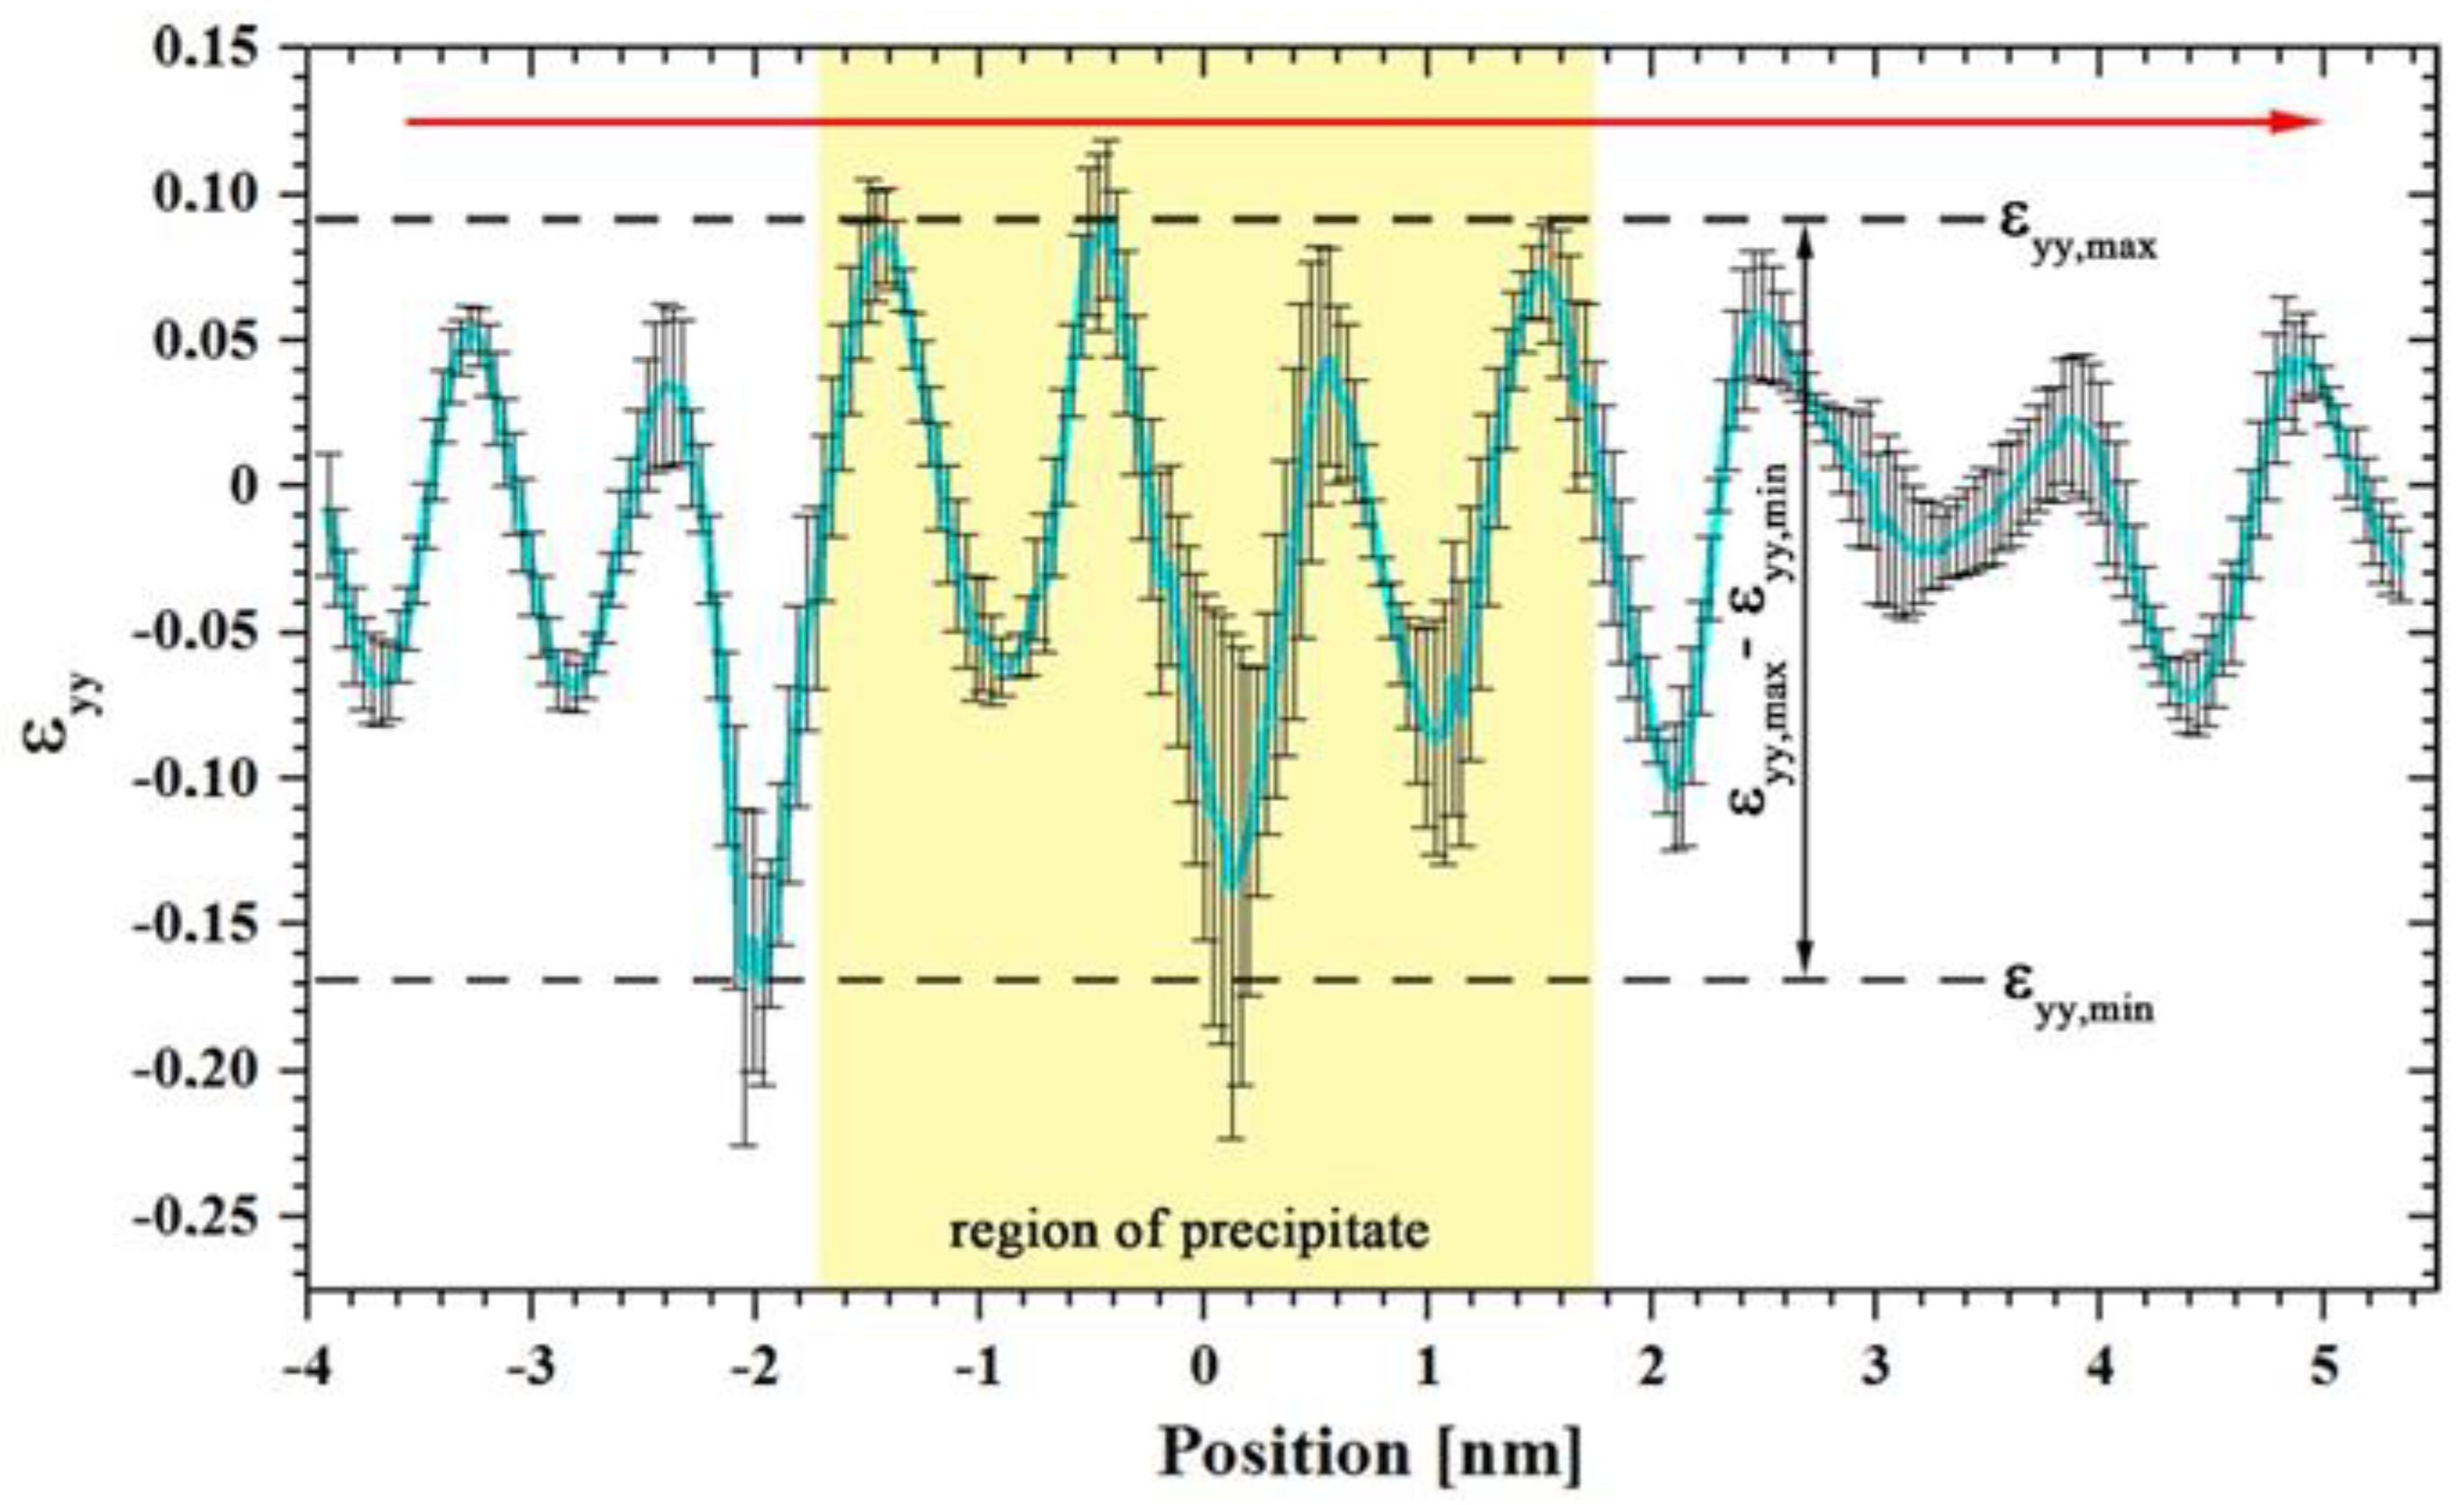
2.2. Quantification of Precipitate Dimensions and Determination of Strain Field within and Around Precipitates Using GPA
- si length of the line i
- ci thickness of the line i
- ti TEM foil thickness in the center of the line i
- area size of the investigated area (i.e., the area of the TEM image)
3. Results
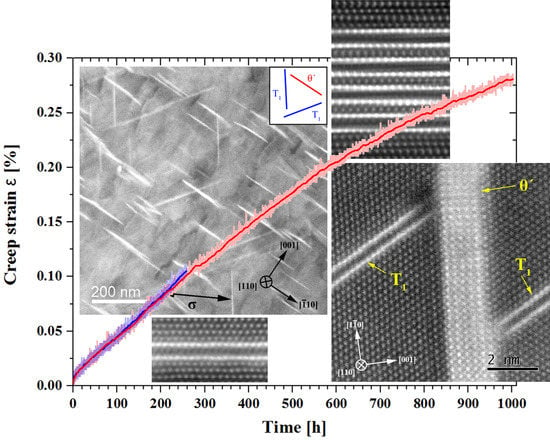
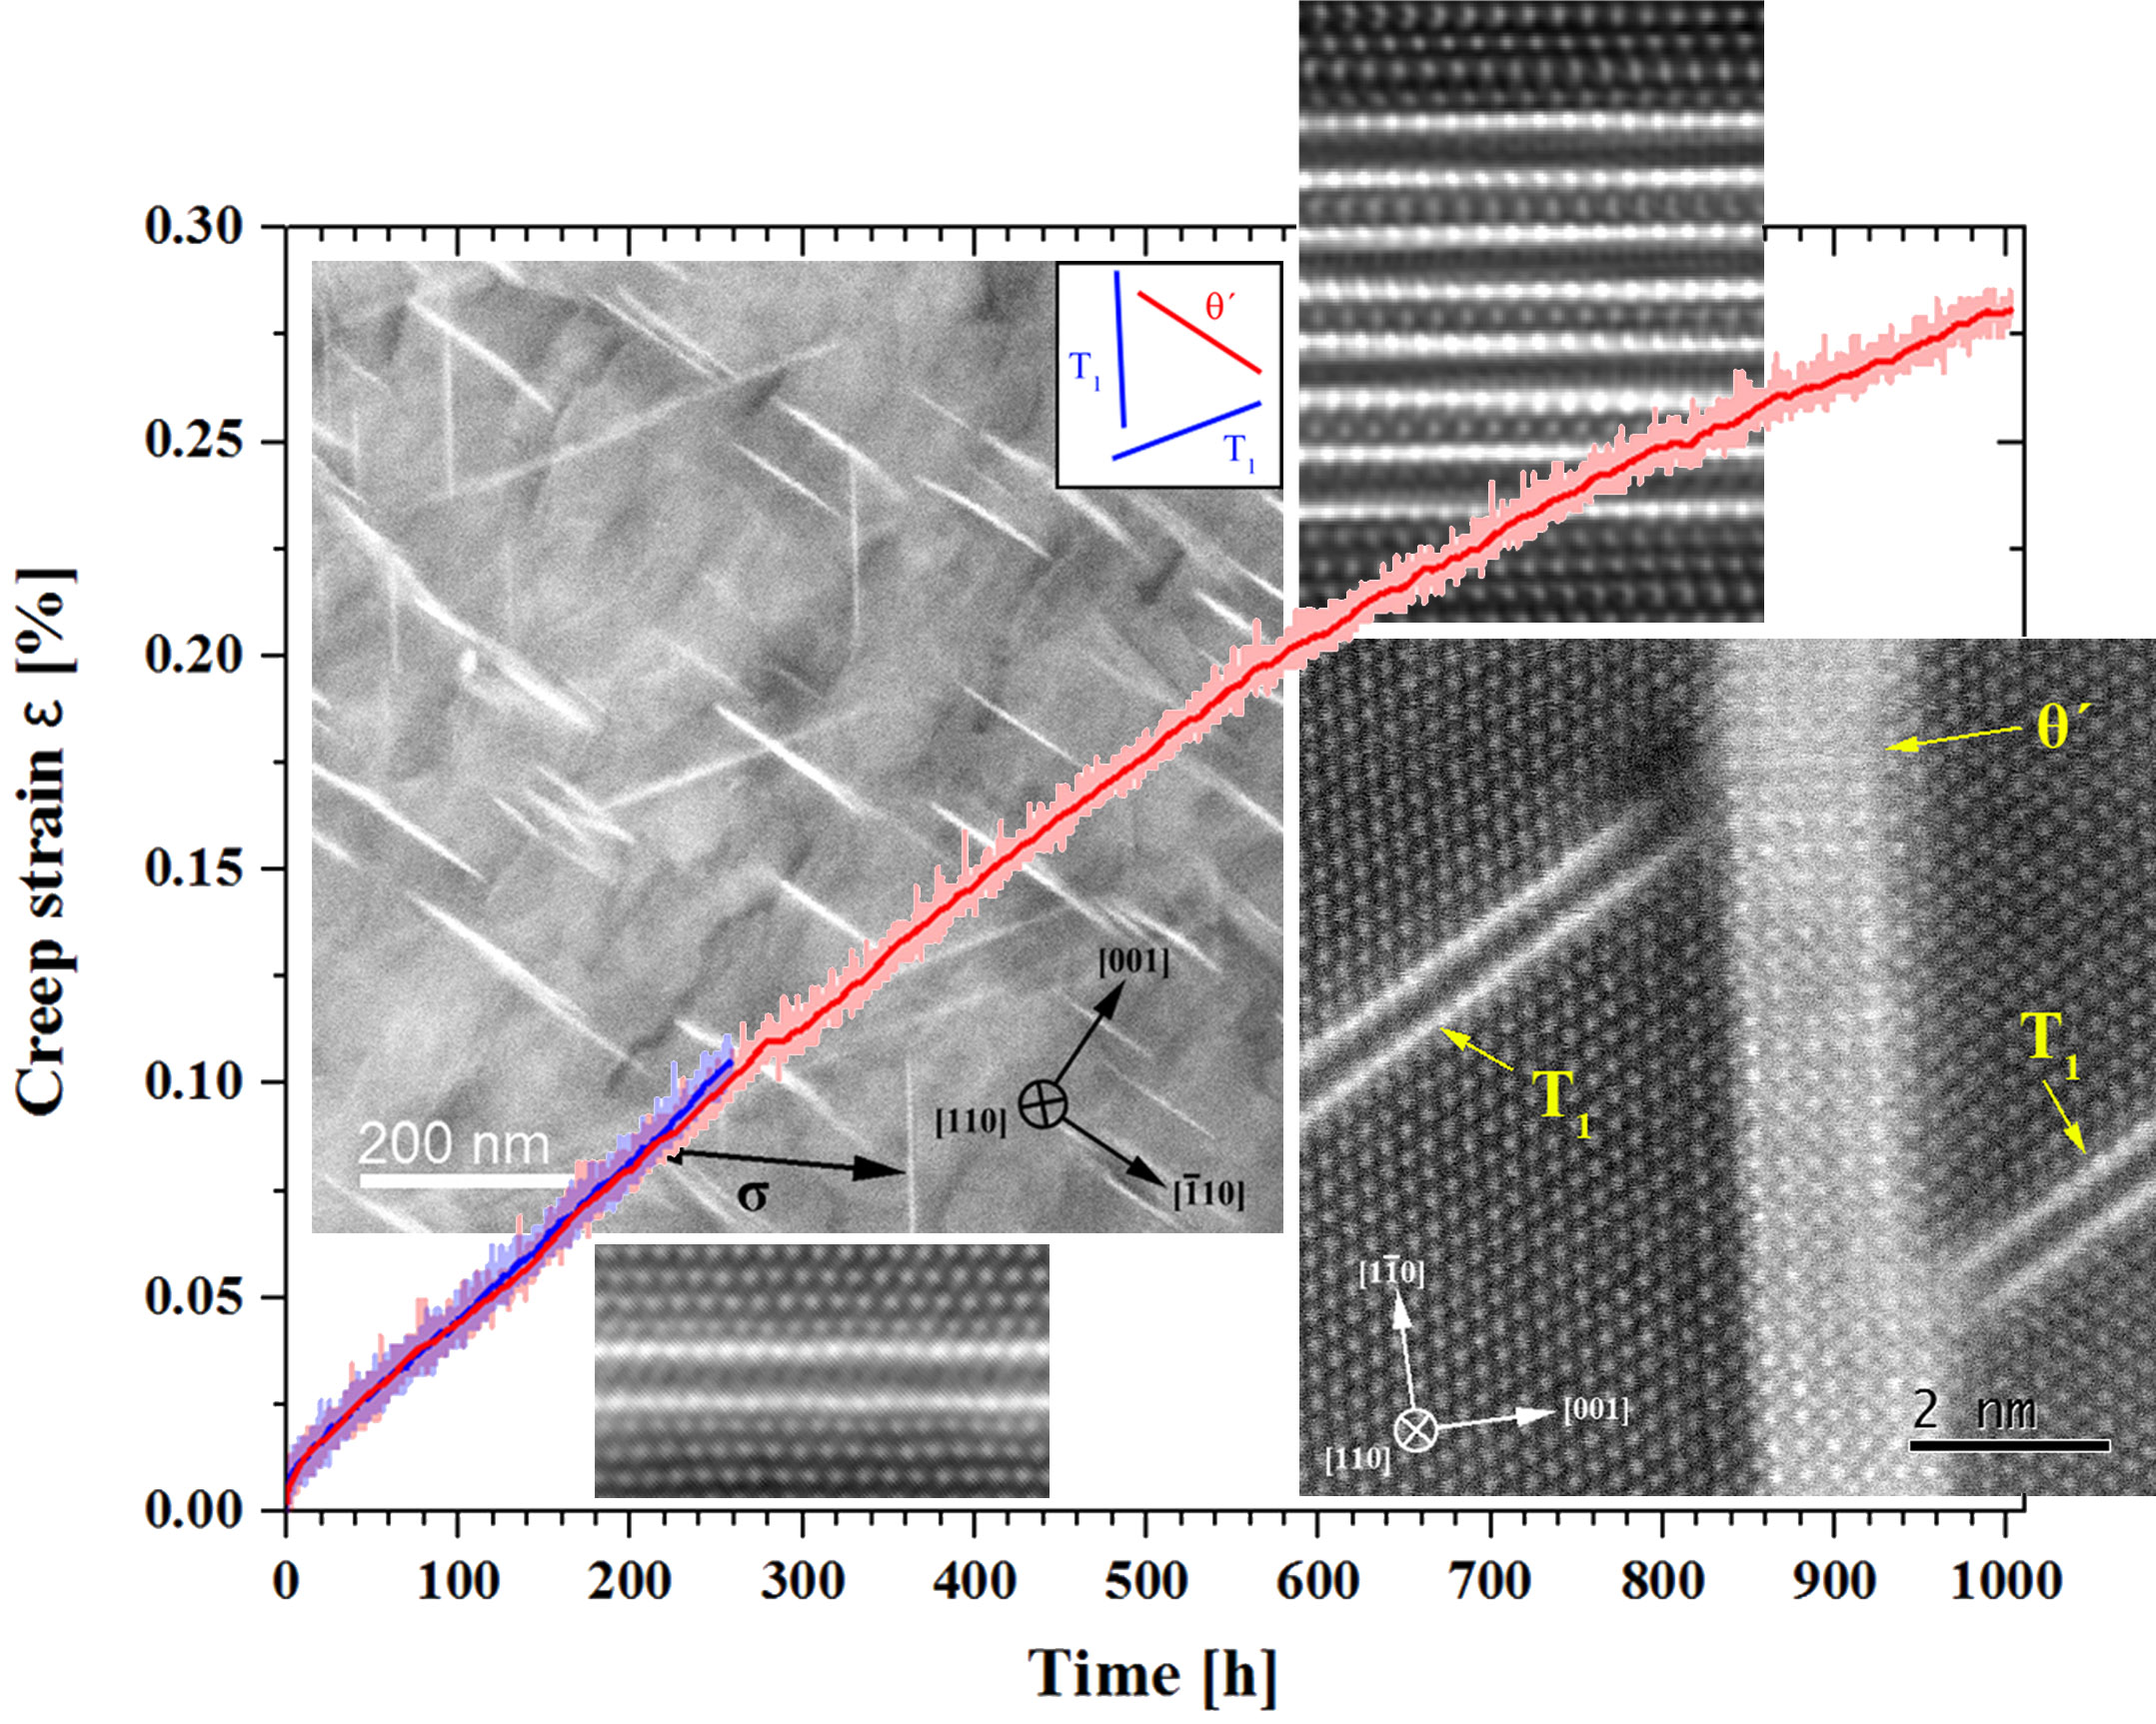
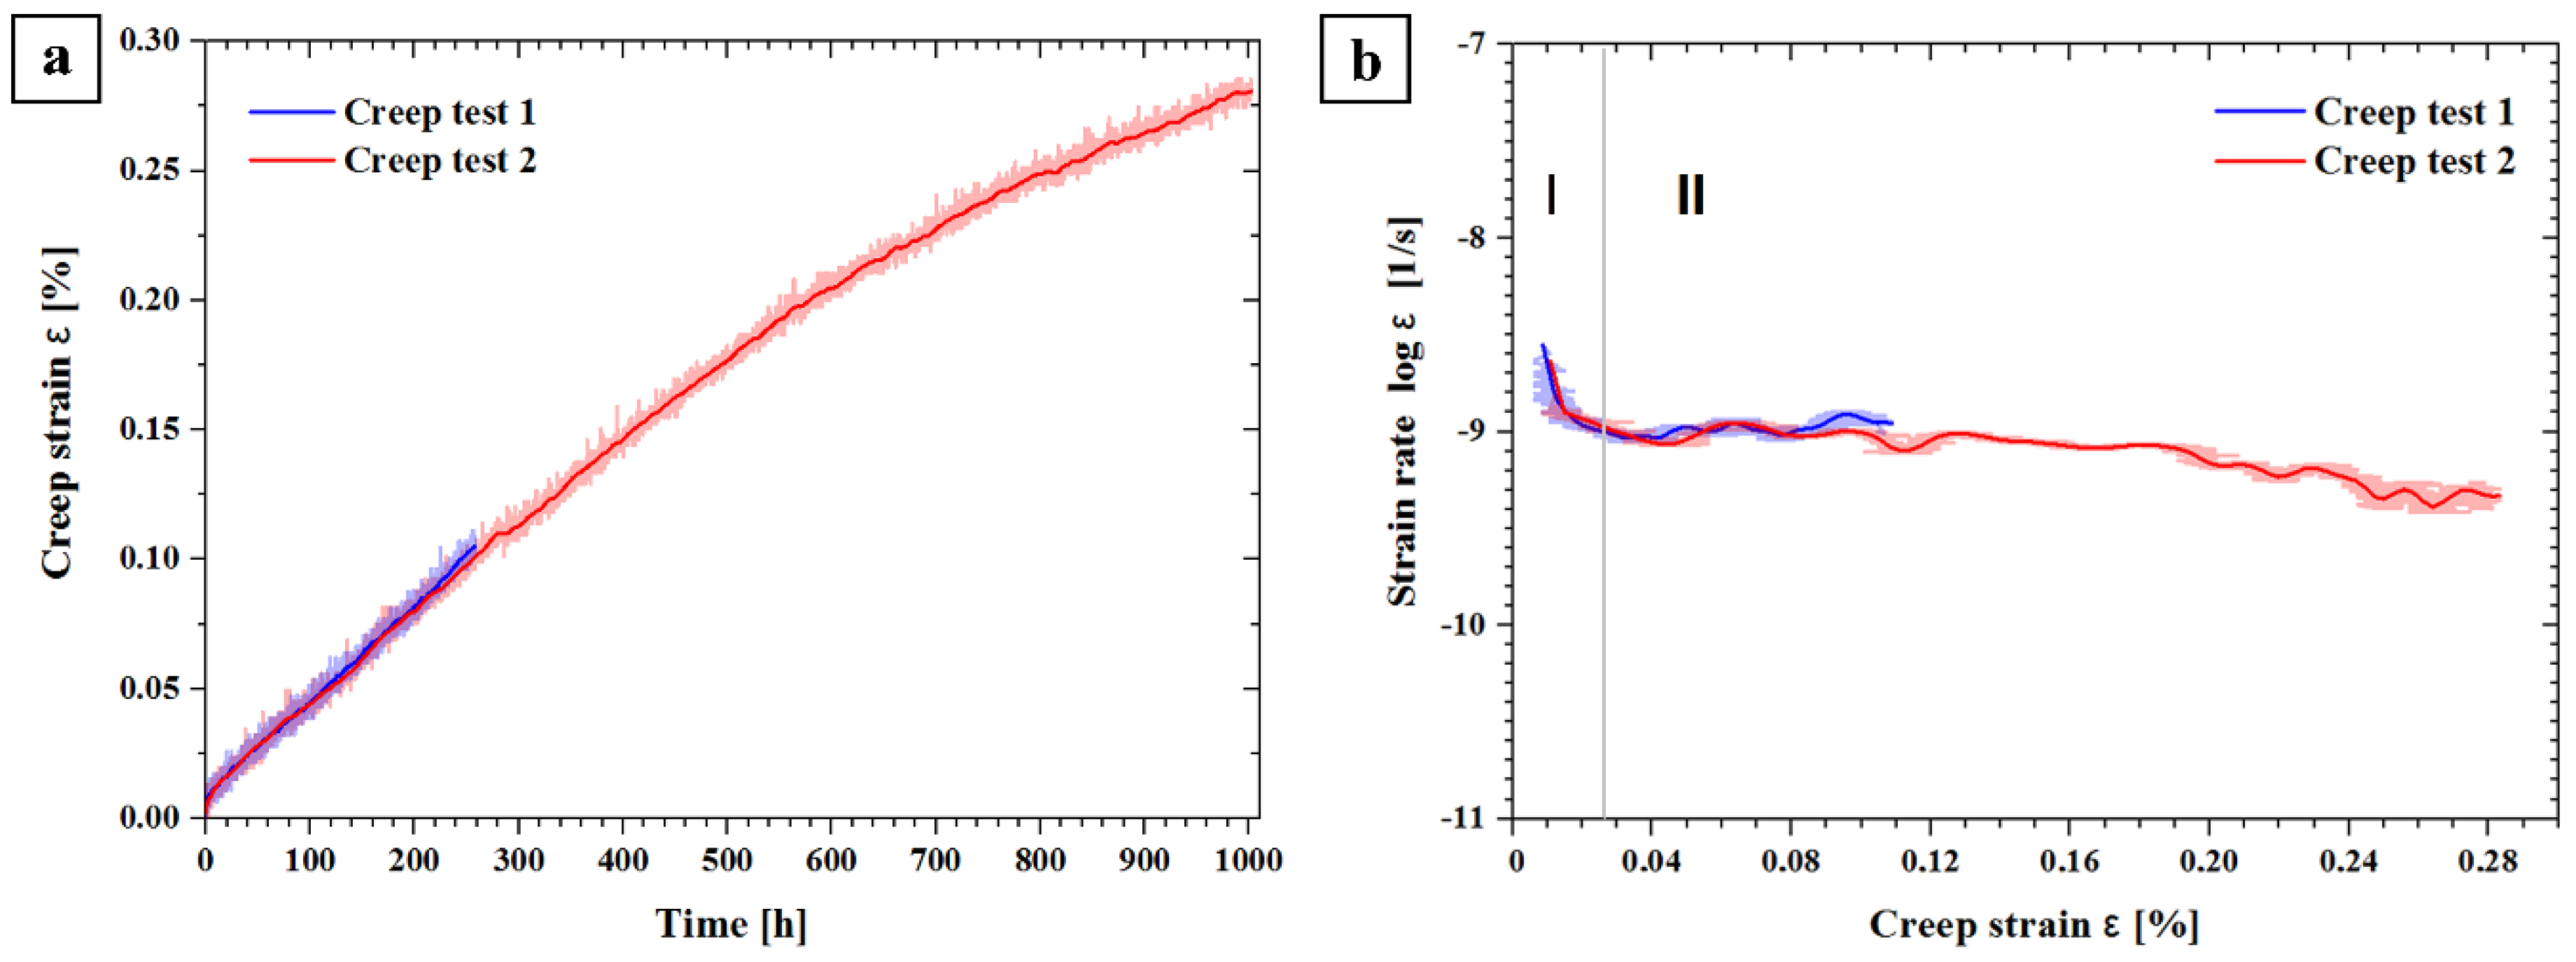
3.1. Creep Behavior
3.2. Brinell Hardness
3.3. Microstructure
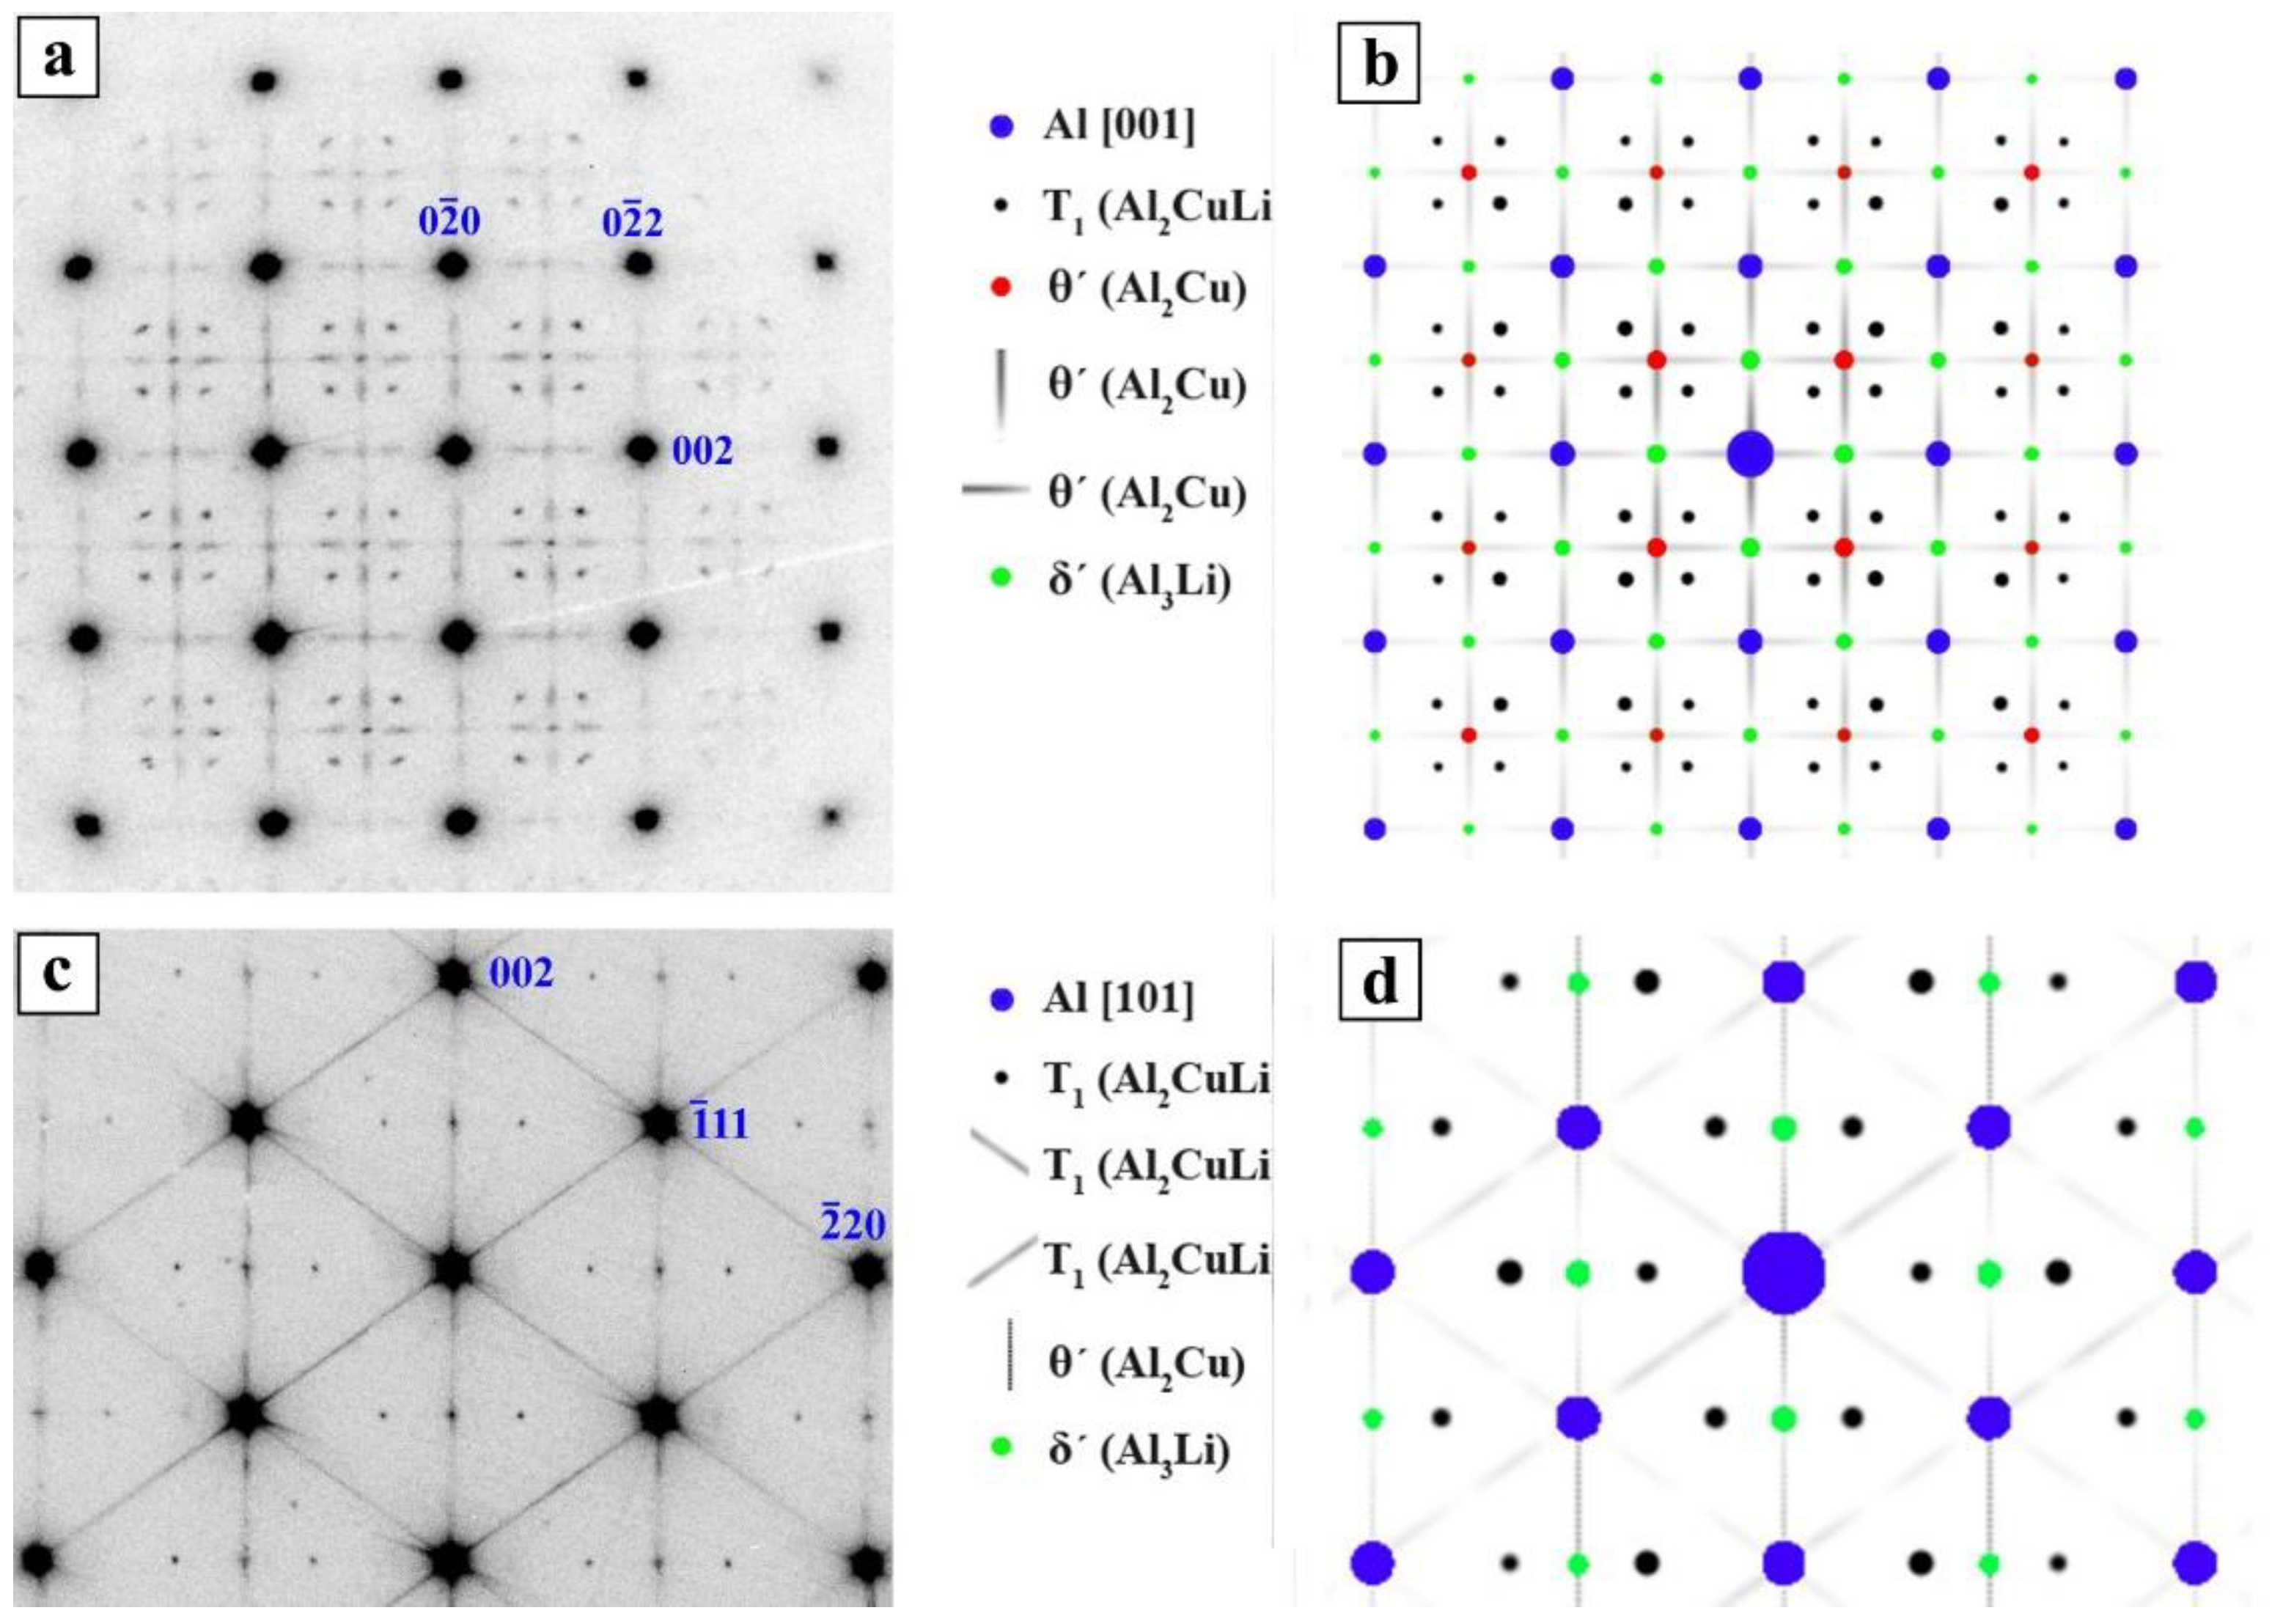
3.3.1. Peak Aged State
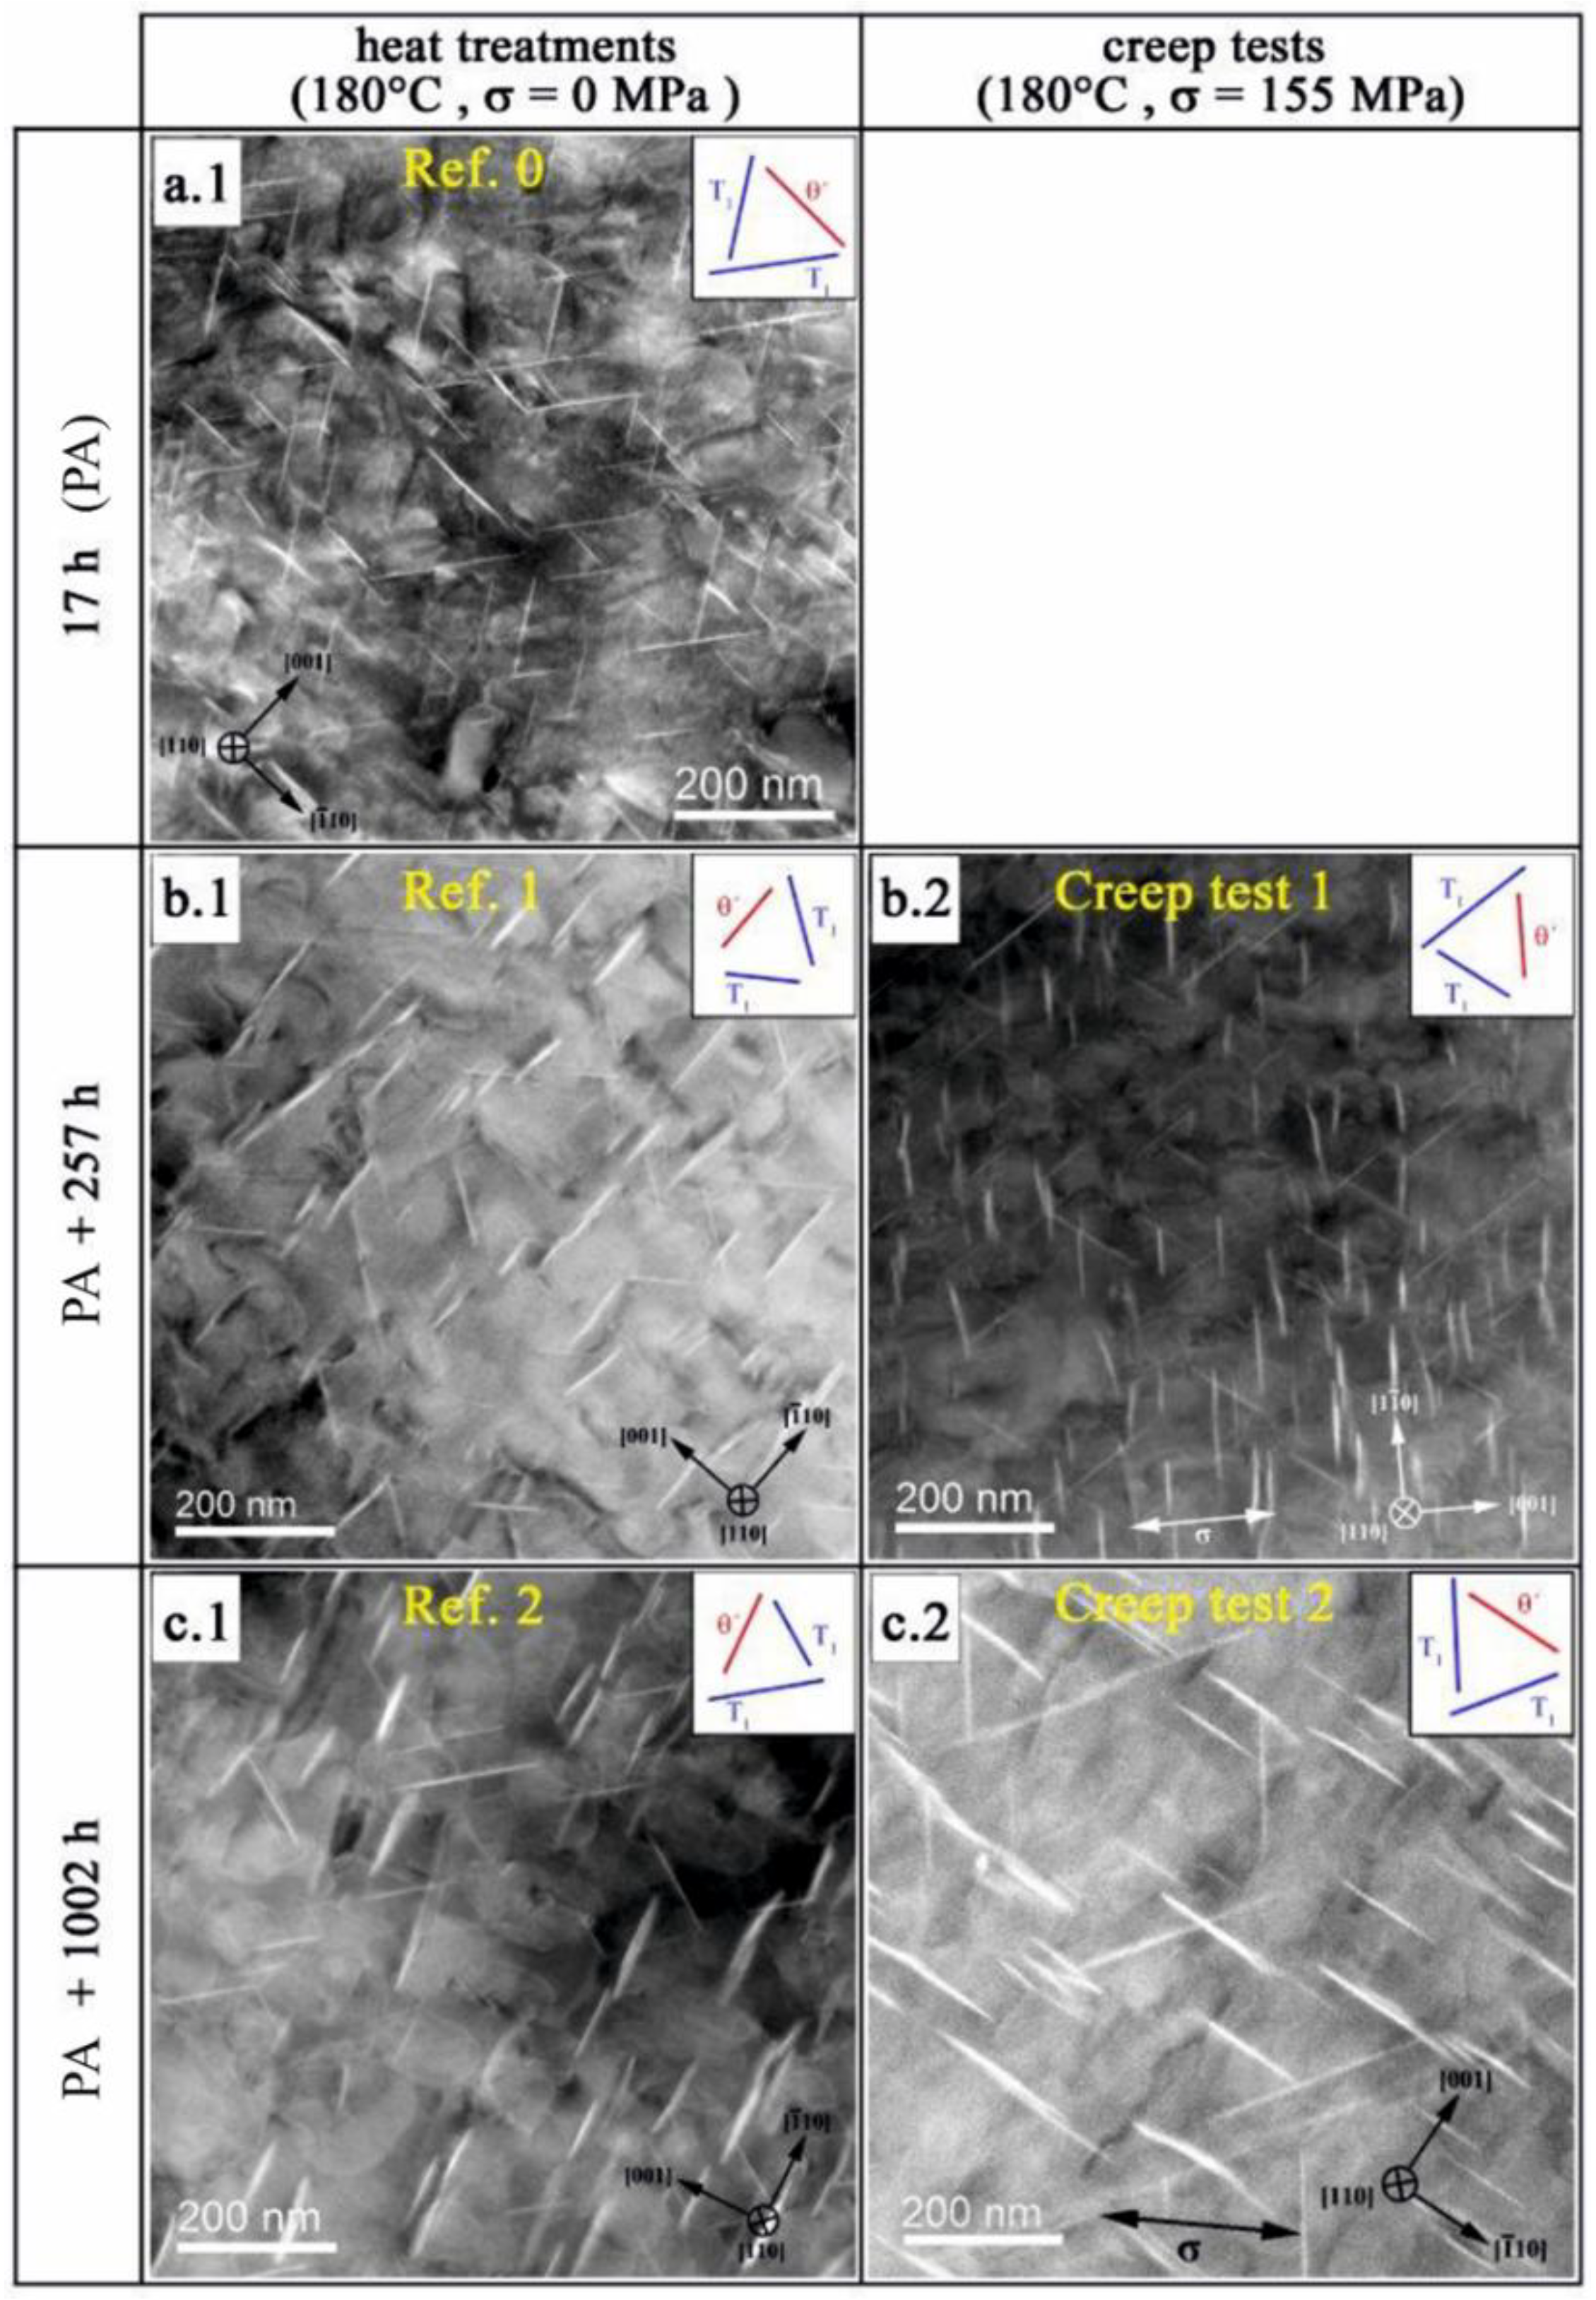
3.3.2. Effect of Further Aging
3.3.3. Effect of Applied Load

3.3.4. Strain Measurements Using GPA
4. Discussion
5. Conclusions
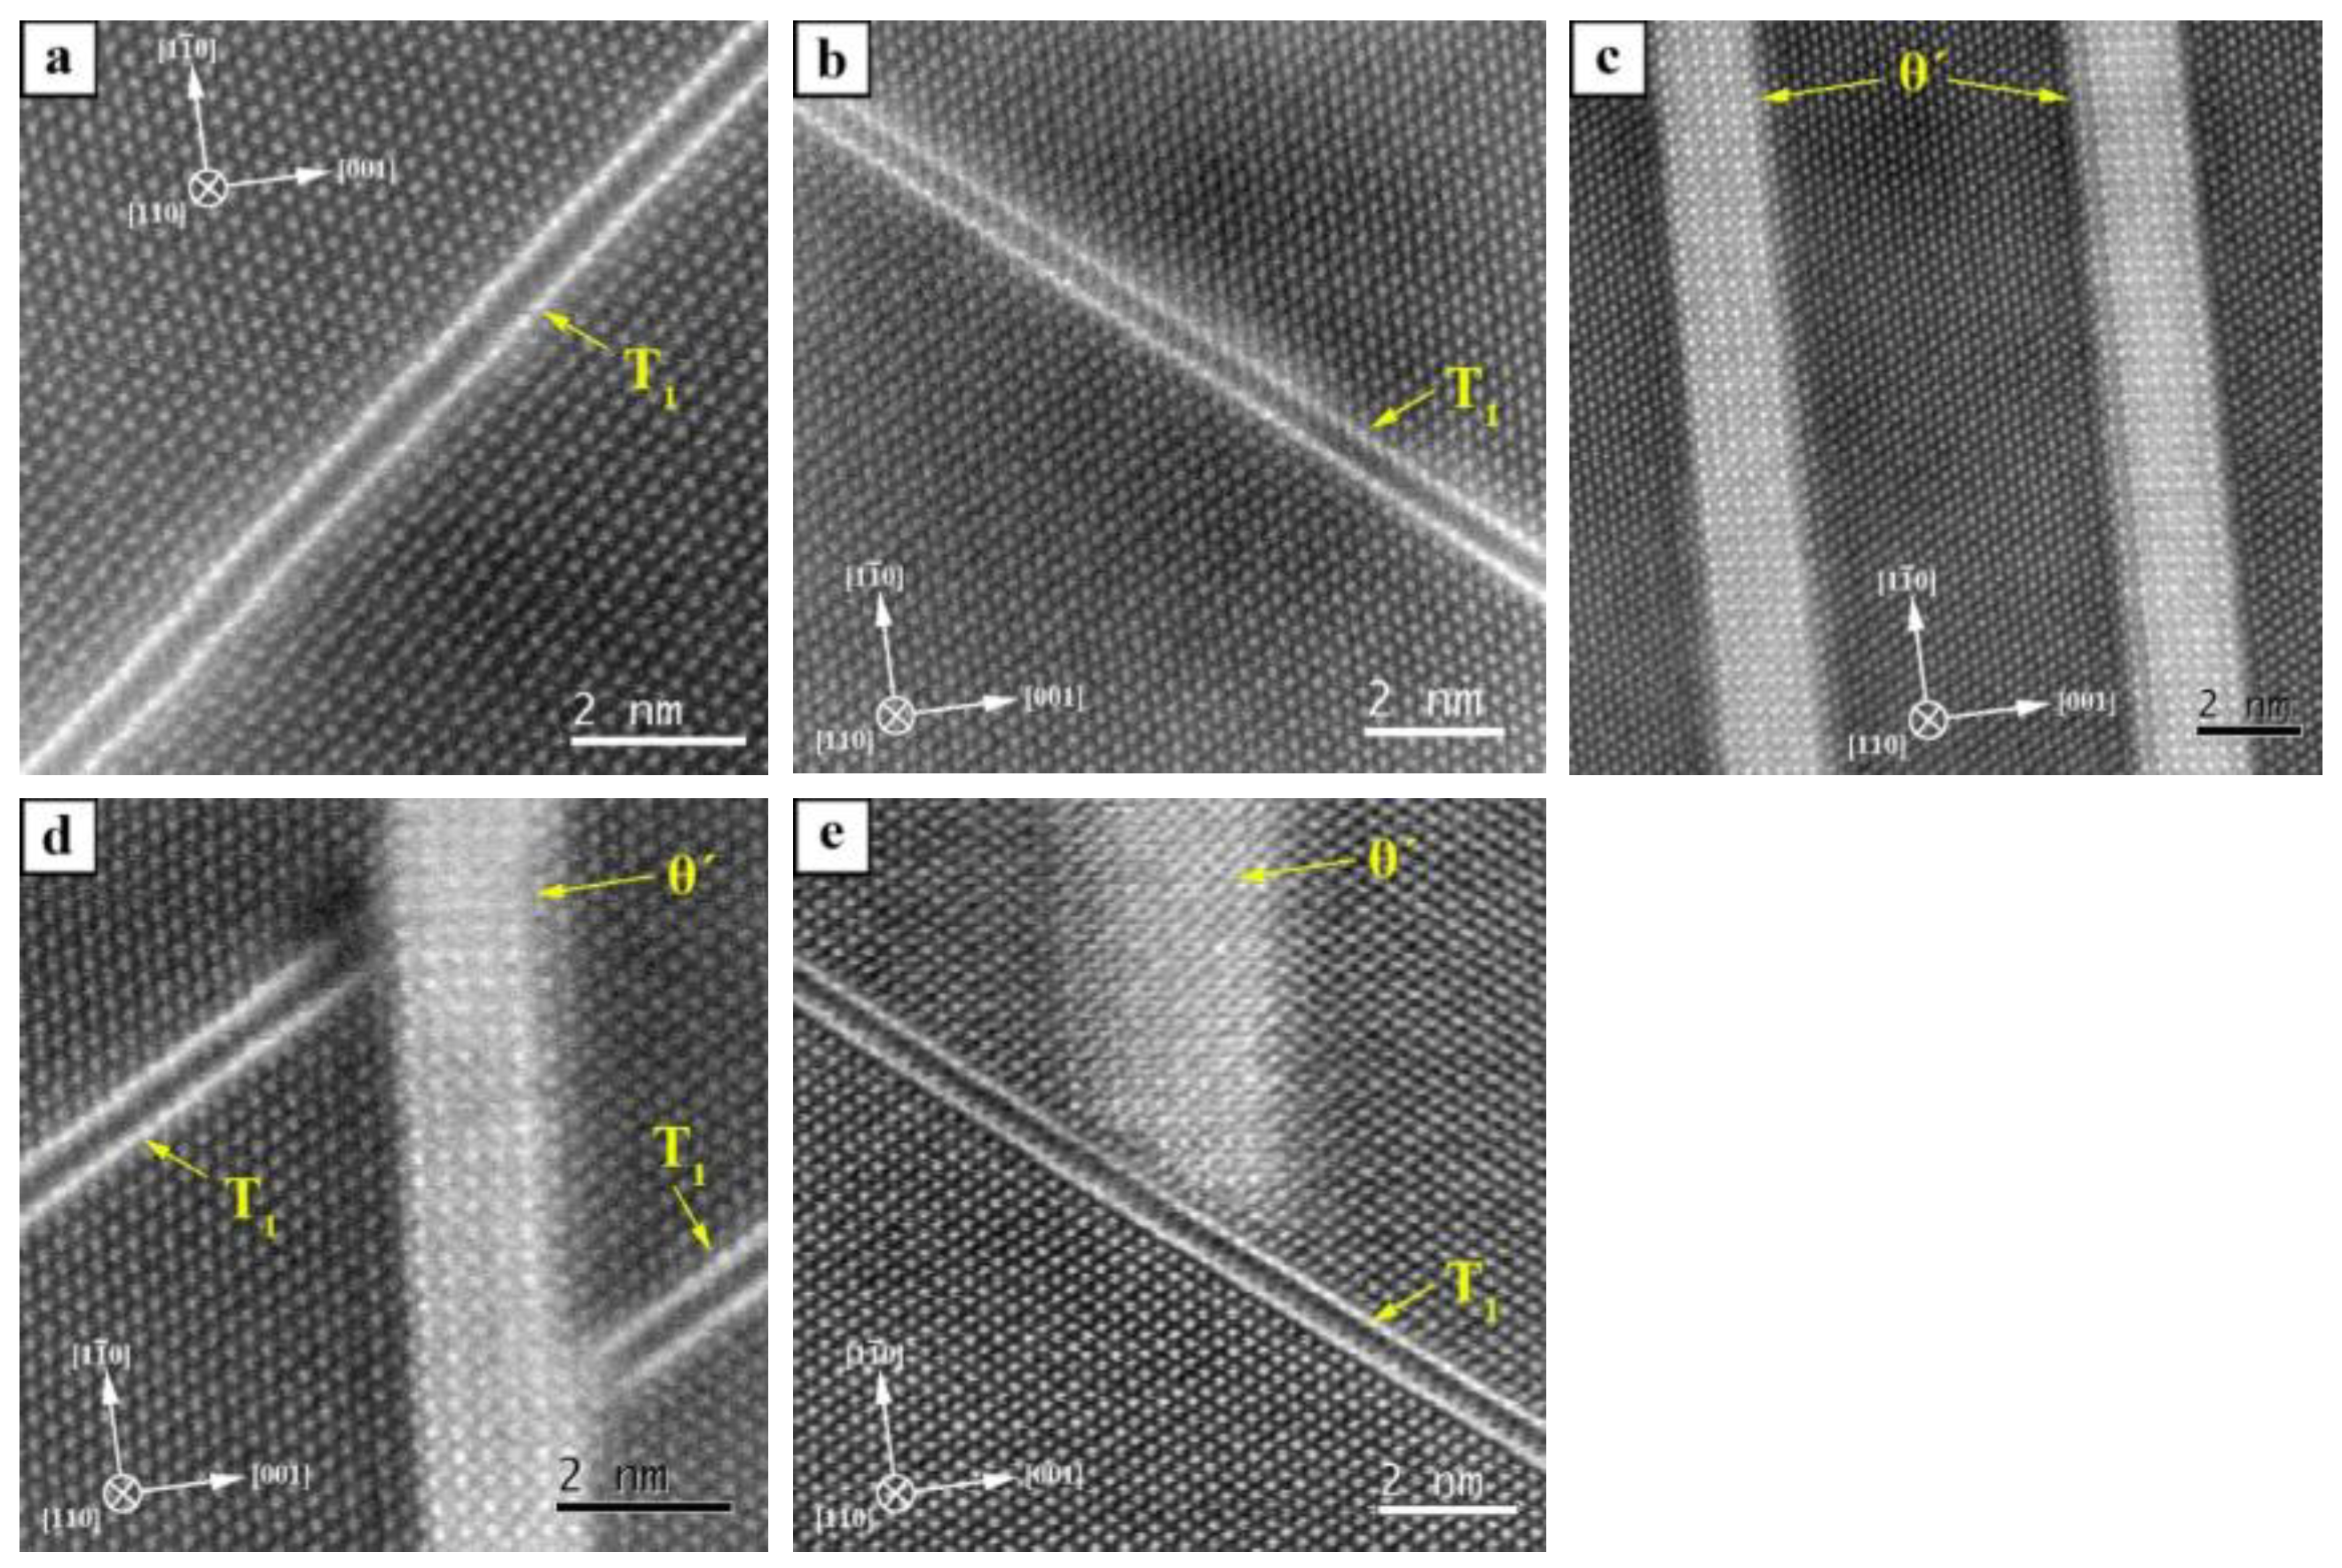
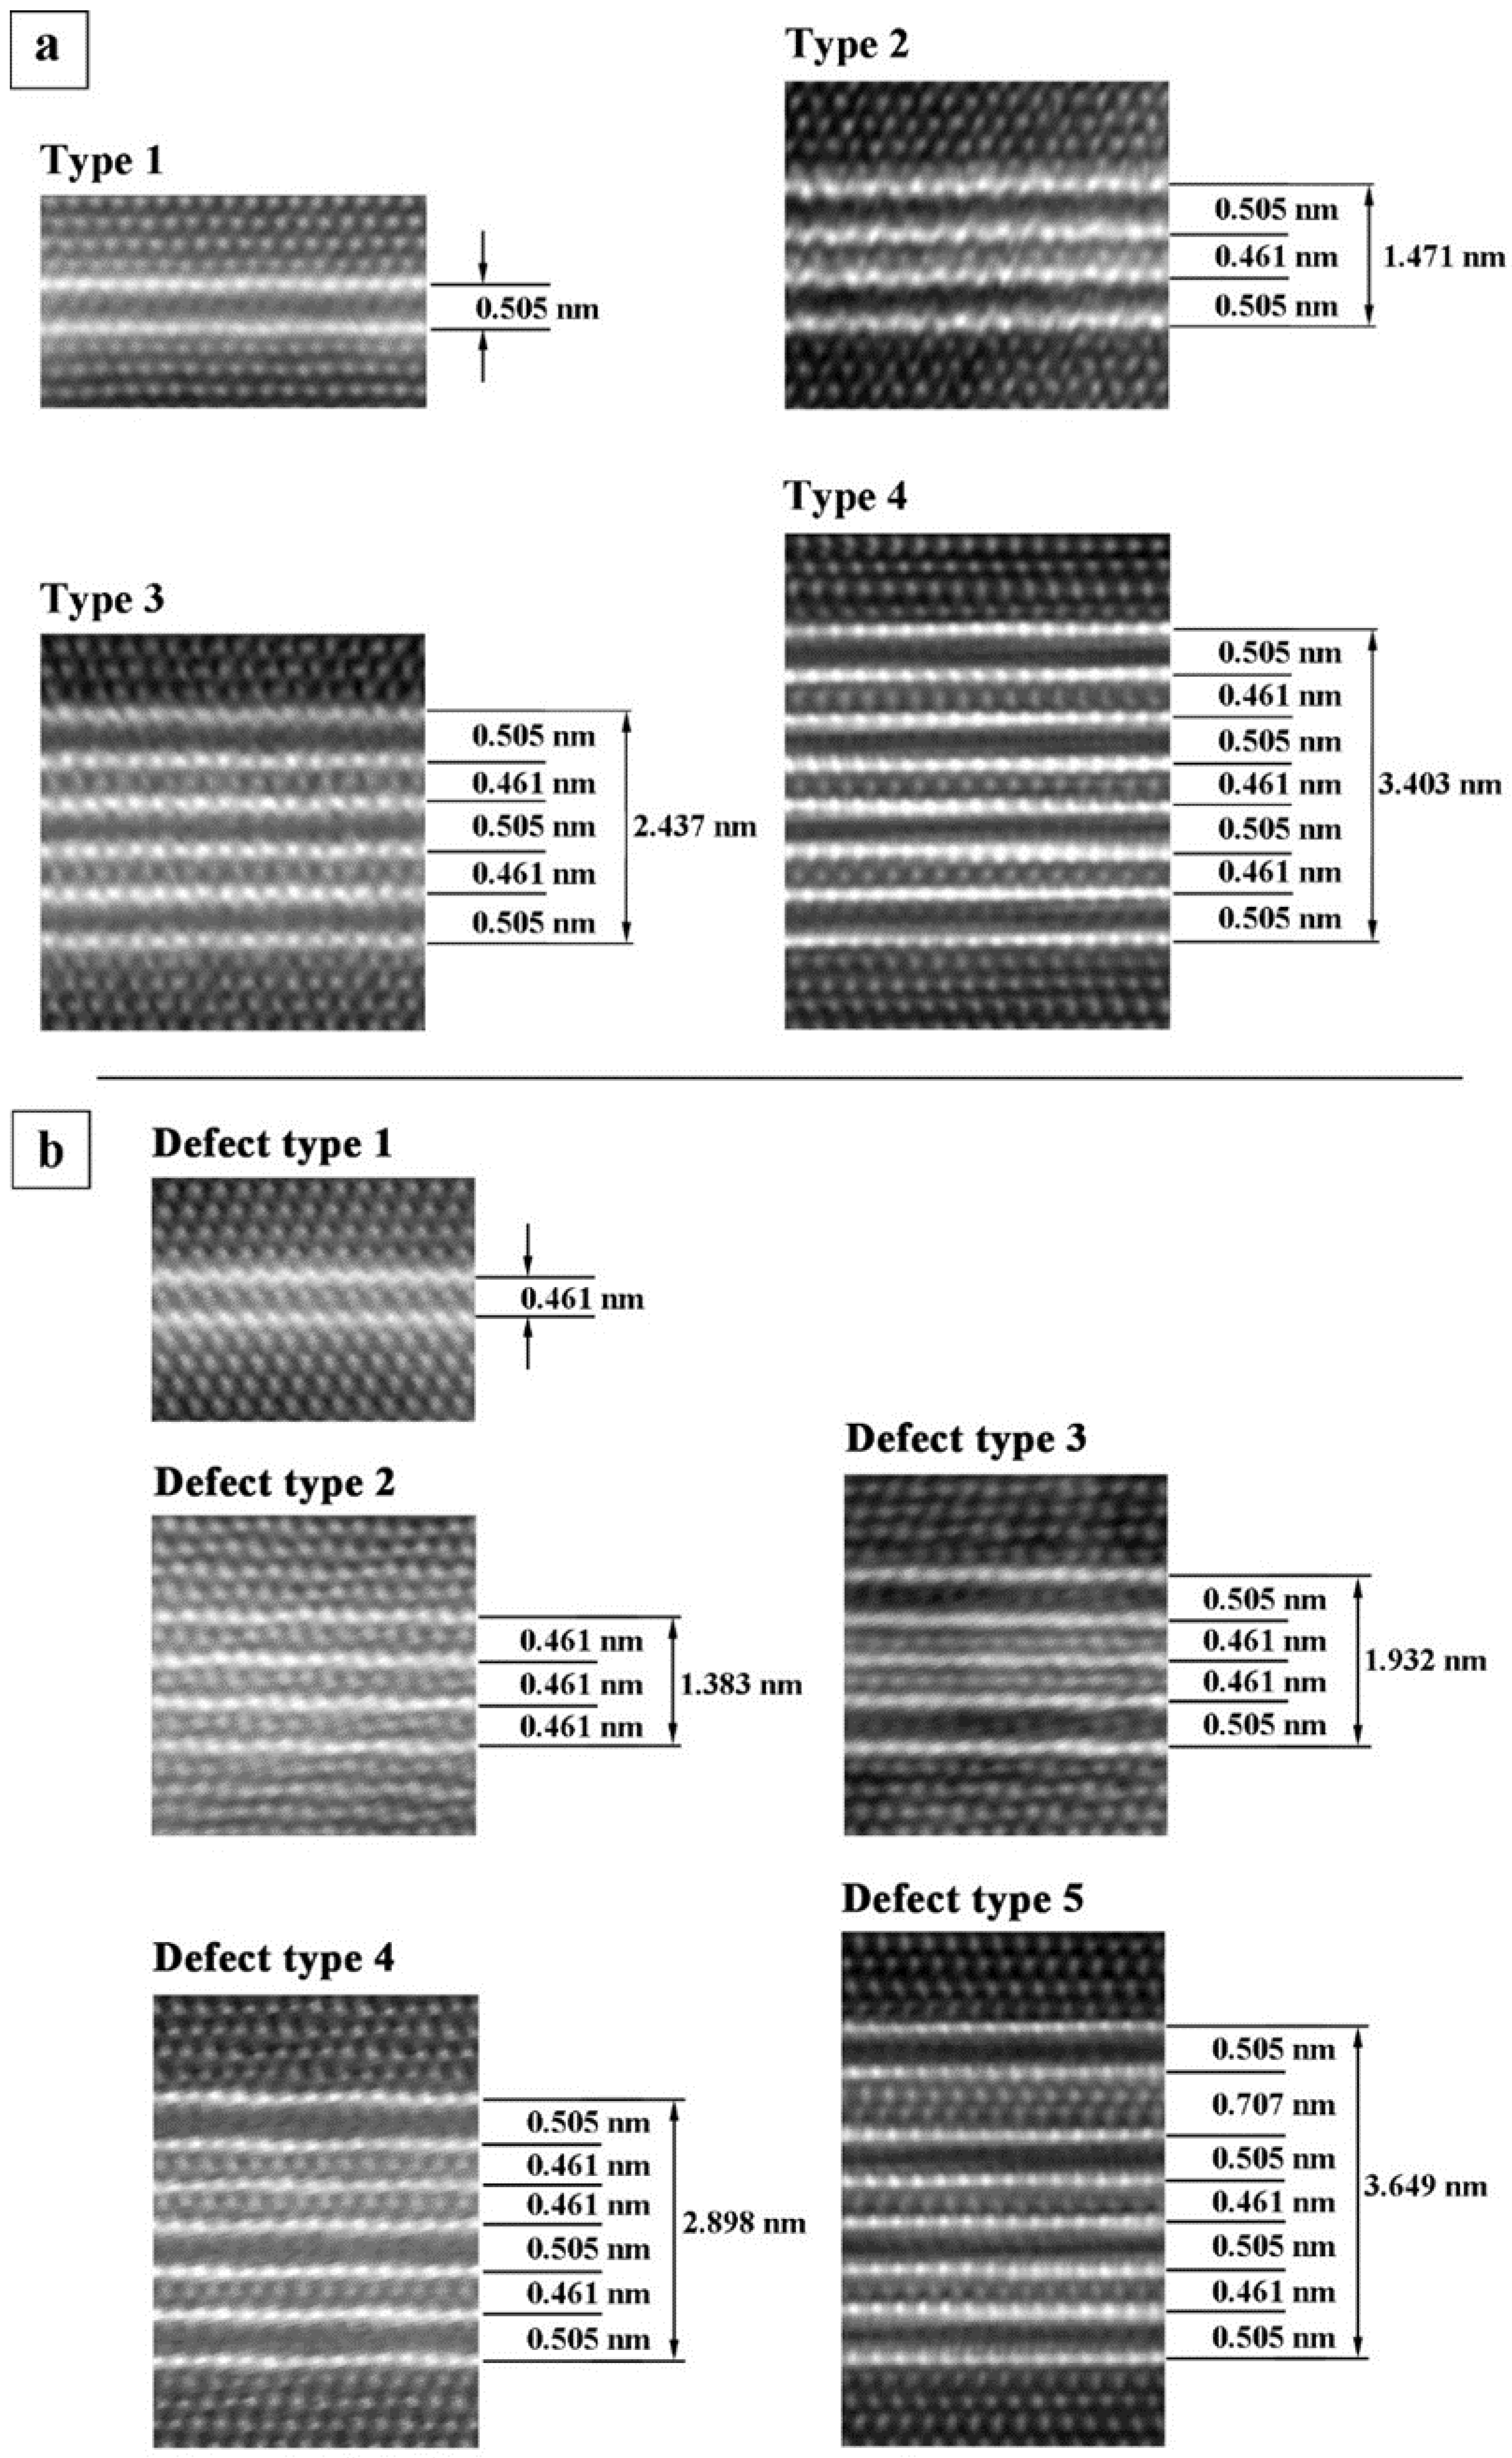
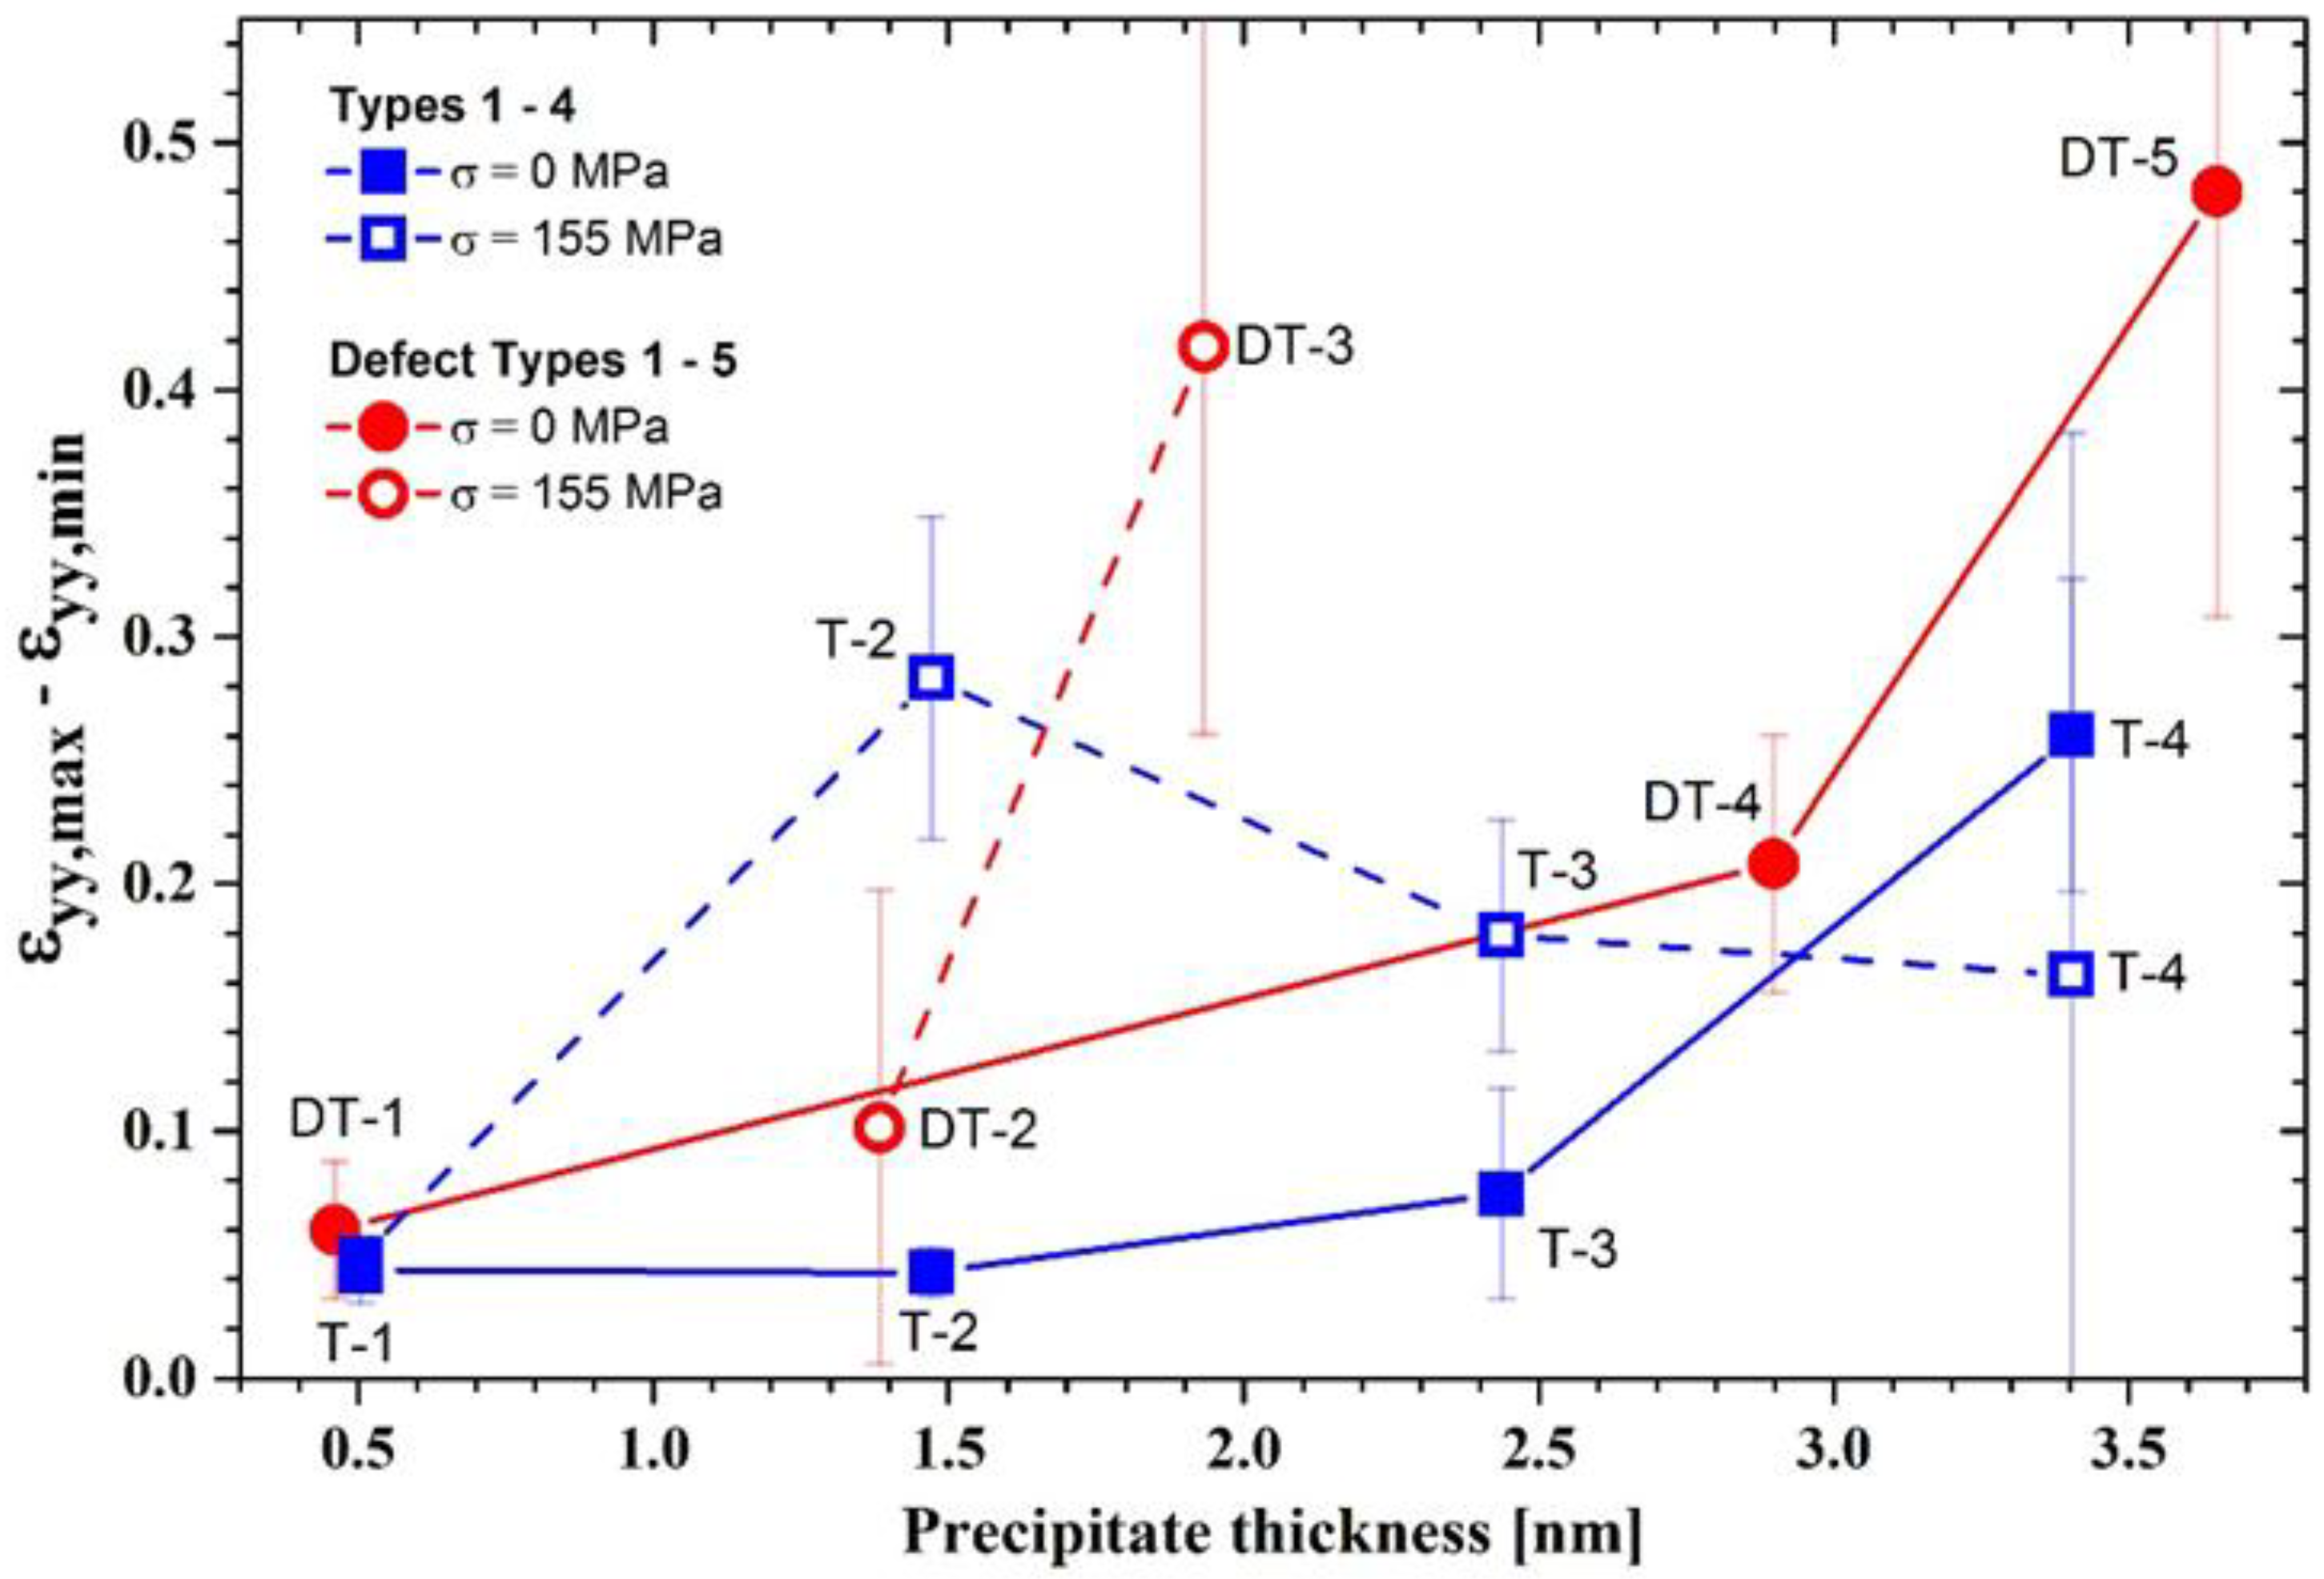
- Two elementary structures of single-layer T1 precipitate were characterized, one with a Li-rich (T-1) and another with an Al-rich (DT-1) central layer. The T-1 structure is very similar to the structure proposed in the previous studies with a thickness of 0.505 nm. The DT-1 structure, however, is observed here for the first time and it has a thickness of 0.461 nm. Single-layer T1 precipitates with mixture T-1 + DT-1 properties were observed as well that suggest DT-1 is a precursor for T-1 T1 precipitate.
- It was found that the thickening of T1 phase occurs by alternative stacking of the T-1 and DT-1 elementary structures. Based on the strain difference GPA measurements, a sandwich, T-2 = 2 (T-1) + (DT-1), T1 precipitate is the most stable thickened precipitate. All precipitates after 257 h aging are found to be in this form.
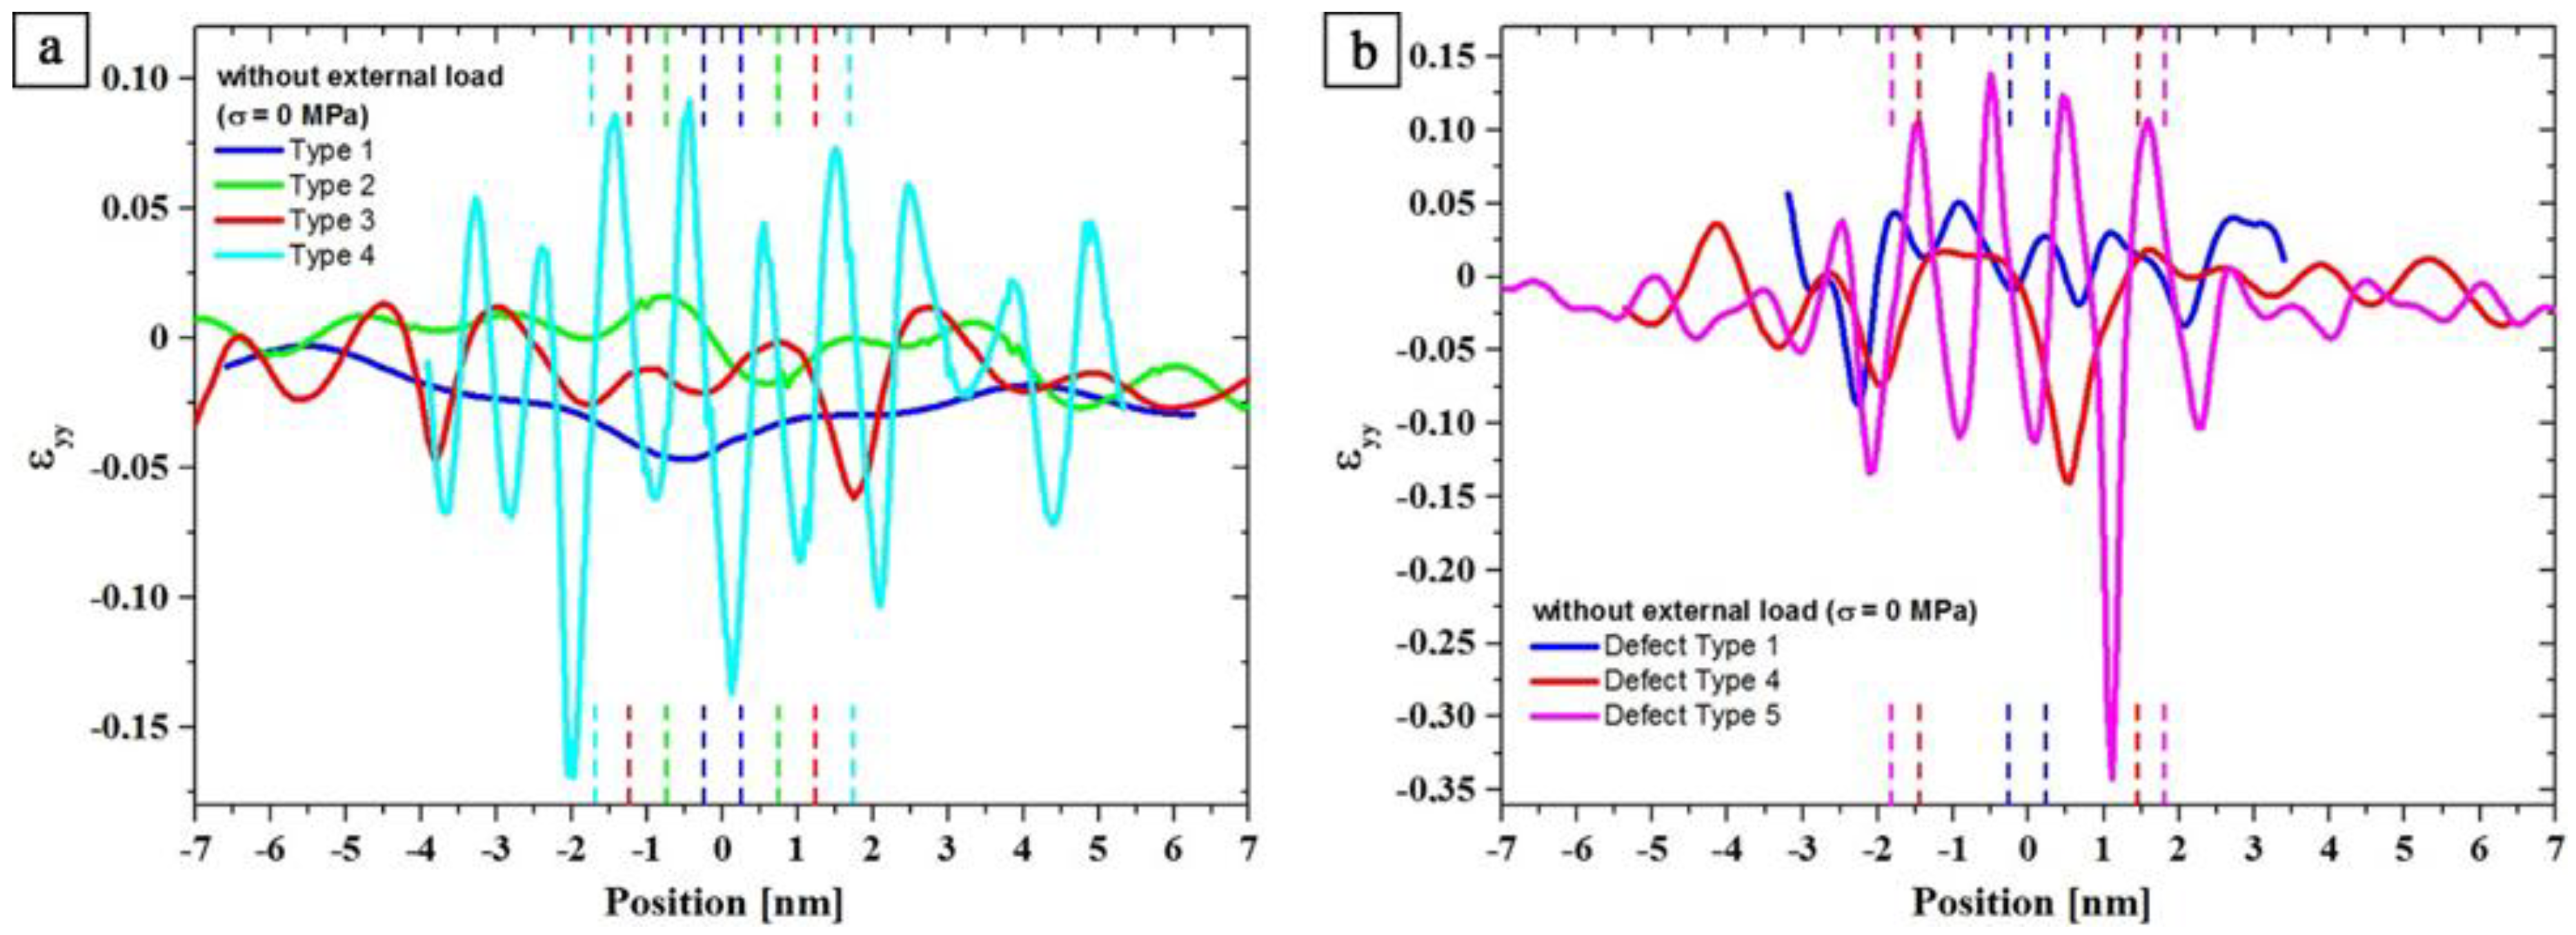
- Upon longer aging, further thickening of T1 precipitates was observed. Defected structures deviating from the alternative T-1 + DT-1 stacking sequence were observed as well, several of which were identified and studied in detail. In the absence of an external load, all thicker precipitates (including defected structures) carry a higher strain difference than T-2 stacking. In the presence of an external load, however, some of the defected structures form with lower strain difference that indicates they might have been preferred under loading condition. Furthermore, the frequency of precipitates with defected structures were found to be higher under loading condition.
Author Contributions
Funding
Acknowledgments
Conflicts of Interest
References
- Eswara Prasad, N.; Gokhale, A.A.; Wanhill, R.J.H. Aluminum Lithium Alloys: Processing, Properties, and Applications; Butterworth-Heinemann: Oxford, UK, 2014. [Google Scholar]
- Noble, B.; Thompson, G.E. T1 (Al2CuLi) Precipitation in Aluminium–Copper–Lithium Alloys. Metal Sci. J. 1972, 6, 167–174. [Google Scholar] [CrossRef]
- Noble, B.; McLauchlin, I.R.; Thompson, G. Solute atom clustering processes in aluminium-copper-lithium alloys. Acta Metall. 1970, 18, 339–345. [Google Scholar] [CrossRef]
- Gable, B.M.; Csontos, A.A.; Starke, E.A., Jr. A quench sensitivity study on the novel Al–Li–Cu–X alloy AF/C 458. J. Light Metals 2002, 2, 65–75. [Google Scholar] [CrossRef]
- Gable, B.M.; Zhu, A.W.; Csontos, A.A.; Starke, E.A., Jr. The role of plastic deformation on the competitive microstructural evolution and mechanical properties of a novel Al–Li–Cu–X alloy. J. Light Metals 2001, 1, 1–14. [Google Scholar] [CrossRef]
- Yoshimura, R.; Konno, T.J.; Abe, E.; Hiraga, K. Transmission electron microscopy study of the early stage of precipitates in aged Al–Li–Cu alloys. Acta Mater. 2003, 51, 2891–2903. [Google Scholar] [CrossRef]
- Yoshimura, R.; Konno, T.J.; Abe, E.; Hiraga, K. Transmission electron microscopy study of the evolution of precipitates in aged Al–Li–Cu alloys: The θ′ and T1 phases. Acta Mater. 2003, 51, 4251–4266. [Google Scholar] [CrossRef]
- Ringer, S.P.; Muddle, B.C.; Polmear, I.J. Effects of Cold Work on Precipitation in Al-Cu-Mg-(Ag) and Al-Cu-Li-(Mg-Ag) Alloys. Metall. Mater. Trans. A 1995, 26, 1659–1671. [Google Scholar] [CrossRef]
- Decreus, B.; Deschamps, A.; De Geuser, F.; Donnadieu, P.; Sigli, C.; Weyland, M. The influence of Cu/Li ratio on precipitation in Al-Cu-Li–x alloys. Acta Mater. 2013, 61, 2207–2218. [Google Scholar] [CrossRef]
- Cassada, W.A.; Shiflet, G.J.; Starke, E.A. Mechanism of Al2CuLi (T1) nucleation and growth. Metall. Trans. A 1991, 22, 287–297. [Google Scholar] [CrossRef]
- Cassada, W.A.; Shiflet, G.J.; Starke, E.A. The effect of plastic deformation on Al2CuLi (T1) precipitation. Metall. Trans. A 1991, 22, 299–306. [Google Scholar] [CrossRef]
- Howe, J.M.; Lee, J.; Vasudevan, A.K. Structure and deformation behavior of T1 precipitate plates in an Al-2Li-1 Cu alloy. Metall. Trans. A 1988, 19, 2911–2920. [Google Scholar] [CrossRef]
- Huang, J.C.; Ardell, A.J. Crystal structure and stability of T1 precipitates in aged Al–Li–Cu alloys. Mater. Sci. Technol. 1987, 3, 176–188. [Google Scholar] [CrossRef]
- Van Smaalen, S.; Meetsma, A.; De Boer, J.L.; Bronsveld, P.M. Refinement of the crystal structure of hexagonal Al2CuLi. J. Solid State Chem. 1990, 85, 293–298. [Google Scholar] [CrossRef]
- Donnadieu, P.; Shao, Y.; De Geuser, F.; Botton, G.A.; Lazar, S.; Cheynet, M.; de Boissieu, M.; Deschamps, A. Atomic structure of T1 precipitates in Al–Li–Cu alloys revisited with HAADF-STEM imaging and small-angle X-ray scattering. Acta Mater. 2011, 59, 462–472. [Google Scholar] [CrossRef]
- Dwyer, C.; Weyland, M.; Chang, L.Y.; Muddle, B.C. Combined electron beam imaging and ab initio modeling of T1 precipitates in Al–Li–Cu alloys. Appl. Phys. Lett. 2011, 98, 201909. [Google Scholar] [CrossRef]
- Kim, K.; Zhou, B.-C.; Wolverton, C. First-principles study of crystal structure and stability of T1 precipitates in Al-Li-Cu alloys. Acta Mater. 2018, 145, 337–346. [Google Scholar] [CrossRef]
- Decreus, B.; Bley, F.; Deschamps, A.; Donnadieu, P. Phase Transformations: Quantitative Characterization of the Precipitation Kinetics in an AA2198 Al-Li-Cu Alloy. In Proceedings of the ICAA-11, Aachen, Germany, 22–26 September 2008; pp. 1040–1046. [Google Scholar]
- Dorin, T.; Deschamps, A.; Geuser, F.D.; Sigli, C. Quantification and modelling of the microstructure/strength relationship by tailoring the morphological parameters of the T1 phase in an Al–Cu–Li alloy. Acta Mater. 2014, 75, 134–146. [Google Scholar] [CrossRef]
- Kang, S.J.; Kim, T.-H.; Yang, C.-W.; Lee, J.I.; Park, E.S.; Noh, T.W.; Kim, M. Atomic structure and growth mechanism of T1 precipitate in Al–Cu–Li–Mg–Ag alloy. Scr. Mater. 2015, 109, 68–71. [Google Scholar] [CrossRef]
- Araullo-Peters, V.; Gault, B.; Geuser, F.D.; Deschamps, A.; Cairney, J.M. Microstructural evolution during ageing of Al–Cu–Li–x alloys. Acta Mater. 2014, 66, 199–208. [Google Scholar] [CrossRef]
- Blum, W. Creep of aluminium and aluminium alloys. In Proceedings of the Symposium on Hot Deformation of Al-Alloys, TMS Fall Meeting, Detroit, MI, USA, 8–12 October 1990; pp. 1–29. [Google Scholar]
- Morris, M.A.; Martin, J.L. Evolution of internal stresses and substructure during creep at intermediate temperatures. Acta Metall. 1984, 32, 549–561. [Google Scholar] [CrossRef]
- Morris, M.A.; Martin, J.L. Microstructural dependence of effective stresses and activation volumes during creep. Acta Metall. 1984, 32, 1609–1623. [Google Scholar] [CrossRef]
- Blum, W.; Rosen, A.; Cegielska, A.; Martin, J.L. Two mechanisms of dislocation motion during creep. Acta Metall. 1989, 37, 2439–2453. [Google Scholar] [CrossRef]
- Mills, M.J.; Gibeling, J.C.; Nix, W.D. A dislocation loop model for creep of solid solutions based on the steady state and transient creep properties of Al-5,5 at. % Mg. Acta Metall. 1985, 33, 1503–1514. [Google Scholar] [CrossRef]
- Mills, M.J.; Gibeling, J.C.; Nix, W.D. Measurement of anelastic creep strains in Al-5,5 at. % Mg using a new technique: Implications for the mechanism of class I creep. Acta Metall. 1986, 34, 915–925. [Google Scholar] [CrossRef]
- Skrotzki, B. Mechanical Loading of Light Alloys at Elevated Temperature; VDI-Verlag GmbH: Düsseldorf, Germany, 2001; Volume 629. [Google Scholar]
- Skrotzki, B.; Murken, J. On the Effect of Stress on Nucleation, Growth, and Coarsening of Precipitates in Age-Hardenable Aluminum Alloys. In Lightweight Alloys for Aerospace Application; Jata, K., Lee, E.W., Frazier, W., Kim, N.J., Eds.; Wiley: Hoboken, NJ, USA, 2013. [Google Scholar]
- Skrotzki, B.; Shiflet, G.; Starke, E. On the effect of stress on nucleation and growth of precipitates in an Al-Cu-Mg-Ag alloy. Metall. Mater. Trans. A 1996, 27, 3431–3444. [Google Scholar] [CrossRef]
- Tsivoulas, D. Heterogeneous Nucleation of the T1 Phase on Dispersoids in Al-Cu-Li Alloys. Metall. Mater. Trans. A 2015, 46, 2342–2346. [Google Scholar] [CrossRef]
- Dorin, T.; De Geuser, F.; Lefebvre, W.; Sigli, C.; Deschamps, A. Strengthening mechanisms of T1 precipitates and their influence on the plasticity of an Al–Cu–Li alloy. Mater. Sci. Eng. A 2014, 605, 119–126. [Google Scholar] [CrossRef]
- Häusler, I.; Schwarze, C.; Umer Bilal, M.; Valencia Ramirez, D.; Hetaba, W.; Darvishi Kamachali, R.; Skrotzki, B. Precipitation of T1 and θ′ Phase in Al-4Cu-1Li-0.25Mn During Age Hardening: Microstructural Investigation and Phase-Field Simulation. Materials 2017, 10, 117. [Google Scholar] [CrossRef]
- DIN EN ISO 6506-1: Metallic Materials—Brinell Hardness Test—Part 1: Test Method; Beuth Verlag GmbH: Berlin, Germany, 2015.
- Williams, D.B.; Carter, C.B. Transmission Electron Microscopy; Springer: Boston, MA, USA, 2009. [Google Scholar]
- Castro Riglos, M.V.; Tolley, A. A method for thin foil thickness determination by transmission electron microscopy. Appl. Surf. Sci. 2007, 254, 420–424. [Google Scholar] [CrossRef]
- Häusler, I. Determination of volume fraction of discrete oriented circlar disc-shaped preicpitates in the transmission mode. Pract. Metallogr. 2017, 54, 816–837. [Google Scholar] [CrossRef]
- Hÿtch, M.J.; Snoeck, E.; Kilaas, R. Quantitative measurement of displacement and strain fields from HREM micrographs. Ultramicroscopy 1998, 74, 131–146. [Google Scholar] [CrossRef]
- Müller-Caspary, K.; Mehrtens, T.; Schowalter, M.; Grieb, T.; Rosenauer, A.; Krause, F.F.; Mahr, C.; Potapov, P. ImageEval. A software for the processing, evaluation and acquisition of (S)TEM images. In European Microscopy Congress 2016: Proceedings—Instrumenation and Methods; Wiley-VCH Verlag GmbH & Co.: Weinheim, Germany, 2016; pp. 481–482. [Google Scholar]
- Gao, Z.; Liu, J.Z.; Chen, J.H.; Duan, S.Y.; Liu, Z.R.; Ming, W.Q.; Wu, C.L. Formation mechanism of precipitate T1 in AlCuLi alloys. J. Alloys Compd. 2015, 624, 22–26. [Google Scholar] [CrossRef]
- Liu, C.; Malladi, S.K.; Xu, Q.; Chen, J.; Tichelaar, F.D.; Zhuge, X.; Zandbergen, H.W. In-situ STEM imaging of growth and phase change of individual CuAlX precipitates in Al alloy. Sci. Rep. 2017, 7, 2184. [Google Scholar] [CrossRef] [PubMed]
- Dorin, T.; Deschamps, A.; De Geuser, F.; Lefebvre, W.; Sigli, C. Quantitative description of the T1 formation kinetics in an Al-Cu-Li alloy using diffential scanning calorimetry, small-angle X-ray scattering and transmission electron microscopy. Philos. Mag. 2014, 94, 1012–1030. [Google Scholar] [CrossRef]
- Li, D.Y.; Chen, L.Q. Shape evolution and splitting of coherent particles under applied stresses. Acta Mater. 1998, 47, 247–257. [Google Scholar] [CrossRef]
- Gumbmann, E.; Lefebvre, W.; De Geuser, F.; Sigli, C.; Deschamps, A. The effect of minor solute additions on the precipitation path of an AlCuLi alloy. Acta Mater. 2016, 115, 104–114. [Google Scholar] [CrossRef]
- Itoh, G.; Cui, Q.; Kanno, M. Effects of a small addition of magnesium and silver on the precipitation of T1 phase in an Al–4%Cu–1.1%Li–0.2%Zr alloy. Mater. Sci. Eng. A 1996, 211, 128–137. [Google Scholar] [CrossRef]
- Bourgeois, L.; Dwyer, C.; Weyland, M.; Nie, J.-F.; Muddle, B.C. The magic thicknesses of θ′ precipitates in Sn-microalloyed Al–Cu. Acta Mater. 2012, 60, 633–644. [Google Scholar] [CrossRef]
- Shiflet, G.J.; Mangan, M.A.; Meng, W.G. Growth by Ledges. Interface Sci. 1998, 6, 133–154. [Google Scholar] [CrossRef]
- Porter, D.A.; Easterling, K.E. Phase Transformations in Metals and Alloys, 2nd ed.; Chapmann & Hall: London, UK, 1993. [Google Scholar]
- Dahmen, U.; Westmacott, K.H. Ledge structure and the mechanism of θ′ precipitate growth in Al–Cu. Phys. Status Solidi A 1983, 80, 249–262. [Google Scholar] [CrossRef]


| Sample | Pre-Treatment | External Load (MPa) | Temperature (°C) | Time (h) |
|---|---|---|---|---|
| Ref. 0 | PA (17 h/180 °C) | - | - | - |
| Ref. 1 | PA (17 h/180 °C) | - | 180 | 257 |
| Ref. 2 | PA (17 h/180 °C) | - | 180 | 1002 |
| Creep test 1 | PA (17 h/180 °C) | 155 | 180 | 257 |
| Creep test 2 | PA (17 h/180 °C) | 155 | 180 | 1002 |
| Sample | Aging/Creep Time (h) | Brinell Hardness HBW 2.5/62.5 | |
|---|---|---|---|
| load free aging | creep | ||
| Ref. 0 | PA | 158 ± 7 | - |
| Ref. 1/Creep test 1 | PA + 257 | 133 ± 2 | 132 ± 2 |
| Ref. 2/Creep test 2 | PA + 1002 | 115 ± 3 | 116 ± 2 |
| Specimen | T1 Type | Defect Type | Total Defects | |||||||
|---|---|---|---|---|---|---|---|---|---|---|
| T-1 | T-2 | T-3 | T-4 | DT-1 | DT-2 | DT-3 | DT-4 | DT-5 | ||
| Ref. 0 | 75% | - | - | - | 25% | - | - | - | - | 25% |
| Ref. 1 | - | 100% | - | - | - | - | - | - | - | - |
| Ref. 2 | - | 20% | 47% | 20% | - | - | - | 6.5% | 6.5% | 13% |
| Creep test 1 | 21% | 52.7% | 21% | - | - | - | 5.3% | - | - | 5.3% |
| Creep test 2 | - | 45.4% | - | 27.3% | - | 9.1% | 9.1% | - | 9.1% | 27.3% |
| Specimen | (nm) | (nm) | ||
|---|---|---|---|---|
| T1 | θ′ | T1 | θ′ | |
| Ref. 0 | 93 ± 41 | 68 ± 30 | 0.494 | 2.402 |
| Ref. 1 | 76 ± 34 | 60 ± 25 | 1.471 | 4.062 |
| Ref. 2 | 74 ± 26 | 80 ± 30 | 2.546 | 5.686 |
| Creep test 1 | 72 ± 32 | 59 ± 27 | 1.495 | 3.648 |
| Creep test 2 | 129 ± 64 | 91 ± 44 | 2.231 | 4.694 |
© 2018 by the authors. Licensee MDPI, Basel, Switzerland. This article is an open access article distributed under the terms and conditions of the Creative Commons Attribution (CC BY) license (http://creativecommons.org/licenses/by/4.0/).
Share and Cite
Häusler, I.; Kamachali, R.D.; Hetaba, W.; Skrotzki, B. Thickening of T1 Precipitates during Aging of a High Purity Al–4Cu–1Li–0.25Mn Alloy. Materials 2019, 12, 30. https://doi.org/10.3390/ma12010030
Häusler I, Kamachali RD, Hetaba W, Skrotzki B. Thickening of T1 Precipitates during Aging of a High Purity Al–4Cu–1Li–0.25Mn Alloy. Materials. 2019; 12(1):30. https://doi.org/10.3390/ma12010030
Chicago/Turabian StyleHäusler, Ines, Reza Darvishi Kamachali, Walid Hetaba, and Birgit Skrotzki. 2019. "Thickening of T1 Precipitates during Aging of a High Purity Al–4Cu–1Li–0.25Mn Alloy" Materials 12, no. 1: 30. https://doi.org/10.3390/ma12010030
APA StyleHäusler, I., Kamachali, R. D., Hetaba, W., & Skrotzki, B. (2019). Thickening of T1 Precipitates during Aging of a High Purity Al–4Cu–1Li–0.25Mn Alloy. Materials, 12(1), 30. https://doi.org/10.3390/ma12010030