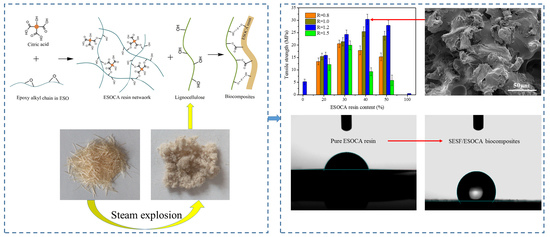
Preparation and Characteristics of Biocomposites Based on Steam Exploded Sisal Fiber Modified with Amphipathic Epoxidized Soybean Oil Resin

Abstract
1. Introduction
2. Materials and Methods
2.1. Materials
2.2. Preparation of Steam Exploded Sisal Fiber (SESF) Preforms
2.3. Preparation of ESOCA Prepolymer
2.4. Preparation of SESF/ESOCA Resin (SEC) Biocomposites
2.5. Characterization
2.5.1. Fourier-Transform Infrared (FT-IR) Spectroscopy
2.5.2. Thermogravimetric Analysis (TGA)
2.5.3. Differential Scanning Calorimetry (DSC)
2.5.4. Mechanical Properties
2.5.5. Microtopography
2.5.6. Water Absorption Measurements
2.5.7. Water Contact Angle Measurements
3. Results and Discussions
3.1. Effect of SESE Pretreatment on Morphology of SF
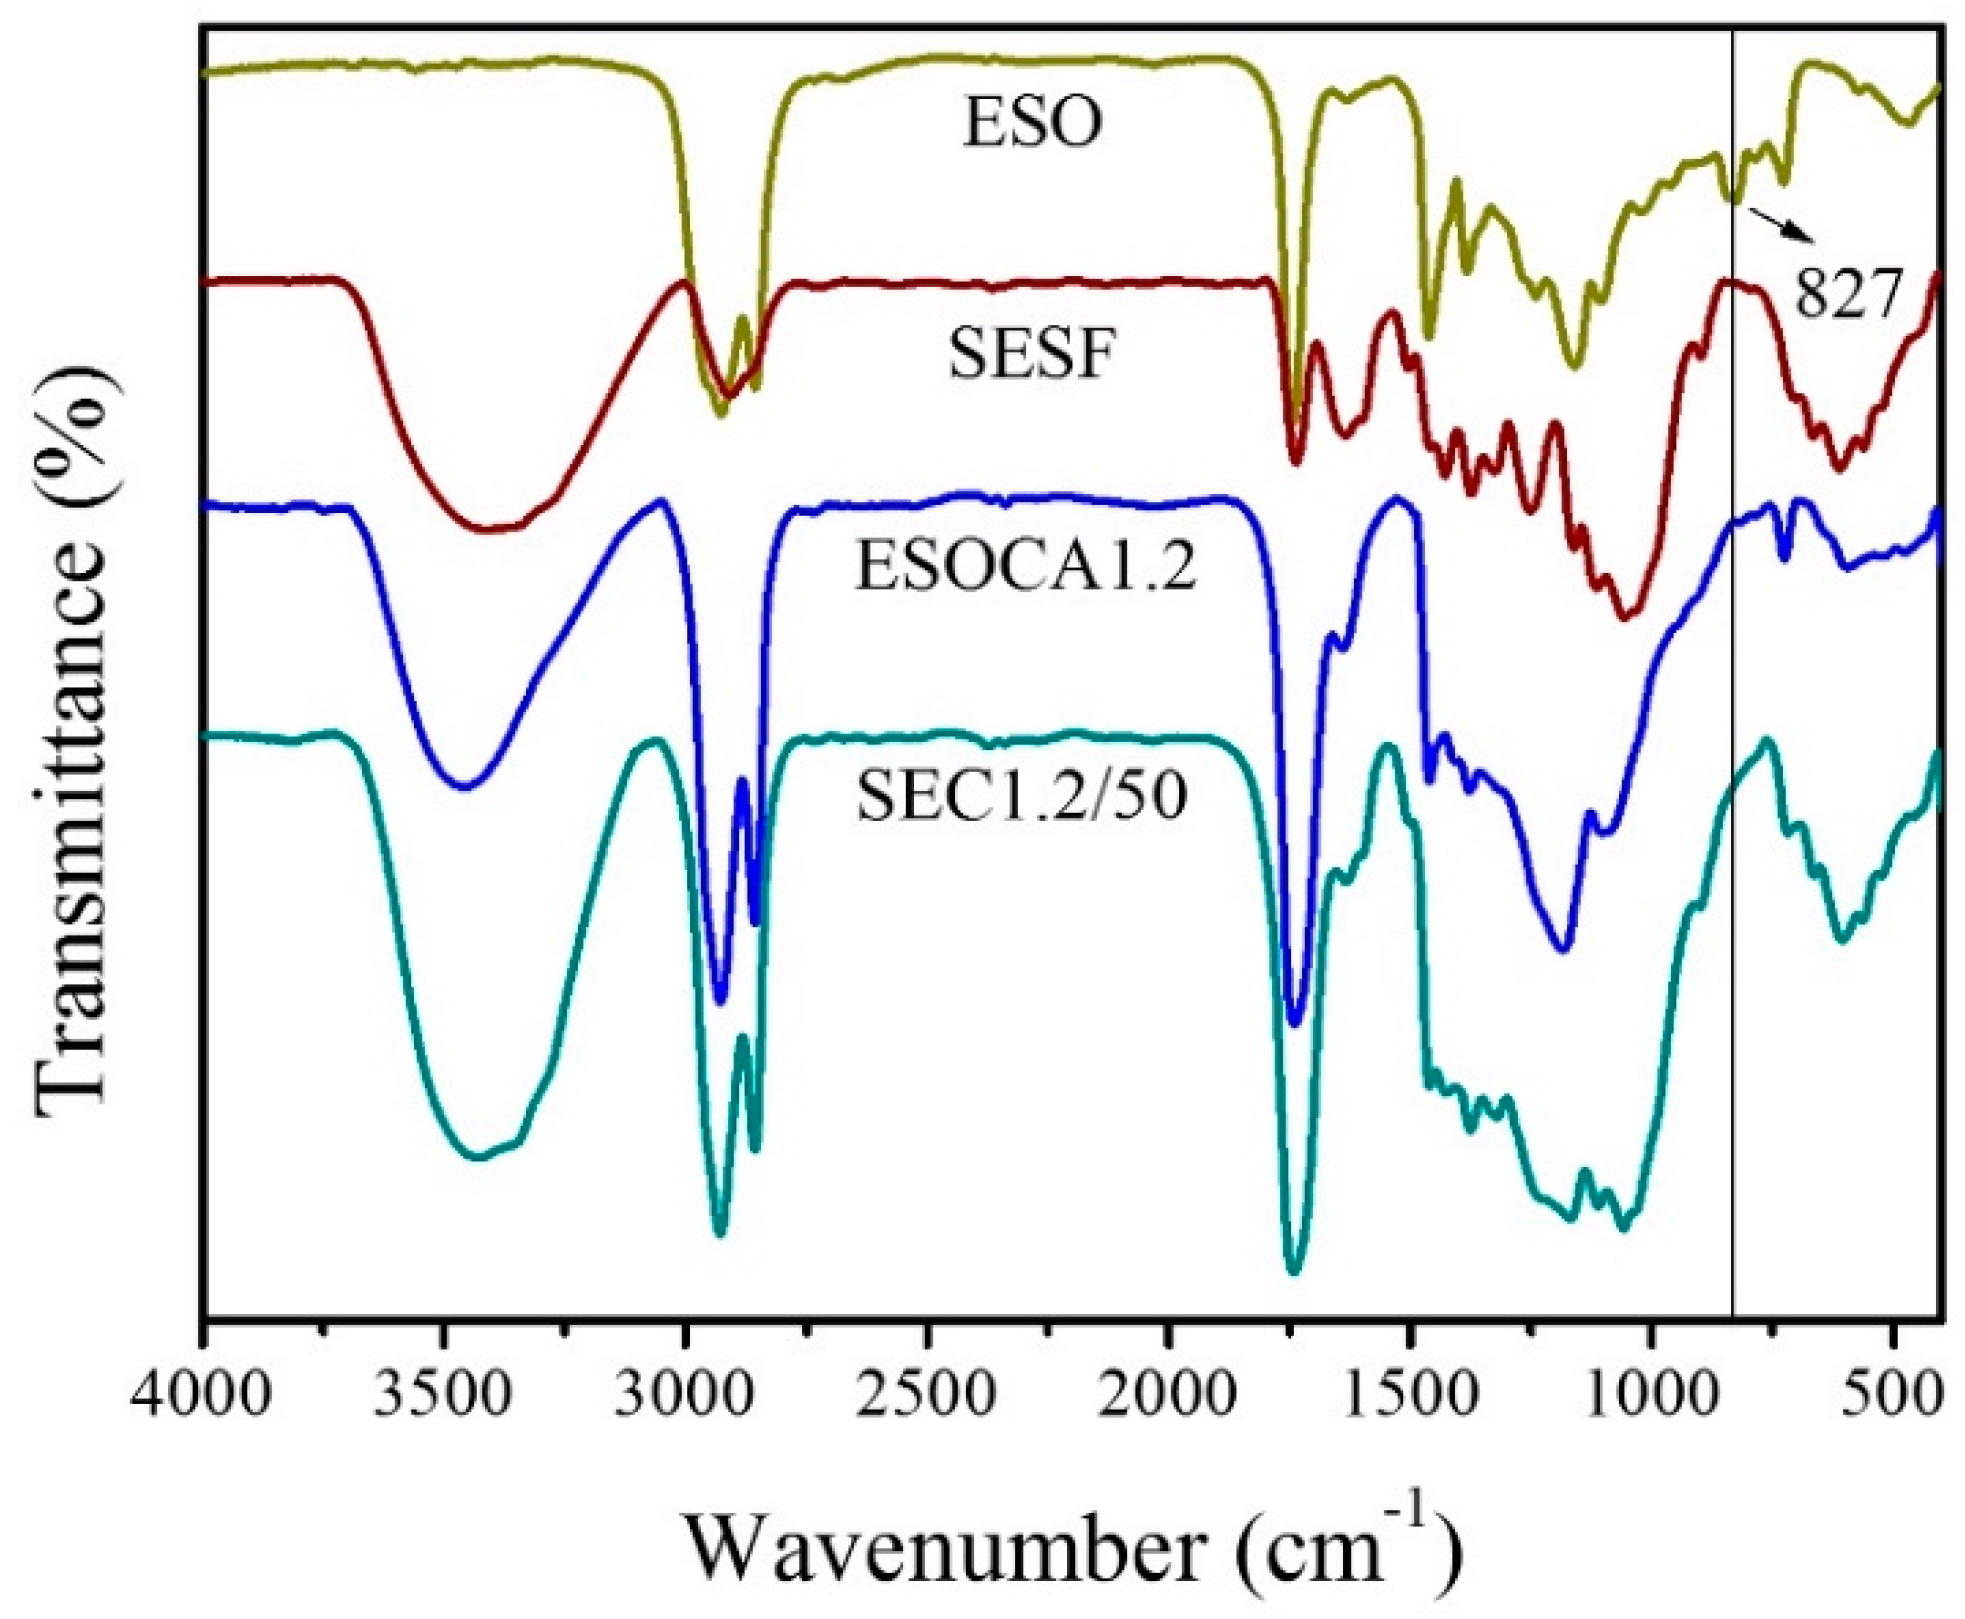
3.2. FT-IR Spectroscopy
3.3. TGA
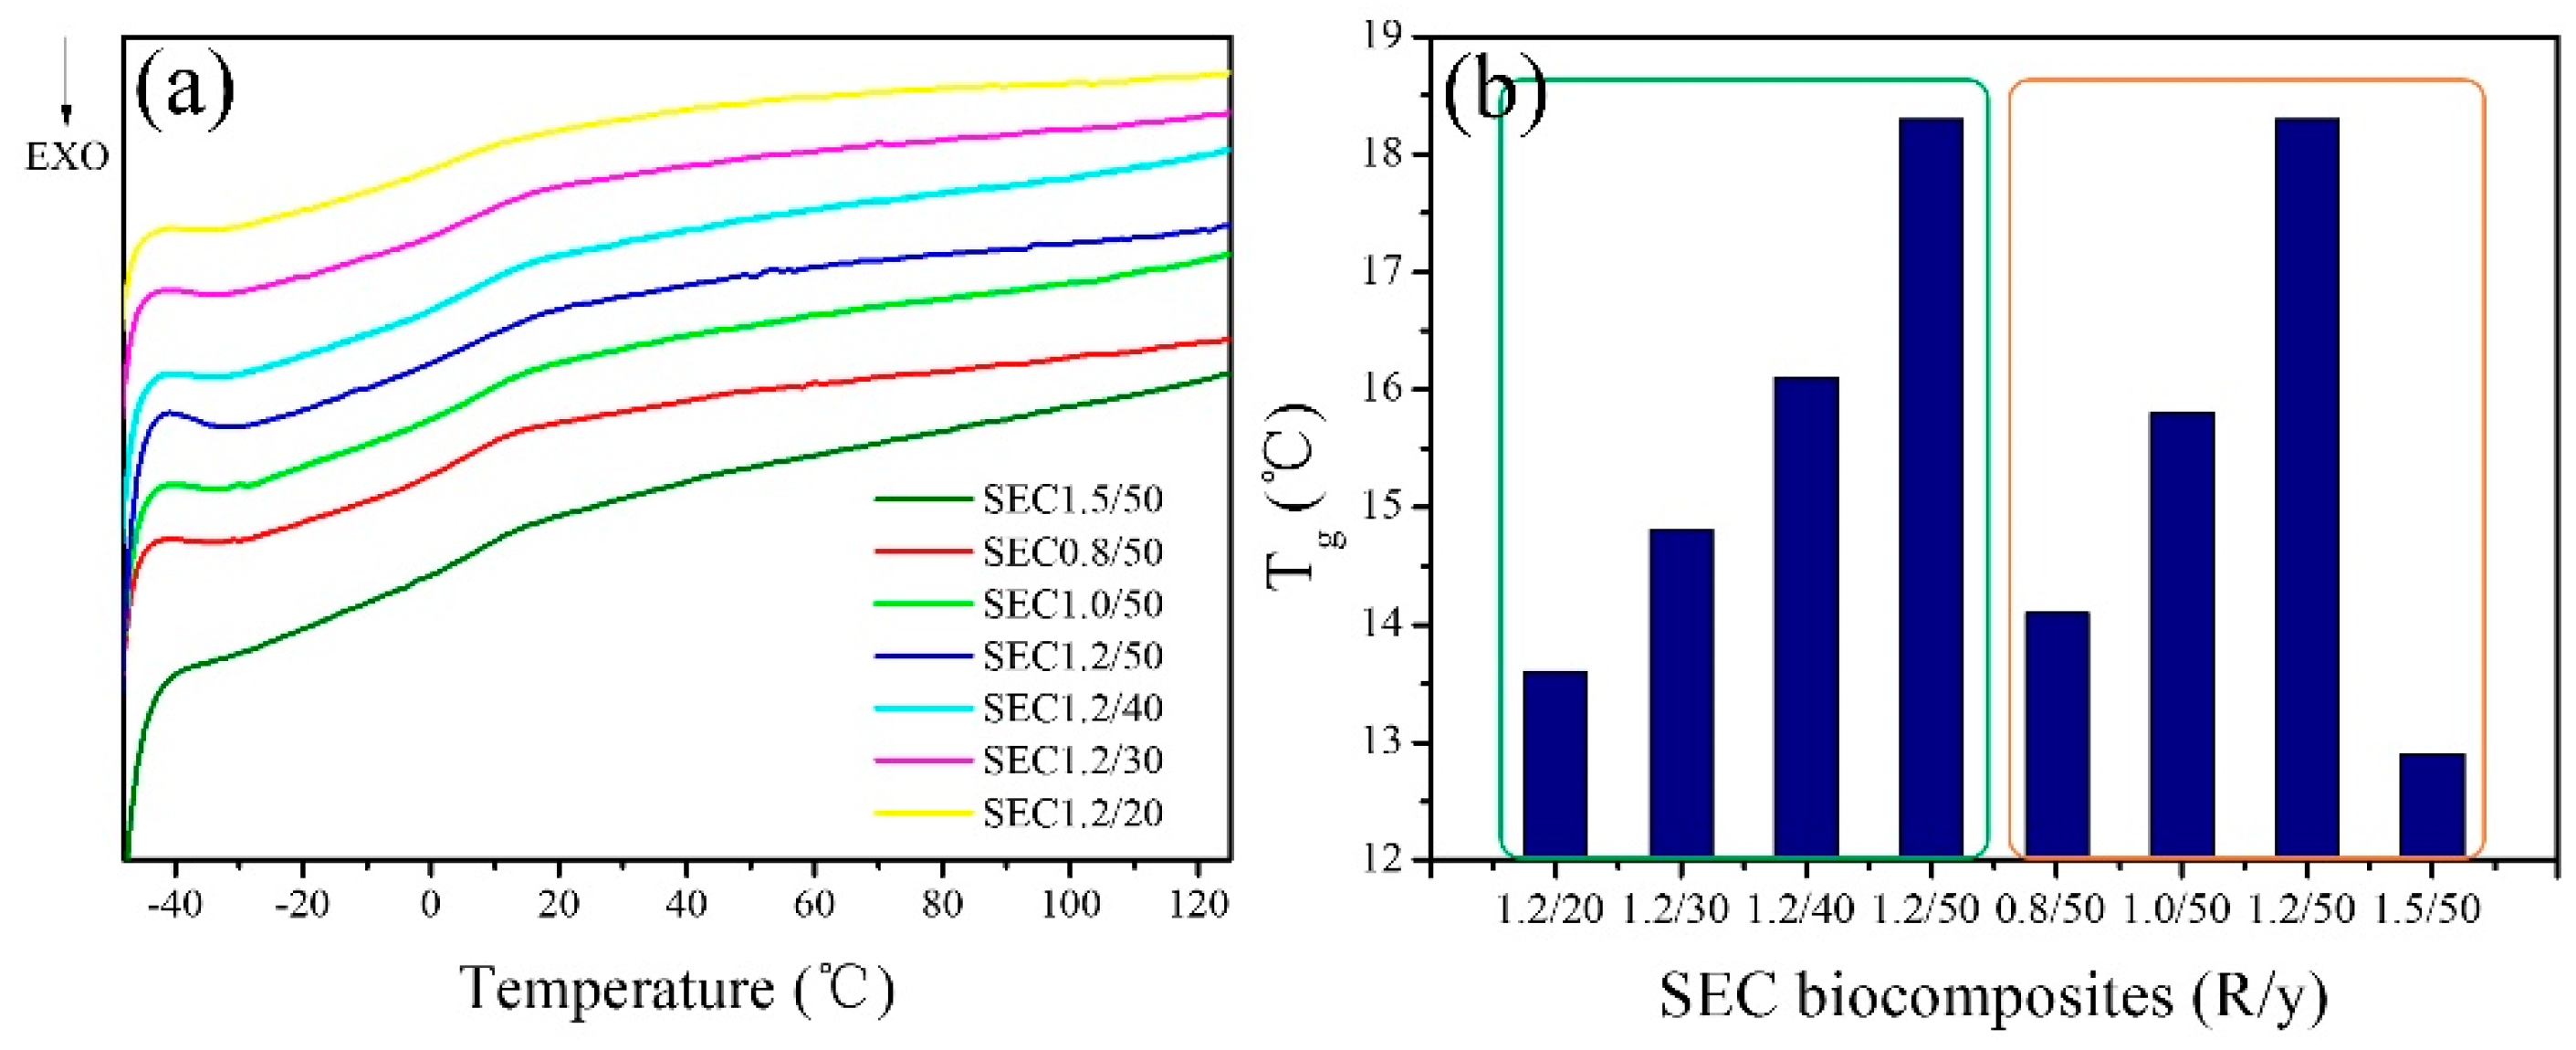
3.4. DSC
3.5. Mechanical Properties of the Biocomposites
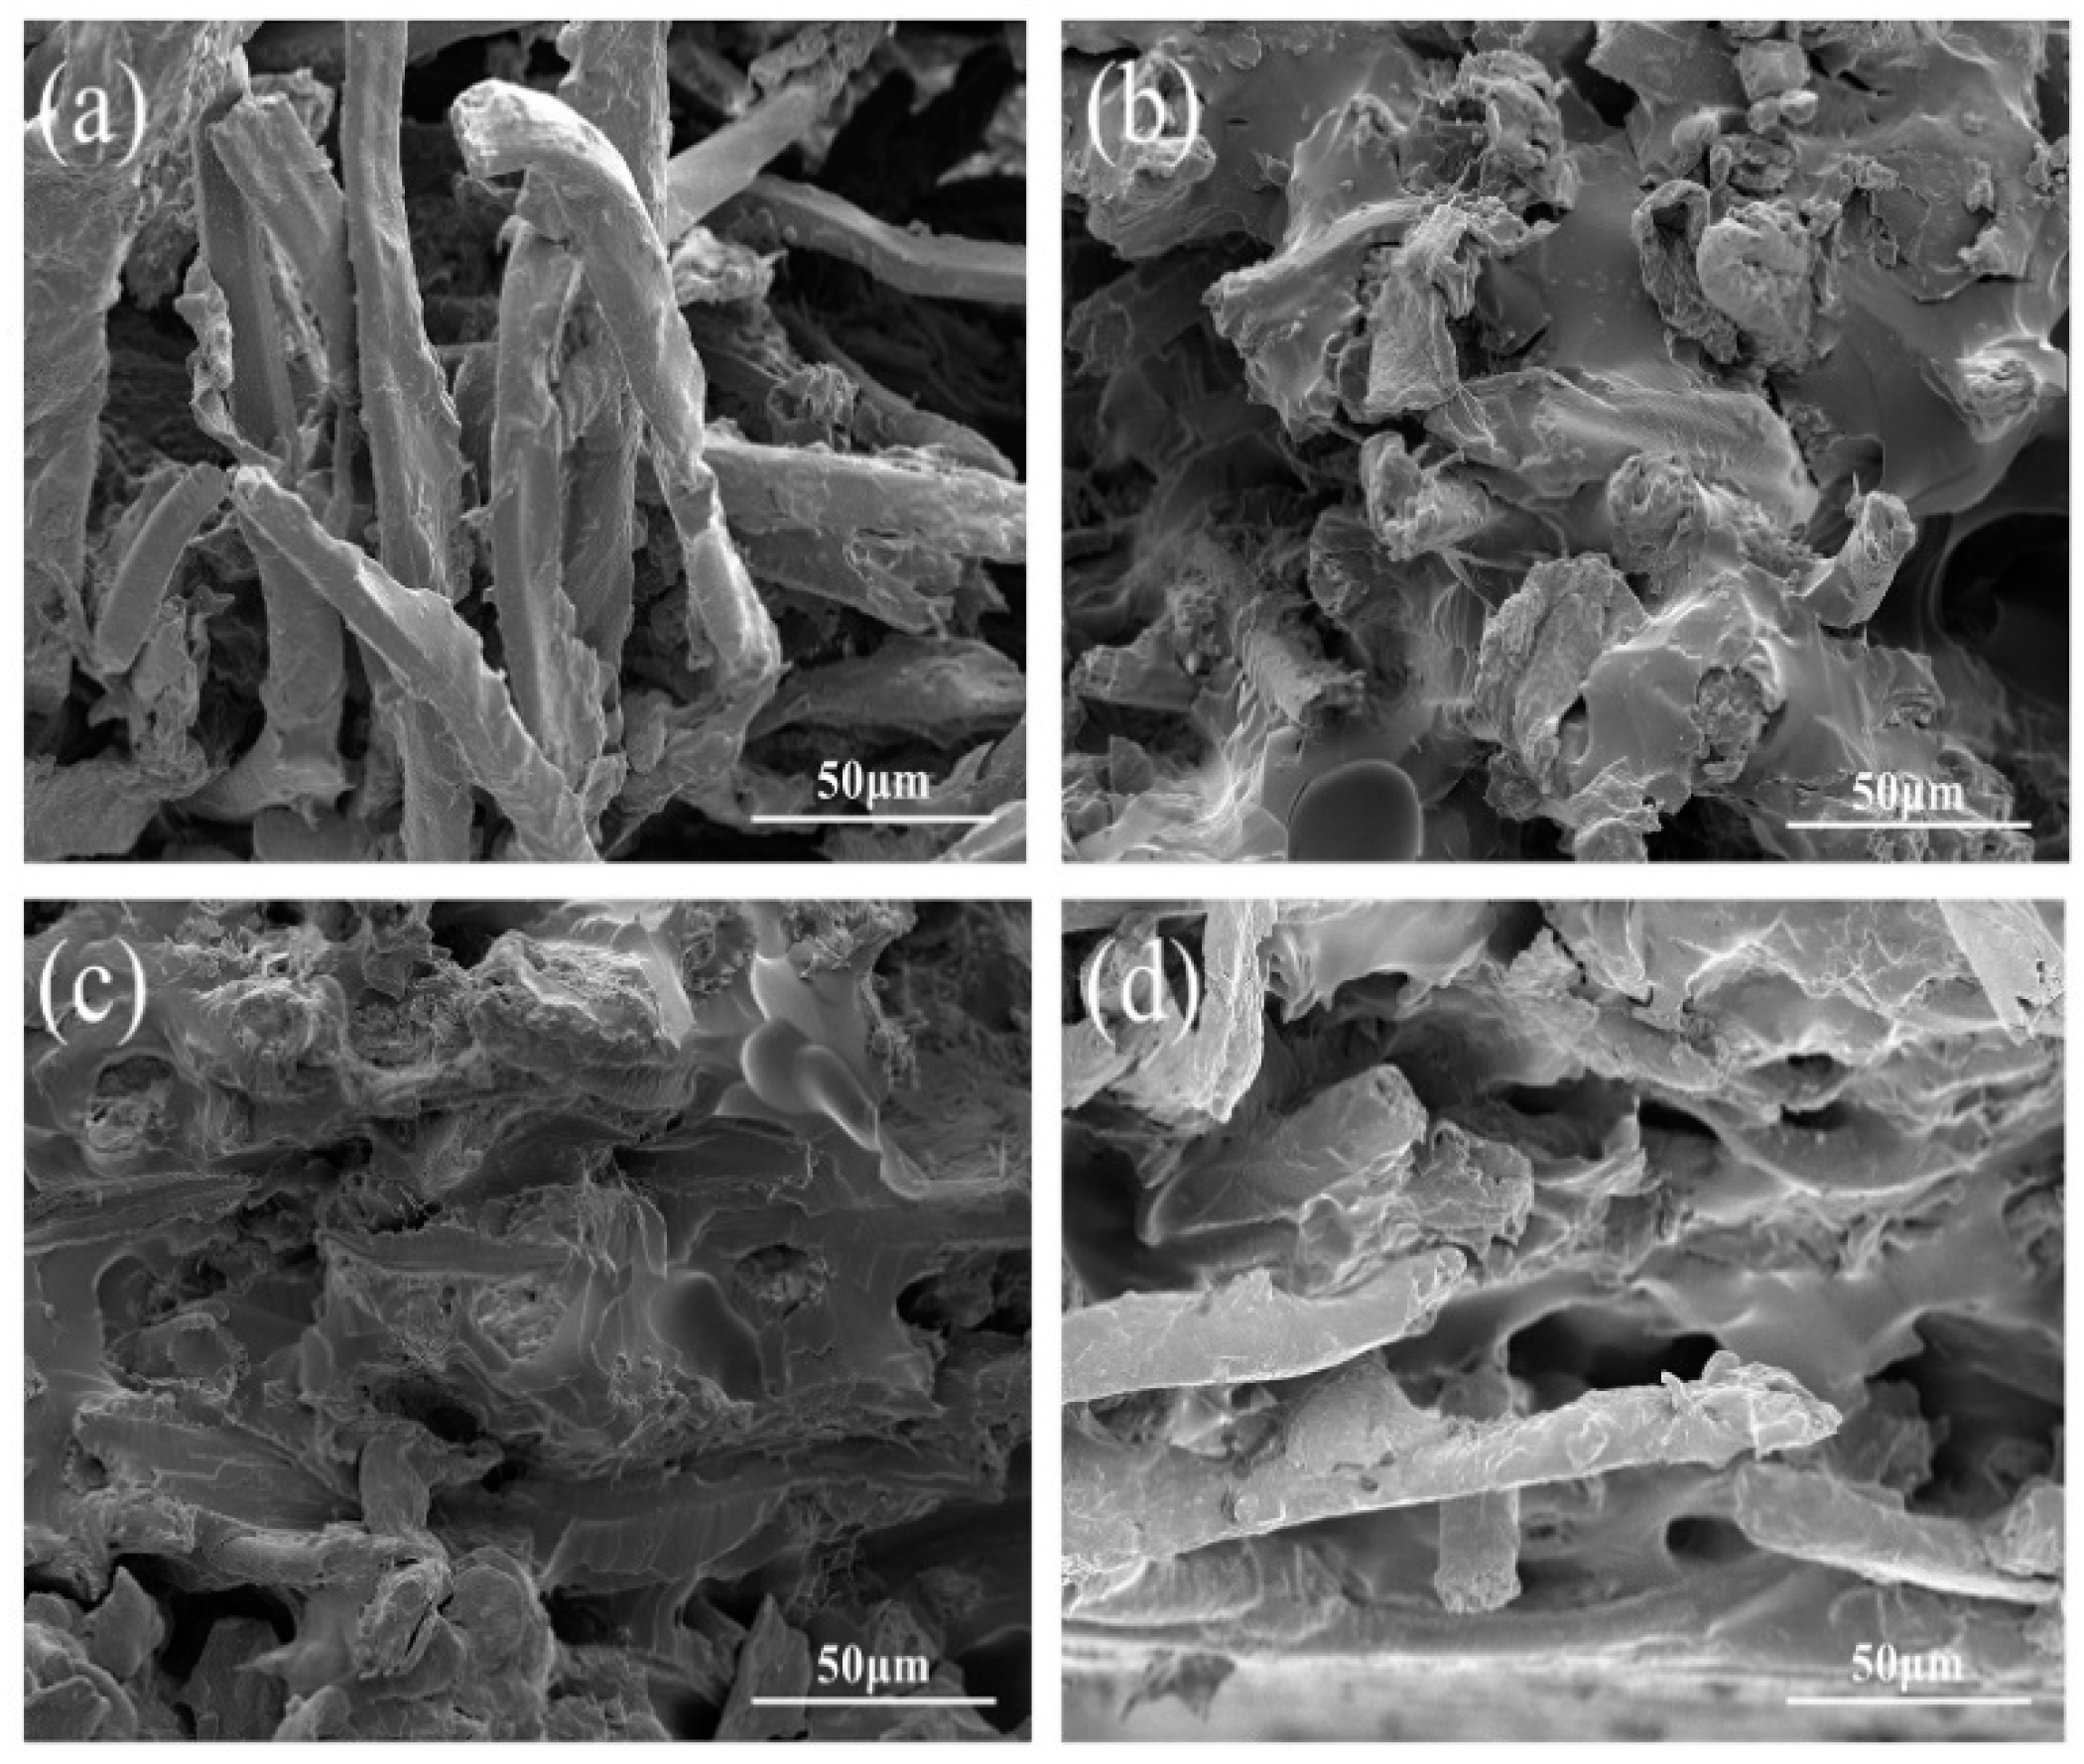
3.6. Morphologies of SEC Biocomposites
3.7. Water Absorption
3.8. Water Contact Angles of SEC Biocomposites
4. Conclusions
Author Contributions
Funding
Conflicts of Interest
References
- Masek, A.; Diakowska, K.; Zaborski, M. Physico-mechanical and thermal properties of epoxidized natural rubber/polylactide (ENR/PLA) composites reinforced with lignocellulose. J. Therm. Anal. Calorim. 2016, 125, 1467–1476. [Google Scholar] [CrossRef]
- Zhang, Z.; Song, J.; Han, B. Catalytic Transformation of Lignocellulose into Chemicals and Fuel Products in Ionic Liquids. Chem. Rev. 2017, 117, 6834–6880. [Google Scholar] [CrossRef] [PubMed]
- Arévalo, R.; Peijs, T. Binderless all-cellulose fibreboard from microfibrillated lignocellulosic natural fibres. Compos. Part A Appl. Sci. Manuf. 2016, 83, 38–46. [Google Scholar] [CrossRef]
- Sridach, W. Preparation and characterization of moulded pulp container made by hot compression moulding. IPPTA Q. J. Indian Pulp Pap. Technol. Assoc. 2014, 26, 89–95. [Google Scholar]
- Xiong, C.; Qi, R.; Wang, Y. Wood-thermoplastic composites from wood flour and high-density polyethylene. J. Appl. Polym. Sci. 2009, 114, 1160–1168. [Google Scholar] [CrossRef]
- Way, C.; Dean, K.; Wu, D.Y.; Palombo, E. Biodegradation of sequentially surface treated lignocellulose reinforced polylactic acid composites: Carbon dioxide evolution and morphology. Polym. Degrad. Stab. 2012, 97, 430–438. [Google Scholar] [CrossRef]
- Bana, R.; Banthia, A.K. Mechanical and thermal analysis of poly (Vinyl-Alcohol) and modified wood dust composites. J. Wood Chem. Technol. 2011, 31, 218–232. [Google Scholar] [CrossRef]
- Müller, P.; Renner, K.; Móczó, J.; Fekete, E.; Pukánszky, B. Thermoplastic starch/wood composites: Interfacial interactions and functional properties. Carbohydr. Polym. 2014, 102, 821–829. [Google Scholar] [CrossRef] [PubMed]
- Jia, P.; Zhang, M.; Hu, L.; Zhou, Y. Green plasticizers derived from soybean oil for poly(vinyl chloride) as a renewable resource material. Korean J. Chem. Eng. 2016, 33, 1080–1087. [Google Scholar] [CrossRef]
- He, M.; Zhou, J.; Zhang, H.; Luo, Z.; Yao, J. Microcrystalline cellulose as reactive reinforcing fillers for epoxidized soybean oil polymer composites. J. Appl. Polym. Sci. 2015, 132. [Google Scholar] [CrossRef]
- Tanrattanakul, V.; Saithai, P. Mechanical properties of bioplastics and bioplastic-organoclay nanocomposites prepared from epoxidized soybean oil with different epoxide contents. J. Appl. Polym. Sci. 2009, 114, 3057–3067. [Google Scholar] [CrossRef]
- Liu, Z.; Erhan, S.Z.; Akin, D.E.; Barton, F.E. “Green” composites from renewable resources: Preparation of epoxidized soybean oil and flax fiber composites. J. Agric. Food Chem. 2006, 54, 2134–2137. [Google Scholar] [CrossRef] [PubMed]
- Tan, S.G.; Ahmad, Z.; Chow, W.S. Interpenetrating polymer network structured thermosets prepared from epoxidized soybean oil/diglycidyl ether of bisphenol A. Polym. Int. 2014, 63, 273–279. [Google Scholar] [CrossRef]
- Miao, S.; Liu, K.; Wang, P.; Su, Z.; Zhang, S. Preparation and characterization of epoxidized soybean oil-based paper composite as potential water-resistant materials. J. Appl. Polym. Sci. 2015, 132. [Google Scholar] [CrossRef]
- Huang, X.; Liu, H.; Shang, S.; Rao, X.; Song, J. Preparation and Characterization of Polymeric Surfactants Based on Epoxidized Soybean Oil Grafted Hydroxyethyl Cellulose. J. Agric. Food Chem. 2015, 63, 9062–9068. [Google Scholar] [CrossRef] [PubMed]
- Shogren, R.L.; Petrovic, Z.; Liu, Z.; Erhan, S.Z. Biodegradation Behavior of Some Vegetable Oil-based Polymers. J. Polym. Environ. 2004, 12, 173–178. [Google Scholar] [CrossRef]
- Altuna, F.I.; Pettarin, V.; Williams, R.J.J. Self-healable polymer networks based on the cross-linking of epoxidised soybean oil by an aqueous citric acid solution. Green Chem. 2013, 15, 3360–3366. [Google Scholar] [CrossRef]
- Sahoo, S.K.; Khandelwal, V.; Manik, G. Development of completely bio-based epoxy networks derived from epoxidized linseed and castor oil cured with citric acid. Polym. Adv. Technol. 2018, 29, 2080–2090. [Google Scholar] [CrossRef]
- Gogoi, P.; Horo, H.; Khannam, M.; Dolui, S.K. In situ synthesis of green bionanocomposites based on aqueous citric acid cured epoxidized soybean oil-carboxylic acid functionalized multiwalled carbon nanotubes. Ind. Crops Prod. 2015, 76, 346–354. [Google Scholar] [CrossRef]
- Shibata, M.; Teramoto, N.; Makino, K. Preparation and properties of biocomposites composed of epoxidized soybean oil, tannic acid, and microfibrillated cellulose. J. Appl. Polym. Sci. 2011, 120, 273–278. [Google Scholar] [CrossRef]
- Feng, Y.; Lei, B.; Liang, Y.; Zhong, H.; Yin, X.; Qu, J.; He, H. Changes in the Microstructure and Components of Eulaliopsis binata Treated by Continuous Screw Extrusion Steam Explosion. BioResources 2016, 11, 9455–9466. [Google Scholar] [CrossRef]
- Benítez-Guerrero, M.; Pérez-Maqueda, L.A.; Artiaga, R.; Sánchez-Jiménez, P.E.; Pascual-Cosp, J. Structural and Chemical Characteristics of Sisal Fiber and Its Components: Effect of Washing and Grinding. J. Nat. Fibers 2017, 14, 26–39. [Google Scholar] [CrossRef]
- Fortea-Verdejo, M.; Lee, K.Y.; Zimmermann, T.; Bismarck, A. Upgrading flax nonwovens: Nanocellulose as binder to produce rigid and robust flax fibre preforms. Compos. Part A Appl. Sci. Manuf. 2016, 83, 63–71. [Google Scholar] [CrossRef]
- Ma, P.; Lan, J.; Feng, Y.; Liu, R.; Qu, J.; He, H. Effects of continuous steam explosion on the microstructure and properties of eucalyptus fibers. BioResources 2016, 11, 1417–1431. [Google Scholar] [CrossRef]
- Tan, S.G.; Chow, W.S. Curing characteristics and thermal properties of Epoxidized soybean oil based thermosetting resin. JAOCS J. Am. Oil Chem. Soc. 2011, 88, 915–923. [Google Scholar] [CrossRef]
- Xu, F.; Jiang, J.X.; Sun, R.C.; She, D.; Peng, B.; Sun, J.X.; Kennedy, J.F. Rapid esterification of wheat straw hemicelluloses induced by microwave irradiation. Carbohydr. Polym. 2008, 73, 612–620. [Google Scholar] [CrossRef] [PubMed]
- Mashouf Roudsari, G.; Mohanty, A.K.; Misra, M. Study of the curing kinetics of epoxy resins with biobased hardener and epoxidized soybean oil. ACS Sustain. Chem. Eng. 2014, 2, 2111–2116. [Google Scholar] [CrossRef]
- Sahoo, S.K.; Khandelwal, V.; Manik, G. Influence of epoxidized linseed oil and sisal fibers on structure-property relationship of epoxy biocomposite. Polym. Compos. 2018. [Google Scholar] [CrossRef]
- Huang, X.; Wang, A.; Xu, X.; Liu, H.; Shang, S. Enhancement of hydrophobic properties of cellulose fibers via grafting with polymeric epoxidized soybean oil. ACS Sustain. Chem. Eng. 2017, 5, 1619–1627. [Google Scholar] [CrossRef]
- Raza, M.A.; Van Swigchem, J.; Jansen, H.P.; Zandvliet, H.J.W.; Poelsema, B.; Kooij, E.S. Droplet impact on hydrophobic surfaces with hierarchical roughness. Surf. Topogr. Metrol. Prop. 2014, 2, 035002. [Google Scholar] [CrossRef]


| Abbreviations | Name |
|---|---|
| ESO | Epoxidized Soybean Oil |
| CA | Citric Acid |
| ESOCA | CA-Cured ESO Resin |
| SESE | Screw Extrusion Steam Explosion |
| SF | Sisal Fiber |
| SESF | Steam Exploded Sisal Fiber |
| SEC | SESF/ESOCA Biocomposites |
© 2018 by the authors. Licensee MDPI, Basel, Switzerland. This article is an open access article distributed under the terms and conditions of the Creative Commons Attribution (CC BY) license (http://creativecommons.org/licenses/by/4.0/).
Share and Cite
Lei, B.; Liang, Y.; Feng, Y.; He, H.; Yang, Z. Preparation and Characteristics of Biocomposites Based on Steam Exploded Sisal Fiber Modified with Amphipathic Epoxidized Soybean Oil Resin. Materials 2018, 11, 1731. https://doi.org/10.3390/ma11091731
Lei B, Liang Y, Feng Y, He H, Yang Z. Preparation and Characteristics of Biocomposites Based on Steam Exploded Sisal Fiber Modified with Amphipathic Epoxidized Soybean Oil Resin. Materials. 2018; 11(9):1731. https://doi.org/10.3390/ma11091731
Chicago/Turabian StyleLei, Bo, Yong Liang, Yanhong Feng, Hezhi He, and Zhitao Yang. 2018. "Preparation and Characteristics of Biocomposites Based on Steam Exploded Sisal Fiber Modified with Amphipathic Epoxidized Soybean Oil Resin" Materials 11, no. 9: 1731. https://doi.org/10.3390/ma11091731
APA StyleLei, B., Liang, Y., Feng, Y., He, H., & Yang, Z. (2018). Preparation and Characteristics of Biocomposites Based on Steam Exploded Sisal Fiber Modified with Amphipathic Epoxidized Soybean Oil Resin. Materials, 11(9), 1731. https://doi.org/10.3390/ma11091731