Preparation of Highly Catalytic N-Doped Carbon Dots and Their Application in SERS Sulfate Sensing


Abstract
1. Introduction
2. Materials and Methods
2.1. Apparatus and Reagents
2.2. Procedure
3. Results and Discussions
3.1. Principle
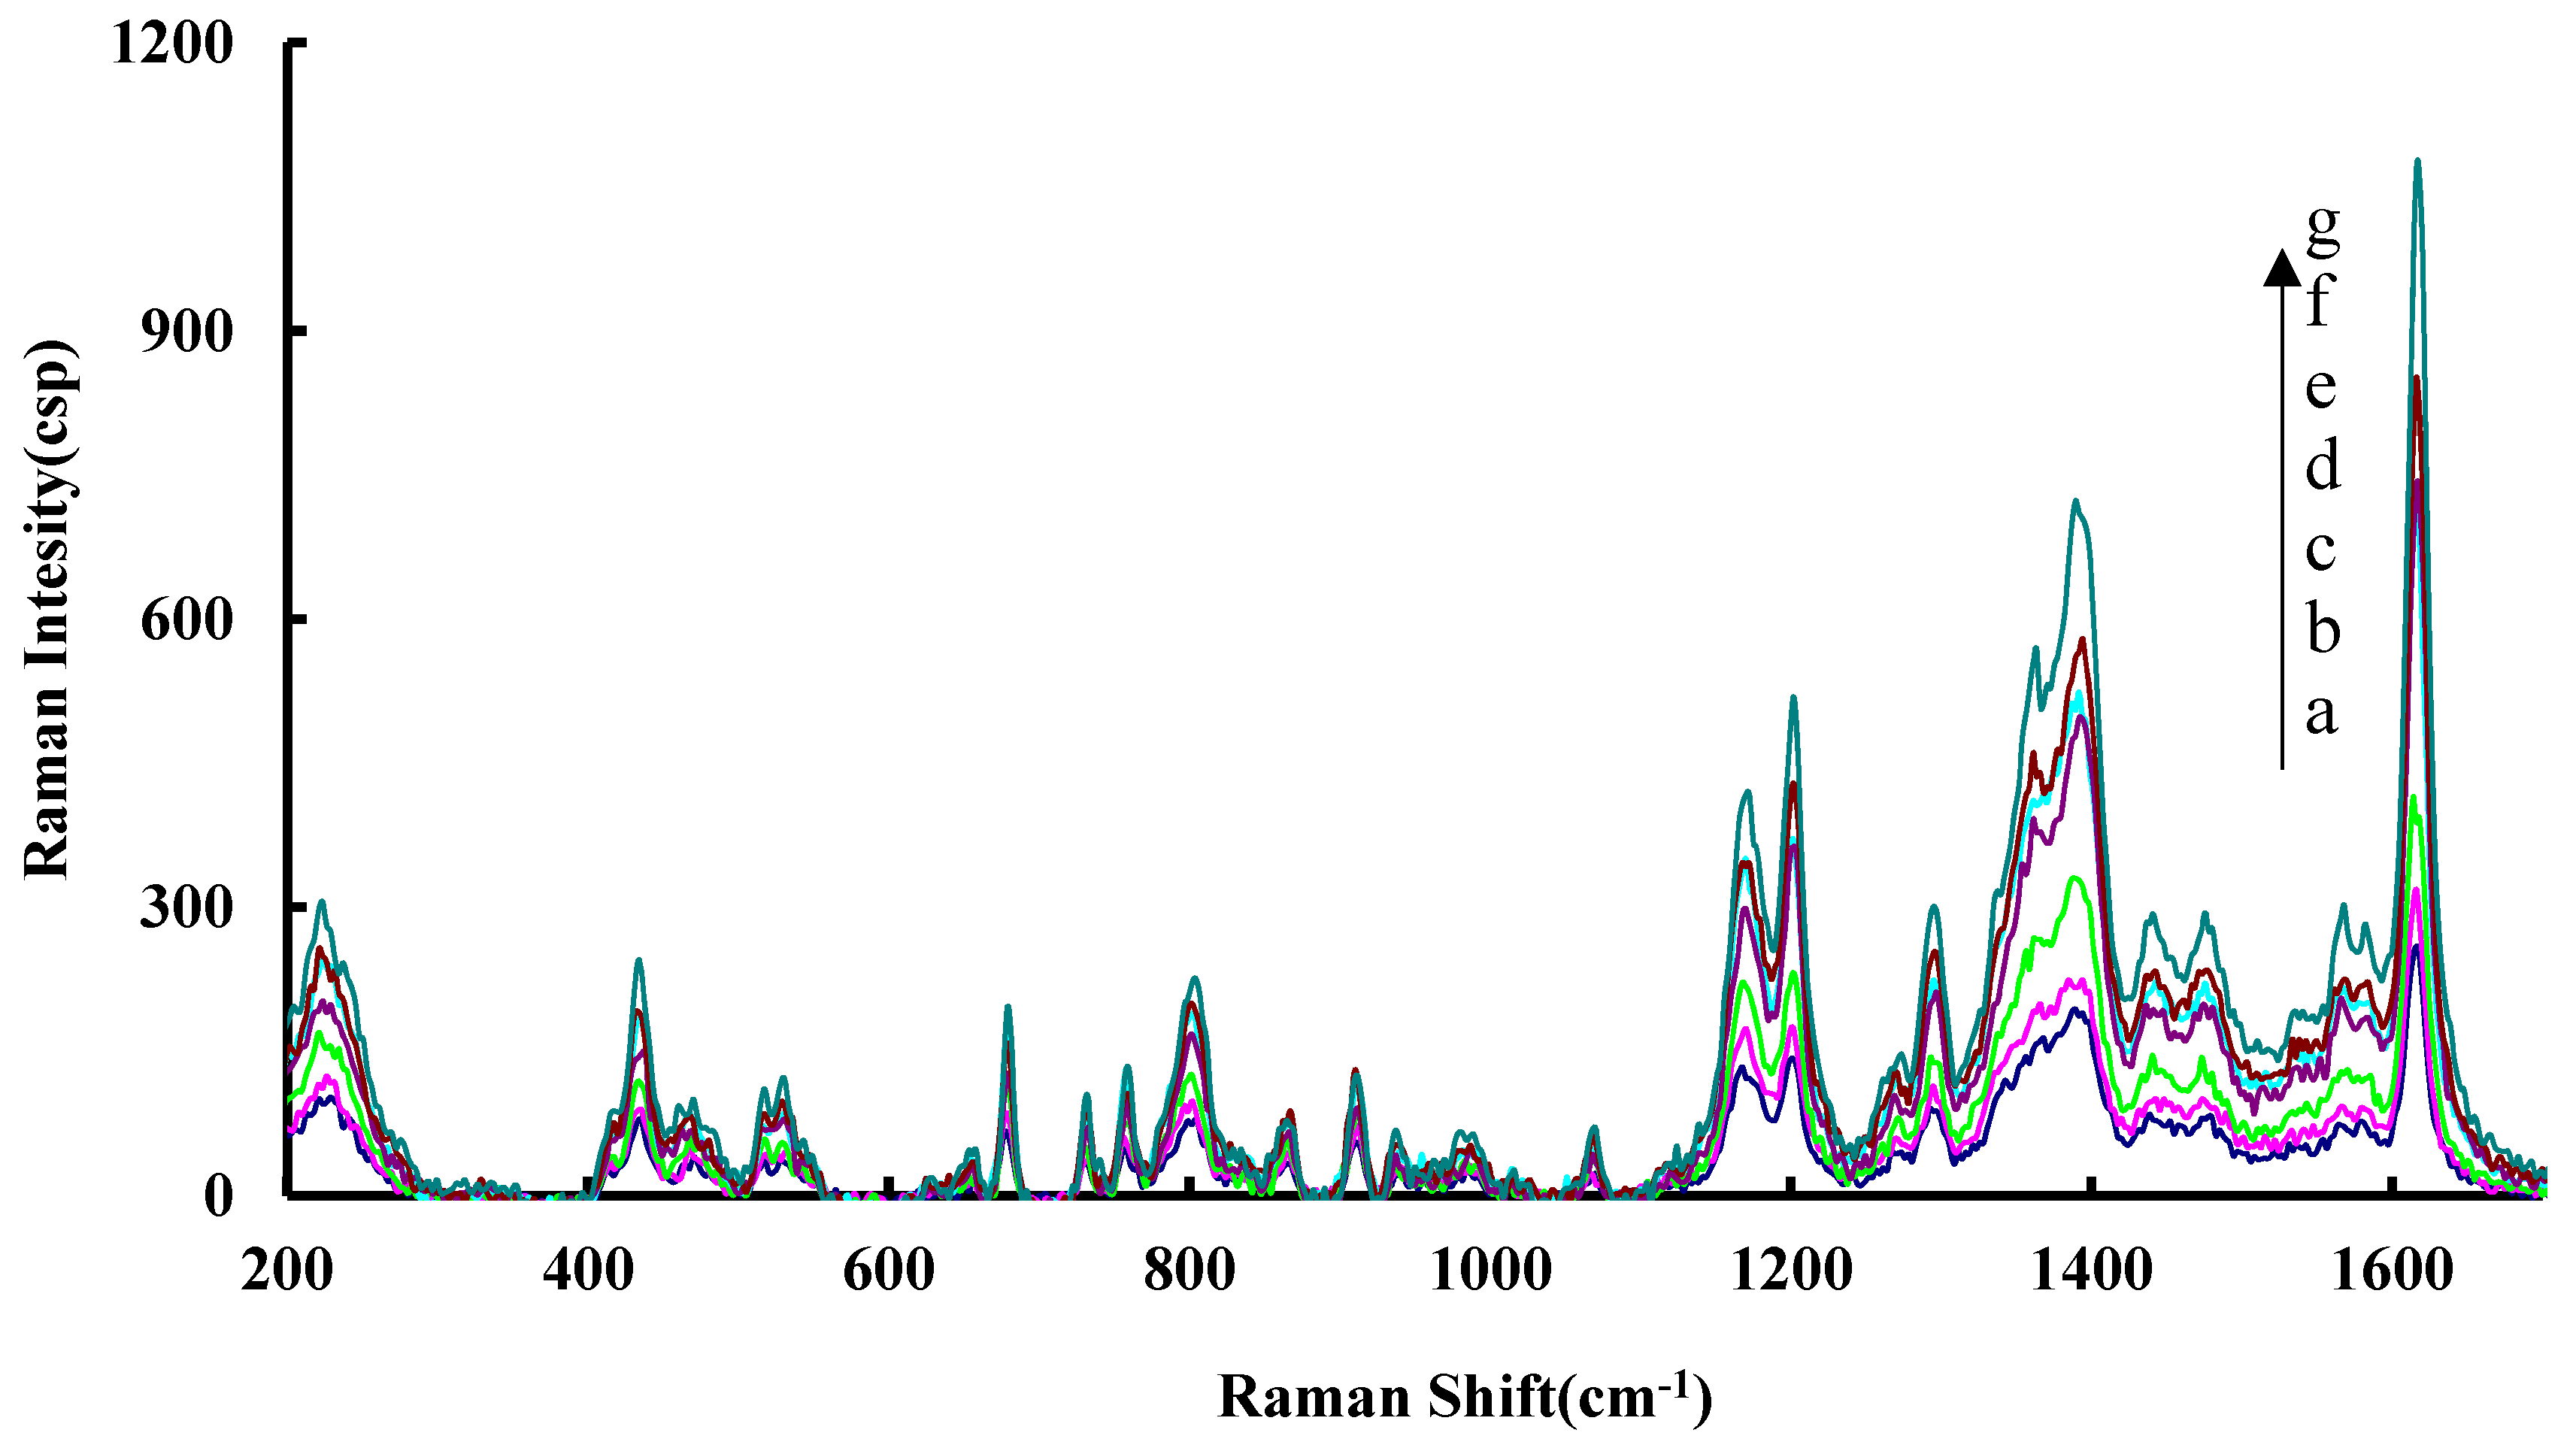
3.2. SERS Spectra
3.3. Scanning Electron Microscopy
3.4. Catalysis and Inhibition
3.5. Optimization of Analytical Conditions
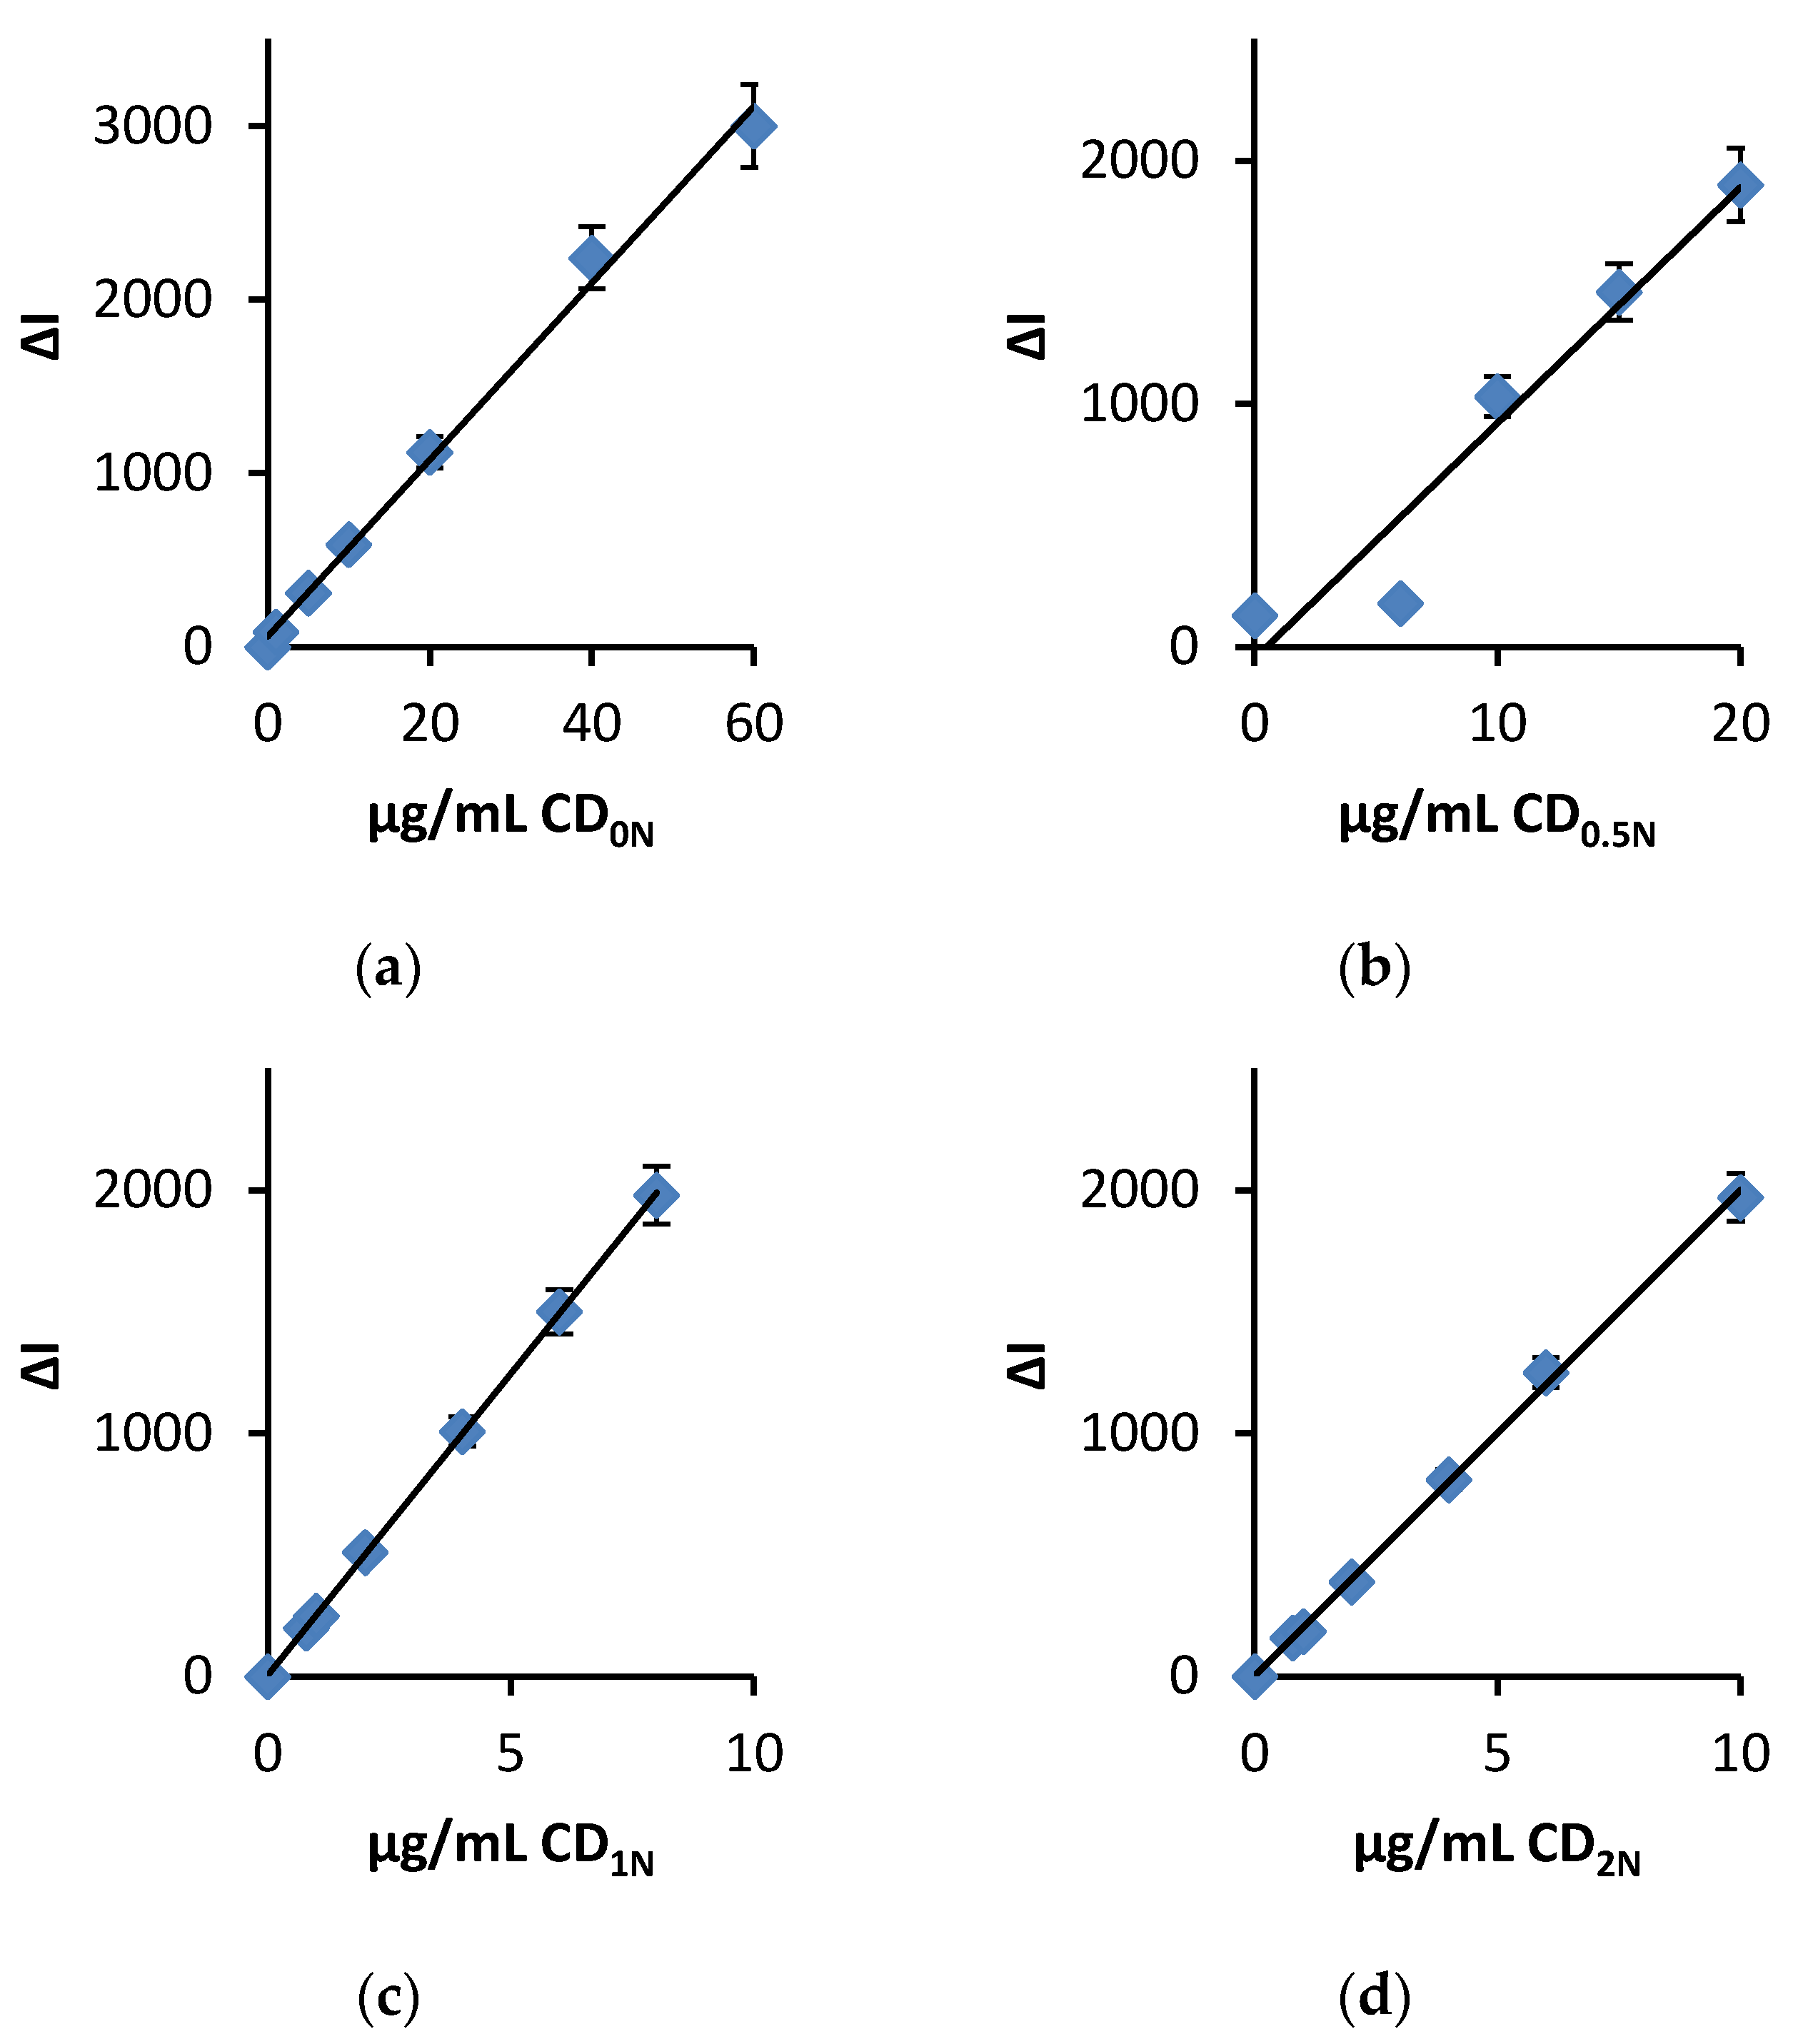
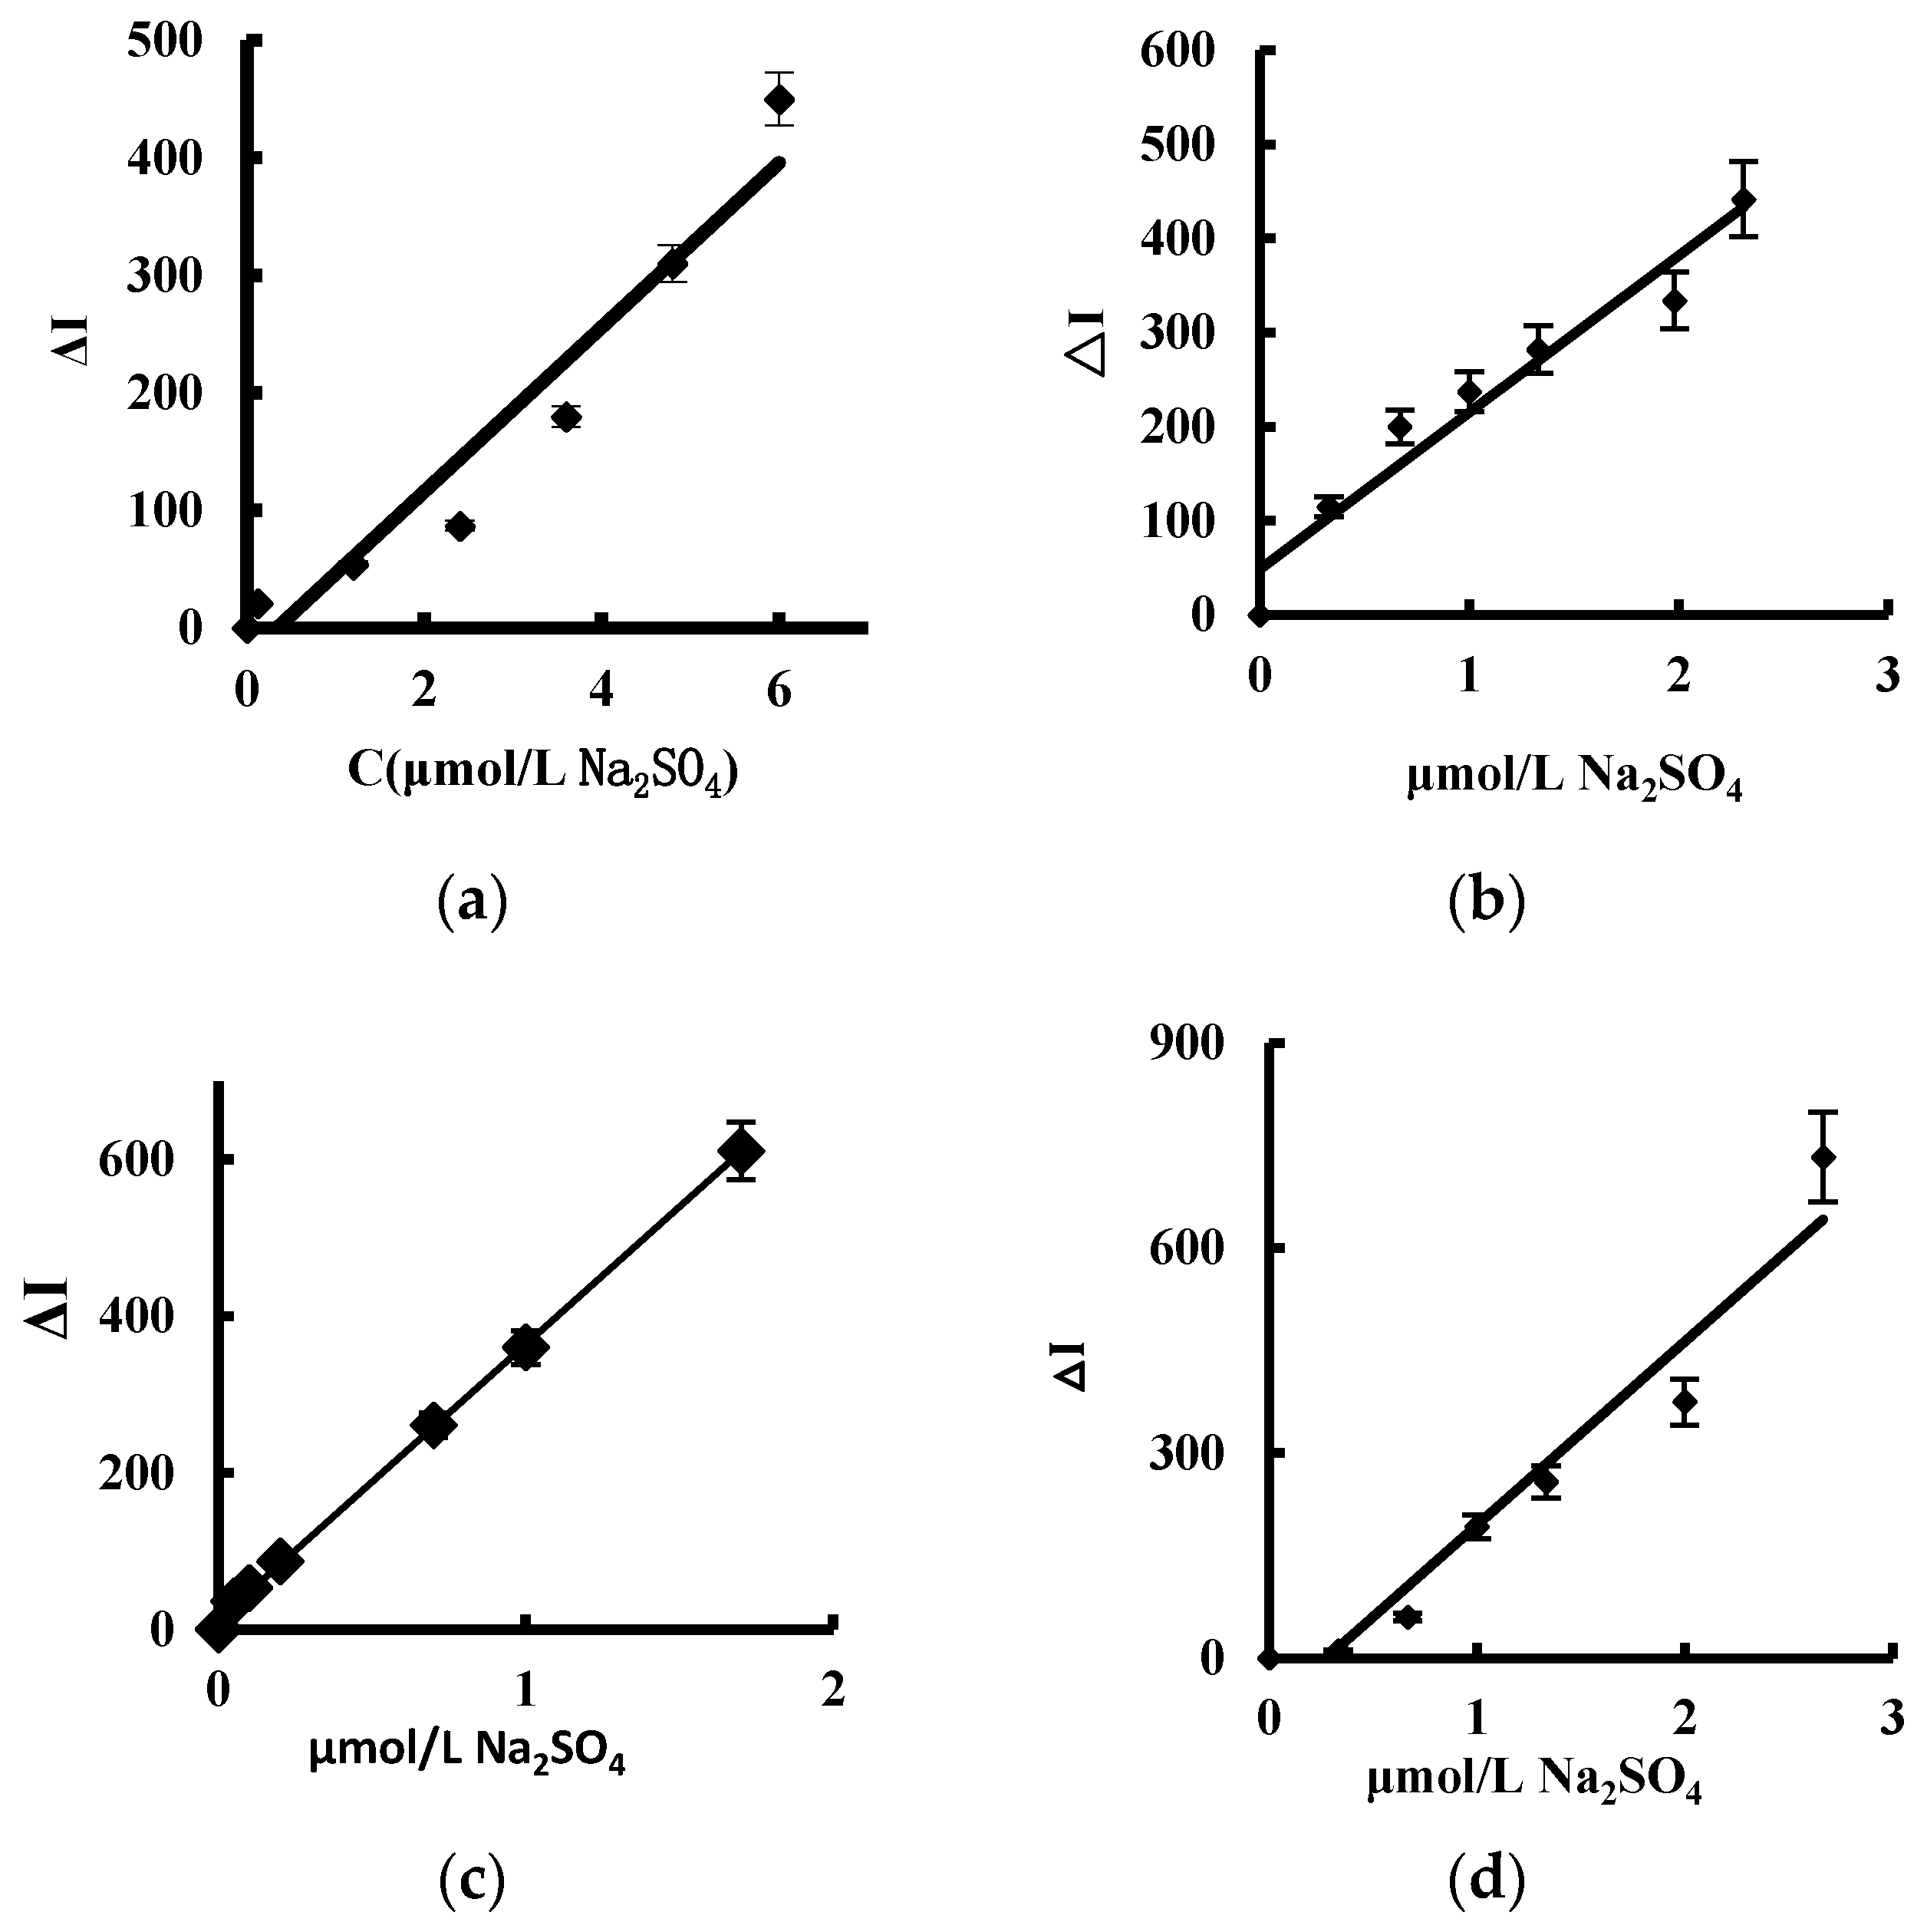
3.6. Performance Curve
3.7. Influence of Foreign Substances
3.8. Analysis of Samples
4. Conclusions
Author Contributions
Funding
Conflicts of Interest
References
- Dong, Y.Q.; Chen, C.Q.; Zheng, X.T.; Gao, L.L.; Cui, Z.M.; Yang, H.B.; Guo, C.X.; Chi, Y.W.; Li, C.M. One-step and high yield simultaneous preparation of single-and multi-layer graphene1 quantum dots from CX-72 carbon black. J. Mater. Chem. 2012, 22, 8764–8766. [Google Scholar] [CrossRef]
- Shen, J.H.; Zhu, Y.H.; Yang, X.L.; Li, C.Z. Graphene quantum dots: Emergent nanolights for bioimaging, sensors, catalysis and photovoltaic devices. Chem. Commun. 2012, 48, 3686–3699. [Google Scholar] [CrossRef] [PubMed]
- Lu, J.; Yeo, P.S.; Gan, C.K.; Wu, P.; Loh, K.P. Transforming C60 molecules into graphene quantum dots. Nat. Nanotechnol. 2011, 6, 247–252. [Google Scholar] [CrossRef] [PubMed]
- Liu, R.; Wu, D.; Feng, X.; Müllen, K. Bottom-up fabrication of photoluminescent graphene quantum dots with uniform morphology. J. Am. Chem. Soc. 2011, 133, 15221–15223. [Google Scholar] [CrossRef] [PubMed]
- Niu, Z.; Chen, J.; Hng, H.H.; Ma, J.; Chen, X. A leavening strategy to prepare reduced graphene oxide foams. Adv. Mater. 2012, 24, 4144–4150. [Google Scholar] [CrossRef] [PubMed]
- Dong, Y.; Li, G.; Zhou, N.; Wang, R.; Chi, Y. Graphene quantum dot as a green and facile sensor for free chlorine in drinking water. Anal. Chem. 2012, 84, 8378–8382. [Google Scholar] [CrossRef] [PubMed]
- Bai, J.M.; Zhang, L.; Liang, R.P.; Qiu, J.D. Graphene quantum dots combined with europium ions as photoluminescent probes for phosphate sensing. Chem. Eur. J. 2013, 19, 3822–3826. [Google Scholar] [CrossRef] [PubMed]
- Liu, J.J.; Zhang, X.L.; Cong, Z.X.; Chen, Z.T.; Yang, H.H.; Chen, G.N. Glutathione-functionalized graphene quantum dots as selective fluorescent probes for phosphate-containing metabolites. Nanoscale 2013, 5, 1810–1815. [Google Scholar] [CrossRef] [PubMed]
- Wang, D.; Wang, L.; Dong, X.; Shi, Z.; Jin, J. Chemically tailoring graphene oxides into fluorescent nanosheets for Fe3+ ion detection. Carbon 2012, 50, 2147–2154. [Google Scholar] [CrossRef]
- Zhang, Y.; Wu, C.; Zhou, X.; Wu, X.; Yang, Y.; Wu, H.; Guo, S.; Zhang, J. Graphene quantum dots/gold electrode and its application in living cell H2O2 detection. Nanoscale 2013, 5, 1816–1819. [Google Scholar] [CrossRef] [PubMed]
- Li, J.; Li, P.; Zhang, L.; Dong, C. Recent progress in the performance improvement of carbon nanodots. J. Anal. Sci. 2018, 34, 429–436. [Google Scholar]
- Freire, R.M.; Le, N.D.B.; Jiang, Z.W.; Kim, C.S.; Rotello, V.M.; Fechine, P.B.A. NH2-rich Carbon Quantum Dots: A protein-responsive probe for detection and identification. Sens. Actuators B 2018, 255, 2725–2732. [Google Scholar] [CrossRef]
- Liu, Y.; Yan, K.; Okoth, O.K.; Zhang, J.D. A label-free photoelectrochemical aptasensor based on nitrogen-doped graphene quantum dots for chloramphenicol determination. Biosens. Bioelectron. 2015, 74, 1016–1021. [Google Scholar] [CrossRef] [PubMed]
- Gu, T.T.; Zou, W.; Gong, F.C.; Xia, J.Y.; Chen, C.; Chen, X.J. A specific nanoprobe for cysteine based on nitrogen-rich fluorescent quantum dots combined with Cu2+. Biosens. Bioelectron. 2017, 100, 79–84. [Google Scholar] [CrossRef] [PubMed]
- Zhao, S.Q.; Xiao, Y.S.; Lu, J.C.; Jian, R.C.; Hui, F. A fluorescent nanosensor based on graphene quantum dots–aptamer probe and graphene oxide platform for detection of lead (II) ion. Biosens. Bioelectron. 2015, 68, 225–231. [Google Scholar]
- Wang, A.X.; Kong, X. Review of Recent Progress of Plasmonic Materials and Nano-Structures for Surface-Enhanced Raman Scattering. Materials 2015, 8, 3024–3052. [Google Scholar] [CrossRef] [PubMed]
- Wang, L.; Zhang, Y.; Yang, Y.; Zhang, J. Strong dependence of surface enhanced raman scattering on structure of graphene oxide film. Materials 2018, 11, 1199. [Google Scholar] [CrossRef] [PubMed]
- Ouyang, H.; Li, C.; Liu, Q.; Wen, G.; Liang, A.; Jiang, Z. Resonance Rayleigh scattering and SERS spectral detection of trace Hg(II) based on the gold nanocatalysis. Nanomaterials 2017, 7, 114. [Google Scholar] [CrossRef] [PubMed]
- Liu, Q.; Zhang, X.; Wen, G.; Luo, Y.; Liang, A.; Jiang, Z. A sensitive silver nanorod/reduced graphene oxide SERS analytical platform and its application to quantitative analysis of iodide in solution. Plasmonics 2015, 10, 285–295. [Google Scholar] [CrossRef]
- Yang, Q.Q.; Liang, F.H.; Wang, D.; Ma, P.Y.; Gao, D.J.; Han, J.Y.; Li, Y.L.; Yu, A.A.; Song, D.Q.; Wang, X.H. Simultaneous determination of thiocyanate ion and melamine in milk and milk powder using surface-enhanced Raman spectroscopy. Anal. Methods 2014, 6, 8388–8395. [Google Scholar] [CrossRef]
- Luo, Y.; Wen, G.; Dong, J.; Liu, Q.; Liang, A.; Jiang, Z. SERS detection of trace nitrite ion in aqueous solution based on the nitrosation reaction of rhodamine 6G molecular probe. Sens. Actuators B 2014, 201, 336–342. [Google Scholar] [CrossRef]
- Liang, A.; Wang, X.; Wen, G.; Jiang, Z. A sensitive and selective Victoria blue 4R SERS molecular probe for sodium lauryl sulfate in AuNP/AgCl sol substrate. Sens. Actuators B 2017, 244, 275–281. [Google Scholar] [CrossRef]
- Zhang, L.; Zeng, Y.M.; Zhao, J.J.; Chen, H.J.; Kong, J.L.; Chen, Q.Z.; Lin, H.Z.; Tian, Z.Q.; Liu, G.K. Rapid determination of sulfur dioxide residues in foods based on surface-enhanced Raman spectroscopy. Sci. Chin. Chem. 2017, 47, 794–800. [Google Scholar]
- Shang, G.; Li, C.; Wen, G.; Zhang, X.; Liang, A.; Jiang, Z. A new silver nanochain SERS analytical platform to detect trace hexametaphosphate with a rhodamine S molecular probe. Luminescence 2016, 31, 640–648. [Google Scholar] [CrossRef] [PubMed]
- Li, C.; Wang, L.; Luo, Y.; Liang, A.; Wen, G.; Jiang, Z. A sensitive gold nanoplasmonic SERS quantitative analysis method for sulfate in serum using fullerene as catalyst. Nanomaterials 2018, 8, 277. [Google Scholar] [CrossRef] [PubMed]
- Biesaga, M.; Schmidt, N.; Seubert, A. Coupled ion chromatography for the determination of chloride, phosphate and sulphate in concentrated nitric acid. J. Chromatogr. A 2004, 1026, 195–200. [Google Scholar] [CrossRef] [PubMed]
- Ali, D.S.; Faizullah, A.T. Combination of FIA-CL technique with ion-exchanger for determination of sulphate in various water resources in Erbil City. Arabian J. Chem. 2012, 5, 147–153. [Google Scholar] [CrossRef]
- Kumar, S.D.; Maiti, B.; Mathur, P.K. Determination of iodate and sulphate in iodized common salt by ion chromatography with conductivity detection. Talanta 2001, 53, 701–705. [Google Scholar] [CrossRef]
- Meneses, S.R.; Maniasso, N.; Zagatto, E.A. Spectrophotometric flow-injection determination of sulphate in soil solutions. Talanta 2005, 65, 1313–1317. [Google Scholar] [CrossRef] [PubMed]
- Fernández-Ramos, C.; Ballesteros, O.; Blanc, R. Determination of alcohol sulfates in wastewater treatment plant influents and effluents by gas chromatography-mass spectrometry. Talanta 2012, 98, 166–171. [Google Scholar] [CrossRef] [PubMed]


| System | Linear Range | Regress Equation | Coefficient |
|---|---|---|---|
| CD0N | 1.0–60 μg/mL | ΔI = 55.8x + 30 | 0.9898 |
| CD0.5N | 6.0–20 μg/mL | ΔI = 89.2x + 130 | 0.9869 |
| CD1N | 0.79–8 μg/mL | ΔI = 249.0x − 8.6 | 0.993 |
| CD2N | 0.79–10 μg/mL | ΔI = 197.4x + 13 | 0.9633 |
| CD | Linear Equation | Coefficient | LR (μmol/L) | DL(μmol/L) |
|---|---|---|---|---|
| CD0N | ΔI = 66.9C + 20.4 | 0.9283 | 1.0–6.0 | 0.50 |
| CD0.5N | ΔI = 166.4C + 48.8 | 0.9463 | 0.5–2.31 | 0.20 |
| CD1N | ΔI = 348.8C + 18.0 | 0.9384 | 0.02–1.7 | 0.007 |
| CD2N | ΔI = 268.6C−73.9 | 0.9403 | 0.06–2.66 | 0.02 |
| Foreign Substance | Tolerance Concentration (µmol/L) | Relative Error (%) | Foreign Substance | Tolerance Concentration (µmol/L) | Relative Error (%) |
|---|---|---|---|---|---|
| Na+ | 33 | 5.0 | Cu2+ | 33 | 7.6 |
| Zn2+ | 33 | 6.4 | HCO3− | 26.4 | 8.6 |
| Ca2+ | 33 | −6.7 | Mg2+ | 26.4 | 6.0 |
| ethanol | 33 | −5.6 | ethylene glycol | 16.5 | 5.8 |
| Pb2+ | 33 | 7.0 | Cr6+ | 6.6 | −6.0 |
| NH4+ | 33 | 3.9 | Fe3+ | 6.6 | −4.5 |
| K+ | 33 | 6.0 | NO2− | 6.6 | 6.2 |
| SO32− | 33 | −7.9 | glycolic acid | 6.6 | 5.0 |
| Bi3+ | 33 | 6.4 |
| Sample | Single Value (μmol/L) | Average (μmol/L) | Added (μmol/) | Found (μmol/L) | Recovery (%) | RSD (%) | Content (μmol/L) | IC Results (μmol/L) |
|---|---|---|---|---|---|---|---|---|
| Running water | 0.39, 0.41, 0.38, 0.40, 0.43 | 0.40 | 0.13 | 0.52 | 92.3 | 4.77 | 0.40 | 0.38 |
| Ronng lake water | 1.12, 1.17, 1.11, 1.17, 1.17 | 1.15 | 0.13 | 1.274 | 95 | 2.6 | 1.15 | 1.22 |
| Shan lake water | 0.70, 0.71, 0.71, 0.72, 0.71 | 0.71 | 0.13 | 0.839 | 99.2 | 0.90 | 0.71 | 0.68 |
| Beer 1 | 1.22, 1.26, 1.30, 1.28, 1.32 | 1.28 | 0.20 | 1.47 | 95 | 3.0 | 1.28 | 1.20 |
| Beer 2 | 1.30, 1.35, 1.38, 1.39, 1.33 | 1.35 | 0.20 | 1.56 | 105 | 2.7 | 1.35 | 1.38 |
| Beer 3 | 1.39, 1.30, 1.39, 1.32, 1.25 | 1.33 | 0.20 | 1.52 | 95 | 4.3 | 1.33 | 1.28 |
© 2018 by the authors. Licensee MDPI, Basel, Switzerland. This article is an open access article distributed under the terms and conditions of the Creative Commons Attribution (CC BY) license (http://creativecommons.org/licenses/by/4.0/).
Share and Cite
Wang, L.; Li, C.; Luo, Y.; Jiang, Z. Preparation of Highly Catalytic N-Doped Carbon Dots and Their Application in SERS Sulfate Sensing. Materials 2018, 11, 1655. https://doi.org/10.3390/ma11091655
Wang L, Li C, Luo Y, Jiang Z. Preparation of Highly Catalytic N-Doped Carbon Dots and Their Application in SERS Sulfate Sensing. Materials. 2018; 11(9):1655. https://doi.org/10.3390/ma11091655
Chicago/Turabian StyleWang, Libing, Chongning Li, Yanghe Luo, and Zhiliang Jiang. 2018. "Preparation of Highly Catalytic N-Doped Carbon Dots and Their Application in SERS Sulfate Sensing" Materials 11, no. 9: 1655. https://doi.org/10.3390/ma11091655
APA StyleWang, L., Li, C., Luo, Y., & Jiang, Z. (2018). Preparation of Highly Catalytic N-Doped Carbon Dots and Their Application in SERS Sulfate Sensing. Materials, 11(9), 1655. https://doi.org/10.3390/ma11091655