Article

A Simple, Quick and Eco-Friendly Strategy of Synthesis Nanosized α-LiFeO2 Cathode with Excellent Electrochemical Performance for Lithium-Ion Batteries

R&D Center for New Energy Materials and Integrated Energy Devices, State Key Laboratory of Electronic Thin Film and Integrated Devices, University of Electronic Science and Technology of China, Chengdu 610054, China
*
Authors to whom correspondence should be addressed.
Materials 2018, 11(7), 1176; https://doi.org/10.3390/ma11071176
Submission received: 10 June 2018 / Revised: 28 June 2018 / Accepted: 3 July 2018 / Published: 10 July 2018

Abstract

:
Nanosized α-LiFeO2 samples were successfully synthesized via a simple, quick and eco-friendly strategy at ambient temperature followed by a low temperature calcined process. X-ray diffraction (XRD), scanning electronic microscopy (SEM) and transmission electron microscopy (TEM) measurements revealed that the optimal α-LiFeO2 sample was composed of extremely small nanoparticles. The electrochemical properties were tested at 0.1 C in the cut-off voltage of 1.5–4.8 V. The sample obtained at 150 °C for 6 h exhibited the best cycling stability with high initial discharge capacity of 223.2 mAh/g, which was extremely high for pristine α-LiFeO2 without any modification process. After 50 cycles, the discharge capacity could still maintain 194.5 mAh/g with good capacity retention. When the charge–discharge rate increased to 0.2 C and 0.5 C, the initial discharge capacities were 216.6 mAh/g and 171.5 mAh/g, respectively. Furthermore, the optimal sample showed low charge transfer resistance and high lithium-ion diffusion coefficients, which facilitated the excellent electrochemical performance.

1. Introduction

Lithium-ion batteries have been widely applied to laptop computers, electric vehicles, hybrid vehicles, and other portable electronic products [1]. As an important part of lithium-ion batteries, cathode materials largely determine the electrochemical performance [2]. Among all the alternate cathode materials, LiFeO2 with layered rock-salt structure has attracted significant attention for its high theoretical capacity of 282 mAh/g, abundant raw materials, low cost, and nontoxic [2,3]. According to the reported results, LiFeO2 has many structural forms, such as α-, β- and γ-conjugated forms [4,5]. Among them, α-LiFeO2 has attracted more attention due to the simpler synthesis method and excellent electrochemical properties [6]. Many researchers have paid great efforts to synthesized α-LiFeO2 via different methods. Sakurai et al. synthesized α-LiFeO2 sample by high temperature solid-state method, but the sample was proven to be electrochemically inactive [7]. Then, they successfully synthesized active α-LiFeO2 sample at low temperature of less than 250 °C via H+/Li+ ionic exchange reaction. Although this sample was electrochemically active, it exhibited only reversible capacity of 80 mAh/g and poor cycle performance at 0.1 C [8]. Furthermore, α-LiFeO2 synthesized by Li et al. via solvothermal methods exhibited higher initial capacity of 135 mAh/g, but the cycling performance was still poor [9]. To further enhance the cycling performance, Rahman et al. prepared α-LiFeO2-MWCNT compounds via radio frequency oxygen plasma method [10]. The optimal compound showed higher initial capacity of 236 mAh/g and better cycling performance, but the synthetic route is too complicated and costly to commercialize. Therefore, it is necessary to develop a more appropriate way to prepare α-LiFeO2 with excellent electrochemical performance.
According to the existing literature [11], nanomaterials can make a significant impact on the electrochemical performance of cathodes as the reduced particle size contributes to the full contact of cathode material and electrolyte and shortens Li+ transportation distance. For α-LiFeO2, the electrochemical performance is significantly impaired by the poor conductivity. Thus, reducing the particle size is a valid approach to promote the ionic transportation and the electronic conductivity. Morales et al. [12] synthesized α-LiFeO2 nanoparticles with smaller average diameter of about 50 nm. This material could exhibit high initial specific capacity of 150 mAh/g. Hirayama et al. further confirmed the improvement effect of smaller particle size on the electrochemical performance of LiFeO2 [13]. However, it is important to note that the improved performance of α-LiFeO2 nanoparticles reported in the above literature still cannot meet the demands of high reversible capacity of cathode materials. To further enhance the reversible capacity, Wang et al. synthesized α-LiFeO2 nanoparticles with particle size under 10 nm. It showed extremely high initial specific capacity of 290.6 mAh/g at 0.1 C, but the cycling performance was not very satisfactory for cathode materials [14]. Based on the above analysis, it can be speculated that the reduction of particle size may present excellent electrochemical performance.
We successfully synthesized nanosized α-LiFeO2 samples via a simple, quick and eco-friendly strategy at ambient temperature followed by a low temperature calcine process. Compared with the reported methods [8,15,16,17,18,19], the present synthesis strategy not only reduces the production cost of α-LiFeO2 with high performance, but also alleviates the environment pollution. More importantly, the optimal α-LiFeO2 sample with small particle size showed excellent electrochemical properties at high voltage.

2. Experimental

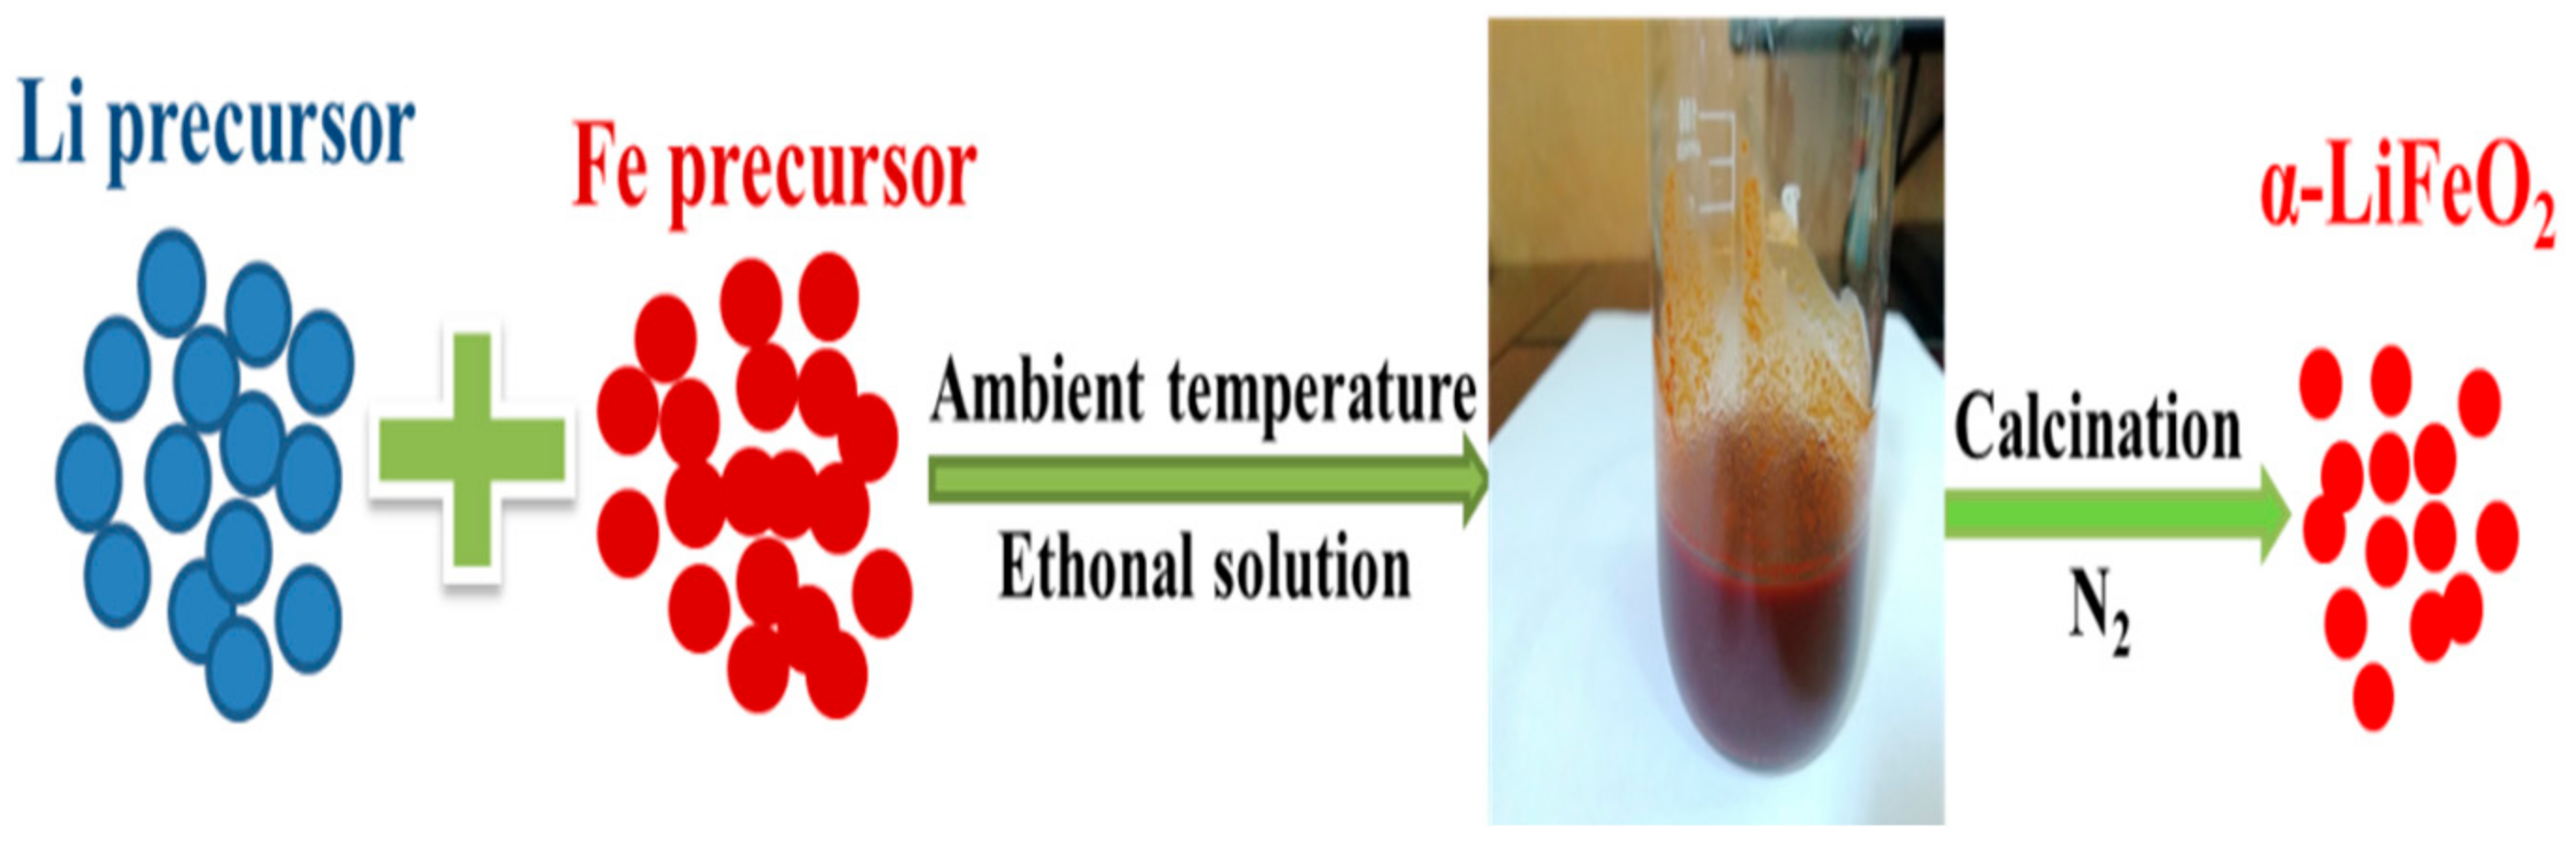
2.1. Synthesis of α-LiFeO2 Cathode Materials

The α-LiFeO2 nanoparticles were prepared by a simple, quick and eco-friendly strategy followed by a low temperature calcined process. Firstly, 2.73 g LiOH·H2O and 3 g Fe(NO)3·9H2O was dissolved in 20 mL ethanol. The suspension was intensely stirred under magnetic stirring at ambient temperature for 5 h. After being washed with distilled water and ethanol repeatedly to eliminate redundant lithium hydrate, the brown product was dried at 80 °C for 12 h in an air oven. The brown particles were obtained by hand-grinding in an agate mortar. Finally, the product was sintered at different temperatures (100 °C, 150 °C, 250 °C, and 350 °C) for 6 h in tube furnace under argon atmosphere.

2.2. Characterizations of α-LiFeO2 Cathode Materials

The crystalline phase was characterized by X-ray diffraction (XRD, Bruker DX-1000, Bruker, Karlsruhe, Germany, Cu Kα radiation). The particle morphology of the α-LiFeO2 powders was examined with scanning electron microscope (SEM, JEOL, JSM-6360LV, Tokyo, Japan) and transmission electron microscopy (TEM, JEOL, JEM-3010, Tokyo, Japan). The specific surface area and pore volume were obtained by Brunauer–Emmett–Teller (BET) N2 adsorption–desorption measurement (BET, NOVA3000 analyzer, Quantachrome Instrument, Boynton Beach, FL, USA). X-ray photoelectron spectroscopy (XPS, ESCALAB 250XI, Thermo Fisher Scientific, Boston, MA, USA) was used to estimate the Valence states of α-LiFeO2 electrodes during different process.

2.3. Electrochemical Tests of α-LiFeO2 Cathode Materials

The electrochemical performance of α-LiFeO2 were evaluated at ambient temperature. The positive electrode was prepared with 85% synthesized product, 10% acetylene black, and 5% polyvinylidene fluoride binder in N-methyl-2-pyrrolidone solvent. The slurry was pressed onto Al foil and dried at 100 °C for 4 h and then punched into round positive slices with 12 mm diameter. The lithium foil was the anode electrode, ehilr celgard microporous polypropylene membrane was the diaphragm. The electrolyte solution was 1 M lithium hexafluorophosphate (LiPF6) solution in a mixture of the ethylene carbonate (EC) and diethl carbonate (DEC) in a 1:1 volume ratio. The charge–discharge profiles were investigated by Land CT2001A battery testing system with a voltage window of 1.5–4.8 V. The EIS was studied by CS-350 electrochemical workstation with frequency ranging from 0.1 Hz to 100 kHz. The CV was also tested by CS-350 electrochemical workstation, with scan rate of 0.1 mV/s.

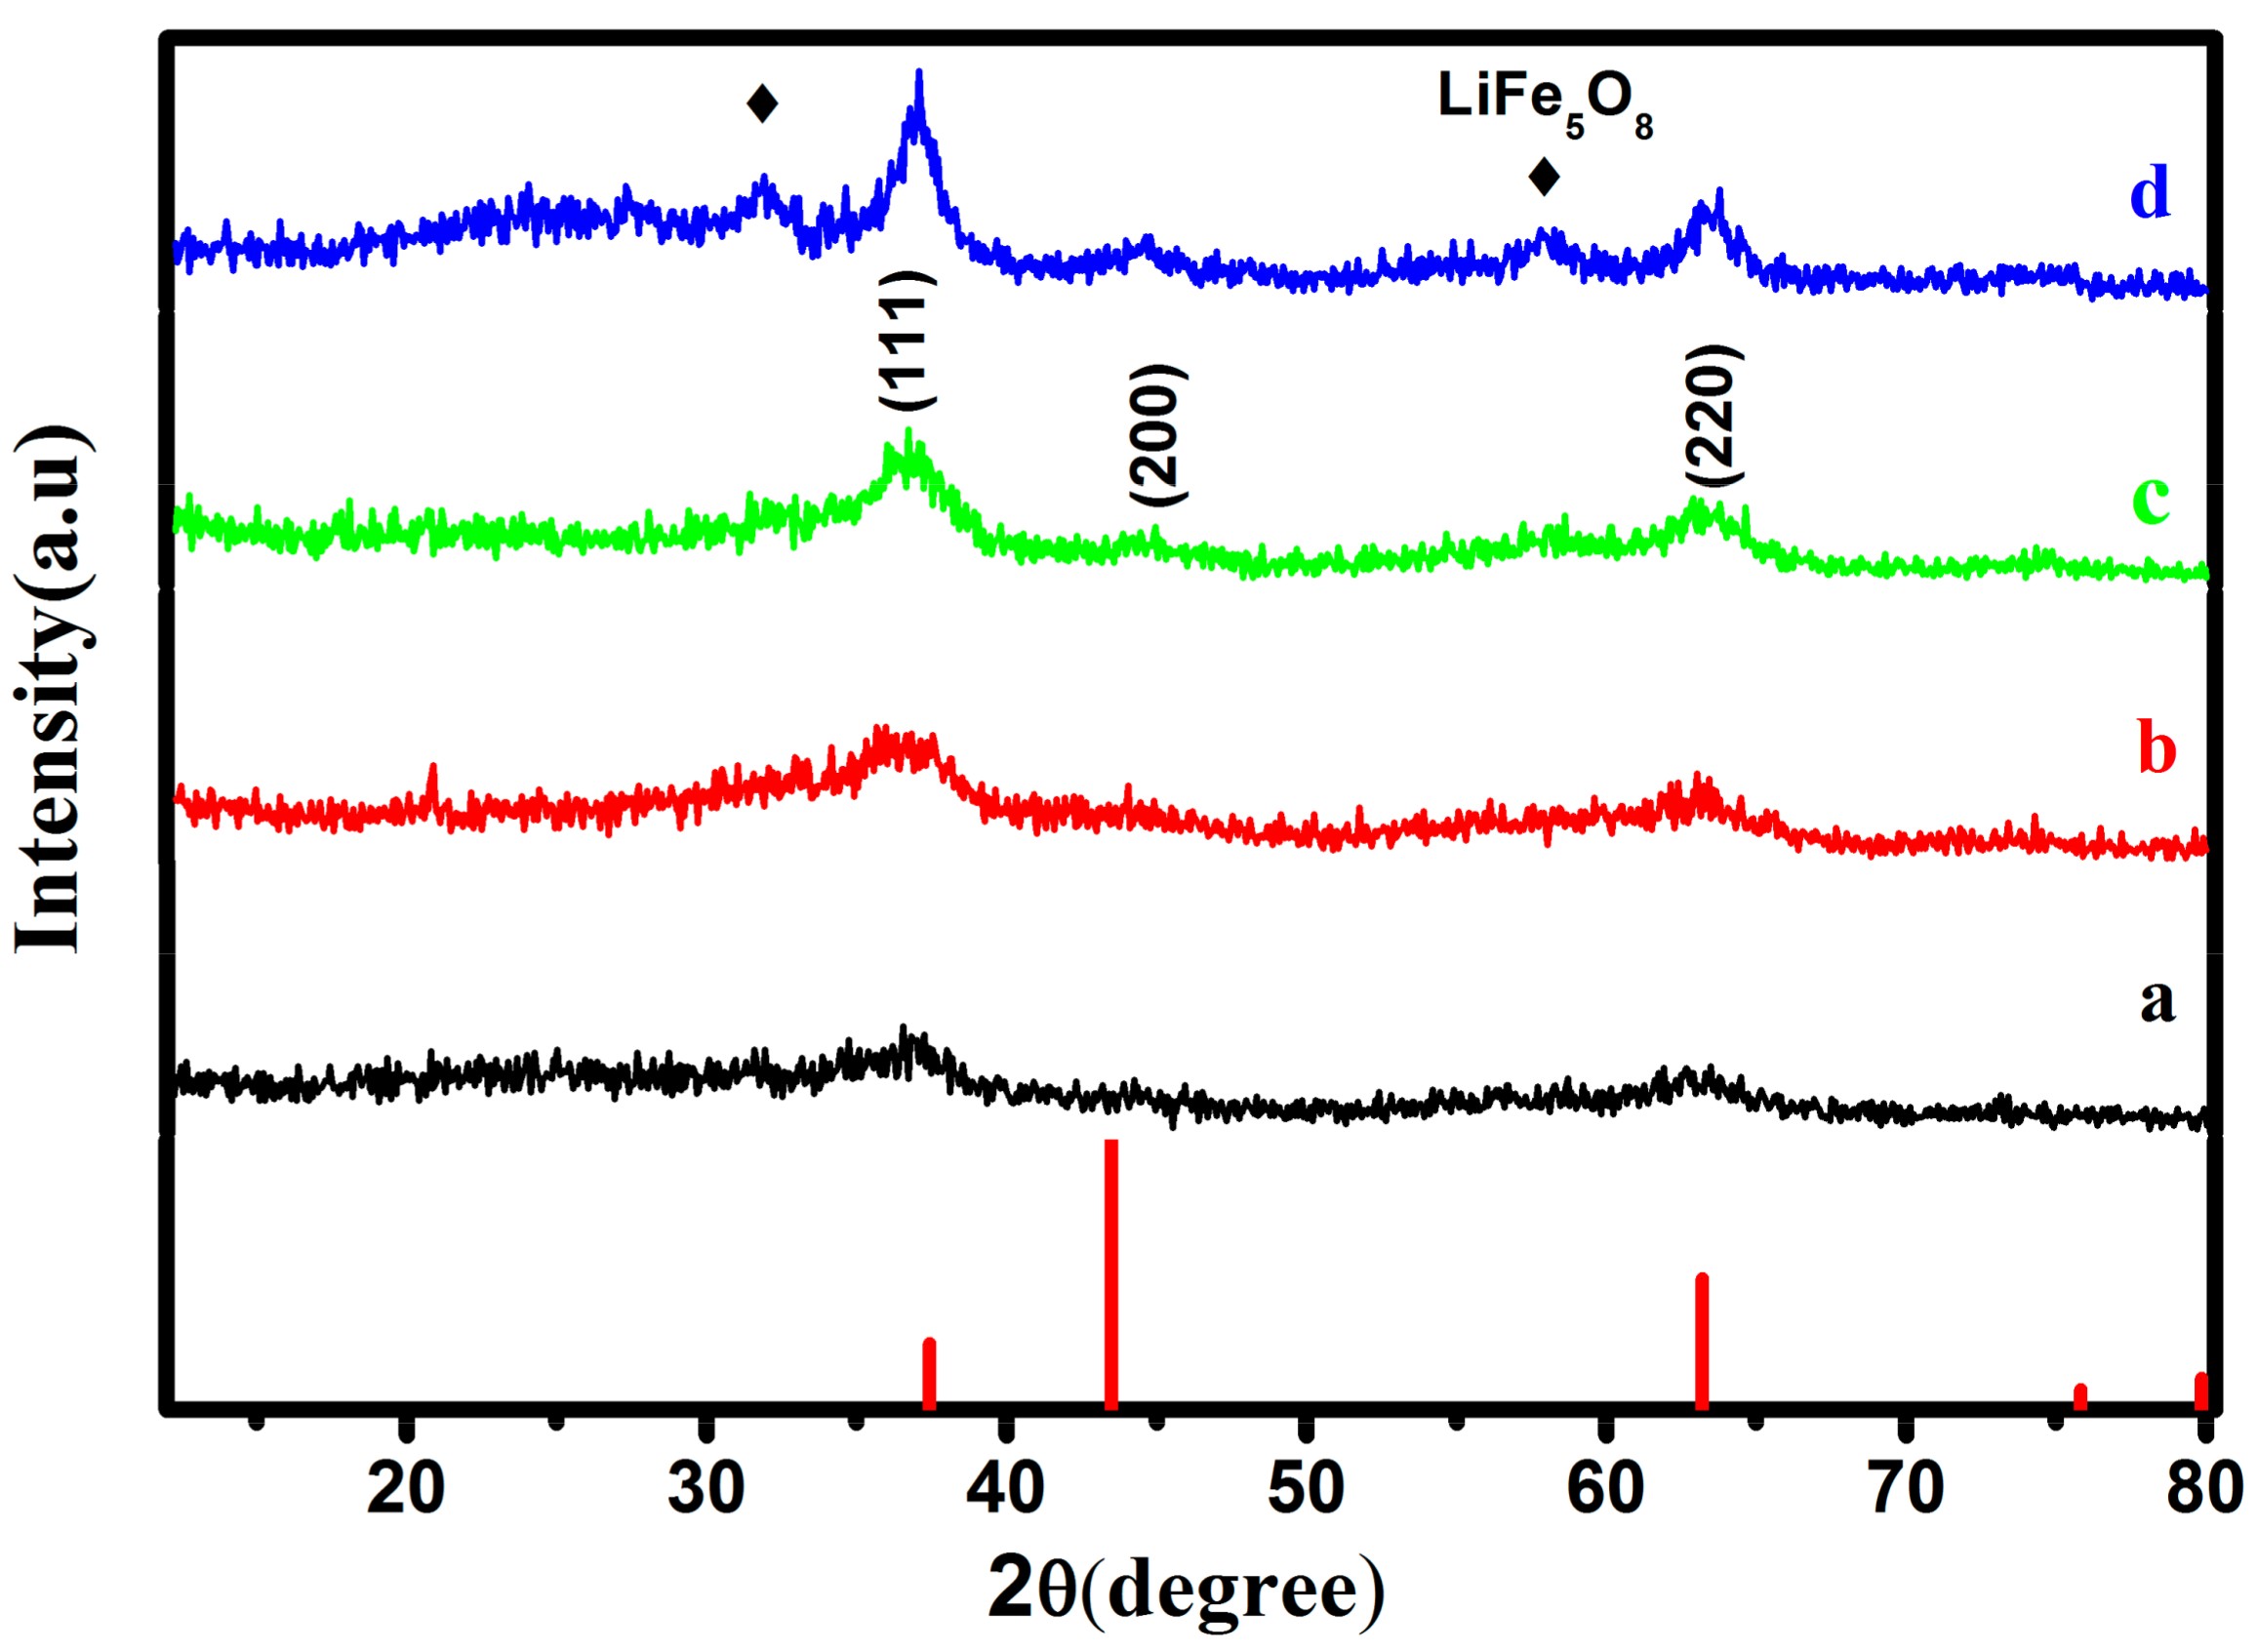
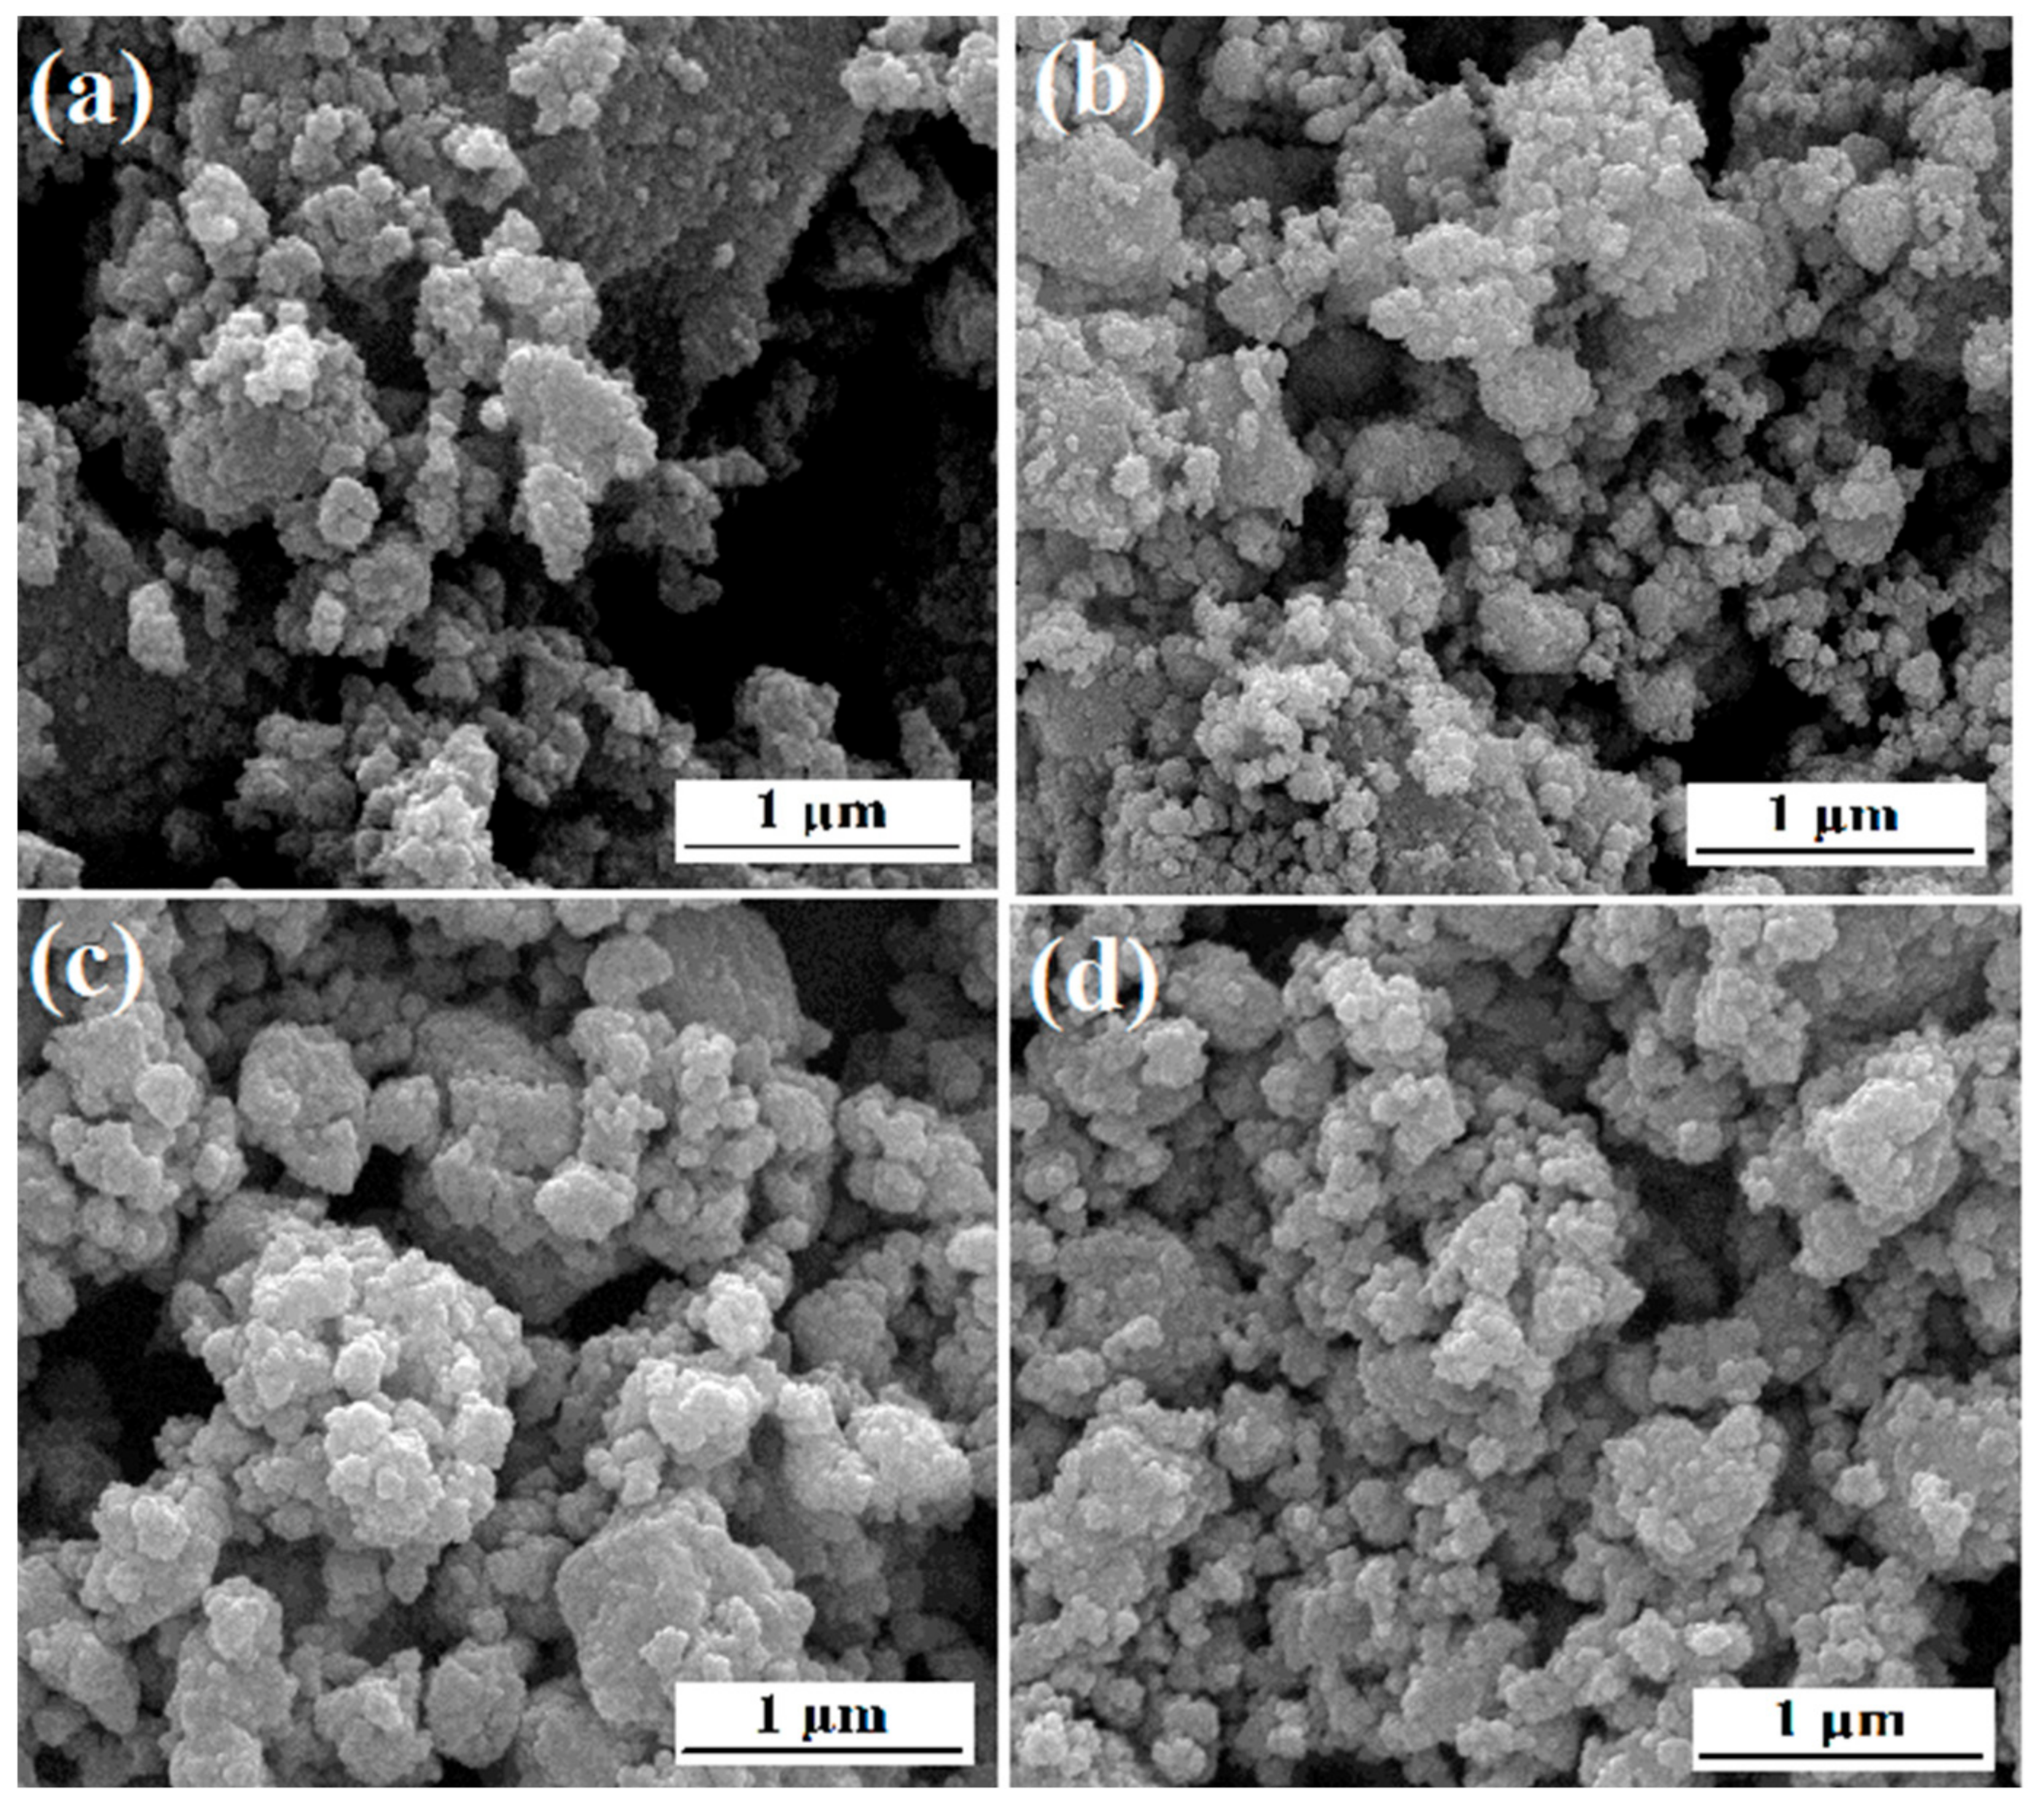
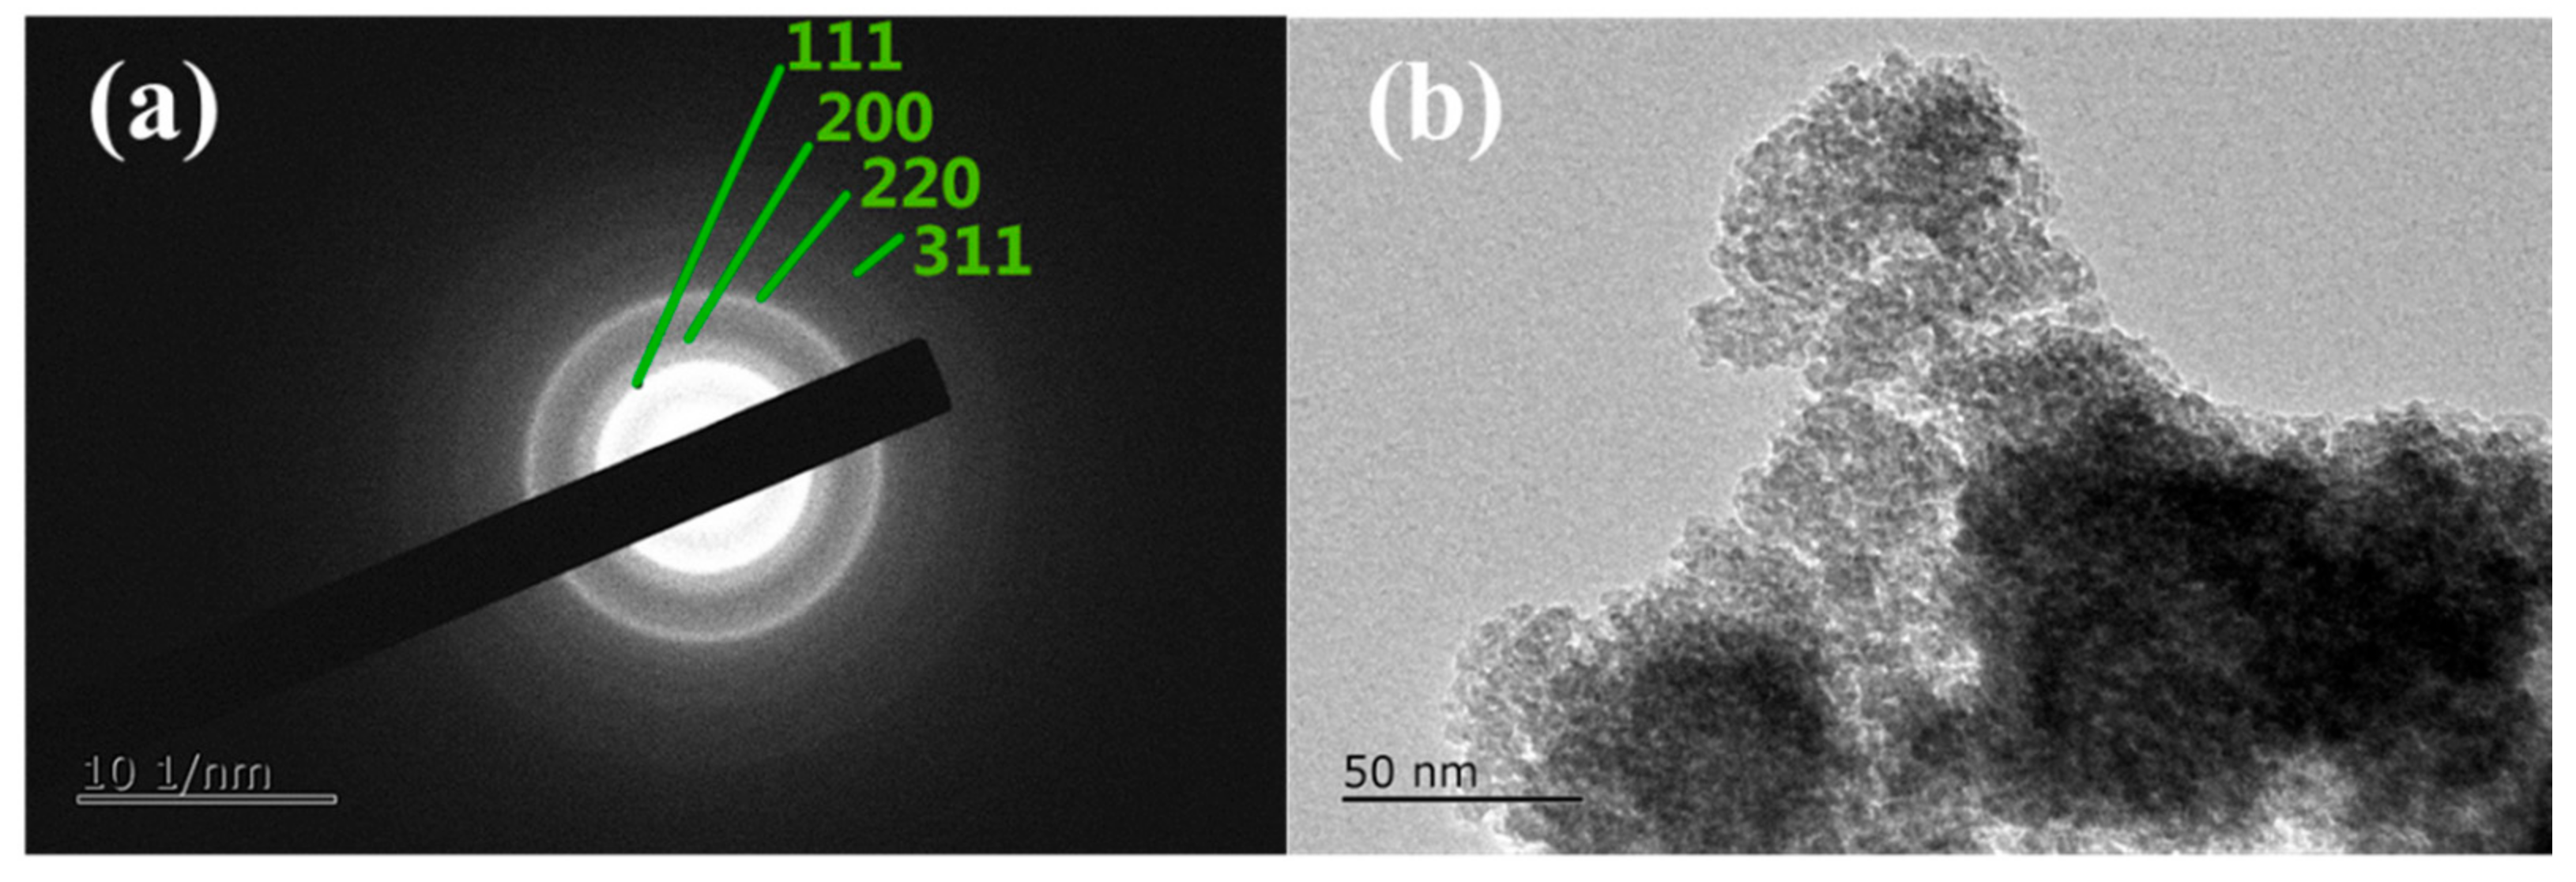
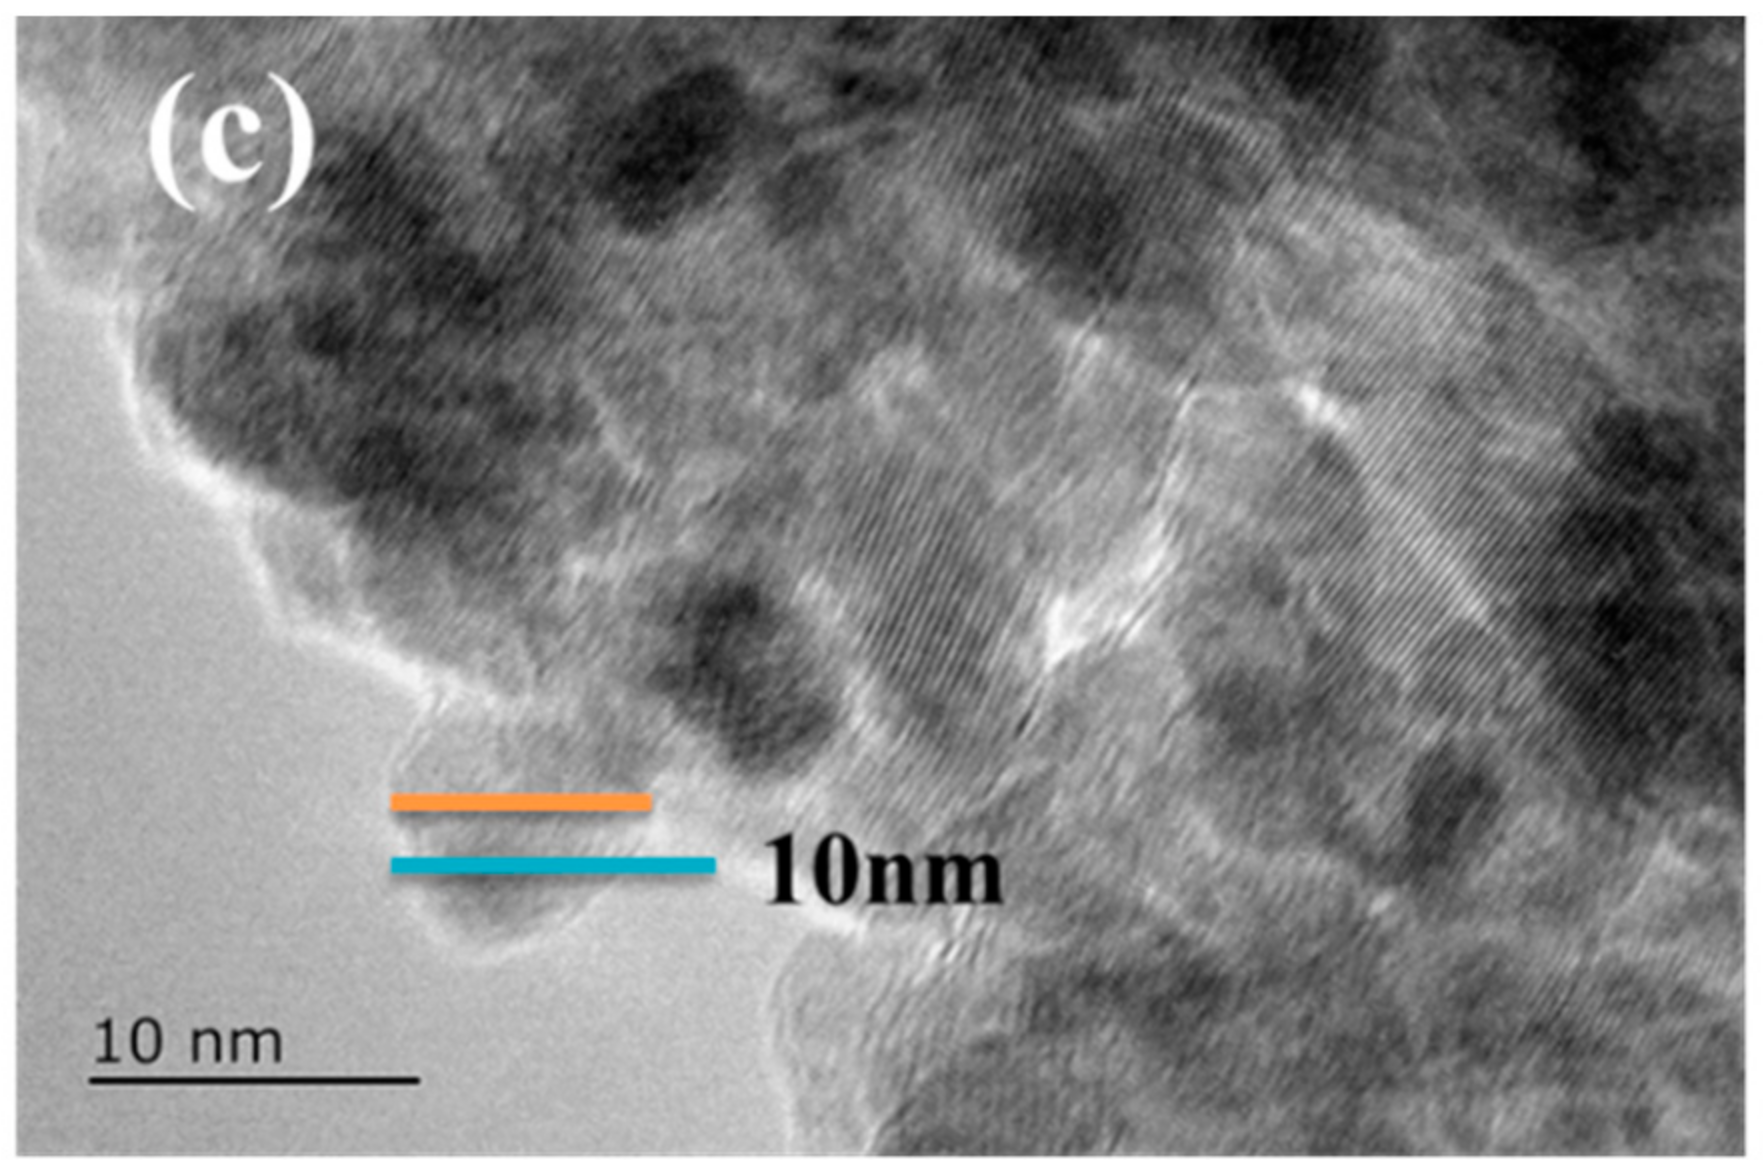
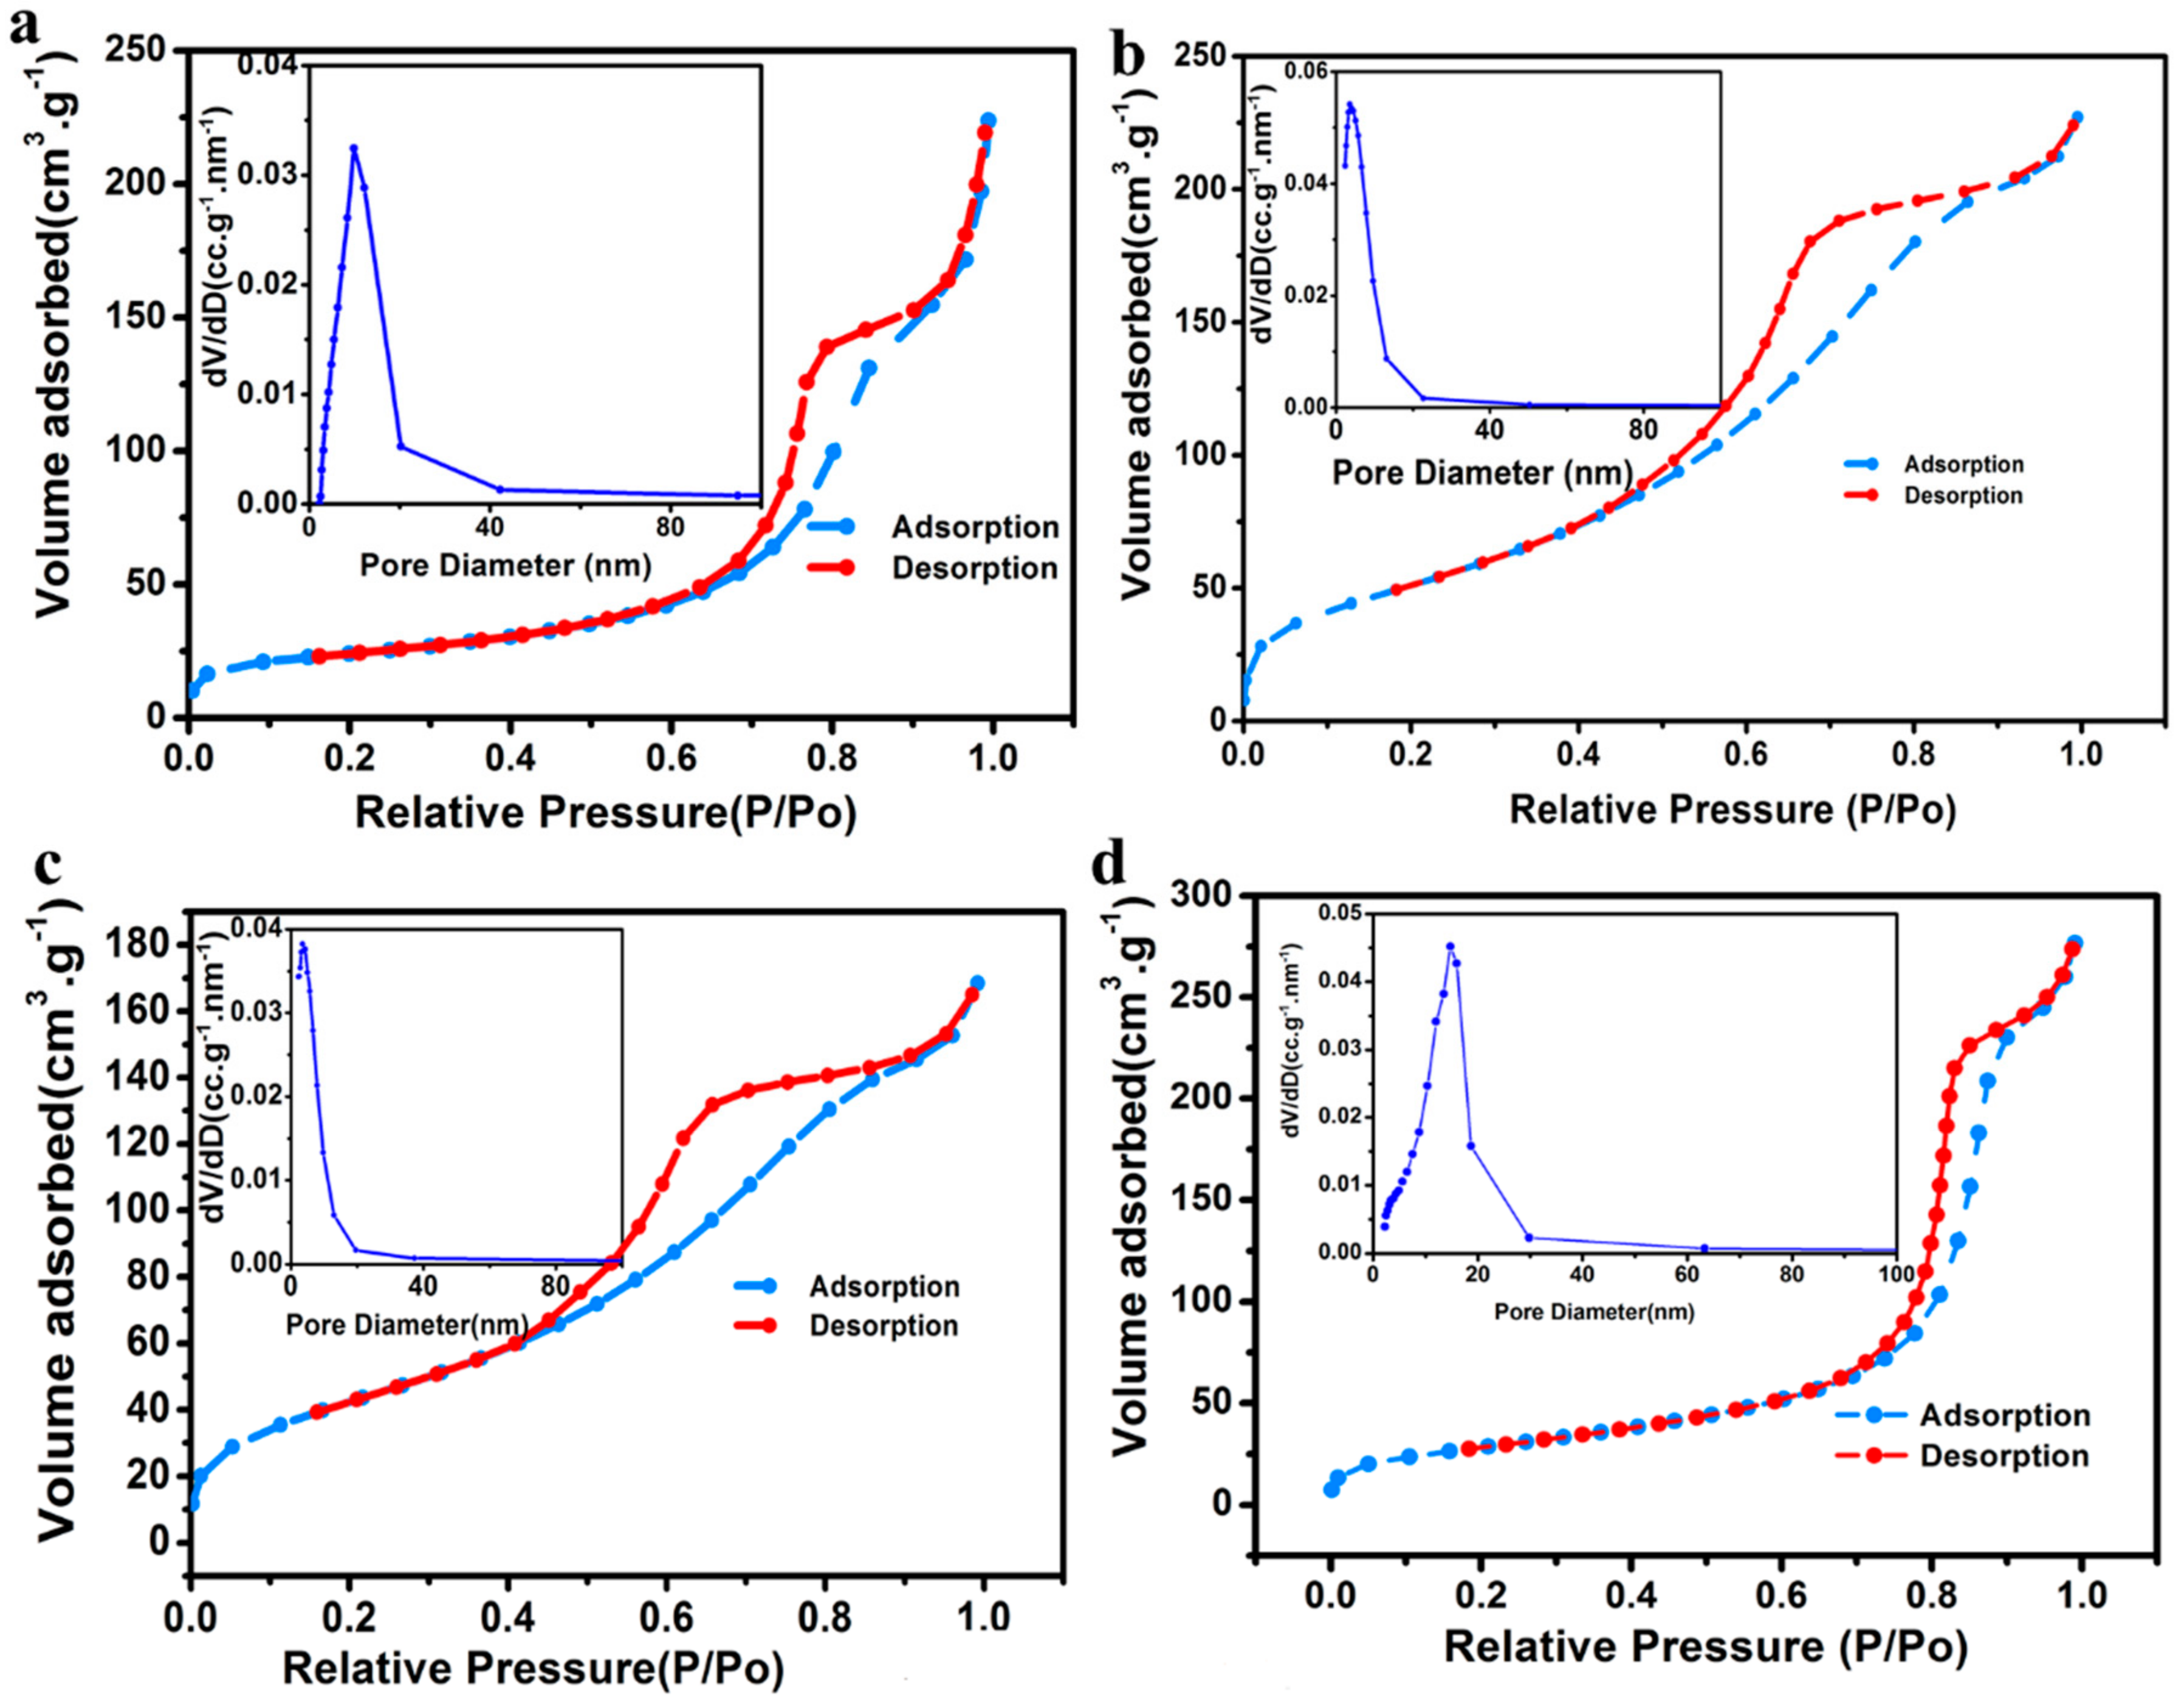
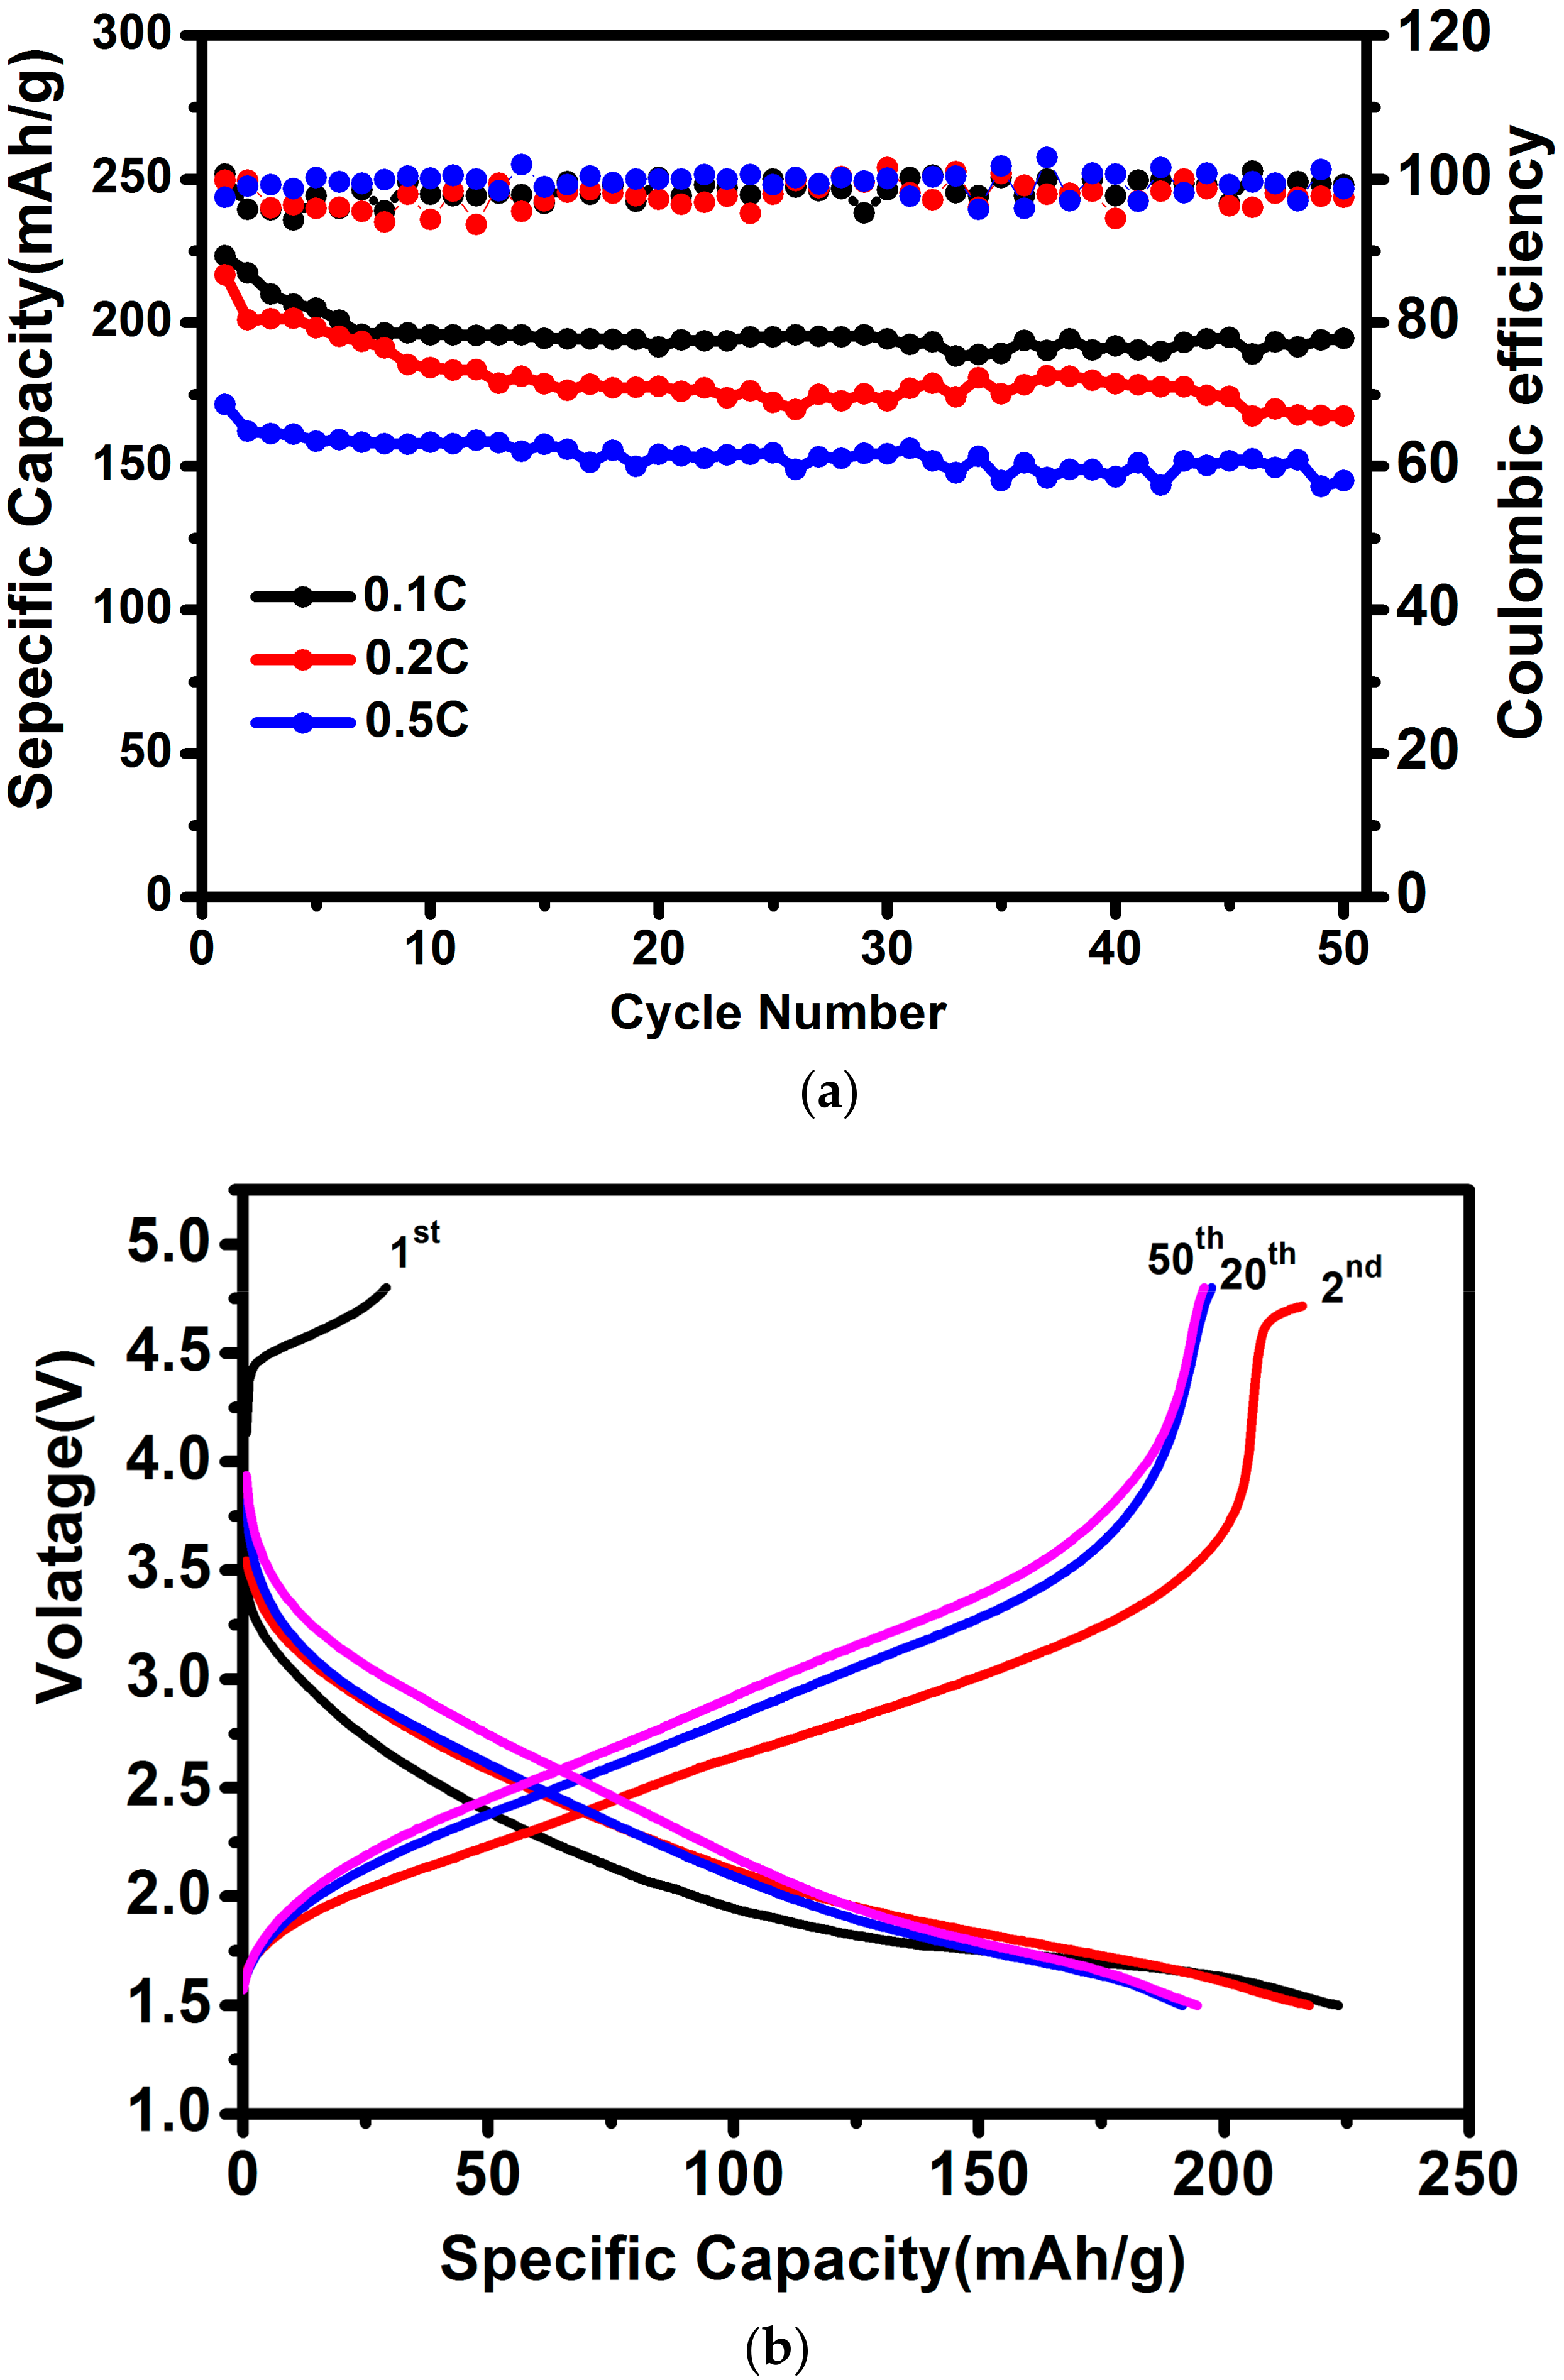
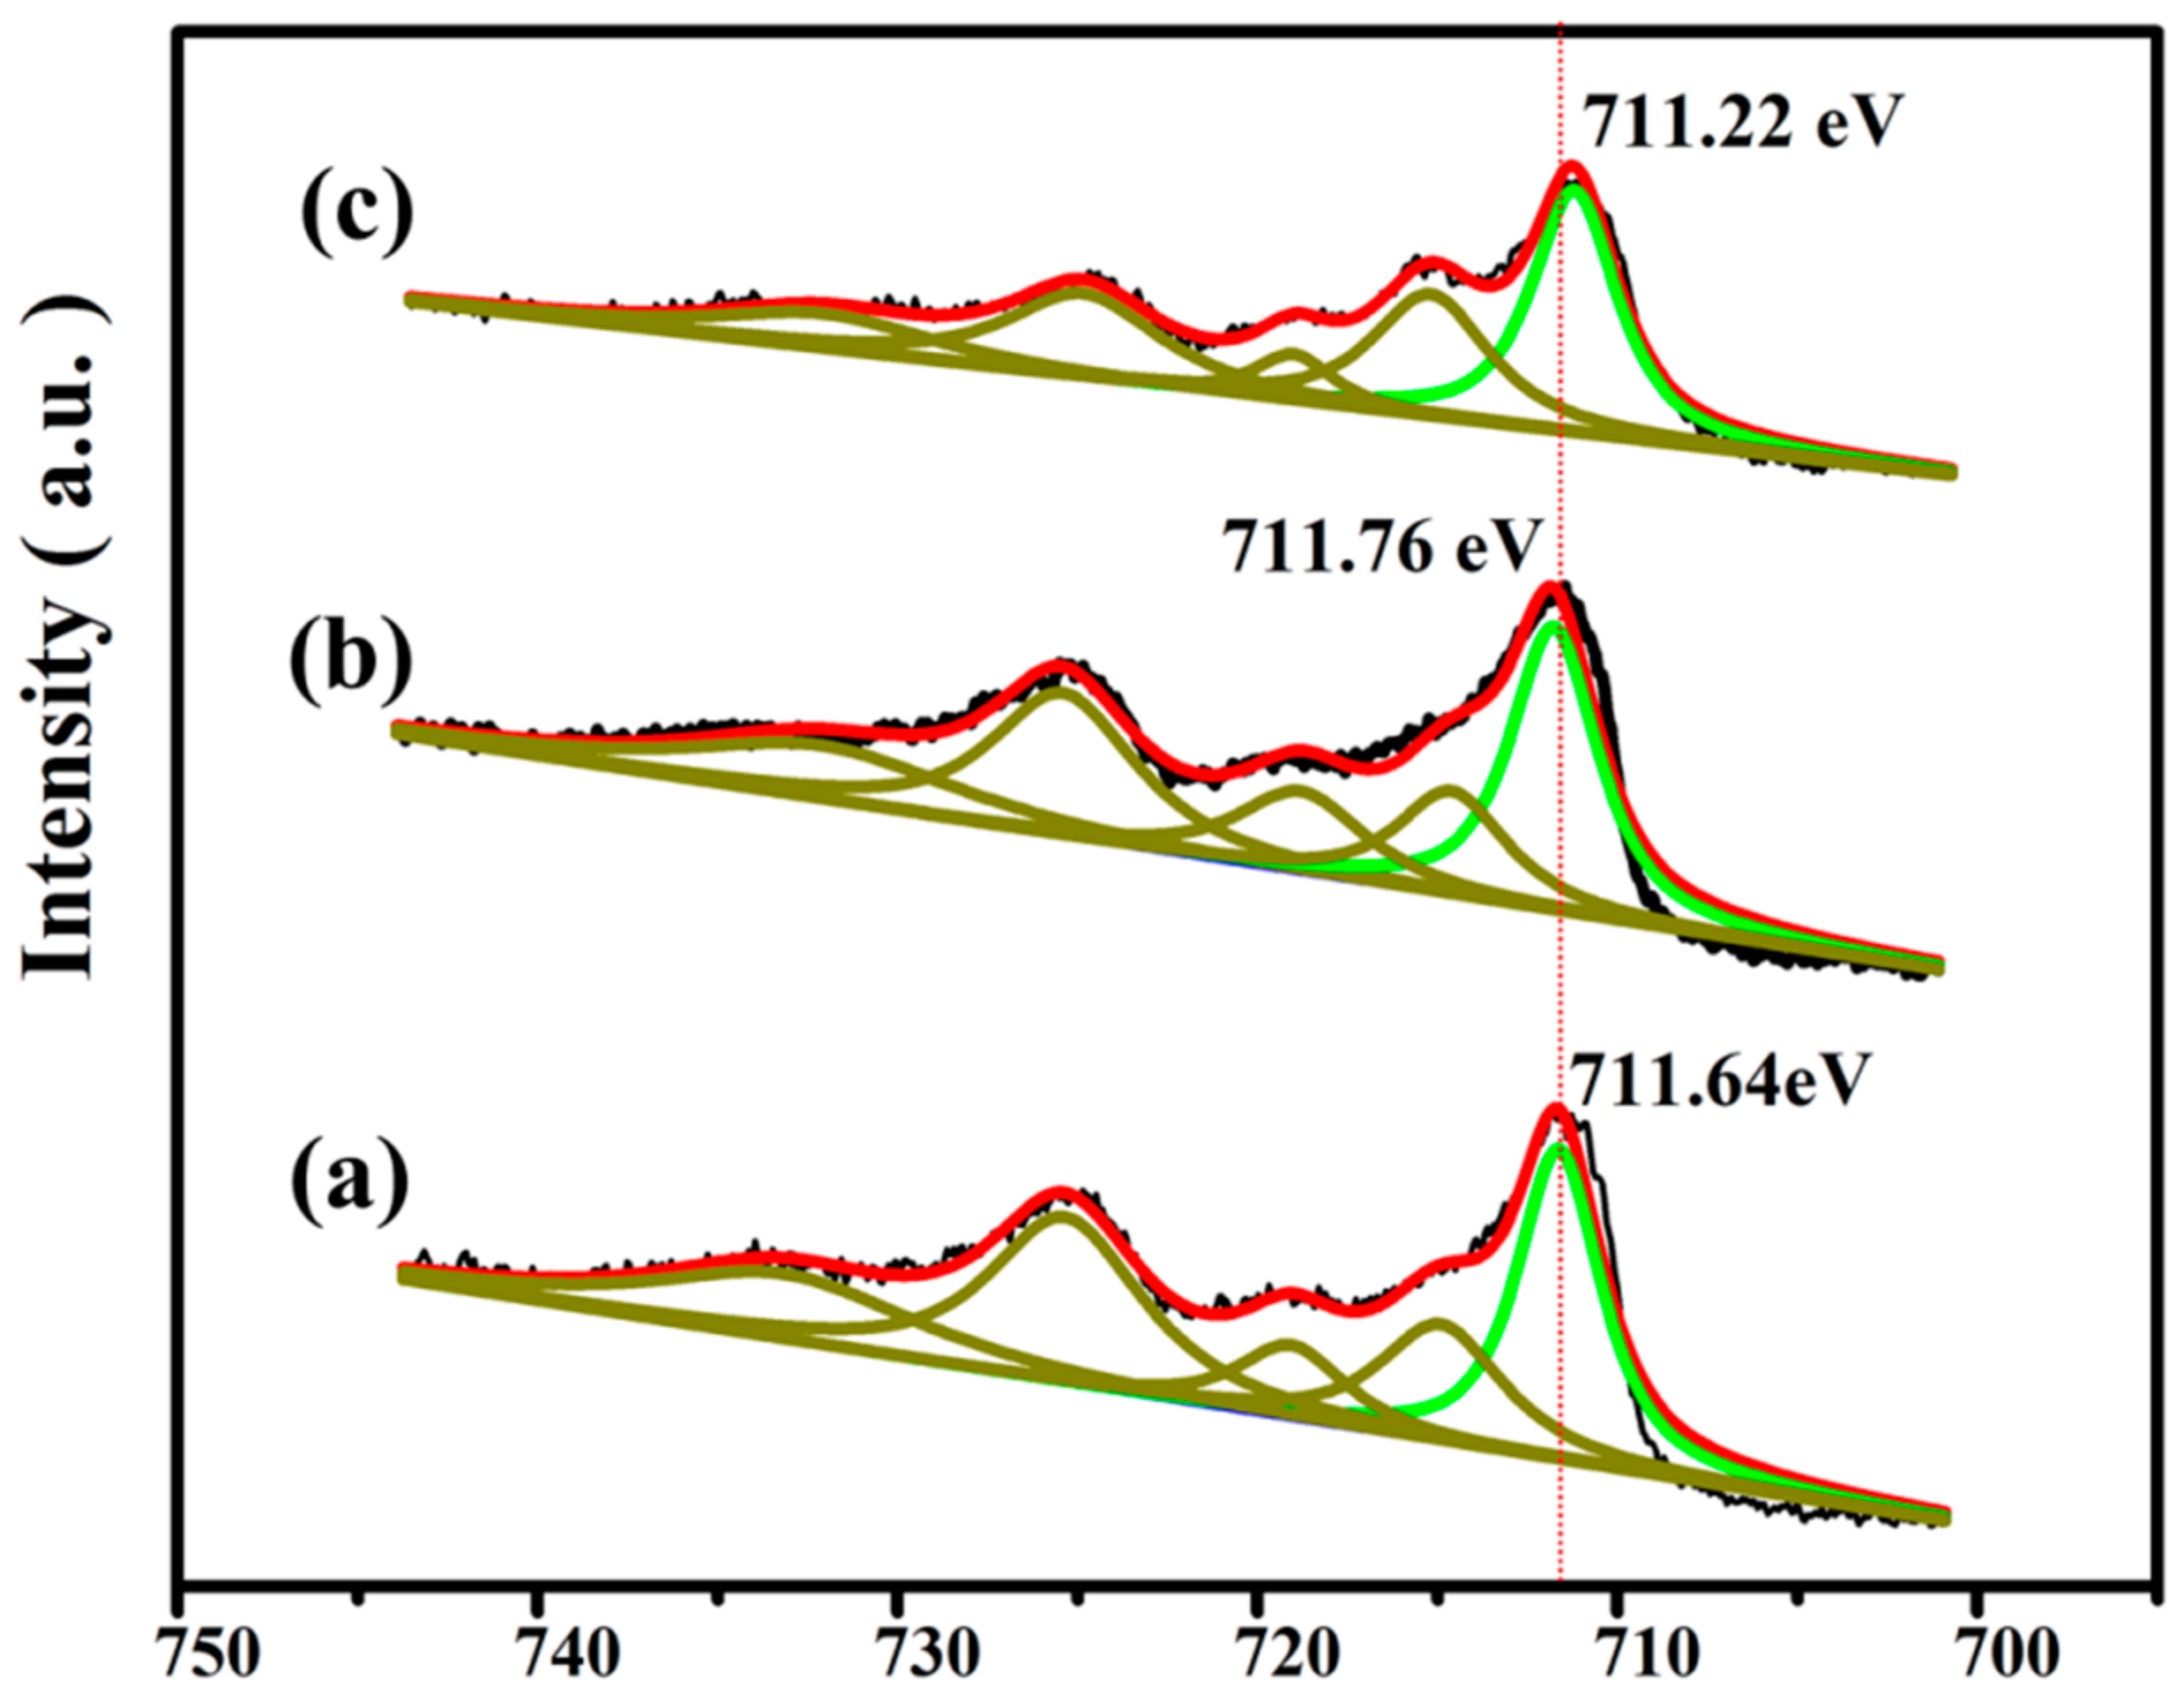
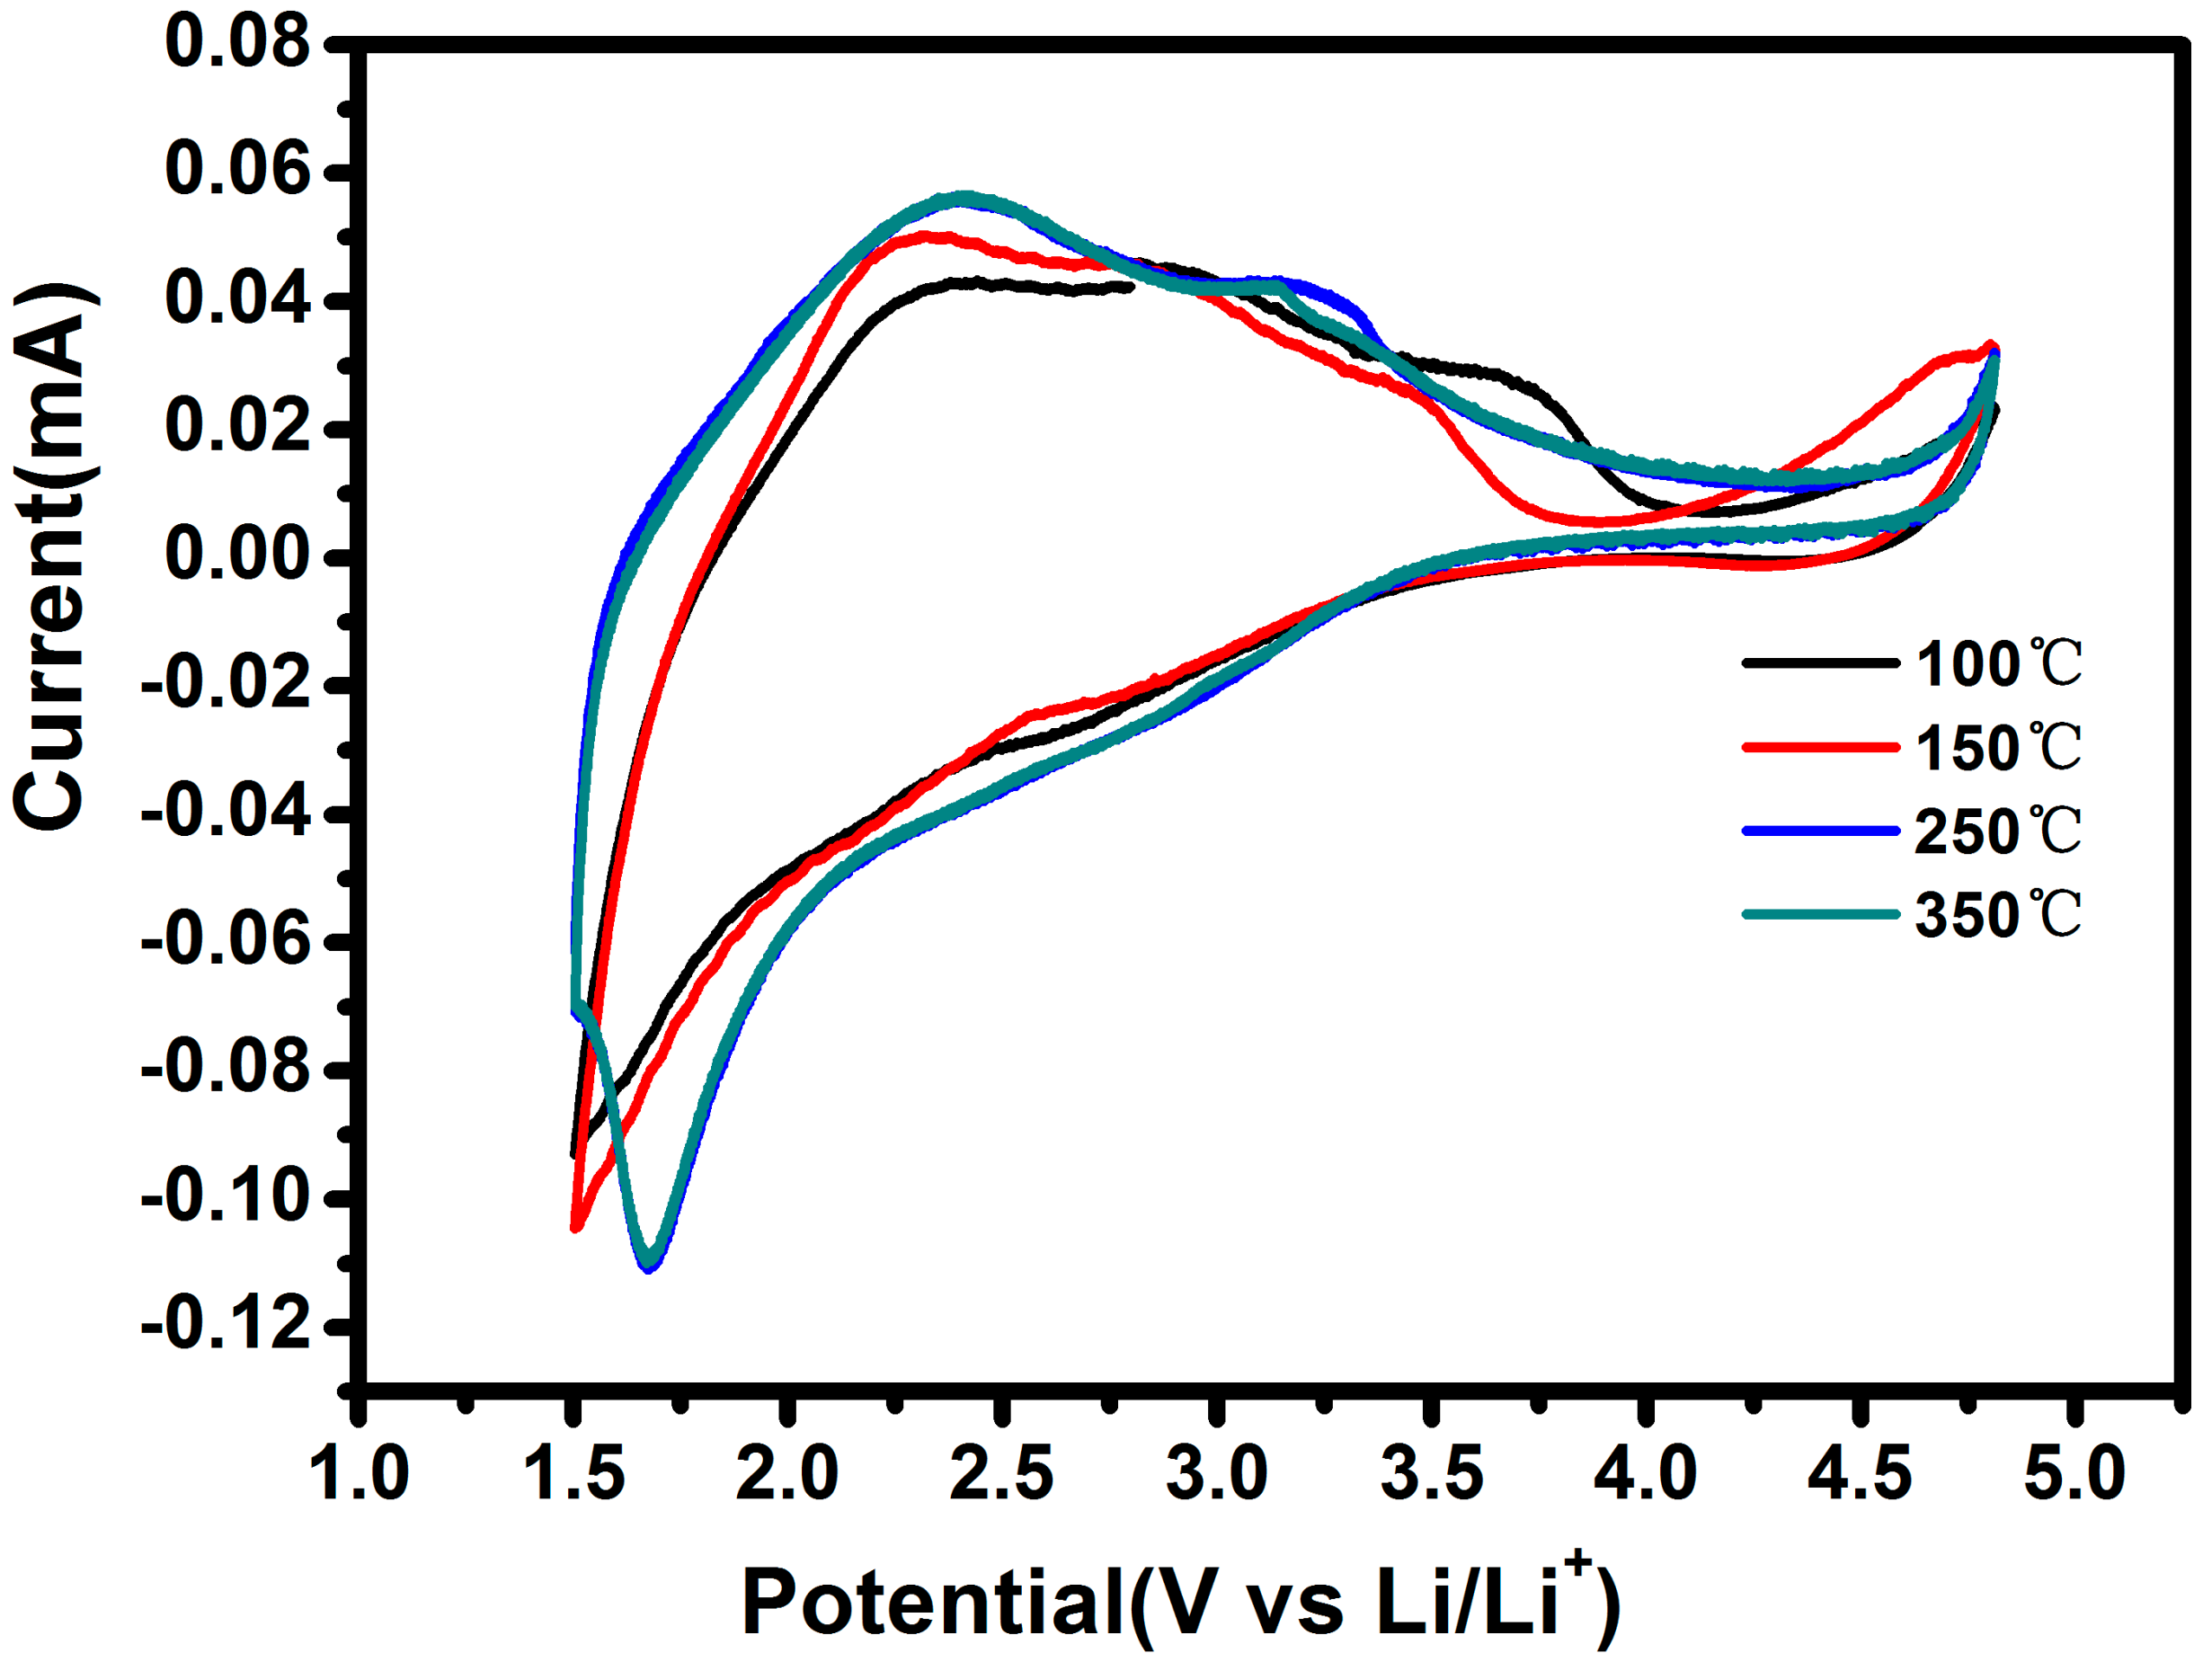
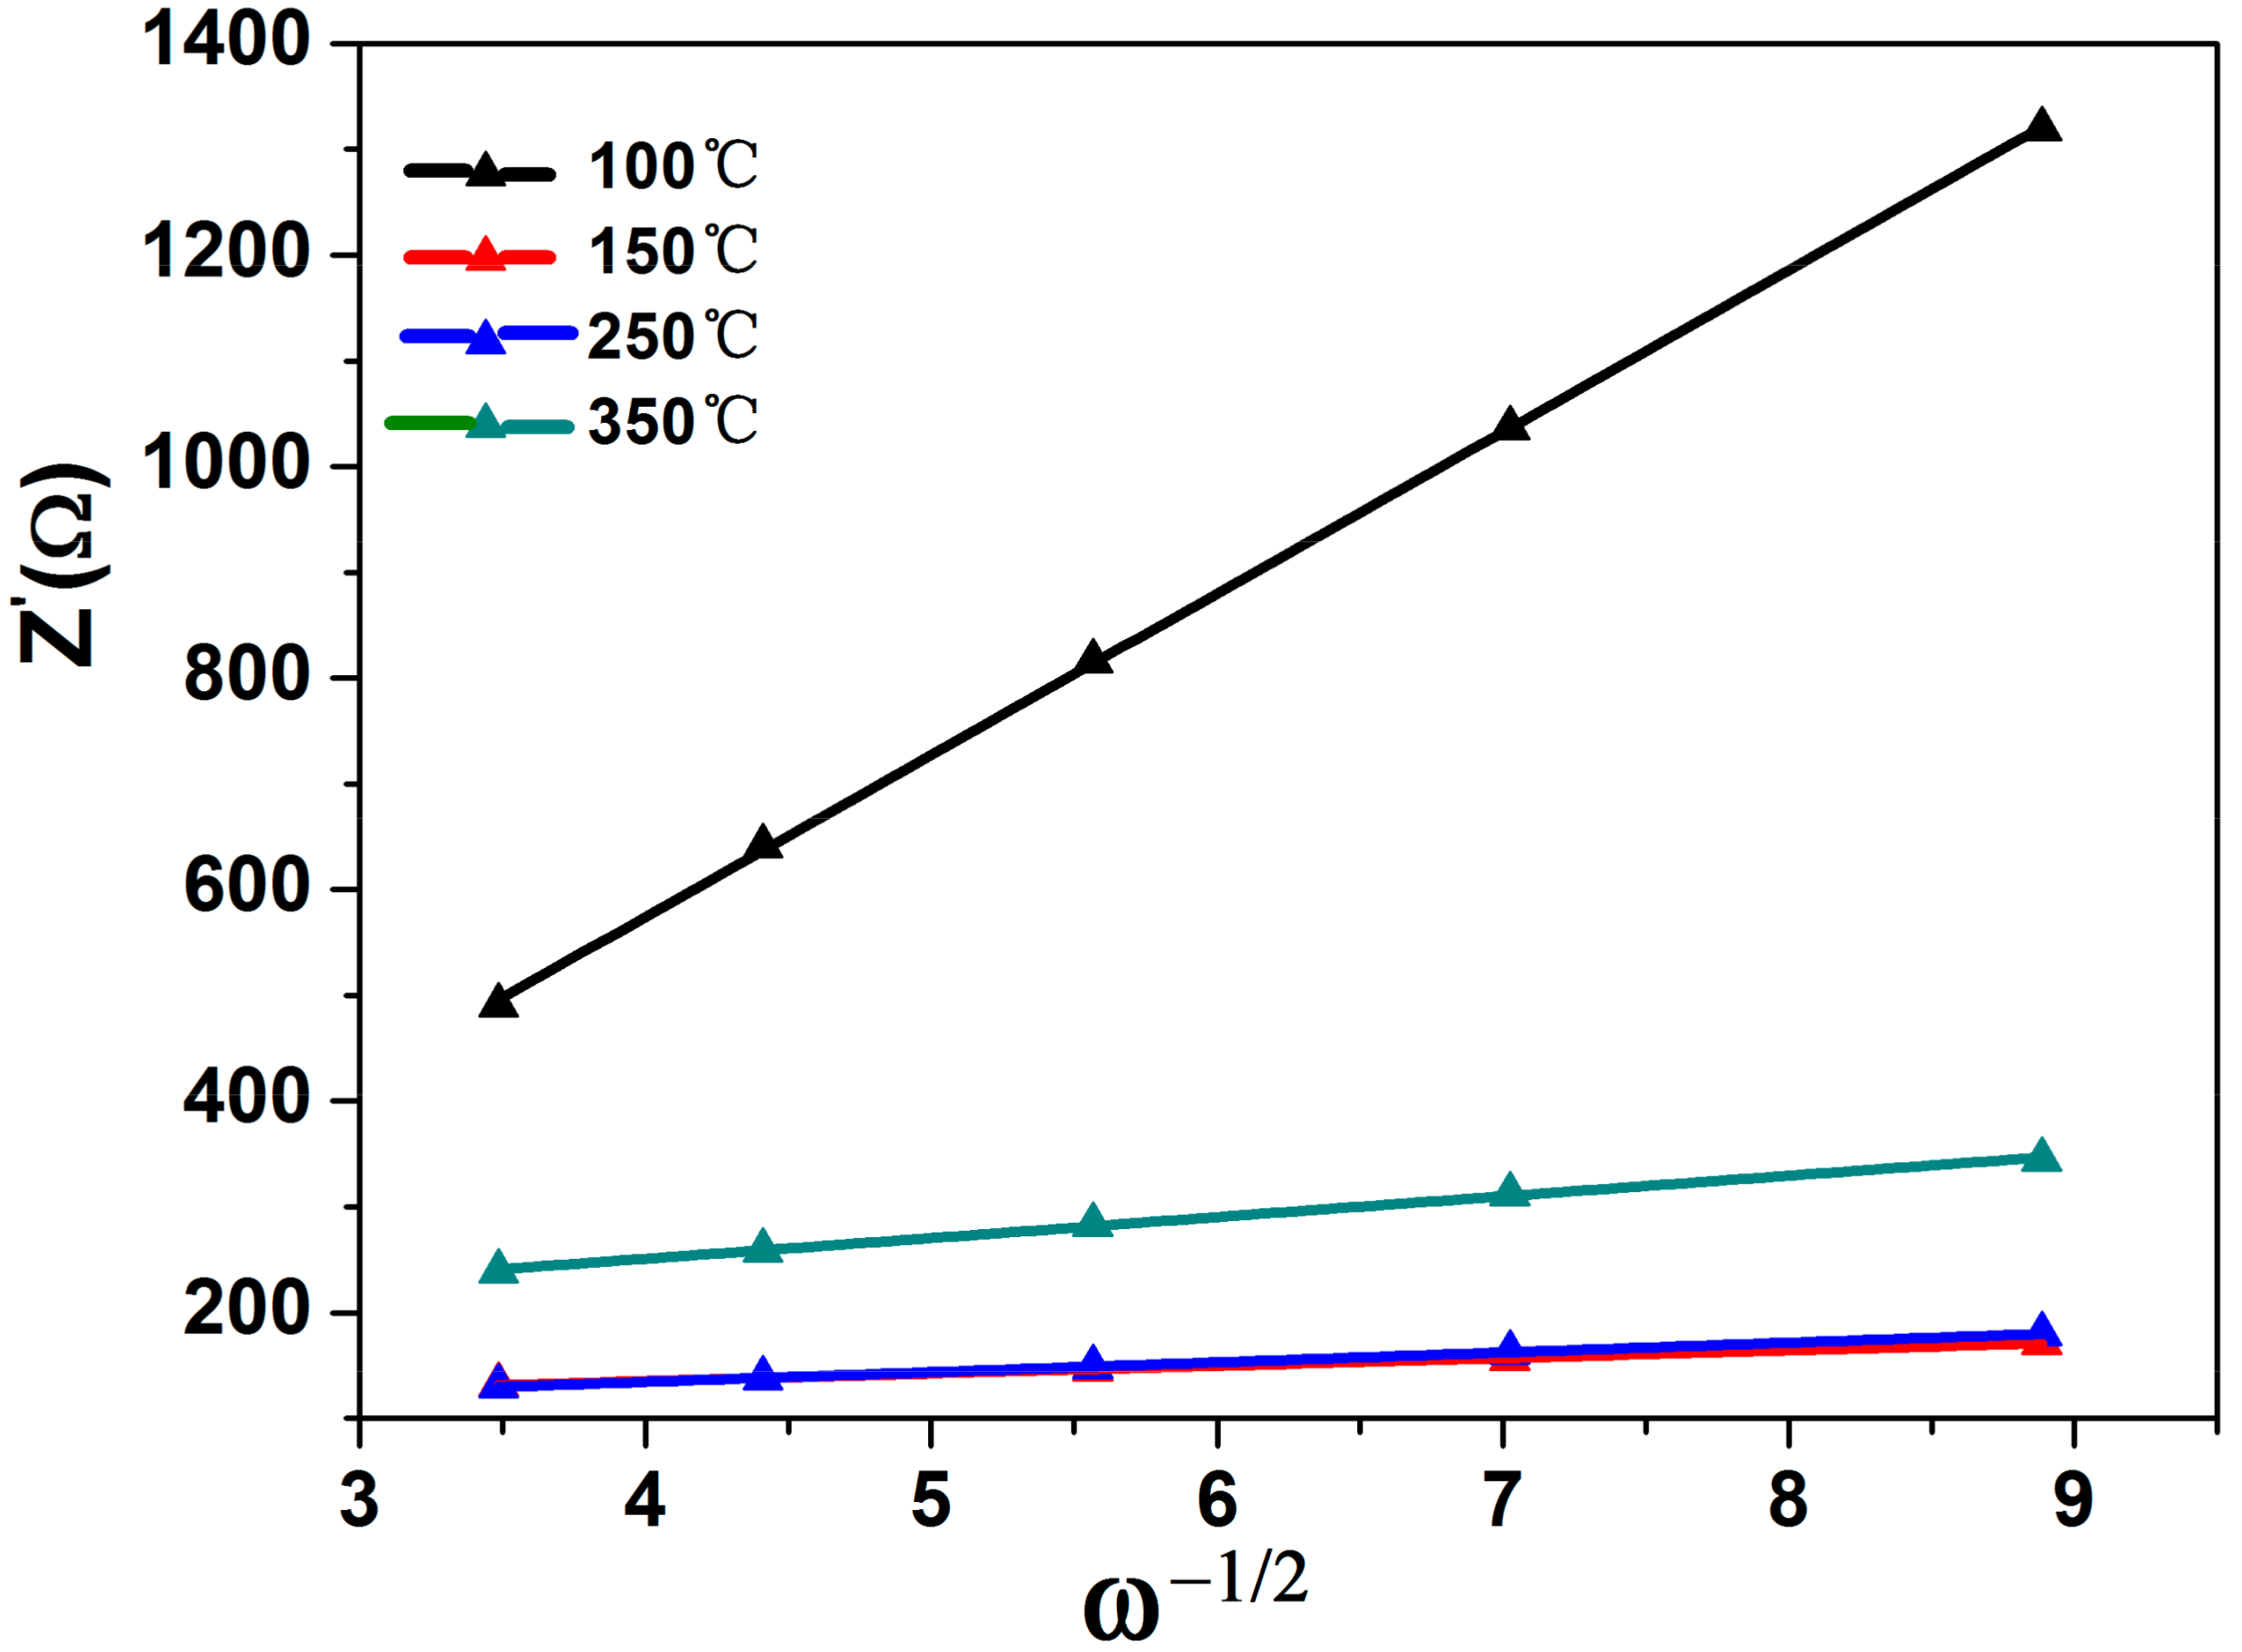
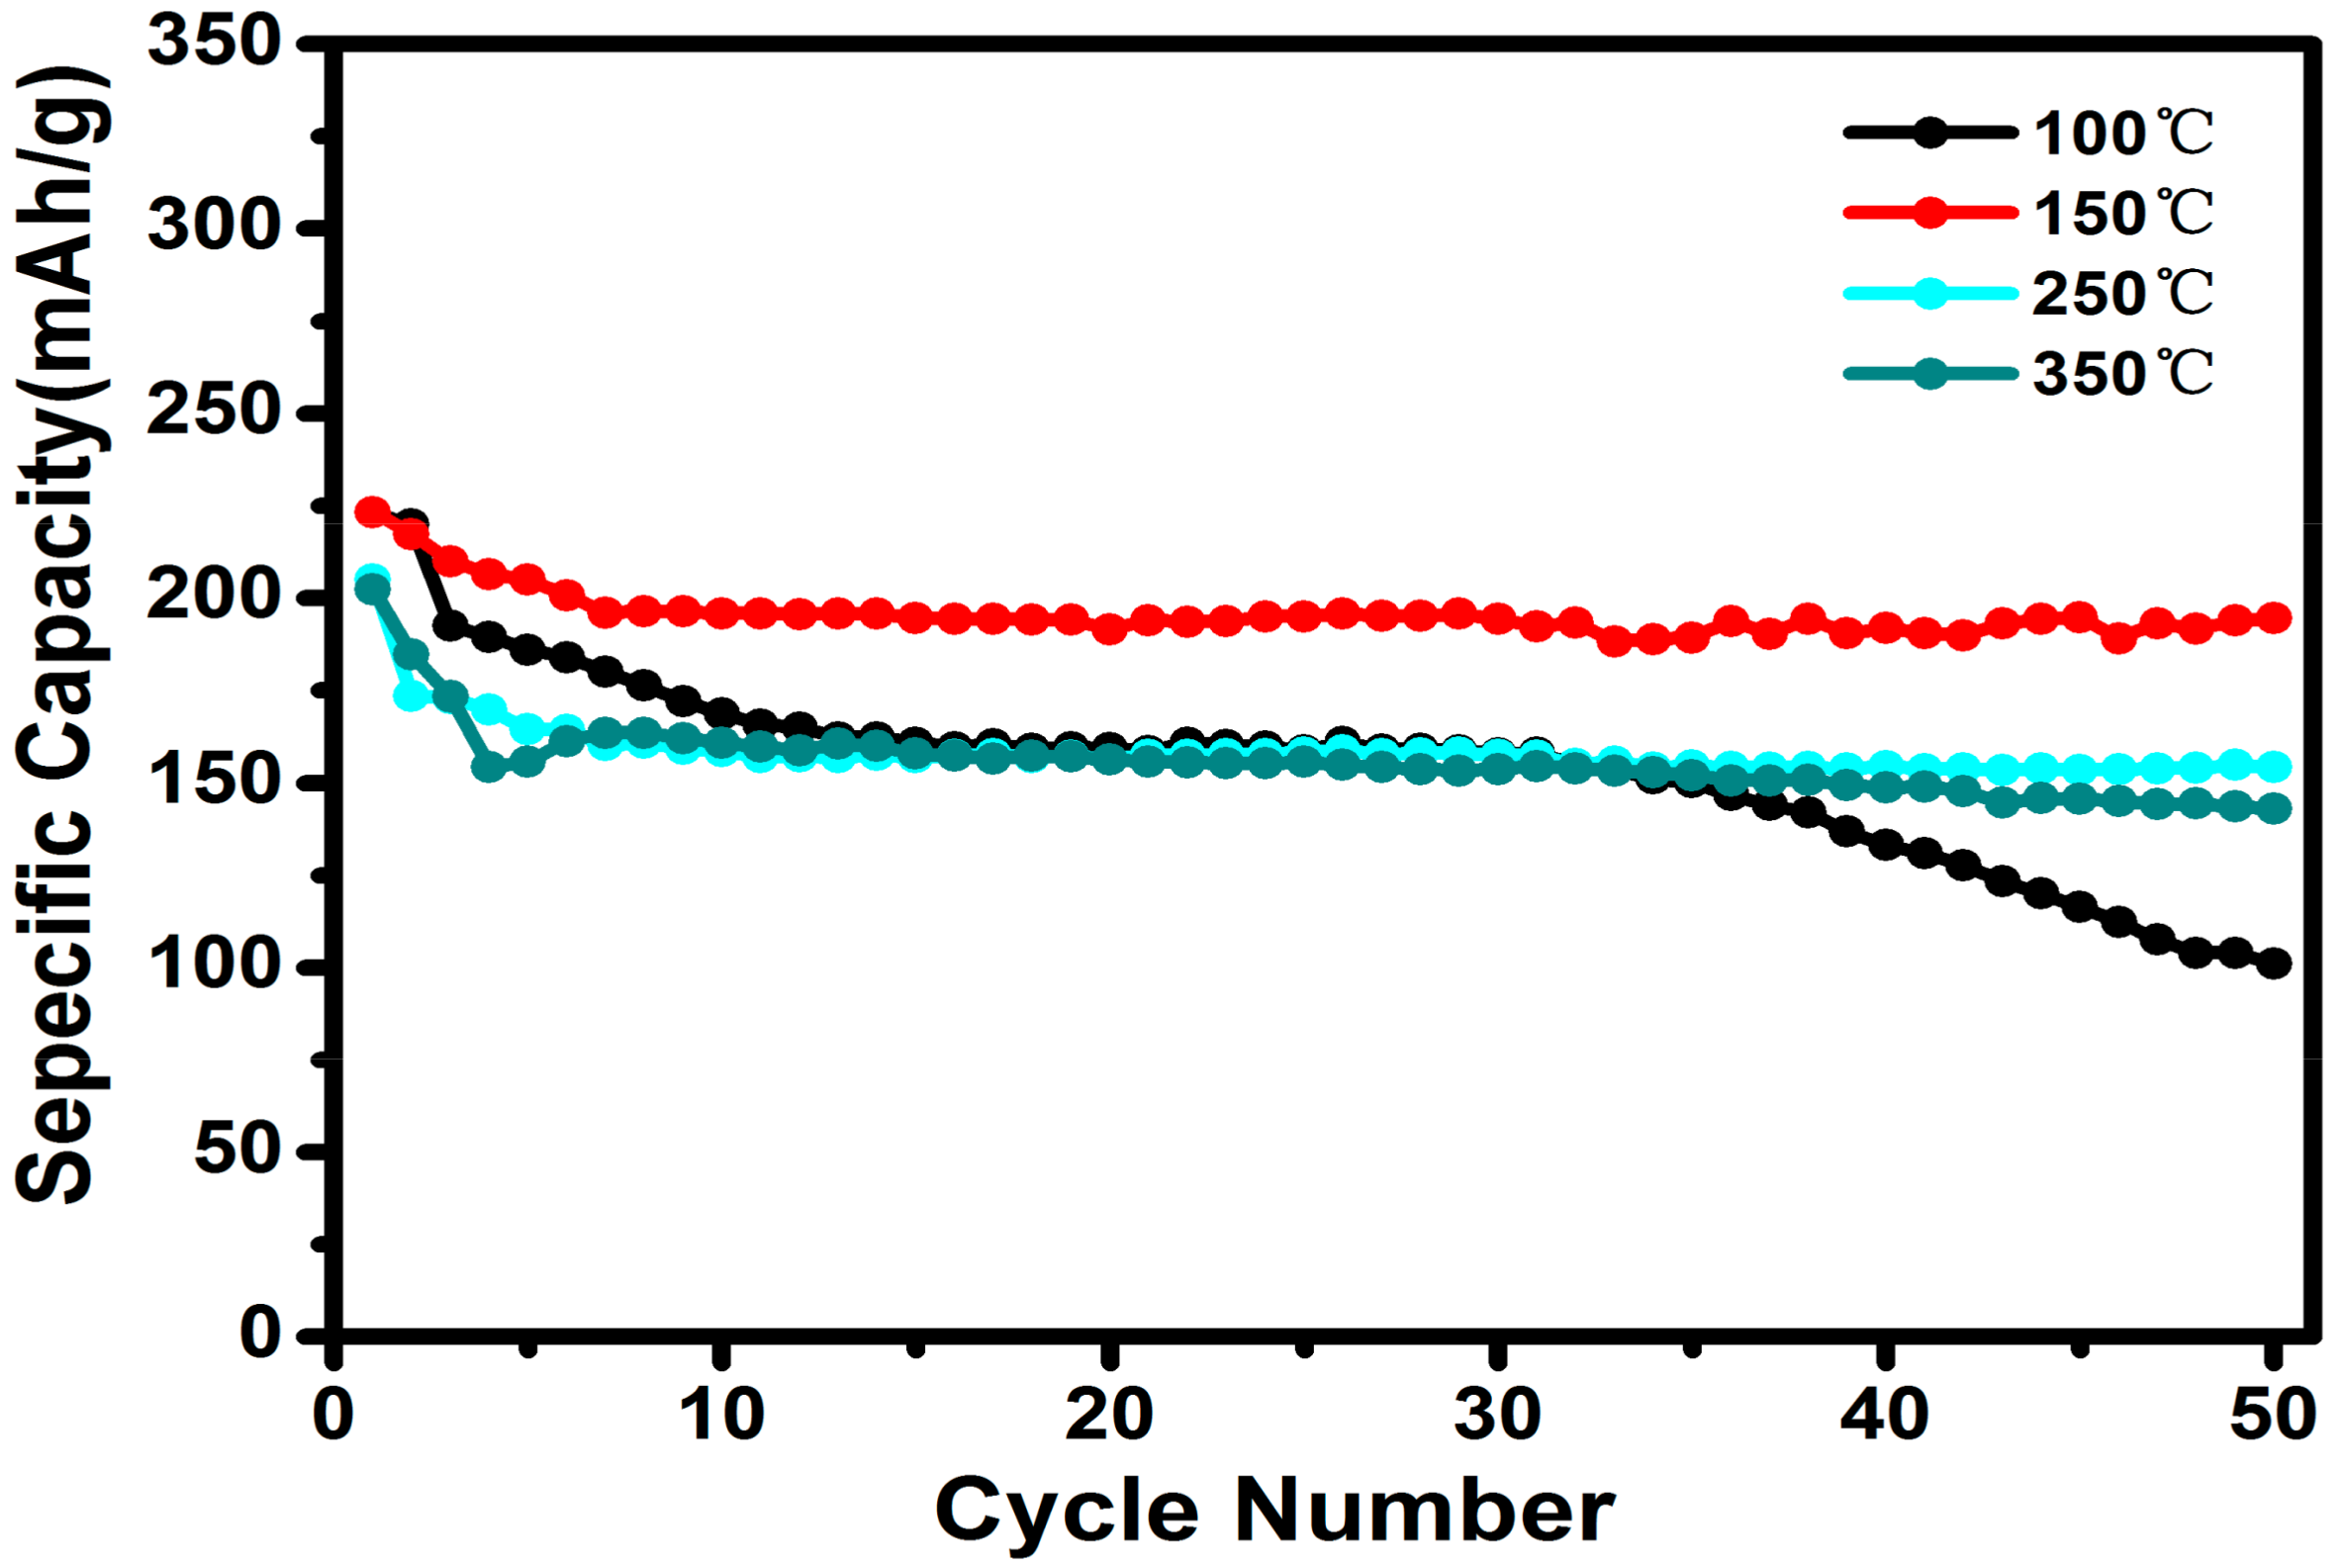
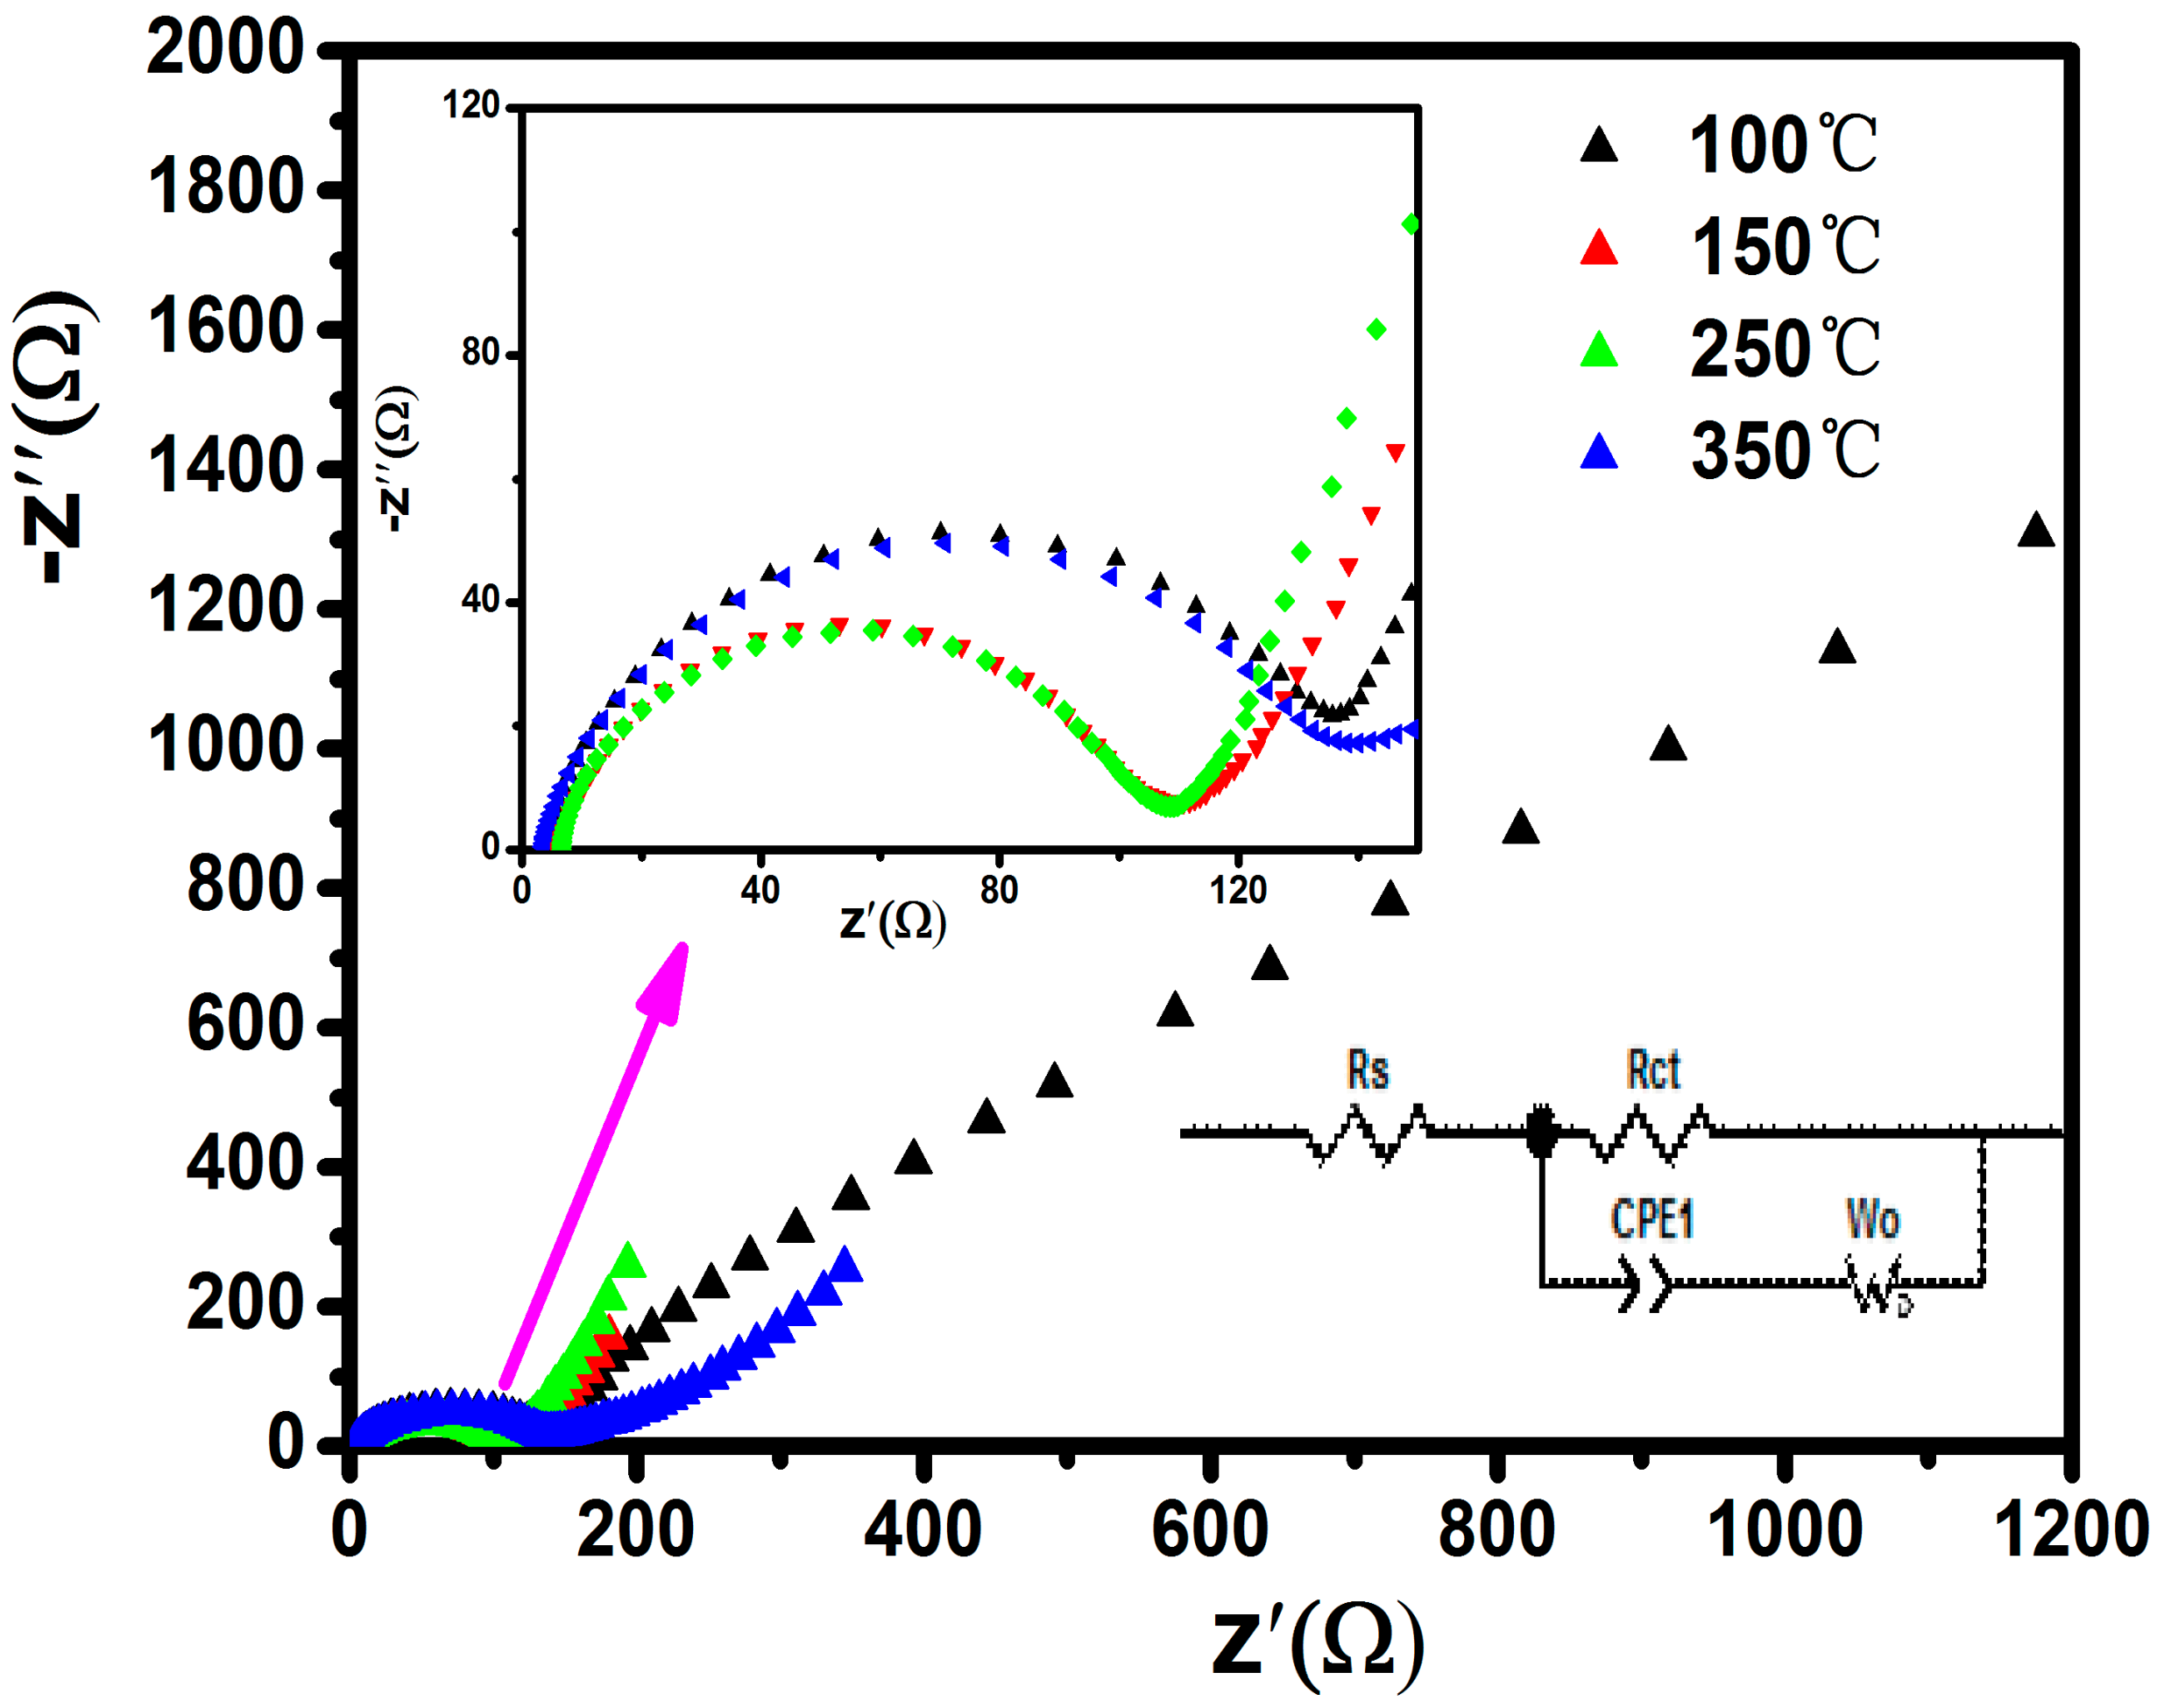
3. Results and Discussion

Scheme 1 illustrates the synthesis process of α-LiFeO2, where the Li precursor and Fe precursor dissolved in ethanol solution and reacted together under ambient temperature. Herein, the formation of α-LiFeO2 includes two stages, the formation of nucleuses and the growth of α-LiFeO2 crystals. Meanwhile, the low temperature calcination process further improved the crystallinity of α-LiFeO2.
The XRD patterns of the α-LiFeO2 samples obtained under various temperatures for 6 h in argon atmosphere is presented in Figure 1. When the temperature is below 250 °C, the diffraction peaks of the obtained samples match the standard reflection peaks of α-LiFeO2 well (Space group Fm3m, JCPDS No. 74-2283, a = 4.156 Å). When the temperature rises to 350 °C, there is an impurity phase, which can be attributed to spinel LiFe5O8 [20,21]. This result agrees with the reported result that the LiFe5O8 impure phase appears after high temperature sinter process [15]. However, with luck, the α-LiFeO2 would still be the main phase, and the (110), (200) and (220) diffraction peaks gradually become thinner upon increasing temperature.
Figure 2 presents the SEM measurements of the α-LiFeO2 nanoparticles obtained at various temperatures. As shown in Figure 2, the sintering temperature does not have a significant impact on the morphology and particle distribution. For these samples, the particle size and grain distribution are roughly the same. Each sample is composed with round likely ultra-small particles. Figure 3a–c shows the SAED image and TEM images of the sample obtained at 150 °C. As shown in Figure 3a, the diffraction rings of (200), (220), (222), and (311) can be indexed to cubic α-LiFeO2 [22]. Furthermore, Figure 3b,c shows the sample with even particle size distribution and the average particle size is below 10 nm. We can conclude from the SEM and TEM images that α-LiFeO2 particles tended to agglomerate a bunch-like morphology. Morales et al. synthesized 50 nm α-LiFeO2 nanoparticles via molten-salt way that also agglomerated with a bunch-like morphology, and they believed such particular architecture can provide an uninterrupted pathway for lithium ion diffusion, which enhances the electrochemical properties [10].
The N2 adsorption–desorption measurements were introduced to obtain the surface information of α-LiFeO2 calcined at different temperatures. In Figure 4 and Table 1, the specific surface areas of samples calcined at 100 °C, 150 °C, 250 °C and 350 °C are 82.11 m2·g−1, 194.48 m2·g−1, 159.30 m2·g−1 and 103.42 m2·g−1, respectively. Furthermore, the corresponding desorption average pore diameter of these samples are 8.46 nm, 3.27 nm, 3.61 nm and 8.28 nm, respectively. Clearly, α-LiFeO2 calcined at 150 °C possesses the largest specific surface area and smallest pore diameter; these surface structures supply a large specific surface area to enhance the contact area between electrolyte and electrode, and shorten the transportation distance of Li+ ions between the nanoparticles [23].
The cycling performance of the electrodes obtained at different temperature are shown in Figure 5. The first specific capacities of these electrodes are 223.2 mAh/g, 223.3 mAh/g, 205 mAh/g, and 202.3 mAh/g with capacity retention of 45.2%, 87.1%, 75.3%, and 70%, respectively. The cycling performance is much better than that of the reported pure phase α-LiFeO2 [16,23,24]. The capacity decreased as the temperatures increase, which might be attributed to the higher sintering temperature leading to the impurity phase of LiFe5O8, which is considered responsible for the sharp decrease of initial discharge capacity [25,26]. Furthermore, Sakurai found that α-LiFeO2 synthesized at high temperature was electrochemically inactive, as the higher temperature may increase the disorder degree of iron ions on lithium sites and block lithium diffusion pathways [8,27,28].
Among these samples, the sample obtained at 150 °C exhibits the highest initial specific capacity of 223.3 mAh/g. More importantly, the discharge capacity retains 194.5 mAh/g after 50 cycles. Although there is a sharp capacity decline in the first five cycles, this sample can show outstanding cycling performance with high capacity retention of 96.9% in subsequent charge–discharge processes. The sample calcined at 150 °C exhibited such excellent electrochemical performance may attributed to small average particle size of below 10 nm and lower calcined temperature.
To further evaluate the electrochemical performance, the optimal sample sintered at 150 °C was cycled between 1.5–4.8 V at different rates.Figure 6 shows the cycling performance and corresponding representative charge–discharge profiles of the α-LiFeO2 electrodes obtained at 150 °C. It can be seen from Figure 6a that the initial discharge capacity at 0.1 C, 0.2 C, and 0.5 C is 223.3 mAh/g, 216.6 mAh/g and 171.5 mAh/g with capacity retention of 87.1%, 77.3% and 84.5%, respectively. Apart from the first cycle, the Coulombic efficiencies of these α-LiFeO2 samples at different rates are very stable and close to 100%, indicating the α-LiFeO2 obtained in this work can show excellent reversible electrochemical performance.
Figure 6b displays the representative charge–discharge profiles of this electrode. It can be seen that the charging profile of the first cycle is totally different from the subsequent cycles, and there are disparate profiles of the charge–discharge curves. This is a typical phenomenon for α-LiFeO2, which was also found in orthorhombic, corrugated layer, and tetragonal phase LiFeO2 [28,29,30]. During the first charging process, the voltage exhibits a sharp increase from the open circuit voltage to 4.25 V. Then, there is a slowly rise to 4.8 V with a long plateau above 4.25 V. When the sample is discharged, the voltage rapidly decreased to 3.0 V and then there is a gradual decrease to the cut-off potential of 1.5 V, giving a long discharge plateau within 1.5–1.8 V. The subsequent discharge curves are consistent with the first cycle, but the subsequent charge curves are totally different from the first one. For the second charging process, the voltage slowly increased from 1.5 V to 3.5 V with a large voltage plateau in the 2.5–3.5 V region, which significantly improves the specific capacity. Then, there is a deep increase with a relative small voltage plateau at 4.25–4.8 V. With continued cycling, this voltage gradually becomes smaller until it disappears after 50 cycles. This typical phenomenon is noted by previous researchers. Morales suggested a structural rearrangement upon lithium removal: The Fe4+ atoms, which originally located on octahedral 4a sites might move to tetrahedral 8c position during reaction. This is the main conduction pathway of lithium ions during charging; the displace position of Fe4+ may account for the voltage hysteresis and a continuous decrease of plateau at 4.5–4.8 V. Another explanation is that unstable Fe4+ may react with the electrolyte during charging process. Wu et al. suggested that the reversible electrochemical reaction occurring in the a-LiFeO2 electrode during charge–discharge are Fe3+/Fe2+, the corresponding reaction formation is:
Li 1 + x FeO 2 LiFeO 2   + xLi + + xe
which was also suggested by Kanno et al. and Lee et al. for other LiFeO2 polymorphs [4,28].
The X-ray photoelectron spectroscopy (XPS) was employed to indicate the chemical state of α-LiFeO2 at pristine state (OCV), charged to 4.8 V and discharged to 1.5 V. Figure 5 shows the XPS spectra of Fe2p at different states. As shown in Figure 7a–c, the value of binding energy is 711.64 eV, 711.76 eV and 711.22 eV, respectively, which correspond to the binding energy of Fe2p in the research result [31,32]. The binding energy value at OCV is 711.64 eV, which slightly increases to 711.76 eV after charged to 4.8 V, indicating that the environment of Fe is scarcely altered during charging process. The small increase in binding energy can be ascribed to the small fraction of oxidized Fe present [32]. However, the large decrease of binding energy value of 0.42 eV at discharged state (Figure 7c) indicates a prominent change of the Fe oxidation state, which is consistent with the earlier report by Morales et al. [32].
The cyclic voltammetry measurements shown in Figure 8 were used to analyze the oxidation and reduction process during the charge–discharge cycles of all electrodes. The scan rate was 0.1 mV/s, and the potential range is 1.5–4.8 V. The large cathodic peak at 1.75 V corresponds to the voltage plateau of 1.5–1.8 V during the discharge process, in which Li+ ions are extraction from α-LiFeO2 to form α-Li1+xFeO2 [33,34]. Two broad anodic peaks at 2.0 and 3.5 V are discovered in all electrodes. They correspond to the voltage plateau in the charge process, in which Li+ de-intercalated from α-Li1+xFeO2 [35]. A sharp rise at 4.8 V is observed in all samples, which further proves that the voltage plateaus above 4.25 V for α-LiFeO2. Evidently, among these electrodes, the electrode calcined at 100 °C demonstrates the lowest current densities and smallest peak areas, exposing that the electrode possesses higher inner resistance and poor electrochemical performance [36].
Figure 9 presents the EIS of electrodes calcined at different temperature, which displayed one semicircle and a sloping line. The fitting circuit model is displayed in the inset, which includes ohmic resistance (Rs); charge transfer resistance (Rct), which is closely related to the electronic conductivity; double layer capacitance (CPE); and the Warburg impedance (Wo) [37,38]. It can be concluded from Table 1 that the Rct value of electrodes calcined at 100 °C and 350 °C are 152.8 Ω and 121.7 Ω, respectively. The values are higher than electrodes calcined at 150 °C and 250 °C, i.e., 94.4 Ω and 94.59 Ω, respectively. The above results suggest that extremely low and relatively high temperatures would increase the charge transfer resistance.
The lithium-ion diffusion coefficient can be calculated by the following equation [37].
D L i + = R 2 T 2 2 A 2 n 4 F 4 C 2 σ 2
Z σ ω 1 / 2
where R is the gas constant, T is the absolute temperature, A is the surface area of the electrode, n is the number of electrons per-molecule, F is he Faraday constant, C is the molar concentration of Li+ ions, ω is the angular frequency, and σ could been obtained by liner fitting the relationship curve between Z and reprocal square root of the angular frequency in Figure 10 [11,39]. The lithium-ion diffusion coefficients of α-LiFeO2 calcined at 100 °C, 150 °C, 250 °C and 350 °C were calculated as 2.98 × 10⁻¹³, 1.3 × 10⁻¹⁰, 8.08 × 10⁻¹¹, and 9.11 × 10⁻¹², respectively. The results of calculations are also listed in Table 2. It can be concluded from the electrochemical impedance spectra results that the electrode calcined at 150 °C exhibited smaller Rct and larger DLi+, which may positively affect the electrochemical performance.

4. Conclusions

Ultra-small α-LiFeO2 nanoparticles with average diameter below 10 nm were successfully prepared via a simple, quick and eco-friendly strategy followed by a low temperature calcine process. The optimal α-LiFeO2 calcined at 150 °C for 6 h exhibited excellent electrochemical performance. The initial discharge capacity could reach up to 223.3 mAh/g at 0.1 C, which is close to the theoretical value, and retained 194.5 mAh/g after 50 cycles. It also exhibited high specific capacities of 216.6 mAh/g and 171.5 mAh/g with capacity retention of 77.3% and 84.5% after 50 cycles at 0.2 C and 0.5 C, respectively. Such high electrochemical performance can be attributed to the ultra-small particle size and small charge transfer resistance. The present work may provide a promising strategy to promote the practical application of α-LiFeO2.

Author Contributions

Y.H. conceived and designed the experiments; Y.H. and H.Z. performed the experiments; all authors analyzed the data; Y.H. and H.Z. co-wrote the paper; all authors discussed the results and commented on the paper.

Funding

This research was funded by the National Natural Science Foundation of China (Grant No. 21071026).

Acknowledgments

The authors appreciate the financial support from the National Natural Science Foundation of China (grant No. 21071026).

Conflicts of Interest

The authors declare no conflict of interest.

References

  1. Dysart, A.D.; Phuah, X.L.; Shrestha, K.L.; Ariga, K.; Pol, V.G. Room and elevated temperature lithium-ion storage in structurally submicron carbon spheres with mechanistic. Carbon 2018, 134, 334–344. [Google Scholar] [CrossRef]
  2. Zheng, J.; Lochala, J.A.; Kwok, A.; Deng, Z.D.; Xiao, J. Research Progress towards Understanding the Unique Interfaces between Concentrated Electrolytes and Electrodes for Energy Storage Applications. Adv. Sci. 2017, 4, 1–19. [Google Scholar] [CrossRef] [PubMed]
  3. Aifantis, K.E.; Hackney, S.A.; Kumar, R.V. High Energy Density Lithium Batteries: Materials, Engineering, Application; Wiley-VCH Verlag GmbH & Co., KGaA: Weinheim, Germany, 2010. [Google Scholar]
  4. Kanno, R.T.; Shirane, Y.; Kawamoto, Y.; Takana, M.; Ohashi, M.; Yamaguchi, Y. Synthesis, structure, and electrochemical properties of a new lithium iron oxide, LiFeO2, with a corrugated layer structure. J. Electrochem. Soc. 1996, 143, 2435–2442. [Google Scholar] [CrossRef]
  5. Kanno, R.; Shirane, T.; Inaba, Y.; Kawamoto, Y. Synthesis and electrochemical properties of lithium iron oxides with layer-related structures. J. Power Sources 1997, 68, 145–152. [Google Scholar] [CrossRef]
  6. Li, J.G.; Luo, J.; Wang, L.; He, X.M. Recent advances in the LiFeO2-based materials for Li-ion batteries. Int. J. Electrochem. Sci. 2011, 6, 1550–1561. [Google Scholar]
  7. Sakurai, Y.; Arai, H.; Okada, S.; Yamaki, J. Low temperature synthesis and electrochemical characteristics of LiFeO2 cathodes. J. Power Sources 1997, 68, 711–715. [Google Scholar] [CrossRef]
  8. Sakurai, Y.; Arai, H.; Yamaki, J. Preparation of electrochemically active a-LiFeO2 at low temperature. Solid State Ion. 1998, 113–115, 29–34. [Google Scholar] [CrossRef]
  9. Li, K.Y.; Hao, C.; Shua, F.F.; Chen, K.F. Low temperature synthesis of Fe2O3 and LiFeO2 as cathode materials for lithium-ion batteries. Electrochim. Acta 2014, 136, 10–18. [Google Scholar] [CrossRef]
  10. Rahman, M.M.; Glushenkov, A.M.; Chen, Z.; Dai, X.J.; Ramireddy, T.; Chen, Y. Clusters of a-LiFeO2 nanoparticles incorporated into multi-walled carbon nanotubes: A lithium-ion battery cathode with enhanced lithium storage properties. Phys. Chem. Chem. Phys. 2013, 15, 20371–20378. [Google Scholar] [CrossRef] [PubMed]
  11. Zhao, S.; Zhang, M.M.; Wang, Z.H.; Xian, X.C. Enhanced high-rate performance of Li4Ti5O12 microspheres/multiwalled carbon nanotubes composites prepared by electrostatic self-assembly. Electrochim. Acta 2018, 276, 73–80. [Google Scholar] [CrossRef]
  12. Morales, J.; Santos-Pena, J. Highly electroactive nanosized a-LiFeO2. Electrochem. Commun. 2007, 9, 2116–2120. [Google Scholar] [CrossRef]
  13. Hirayama, M.; Tomita, H.; Kubota, K.; Kanno, R. Synthesis and electrochemical properties of nanosized LiFeO2 particles with a layered rock salt structure for lithium batteries. Mater. Res. Bull. 2012, 47, 79–84. [Google Scholar] [CrossRef]
  14. Wang, Y.R.; Wang, J.; Liao, H.T.; Qian, X.F.; Wang, M. Facile synthesis of electrochemically active α-LiFeO2 nanoparticles in absolute ethanol at ambient temperature. RSC Adv. 2014, 4, 3753–3757. [Google Scholar]
  15. Liu, H.; Ji, P.; Han, X. Rheological phase synthesis of nanosized a-LiFeO2 with higher crystallinity degree for cathode material of lithium-ion batteries. Mater. Chem. Phys. 2016, 183, 152–157. [Google Scholar] [CrossRef]
  16. Ma, Y.M.; Zhu, Y.C.; Yu, Y.; Mei, T.; Xing, Z.; Zhang, X.; Qian, Y.T. Low Temperature Synthesis of α-LiFeO2 Nanoparticles and its behavior as cathode materials for Li-ion batteries. Int. J. Electrochem. Sci. 2012, 7, 4657–4662. [Google Scholar]
  17. Kim, J.; Manthiram, A. Synthesis and Lithium Intercalation Properties of Nanocrystalline Lithium Iron Oxides. J. Electrochem. Soc. 1999, 146, 4371–4374. [Google Scholar] [CrossRef]
  18. Lee, Y.S.; Yoon, C.S.; Sun, Y.K.; Kobayakawa, K. Synthesis of nano-crystalline LiFeO2 material with advanced battery performance. Electrochem. Commun. 2002, 4, 727–731. [Google Scholar] [CrossRef]
  19. Shirane, T.; Kanno, R.; Kawamoto, Y.; Takeda, Y.; Takano, M. Structure and physical properties of lithium iron oxide, LiFeO2, synthesized by ionic exchange reaction. Solid State Ion. 1995, 79, 227–233. [Google Scholar] [CrossRef]
  20. Cook, W.; Manley, M. Raman characterization of α- and β-LiFe5O8 prepared through a solid-state reaction pathway. J. Solid State Chem. 2010, 183, 322–326. [Google Scholar] [CrossRef]
  21. El-Shaarawy, M.G.; Maklad, M.H.; Rashad, M.M. Structural, AC conductivity, dielectric behavior and magnetic properties of Mg-substituted LiFe5O8 powders synthesized by sol–gel auto-combustion method. J. Mater. Sci. Mater. Electron. 2015, 26, 6040–6050. [Google Scholar] [CrossRef]
  22. Rahman, M.M.; Wang, J.Z.; Hassan, M.F.; Chou, S.; Chen, Z.; Liu, H.K. Nanocrystalline porous a-LiFeO2–C composite—An environmentally friendly cathode for the lithium-ion battery. Energy Environ. Sci. 2011, 4, 952–957. [Google Scholar] [CrossRef]
  23. Zhang, Z.; Liu, X.Q.; Wang, L.P.; Wu, Y.; Zhao, H.Y. Synthesis of Li2FeSiO4/C nanocomposite via a hydrothermal-assisted sol–gel process. Solid State Ion. 2015, 276, 33–39. [Google Scholar] [CrossRef]
  24. Wang, X.; Gao, L.S.; Zhou, F.; Zhang, Z.D.; Jia, M.R.; Tang, C.M.; Shen, T.; Zheng, H.G. Large-scale synthesis of a-LiFeO2 nanorods by low-temperature molten salt synthesis (MSS) method. J. Cryst. Growth 2004, 265, 220–223. [Google Scholar] [CrossRef]
  25. Zhao, H.Y.; Liu, S.S.; Wang, Z.W.; Cai, Y.; Tan, M.; Liu, X.Q. LiSixMn2-xO4 (x ≤ 0.10) cathode materials with improved electrochemical properties prepared via a simple solid-state method for high-performance lithium-ion batteries. Ceram. Int. 2016, 42, 13442–13448. [Google Scholar] [CrossRef]
  26. Loukya, B.; Negi, D.S.; Sahu, R.; Pachauri, N.; Datta, A.; Gupta, R. Structural characterization of epitaxial LiFe5O8 thin films grown by chemical vapor deposition. J. Alloys Compd. 2016, 668, 187–193. [Google Scholar] [CrossRef]
  27. Wu, S.H.; Liu, H.Y. Preparation of α-LiFeO2-based cathode materials by an ionic exchange method. J. Power Sources 2007, 174, 789–794. [Google Scholar] [CrossRef]
  28. Lee, Y.S.; Satob, S.; Sun, Y.K.; Kobayakawab, K.; Satob, Y. A new type of orthorhombic LiFeO2 with advanced battery performance and its structural change during cycling. J. Power Sources 2003, 119–121, 285–289. [Google Scholar] [CrossRef]
  29. Armstrong, A.R.; Tee, D.W.; Mantia, F.L. Synthesis of tetrahedral LiFeO2 and its behavior as a cathode in rechargeable lithium batteries. J. Am. Chem. Soc. 2008, 130, 3554–3559. [Google Scholar] [CrossRef] [PubMed]
  30. Hirayama, M.; Tomita, H.; Kubota, K.; Kanno, R. Structure and electrode reactions of layered rock salt LiFeO2 nanoparticles for lithium battery cathode. J. Power Sources 2011, 196, 6809–6814. [Google Scholar] [CrossRef]
  31. Catti, M.; Montero, C.M. First-principles modelling of lithium iron oxides as battery cathode materials. J. Power Sources 2011, 196, 3955–3961. [Google Scholar] [CrossRef]
  32. Moralesa, J.; Santos-Pe, J.; Trocolia, R.; Frangerb, S. Insights into the electrochemical activity of nanosized α-LiFeO2. Electrochim. Acta 2008, 53, 6366–6371. [Google Scholar] [CrossRef]
  33. Rahmana, M.M.; Wang, J.Z.; Chen, Z.X.; Liu, H.K. Synthesis of carbon coated nanocrystalline porous α-LiFeO2 composite and its application as anode for the lithium ion battery. J. Alloys Compd. 2011, 509, 5408–5413. [Google Scholar] [CrossRef]
  34. Zhang, Z.; Wang, J.Z.; Chou, S.L.; Liu, H.K.; Ozawa, K.; Li, H. Polypyrrole-coated α-LiFeO2 nanocomposite with enhanced electrochemical properties for lithium-ion batteries. Electrochim. Acta 2013, 108, 820–826. [Google Scholar] [CrossRef]
  35. Abdel-Ghany, A.E.; Mauger, A.; Groult, H.; Zaghib, K.; Julien, C.M. Structural properties and electrochemistry of a-LiFeO2. J. Power Sources 2012, 197, 285–291. [Google Scholar] [CrossRef]
  36. Ju, B.W.; Wang, X.Y.; Wu, C.; Yang, X.K.; Shu, H.B.; Bai, Y.S.; Wen, W.C.; Yi, X. Electrochemical performance of the graphene/Y2O3/LiMn2O4 hybrid as cathode for lithium-ion battery. J. Alloys Compd. 2014, 584, 454–460. [Google Scholar] [CrossRef]
  37. Wu, H.; Li, H.; Sun, G.; Ma, S.L.; Yang, X.J. Synthesis, characterization and electromagnetic performance of nanocomposites of grapheme with a-LiFeO2 and b-LiFe5O8. J. Mater. Chem. C 2015, 3, 5457–5466. [Google Scholar] [CrossRef]
  38. Buyukyazi, M.; Mathurn, S. 3D nanoarchitectures of α-LiFeO2 and α-LiFeO2/C nanofibers for high power lithium-ion batteries. Nano Energy 2015, 13, 28–35. [Google Scholar] [CrossRef]
  39. Tu, J.; Wu, K.; Tang, H.; Zhou, H.H.; Jiao, S.Q. Mg–Ti co-doping behavior of porous LiFePO4 microspheres for high-rate lithium-ion batteries. J. Mater. Chem. A 2017, 5, 17021–17028. [Google Scholar] [CrossRef]
Scheme 1. Schematic illustration of the synthesis process for composite α-LiFeO2 nanoparticles.
Materials 11 01176 sch001
Figure 1. XRD patterns of the α-LiFeO2 samples obtained at various temperatures: (a) 100 °C; (b) 150 °C; (c) 250 °C; and (d) 350 °C.
Materials 11 01176 g001
Figure 2. SEM images of α-LiFeO2 nanoparticles synthesized at different temperatures: (a) 100 °C; (b) 150 °C; (c) 250 °C; and (d) 350 °C.
Materials 11 01176 g002
Figure 3. (a) Selected area electron diffraction pattern; and (b,c) TEM image and of the sample obtained at 150 °C.
Materials 11 01176 g003aMaterials 11 01176 g003b
Figure 4. N2 adsorption–desorption isotherms (BET) and pore-size (BJH) diagram for α-LiFeO2 nanoparticles synthesized at different temperatures: (a) 100 °C; (b) 150 °C; (c) 250 °C; and (d) 350 °C.
Materials 11 01176 g004
Figure 5. Cycling performance of the resulting LiFeO2 nanoparticles obtained at different temperature.
Materials 11 01176 g005
Figure 6. (a) Cycling performance; and (b) representative charge–discharge curves of the resulting α-LiFeO2 samples obtained at 150 °C.
Materials 11 01176 g006
Figure 7. XPS spectra for Fe 2p in α-LiFeO2-based electrodes: (a) at OCV; (b) after one charge process to 4.8 V; and (c) after one discharge process to 1.5 V.
Materials 11 01176 g007
Figure 8. Representative cyclic voltammogram curves of α-LiFeO2-based electrodes.
Materials 11 01176 g008
Figure 9. EIS of all electrodes.
Materials 11 01176 g009
Figure 10. The relationship between Z and ω−1/2 in the low frequency range.
Materials 11 01176 g010
Table 1. The specific surface area and pore volume of samples.
SampleSBET/m2·g−1Pore Diameter/nm
100 °C82.118.46
150 °C194.483.27
250 °C159.303.61
350 °C103.428.28
Table 2. Fitting values of the electrochemical impedance.
SampleRct/Ωσ/SDLi+/cm2·S−1
100 °C152.8152.832.98 × 10−13
150 °C94.47.291.3 × 10−10
250 °C94.599.288.08 × 10−11
350 °C121.719.559.11 × 10−12

