Article

Investigation of Three-Dimensional Microstructure of Tricalcium Silicate (C3S) by Electron Microscopy

1
School of Materials Science and Engineering, Tongji University, Shanghai 201804, China
2
Key Laboratory of Advanced Civil Engineering Materials (Tongji University), Ministry of Education, Shanghai 201804, China
3
London Centre for Nanotechnology, University College London, London WC1H 0AH, UK
4
Division of Condensed Matter Physics and Materials Science, Brookhaven National Laboratory, Upton, NY 11973, USA
*
Authors to whom correspondence should be addressed.
Materials 2018, 11(7), 1110; https://doi.org/10.3390/ma11071110
Submission received: 25 May 2018 / Revised: 18 June 2018 / Accepted: 27 June 2018 / Published: 29 June 2018

Abstract

:
A serial block-face scanning electron microscopy (SBFSEM) system, composed of a scanning electron microscope (SEM) and an ultra-microtome installed within the SEM vacuum chamber, has been used to characterize the three-dimensional (3D) microstructure of tricalcium silicate (C3S) grains embedded in epoxy resin. A selection of C3S grains were segmented and rendered with 3D-image processing software, which allowed the C3S grains to be clearly visualized and enabled statistically quantitative analysis. The results show that about 5% of the C3S grains have volumes larger than 1 μm3 and the average volume of the grains is 25 μm3. Pores can also be clearly seen in the biggest C3S grain, the volume of which is 3.6 × 104 μm3, and the mean volume and total volume of all the pores within this grain are 4.8 μm3 and 3.0 × 103 μm3, respectively. The reported work provides a new approach for the characterization of the 3D spatial structure of raw C3S materials, and the resulting 3D structure of the raw C3S is important for further systematic research on the relationships between the spatial microstructure and the hydration kinetics of C3S and other cement minerals.

1. Introduction

As it is well known, tricalcium silicate (3CaO·SiO2, or simplified as C3S) is the main component of ordinary Portland cement, and it plays an important role in building the strength of the cement paste during its hydration [1,2]. What is more, the C3S mineral phase controls the normal setting rate and the early-stage strength development of Portland cement paste, mortar and concrete [3]. The hydration process of cement is influenced by various factors and is very complicated. Nevertheless, the morphology of C3S grains within the materials has a direct effect on the hydration capacity of cement, the amount of required cement in the cement-based materials, as well as the eventual properties and performance of the cement paste and concrete. For these reasons, researchers often treat the monophase C3S mineral as a simplified cement for study [4,5,6,7], and so the properties and hydration behavior of C3S have been extensively investigated [8,9,10,11]. Up to now, the two-dimensional microstructure of cement particles has been extensively studied to correlate their morphologies with their properties [12,13,14,15,16,17,18,19,20]. However, the reported work extends such study to three dimensions, where the capabilities to monitor the grain porosity and volume-related properties have significantly improved. The properties of C3S or cement paste are heavily influenced by the morphology and size distribution of the (raw) particles within them [21]. As Xi [22] pointed out, pore structure is a vital component of the microstructure of cement-based materials, which directly affects the macroscopic properties such as the strength, durability, elastic modulus, corrosion resistance, shrinkage, and permeability of the concrete.
In this work, the three-dimensional (3D) structure of the raw C3S grains, including the pore structure within the grains, was observed using serial block-face scanning electron microscopy (SBFSEM) [23,24,25], which can reveal the 3D microstructure of the measured objects with a spatial resolution of up to 2–3 nm in the XY planes (imaging planes) and of about 15 nm along the Z-axis (slicing direction). SBFSEM has been proven to be a very powerful tool for the investigation of the internal structure of biological specimens, with a considerable amount of literature having been reported [26,27,28,29]. This is because both the sample preparation and imaging methods are well-matched with soft-condensed matters and materials, for which the SBFSEM was initially developed. Meanwhile, the investigation of hard-condensed materials using SBFSEM is in progress [30,31]. However, there is still no report on studying the cement components such as C3S, tricalcium aluminate(C3A), dicalcium silicate(C2S) or cement-based materials by SBFSEM.
In the reported work, SBFSEM, a 3D-structure investigation technique normally used for biological materials, was extended further to be applied to cement-based materials that are represented by the C3S grains here. This work demonstrates a new approach for studying the monocrystalline component of cement and the results can be used in future studies on the mechanism of C3S hydration.

2. Materials and Methods

The SBFSEM system (Figure 1) mainly consisted of a scanning electron microscope (SEM, Zeiss Sigma 300 VP, Carl Zeiss Microscopy GmbH, Oberkochen, Germany), an ultra-microtome with a diamond knife (Gatan 3View2XP, Gatan UK, Abingdon, UK) installed within the vacuum chamber of the microscope (see Figure 1b), and the controlling hardware and software to manage the serial sectioning and imaging processes. For the measurements, the well-shaped, pre-prepared sample was firstly inserted into the SBFSEM sample holder in the ultra-microtome system, and then a manual approach procedure was carried out under the observation of an optical microscope to move the sample surface up to until it could be just cut by the diamond knife. The SEM chamber was then closed and pumped down, the imaging parameters were set, and the automatic acquisition was started. Serial imaging of the samples was conducted by using a highly efficient backscattered electron (BSE) detector. Each time, once the region of interest on the freshly cut sample surface had been imaged, the sample was moved up by the nominal slice thickness (usually in the range of 15–100 nm) and then the diamond knife cut the entire surface of the sample block again. After the cutting, the area of interest was imaged on the freshly exposed surface again. These sectioning-and-imaging cycles run consecutively and can acquire a series of thousands of BSE micrography slices without user interaction, if desired. A schematic diagram of the workflow of acquiring serial image slices by using SBFSEM is shown in Figure 1c. The sequence of the sectioning and imaging was automated, and hence has the additional advantage that all the images were correctly aligned and almost free of distortion [32,33].
C3S was synthesized according to the procedures used by De la Torre et al. [34]. All the raw materials including CaCO3, Mg(OH)2.4MgCO3.5H2O, SiO2, and Al2O3 were from Sinopharm Chemical Reagent Co. Ltd., Shanghai, China. They were weighed according to the stoichiometric ratio of Ca2.92Mg0.06O3(SiO2)0.98(Al2O3)0.02. The raw materials with this ratio were then mixed and placed in a Pt crucible, then preheated in a furnace at 1000 °C for 6 h. Subsequently, the preheated materials were ground into granules in an agate mortar, poured into a metal grinder, and ground again. Then, they were pressed into a cylinder by a compressor, heated in a furnace at 1450 °C for 12 h, and then cooled. The obtained materials were crushed, grinded, pressed and heated again in the furnace at 1500 °C for another 6 h and then cooled. The above procedures were repeated until the content of C3S in the materials reached more than 98% (measured by powder X-ray diffraction).
The synthesized C3S was then ground into powder, embedded and fixed in an epoxy resin for SBFSEM measurements. A multiple component Agar 100 resin was selected to embed the C3S grains following the technical procedure offered by Agar Scientific Ltd. [35]. Subsequently, the top of the C3S embedded sample was trimmed to a pyramid shape using a Leica EM UC7 microtome (Leica Microsystems Inc., Buffalo, IL, USA) with a glass knife. The trimmed sample was then super-glued onto the top of a small rivet-shaped Al sample mount and placed and fixed into a removable sample holder with a diameter of 1 cm, which was then installed in the sample stage of the ultra-microtome system of SBFSEM. In order to reduce the charging effect from the sample, the side surface and the bottom of the sample were covered by conductive silver paint to connect the sample with the body of the Al sample mount to form an electrically conductive bridge between the sample stage and the sample surface.
The C3S embedded sample was then measured by SBFSEM, and the instrument was operated in high vacuum (<3 × 10⁻⁴ Pa) at an acceleration voltage of 1 kV with a beam current of 200 nA. The cutting speed of the diamond knife was set at 0.5 mm/s. The BSE detector collected signals with a dwell time of 2 µs on each pixel and generated BSE micrographs with a pixel size of 49 × 49 nm. In total, 200 slices of the sample, of 50-nm thickness with a field of view of 100 × 100 µm, were acquired after about 2 h of sequential measurement.

3. Results and Discussions

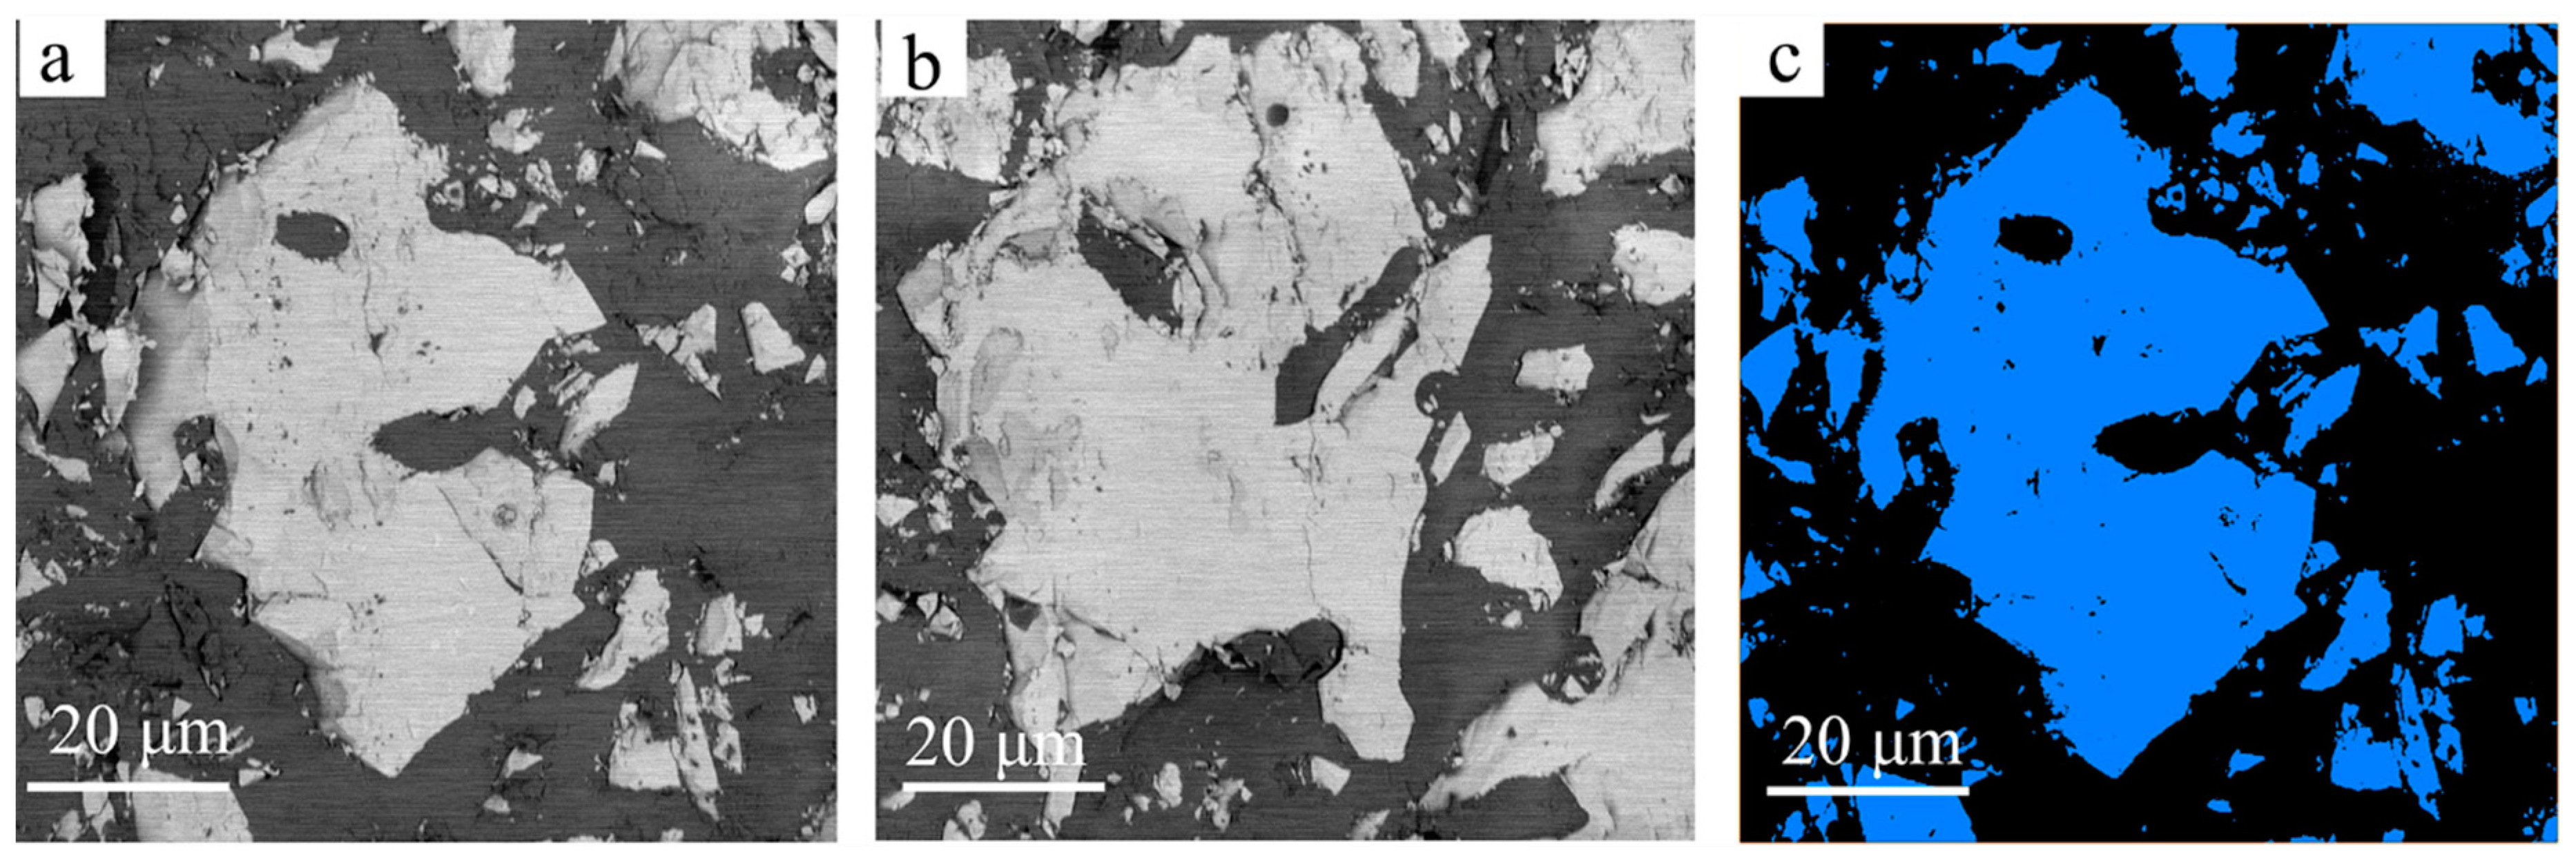
The first and last two-dimensional (2D) BSE micrography slices out of the series of 200 slices of the embedded C3S sample are shown as Figure 2a,b with an interval distance of 10 µm. Since the BSE signals scale with the atomic masses and electron densities within the sample, the brighter features within the BSE micrographs were identified as C3S grains, the darker regions among different brighter grains as epoxy resin, and the remaining darker regions within the grains as pores. The distribution of C3S grains and pores within them can be clearly seen in these images. The first step of analyzing the 3D image data is to binarize these micrography slices of the embedded C3S sample, and one of the resulting images is shown in Figure 2c, which is the first slice of the stack of slice images as shown in Figure 2a. For the binary image (Figure 2c), the blue parts represent C3S grains obtained through noise reduction and threshold segmentation by Avizo. It is an advanced 3D-image analysis software that provides optimized workflows for image processing and materials property simulations.
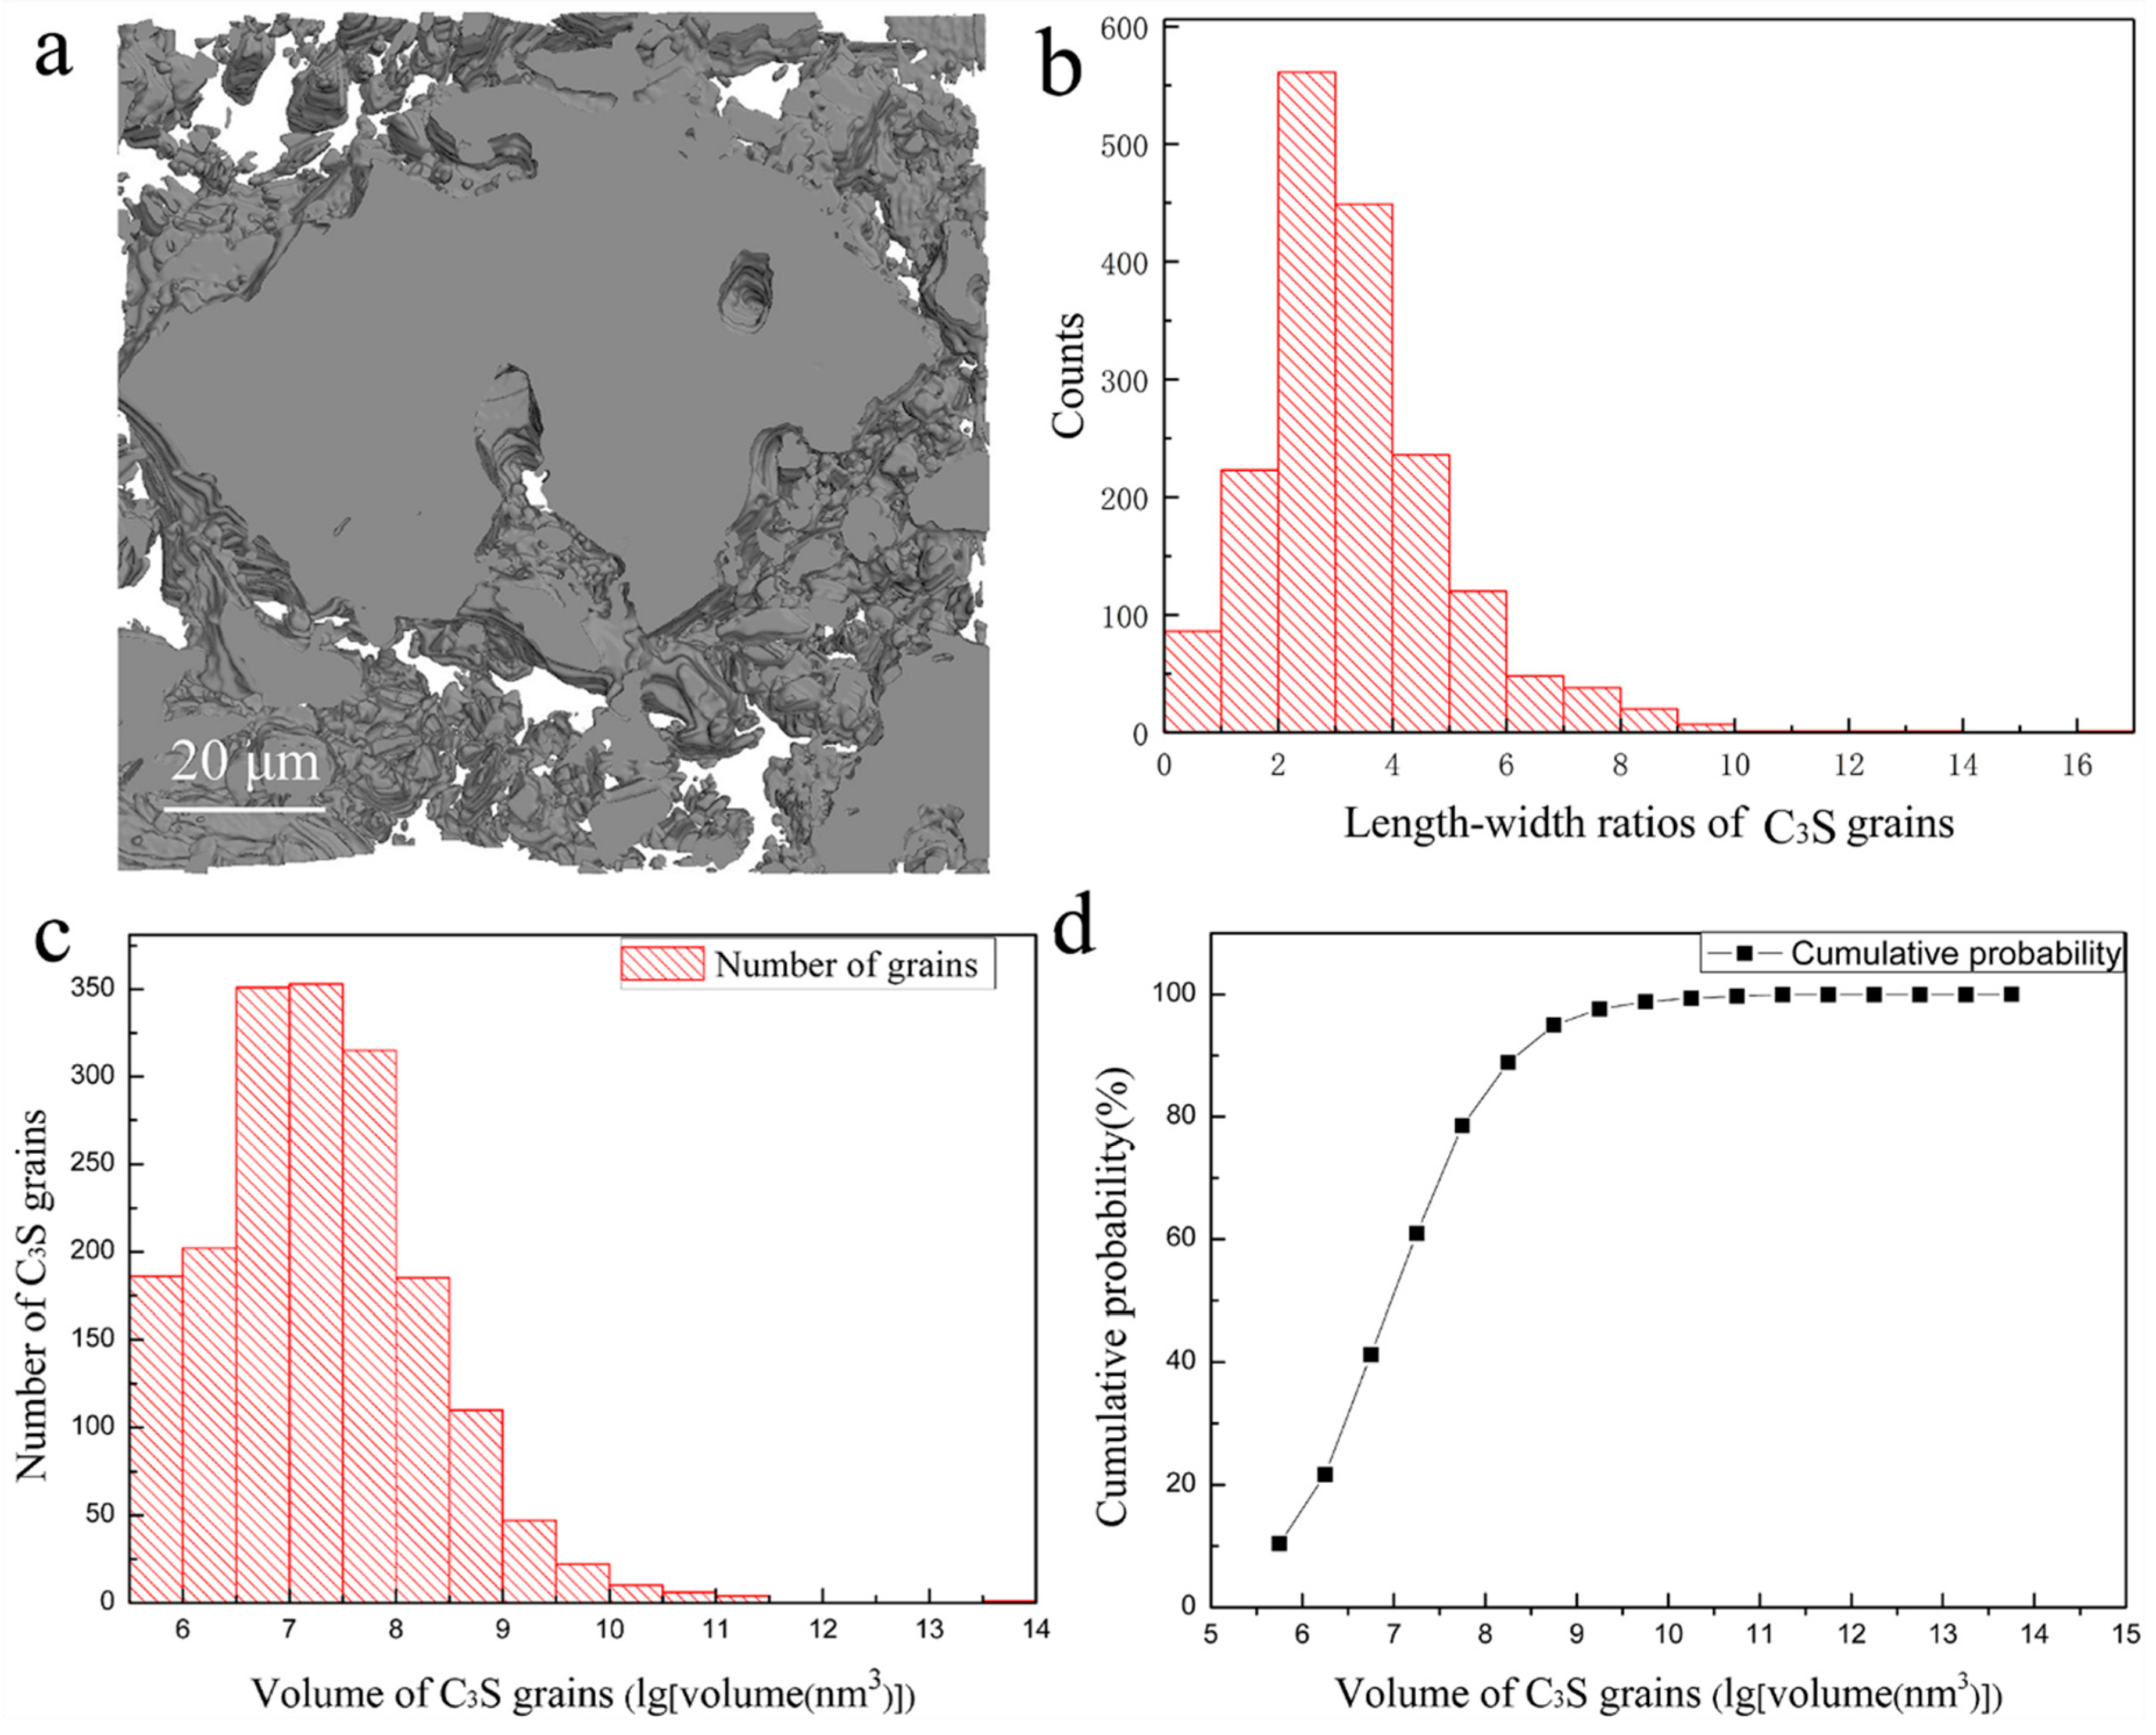
The obtained serial slice images were then stacked together by Avizo to generate the 3D image for quantitative analysis. Noise reduction, image registration, gray-scale based segmentation, volume fraction quantification and 3D rendering of the structure were performed by Avizo [36], and Figure 3a shows the 3D image obtained according to the above procedure, in which the gray parts are C3S grains. It clearly reveals the spatial distribution of the C3S grains fixed within the epoxy resin and the pores within the grains. From Figure 2 and Figure 3a, it can be seen that the outer shape of the C3S grains is irregular and the grain sizes are not uniform. The length–width ratios (LWRs) of the C3S grains are presented in Figure 3b, which shows that most of the LWR values are between 3 and 5. This means that most of the particles are quasi-acicular shaped rather than spherical shaped. This would lead the actually required quantity of water, i.e., the water–cement ratio, to be higher than the theoretically required quantity for the full hydration. This can have a significant impact on the physical and hydration properties of the C3S grains themselves. The LWR is defined as the ratio of the maximum Feret diameters against its minimum ones [37]. All the data extracted from a total of 1792 grains are listed in Supplementary Spreadsheet S1. From the spreadsheet and Figure 3c,d, it is clear that the volumes of the C3S grains range from 4.8 × 10⁻⁴ μm3 to 3.6 × 104 μm3.These C3S grains have a relatively wide volume distribution, while about 95% of the grains are less than 1 μm3 big and the smallest volume that can be measured by SBFSEM is 4.8 × 10⁻⁴ μm3. Based on the segmentation of the 3D images, the statistical mean values of length, width, and volume of all the measured C3S grains are 1174 nm, 332 nm, and 25 μm3, respectively. The largest grain in the measured volume is 3.6 × 104 μm3, which is crossing the whole observed volume. This means that it is not fully visualized by the SBFSEM measurement, i.e., the real volume of this largest grain is actually larger than 3.6 × 104 μm3.
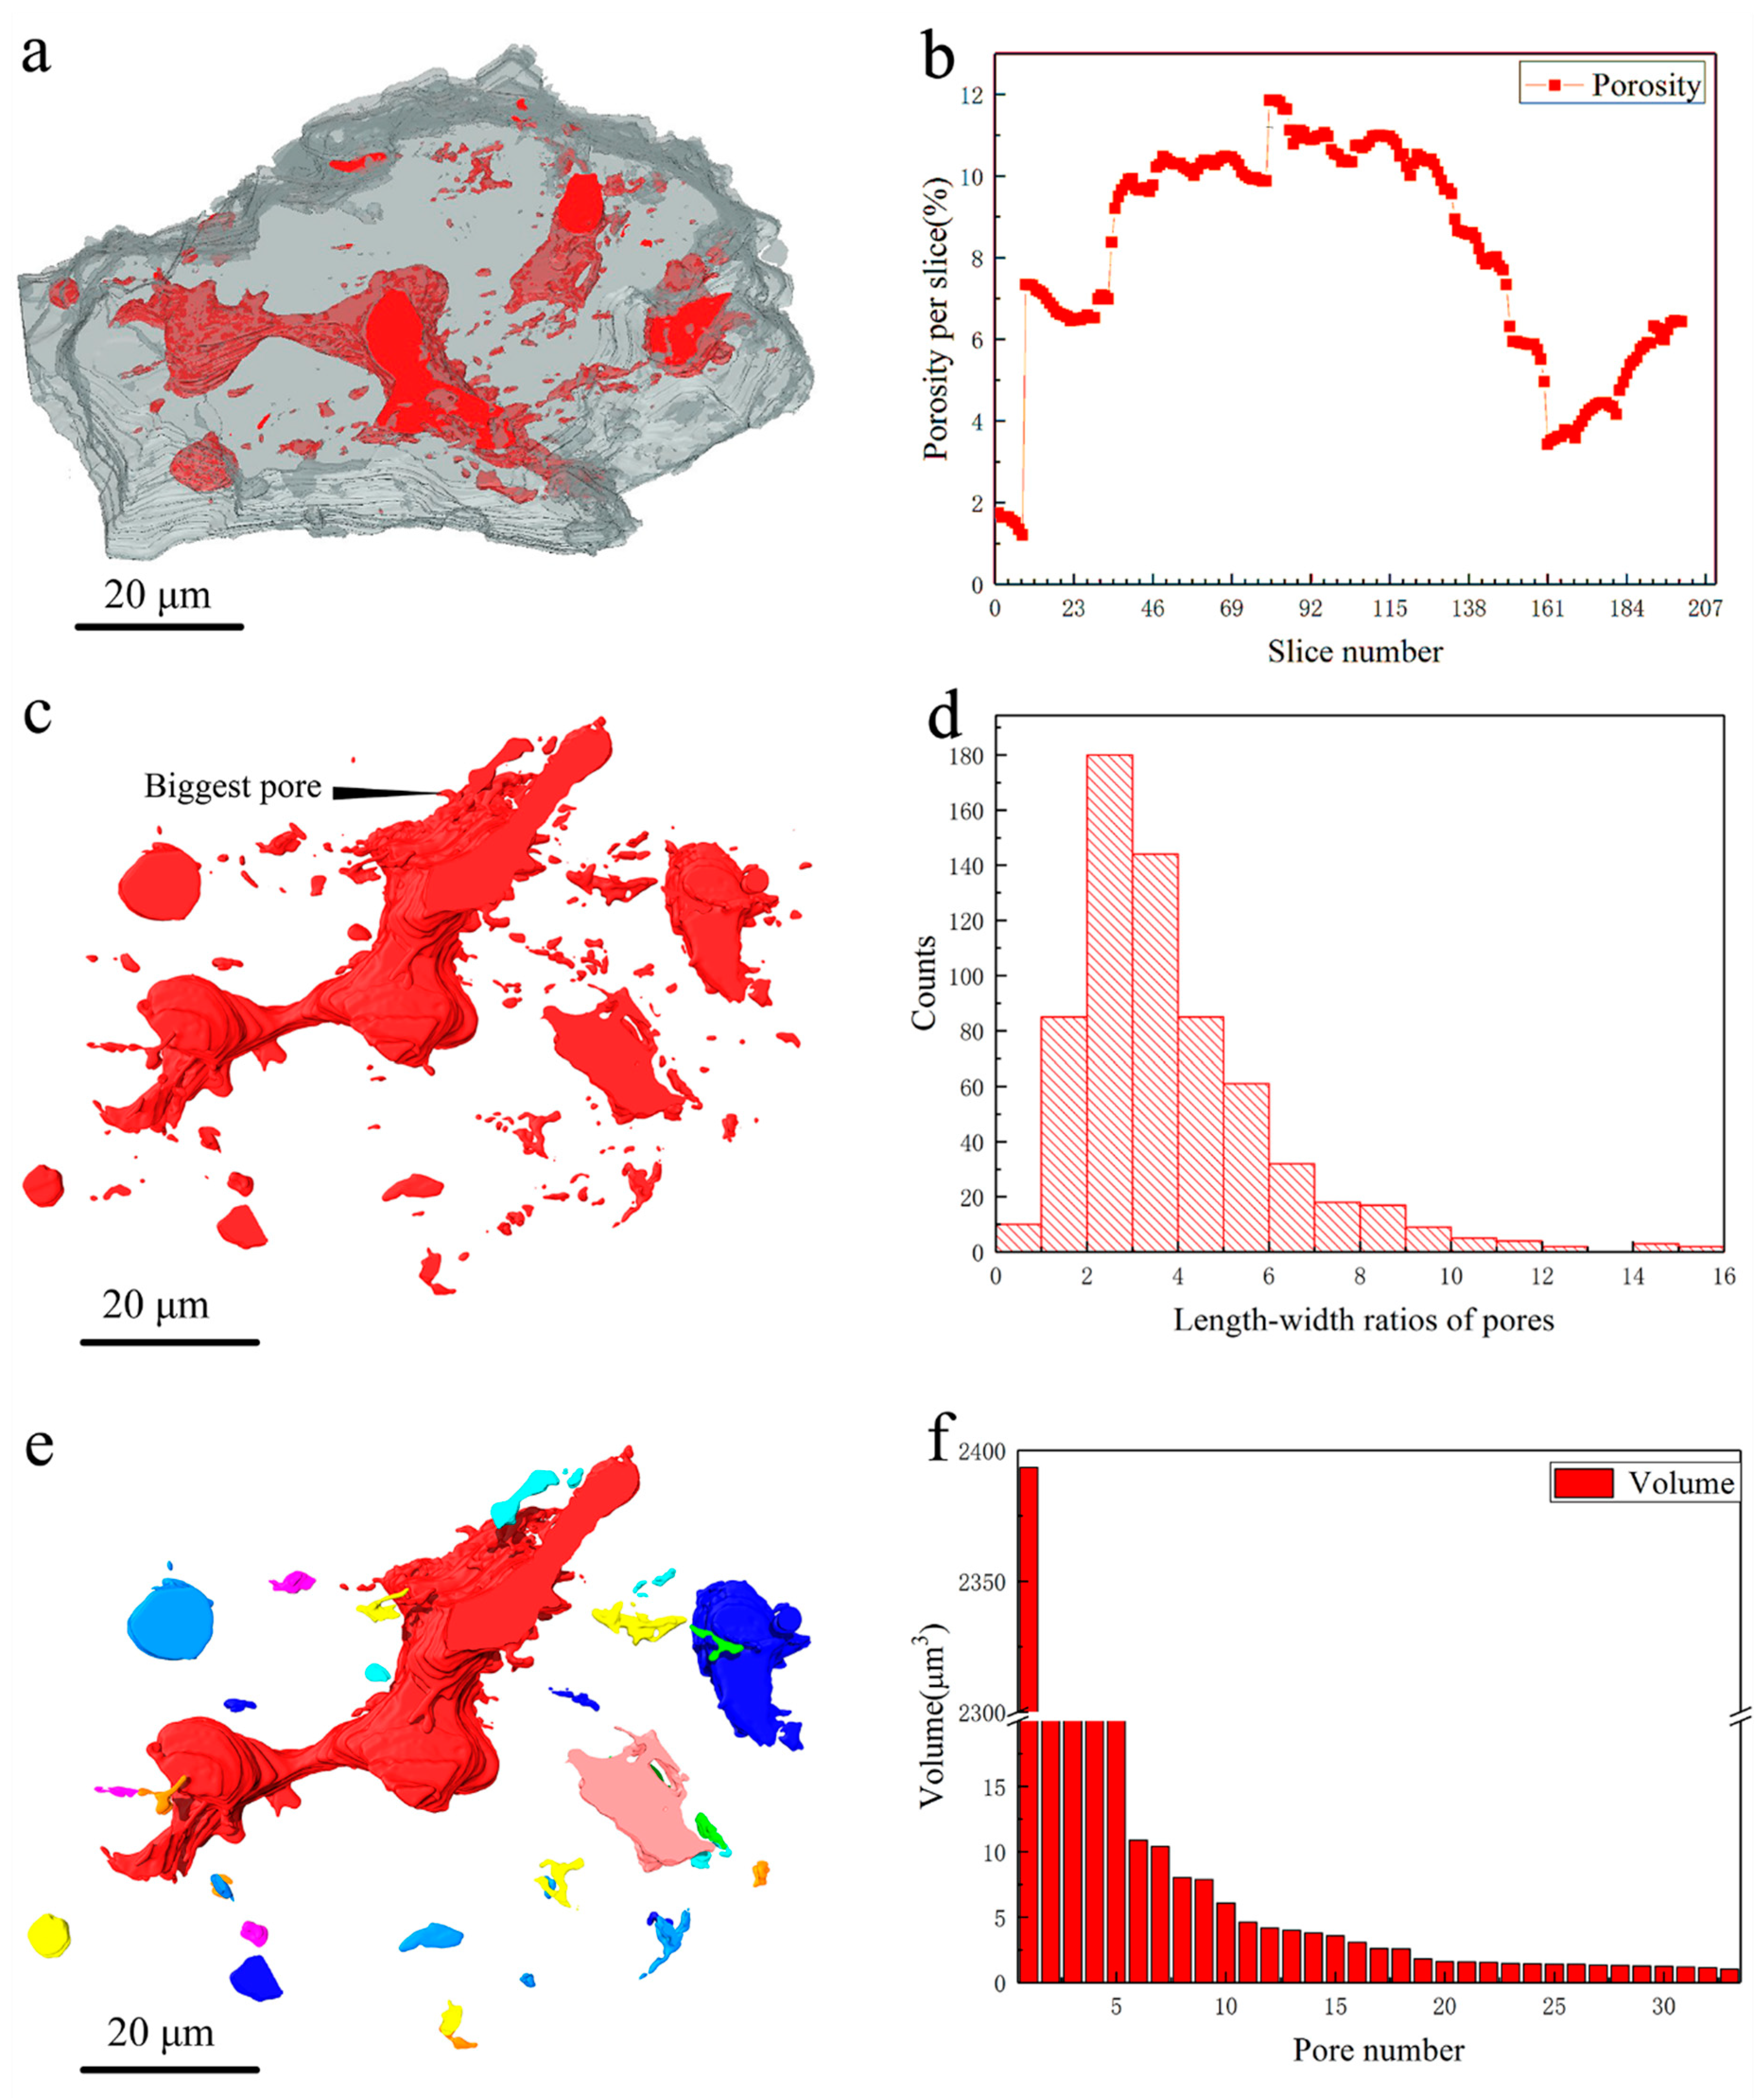
The largest C3S grain was located, segmented individually from the rest of the particles, and displayed in Figure 4a, in which the pores that were rendered in red can be easily seen. The 3D spatial distribution of the pores in this large C3S grain is also shown in Figure 4c. Both Figure 4a,c show that the sizes and shapes of the pores in the grain are quite different from each other. The biggest pore, with a volume of 2.4 × 103 μm3, as shown in the middle of Figure 4c, runs through the whole grain and has a high surface-area-to-volume ratio. This could play an important role in the hydration of C3S because it can increase the contact of C3S grains with water. As Figure 4b presents, the porosity per slice (defined as the area of pores within the grain against the whole area of the grain within the slice) within the single C3S grain varies significantly along the sectioning direction. It ranges between 1.2% and 11.9% (Figure 4b), and all the values are numerically presented in Supplementary Spreadsheet S2. Since the porosity represents morphometric parameters in the serial 2D slice images over the volume of the largest C3S grain, it can demonstrate the evolution of pores inside this C3S grain. For example, in slice 8, the porosity has a minimum value of 1.2%, and the porosity reaches 7.3% in slice 9, which indicates the appearance of new pore(s).
Compared with 2D slice data only, after segmentation and rendering of the acquired 3D structural image, the real shape, volumes/sizes, orientation, and connection of the pores within the largest C3S grain can be obtained through the data analysis. This gives the quantitative information on the material porosity. In turn, it can help to reveal one of the most important characteristics of the microstructure of hardened cement paste: pore structure. From Supplementary Spreadsheet S3, it can be known that the pores within the C3S grain have a relatively wide size distribution, with about 5% of them being larger than 1 μm3, and the mean length, width, and volume of all the pores are 1.3 µm, 0.3 µm, and 4.8 μm3, respectively. Based on the statistical result obtained from Supplementary Spreadsheet S3, the total volume of the pores in the grain is 3.1 × 103 μm3 and the porosity of the grain is about 8%. From Figure 4d, it can be seen that the LWRs of most of the pores are between 1 and 5. With further analysis of the porosity, the independent pores larger than 1 μm3 are displayed in Figure 4e in different colors, and about 85% of them have volumes between 1 μm3 and 10 μm3 (Figure 4f).

4. Conclusions

SBFSEM has been shown to be an effective method to investigate the 3D structure of hard condensed matters and materials such as raw C3S mineral particles. This method provides high resolution and enables nanoscale details of the C3S sample, as small as about 4.8 × 10⁻⁴ μm3 (likely 60 × 60 × 133 nm3), to be obtained.
In the epoxy-embedded C3S grain samples, the average volume of the C3S grains is 25 μm3 and more than 95% of the C3S grains are smaller than 1 μm3. This indicates that the sample is composed of large amounts of fine particles and relatively small amount of larger particles, which results in a large surface area of C3S and will be beneficial to its hydration process. The pore structure within the largest raw C3S grain is very rich: the mean volume of the pores is 4.8 μm3 and more than half of the pores have LWR values around 3. The largest pore is 2.4 × 103 μm3, which penetrates through the whole largest C3S grain. This quantitative information can also be used for further analysis of the relationship between the kinetics of C3S hydration process and their spatial nanostructure and microstructure, including the porous structure within the ingredient particles.
The results prove that SBFSEM could be used for investigation of the internal pore structure of the cement materials such as raw C3S grains, and it could be applied to study the nanoscale 3D spatial structure of hard condensed matters and materials in future.

Supplementary Materials

The following supplementary materials are available online at https://www.mdpi.com/1996-1944/11/7/1110/s1, Spreadsheet S1: Volumes, areas, lengths, widths, and length–width ratios of C3S grains; Spreadsheet S2: Areas of C3S and pores per slice image and the porosity per slice; Spreadsheet S3: Volumes, areas, lengths, widths, and length–width ratios of pores within the largest C3S grain.

Author Contributions

X.L., I.R. and B.C. conceived the project. Y.Z. (Yongjuan Zhao), X.L., Y.Z. (Yongming Zhang), and P.W. synthesized the C3S samples. F.Y. prepared the epoxy resin embedded C3S samples. F.Y. and X.L. carried out the SBFSEM experiment. F.Y. and B.C. analyzed the data. F.Y., I.R., and B.C. wrote the manuscript with contributions from all the other co-authors.

Funding

This research was funded by the Talent Program “Materials Nano-structure” with grants [152221] and [152243] at Tongji University. Part of the work at Tongji University was also supported by the National Natural Science Foundation of China grant [51102181]. B. Chen acknowledges the supports from “PuJiang Talent Program” under grant number [18PJ1410400]. Work performed at Brookhaven National Laboratory was supported by the US Department of Energy, Office of Basic Energy Sciences, under Contract Number [DE-SC00112704].

Acknowledgments

The SBFSEM measurements were carried out at the School of Materials Science and Engineering, Tongji University, China.

Conflicts of Interest

The authors declare no conflict of interest.

References

  1. Alizadeh, R.; Raki, L.; Makar, J.M.; Beaudoin, J.J.; Moudrakovski, I. Hydration of tricalcium silicate in the presence of synthetic calcium–silicate–hydrate. J. Mater. Chem. 2009, 19, 7937–7946. [Google Scholar] [CrossRef]
  2. Dunstetter, F.; de Noirfontaine, M.N.; Courtial, M. Polymorphism of tricalcium silicate, the major compound of portland cement clinker. Cem. Concr. Res. 2006, 36, 39–53. [Google Scholar] [CrossRef]
  3. Juenger, M.C.G.; Monteiro, P.J.M.; Gartner, E.M.; Denbeaux, G.P. A soft X-ray microscope investigation into the effects of calcium chloride on tricalcium silicate hydration. Cem. Concr. Res. 2005, 35, 19–25. [Google Scholar] [CrossRef]
  4. De La Torre, A.; Bruque, S.; Campo, J.; Aranda, M. The superstructure of C3S from synchrotron and neutron powder diffraction and its role in quantitative phase analyses. Cem. Concr. Res. 2002, 32, 1347–1356. [Google Scholar] [CrossRef]
  5. Bae, S.; Kanematsu, M.; Hernández-Cruz, D.; Moon, J.; Kilcoyne, D.; Monteiro, P.J.M. In situ soft X-ray spectromicroscopy of early tricalcium silicate hydration. Materials 2016, 9, 976. [Google Scholar] [CrossRef] [PubMed]
  6. Joseph, S.; Bishnoi, S.; Van Balen, K.; Cizer, Ö. Modeling the effect of fineness and filler in early-age hydration of tricalcium silicate. J. Am. Ceram. Soc. 2017, 100, 1178–1194. [Google Scholar] [CrossRef]
  7. Nicoleau, L.; Nonat, A. A new view on the kinetics of tricalcium silicate hydration. Cem. Concr. Res. 2016, 86, 1–11. [Google Scholar] [CrossRef]
  8. Bailey, J.E.; Stewart, H.R. C3S hydration products viewed using a cryo stage in sem. J. Mater. Sci. Lett. 1984, 3, 411–414. [Google Scholar] [CrossRef]
  9. Glasser, L.D.; Lachowski, E.E.; Mohan, K.; Taylor, H.F.W. A multi-method study of C3S hydration. Cem. Concr. Res. 1978, 8, 733–740. [Google Scholar] [CrossRef]
  10. Slegers, P.A.; Genet, M.; Leonard, A.J.; Fripiat, J.J. Structural transformation of triealeium silicate during hydration. J. Appl. Crystallogr. 1977, 10, 270–276. [Google Scholar] [CrossRef]
  11. Wu, Z.; Yong, J. The hydration of tricalcium silicate in the presence of colloidal silica. J. Mater. Sci. 1984, 19, 3477–3486. [Google Scholar] [CrossRef]
  12. Fic, S.; Szeląg, M. Analysis of the development of cluster cracks caused by elevated temperatures in cement paste. Constr. Build. Mater. 2015, 83, 223–229. [Google Scholar] [CrossRef]
  13. Li, L.; Wang, Q.; Zhang, G.; Shi, L.; Dong, J.; Jia, P. A method of detecting the cracks of concrete undergo high-temperature. Constr. Build. Mater. 2018, 162, 345–358. [Google Scholar] [CrossRef]
  14. Szelag, M. The Influence of Metakaolinite on the Development of Thermal Cracks in a Cement Matrix. Materials 2018, 11, 520. [Google Scholar] [CrossRef] [PubMed]
  15. Chen, Q.; Hills, C.D.; Yuan, M.; Liu, H.; Tyrer, M. Characterization of carbonated tricalcium silicate and its sorption capacity for heavy metals: A micron-scale composite adsorbent of active silicate gel and calcite. J. Hazard. Mater. 2008, 153, 775–783. [Google Scholar] [CrossRef] [PubMed]
  16. Han, S.; Yan, P.; Liu, R. Study on the hydration product of cement in early age using TEM. Sci. China Technol. Sci. 2012, 55, 2284–2290. [Google Scholar] [CrossRef]
  17. Kjellsen, K.O.; Justnes, H. Revisiting the microstructure of hydrated tricalcium silicate—A comparison to portland cement. Cem. Concr. Compos. 2004, 26, 947–956. [Google Scholar] [CrossRef]
  18. Kolovos, K.; Tsivilis, S.; Kakali, G. SEM examination of clinkers containing foreign elements. Cem. Concr. Compos. 2005, 27, 163–170. [Google Scholar] [CrossRef]
  19. Ylmén, R.; Jäglid, U.; Steenari, B.-M.; Panas, I. Early hydration and setting of portland cement monitored by IR, SEM and VICAT techniques. Cem. Concr. Res. 2009, 39, 433–439. [Google Scholar] [CrossRef]
  20. Zhang, L.; Cheng, X.; Hou, D.; Guo, S. Hydration for the alite mineral: Morphology evolution, reaction mechanism and the compositional influences. Constr. Build. Mater. 2017, 155, 413–426. [Google Scholar] [CrossRef]
  21. Hansen, T.C. Physical structure of hardened cement paste. A classical approach. Mater. Struct. 1986, 19, 423–436. [Google Scholar] [CrossRef]
  22. Xi, Y.; Siemer, D.D.; Scheetz, B.E. Strength development, hydration reaction and pore structure of autoclaved slag cement with added silica fume. Cem. Concr. Res. 1997, 26, 75–82. [Google Scholar] [CrossRef]
  23. Chen, B.; Guizar-Sicairos, M.; Xiong, G.; Shemilt, L.; Diaz, A.; Nutter, J.; Burdet, N.; Huo, S.; Mancuso, J.; Monteith, A.; et al. Three-dimensional structure analysis and percolation properties of a barrier marine coating. Sci. Rep. 2013, 3, 1177. [Google Scholar] [CrossRef] [PubMed]
  24. Denk, W.; Horstmann, H. Serial block-face scanning electron microscopy to reconstruct three-dimensional tissue nanostructure. PLoS Biol. 2004, 2, e329. [Google Scholar] [CrossRef] [PubMed] [Green Version]
  25. Pollreisz, A.; Messinger, J.D.; Sloan, K.R.; Mittermueller, T.J.; Weinhandl, A.S.; Benson, E.K.; Kidd, G.J.; Schmidt-Erfurth, U.; Curcio, C.A. Visualizing melanosomes, lipofuscin, and melanolipofuscin in human retinal pigment epithelium using serial block face scanning electron microscopy. Exp. Eye Res. 2018, 166, 131–139. [Google Scholar] [CrossRef] [PubMed]
  26. Briggman, K.L.; Helmstaedter, M.; Denk, W. Wiring specificity in the direction-selectivity circuit of the retina. Nature 2011, 471, 183–188. [Google Scholar] [CrossRef] [PubMed]
  27. Chen, B.; Yusuf, M.; Hashimoto, T.; Estandarte, A.K.; Thompson, G.; Robinson, I. Three-dimensional positioning and structure of chromosomes in a human prophase nucleus. Sci. Adv. 2017, 3, e1602231. [Google Scholar] [CrossRef] [PubMed]
  28. Jurrus, E.; Hardy, M.; Tasdizen, T.; Fletcher, P.T.; Koshevoy, P.; Chien, C.B.; Denk, W.; Whitaker, R. Axon tracking in serial block-face scanning electron microscopy. Med. Image Anal. 2009, 13, 180–188. [Google Scholar] [CrossRef] [PubMed] [Green Version]
  29. Mukherjee, K.; Clark, H.R.; Chavan, V.; Benson, E.K.; Kidd, G.J.; Srivastava, S. Analysis of brain mitochondria using serial block-face scanning electron microscopy. JoVE-J. Vis. Exp. 2016, e54214. [Google Scholar] [CrossRef] [PubMed]
  30. Chen, B.; Hashimoto, T.; Vergeer, F.; Burgess, A.; Thompson, G.; Robinson, I. Three-dimensional analysis of the spatial distribution of iron oxide particles in a decorative coating by electron microscopic imaging. Prog. Org. Coat. 2014, 77, 1069–1072. [Google Scholar] [CrossRef]
  31. Thompson, G.E.; Hashimoto, T.; Zhong, X.L.; Curioni, M.; Zhou, X.; Skeldon, P.; Withers, P.J.; Carr, J.A.; Monteith, A.G. Revealing the three dimensional internal structure of aluminium alloys. Surf. Interface Anal. 2013, 45, 1536–1542. [Google Scholar] [CrossRef]
  32. Miranda, K.; Girard-Dias, W.; Attias, M.; de Souza, W.; Ramos, I. Three dimensional reconstruction by electron microscopy in the life sciences: An introduction for cell and tissue biologists. Mol. Reprod. Dev. 2015, 82, 530–547. [Google Scholar] [CrossRef] [PubMed] [Green Version]
  33. Titze, B.; Genoud, C. Volume scanning electron microscopy for imaging biological ultrastructure. Biol. Cell 2016, 108, 307–323. [Google Scholar] [CrossRef] [PubMed]
  34. Torre, A.G.D.l.; Aranda, M.A.G. Accuracy in rietveld quantitative phase analysis of portland cements. J. Appl. Crystallogr. 2003, 36, 1169–1176. [Google Scholar] [CrossRef]
  35. Briggman, K.L.; Denk, W. Towards neural circuit reconstruction with volume electron microscopy techniques. Curr. Opin. Neurobiol. 2006, 16, 562–570. [Google Scholar] [CrossRef] [PubMed]
  36. Liu, Y.; King, H.; van Huis, M.; Drury, M.; Plümper, O. Nano-tomography of porous geological materials using focused ion beam-scanning electron microscopy. Minerals 2016, 6, 104. [Google Scholar] [CrossRef]
  37. Barbieri, D.; Yuan, H.; Ismailoglu, A.S.; de Bruijn, J.D. Comparison of two moldable calcium phosphate-based bone graft materials in a noninstrumented canine interspinous implantation model. Tissue Eng. Part A 2017, 23, 1310–1320. [Google Scholar] [CrossRef] [PubMed]
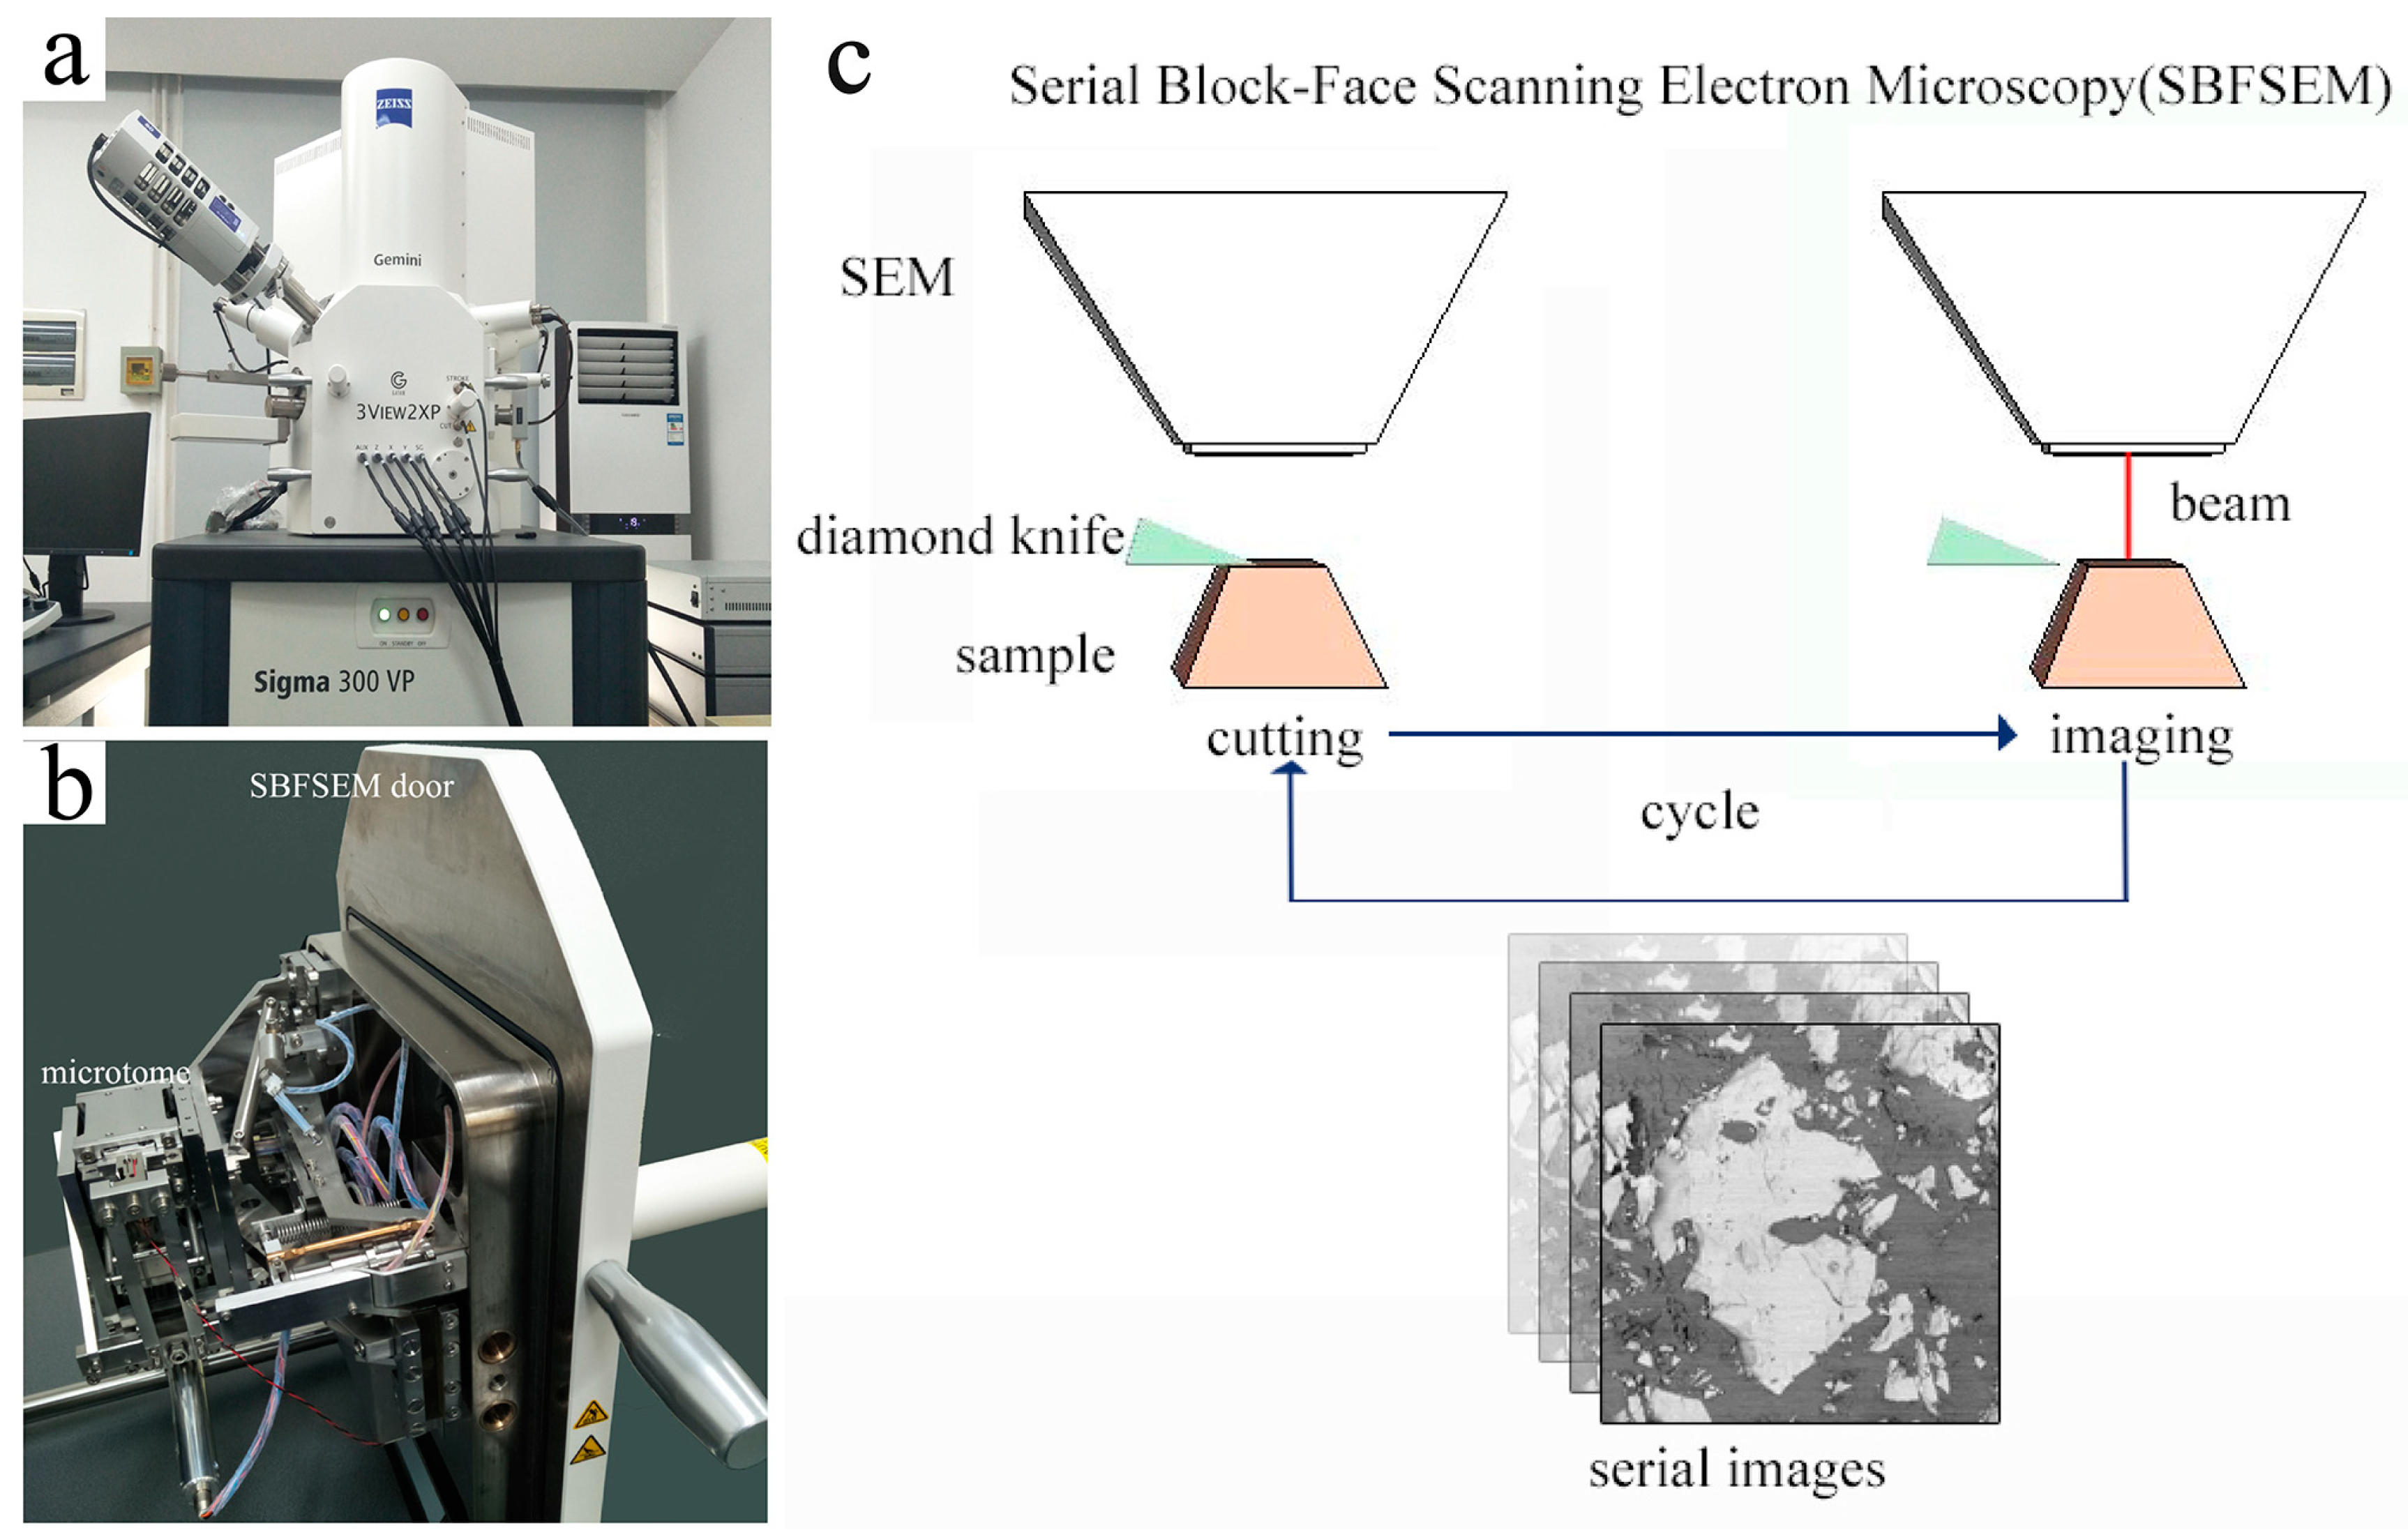
Figure 1. Serial block-face scanning electron microscopy (SBFSEM) system and its workflow: (a) The SBFSEM instrument; (b) Ultra-microtome attached to the inner side of the SEM vacuum chamber door; (c) Schematic diagram showing the workflow of acquiring serial image slices by using SBFSEM.
Materials 11 01110 g001
Figure 2. Two-dimensional images of the embedded tricalcium silicate (C3S) grains from SBFSEM: (a) The first backscattered electron (BSE) micrography slice of the C3S grains acquired by SBFSEM; (b) The last BSE micrography slice of the C3S grains; (c) Binary image of the first slice of the stack of slice images as shown in panel (a).
Materials 11 01110 g002
Figure 3. 3D rendering and characterization of the C3S grains: (a) 3D Rendering of the acquired volume containing C3S grains; (b) A histogram (with step of 1) of the length–width ratios of the measured C3S grains; (c) A histogram of the volume distribution (with 0.5 step in logarithm coordinate) of the C3S grains; (d) The curve of volumetric cumulative probability of the C3S grains.
Materials 11 01110 g003
Figure 4. Characterization of the biggest C3S grain and pores within it: (a) 3D rendering image of the biggest C3S grain and the pores within it (labeled in red); (b) A profile of porosity per slice; (c) 3D rendering image of the pores (within the biggest C3S grain) alone; (d) A histogram (with step of 1) of length–width ratios of pores; (e) Segmented pores, bigger than 1μm3, rendered in different colors; (f) Volume distribution of pores bigger than 1 μm3.
Materials 11 01110 g004