Improvement of Strength-Toughness-Hardness Balance in Large Cross-Section 718H Pre-Hardened Mold Steel

Abstract
1. Introduction
2. Experimental Procedures
2.1. Materials and Heat Treatment
2.2. Microstructure Observation
2.3. Mechanical Tests
3. Results
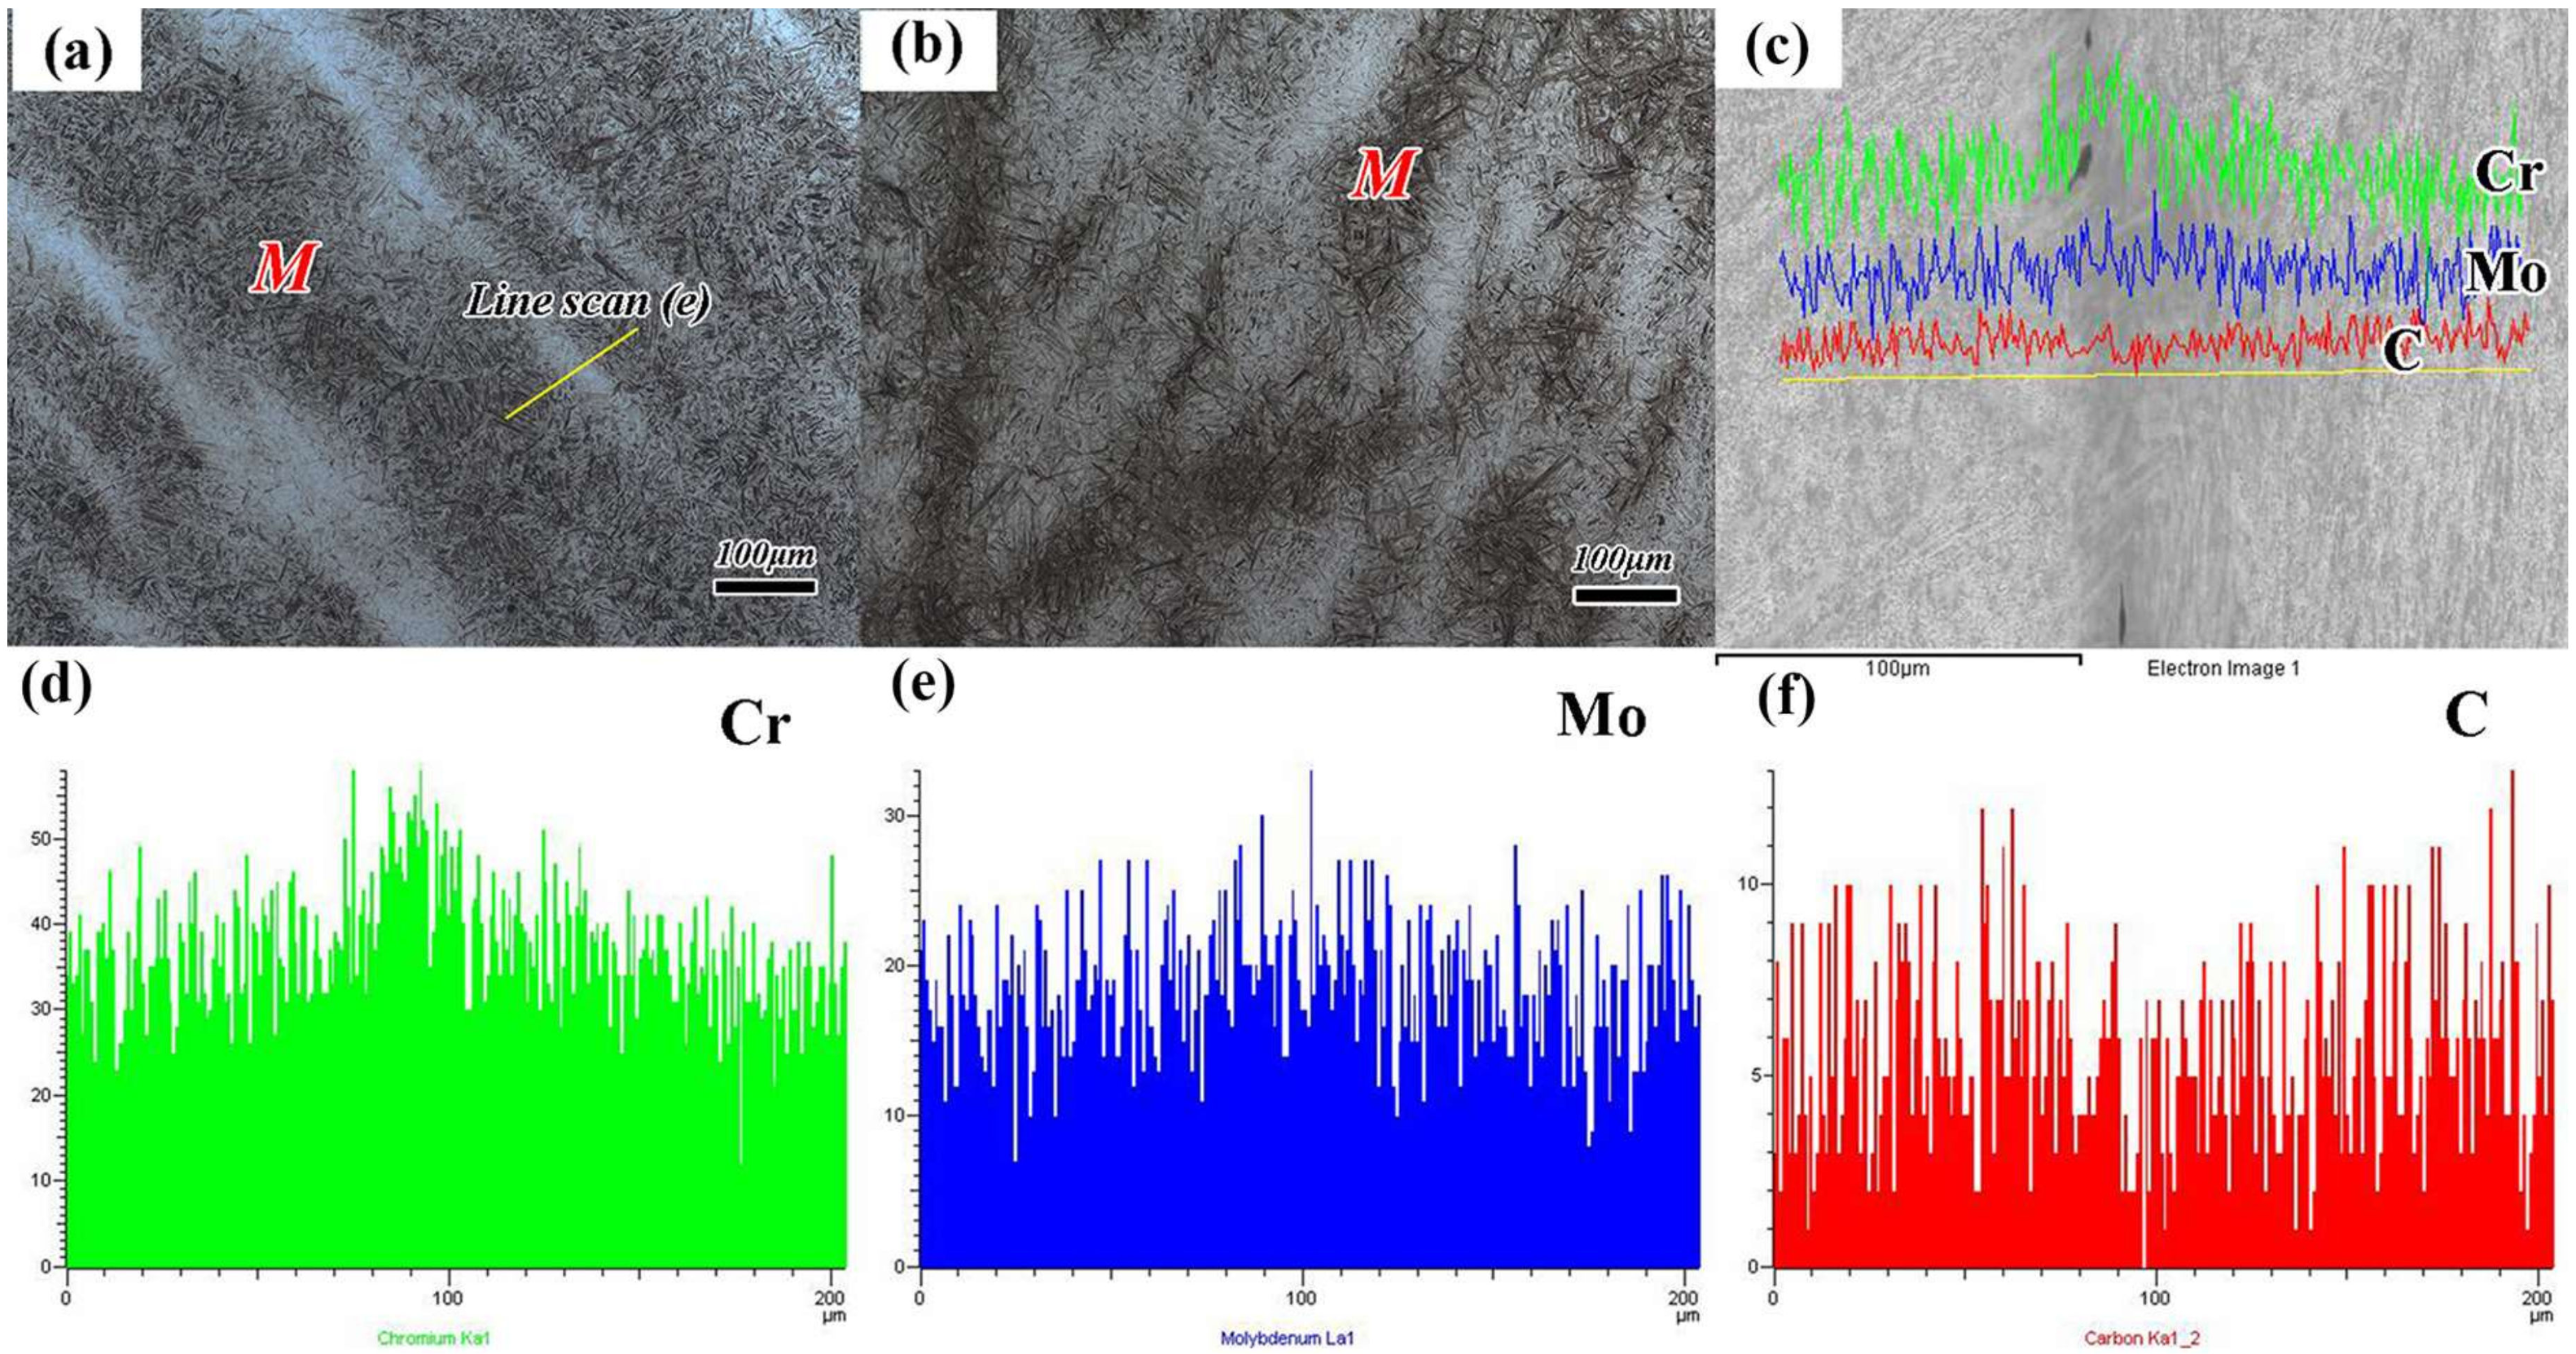
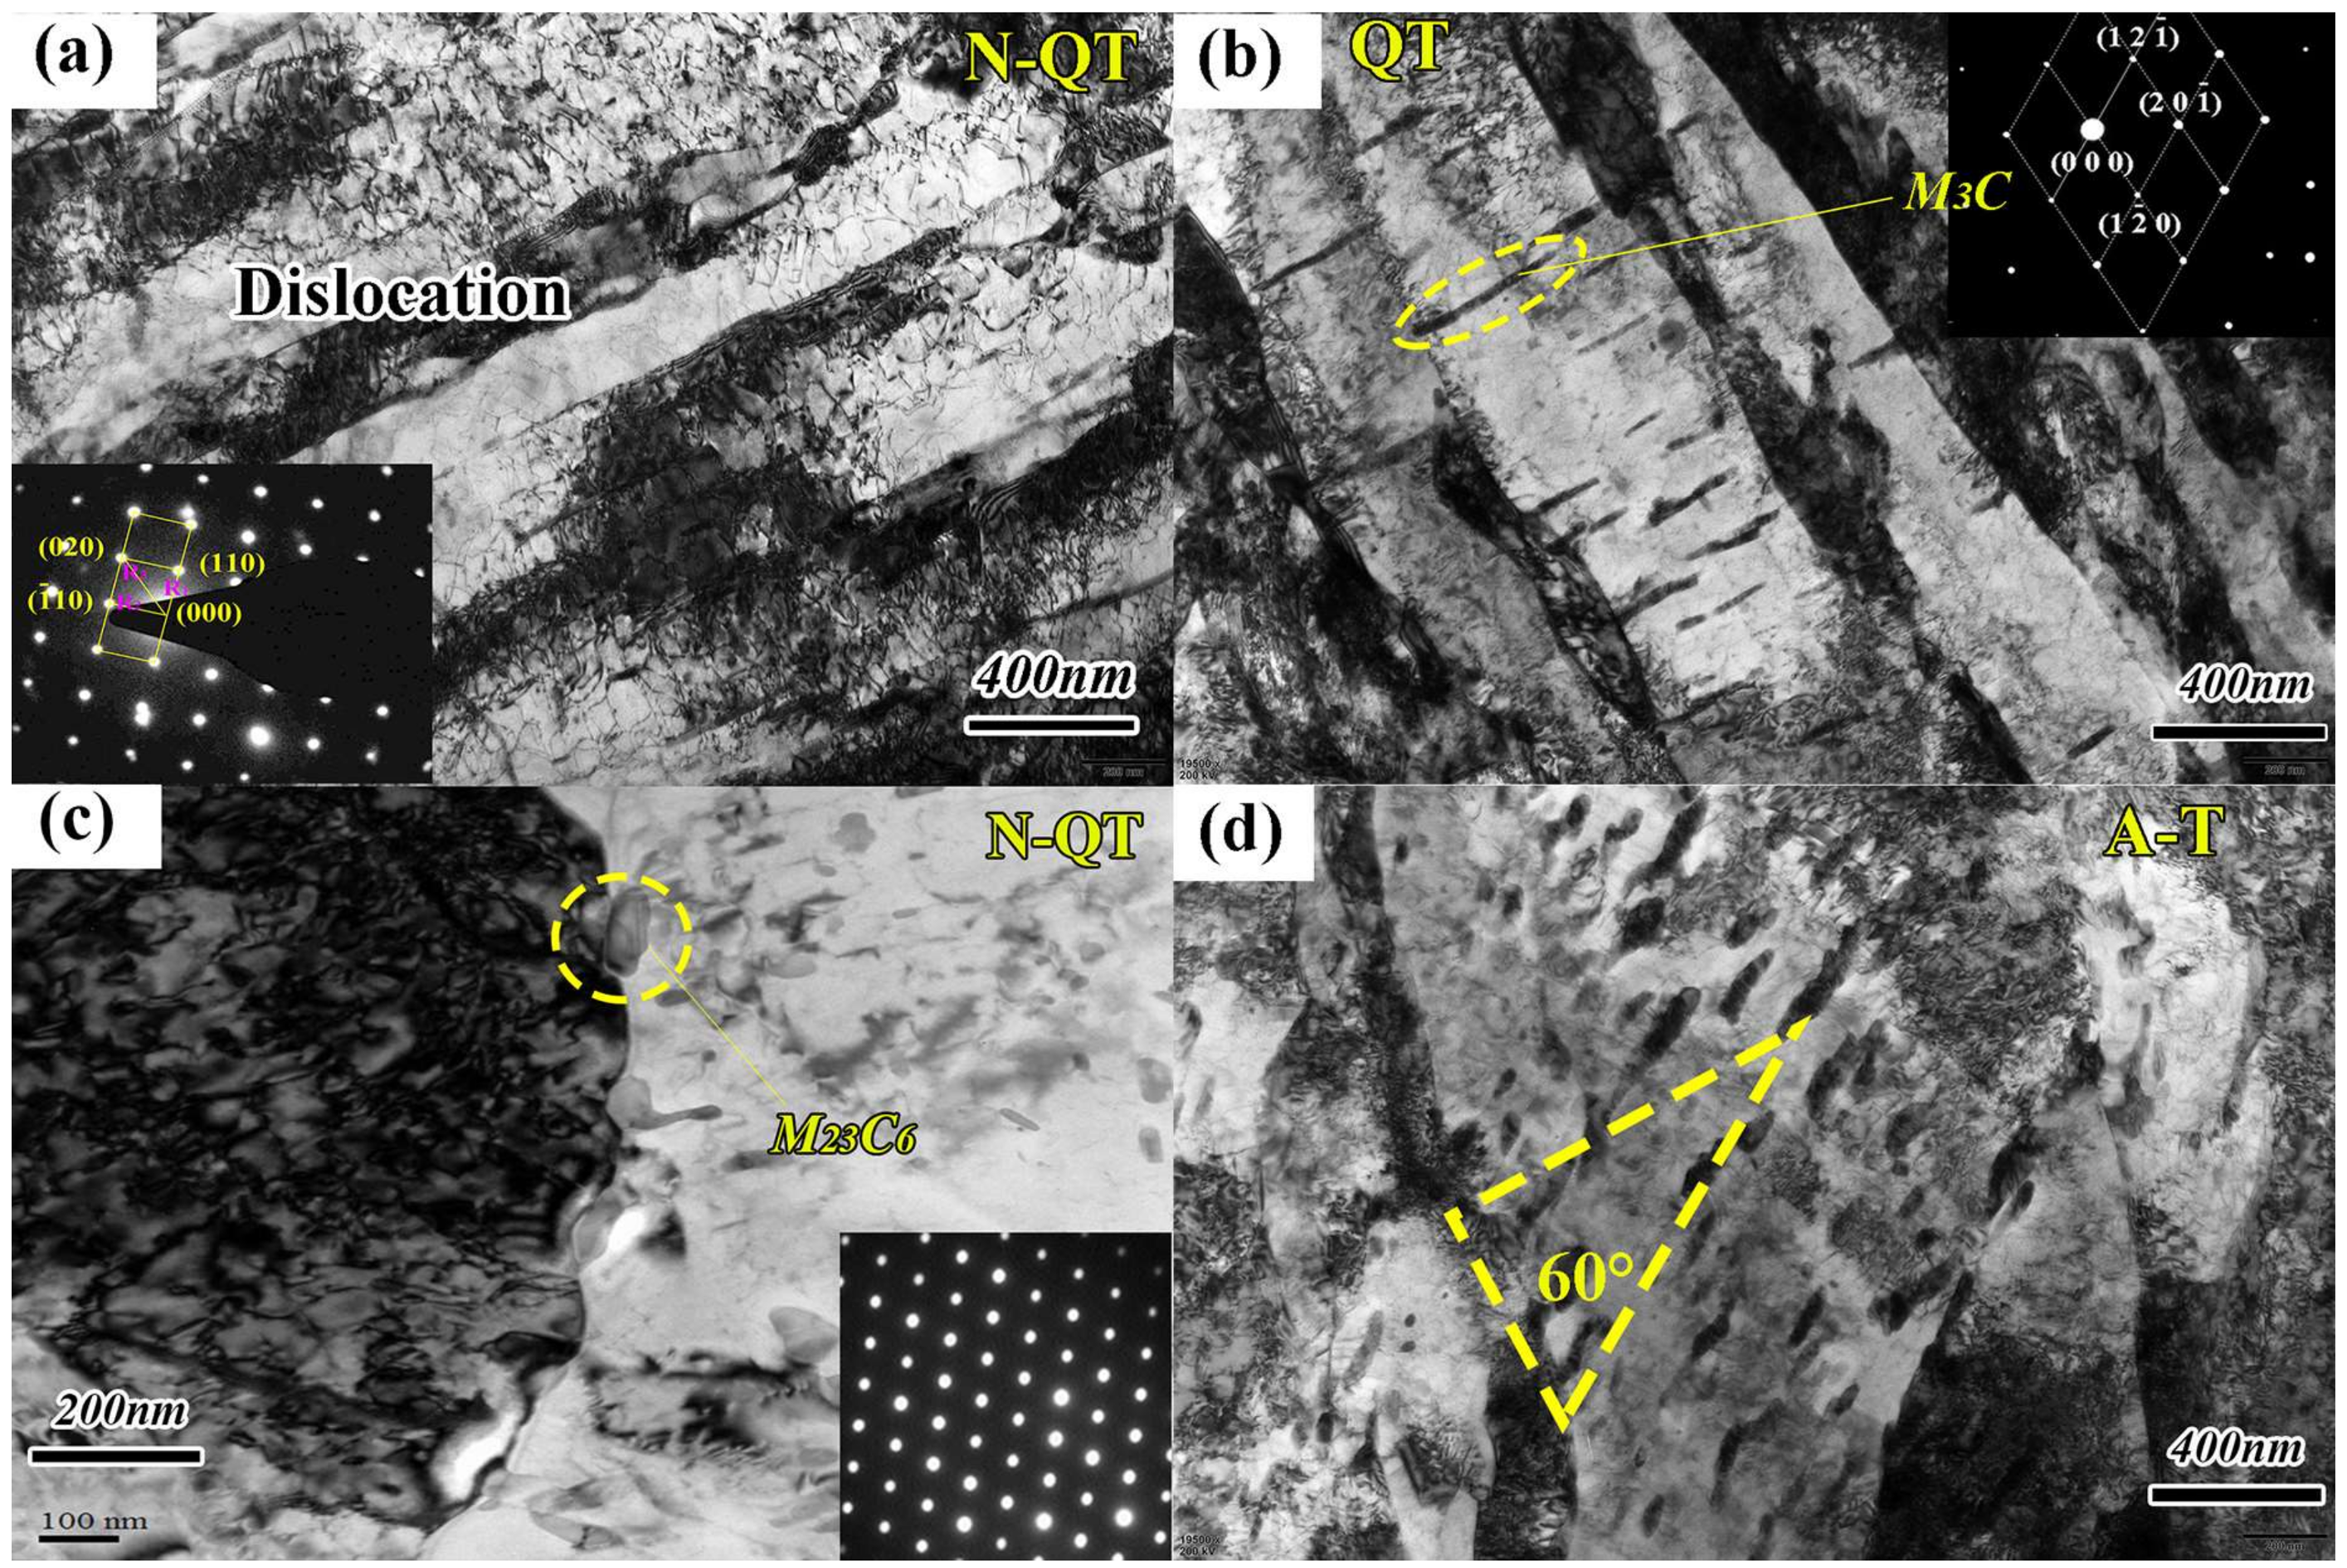
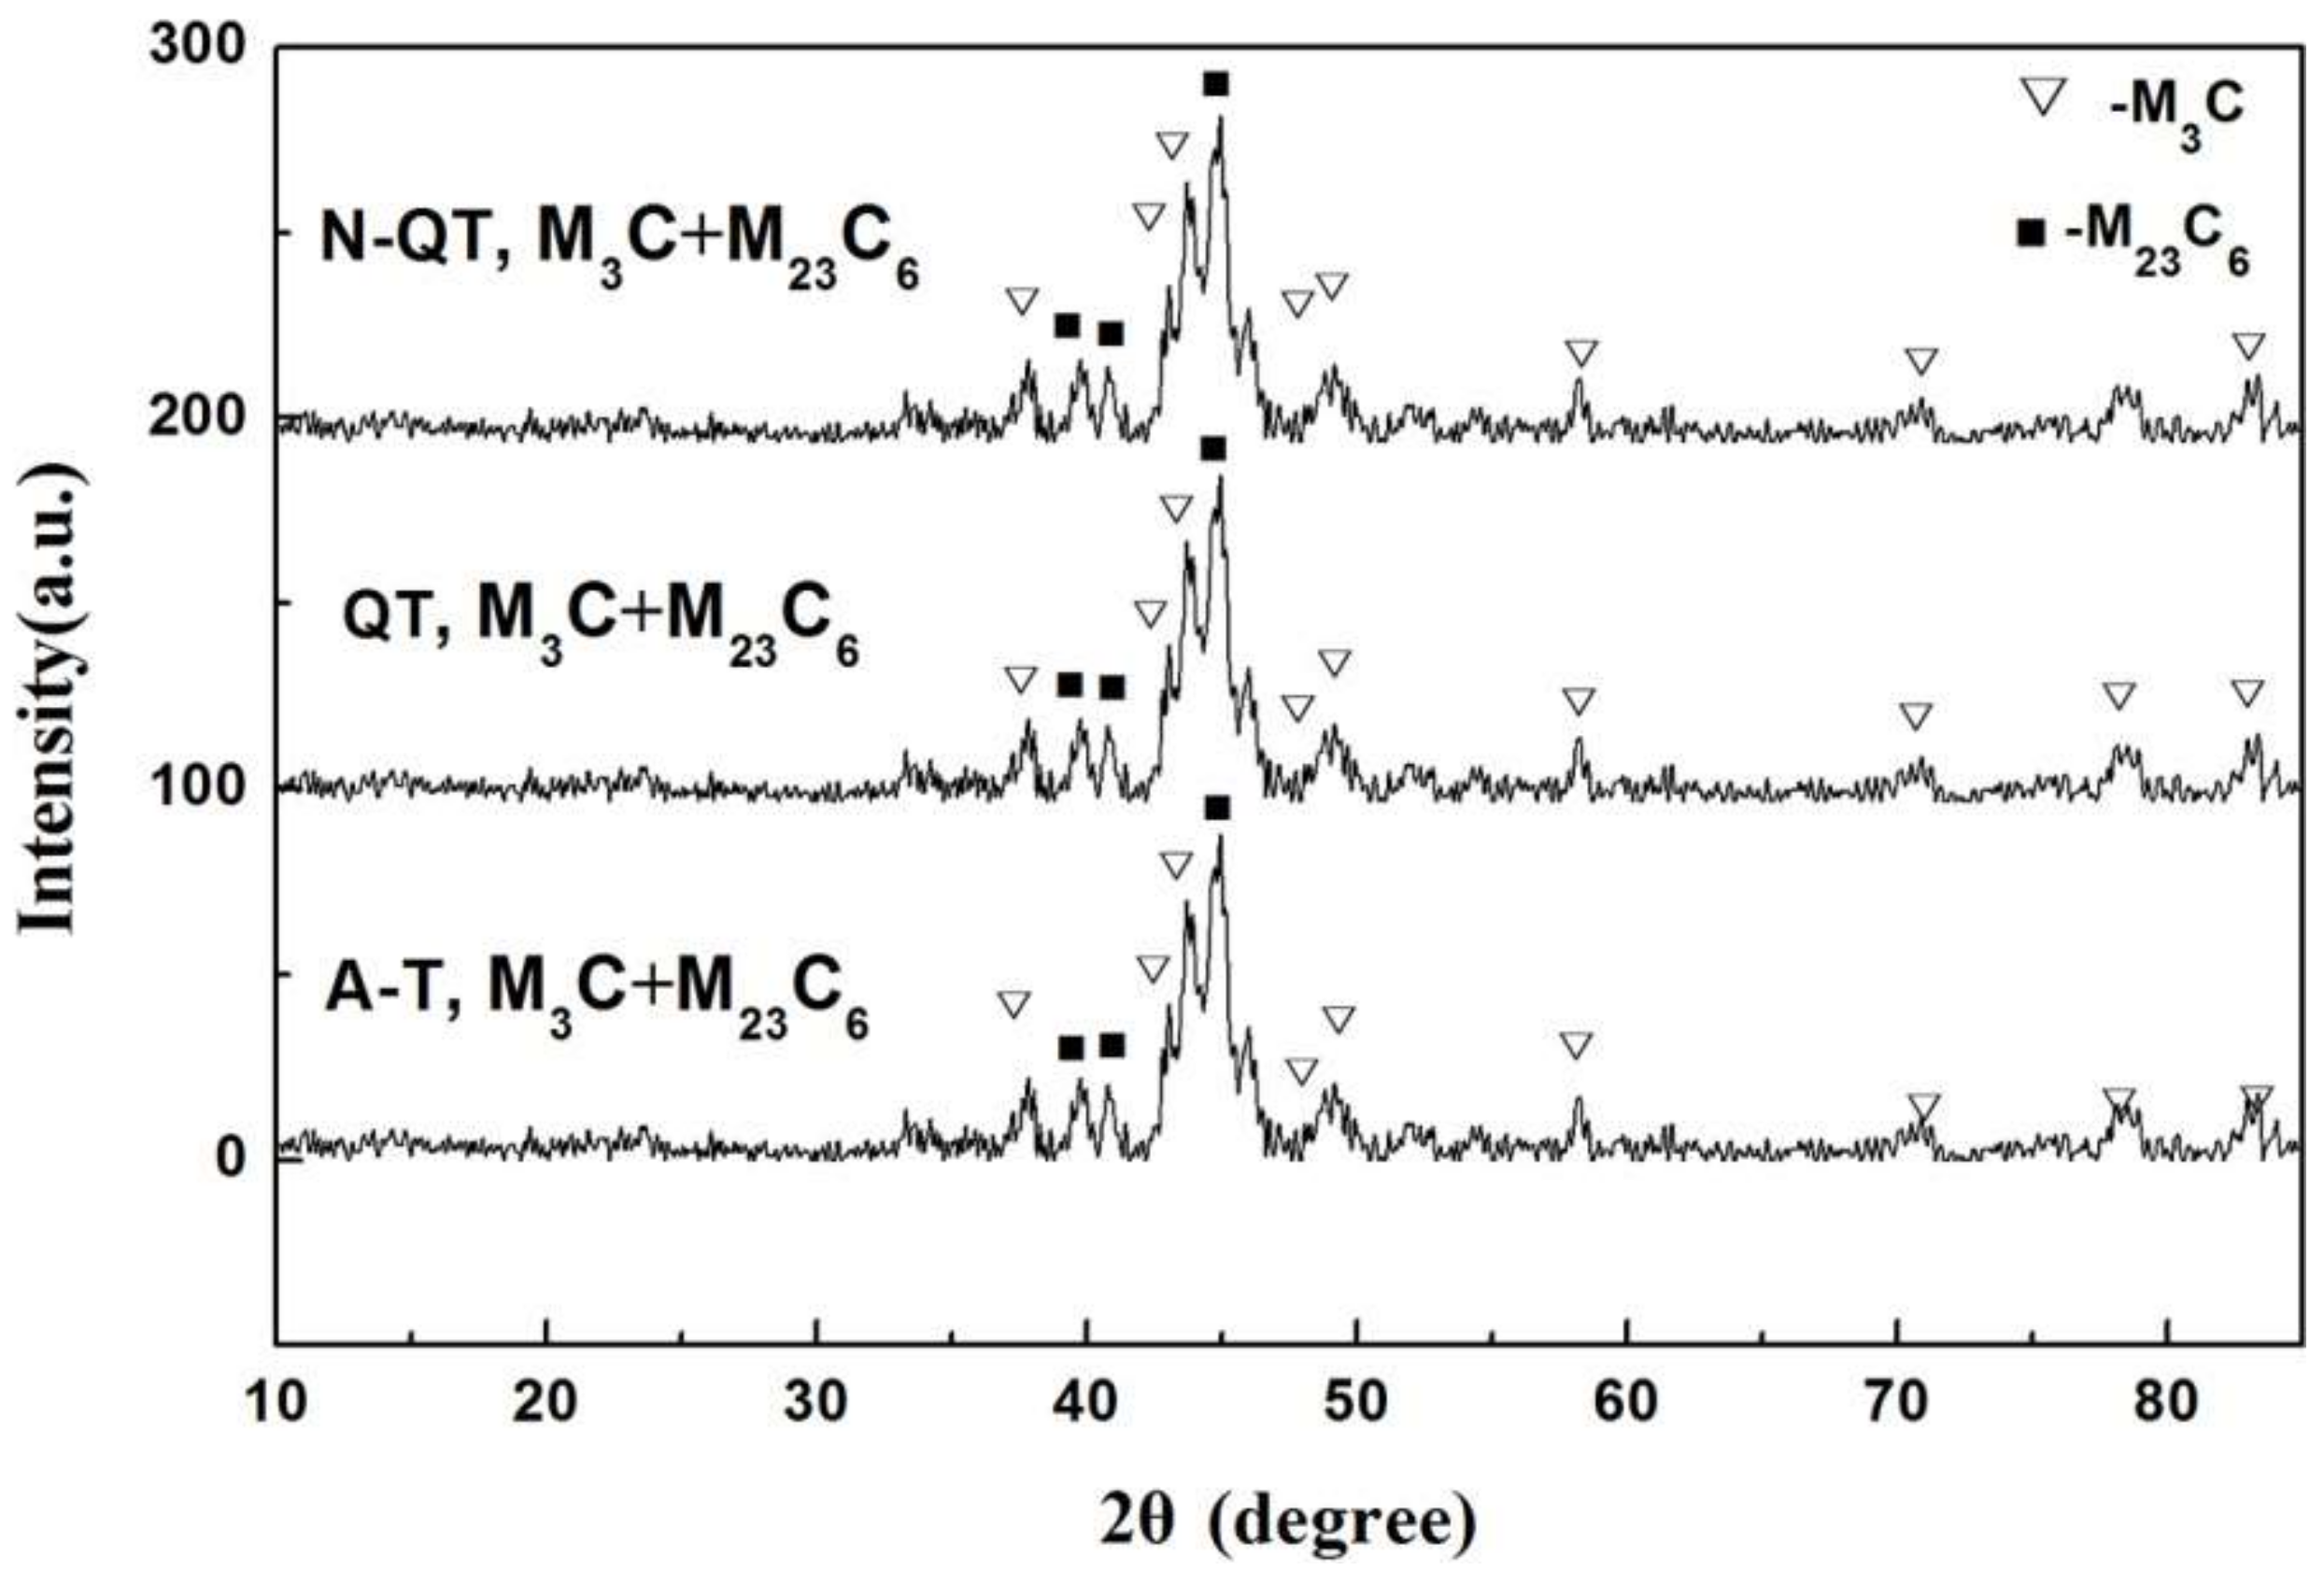
3.1. Microstructure
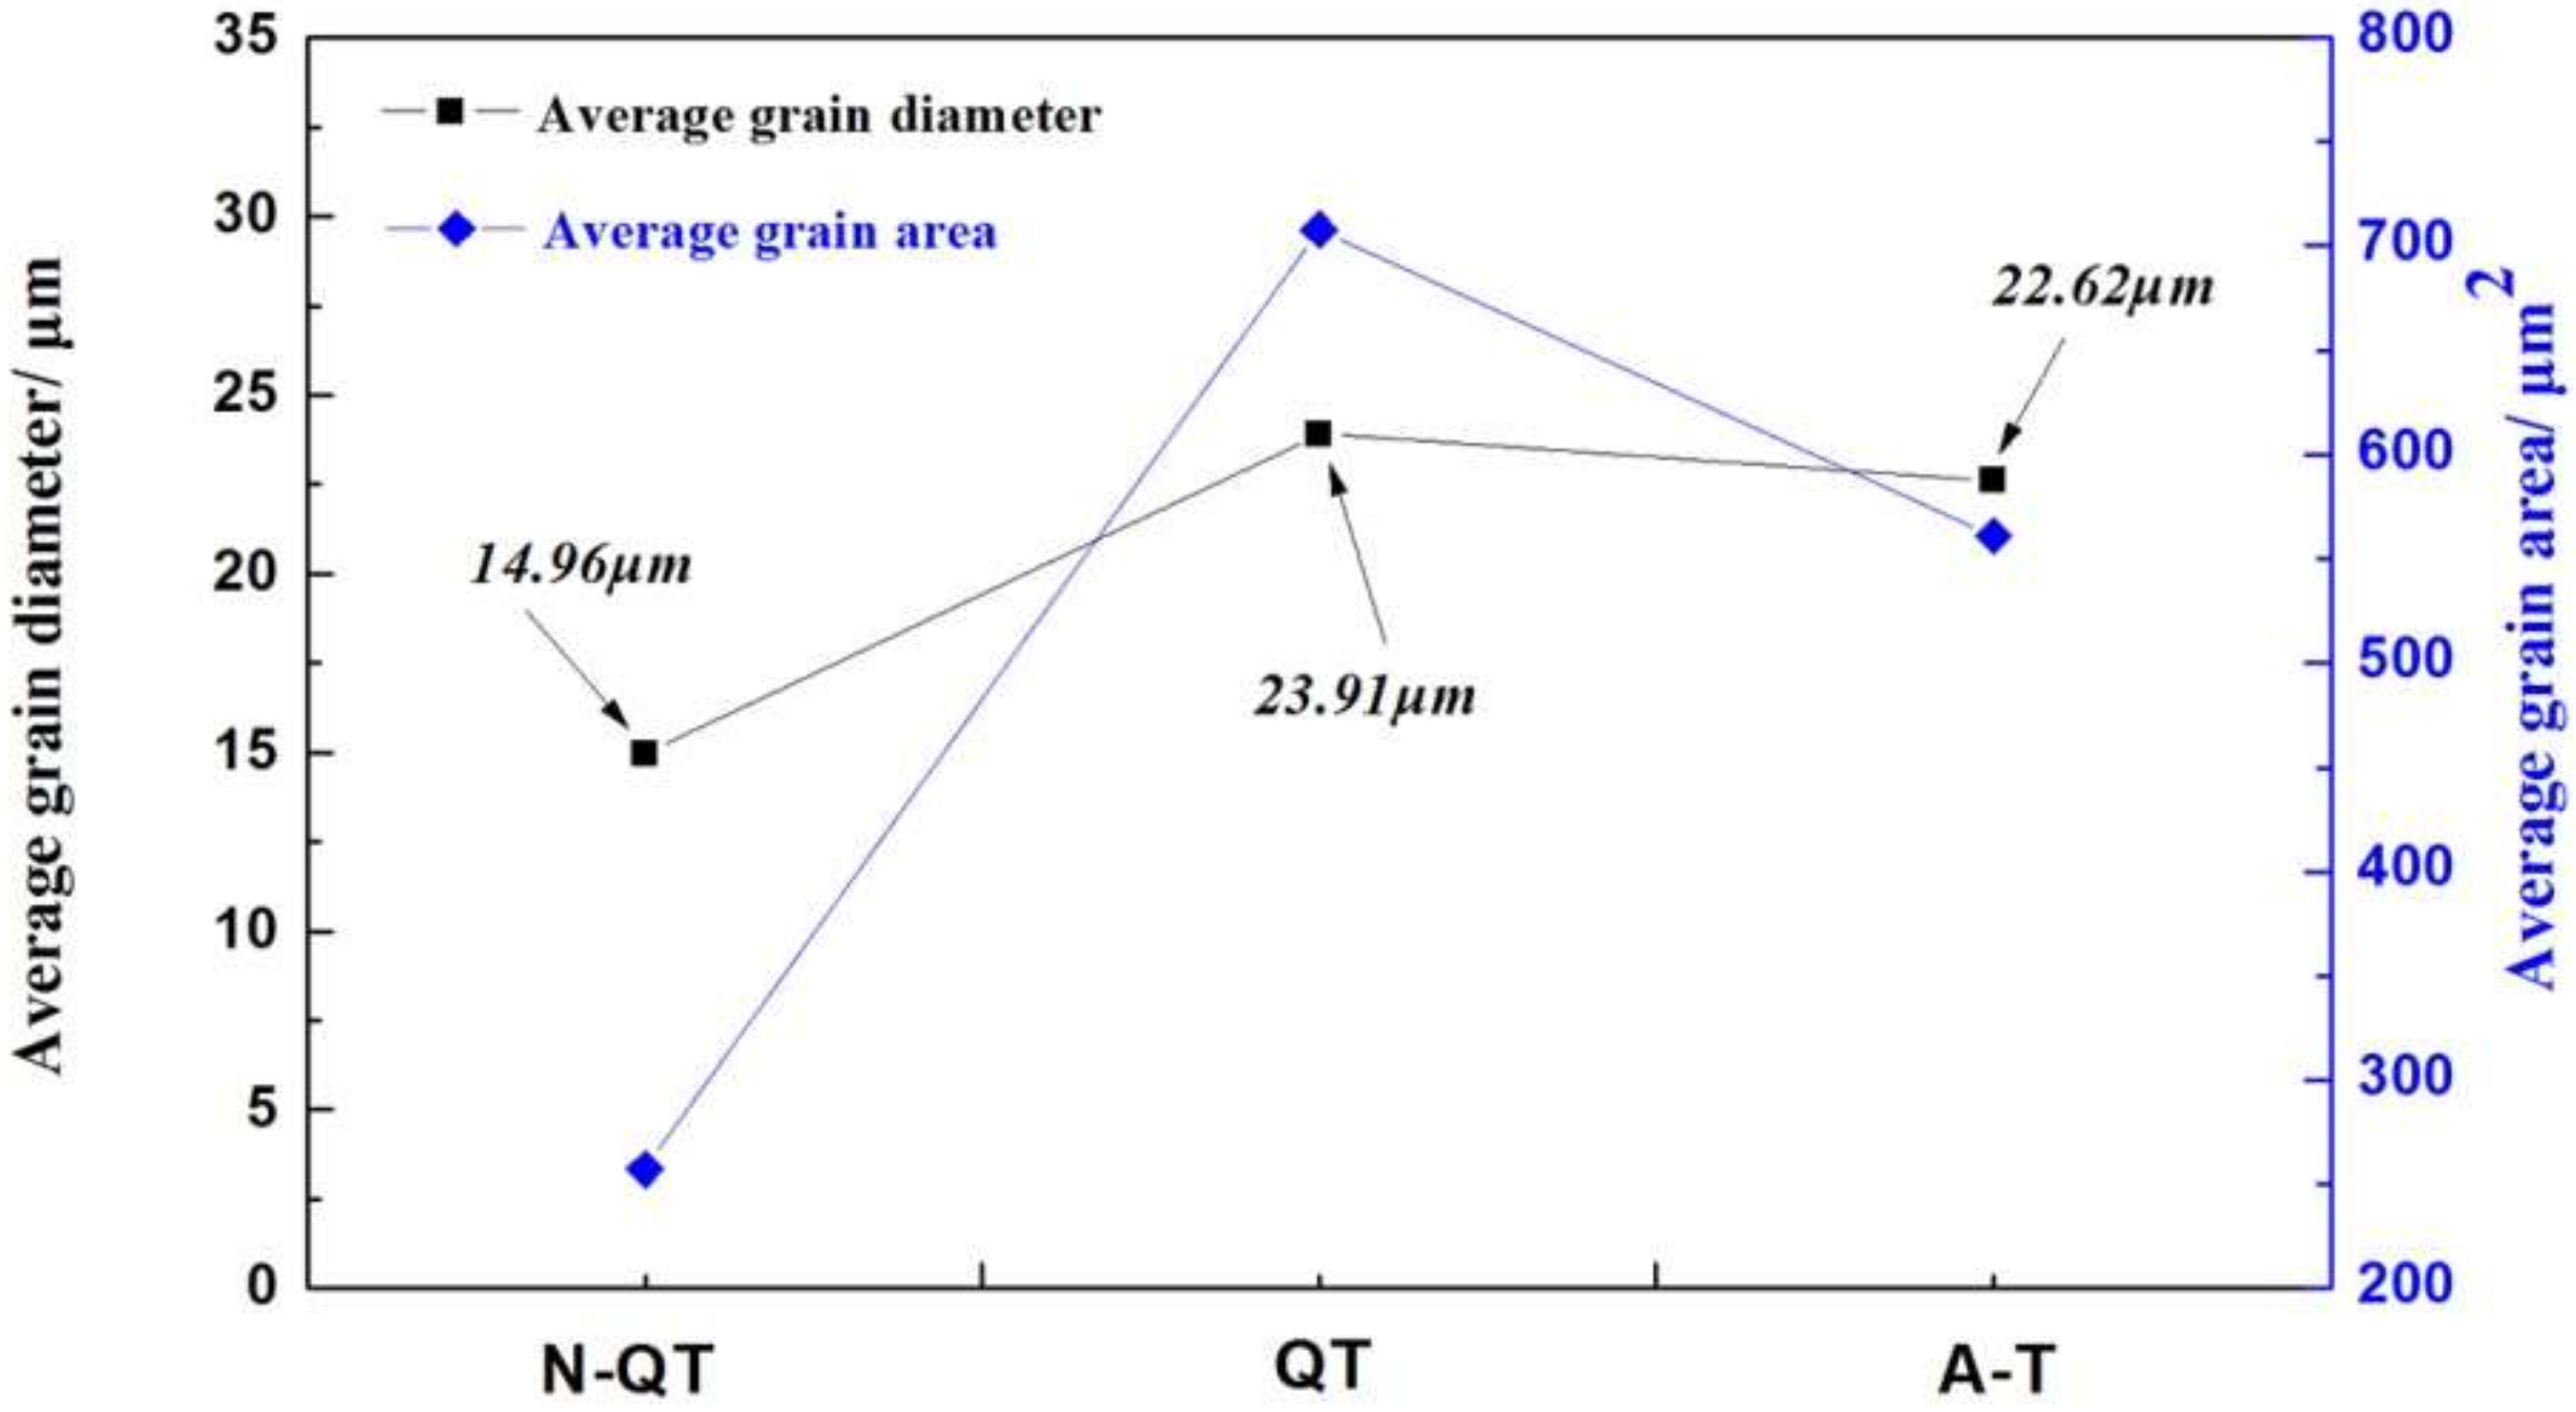
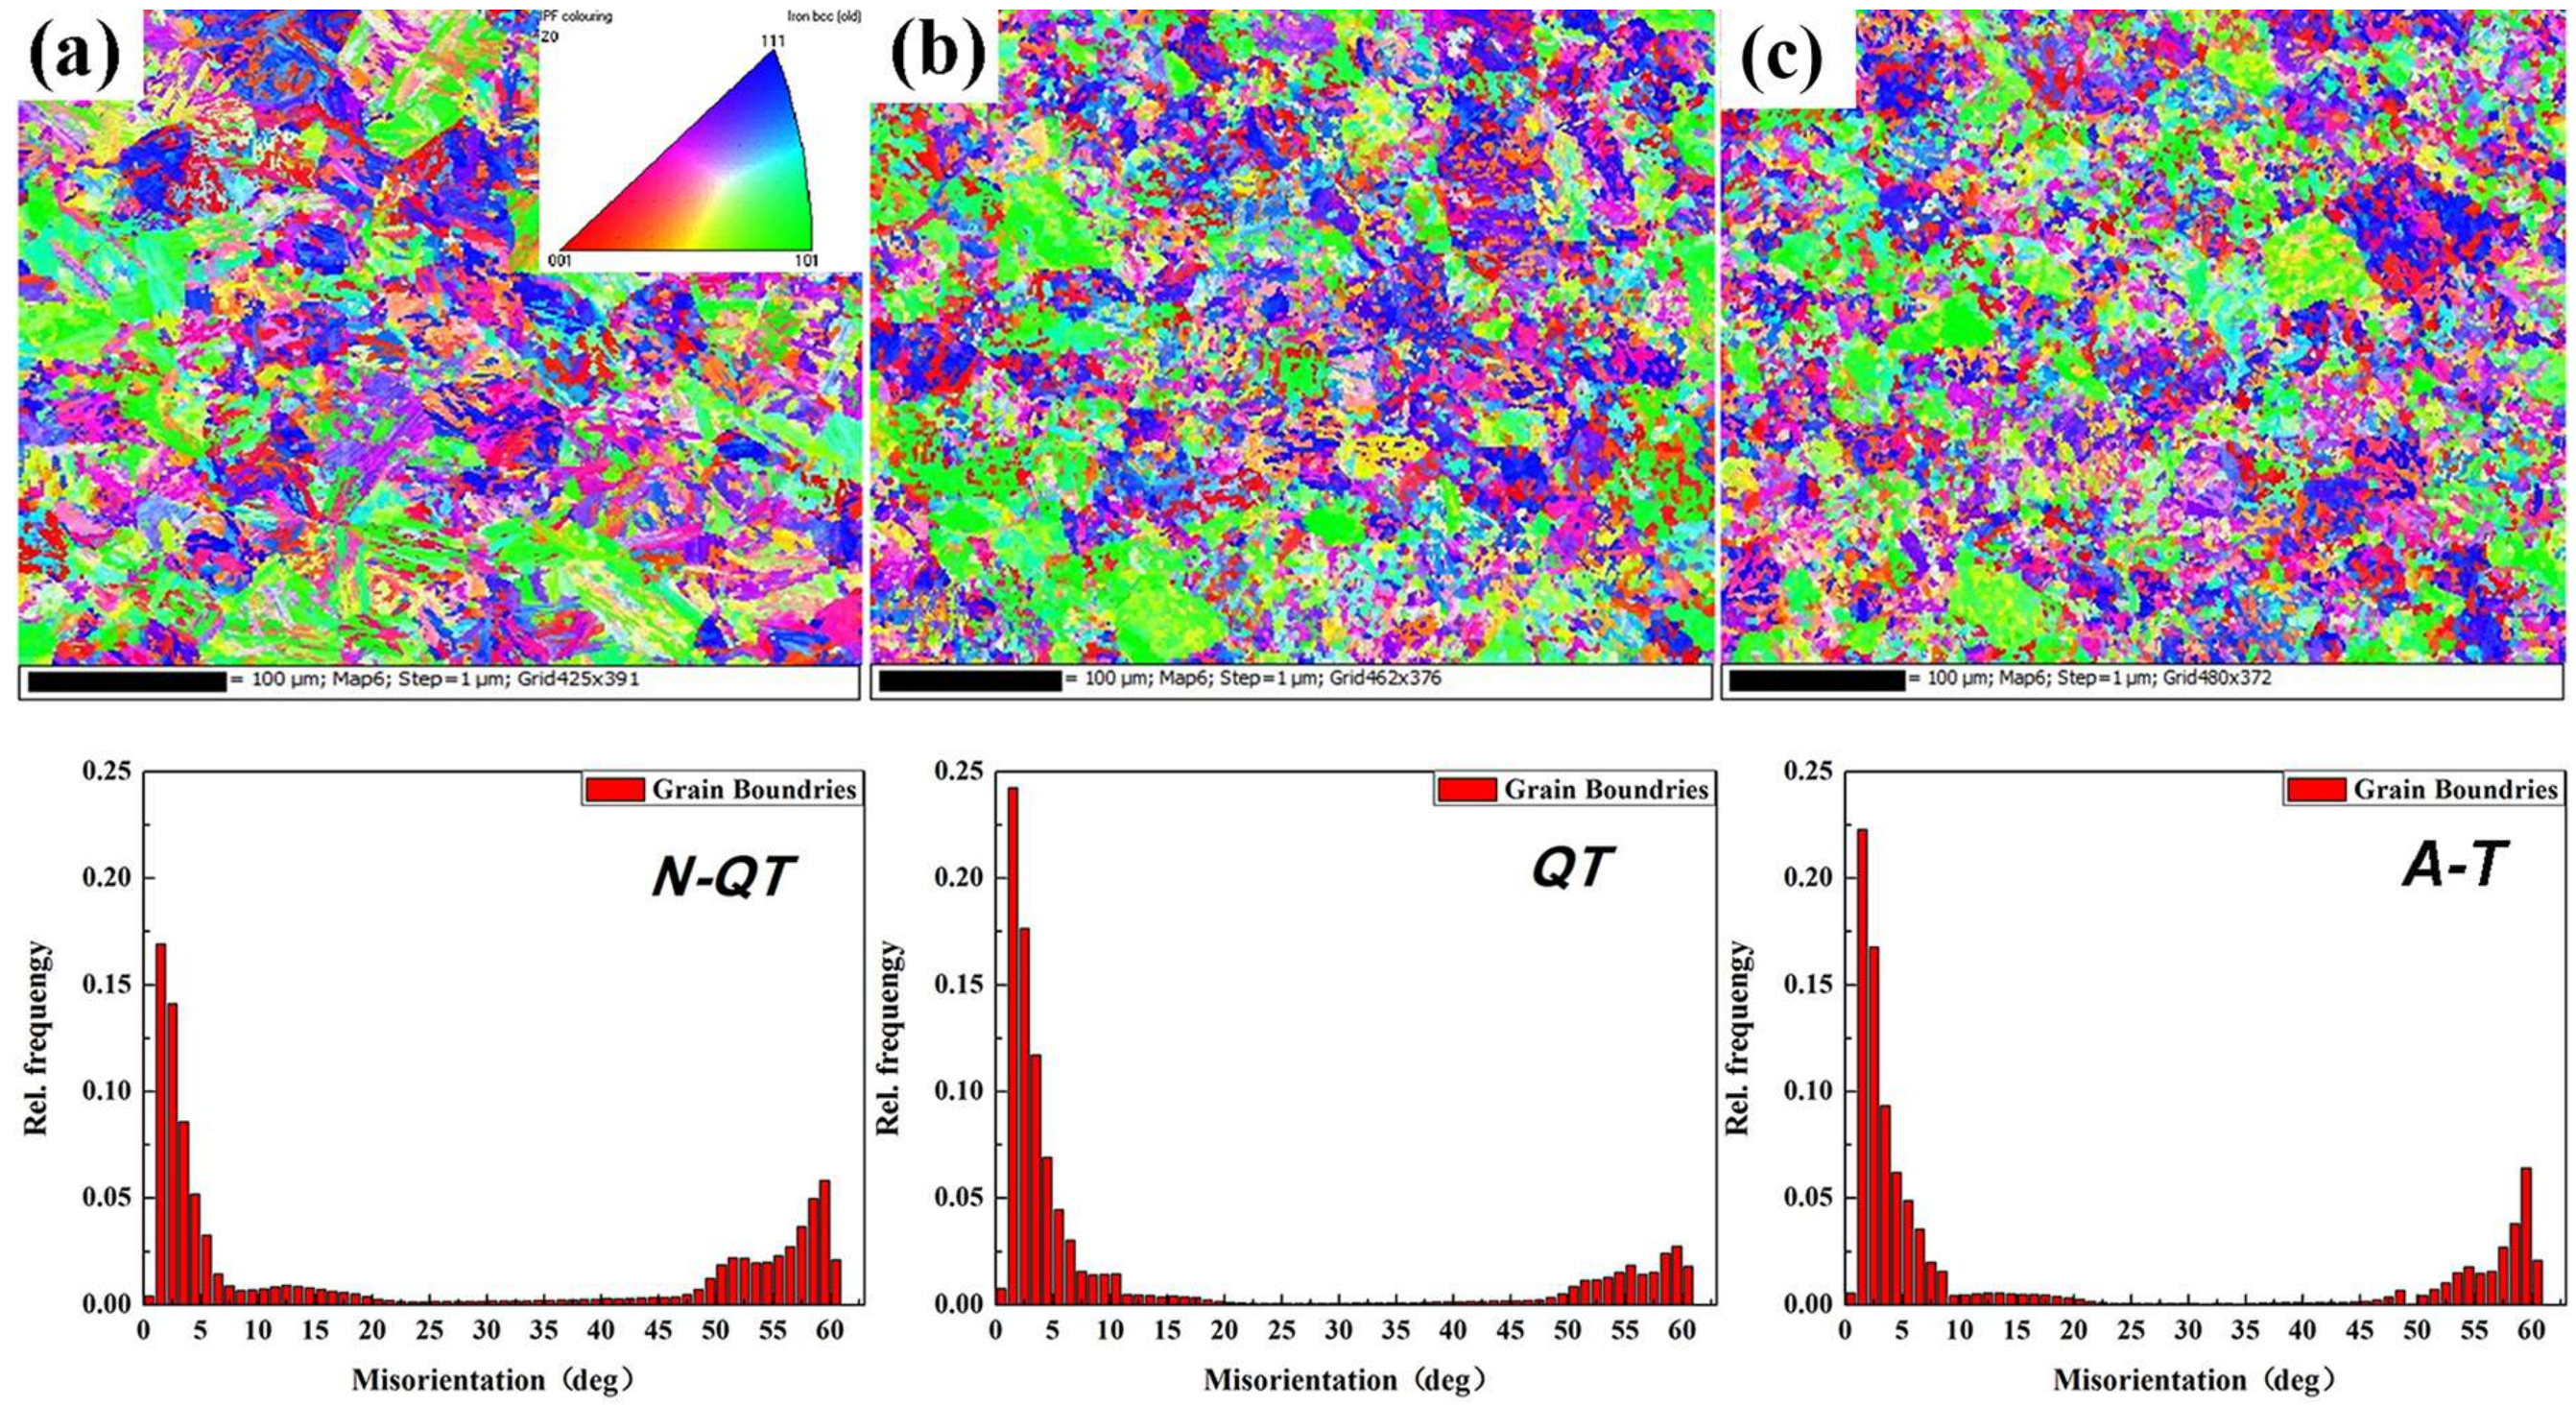
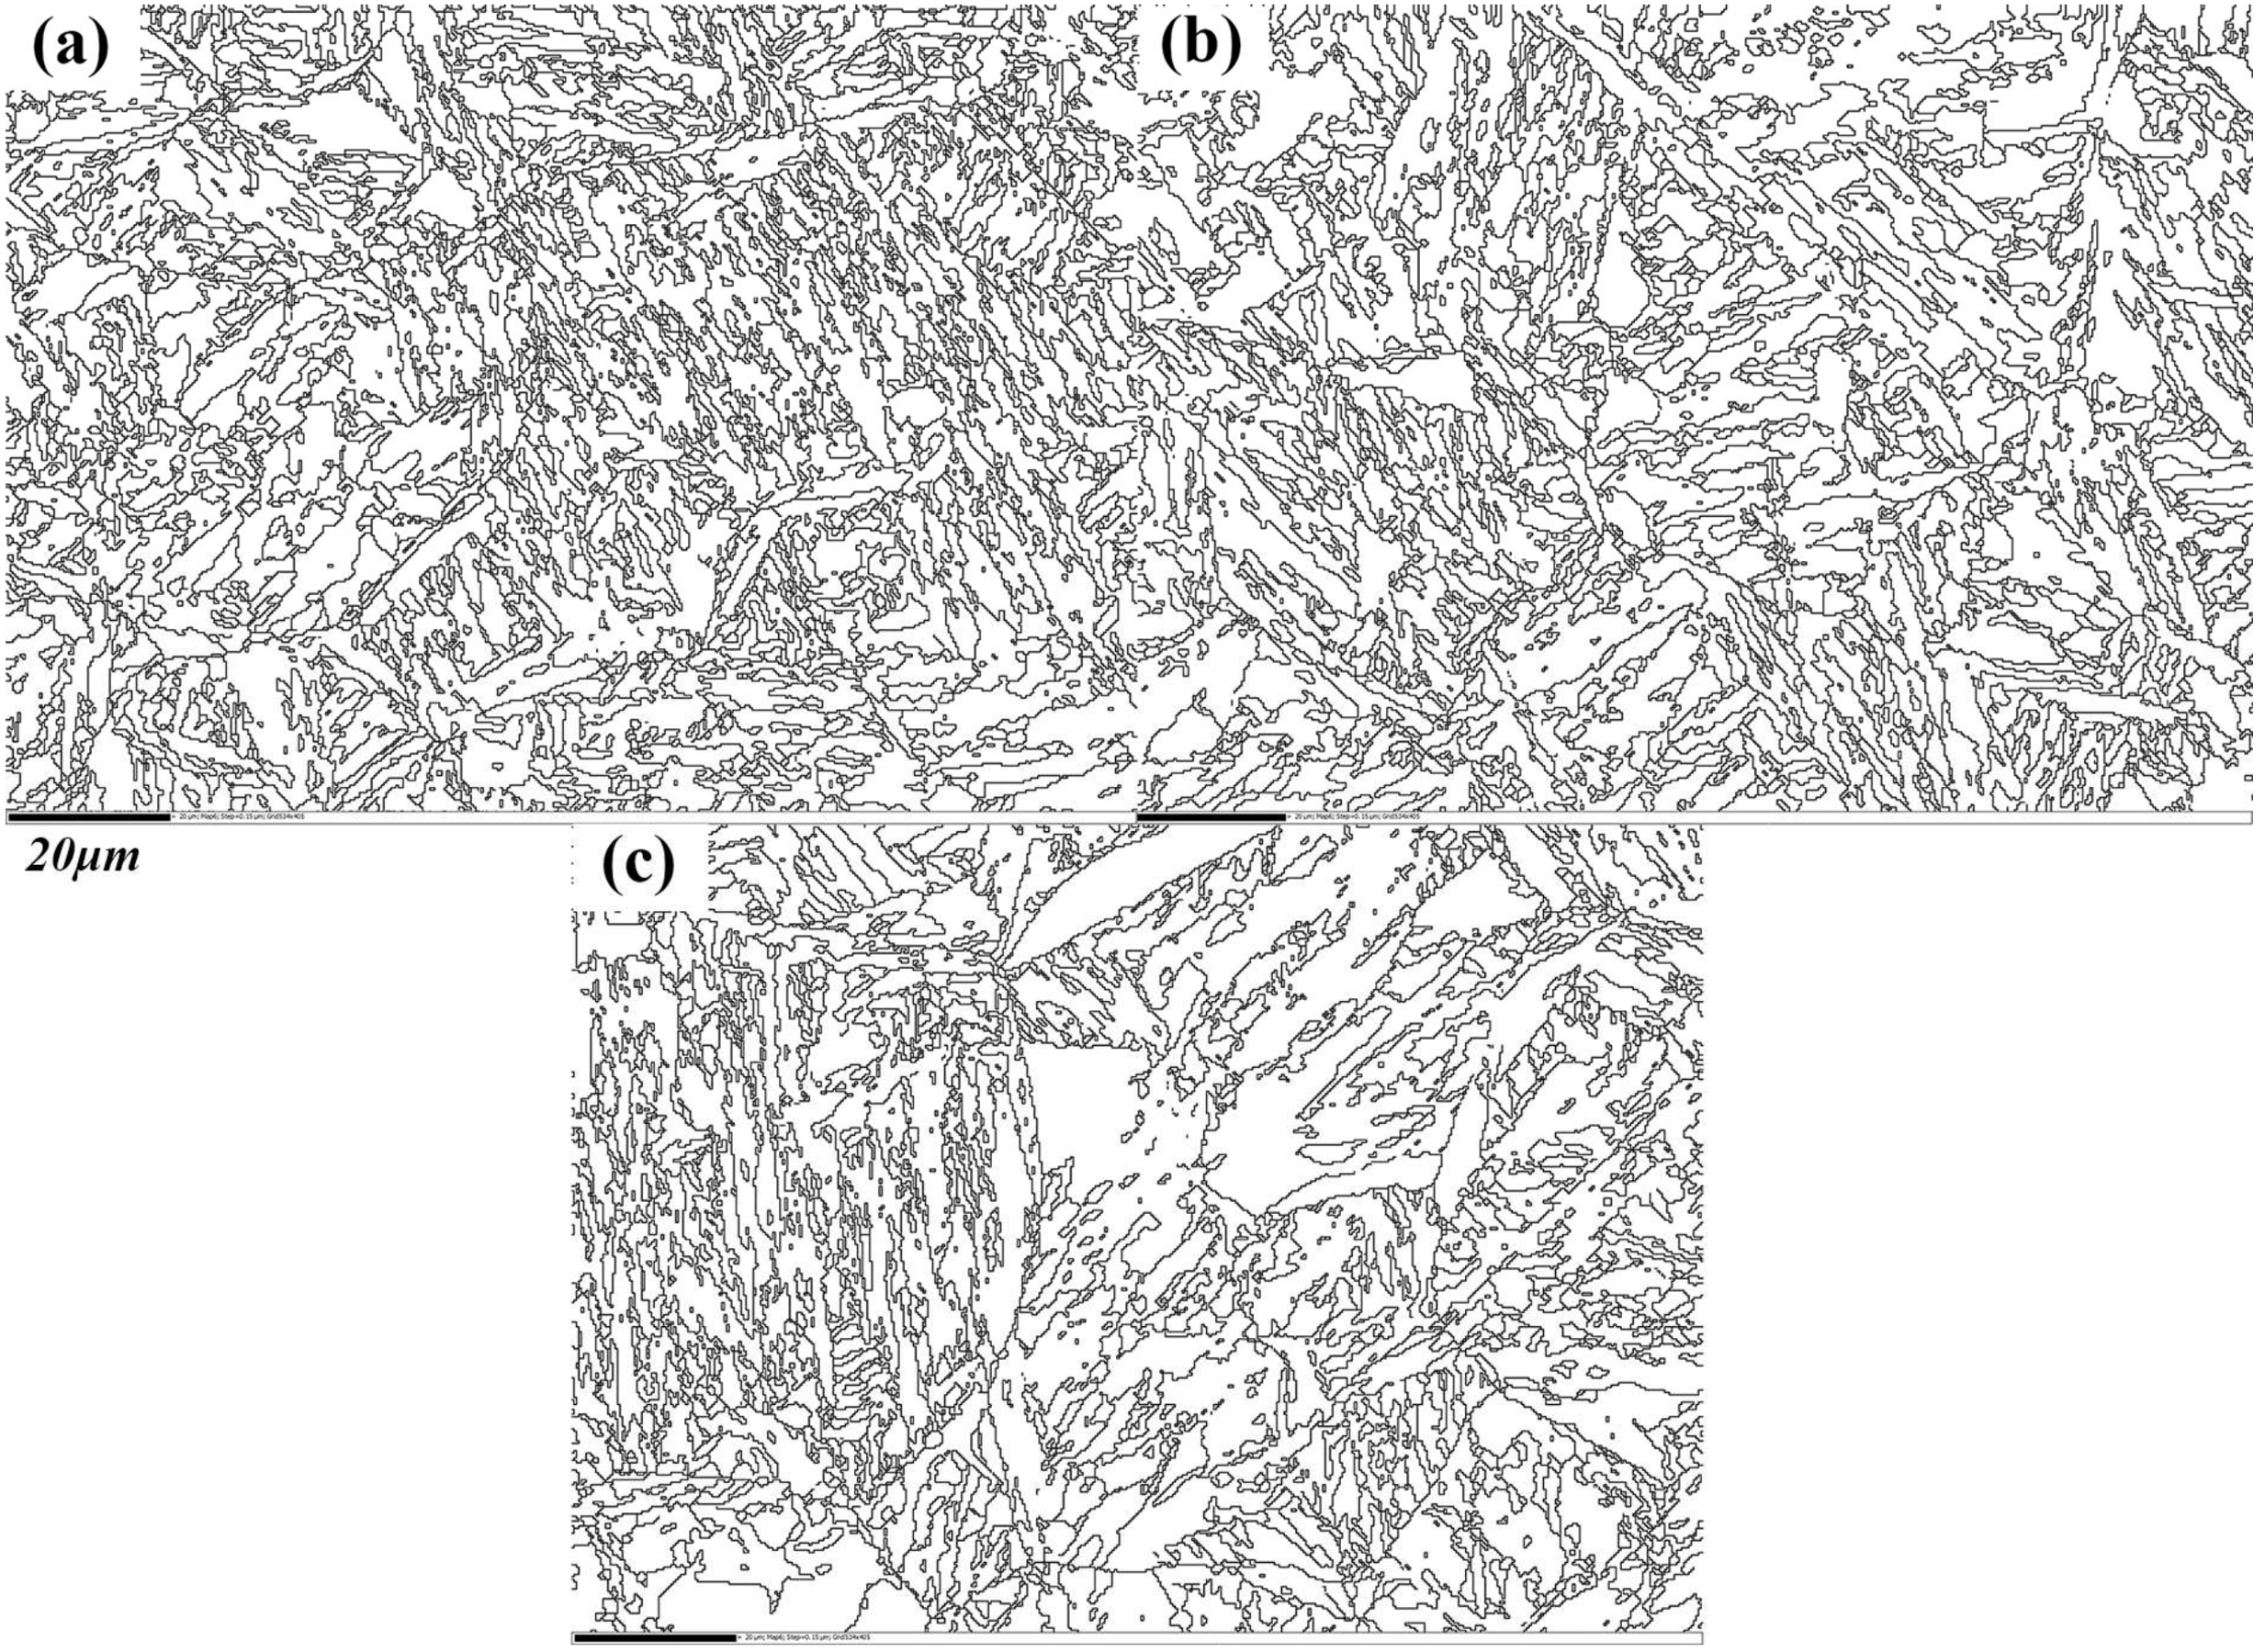
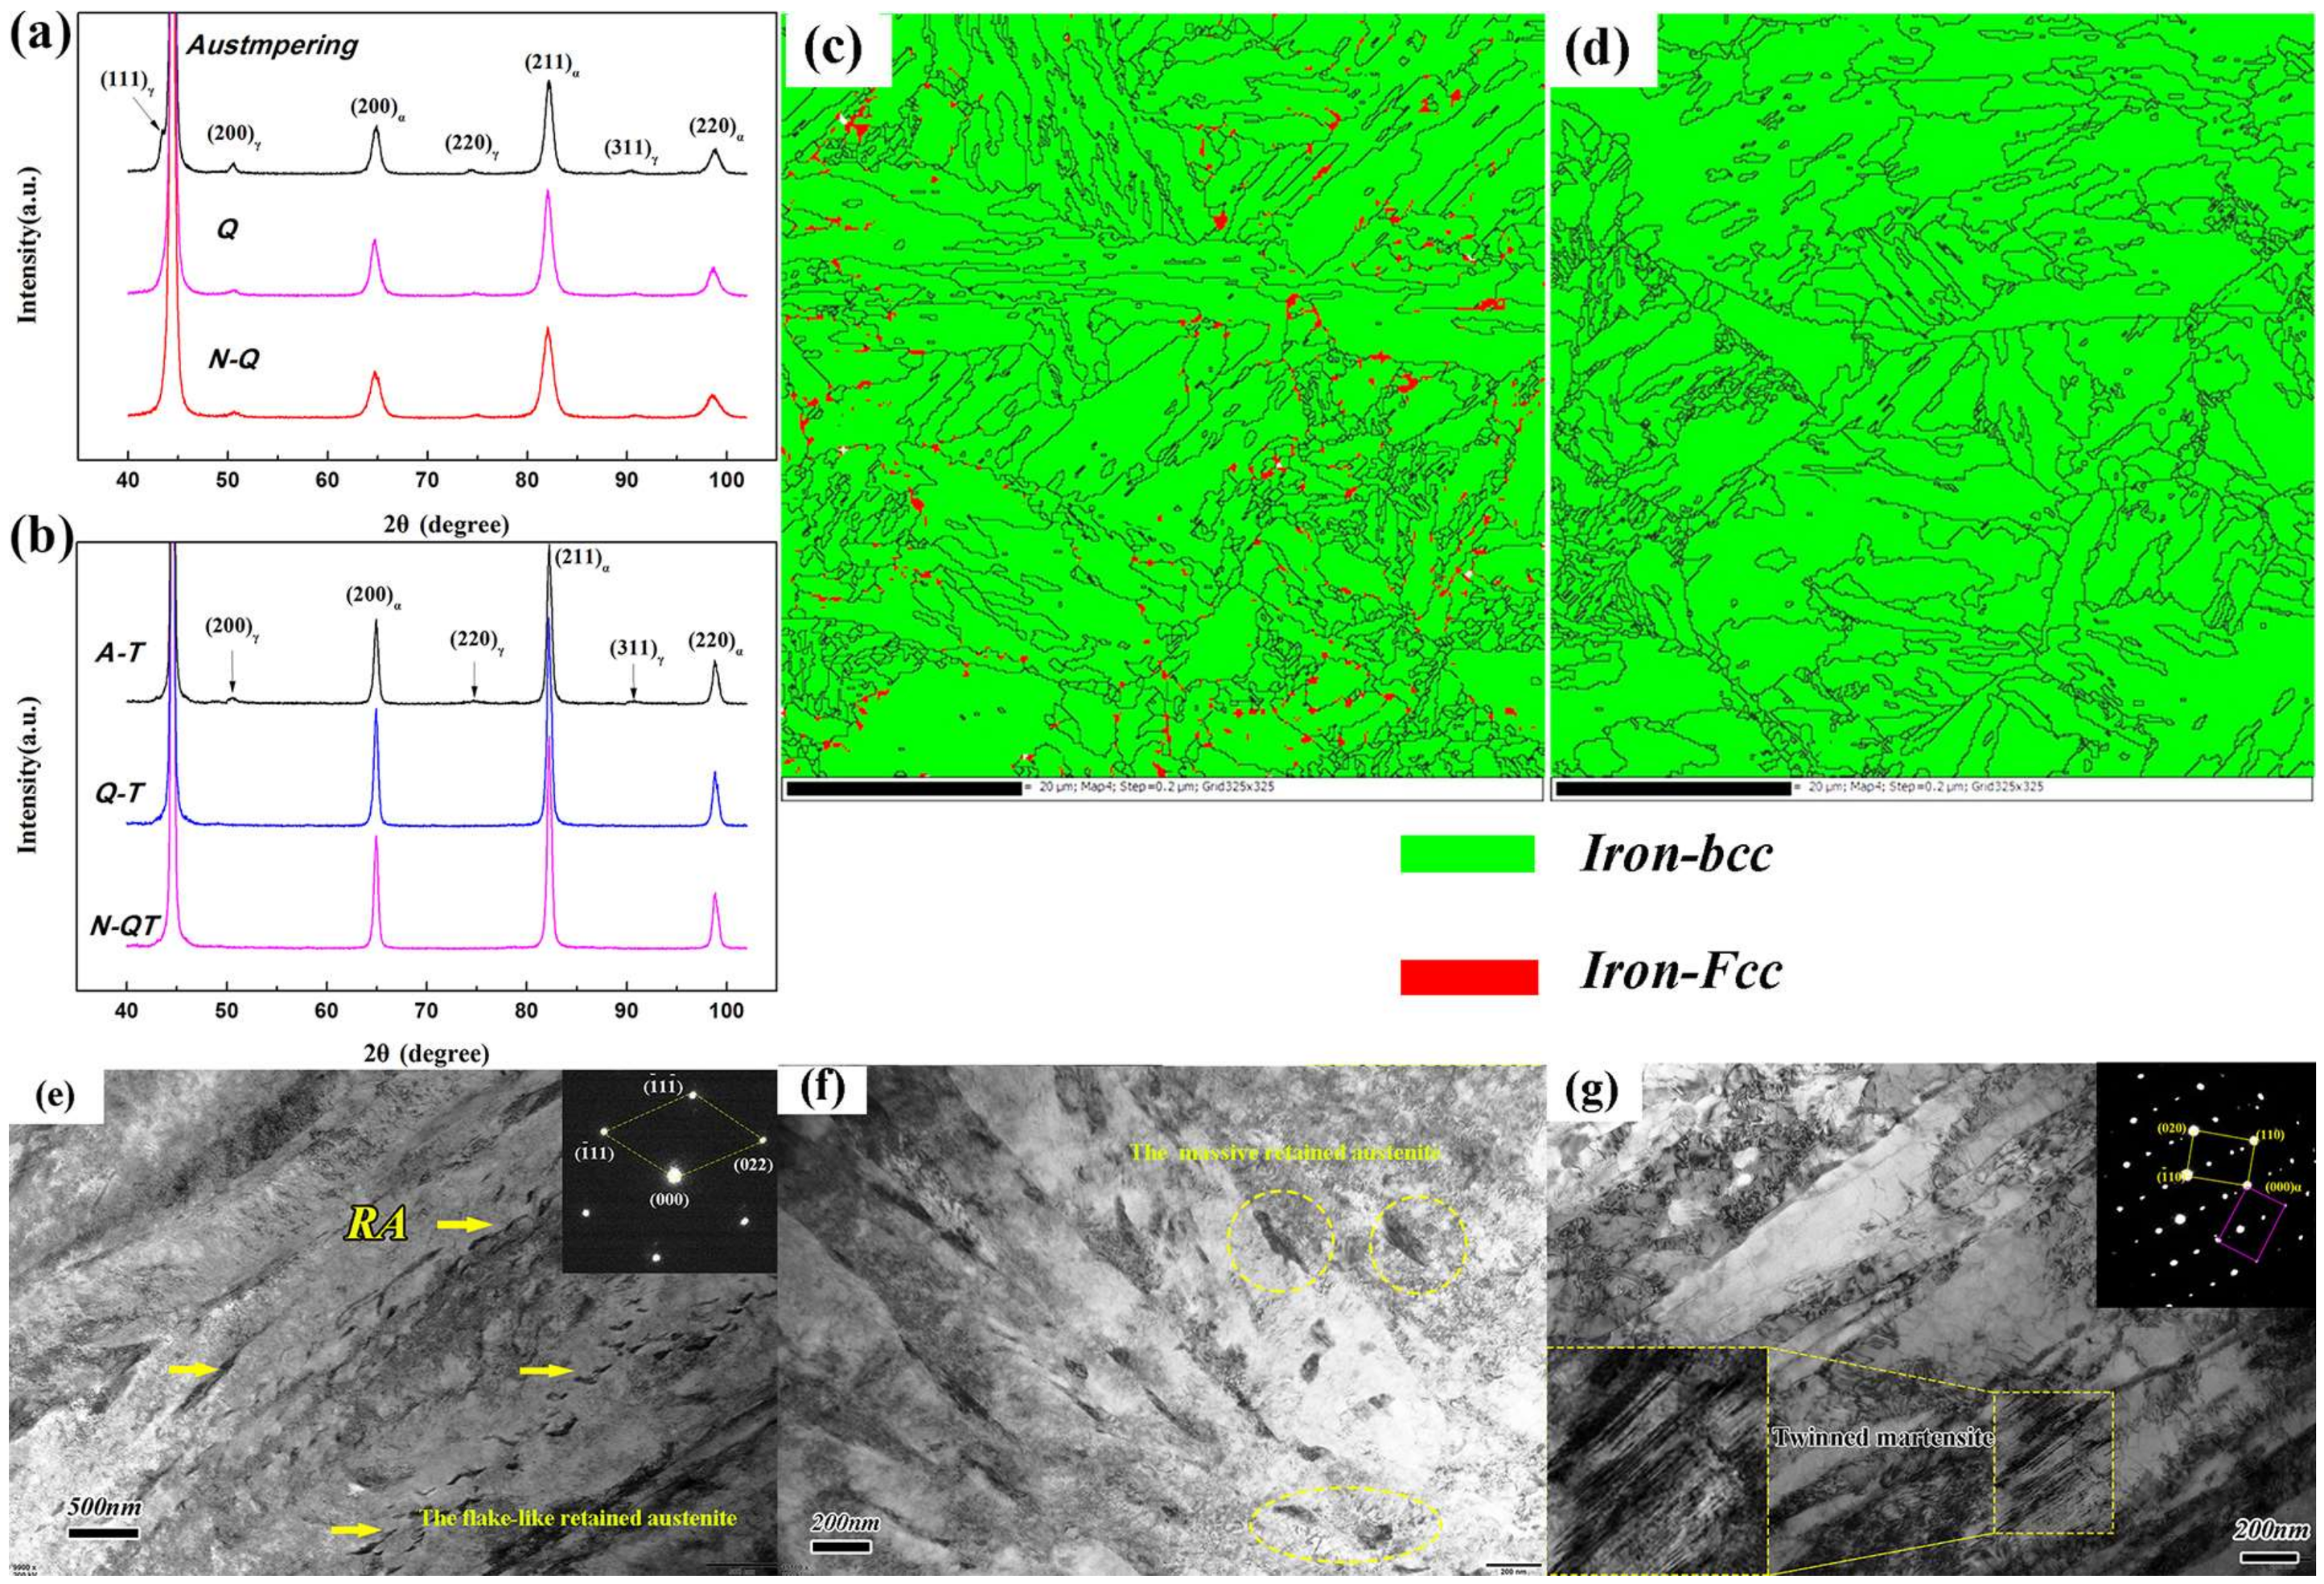
3.2. Grain Structure and Retained Austenite
3.3. Mechanical Properties
4. Discussion
4.1. Hardness Uniformity
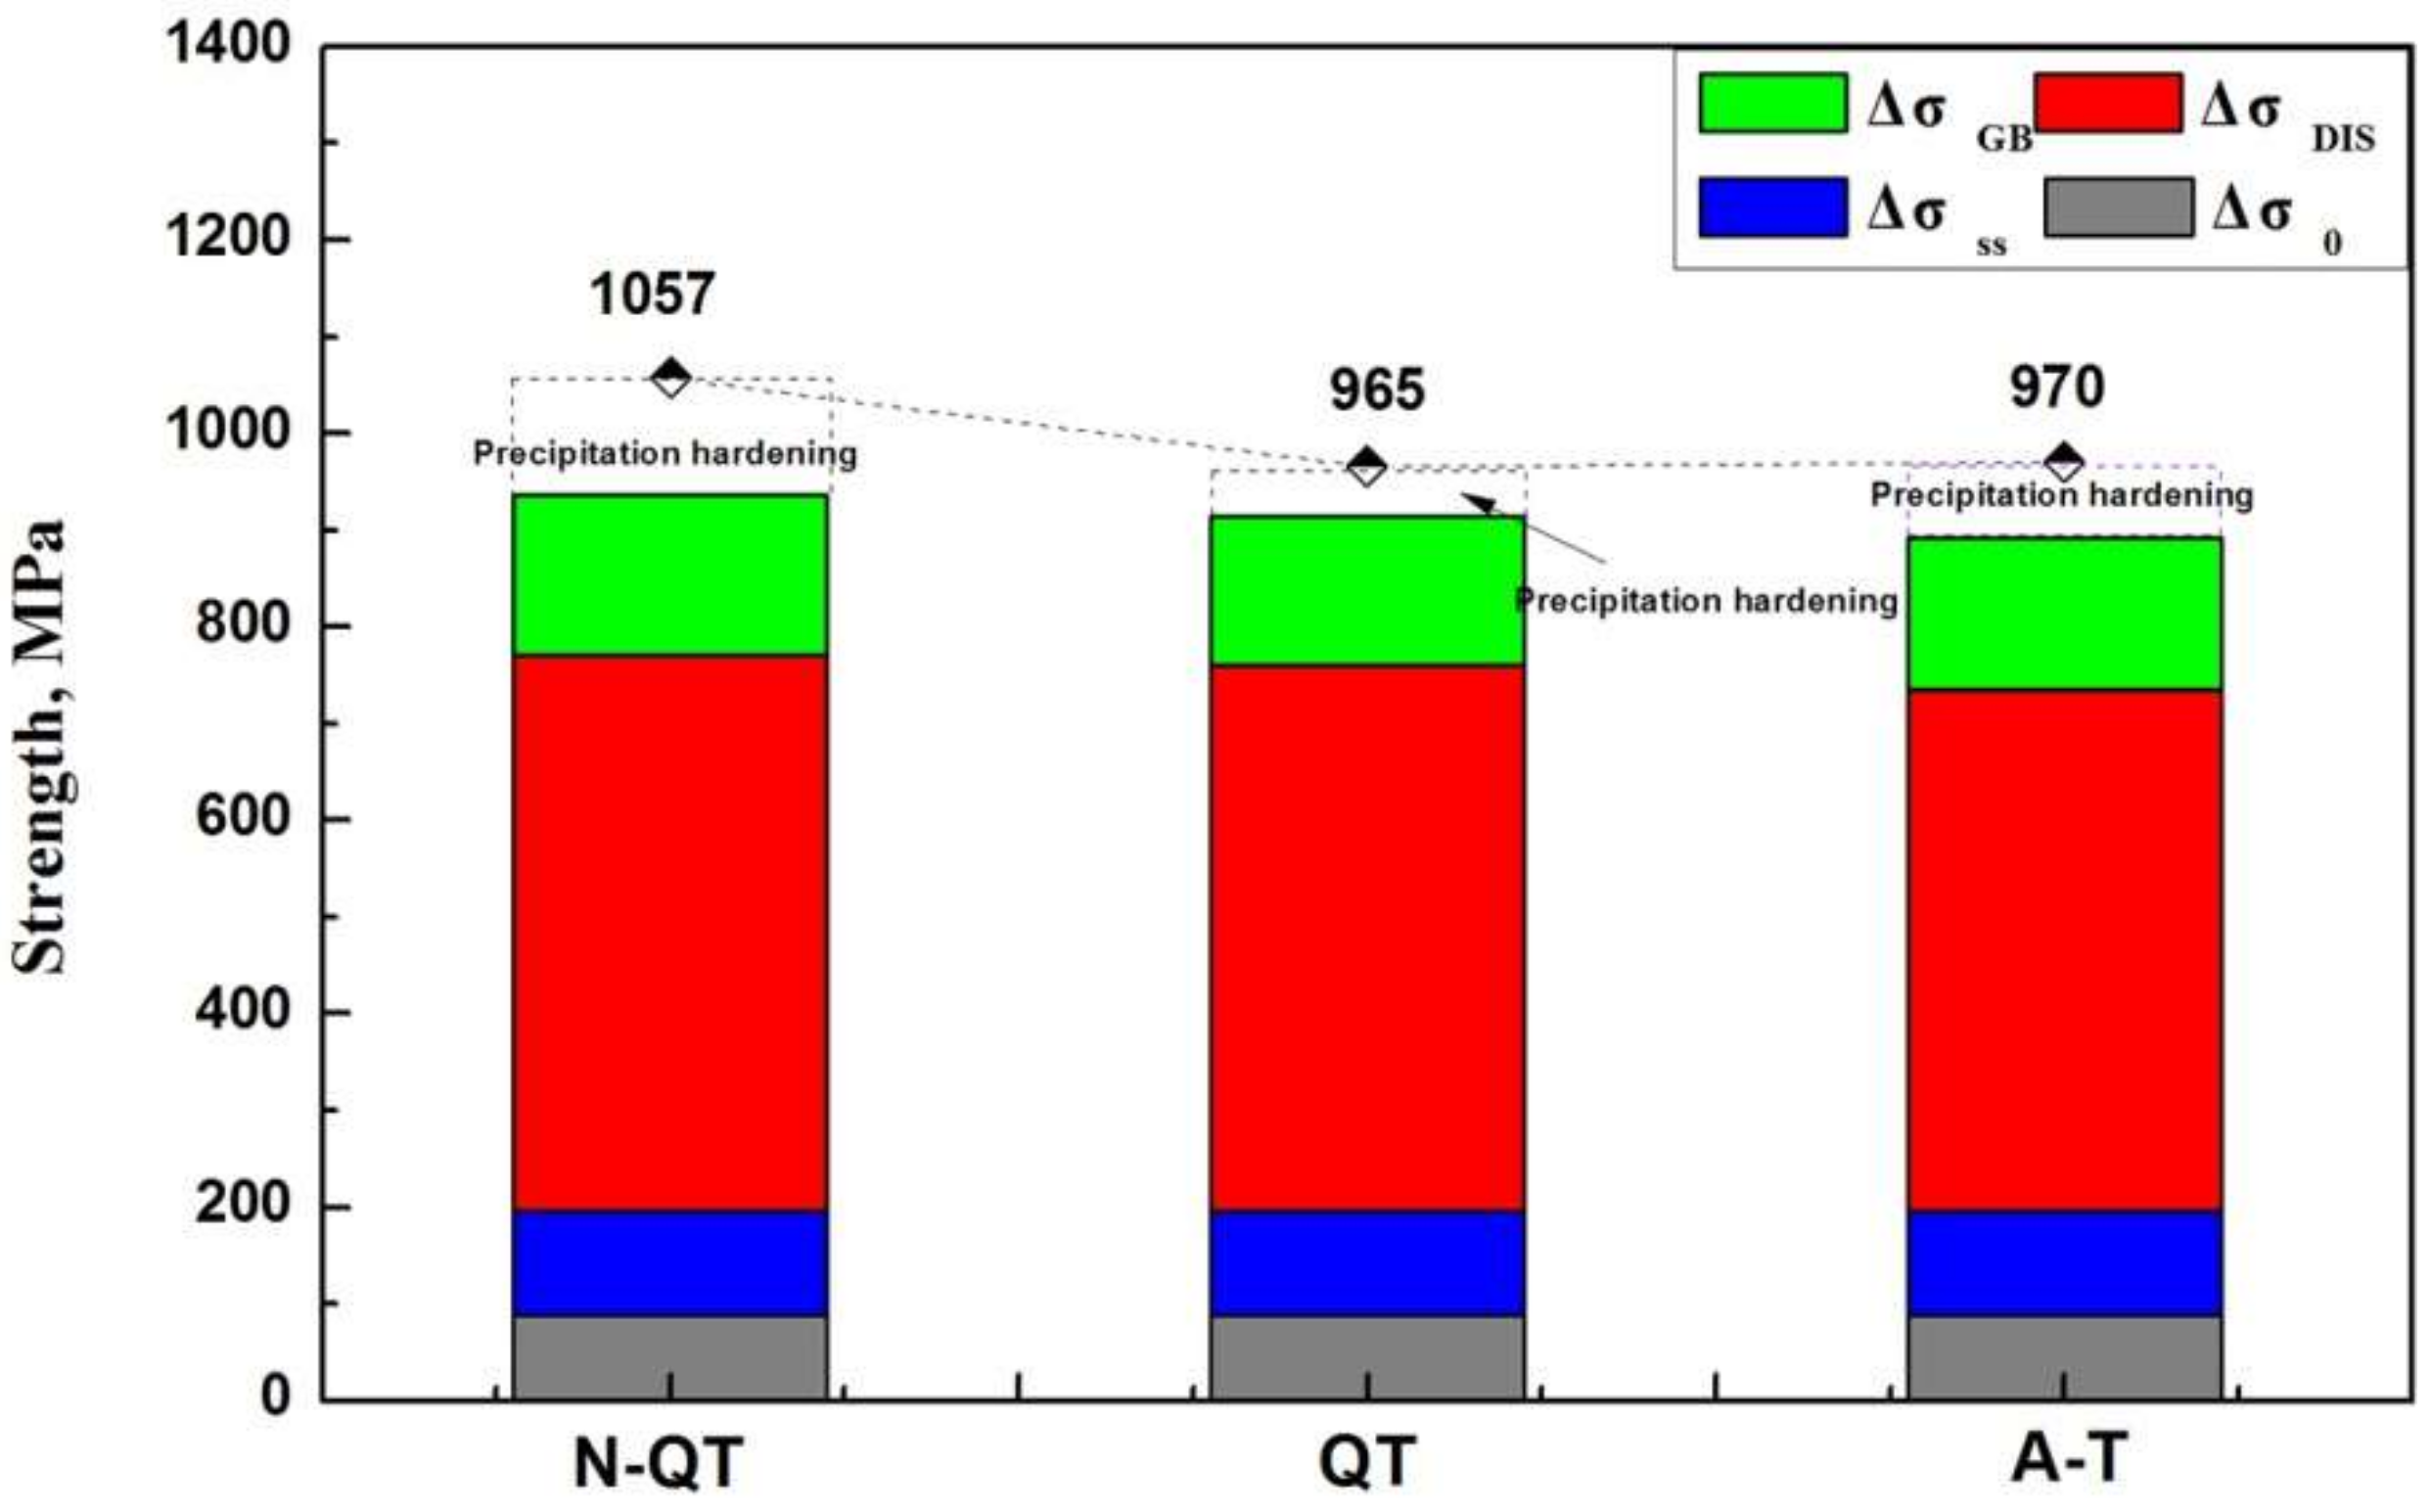
4.2. Strengthening Mechanism
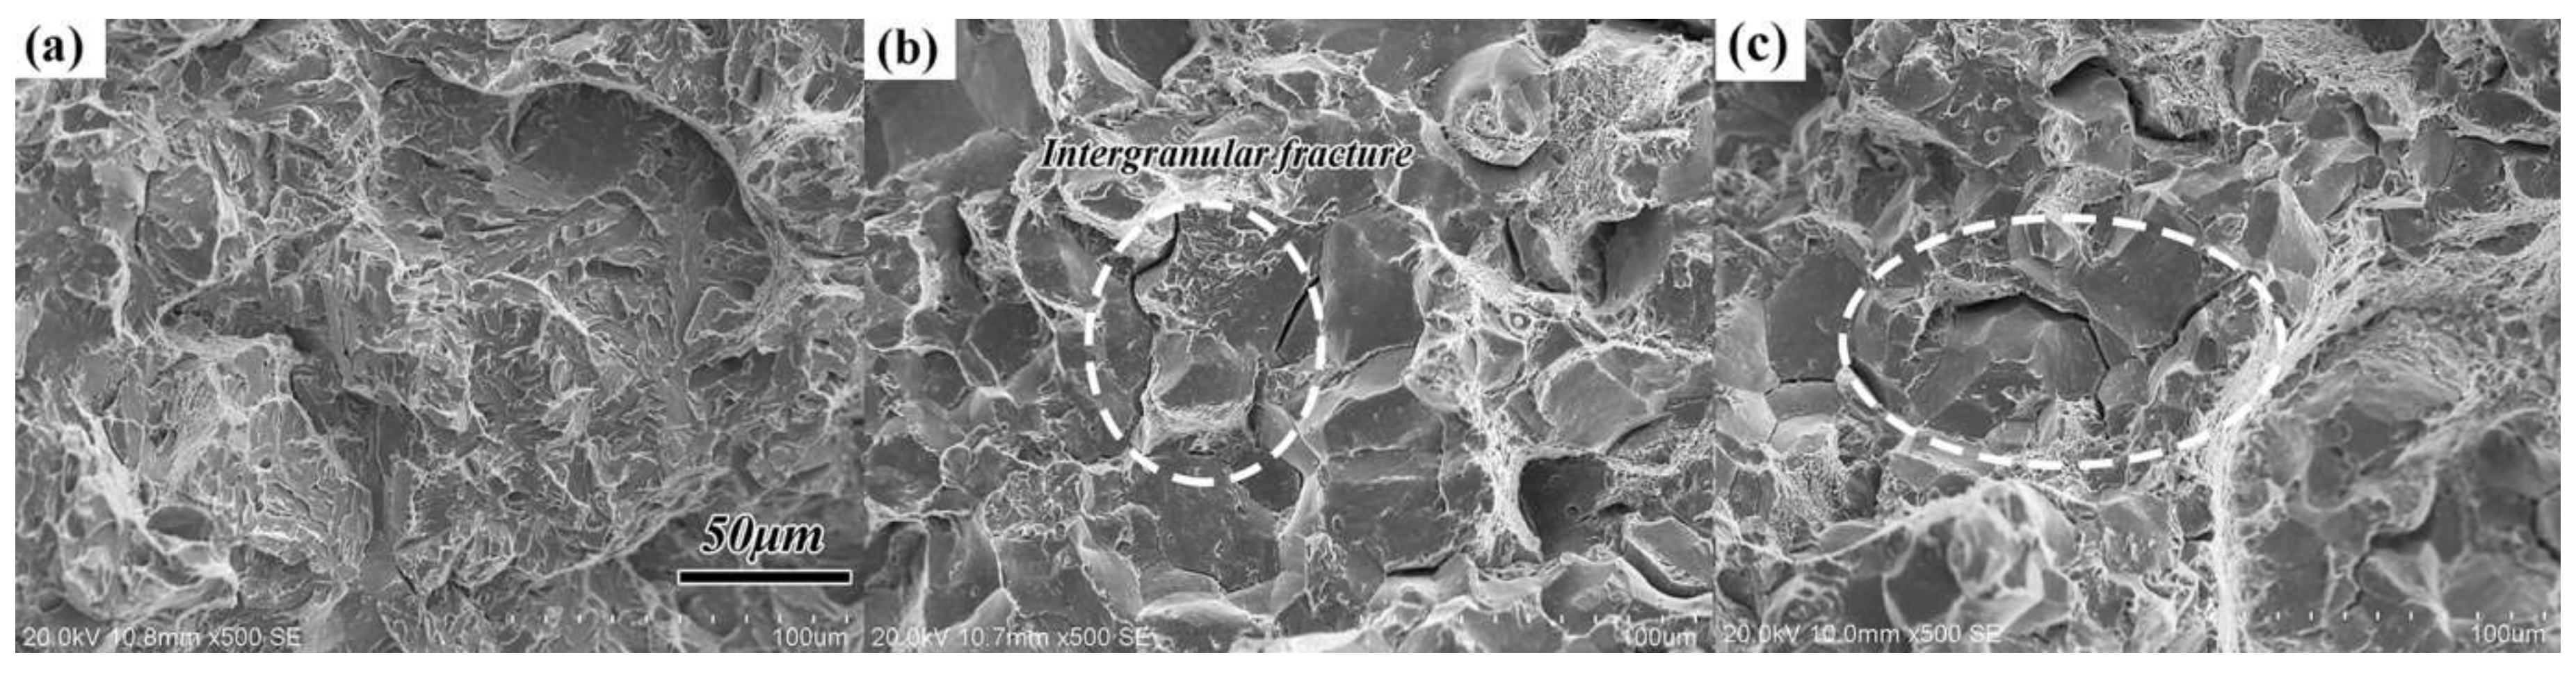
4.3. Impact Toughness
4.4. Selection of Optimal Heat Treatment Process
5. Conclusions
- (1)
- The specimens after N-QT treatment possessed the best strength-toughness combination and hardness uniformity compared with that of A-T and QT treatment. The microscopic element segregation, grain structure, the dislocation density, the precipitation carbides, and retained austenite were all responsible for the change of mechanical properties.
- (2)
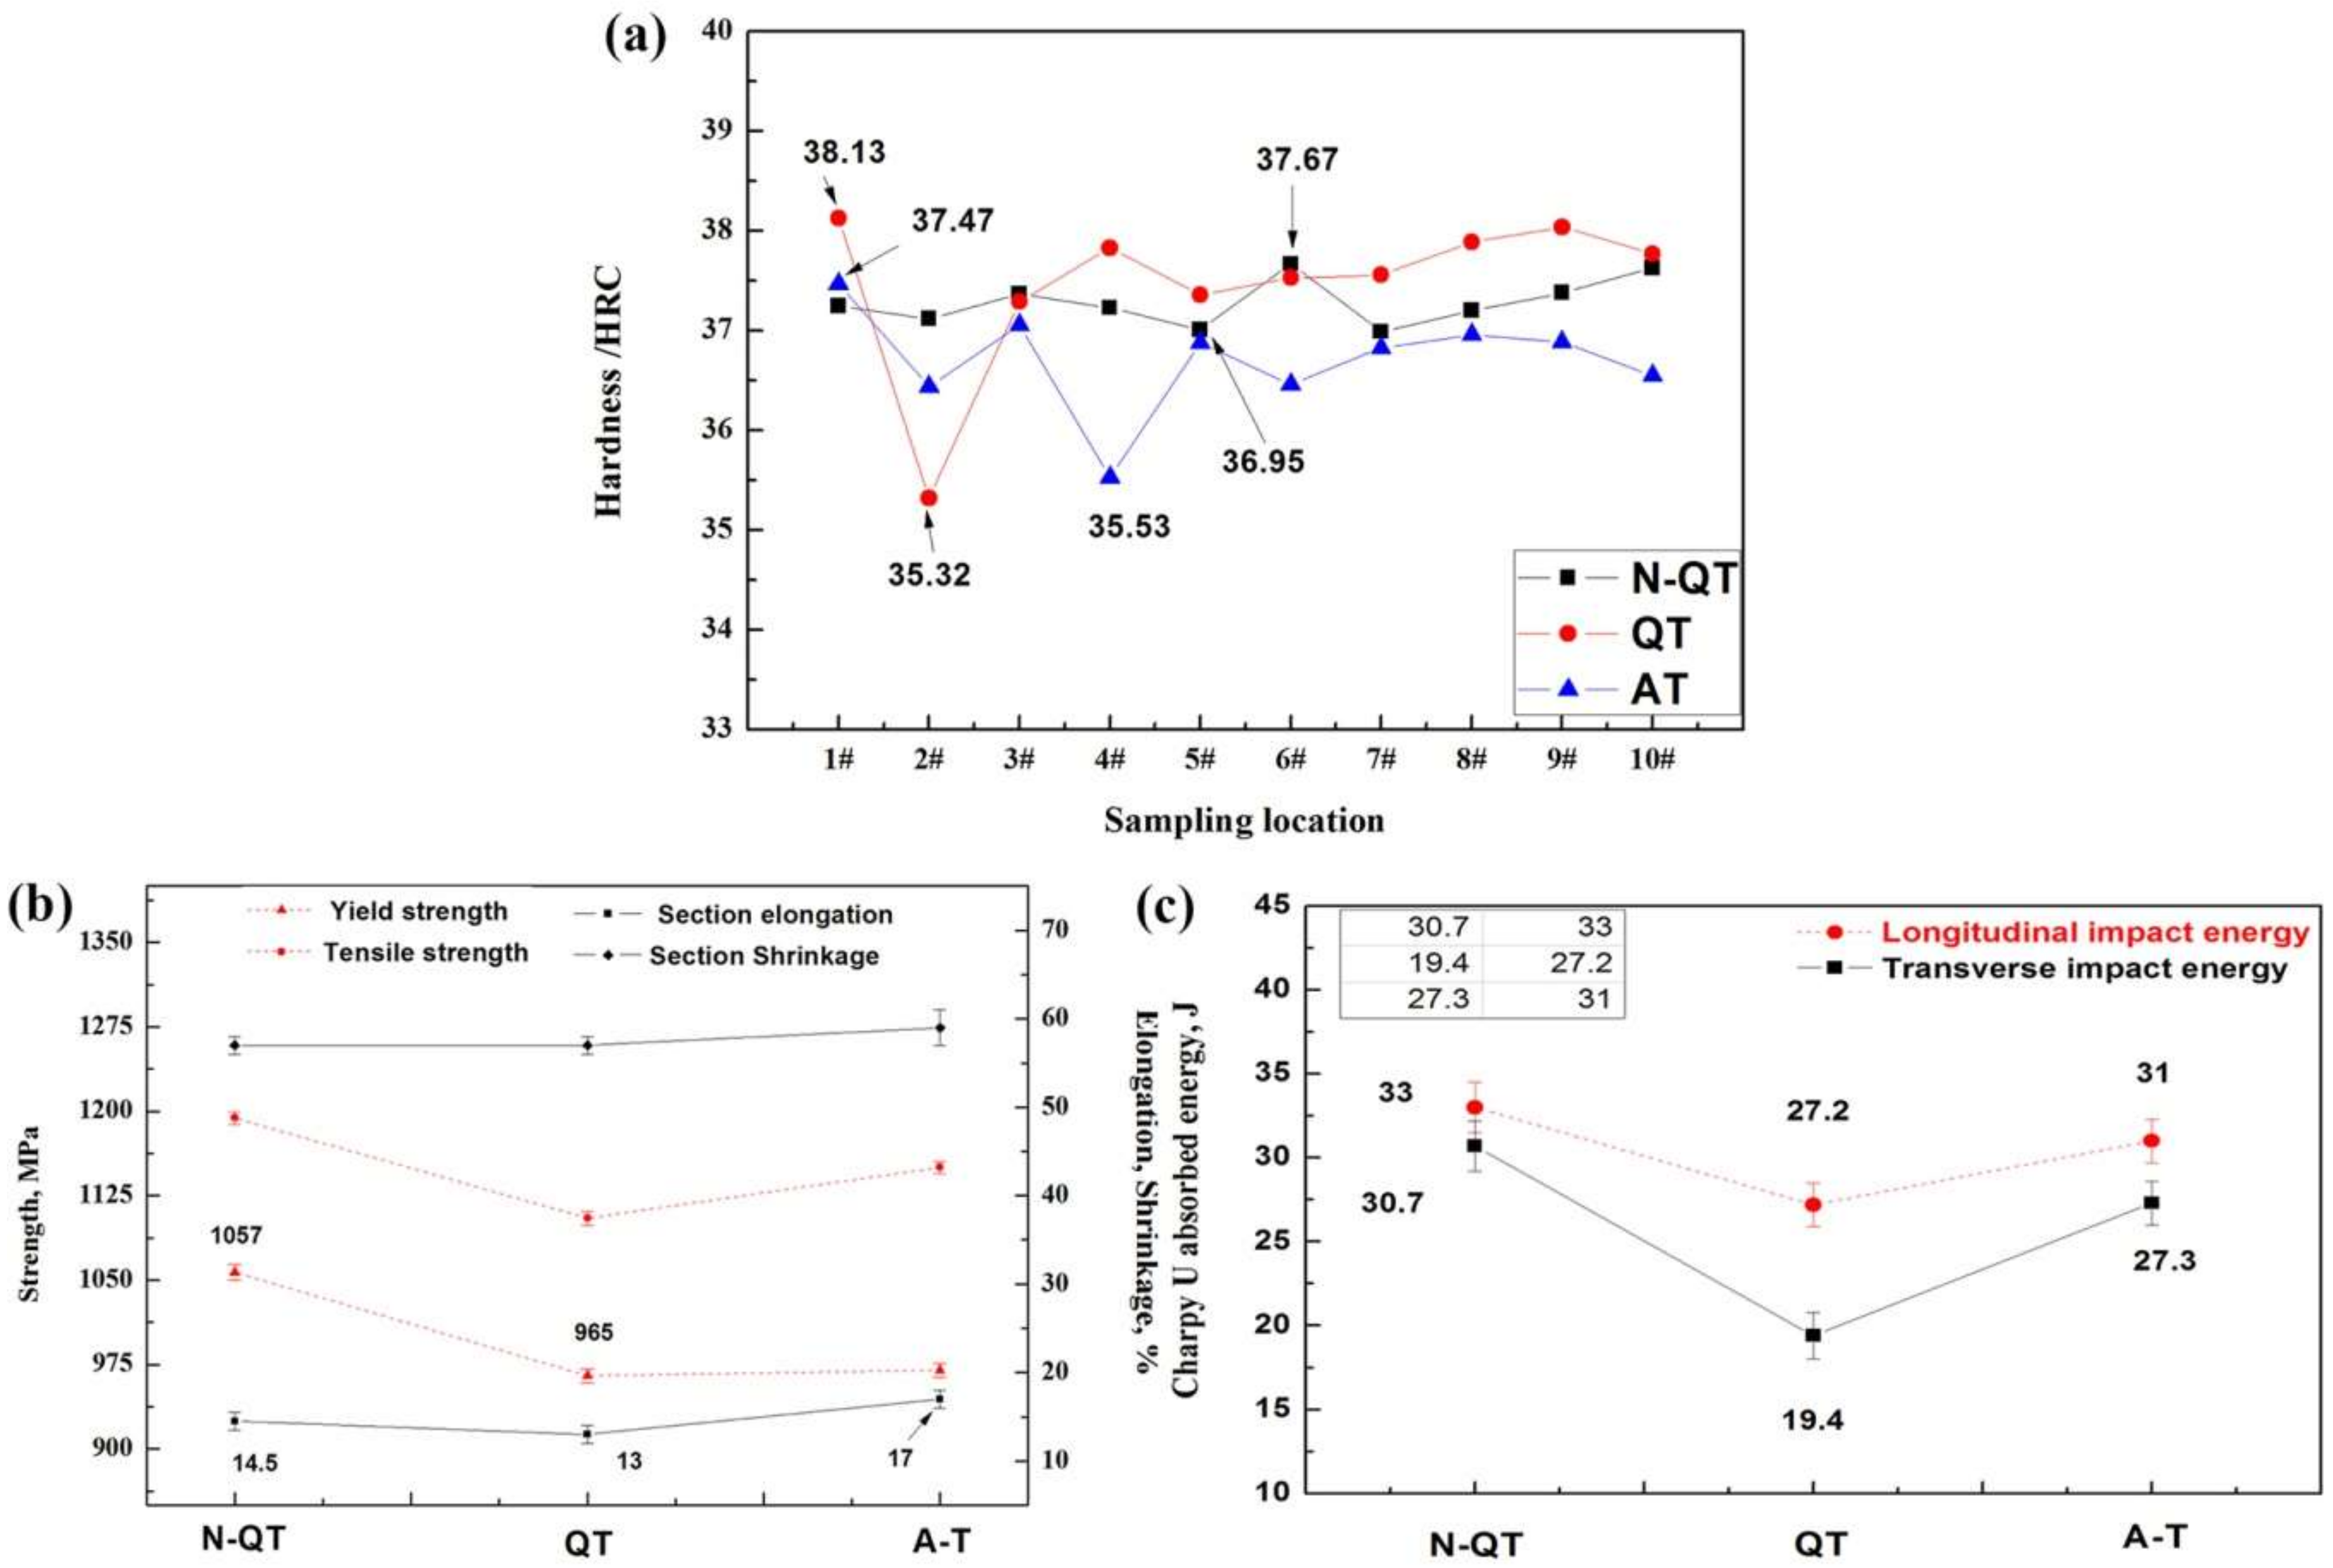
- The A-T treatment specimen possessed the worse hardness uniformity with a total deviation greater than 1.94 HRC compared with N-QT treatment. It was mostly attributed to the gap of microhardness between lower bainite and tempered martensite. In addition, the twinned martensite and retained austenite in the tempered microstructure also had a negative effect on the microhardness uniformity.
- (3)
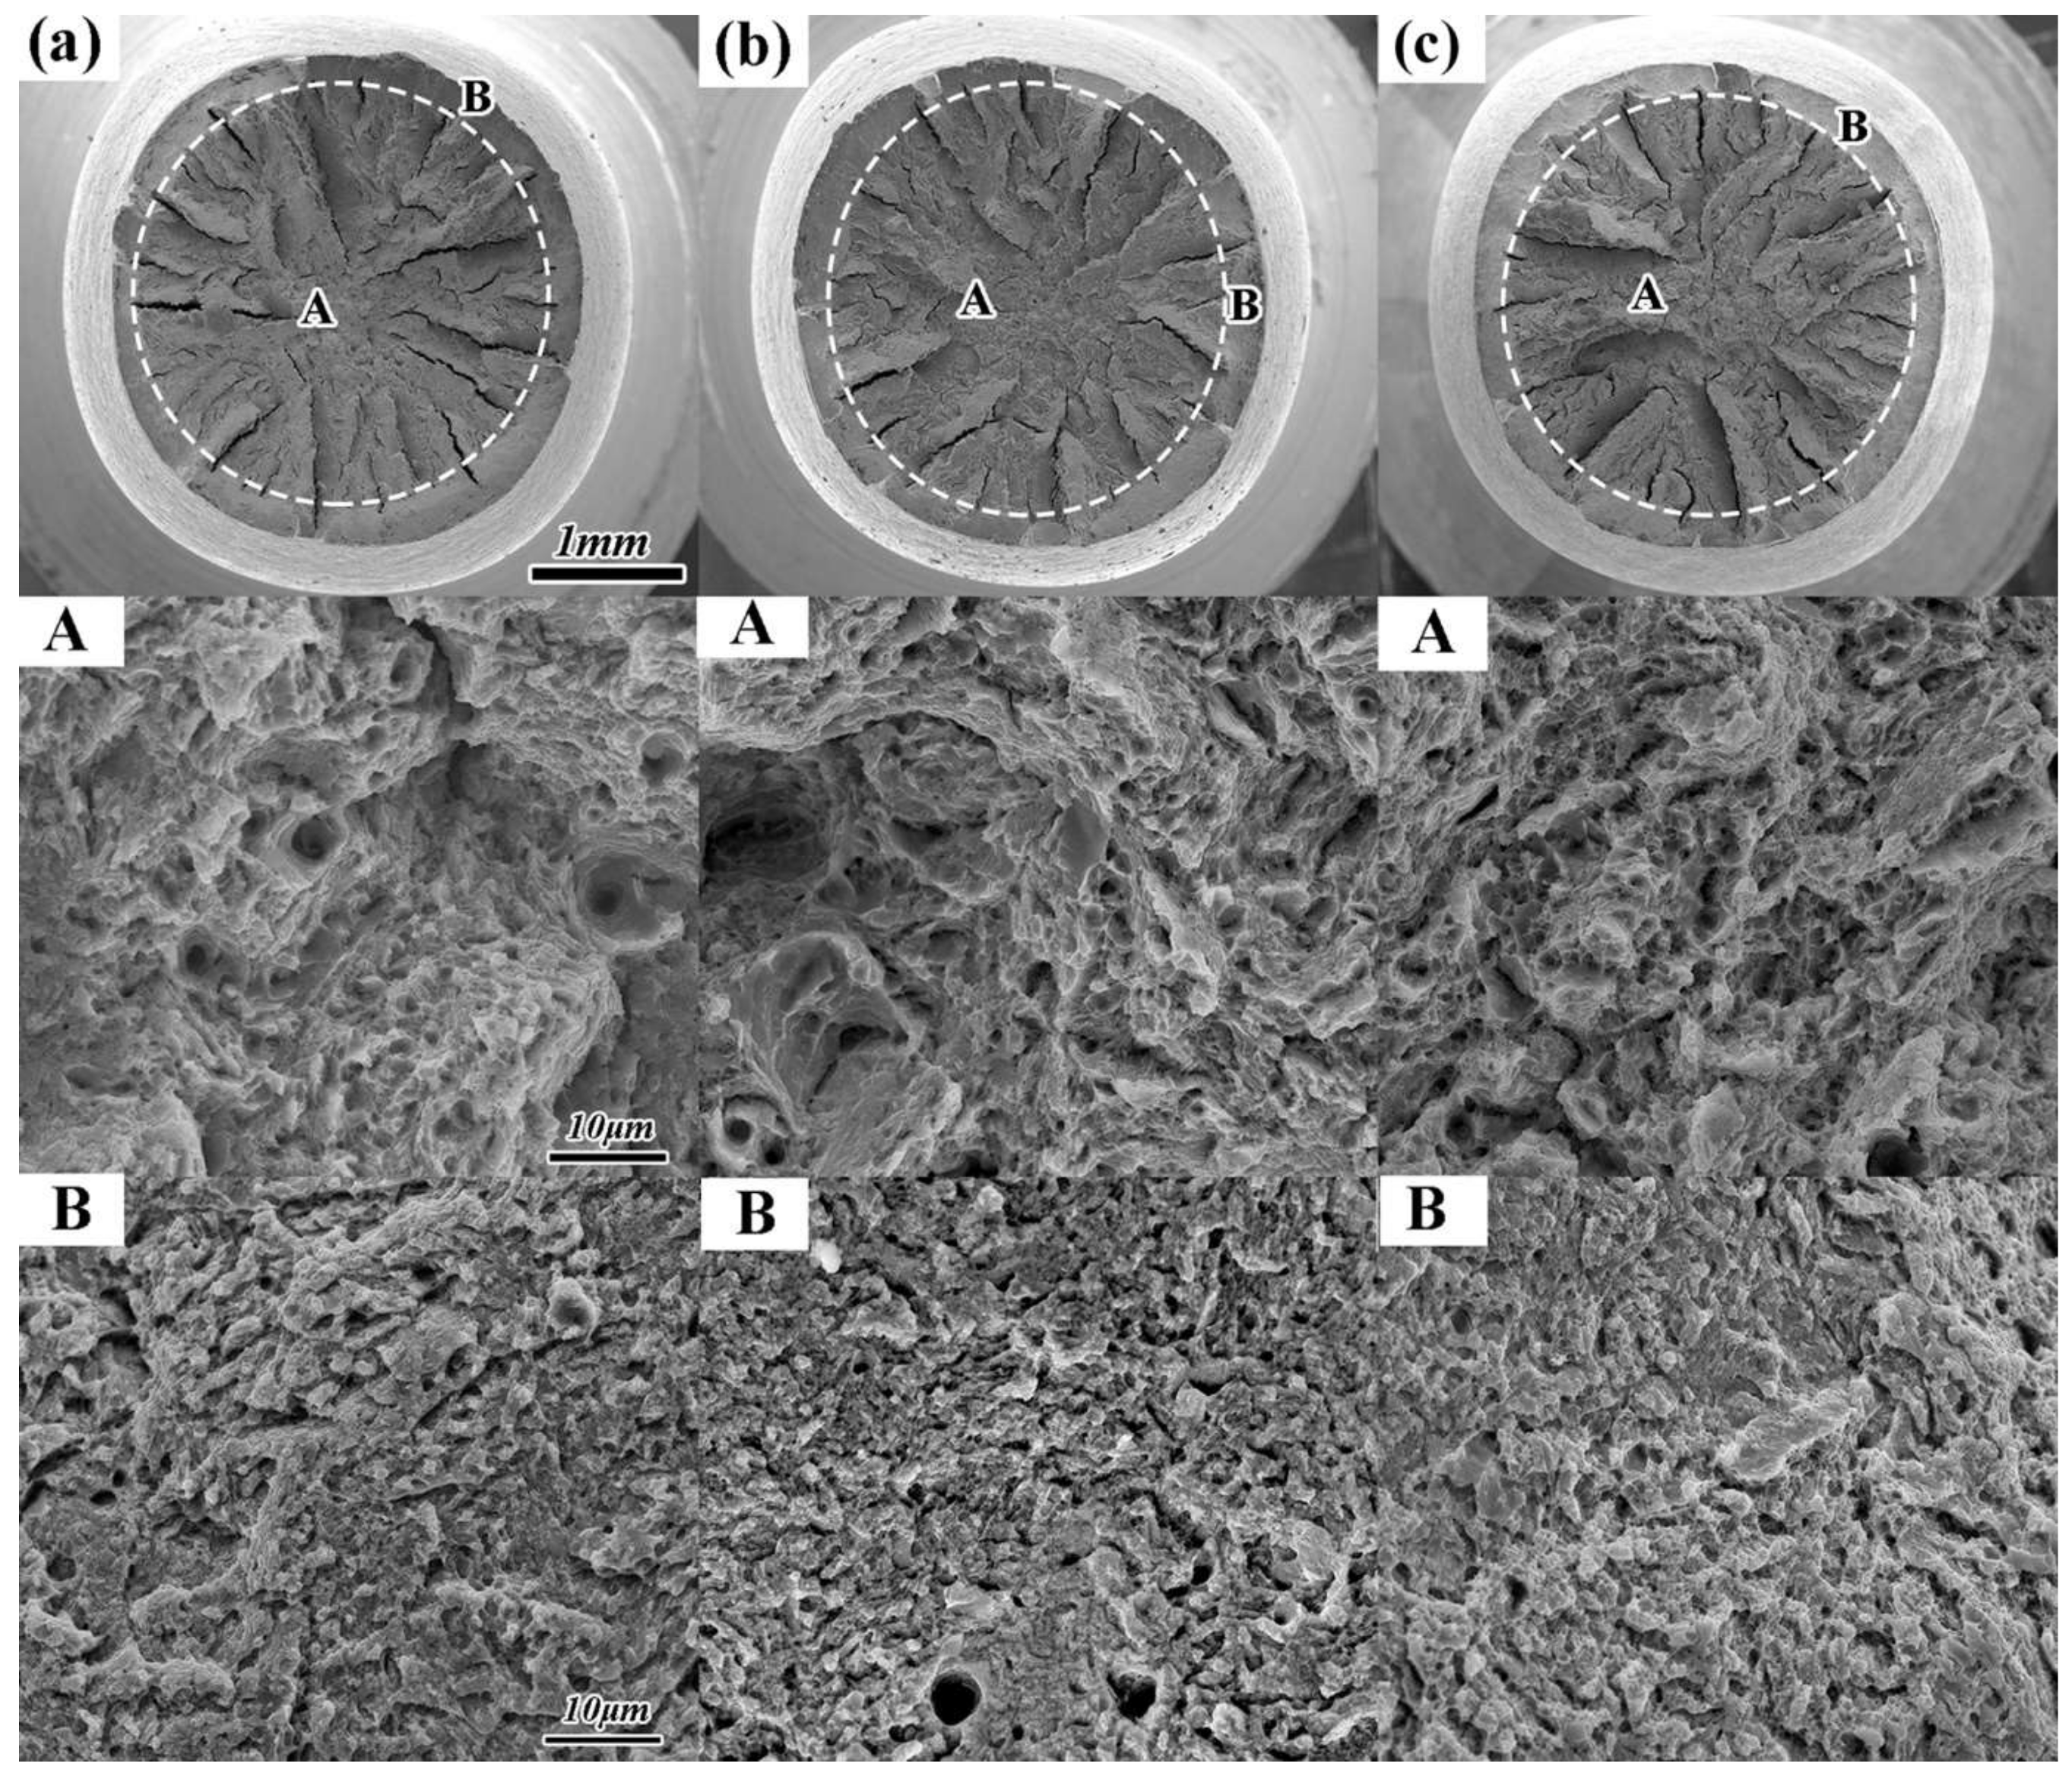
- The A-T treatment specimen showed relatively higher elongation (17%) compared with the specimens after N-QT (14.5%) and QT (13%) treatments. The ductility of A-T specimen mainly depended on the amount and morphology of retained austenite and thermal/deformation-induced twined martensite.
- (4)
- The reason for brittle intergranular failure of the impact specimens after QT and A-T treatments could be attributed to grain boundary weakening.
Acknowledgments
Author Contributions
Conflicts of Interest
References
- Wu, X.; Xu, L. New Products and Techniques of Mould Steels; Springer: Berlin/Heidelberg, Germany, 2011; pp. 423–441. [Google Scholar]
- Wu, R.; Li, J.; Su, Y.; Liu, S.; Yu, Z. Improved uniformity of hardness by continuous low temperature bainitic transformation in prehardened mold steel with large section. Mater. Sci. Eng. A 2017, 706, 15–21. [Google Scholar] [CrossRef]
- Wu, R.M.; Zheng, Y.F.; Wu, X.C.; Li, X.C. Effect of titanium on the microstructure and hardness uniformity of non-quenched and tempered prehardened steel for large-section plastic mould. Ironmak. Steelmak. 2016, 44, 17–22. [Google Scholar] [CrossRef]
- González, H.; Calleja, A.; Pereira, O.; Ortega, N.; Norberto López de Lacalle, L.; Barton, M. Super Abrasive Machining of Integral Rotary Components Using Grinding Flank Tools. Metals 2018, 8, 24. [Google Scholar] [CrossRef]
- Hoseiny, H.; Högman, B.; Klement, U.; Kinnander, A. Machinability evaluation of prehardened plastic mould steels. Int. J. Mach. Mach. Mater. 2012, 11, 355–364. [Google Scholar]
- Hoseiny, H.; Caballero, F.G.; Saoubi, R.M.; Högman, B.; Weidow, J.; Andrén, H.O. The Influence of Heat Treatment on the Microstructure and Machinability of a Prehardened Mold Steel. Metall. Mater. Trans. A 2015, 46, 2157–2171. [Google Scholar] [CrossRef]
- Luo, Y.; Wu, X.C.; Wang, H.B.; Min, Y.A. A comparative study on non-quenched and quenched prehardened steel for large section plastic mould. J. Mater. Process. Technol. 2009, 209, 5437–5442. [Google Scholar] [CrossRef]
- Firrao, D.; Matteis, P.; Spena, P.R.; Gerosa, R. Influence of the microstructure on fatigue and fracture toughness properties of large heat-treated mold steels. Mater. Sci. Eng. A 2013, 559, 371–383. [Google Scholar] [CrossRef]
- Firrao, D.; Matteis, P.; Scavino, G.; Ubertalli, G.; Ienco, M.G.; Pinasco, M.R.; Stagno, E.; Gerosa, R.; Rivolta, B.; Silvestri, A.; et al. Relationships between tensile and fracture mechanics properties and fatigue properties of large plastic mould steel blocks. Mater. Sci. Eng. A 2007, 468–470, 193–200. [Google Scholar] [CrossRef]
- Hoseiny, H.; Klement, U.; Sotskovszki, P.; Andersson, J. Comparison of the microstructures in continuous-cooled and quench-tempered pre-hardened mould steels. Mater. Des. 2011, 32, 21–28. [Google Scholar] [CrossRef]
- Liu, H.H.; Fu, P.X.; Liu, H.W.; Sun, C.; Ma, X.P.; Li, D.Z. Microstructure evolution and mechanical properties in 718H pre-hardened mold steel during tempering. Mater. Sci. Eng. A 2018, 709, 181–192. [Google Scholar] [CrossRef]
- Wen, X.L.; Mei, Z.; Jiang, B.; Zhang, L.C.; Liu, Y.Z. Effect of normalizing temperature on microstructure and mechanical properties of a Nb-V microalloyed large forging steel. Mater. Sci. Eng. A 2016, 671, 233–243. [Google Scholar] [CrossRef]
- Tu, M.Y.; Hsu, C.A.; Wang, W.H.; Hsu, Y.F. Comparison of microstructure and mechanical behavior of lower bainite and tempered martensite in JIS SK5 steel. Mater. Chem. Phys. 2008, 107, 418–425. [Google Scholar] [CrossRef]
- Kim, S.; Lee, Y. Effect of retained austenite phase on springback of cold-rolled TRIP steel sheets. Mater. Sci. Eng. A 2011, 530, 218–224. [Google Scholar] [CrossRef]
- Couturier, L.; Geuser, F.D.; Descoins, M.; Deschamps, A. Evolution of the microstructure of a 15-5PH martensitic stainless steel during precipitation hardening heat treatment. Mater. Des. 2016, 107, 416–425. [Google Scholar] [CrossRef]
- Dijk, N.H.V.; Butt, A.M.; Zhao, L.; Sietsma, J.; Offerman, S.E.; Wright, J.P.; Zwaag, V.D. Thermal stability of retained austenite in TRIP steels studied by synchrotron X-ray diffraction during cooling. Acta Mater. 2005, 53, 5439–5447. [Google Scholar]
- Li, X.L.; Wang, Z.D. Effect of one step Q&P process on microsturcture and mechanical properties of a dual martensite steel. Acta Metall. Sin. 2015, 51, 537–544. [Google Scholar]
- Bhadeshia, H.K.D.H. Bainite in Steels: Transformation, Microstructure and Properties; University of Cambridge Iom Communications: London, UK, 2001; Available online: http://www.phase-trans.msm.cam.ac.uk/2004/z/personal.pdf (accessed on 9 April 2018).
- Dong, J.; Zhou, X.; Liu, Y.; Li, C.; Liu, C.; Guo, Q. Carbide precipitation in Nb-V-Ti microalloyed ultra-high strength steel during tempering. Mater. Sci. Eng. A 2017, 683, 215–226. [Google Scholar] [CrossRef]
- Chen, J.; Zhang, W.; Liu, Z.; Wang, G. The Role of Retained Austenite on the Mechanical Properties of a Low Carbon 3Mn-1.5Ni Steel. Metall. Mater. Trans. A 2017, 48, 5849–5859. [Google Scholar] [CrossRef]
- Zhang, K.; Zhang, M.; Guo, Z.; Chen, N.; Rong, Y. A new effect of retained austenite on ductility enhancement in high-strength quenching–partitioning–tempering martensitic steel. Mater. Sci. Eng. A 2011, 528, 8486–8491. [Google Scholar] [CrossRef]
- Gao, G.; An, B.; Zhang, H.; Guo, H.; Gui, X.; Bai, B. Concurrent enhancement of ductility and toughness in an ultrahigh strength lean alloy steel treated by bainite-based quenching-partitioning-tempering process. Mater. Sci. Eng. A 2017, 702, 104–112. [Google Scholar] [CrossRef]
- Zhang, J.; Wang, F.M.; Yang, Z.B.; Li, C.R. Microstructure, Precipitation, and Mechanical Properties of V-N-Alloyed Steel After Different Cooling Processes. Metall. Mater. Trans. A 2016, 47, 6621–6631. [Google Scholar] [CrossRef]
- Chen, J.; Lv, M.Y.; Tang, S.; Liu, Z.Y.; Wang, G.D. Influence of cooling paths on microstructural characteristics and precipitation behaviors in a low carbon V–Ti microalloyed steel. Mater. Sci. Eng. A 2014, 594, 389–393. [Google Scholar] [CrossRef]
- Bouquerel, J.; Verbeken, K.; Cooman, B.D. Microstructure-based model for the static mechanical behaviour of multiphase steels. Acta Mater. 2006, 54, 1443–1456. [Google Scholar] [CrossRef]
- Yen, H.W.; Chen, P.Y.; Huang, C.Y.; Yang, J.R. Interphase precipitation of nanometer-sized carbides in a titanium–molybdenum-bearing low-carbon steel. Acta Mater. 2011, 59, 6264–6274. [Google Scholar] [CrossRef]
- Halfa, H. Recent Trends in Producing Ultrafine Grained Steels. J. Miner. Mater. Charact. Eng. 2014, 2, 428–469. [Google Scholar] [CrossRef]
- Cheng, X.Y.; Zhang, H.X.; Li, H.; Shen, H.P. Effect of tempering temperature on the microstructure and mechanical properties in mooring chain steel. Mater. Sci. Eng. A 2015, 636, 164–171. [Google Scholar] [CrossRef]
- Kim, B.; Boucard, E.; Sourmail, T.; Martín, D.S.; Gey, N.; Rivera-Díaz-del-Castillo, P.E.J. Understanding the microstructure–properties relationship in 0.5–0.6 wt % C steels. Acta Mater. 2014, 68, 169–178. [Google Scholar] [CrossRef]
- Daigne, J.; Guttmann, M.; Naylor, J.P. The influence of lath boundaries and carbide distribution on the yield strength of 0.4% C tempered martensitic steels. Mater. Sci. Eng. 1982, 56, 1–10. [Google Scholar] [CrossRef]
- Shibata, A.; Nagoshi, T.; Sone, M.; Morito, S.; Higo, Y. Evaluation of the block boundary and sub-block boundary strengths of ferrous lath martensite using a micro-bending test. Mater. Sci. Eng. A 2010, 527, 7538–7544. [Google Scholar] [CrossRef]
- Wang, J.S.; Mulholland, M.D.; Olson, G.B.; Seidman, D.N. Prediction of the yield strength of a secondary-hardening steel. Acta Mater. 2013, 61, 4939–4952. [Google Scholar] [CrossRef]
- Qin, S.; Liu, Y.; Hao, Q.; Wang, Y.; Chen, N.L.; Zuo, X.W.; Rong, Y.H. The Mechanism of High Ductility for Novel High-Carbon Quenching–Partitioning–Tempering Martensitic Steel. Metall. Mater. Trans. A 2015, 46, 4047–4055. [Google Scholar] [CrossRef]
- Chen, J.D.; Mo, W.L.; Wang, P.; Lu, S.P. Effects of tempering temperature on the impact toughness of steel 42CrMo. Acta Metall. Sin. 2012, 48, 1186–1193. [Google Scholar] [CrossRef]
- Soto, R.; Saikaly, W.; Bano, X.; Issartel, C.; Rigaut, G.; Charai, A. Statistical and theoretical analysis of precipitates in dual-phase steels microalloyed with titanium and their effect on mechanical properties. Acta Mater. 1999, 47, 3475–3481. [Google Scholar] [CrossRef]
- Gladman, T.; Dulieu, D.; Mivor, I.D. Proc. Int. Conf. on High Strength Low Alloy Steels—Microalloying 75; Union Carbide Corporation: New York, NY, USA, 1977; pp. 32–55. [Google Scholar]
- Cao, J.C.; Yong, Q.L.; Liu, Q.Y.; Sun, X. Precipitation of MC phase and precipitation strengthening in hot rolled Nb–Mo and Nb–Ti steels. J. Mater. Sci. 2007, 42, 10080–10084. [Google Scholar] [CrossRef]
- Gao, G.H.; Zhang, H.; Gui, X.L.; Luo, P.; Tan, Z.L.; Bai, B.Z. Enhanced ductility and toughness in an ultrahigh-strength Mn–Si–Cr–C steel: The great potential of ultrafine filmy retained austenite. Acta Mater. 2014, 76, 425–433. [Google Scholar] [CrossRef]
- Nakada, N.; Mizutani, K.; Tsuchiyama, T.; Takaki, S. Difference in transformation behavior between ferrite and austenite formations in medium manganese steel. Acta Mater. 2014, 65, 251–258. [Google Scholar] [CrossRef]
- Chen, J.; Lv, M.Y.; Tang, S.; Liu, Z.; Wang, G. Correlation between mechanical properties and retained austenite characteristics in a low-carbon medium manganese alloyed steel plate. Mater. Charact. 2015, 106, 108–111. [Google Scholar] [CrossRef]
- Chen, J.; Lv, M.Y.; Liu, Z.Y.; Wang, G.D. Influence of Heat Treatments on the Microstructural Evolution and Resultant Mechanical Properties in a Low Carbon Medium Mn Heavy Steel Plate. Metall. Mater. Trans. A 2016, 47, 2300–2312. [Google Scholar] [CrossRef]
- Nakada, N.; Tsuchiyama, T.; Takaki, S.; Miyano, N. Temperature Dependence of Austenite Nucleation Behavior from Lath Martensite. ISIJ Int. 2011, 51, 299–304. [Google Scholar] [CrossRef]
- Xiong, X.C.; Chen, B.; Huang, M.X.; Wang, J.F.; Wang, L. The effect of morphology on the stability of retained austenite in a quenched and partitioned steel. Scr. Mater. 2013, 68, 321–324. [Google Scholar] [CrossRef]
- Li, Y.J.; Li, X.L.; Yuan, G.; Kang, J.; Chen, D.; Wang, G.D. Microstructure and partitioning behavior characteristics in low carbon steels treated by hot-rolling direct quenching and dynamical partitioning processes. Mater. Charact. 2016, 121, 157–165. [Google Scholar] [CrossRef]
- Slycken, J.V.; Verleysen, P.; Degrieck, J.; Samek, L.; Cooman, B.C.D. High-strain-rate behavior of low-alloy multiphase aluminum- and silicon-based transformation-induced plasticity steels. Metall. Mater. Trans. A 2006, 37, 1527–1539. [Google Scholar] [CrossRef]
- Curtze, S.; Kuokkala, V.T.; Hokka, M.; Peura, P. Deformation behavior of TRIP and DP steels in tension at different temperatures over a wide range of strain rates. Mater. Sci. Eng. A 2009, 507, 124–131. [Google Scholar] [CrossRef]
- Hao, Q.; Qin, S.; Liu, Y.; Zuo, X.W.; Chen, N.L.; Huang, W.; Rong, Y.H. Effect of retained austenite on the dynamic tensile behavior of a novel quenching-partitioning-tempering martensitic steel. Mater. Sci. Eng. A 2016, 662, 16–25. [Google Scholar] [CrossRef]
- Sohn, S.S.; Hong, S.; Lee, J.; Sun, B.C.; Kim, S.K.; Lee, B.J.; Kim, N.J.; Lee, S. Effects of Mn and Al contents on cryogenic-temperature tensile and Charpy impact properties in four austenitic high-Mn steels. Acta Mater. 2015, 100, 39–52. [Google Scholar] [CrossRef]
- Seo, E.J.; Cho, L.; Estrin, Y.; Cooman, B.C.D. Microstructure-mechanical properties relationships for quenching and partitioning (Q&P) processed steel. Acta Mater. 2016, 113, 124–139. [Google Scholar]
- Li, Y.J.; Kang, J.; Zhang, W.N.; Liu, D.; Wang, X.H.; Yuan, G.; Misra, R.D.K.; Wang, G.D. A novel phase transition behavior during dynamic partitioning and analysis of retained austenite in quenched and partitioned steels. Mater. Sci. Eng. A 2018, 710, 181–191. [Google Scholar] [CrossRef]
- Podder, A.S.; Bhadeshia, H.K.D.H. Thermal stability of austenite retained in bainitic steels. Mater. Sci. Eng. A 2010, 527, 2121–2128. [Google Scholar] [CrossRef]
- Wang, K.; Tan, Z.; Gu, K.; Gao, B.; Gao, G.H.; Misra, R.D.K.; Bai, B.Z. Effect of deep cryogenic treatment on structure-property relationship in an ultrahigh strength Mn-Si-Cr bainite/martensite multiphase rail steel. Mater. Sci. Eng. A 2017, 684, 559–566. [Google Scholar] [CrossRef]
- Liu, J.; Yu, H.; Zhou, T.; Song, C.; Zhang, K. Effect of double quenching and tempering heat treatment on the microstructure and mechanical properties of a novel 5Cr steel processed by electro-slag casting. Mater. Sci. Eng. A 2014, 619, 212–220. [Google Scholar] [CrossRef]
- Morito, S.; Tanaka, H.; Konishi, R.; Furuhara, T.; Maki, T. The morphology and crystallography of lath martensite in Fe-C alloys. Acta Mater. 2003, 51, 1789–1799. [Google Scholar] [CrossRef]
- Guan, Q.; Jiang, Q.; Fang, J.; Jiang, H. Microstructures and Thermal Fatigue Behavior of Cr-Ni-Mo Hot Work Die Steel Modified by Rare Earth. ISIJ Int. 2003, 43, 784–789. [Google Scholar] [CrossRef][Green Version]
- Wang, X.D.; Guo, Z.H.; Rong, Y.H. Mechanism exploration of an ultrahigh strength steel by quenching–partitioning–tempering process. Mater. Sci. Eng. A 2011, 529, 35–40. [Google Scholar] [CrossRef]
- Bai, Y.; Momotani, Y.; Chen, M.C.; Shibata, A.; Tsuji, N. Effect of grain refinement on hydrogen embrittlement behaviors of high-Mn TWIP steel. Mater. Sci. Eng. A 2016, 651, 935–944. [Google Scholar] [CrossRef]
- Krajnik, P.; Kopač, J. Modern machining of die and mold tools. J. Mater. Process. Technol. 2004, 157, 543–552. [Google Scholar] [CrossRef]


| C | Si | Mn | Cr | Ni | Mo | P | S | Al |
|---|---|---|---|---|---|---|---|---|
| 0.34 | 0.33 | 1.56 | 2.06 | 1.04 | 0.20 | 0.016 | 0.005 | 0.017 |
© 2018 by the authors. Licensee MDPI, Basel, Switzerland. This article is an open access article distributed under the terms and conditions of the Creative Commons Attribution (CC BY) license (http://creativecommons.org/licenses/by/4.0/).
Share and Cite
Liu, H.; Fu, P.; Liu, H.; Li, D. Improvement of Strength-Toughness-Hardness Balance in Large Cross-Section 718H Pre-Hardened Mold Steel. Materials 2018, 11, 583. https://doi.org/10.3390/ma11040583
Liu H, Fu P, Liu H, Li D. Improvement of Strength-Toughness-Hardness Balance in Large Cross-Section 718H Pre-Hardened Mold Steel. Materials. 2018; 11(4):583. https://doi.org/10.3390/ma11040583
Chicago/Turabian StyleLiu, Hanghang, Paixian Fu, Hongwei Liu, and Dianzhong Li. 2018. "Improvement of Strength-Toughness-Hardness Balance in Large Cross-Section 718H Pre-Hardened Mold Steel" Materials 11, no. 4: 583. https://doi.org/10.3390/ma11040583
APA StyleLiu, H., Fu, P., Liu, H., & Li, D. (2018). Improvement of Strength-Toughness-Hardness Balance in Large Cross-Section 718H Pre-Hardened Mold Steel. Materials, 11(4), 583. https://doi.org/10.3390/ma11040583