Corrosion Development of Carbon Steel Grids and Shear Connectors in Cracked Composite Beams Exposed to Wet–Dry Cycles in Chloride Environment


Abstract
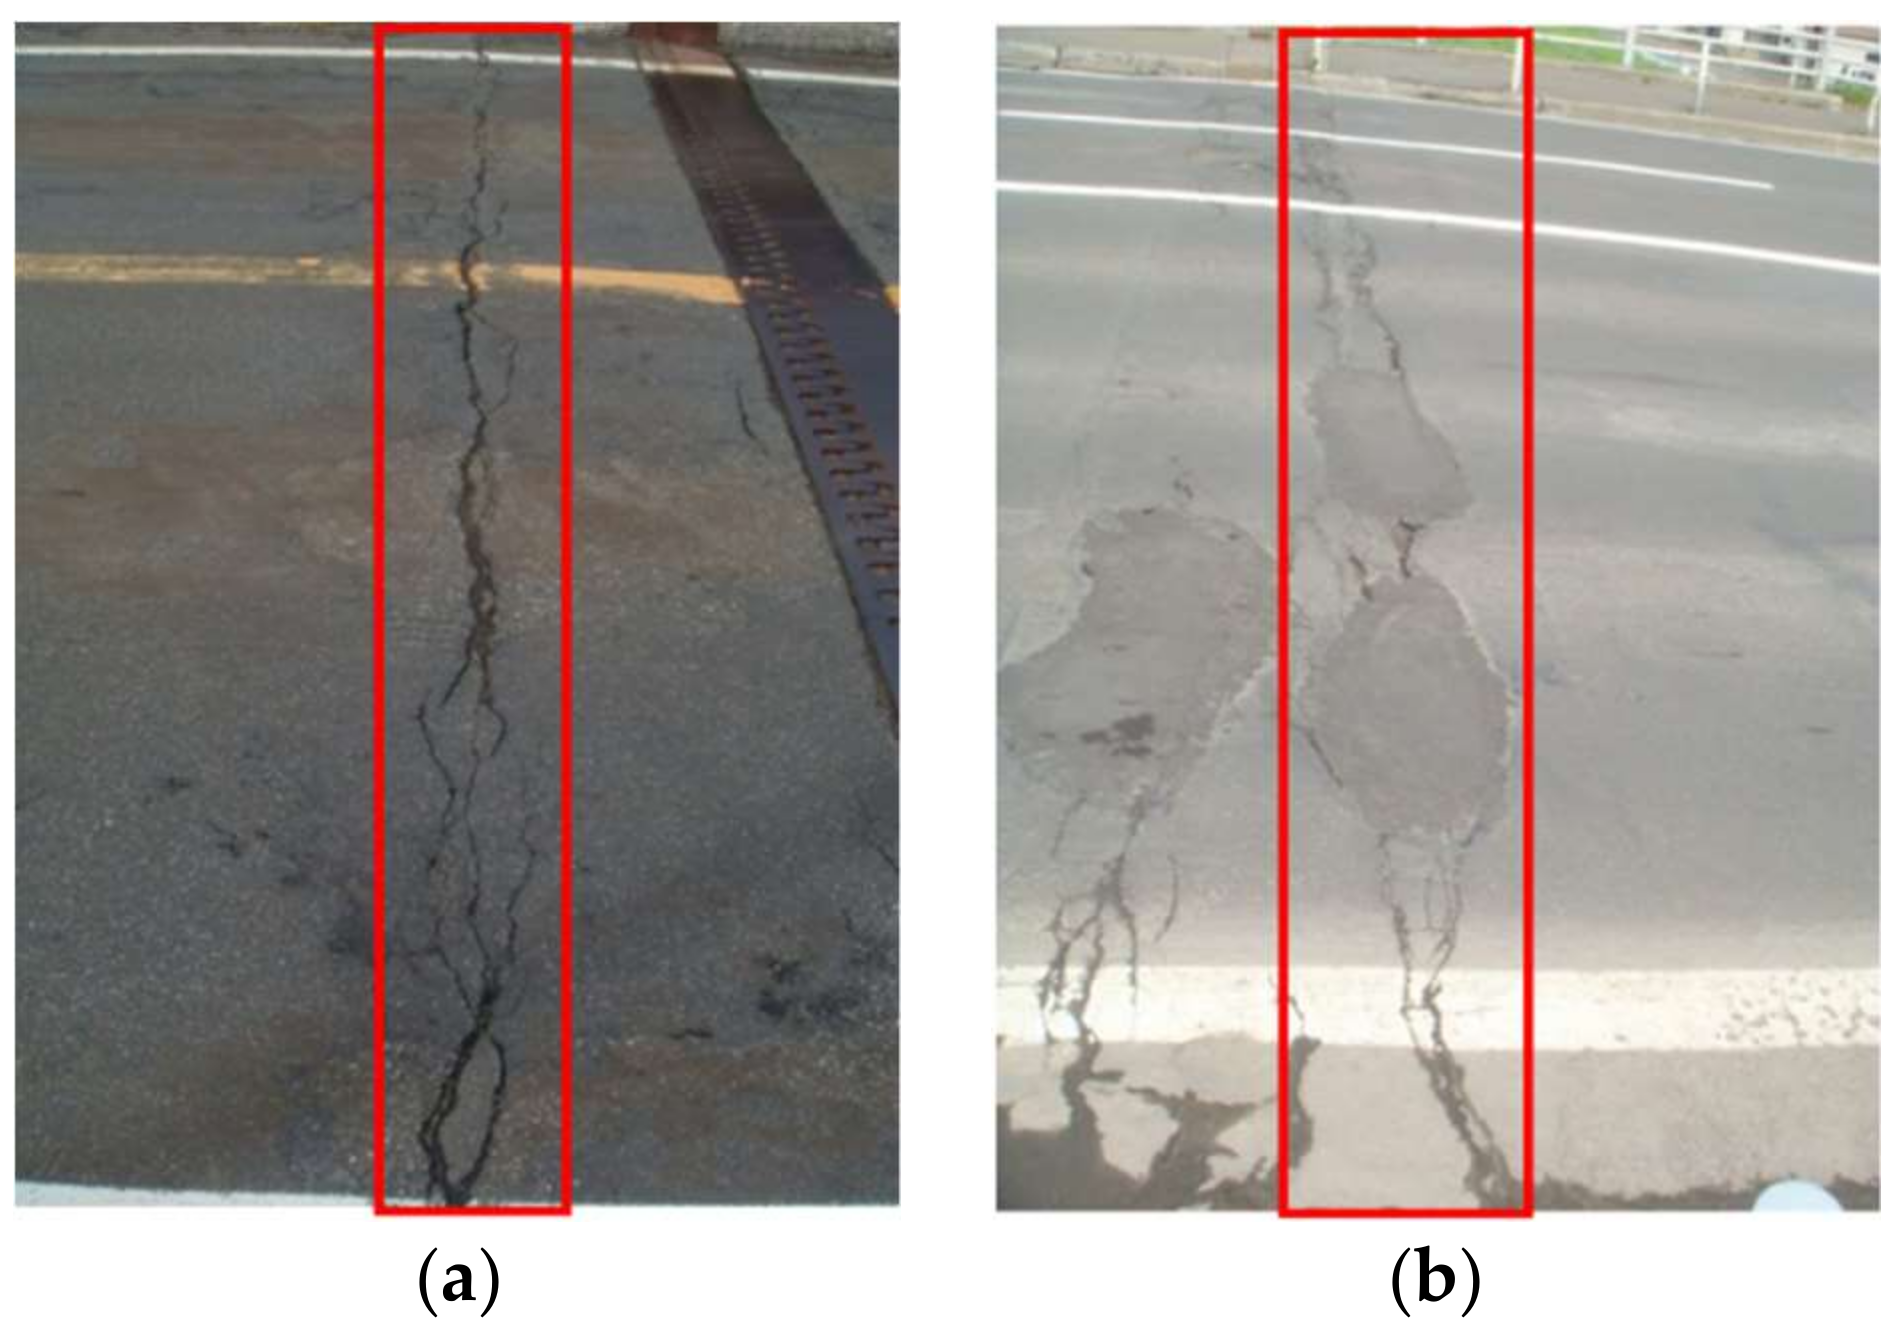
:1. Introduction
2. Experimental Section
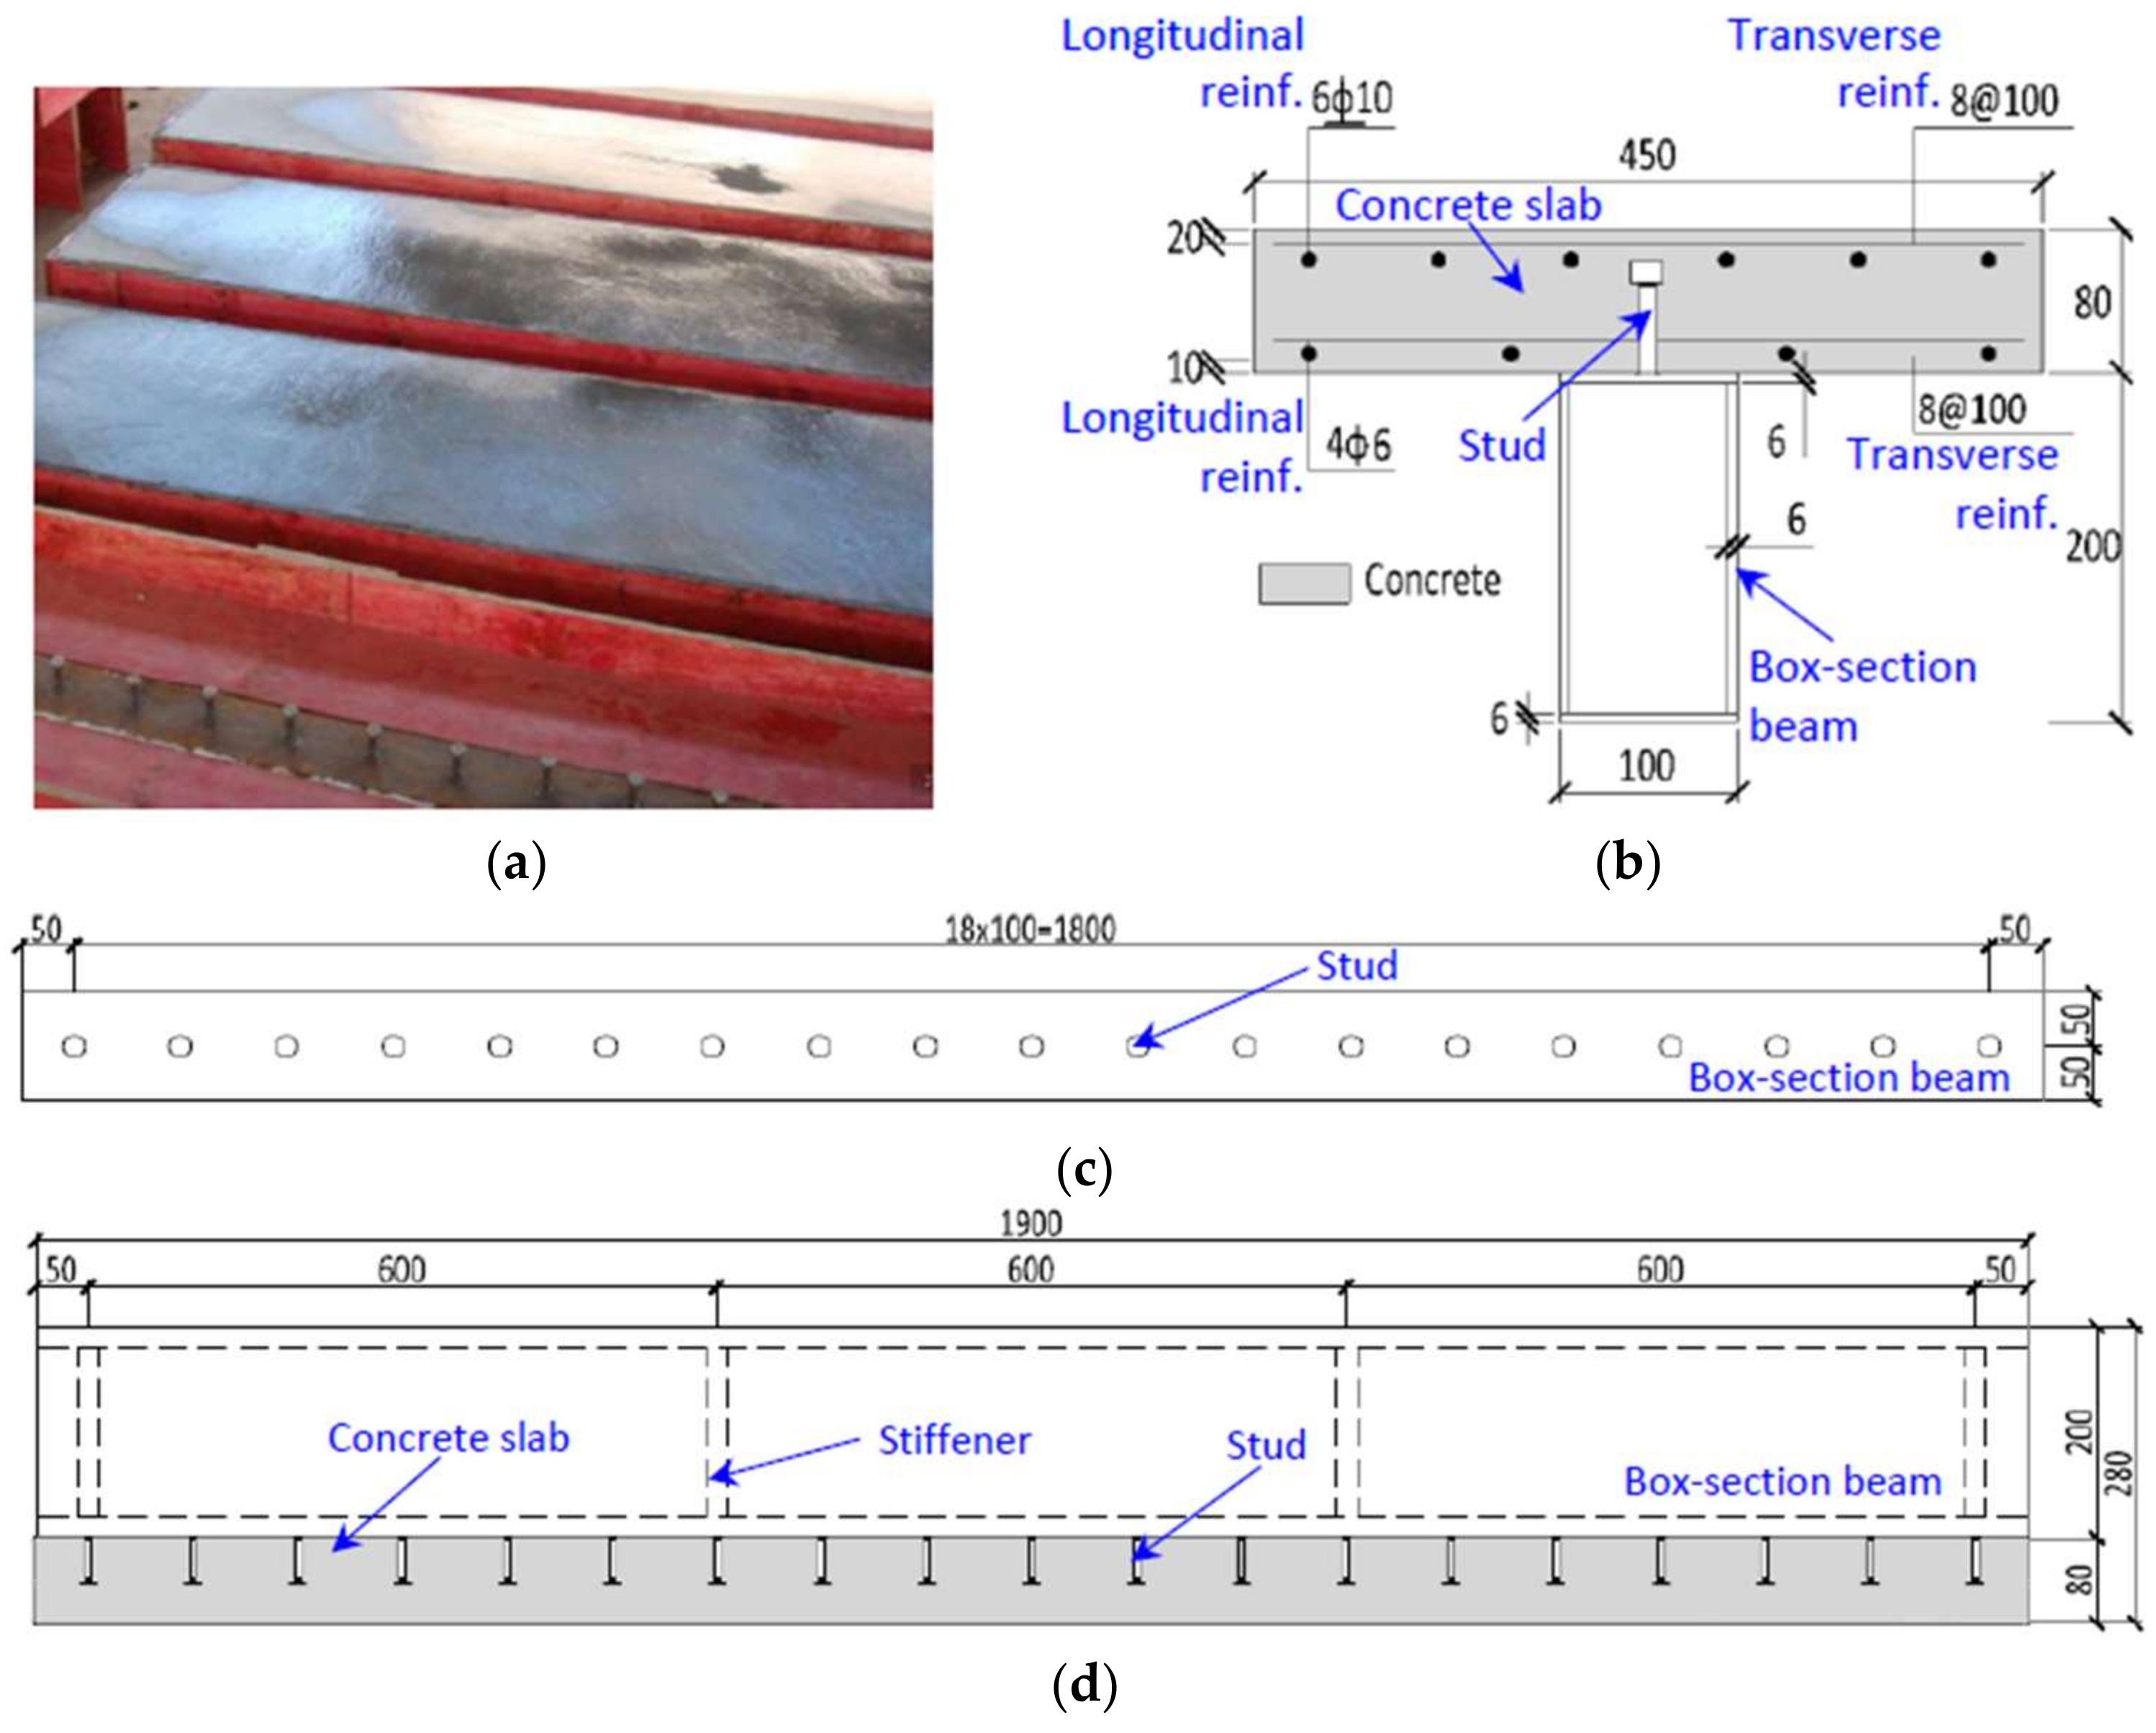
2.1. Test Specimens
2.2. Material Properties and Measurements
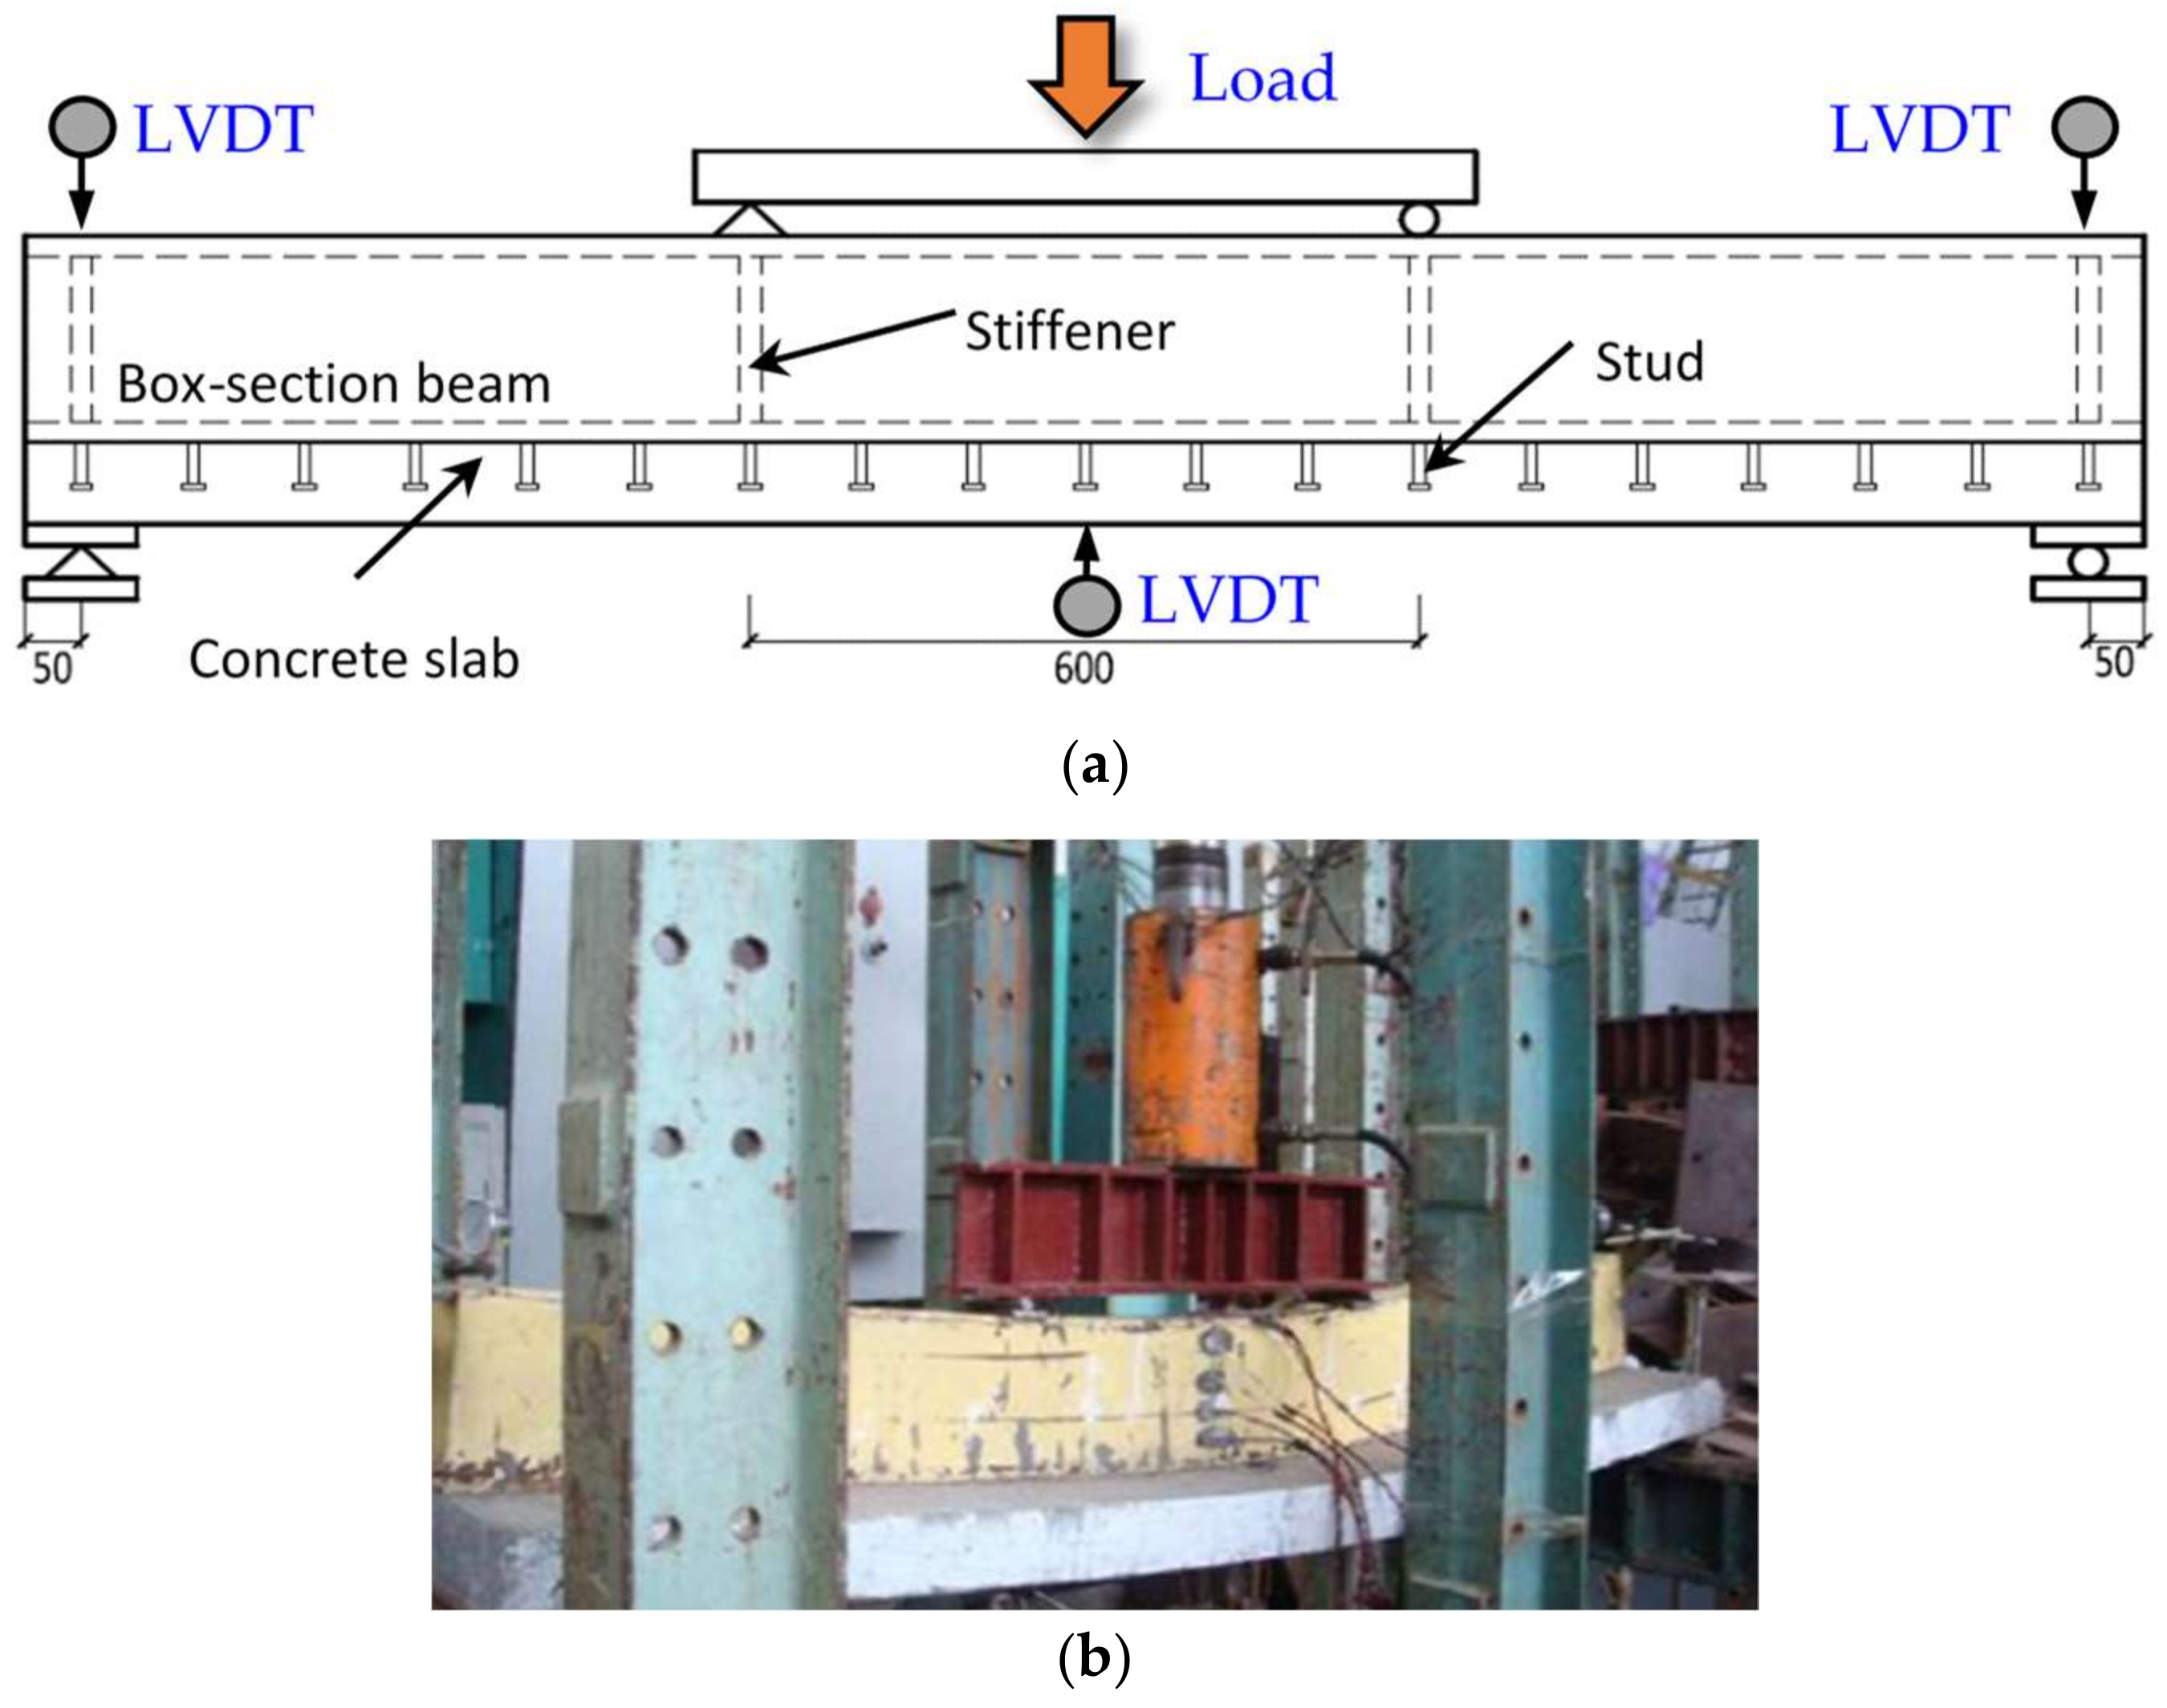
2.3. Pre-Cracked Test and Exposure Conditions
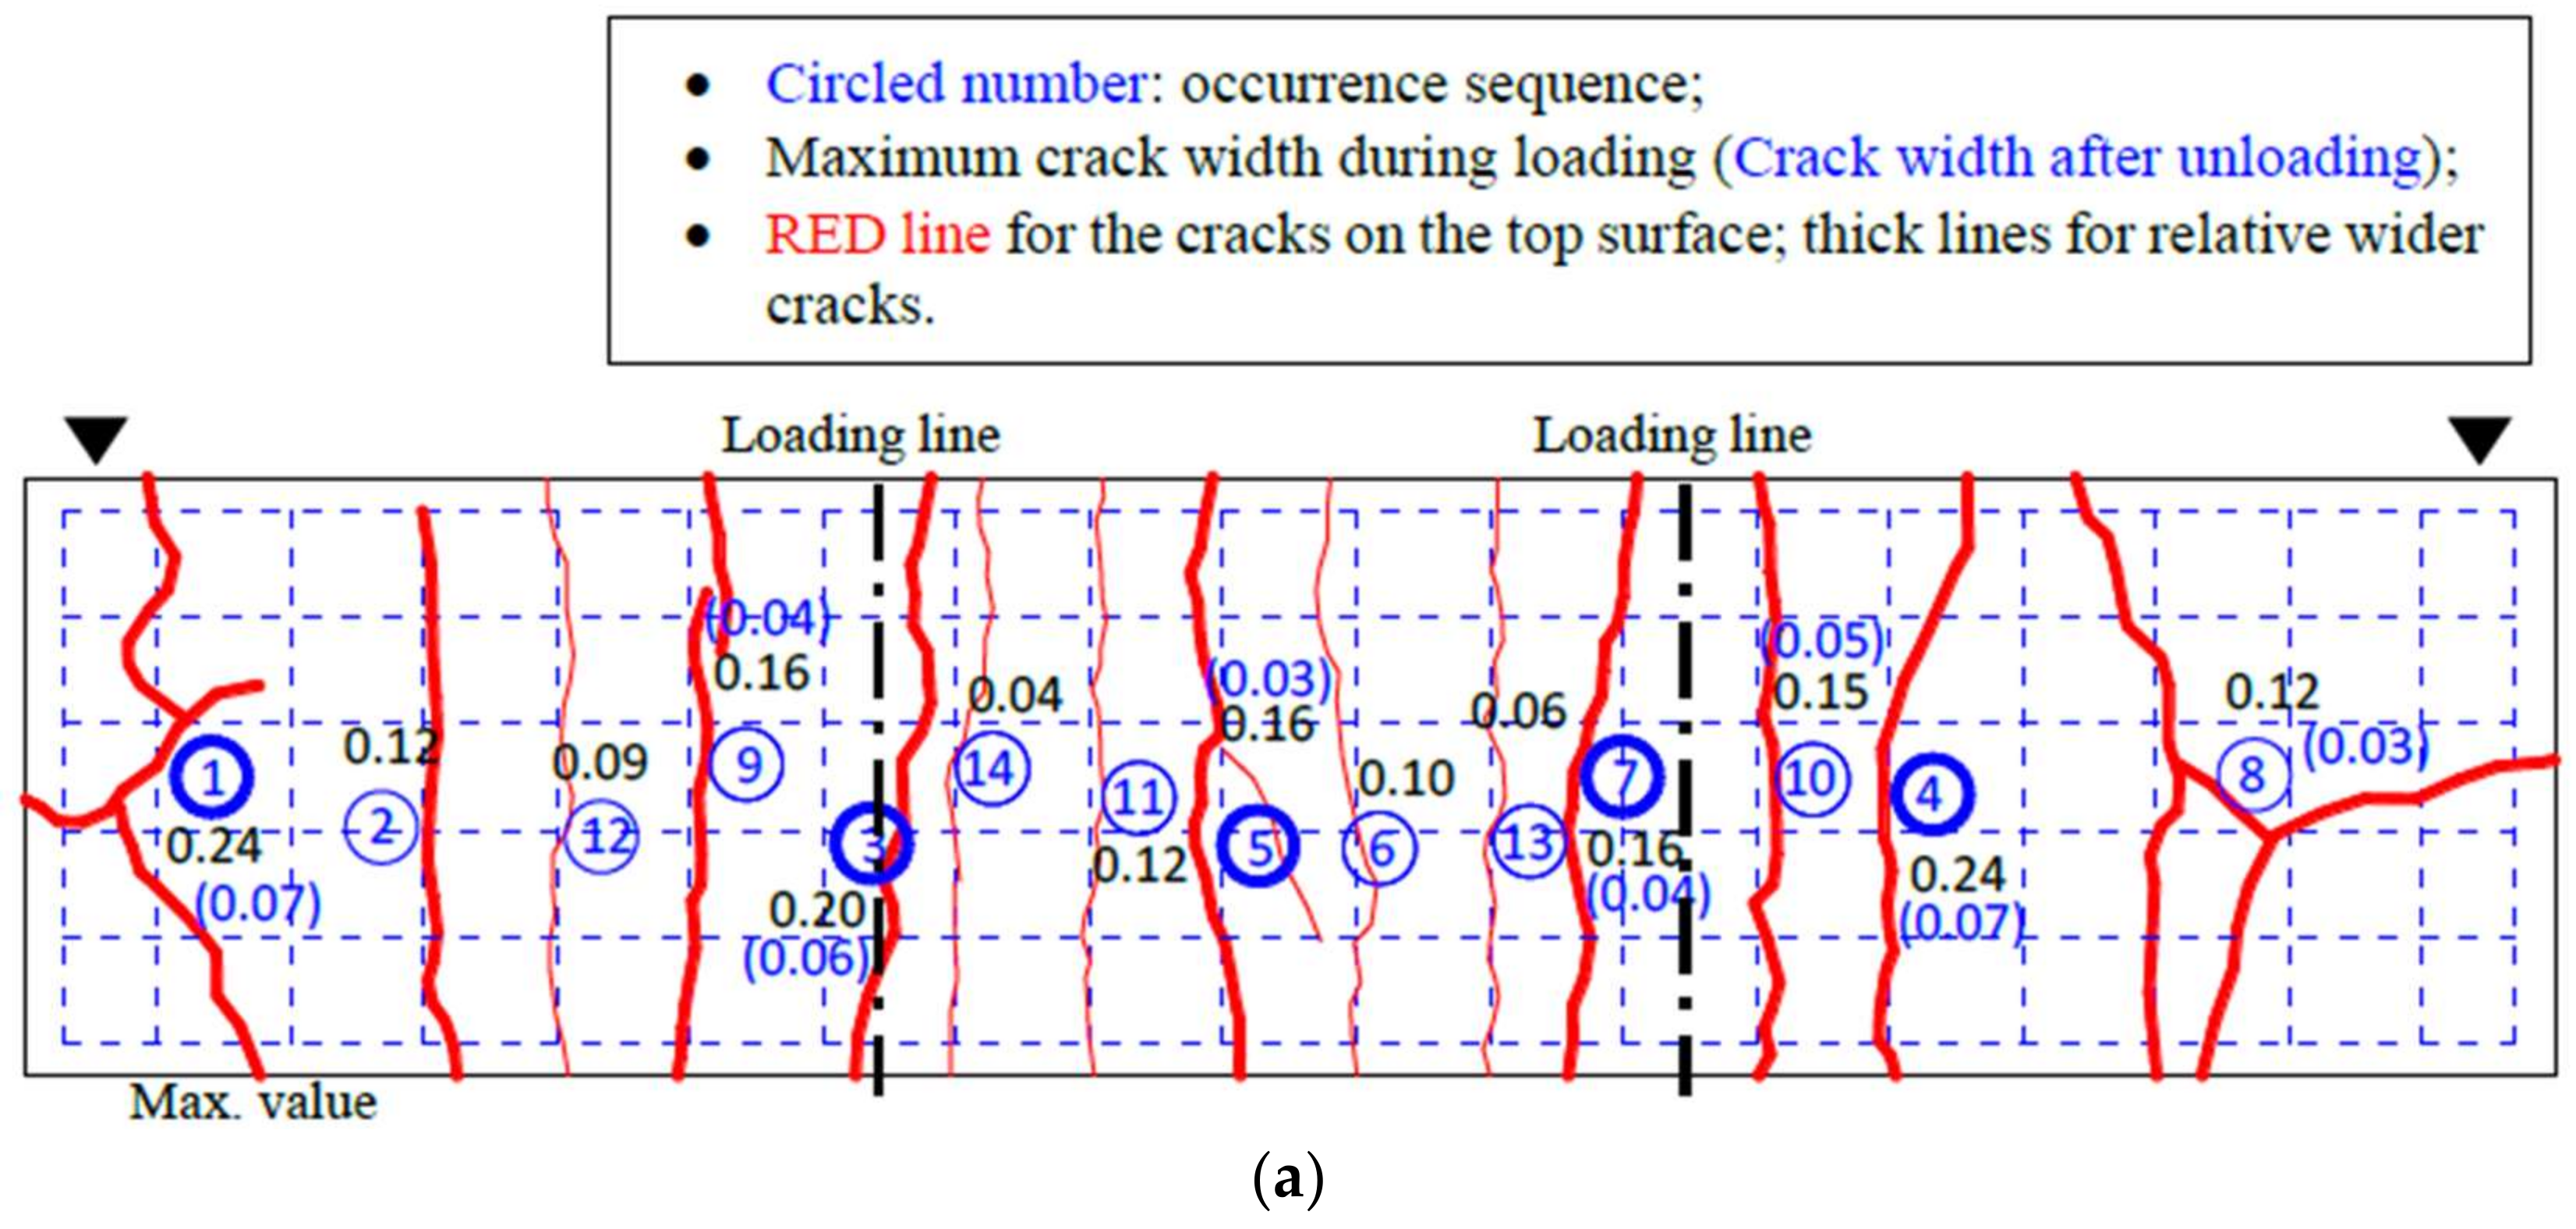
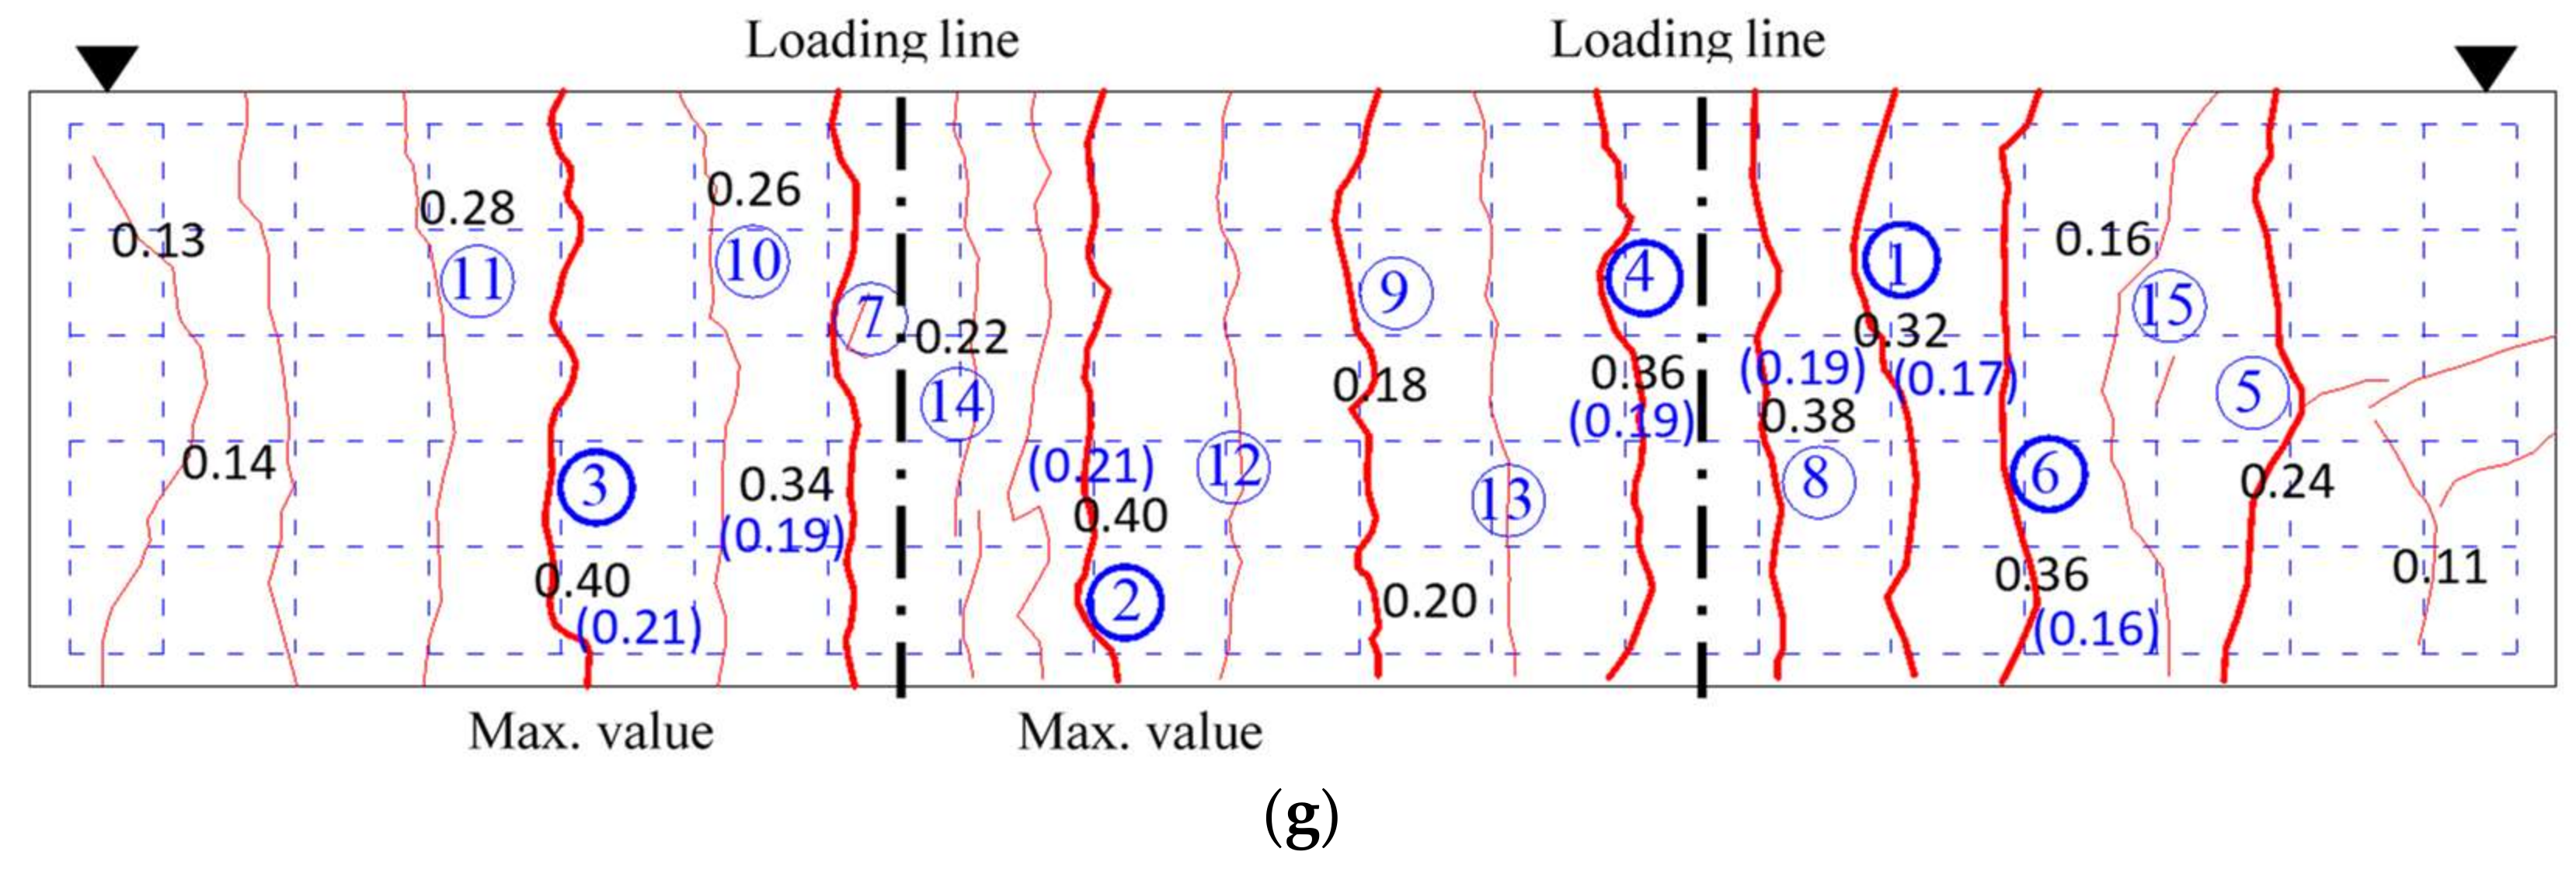
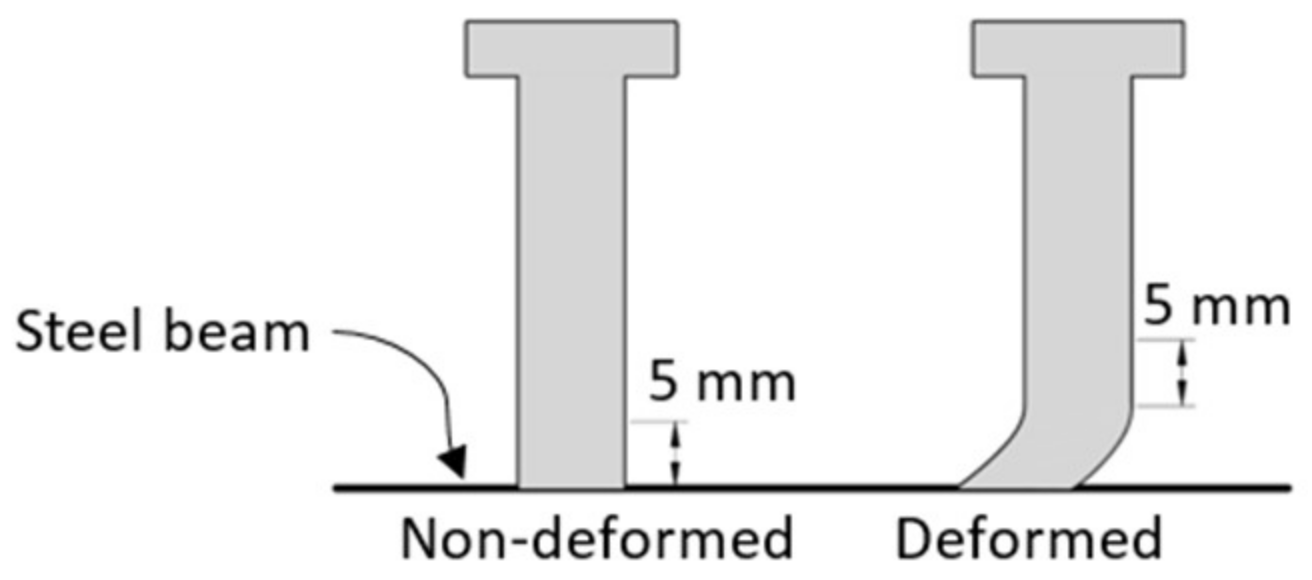
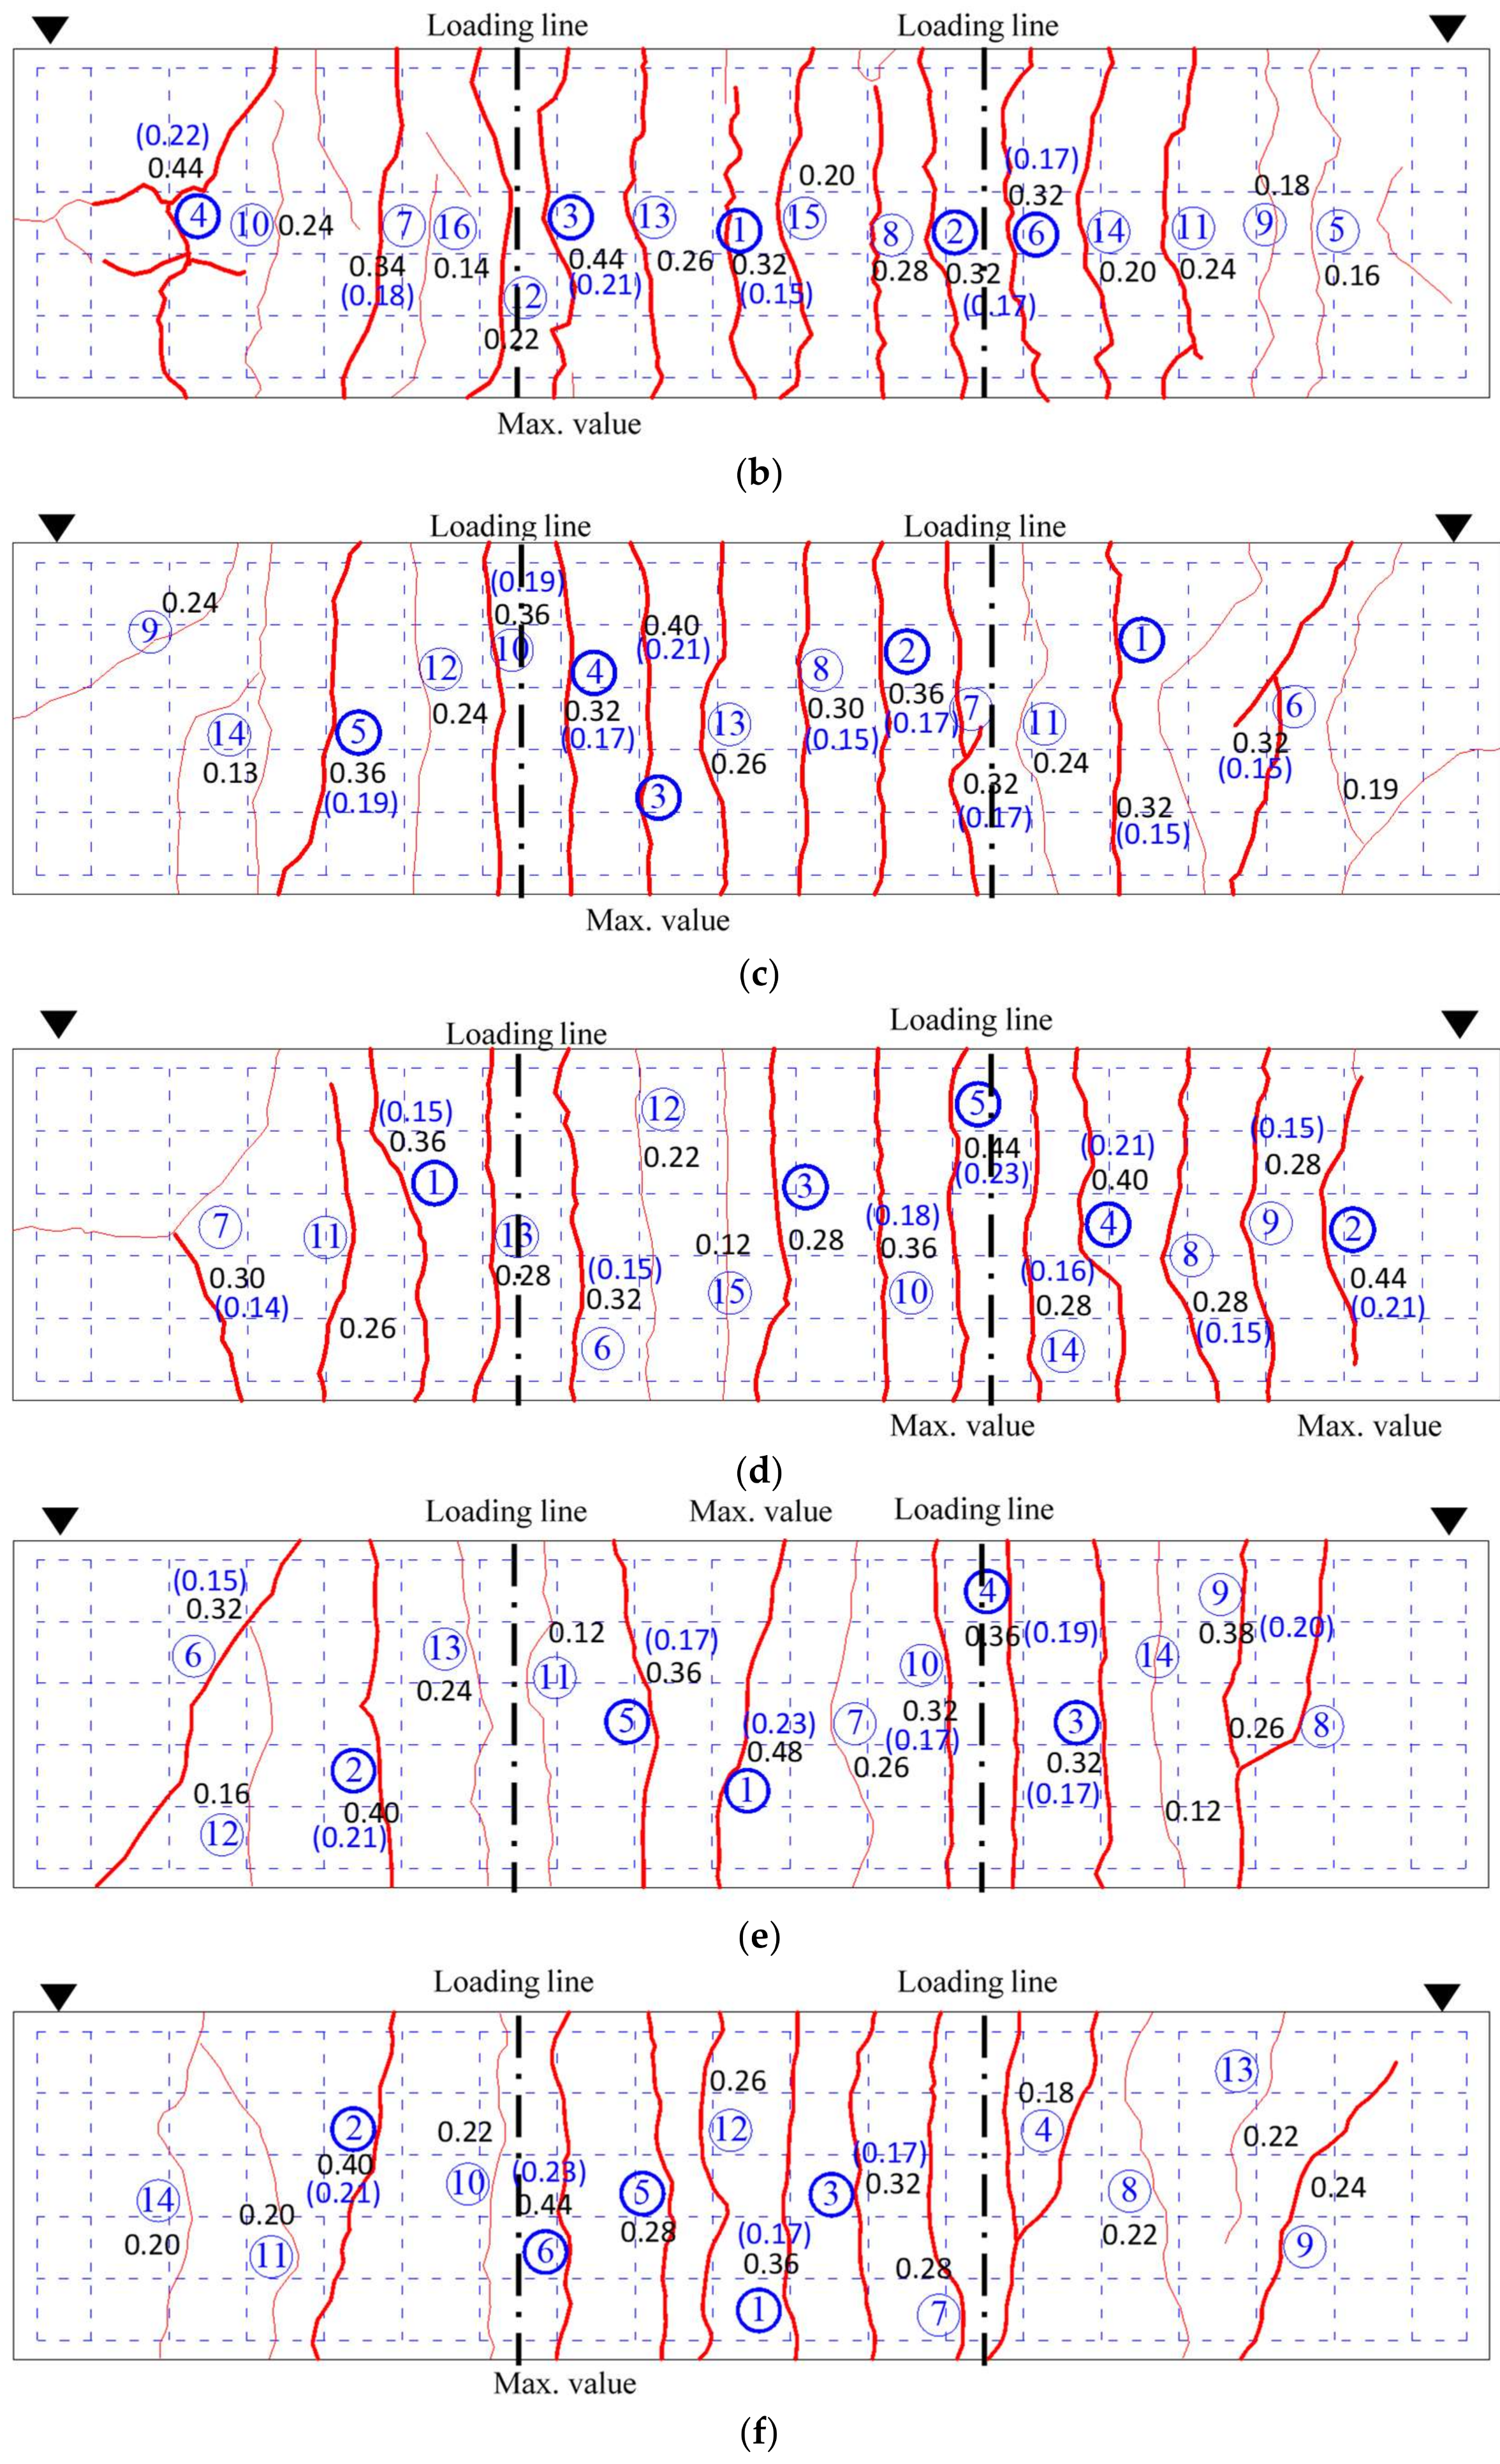
2.4. Cracking Maps
2.5. Assesment of Cross-Section Loss
3. Experimental Results and Discussion
3.1. Crack Maps
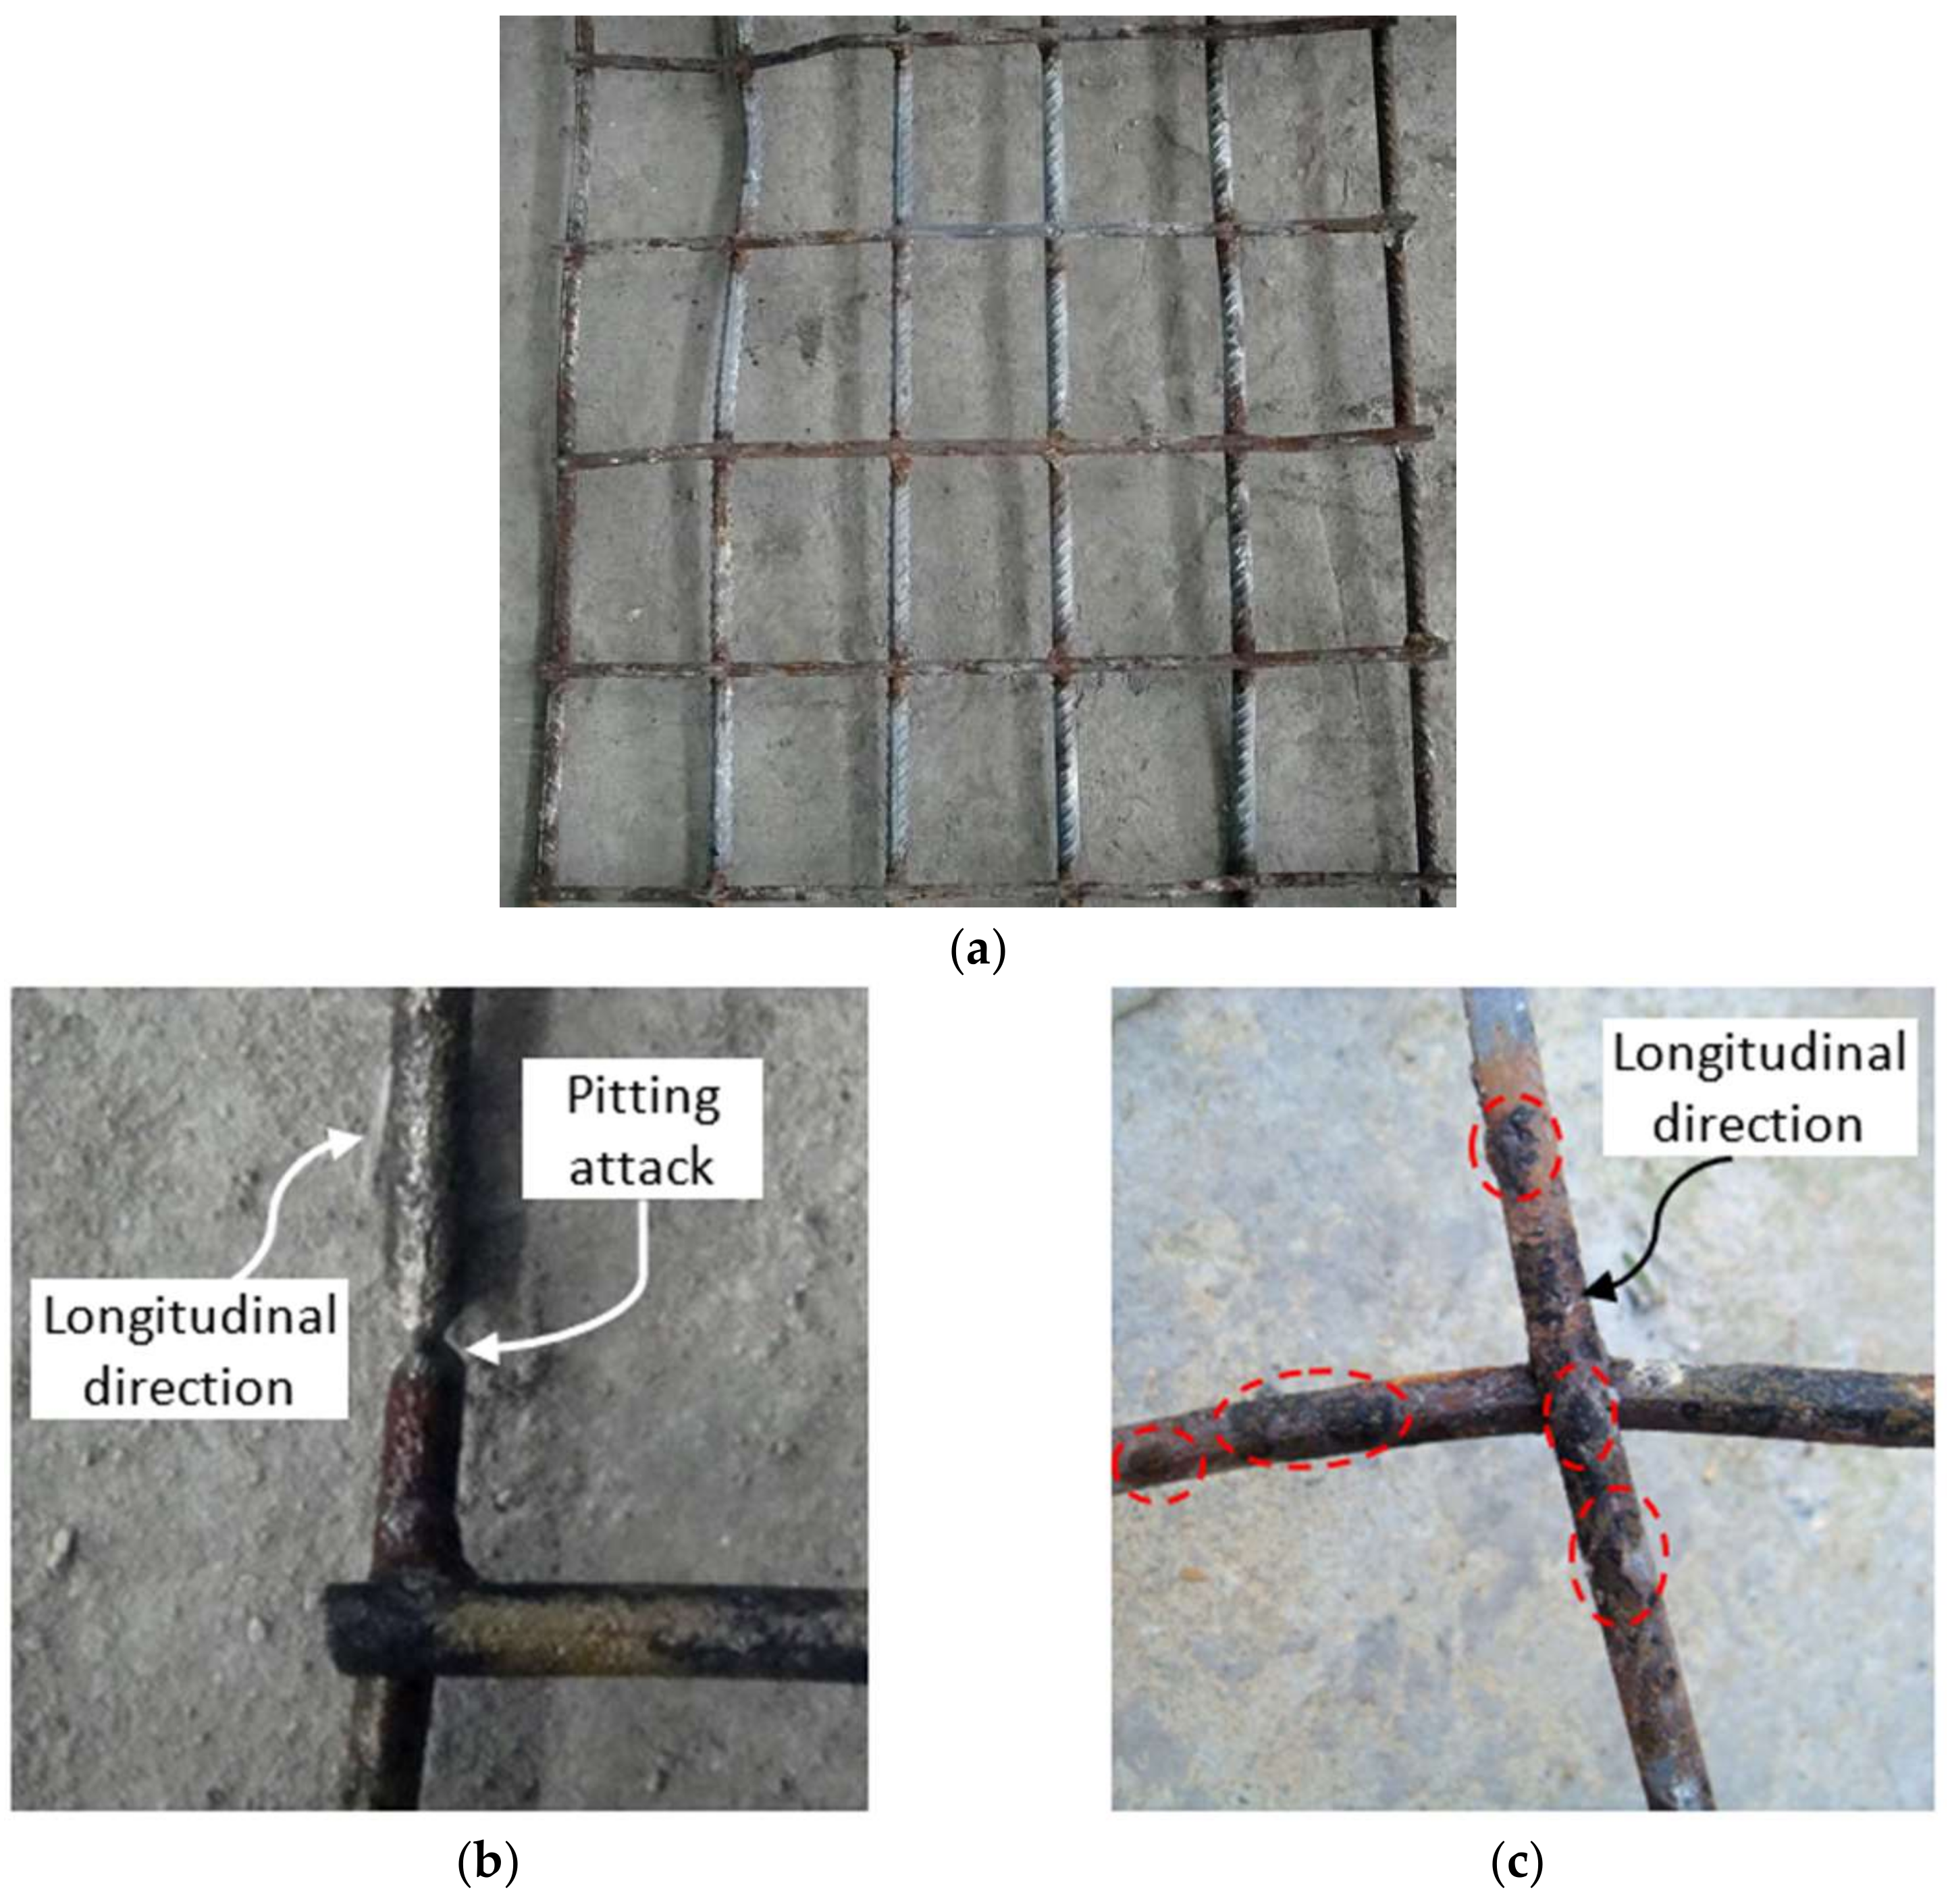
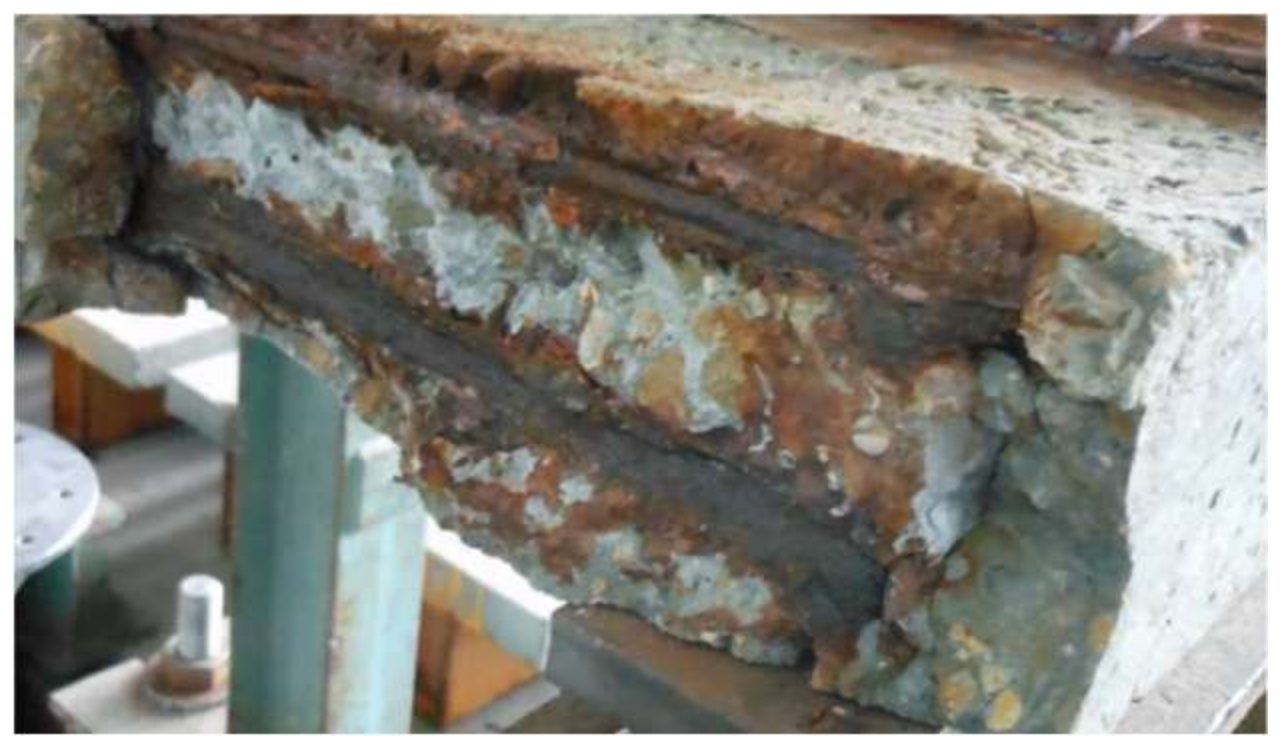
3.2. Corossion Patterns
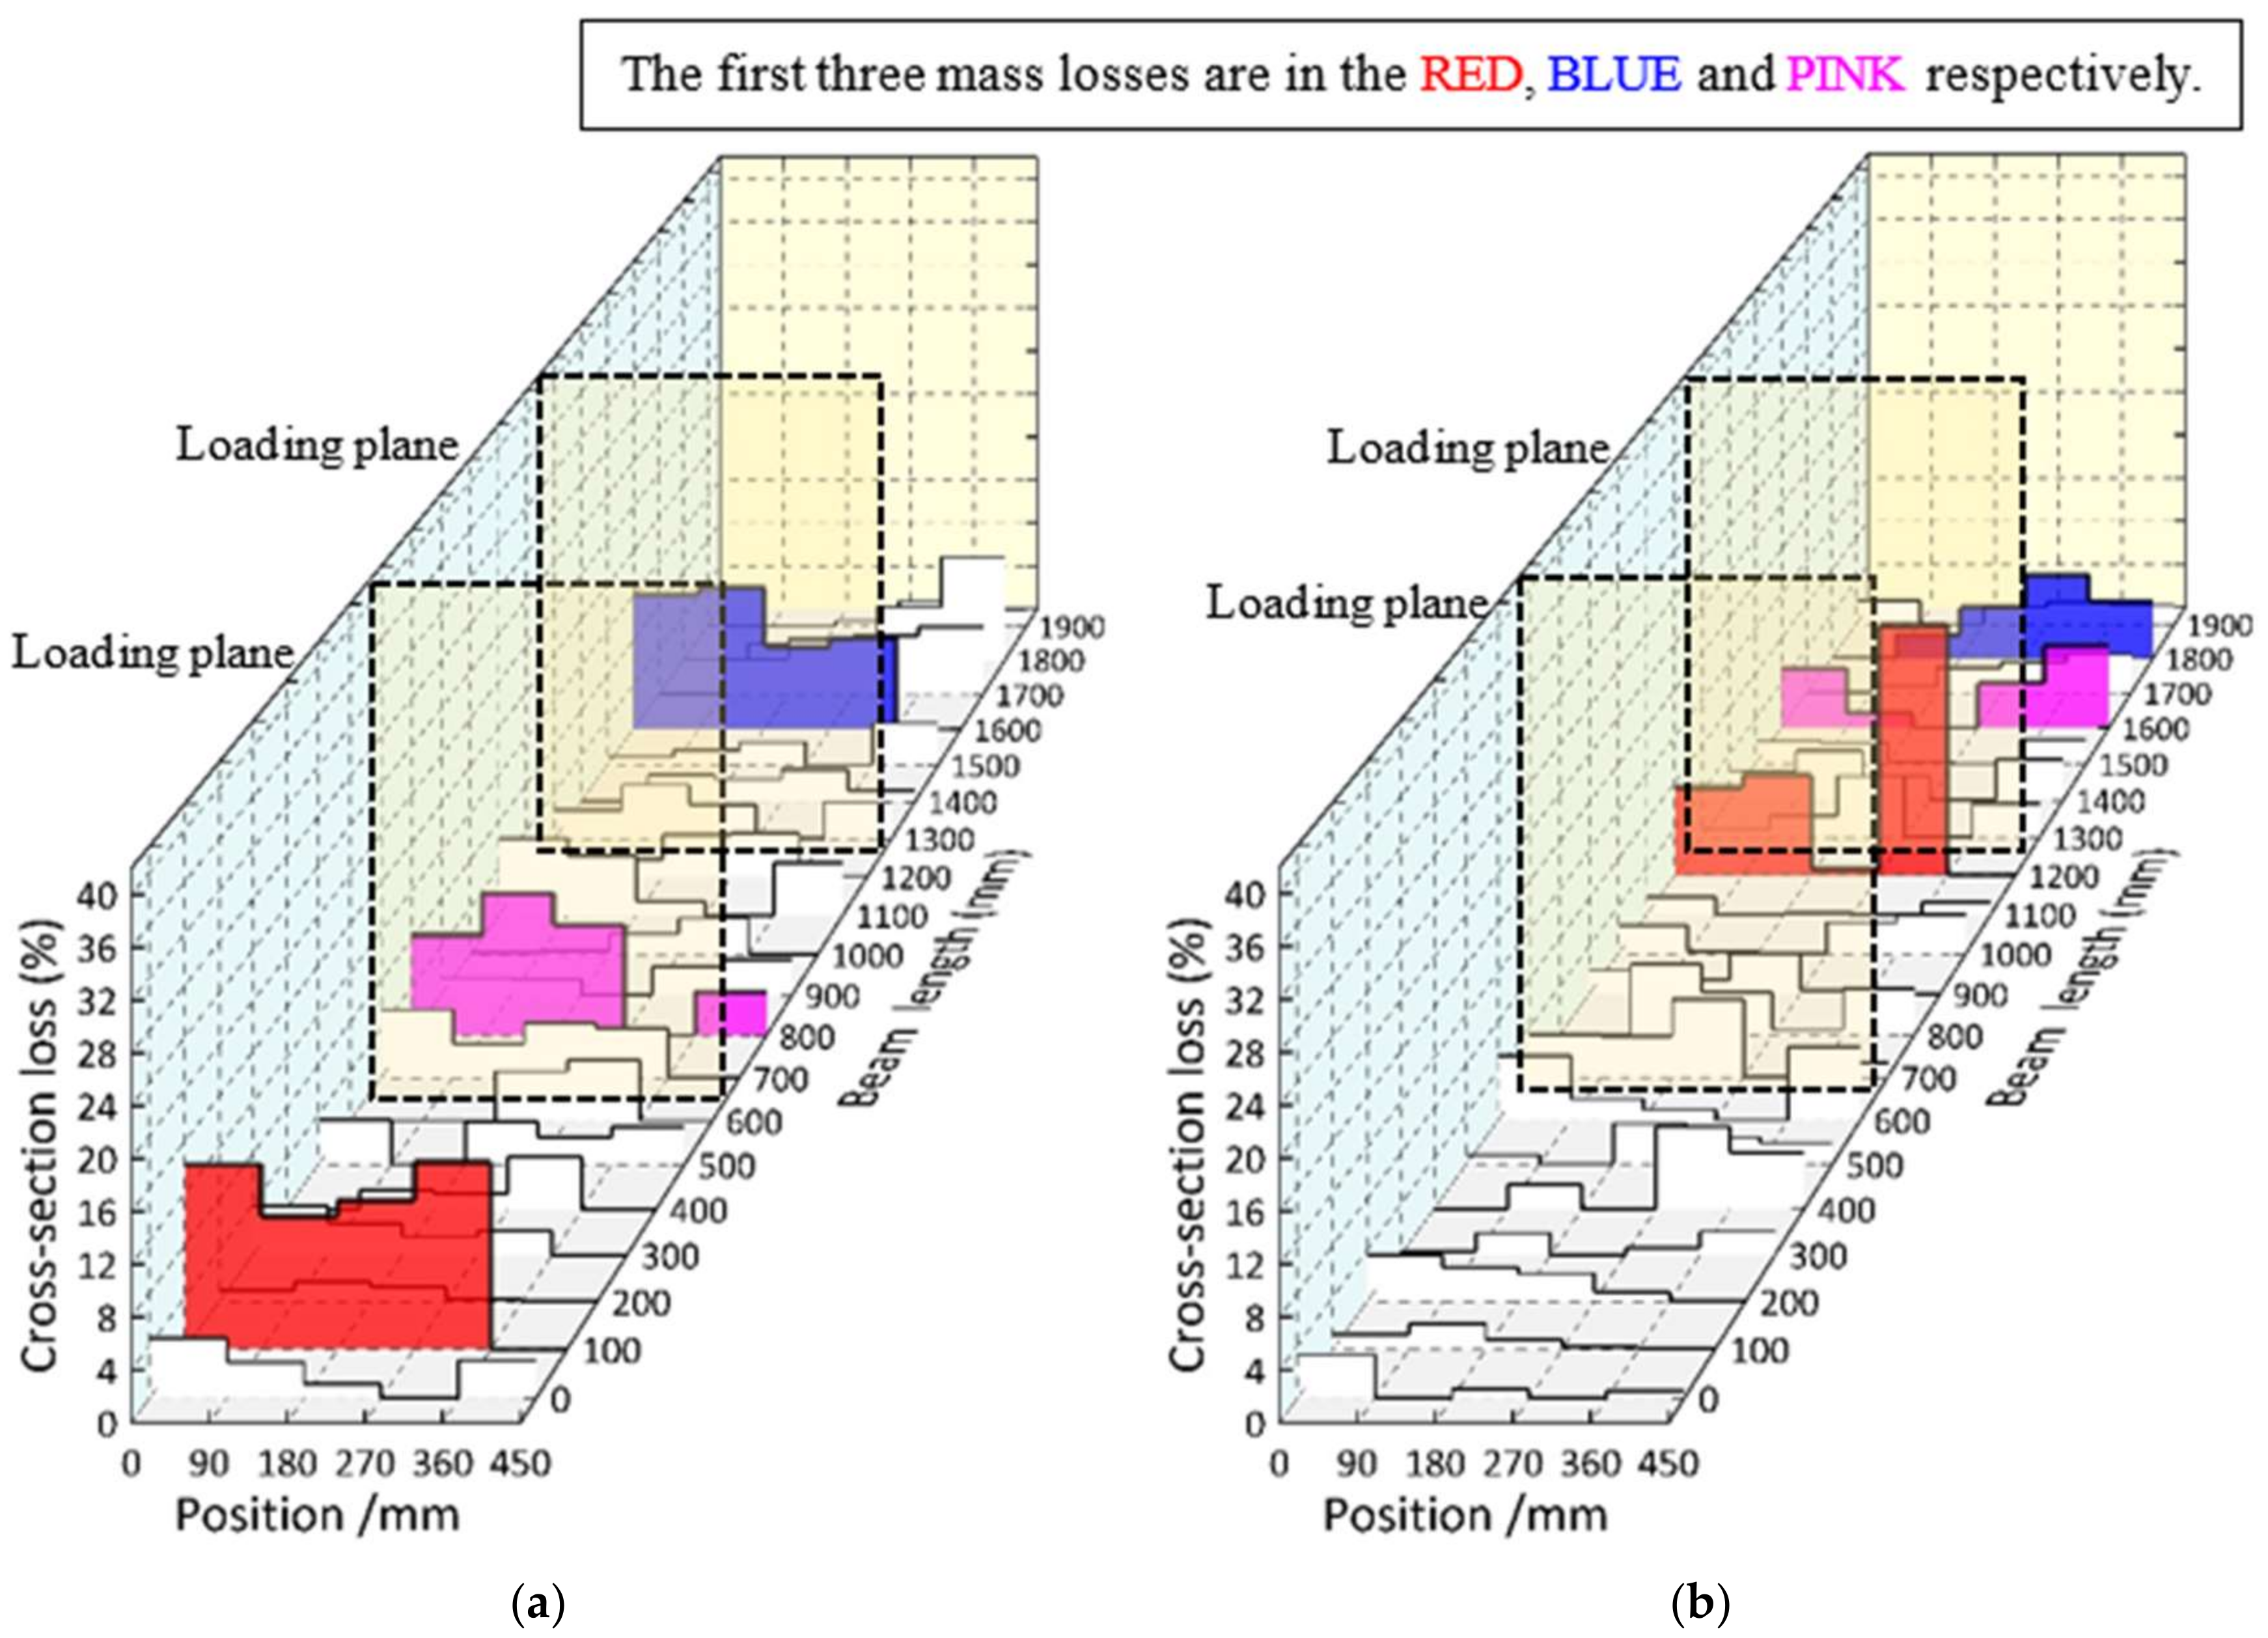
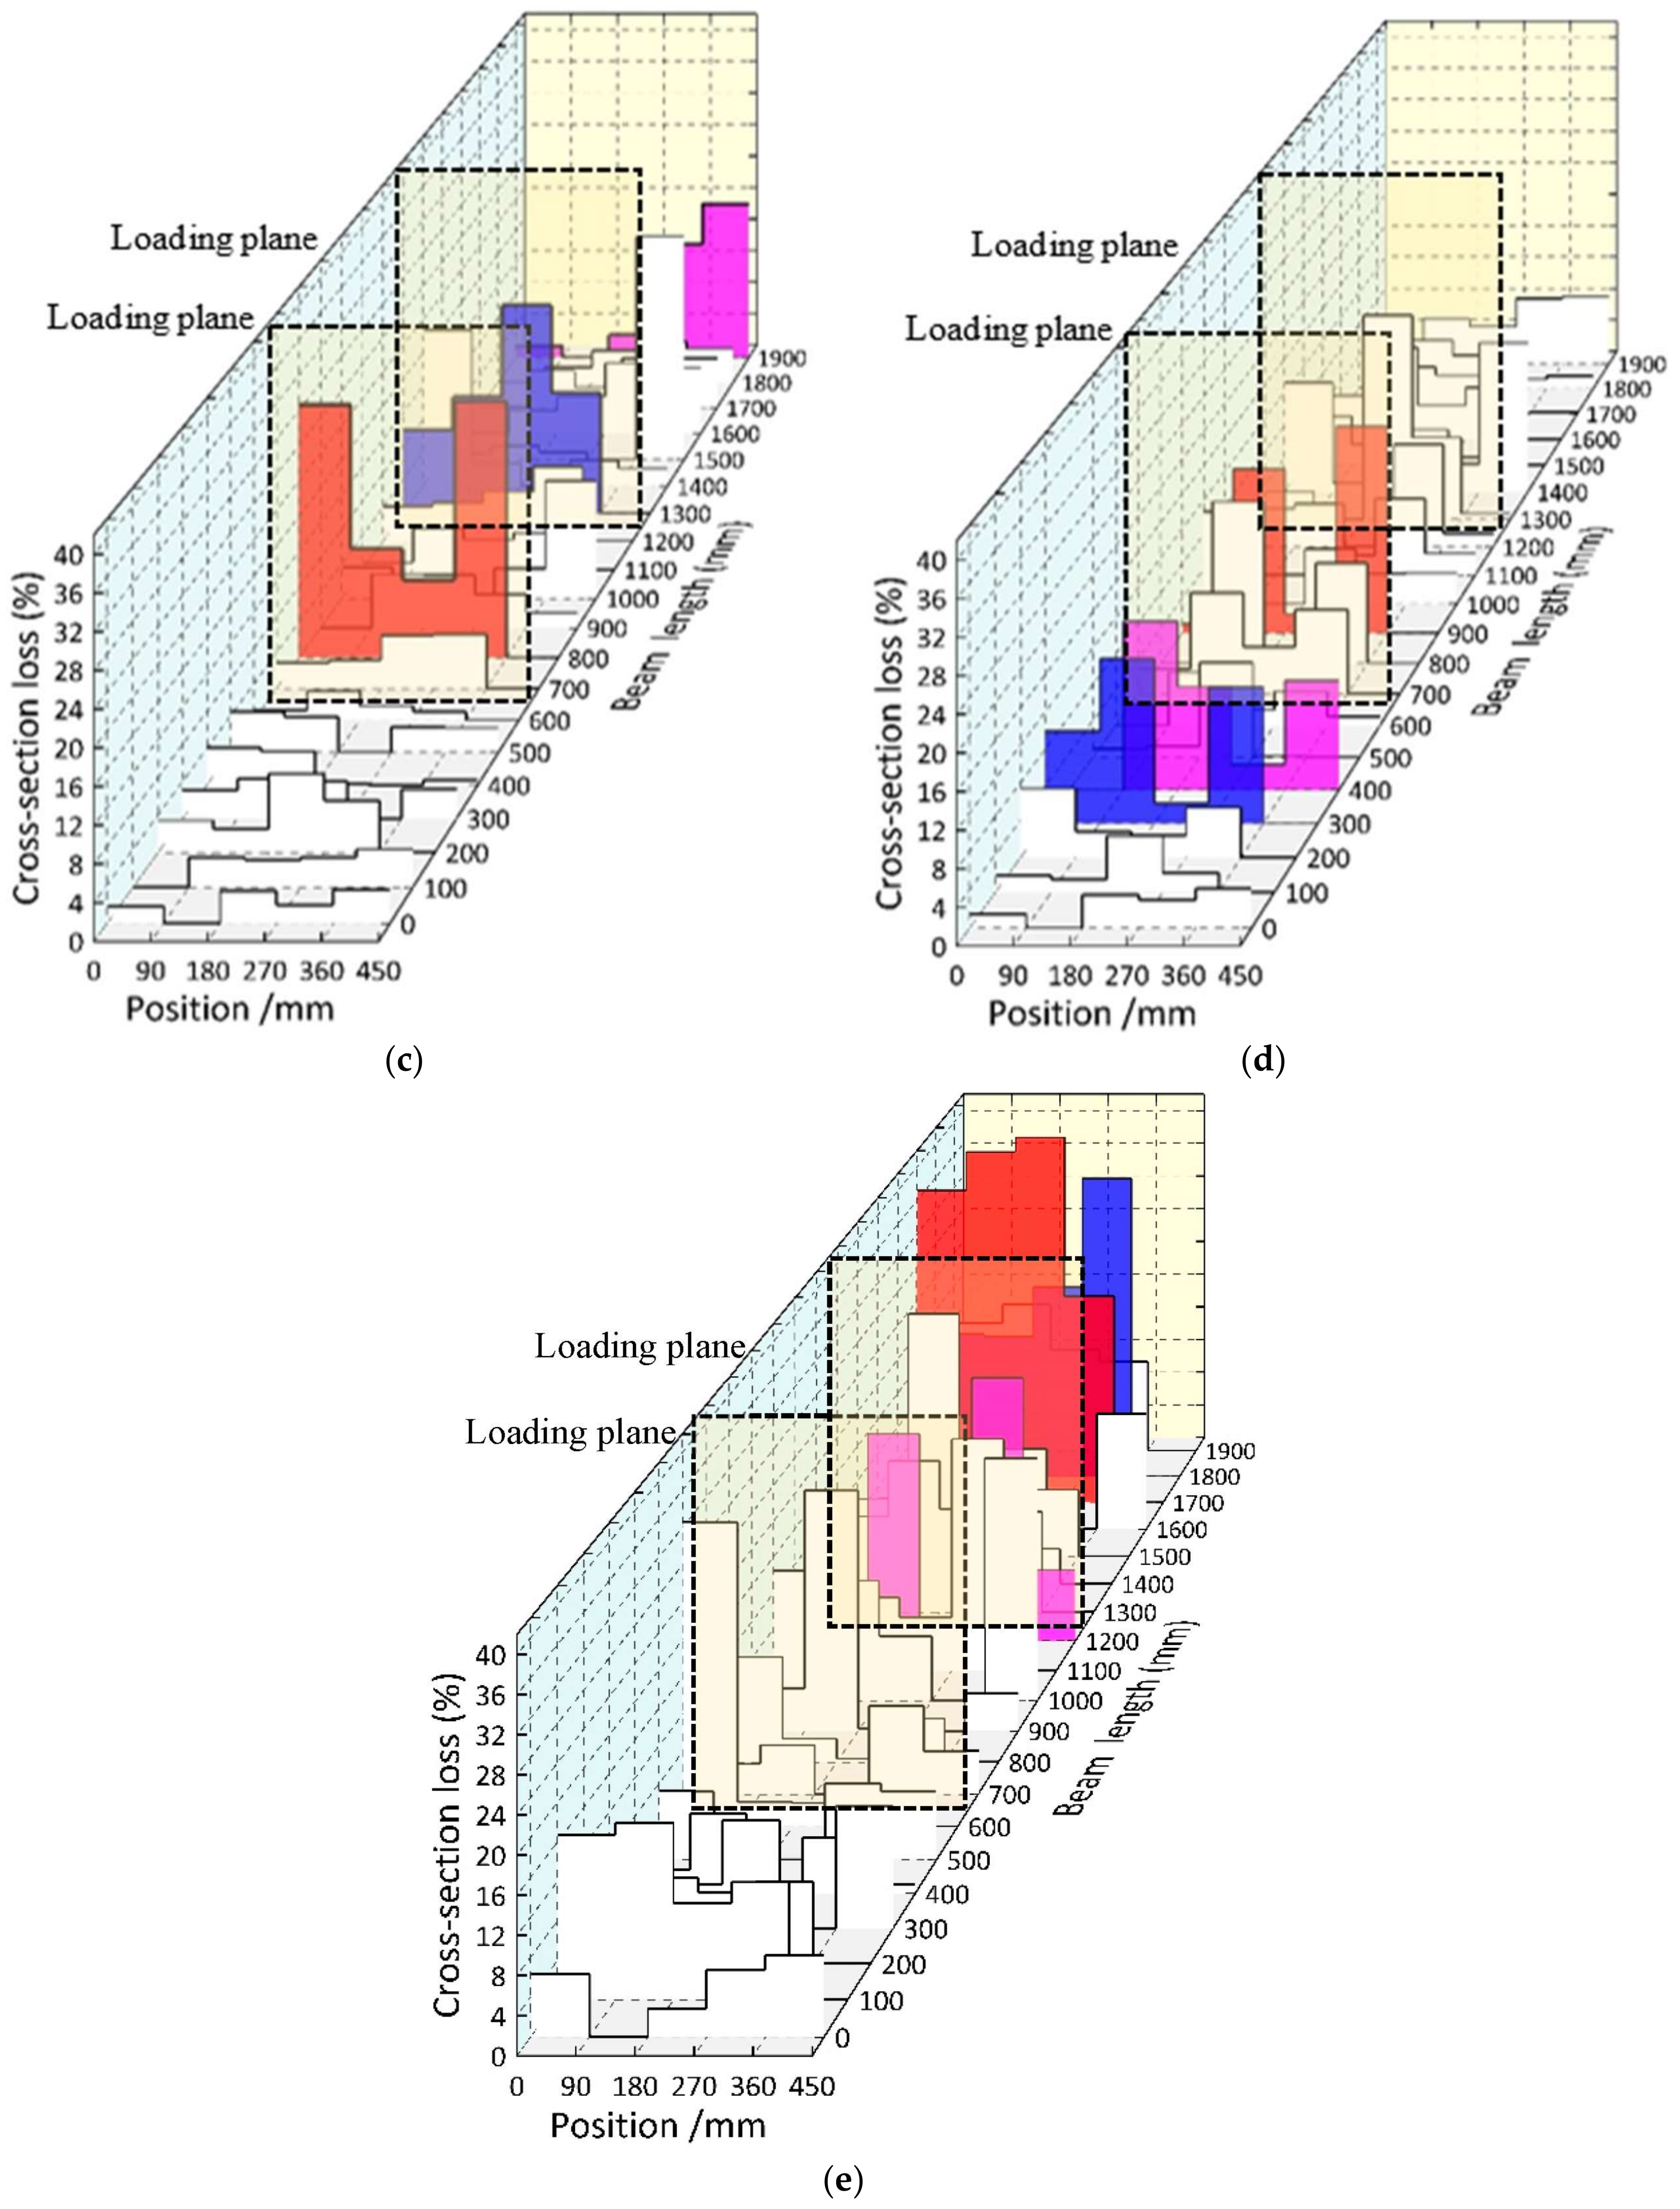
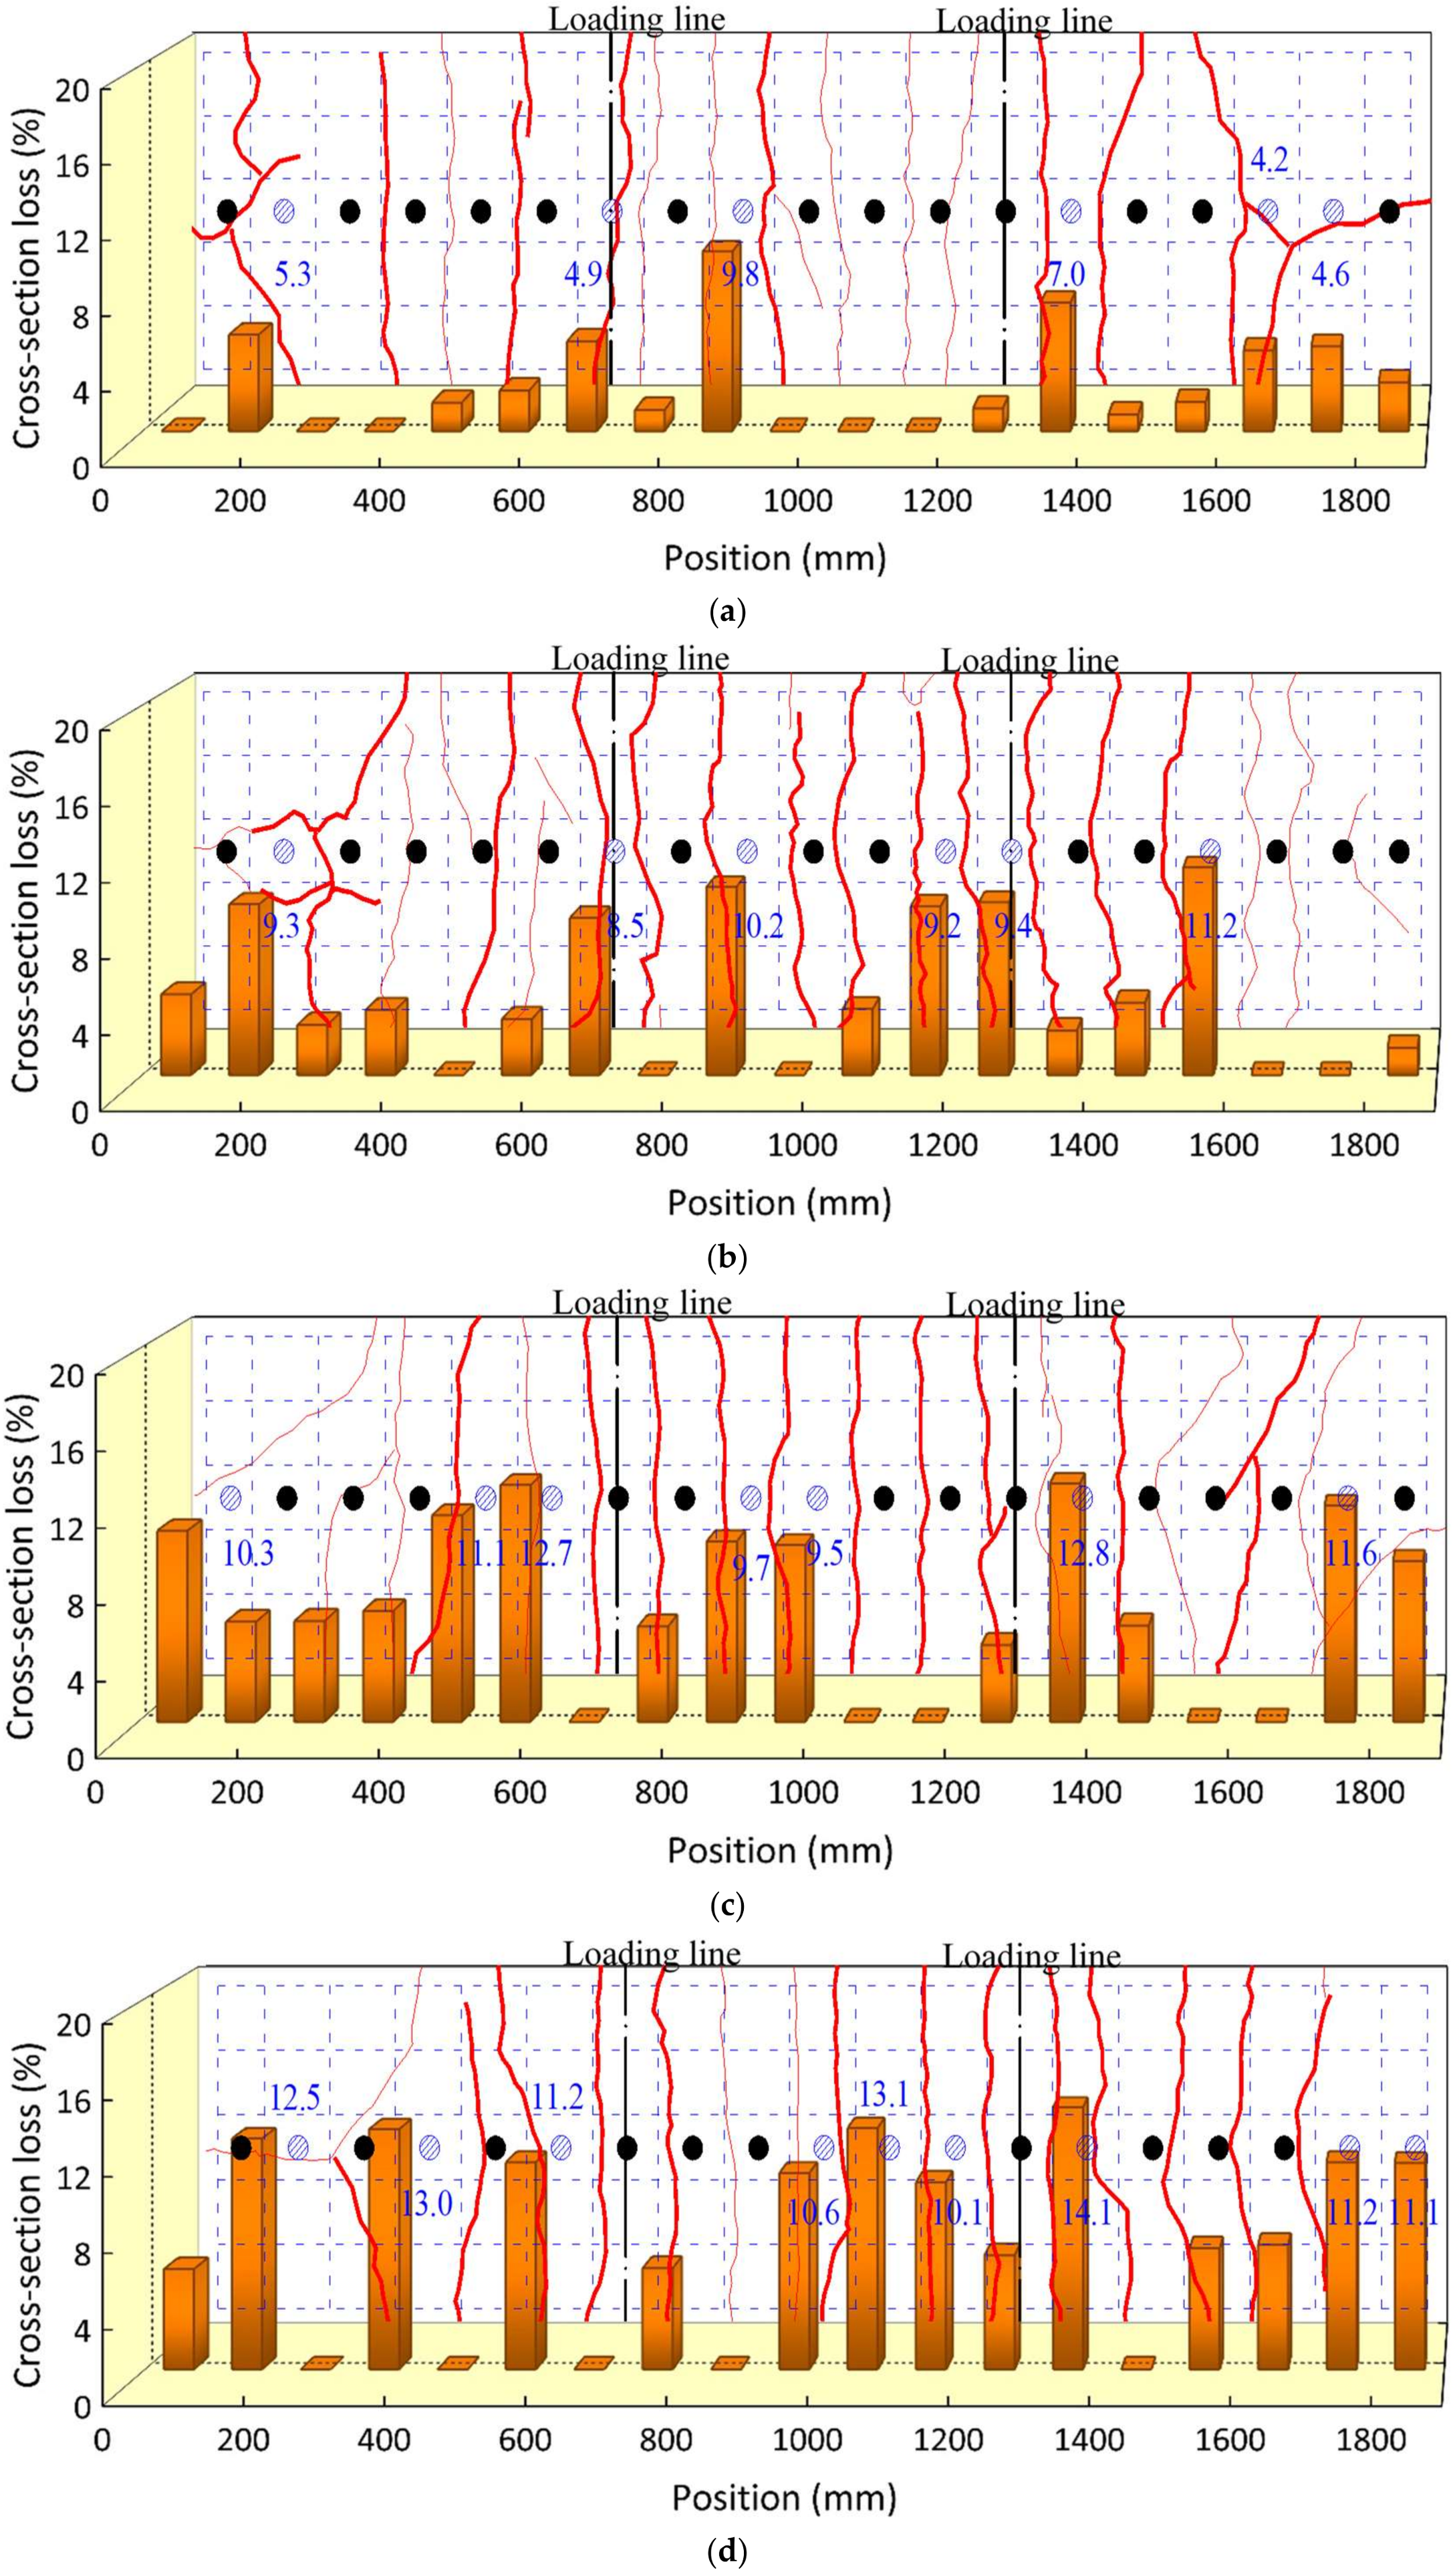
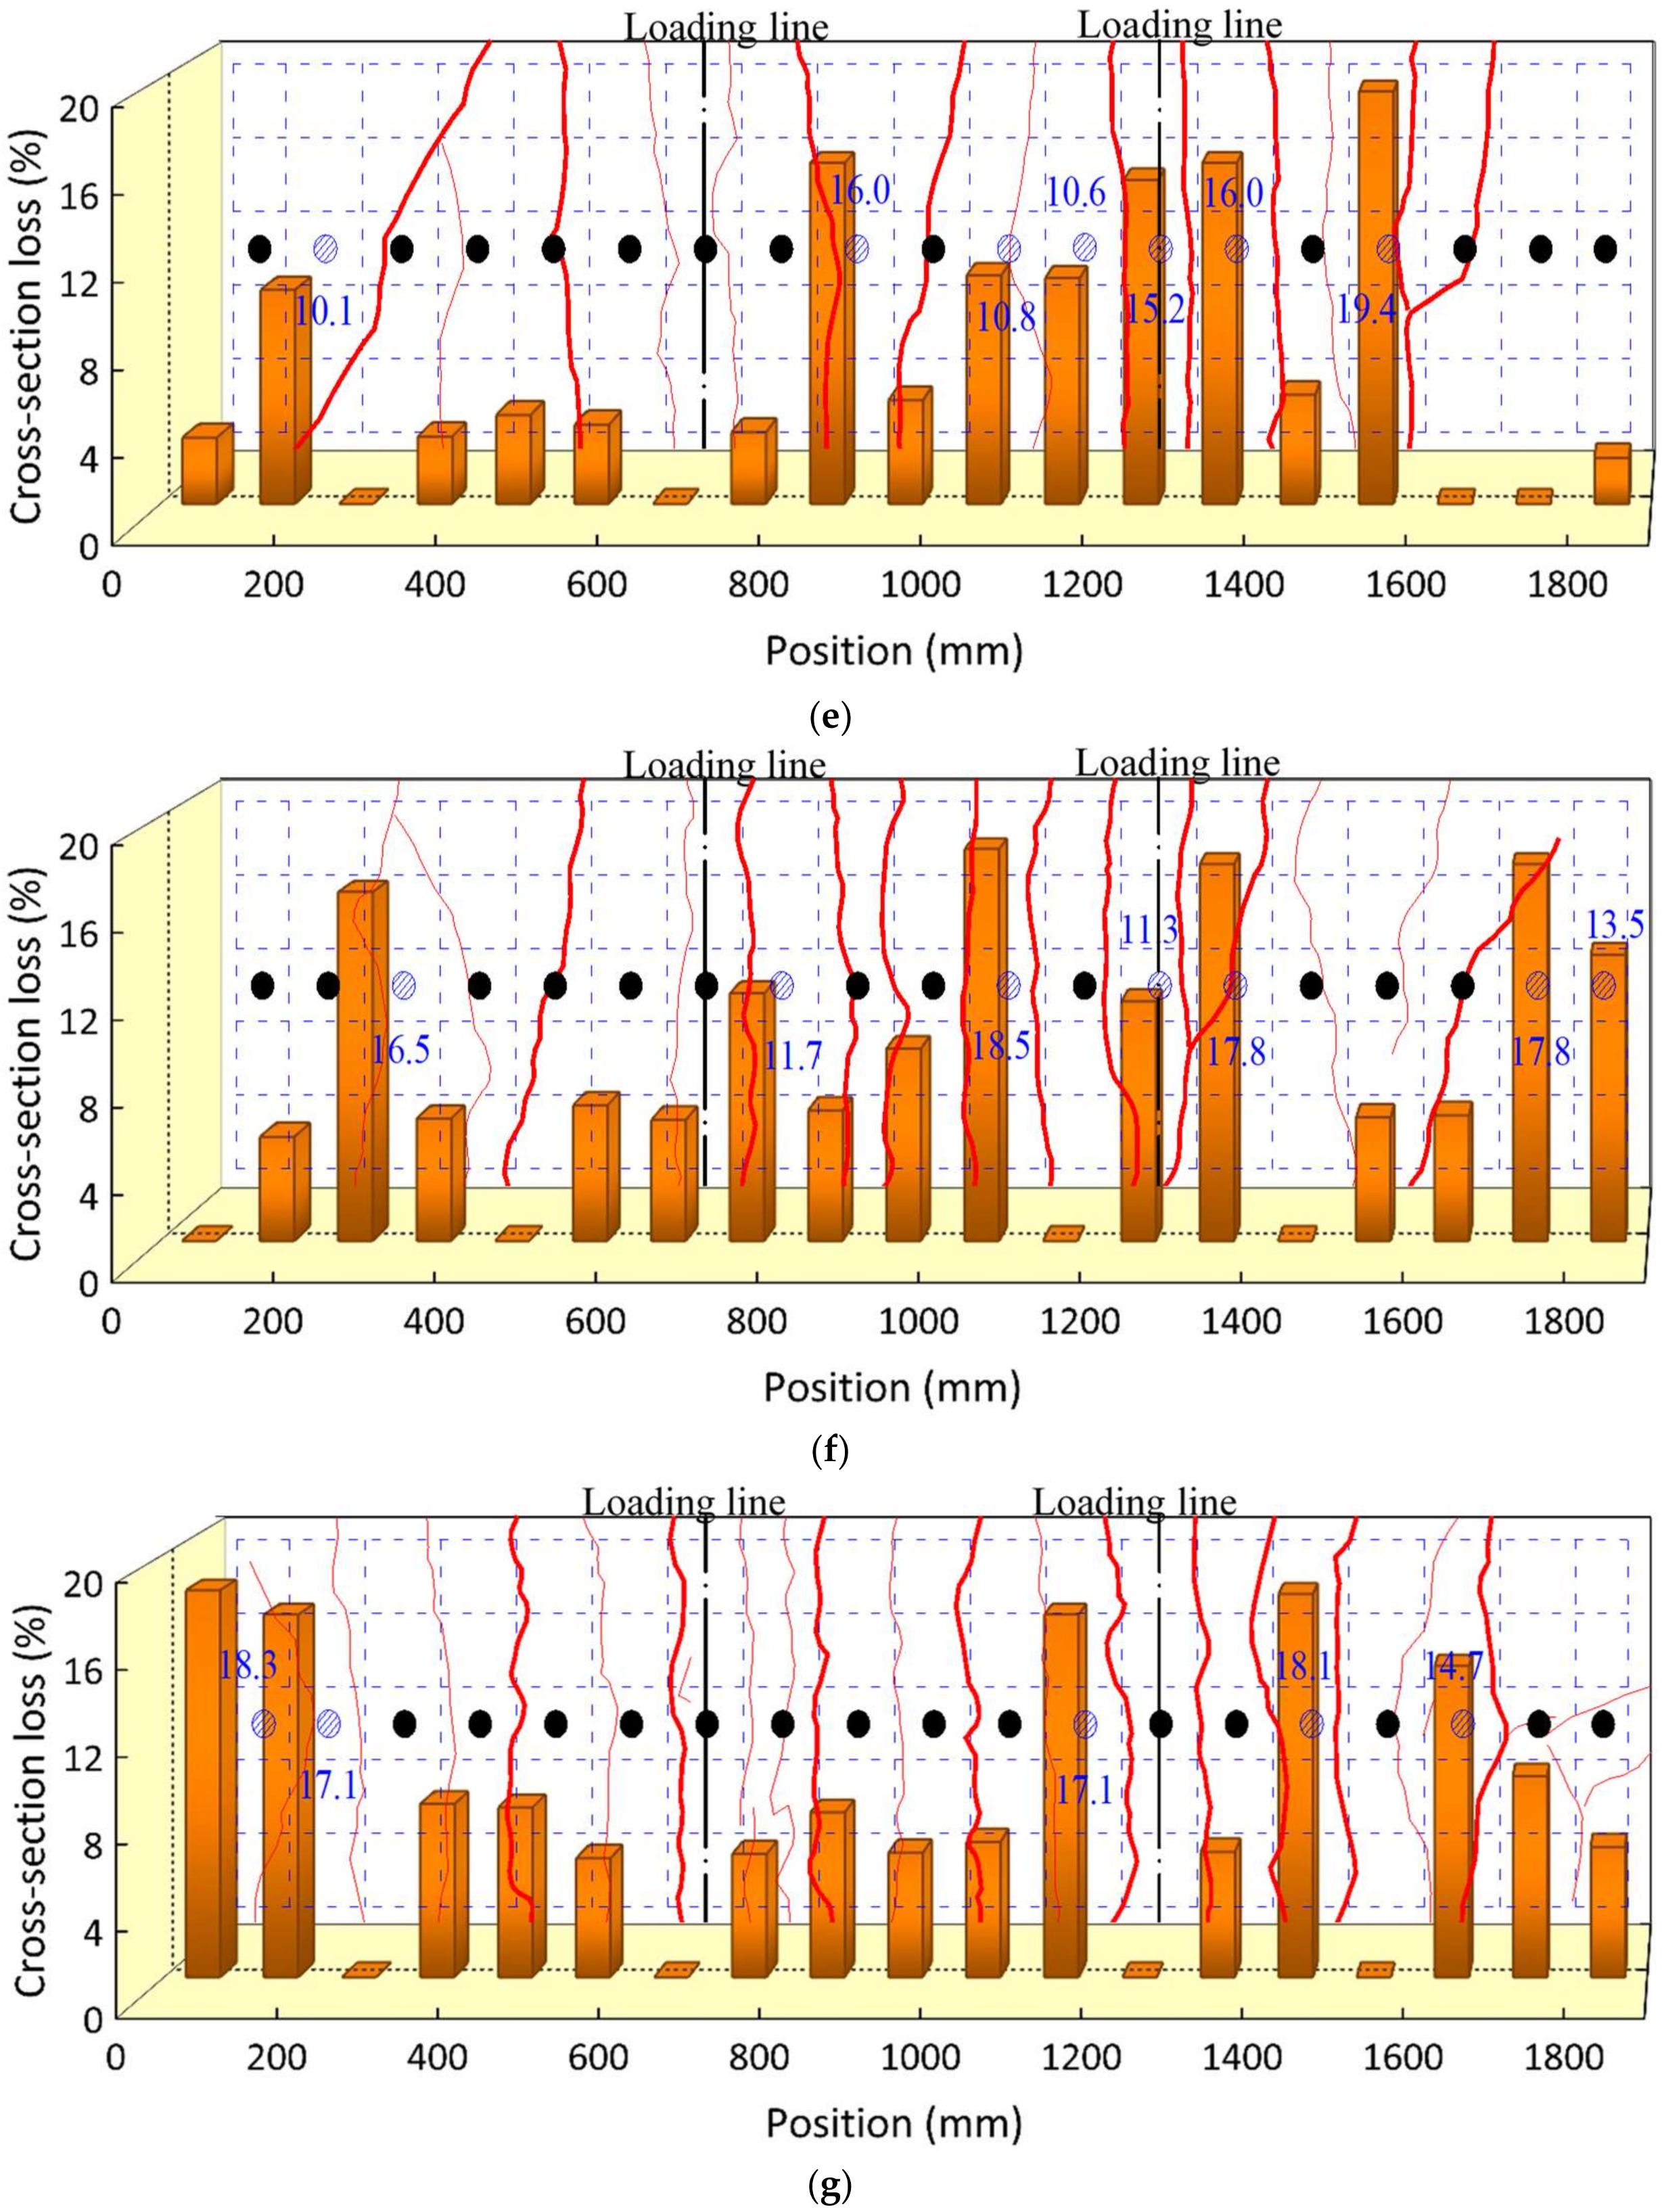
3.3. Cross-Section Loss Distribution
3.3.1. Steel Grids
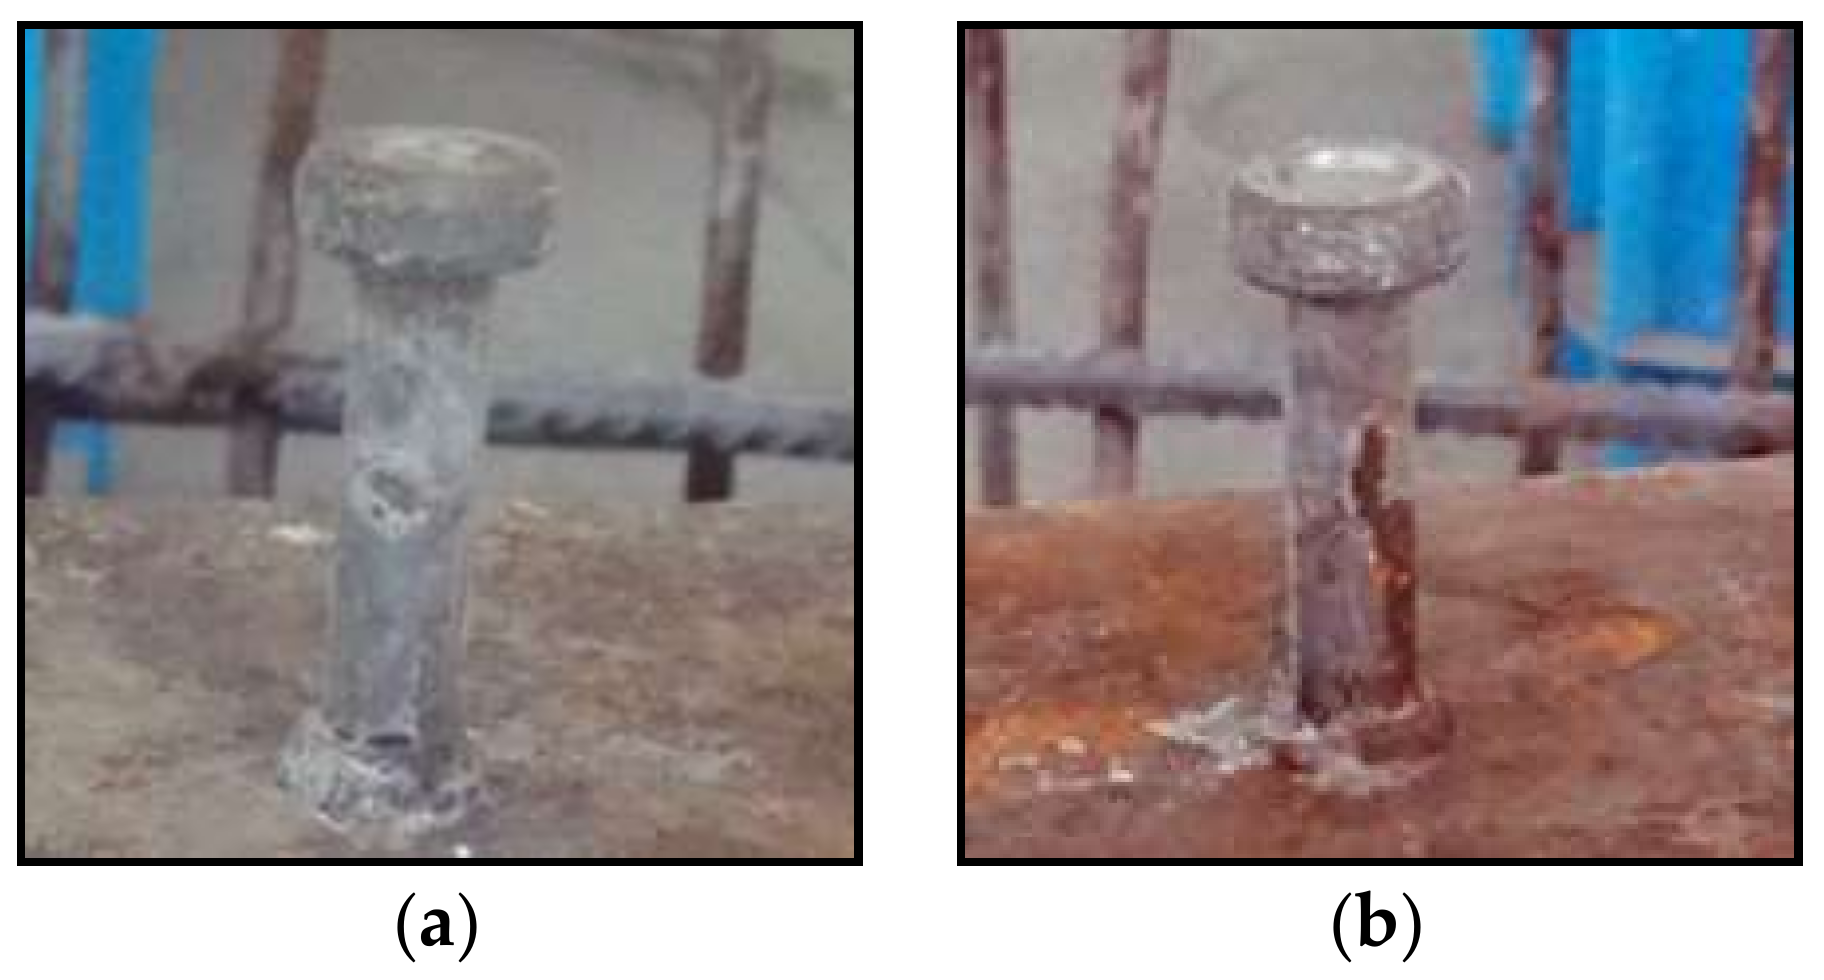
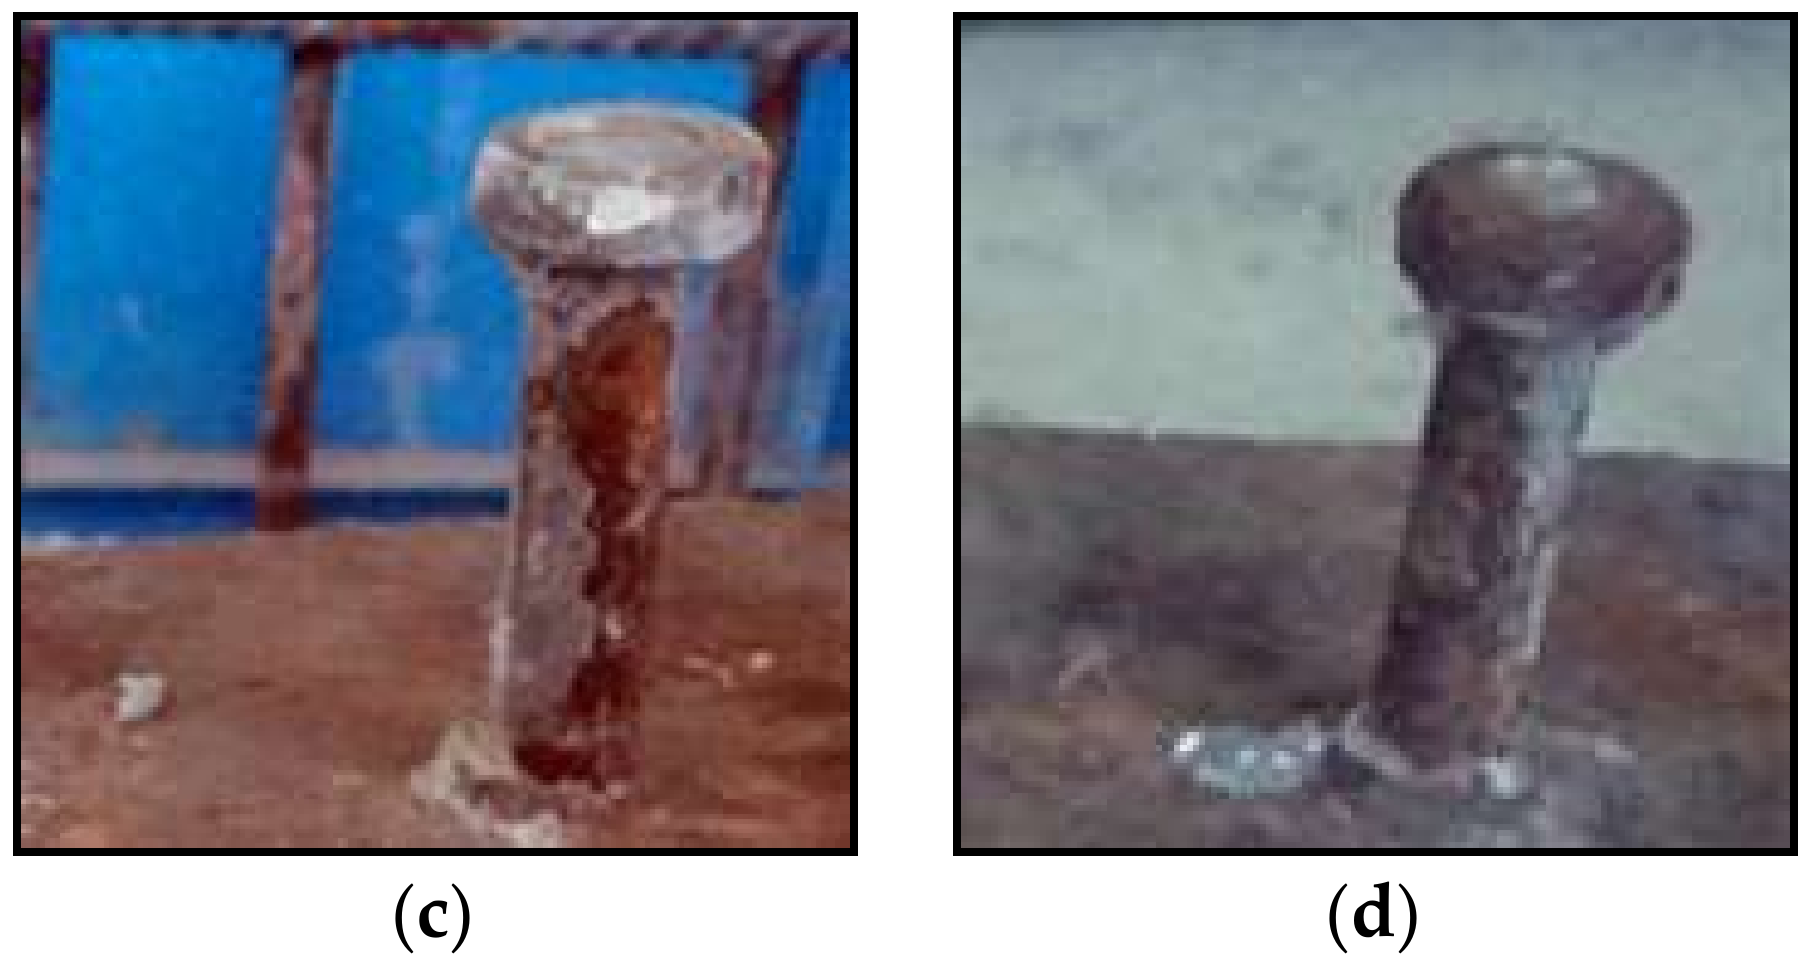
3.3.2. Shear Studs
3.4. Influenceing Factors on the Corrosion Development on Shear Studs
3.4.1. Load-Induced Cracks
3.4.2. Welding Effects
4. Conclusions
Acknowledgments
Author Contributions
Conflicts of Interest
References
- Zhang, R.; Castel, A.; François, R. The corrosion pattern of reinforcement and its influence on serviceability of reinforced concrete members in chloride environment. Cem. Concr. Res. 2009, 39, 1077–1086. [Google Scholar] [CrossRef]
- Rodriguez, J.; Ortega, L.M.; Casal, J. Load carrying capacity of concrete structures with corroded reinforcement. Constr. Build. Mater. 1997, 11, 239–248. [Google Scholar] [CrossRef]
- Neville, A. Chloride attack of reinforced concrete: An overview. Mater. Struct. 1995, 28, 63. [Google Scholar] [CrossRef]
- Bertolini, L.; Elsener, B.; Pedeferri, P.; Redaelli, E.; Polder, R.B. Corrosion of Steel in Concrete: Prevention, Diagnosis, Repair; John Wiley & Sons: Hoboken, NJ, USA, 2013. [Google Scholar]
- Yu, L.; François, R.; Dang, V.H.; L’Hostis, V.; Gagné, R. Development of chloride-induced corrosion in pre-cracked RC beams under sustained loading: Effect of load-induced cracks, concrete cover, and exposure conditions. Cem. Concr. Res. 2015, 67, 246–258. [Google Scholar] [CrossRef]
- Vassie, P. Reinforcement corrosion and the durability of concrete bridges. Proc. Inst. Civ. Eng. 1984, 76, 713–723. [Google Scholar] [CrossRef]
- Asami, K.; Kikuchi, M. In-depth distribution of rusts on a plain carbon steel and weathering steels exposed to coastal–industrial atmosphere for 17 years. Corros. Sci. 2003, 45, 2671–2688. [Google Scholar] [CrossRef]
- Zhang, R.; Castel, A.; François, R. Concrete cover cracking with reinforcement corrosion of RC beam during chloride-induced corrosion process. Cem. Concr. Res. 2010, 40, 415–425. [Google Scholar] [CrossRef]
- Duffó, G.S.; Morris, W.; Raspini, I.; Saragovi, C. A study of steel rebars embedded in concrete during 65 years. Corros. Sci. 2004, 46, 2143–2157. [Google Scholar] [CrossRef]
- François, R.; Arliguie, G. Influence of service cracking on reinforcement steel corrosion. J. Mater. Civ. Eng. 1998, 10, 14–20. [Google Scholar] [CrossRef]
- Arya, C.; Ofori-Darko, F.K. Influence of crack frequency on reinforcement corrosion in concrete. Cem. Concr. Res. 1996, 26, 345–353. [Google Scholar] [CrossRef]
- Otieno, M.B.; Alexander, M.G.; Beushausen, H.D. Corrosion in cracked and uncracked concrete–influence of crack width, concrete quality and crack reopening. Mag. Concr. Res. 2010, 62, 393–404. [Google Scholar] [CrossRef]
- Davis, J.R. Corrosion of Weldments; ASM International: Almere, The Netherlands, 2006. [Google Scholar]
- Xue, W.; Chen, J.; Zhu, J.H. Behaviour of corroded single stud shear connectors. Materials 2017, 10, 276. [Google Scholar] [CrossRef] [PubMed]
- Chen, J.; Zhao, Y.X.; Wu, L.; Jin, W.L. Experimental investigation and design of corroded stud shear connectors. Adv. Struct. Eng. 2016, 19, 218–226. [Google Scholar] [CrossRef]
- Wang, W.L.; Chen, J.; Jin, W.L. Experimental investigation of corroded stud shear connectors subjected to fatigue loading. J. Mater. Civ. Eng. 2016, 29, 04016175. [Google Scholar] [CrossRef]
- Cheese Head Studs for Arc Stud Welding; GB/T10433-2002; General Administration of Quality Supervision, Inspection and Quarantine of P.R.C.: Beijing, China, 2002.
- Testing Hardened Concrete, Part 3: Compressive Strength of Test Specimens; EN BS. 12390-3: 2009; British Standards Institution: London, UK, 2009.
- China National Standard: Code for Design of Concrete Structures; GB50010-2010; China Architecture & Building Press: Beijing, China, 2016.
- China National Standard: Code for Design of Steel Structures; GB50017-2003; China Architecture & Building Press: Beijing, China, 2003.
- Design of Composite Steel and Concrete Structures; ENV 1994-1-1: Eurocode 4; BSI: London, UK, 1994.
- Standard Practice for Preparing, Cleaning, and Evaluating Corrosion Test Specimens, Annual Book of ASTM Standards; G1-03; ASTM: West Conshohocken, PA, USA, 2003; pp. 17–25.
- Fu, C.; Jin, N.; Ye, H.; Jin, X.; Dai, W. Corrosion characteristics of a 4-year naturally corroded reinforced concrete beam with load-induced transverse cracks. Corros. Sci. 2017, 117, 11–23. [Google Scholar] [CrossRef]
- Zhu, W.; François, R.; Zhang, C.; Zhang, D. Propagation of corrosion-induced cracks of the RC beam exposed to marine environment under sustained load for a period of 26 years. Cem. Concr. Res. 2018, 103, 66–76. [Google Scholar] [CrossRef]


| Specimen | Duration (Month) | Number of Wet–Dry Cycles |
|---|---|---|
| CB2M | 2 | 30 |
| CB4M | 4 | 60 |
| CB6M | 6 | 90 |
| CB8M | 8 | 120 |
| CB10M | 10 | 150 |
| CB12M | 12 | 180 |
| CB12MR | 12 | 180 |
| Water (kg/m3) | Cement (kg/m3) | Sand (kg/m3) | Aggregate (kg/m3) |
|---|---|---|---|
| 210.0 | 525.0 | 524.4 | 1114.4 |
| Types | Nominal Diameter (mm) | Measured Area (mm2) | Yield Strength (MPa) | Ultimate Strength (MPa) | Elastic Modulus (GPa) | Elongation at Fracture δ5 (%) |
|---|---|---|---|---|---|---|
| Stud | 10 | 75.38 | 462.7 | 521.2 | 194.0 | 26.4 |
| Steel Beam | — | — | 333.6 | 478.7 | 201.0 | 38.7 |
| HPB235 | 6 | 28.80 | 298.5 | 381.2 | 194.0 | 30.0 |
| HPB235 | 8 | 52.30 | 427.3 | 617.0 | 196.0 | 29.2 |
| HRB335 | 10 | 80.75 | 447.6 | 594.2 | 200.0 | 33.5 |
© 2018 by the authors. Licensee MDPI, Basel, Switzerland. This article is an open access article distributed under the terms and conditions of the Creative Commons Attribution (CC BY) license (http://creativecommons.org/licenses/by/4.0/).
Share and Cite
Xue, W.; Chen, J.; Xu, F.; Jiang, A.-y. Corrosion Development of Carbon Steel Grids and Shear Connectors in Cracked Composite Beams Exposed to Wet–Dry Cycles in Chloride Environment. Materials 2018, 11, 479. https://doi.org/10.3390/ma11040479
Xue W, Chen J, Xu F, Jiang A-y. Corrosion Development of Carbon Steel Grids and Shear Connectors in Cracked Composite Beams Exposed to Wet–Dry Cycles in Chloride Environment. Materials. 2018; 11(4):479. https://doi.org/10.3390/ma11040479
Chicago/Turabian StyleXue, Wen, Ju Chen, Fei Xu, and Ao-yu Jiang. 2018. "Corrosion Development of Carbon Steel Grids and Shear Connectors in Cracked Composite Beams Exposed to Wet–Dry Cycles in Chloride Environment" Materials 11, no. 4: 479. https://doi.org/10.3390/ma11040479
APA StyleXue, W., Chen, J., Xu, F., & Jiang, A.-y. (2018). Corrosion Development of Carbon Steel Grids and Shear Connectors in Cracked Composite Beams Exposed to Wet–Dry Cycles in Chloride Environment. Materials, 11(4), 479. https://doi.org/10.3390/ma11040479