Article

Sulfide Stress Cracking Behavior of a Martensitic Steel Controlled by Tempering Temperature

1
Laboratory of Metastable Materials Science and Technology, Yanshan University, Qinhuangdao 066004, China
2
Technical Center, Tianjin Pipe (Group) Corporation Limited, Tianjin 300301, China
3
National Engineering Research Center for Equipment and Technology of Cold Strip Rolling, Yanshan University, Qinhuangdao 066004, China
*
Author to whom correspondence should be addressed.
Materials 2018, 11(3), 412; https://doi.org/10.3390/ma11030412
Submission received: 18 January 2018 / Revised: 1 March 2018 / Accepted: 7 March 2018 / Published: 9 March 2018

Abstract

:
A medium-carbon Cr–Mo–V martensitic steel was thermally processed by quenching (Q) at 890 °C and tempering (T) at increasing temperatures from 650 °C to 720 °C and the effect of tempering temperature, Tt, on sulfide stress cracking (SSC) behaviors was estimated mainly via double cantilever beam (DCB) and electrochemical hydrogen permeation (EHP) tests and microstructure characterization. The results indicate that the threshold stress intensity factor for SSC, KISSC, increased with increasing Tt. The overall and local H concentration around the inclusions decreased with increasing Tt, due to reductions in the amounts of solute atoms, grain boundaries and dislocations, which effectively prevented SSC initiation. Also, increasing Tt caused an increased fraction of high-angle boundaries, which evidently lowered the SSC propagation rate by more frequently diverting the propagating direction and accordingly restricted SSC propagation. The overall SSC resistance of this Q&T–treated steel was therefore significantly enhanced.

1. Introduction

Quenching and tempering (Q&T)–treated martensitic steels have long been widely used for important oil country tubular goods production, such as C90–C110 or higher grades for sour oil/gas well service [1,2], T125 and V150 grades for ultra-deep oil/gas well service [3,4,5] and 155 ksi or higher grades for perforation and drill services [6]. However, these high-strength martensitic steels normally have a high susceptibility to sulfide stress cracking (SSC)/hydrogen-induced cracking (HIC) [1]. Therefore, there have been extensive efforts [7,8,9,10,11,12,13,14,15,16,17,18,19,20,21,22] to understand the mechanisms governing SSC/HIC behaviors and to achieve the desired combination of high strength, high toughness and superior SSC/HIC resistance in these steels by optimizing the alloying design, metallurgical quality and Q&T parameters.
Among these efforts, the correlations between various metallurgical factors and the susceptibility to SSC/HIC have recently received increasing attention [7,8,9,10,11,12,13,14,15,16,17,18,19,20,21,22]. Once these steels are exposed to the sour environment, atomic hydrogen (H) can form on the material surface due to the H+→H reaction [11], which depends on environmental and surface conditions. After the H atoms enter the material, these metallurgical factors might have their respective impacts on H mobility or diffusion [10], by acting as reversible (solute atoms, dislocations, grain boundaries, etc.) or irreversible (nonmetallic inclusions, precipitated particles, voids, etc.) traps for H atoms, depending on their binding enthalpies with H [12] and contributing to the susceptibility to SSC/HIC in different degrees [23,24,25]. Some investigations have suggested that reversible traps, where the H commonly escapes at room temperature, might have a strong effect on H embrittlement [13]. In contrast, irreversible traps, where H can escape only at high temperatures, such as 250 °C or above, might not participate in this behavior [13,14,15]. However, previous works have also identified SSC/HIC initiation at certain inclusions, such as non-deformable Al2O3 [17,18] and large-sized TiN/TiC particles [19] and at their interface with the matrix [26], even though they were irreversible traps. Moreover, once SSC/HIC initiates, it might propagate toward certain preferred directions or zones, such as the phase boundary, the segregation zone, or the particular crystallographic orientation. According to Reference [20], high-angle grain boundaries (HAGBs) with a high misorientation angle (MA ≥ 15°) might store higher energy and provide both more potent sites for H trapping and easier paths for crack propagation, in comparison with low-angle grain boundaries (LAGBs, MA < 15°), eventually leading to higher susceptibility to HIC in X70 pipeline steel. On the contrary, it was reported that for Q&T–treated martensitic steels, SSC could be arrested at HAGBs [26] and the threshold stress intensity factor for SSC, KISSC, increased with decreasing size of martensitic packet with high-angle boundaries [22], indicating enhanced SSC resistance. On the other hand, Omura et al. [27] reported significantly enhanced SSC resistance in a martensitic steel via increases in tempering temperature, Tt and time and attributed it to a martensitic ferrite matrix with fewer dislocations and more dispersed carbides. This indicates that the SSC resistance of martensitic steels could be effectively enhanced by improving the tempering process.
Therefore, these various metallurgical factors have exerted complex effects on the susceptibility to SSC/HIC, which were originally and essentially correlated to SSC evolution, including three stages of the entry of H atoms, SSC/HIC initiation and propagation. The effects of some metallurgical aspects (e.g., GB, dislocation and precipitate) on a single stage of SSC/HIC evolution in martensitic/bainitic steels, namely the entry of H atoms and SSC/HIC propagation, were estimated in previous work [28] by electrochemical hydrogen permeation (EHP) [29] and double cantilever beam (DCB) tests [30]. This led to some contradictory effects (e.g., GBs) on the overall resistance to SSC/HIC in previous reports. It was therefore essential to further clarify their effects on the overall resistance to SSC/HIC by determining their correlation with the whole SSC/HIC evolution. However, these efforts have been rarely reported, to the authors’ knowledge.
For this attempt, a martensitic steel was thermally processed via Q&T at differing Tt, providing a group of samples with quite different microstructural features of GBs, dislocations and precipitates. Their effects on SSC behavior, namely H mobility, SSC initiation/propagation and overall resistance to SSC (KISSC), were estimated mainly through microstructure characterization and EHP and DCB tests. The mechanisms governing these correlations are also discussed.

2. Results

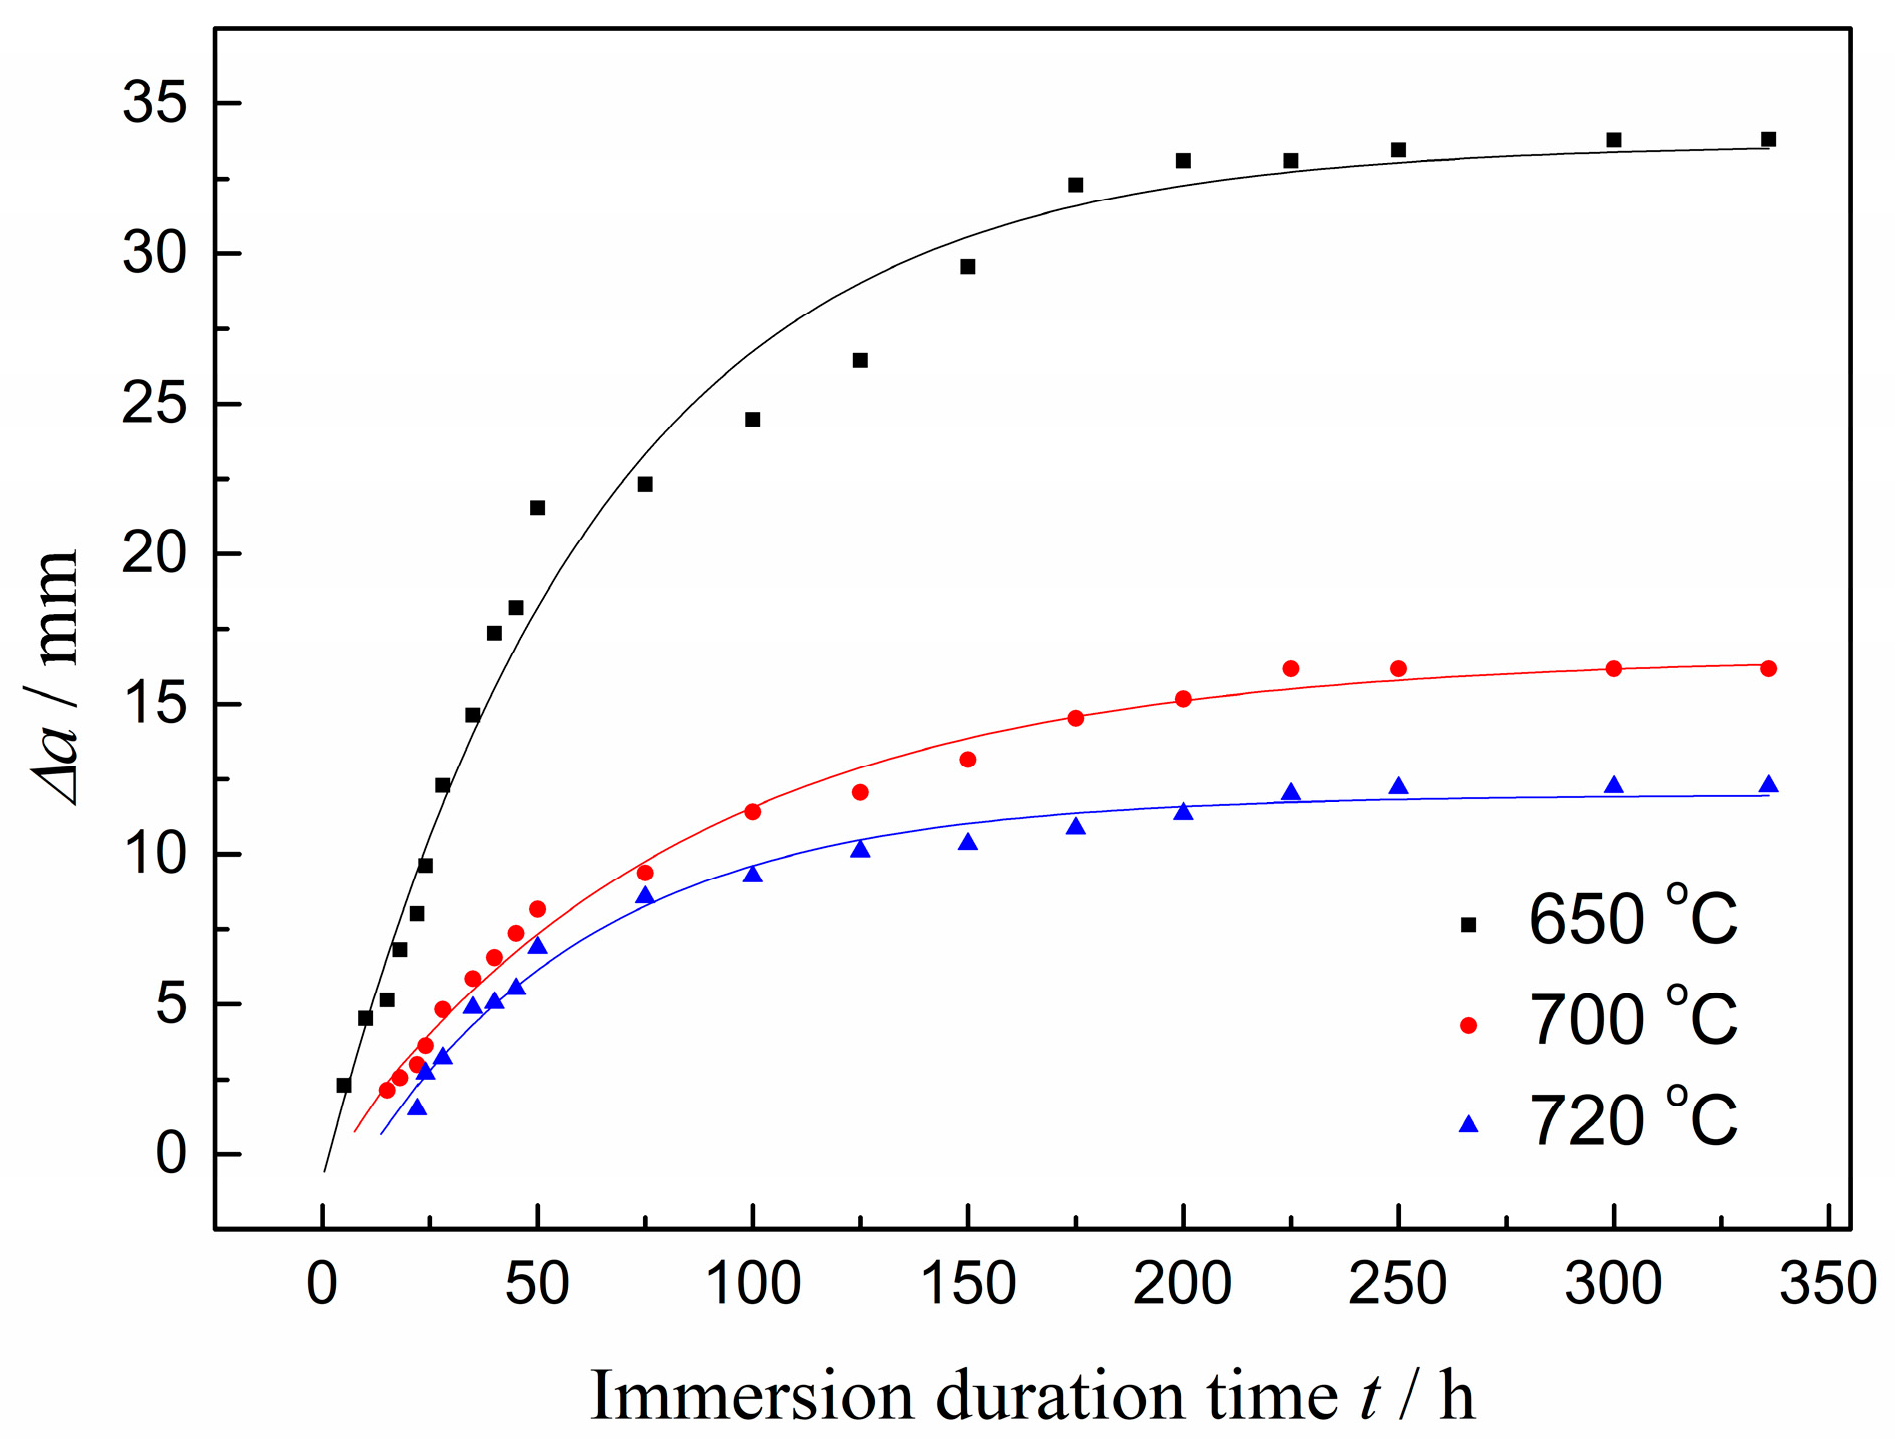
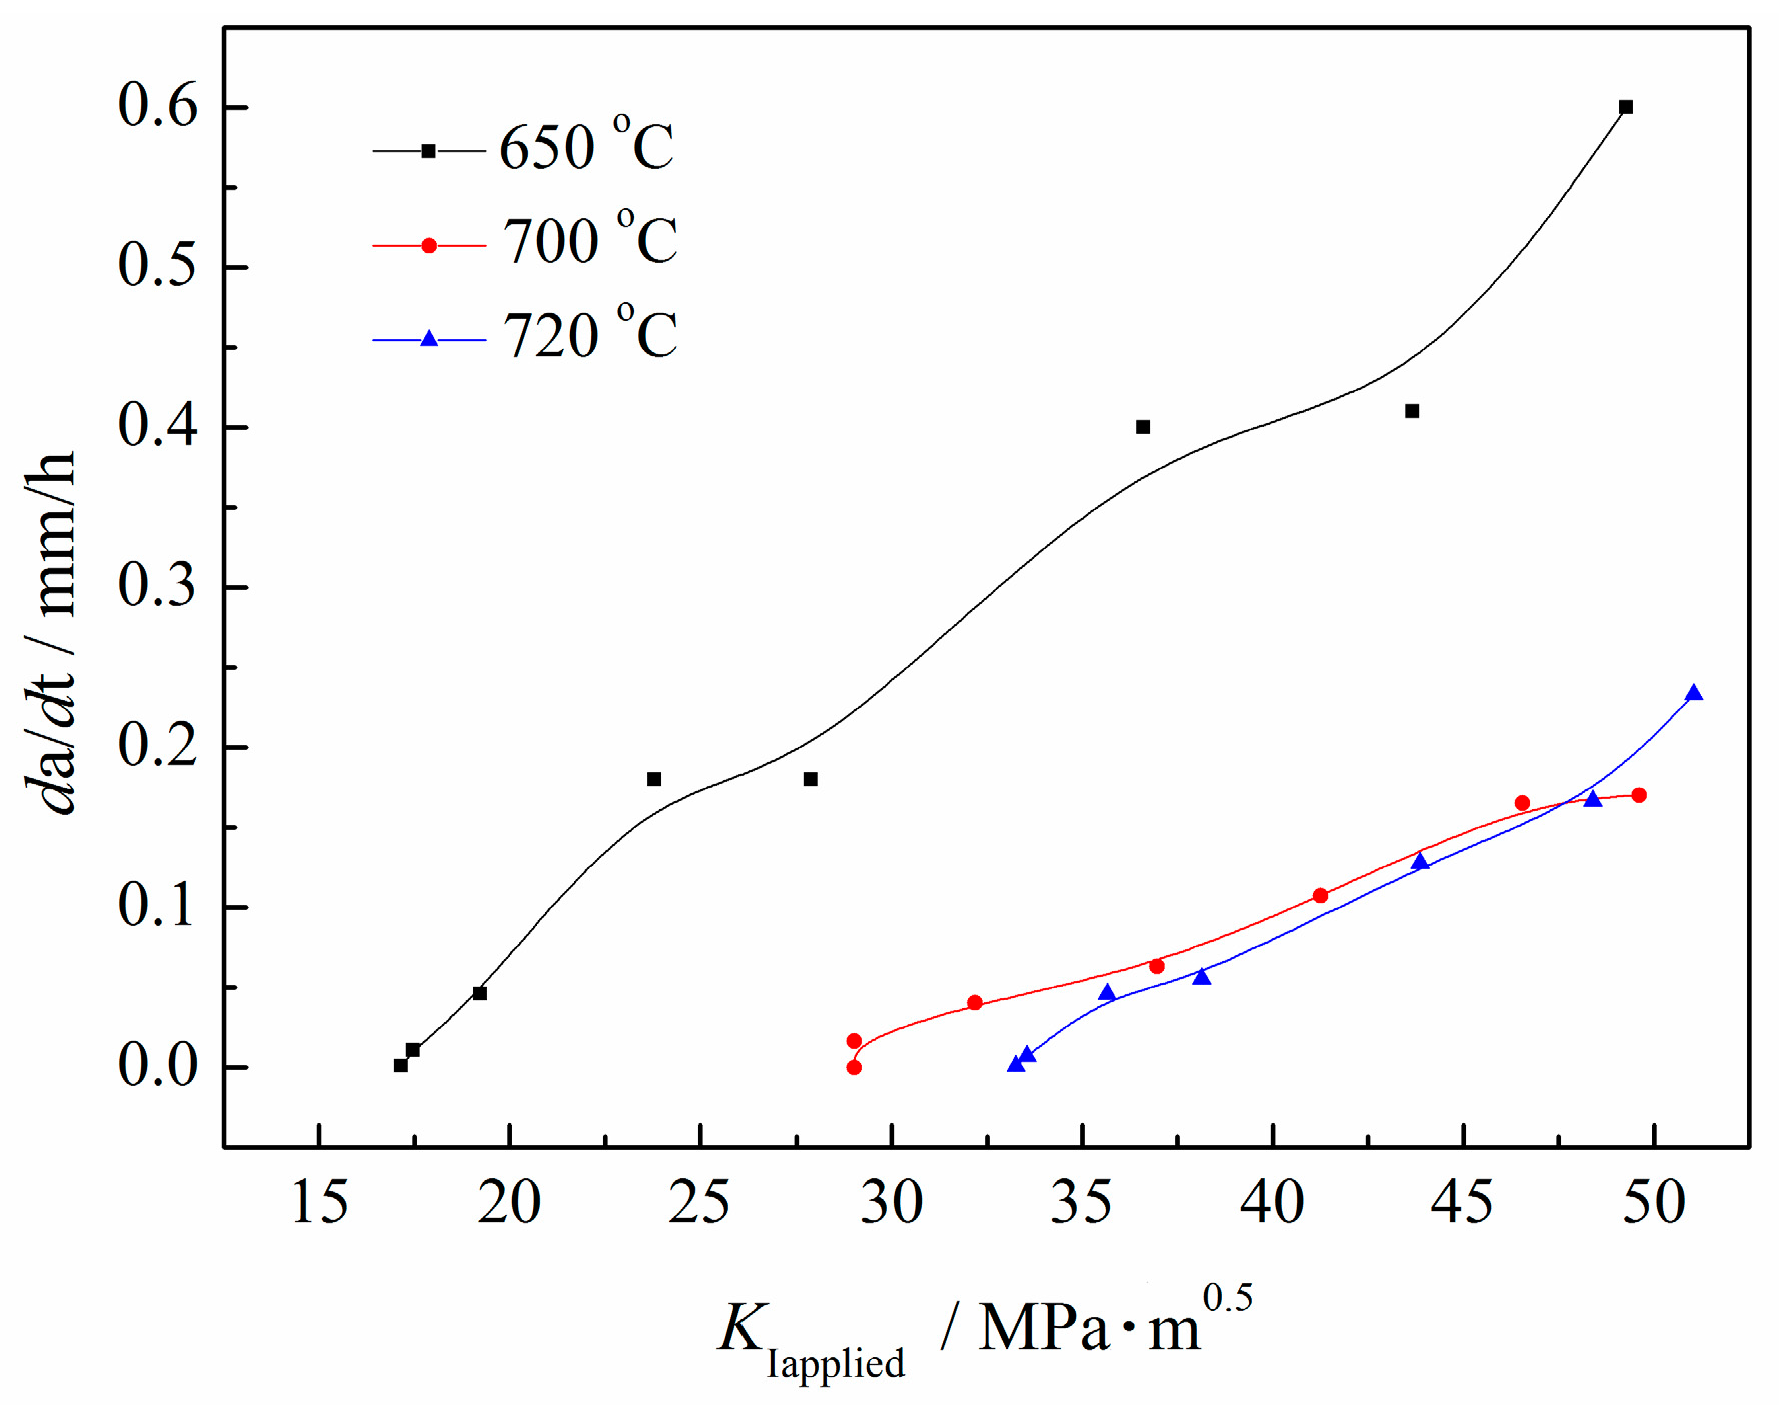
2.1. Mechanical Property and KISSC Values

The mechanical properties of each Q&T–treated sample are summarized in Table 1, indicating that the yield strength (YS), tensile strength (TS) and hardness (HRC) decreased, while the elongation (EL) at rupture increased with elevating Tt. The KISSC for each Q&T–treated sample was also determined via the DCB test and is also summarized in Table 1. As the table shows, KISSC increased from 17.16 MPa∙mm−0.5 to 33.26 MPa∙mm−0.5 with increasing Tt from 650 °C to 720 °C, indicating an enhanced overall resistance to SSC due to the increased Tt.
The instantaneous SSC propagation length for each Q&T–treated sample was measured with the DCB test interrupted, according to the NACE (National Association of Corrosion Engineer) TM0177 standard [31] and evaluated as a function of immersing time (t), as shown in Figure 1. This reveals that SSC probably developed in three stages: initiation, rapid and palliative propagation. For the first stage, SSC was not detected for a couple of hours, the inoculation period after the DCB specimen was immersed in the solution, during which the diffusion of H atoms into the crystalline interstices and voids was assumed to be accumulated for initializing the H damage. For the second stage, SSC grew rapidly with the simultaneous assistance of the highly concentrated stress and the accumulated H atoms. For the third stage, SSC grew at a gradual reduced rate and approached a metastable state, where its propagation was almost imperceptible, probably due to the relaxation of concentrated stress and the approximately saturated H atom concentration.
As also indicated in Figure 1, the steel tempered at 720 °C had both the longest inoculation period for detected SSC and the least SSC propagation length among these Q&T–treated samples. SSC initiated over a longer time and propagated at a decreased length with the increased Tt.
SSC propagation behaviors were also interpreted in terms of the correlation between da/dt and KIapplied, as shown in Figure 2. This indicates that da/dt decreased as a result of decreasing KIapplied. With KIapplied decreased to a certain value, da/dt approached zero, where KISSC was obtained, according to the NACE TM0177 standard [31]. Furthermore, da/dt decreased and KISSC increased with increasing Tt, indicating that the high-temperature tempering retarded SSC propagation and correspondingly enhanced SSC resistance.

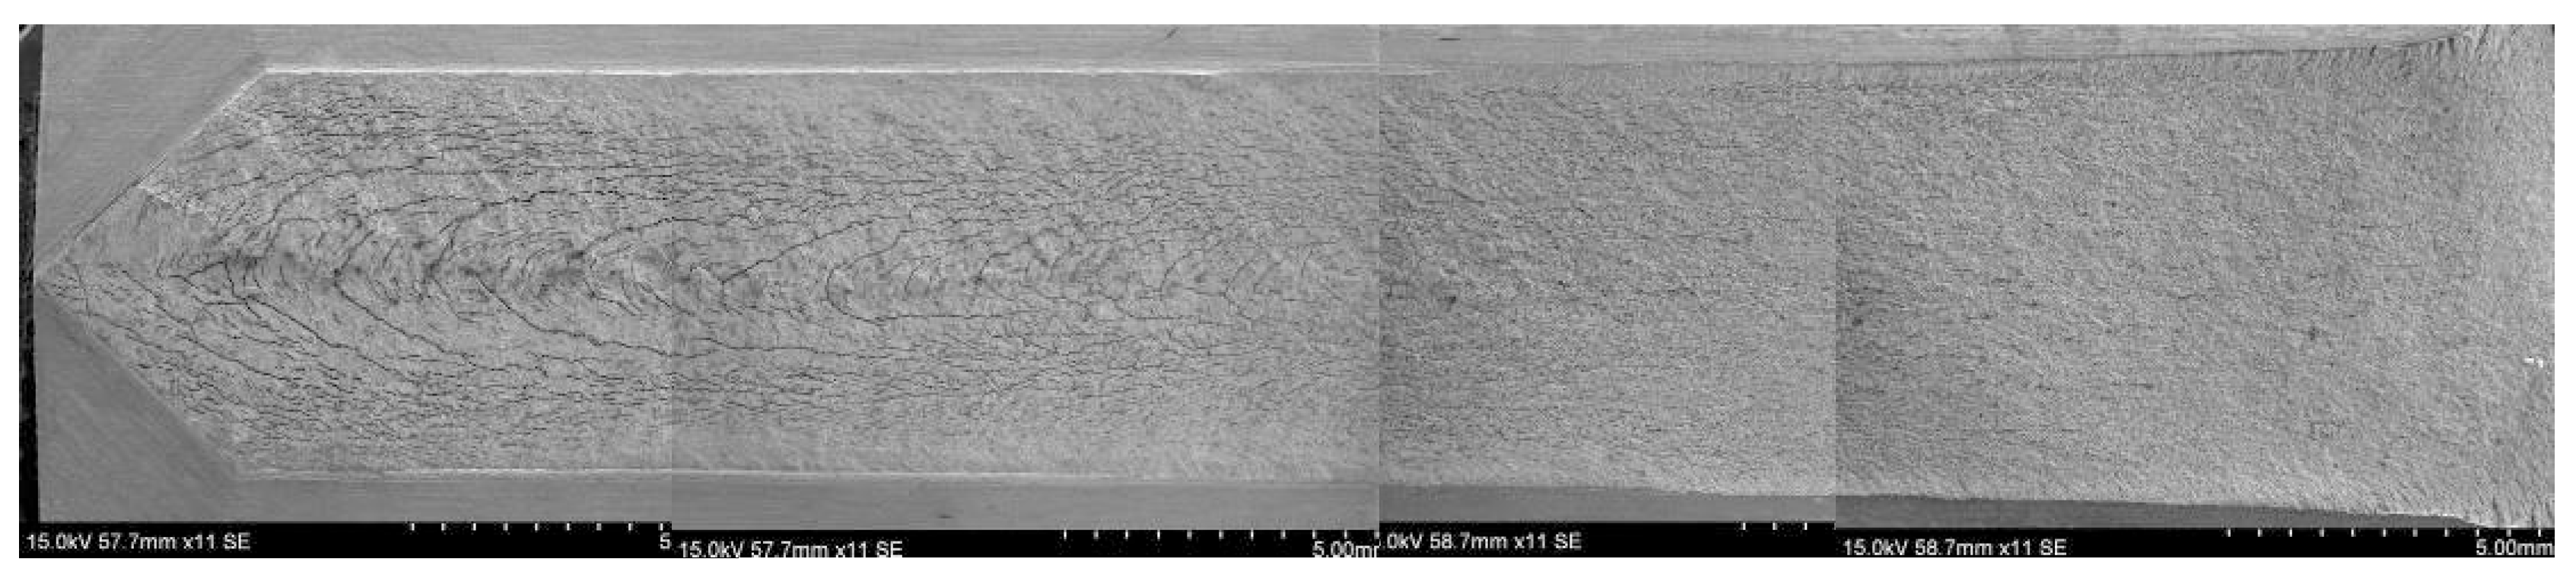
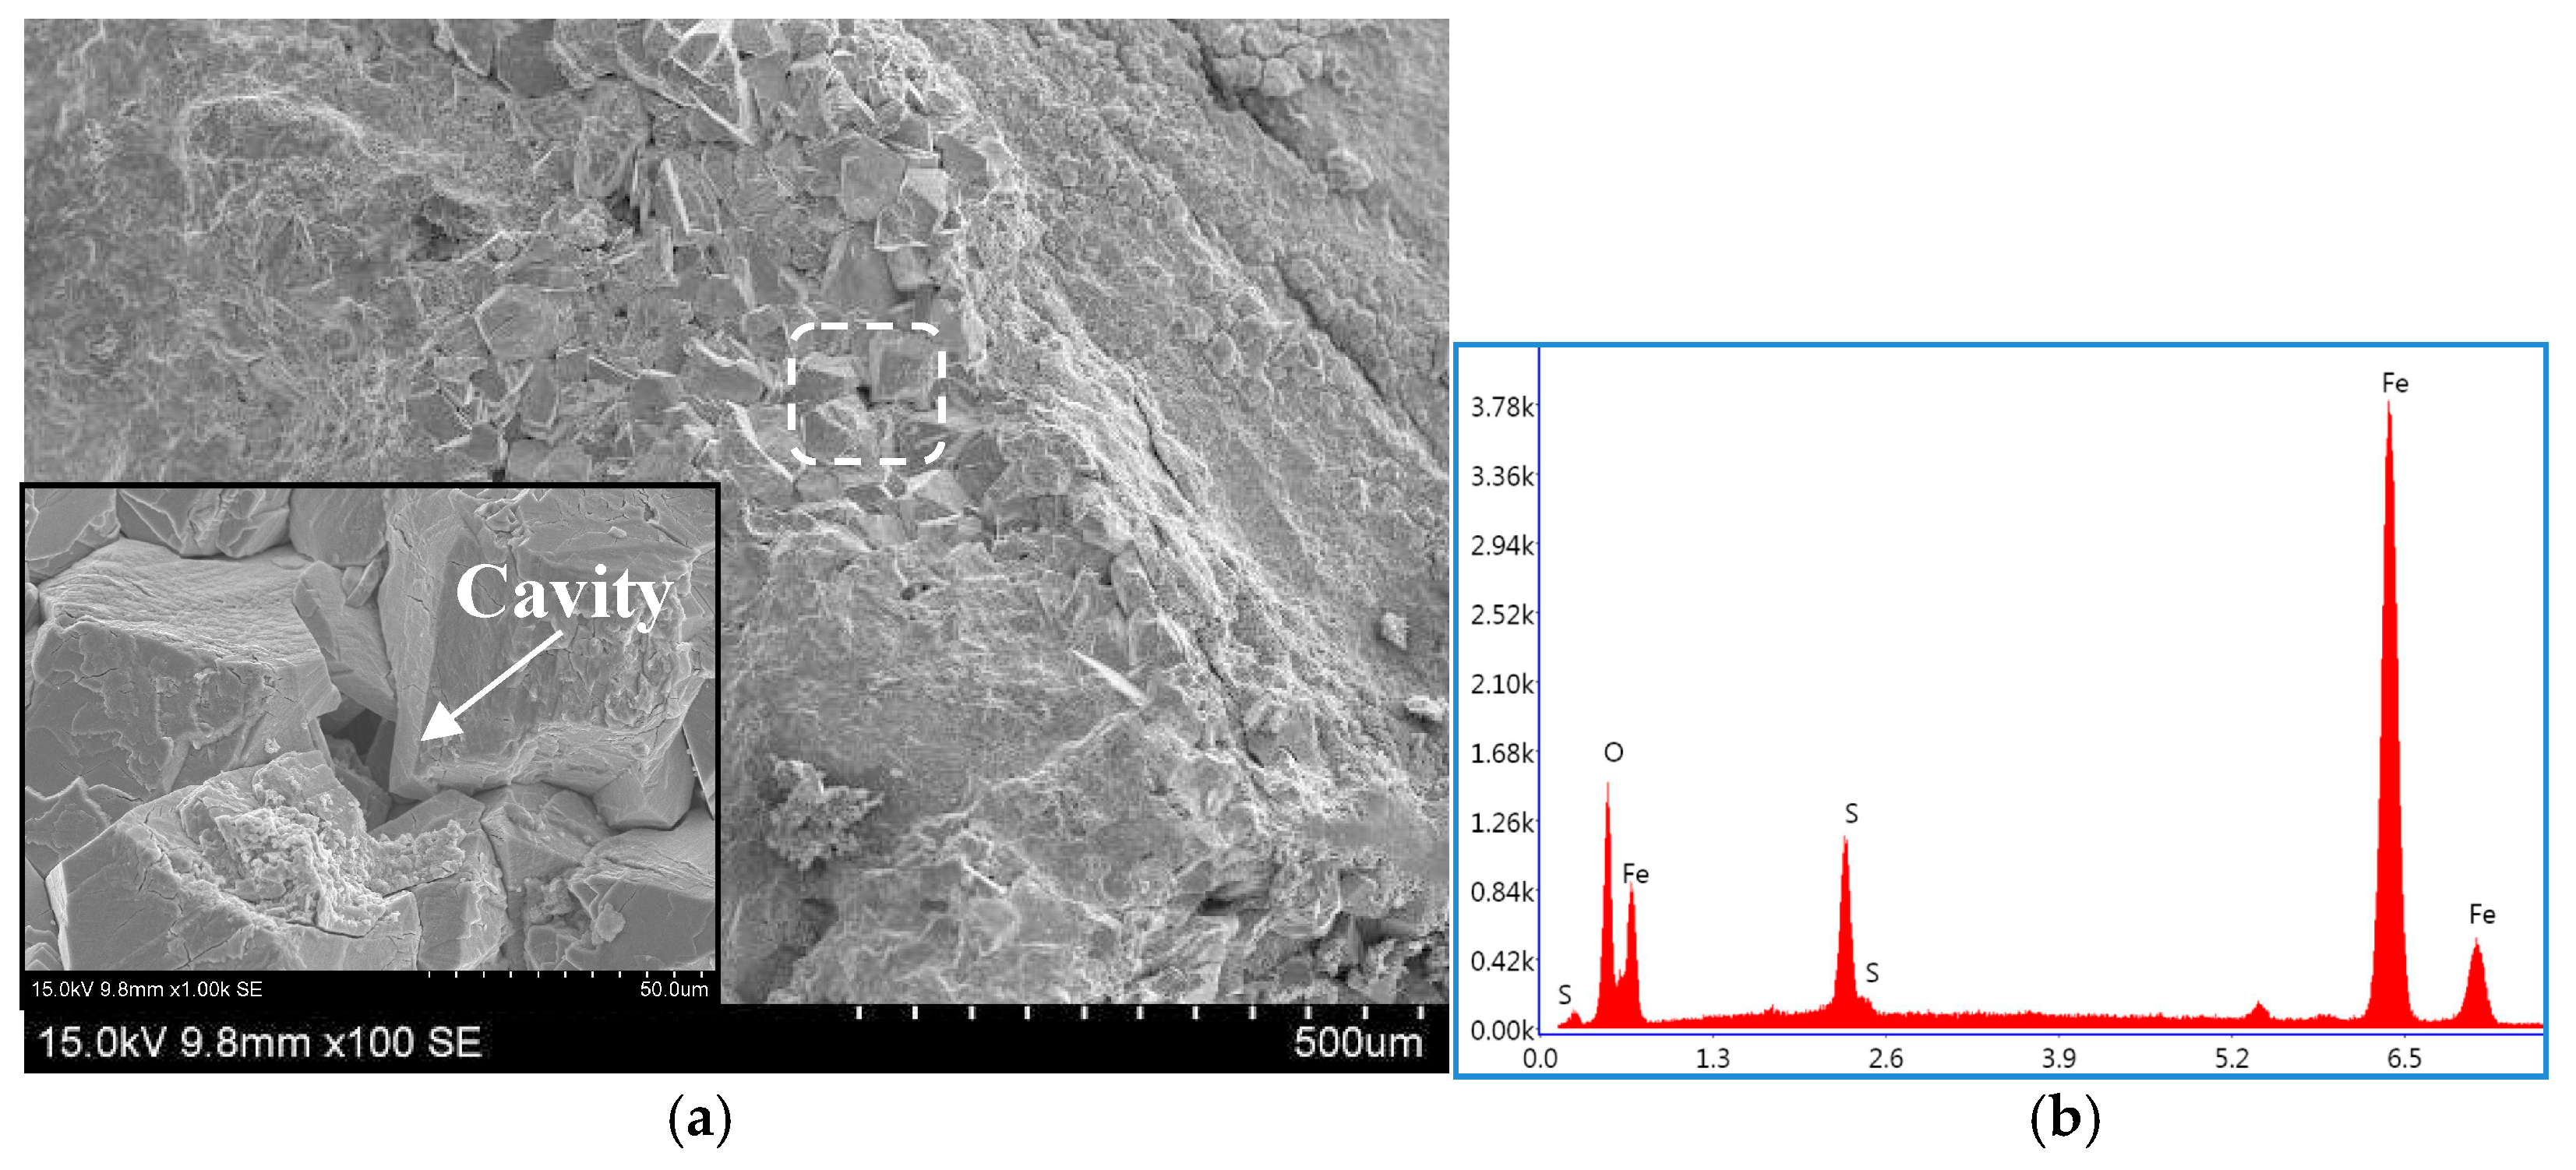
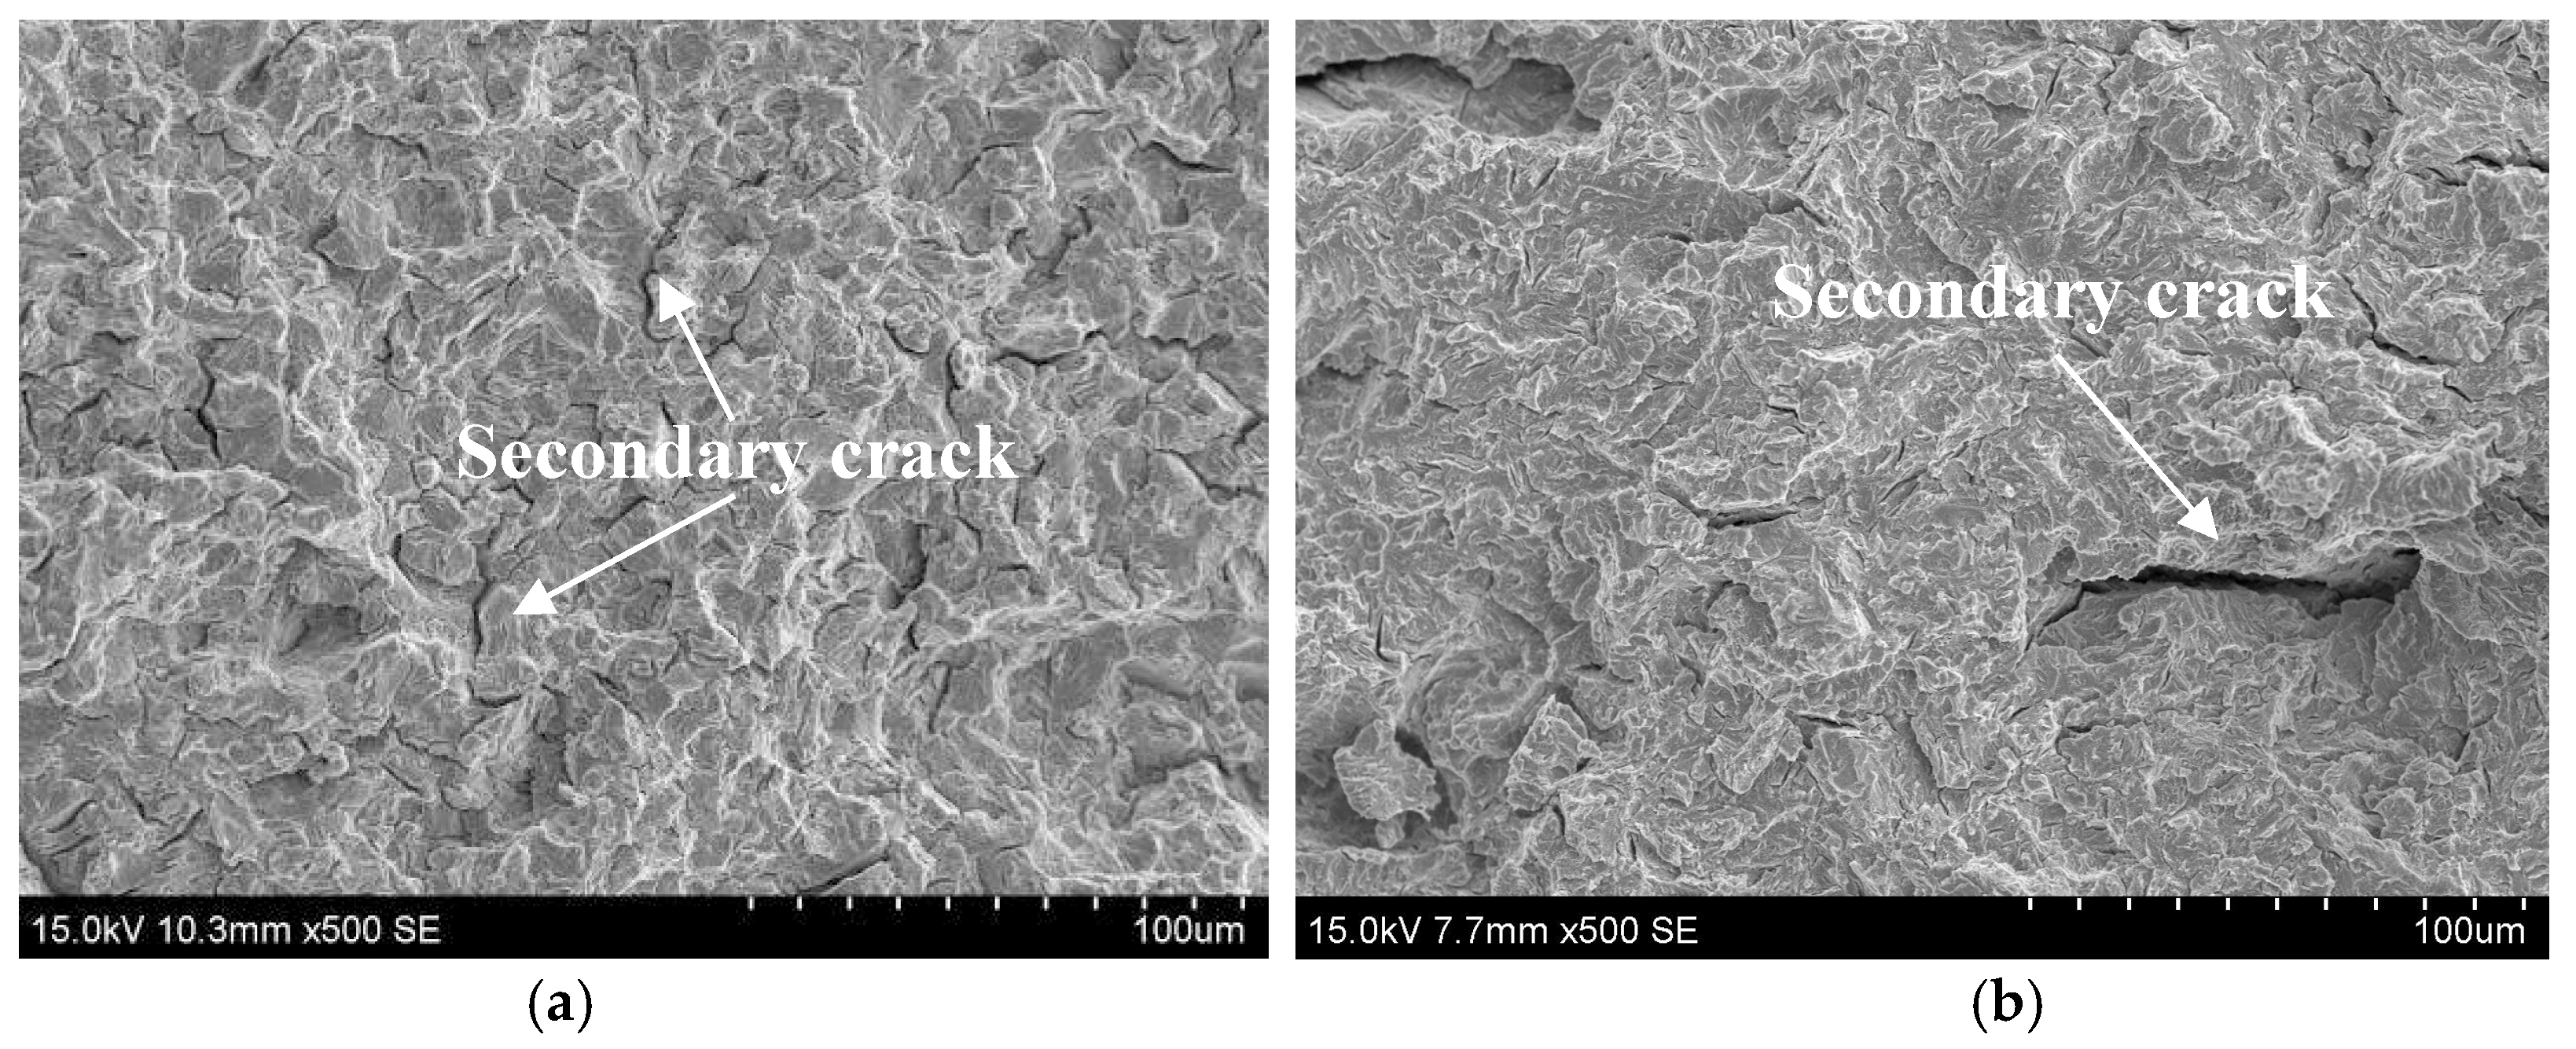
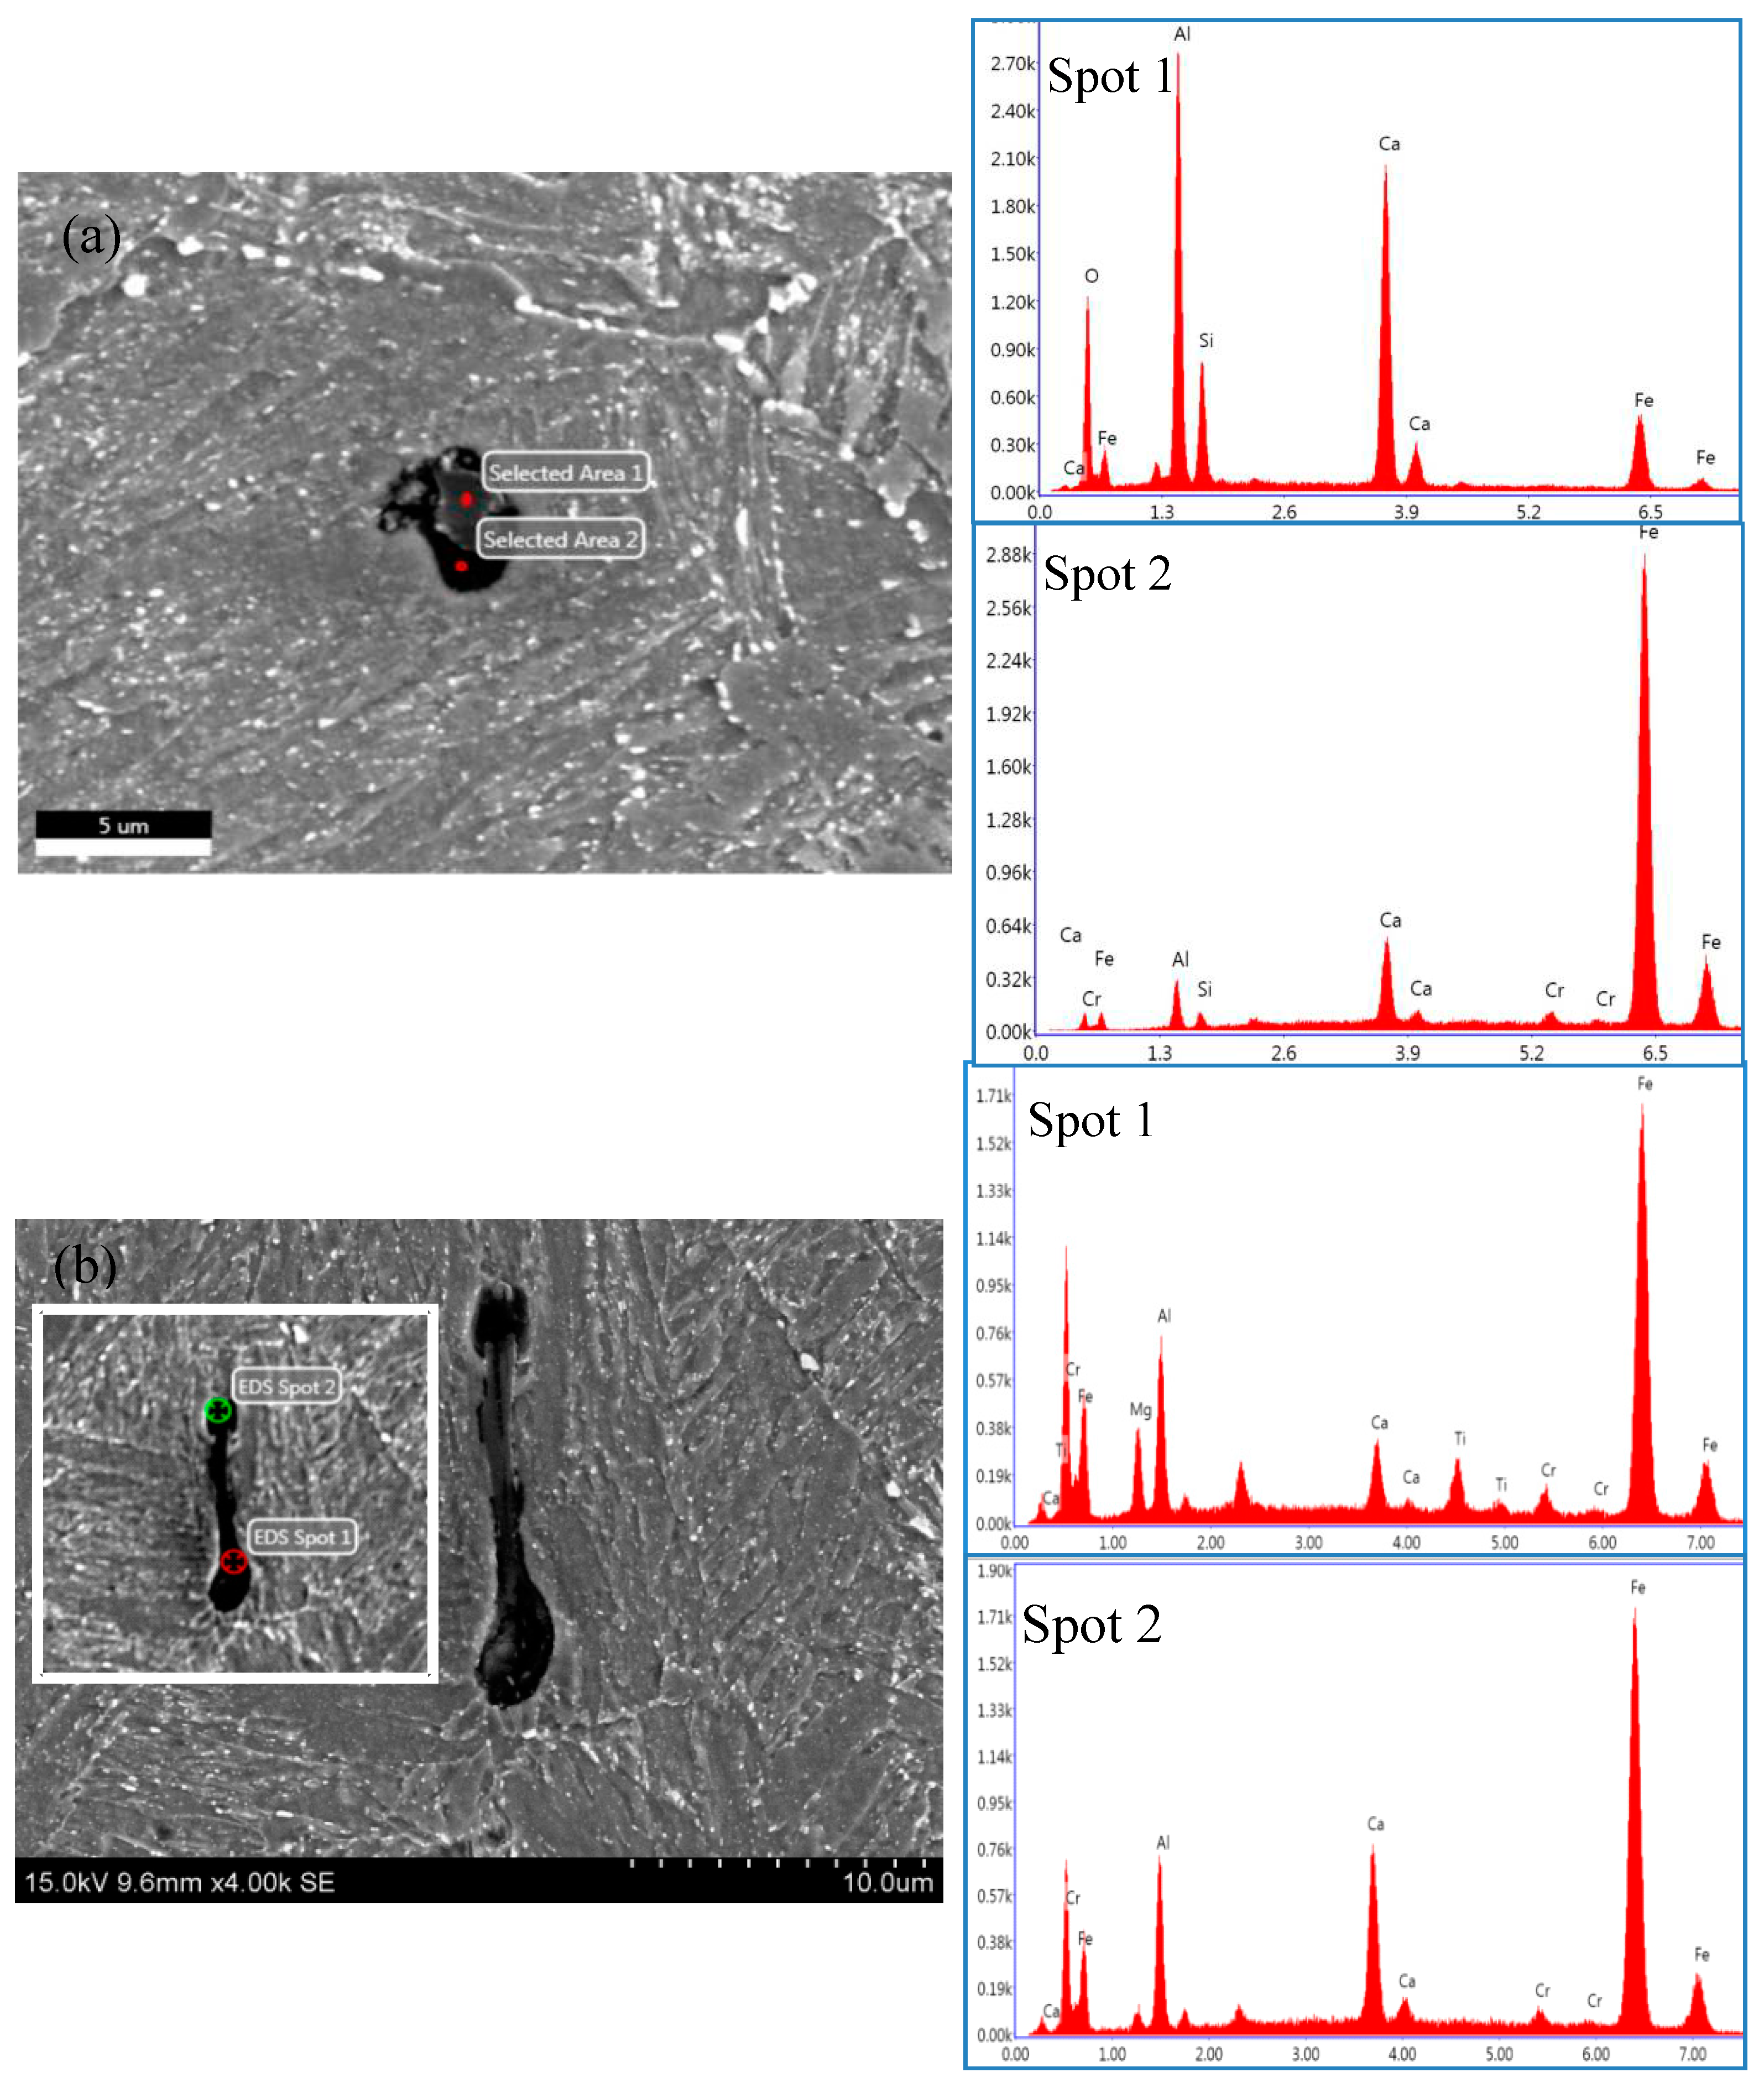
2.2. SSC Fracture Morphology of the DCB Specimen

Figure 3 shows a typical SSC fracture morphology of the DCB specimen tempered at 700 °C. It can be seen that the fracture surface was covered with a corrosion product film that was rich in Fe and S, as examined by EDS (energy dispersive spectroscopy) analysis, illustrated in Figure 4. The corrosion film was loose and featured microcracks and micropores, probably leading to poor resistance to the migration of HS or S2− to the fresh material surface.
The corrosion film was subsequently removed with a solution of dilute hydrochloric acid and hexamethylene tetramine and the real SSC fracture surface is shown in Figure 5. Actually, the SSC fracture was a typical quasi-cleavage cracking, featuring some random secondary cracks underneath the fracture surface, consistent with an early work reported by Dadfarnia et al. [28]. In addition, some intergranular fracture areas were also perceptible on the fracture surface in all the DCB samples.

2.3. Microstructure Observation

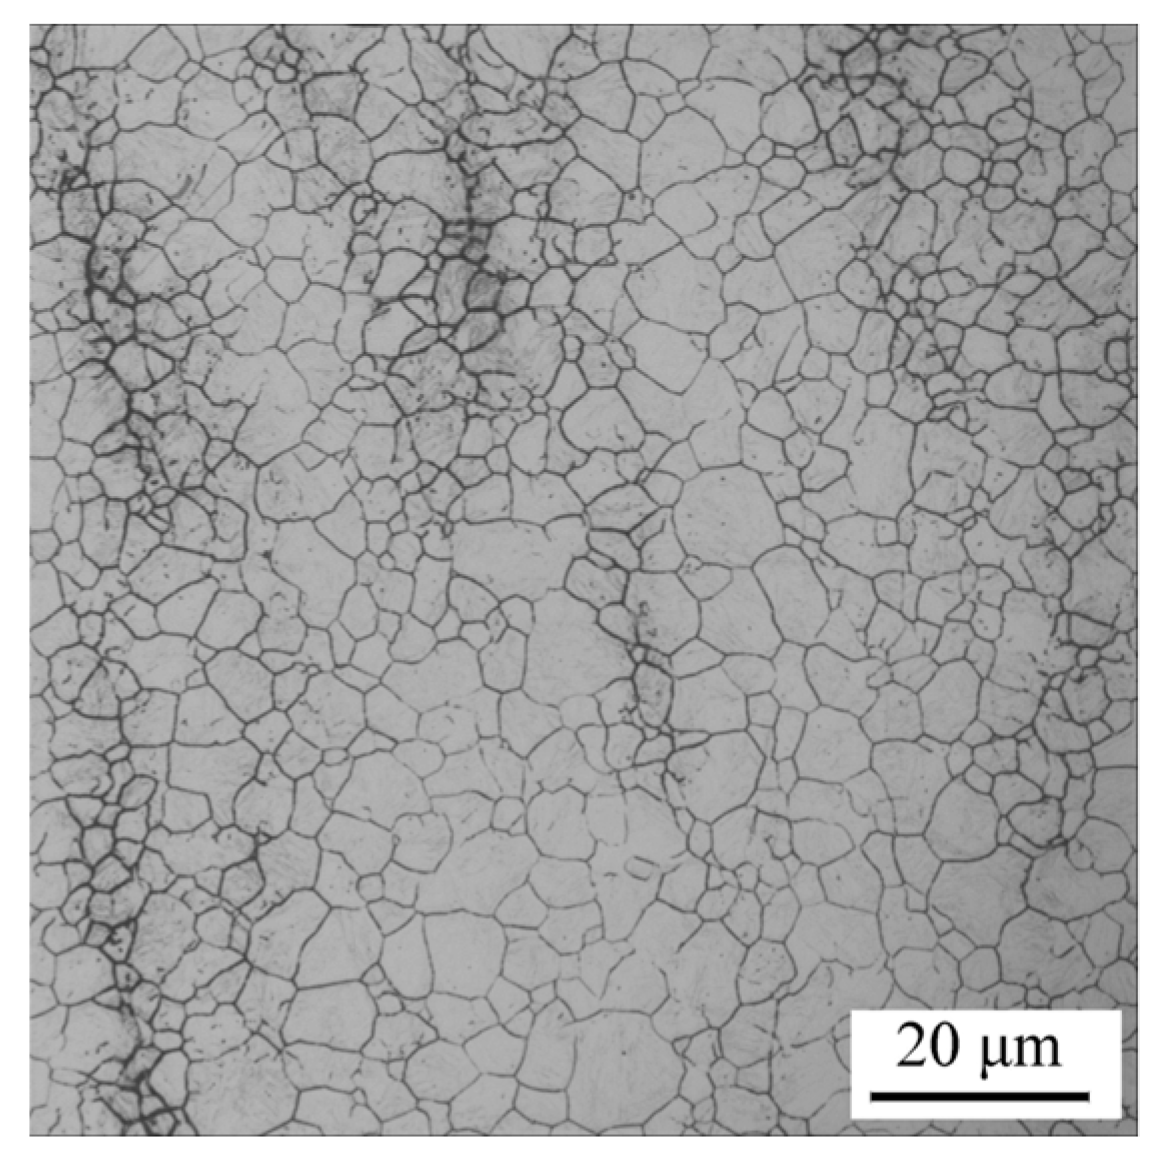
2.3.1. Prior Austenite Grain Observation

The typical prior austenite grain (PAG) morphology of the samples quenched at an identical temperature of 890 °C, waiting for further tempering at differing Tt, is shown in Figure 6. The average PAG size, Dγ, was quantitatively estimated and is summarized in Table 2. As the table states, Dγ remained at almost the same level of 7.5 μm under identical quenching conditions.

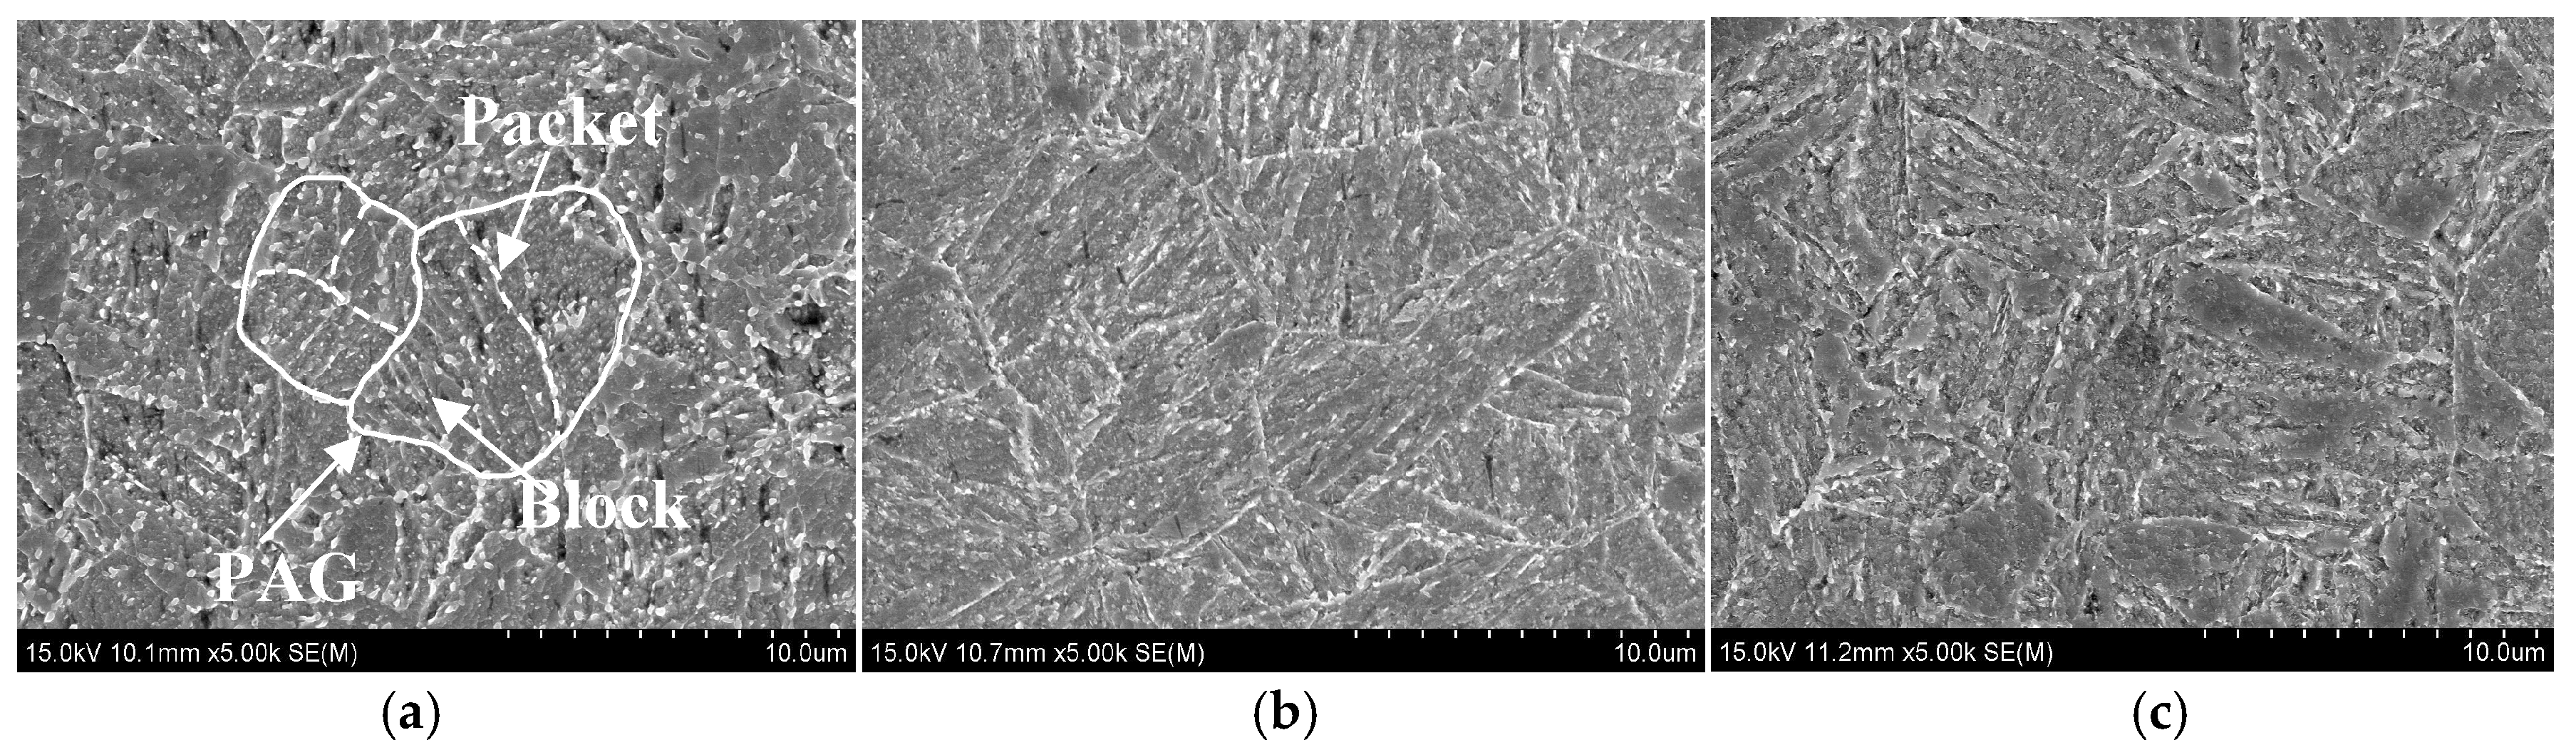
2.3.2. Martensitic Structure Observations

The PAG of martensitic steel can normally be partitioned into three types of martensitic substructures: packet, block and lath [32,33]. The martensitic packet and block in each Q&T–treated sample were also characterized via SEM and electron back-scattered diffraction (EBSD), as shown in Figure 7 and Figure 8, respectively. The average packet and block size, Dp and Db, were quantitatively determined and are summarized in Table 2. This demonstrates that Dp and Db increased with increasing Tt from 650 °C to 720 °C. The grain boundary misorientation angle (GBMA) might play a significant role in controlling SSC resistance by affecting hydrogen permeability [20,34] and crack propagation [21,26]. Therefore, the GBMA distribution of martensitic substructure in each Q&T–treated sample was also analyzed via EBSD and the fraction of the HAGBs, fGBMA≥15°, is summarized in Table 2. As presented, HAGBs were in the majority in each sample and fGBMA≥15° increased slightly with increasing Tt from 650 to 720 °C.

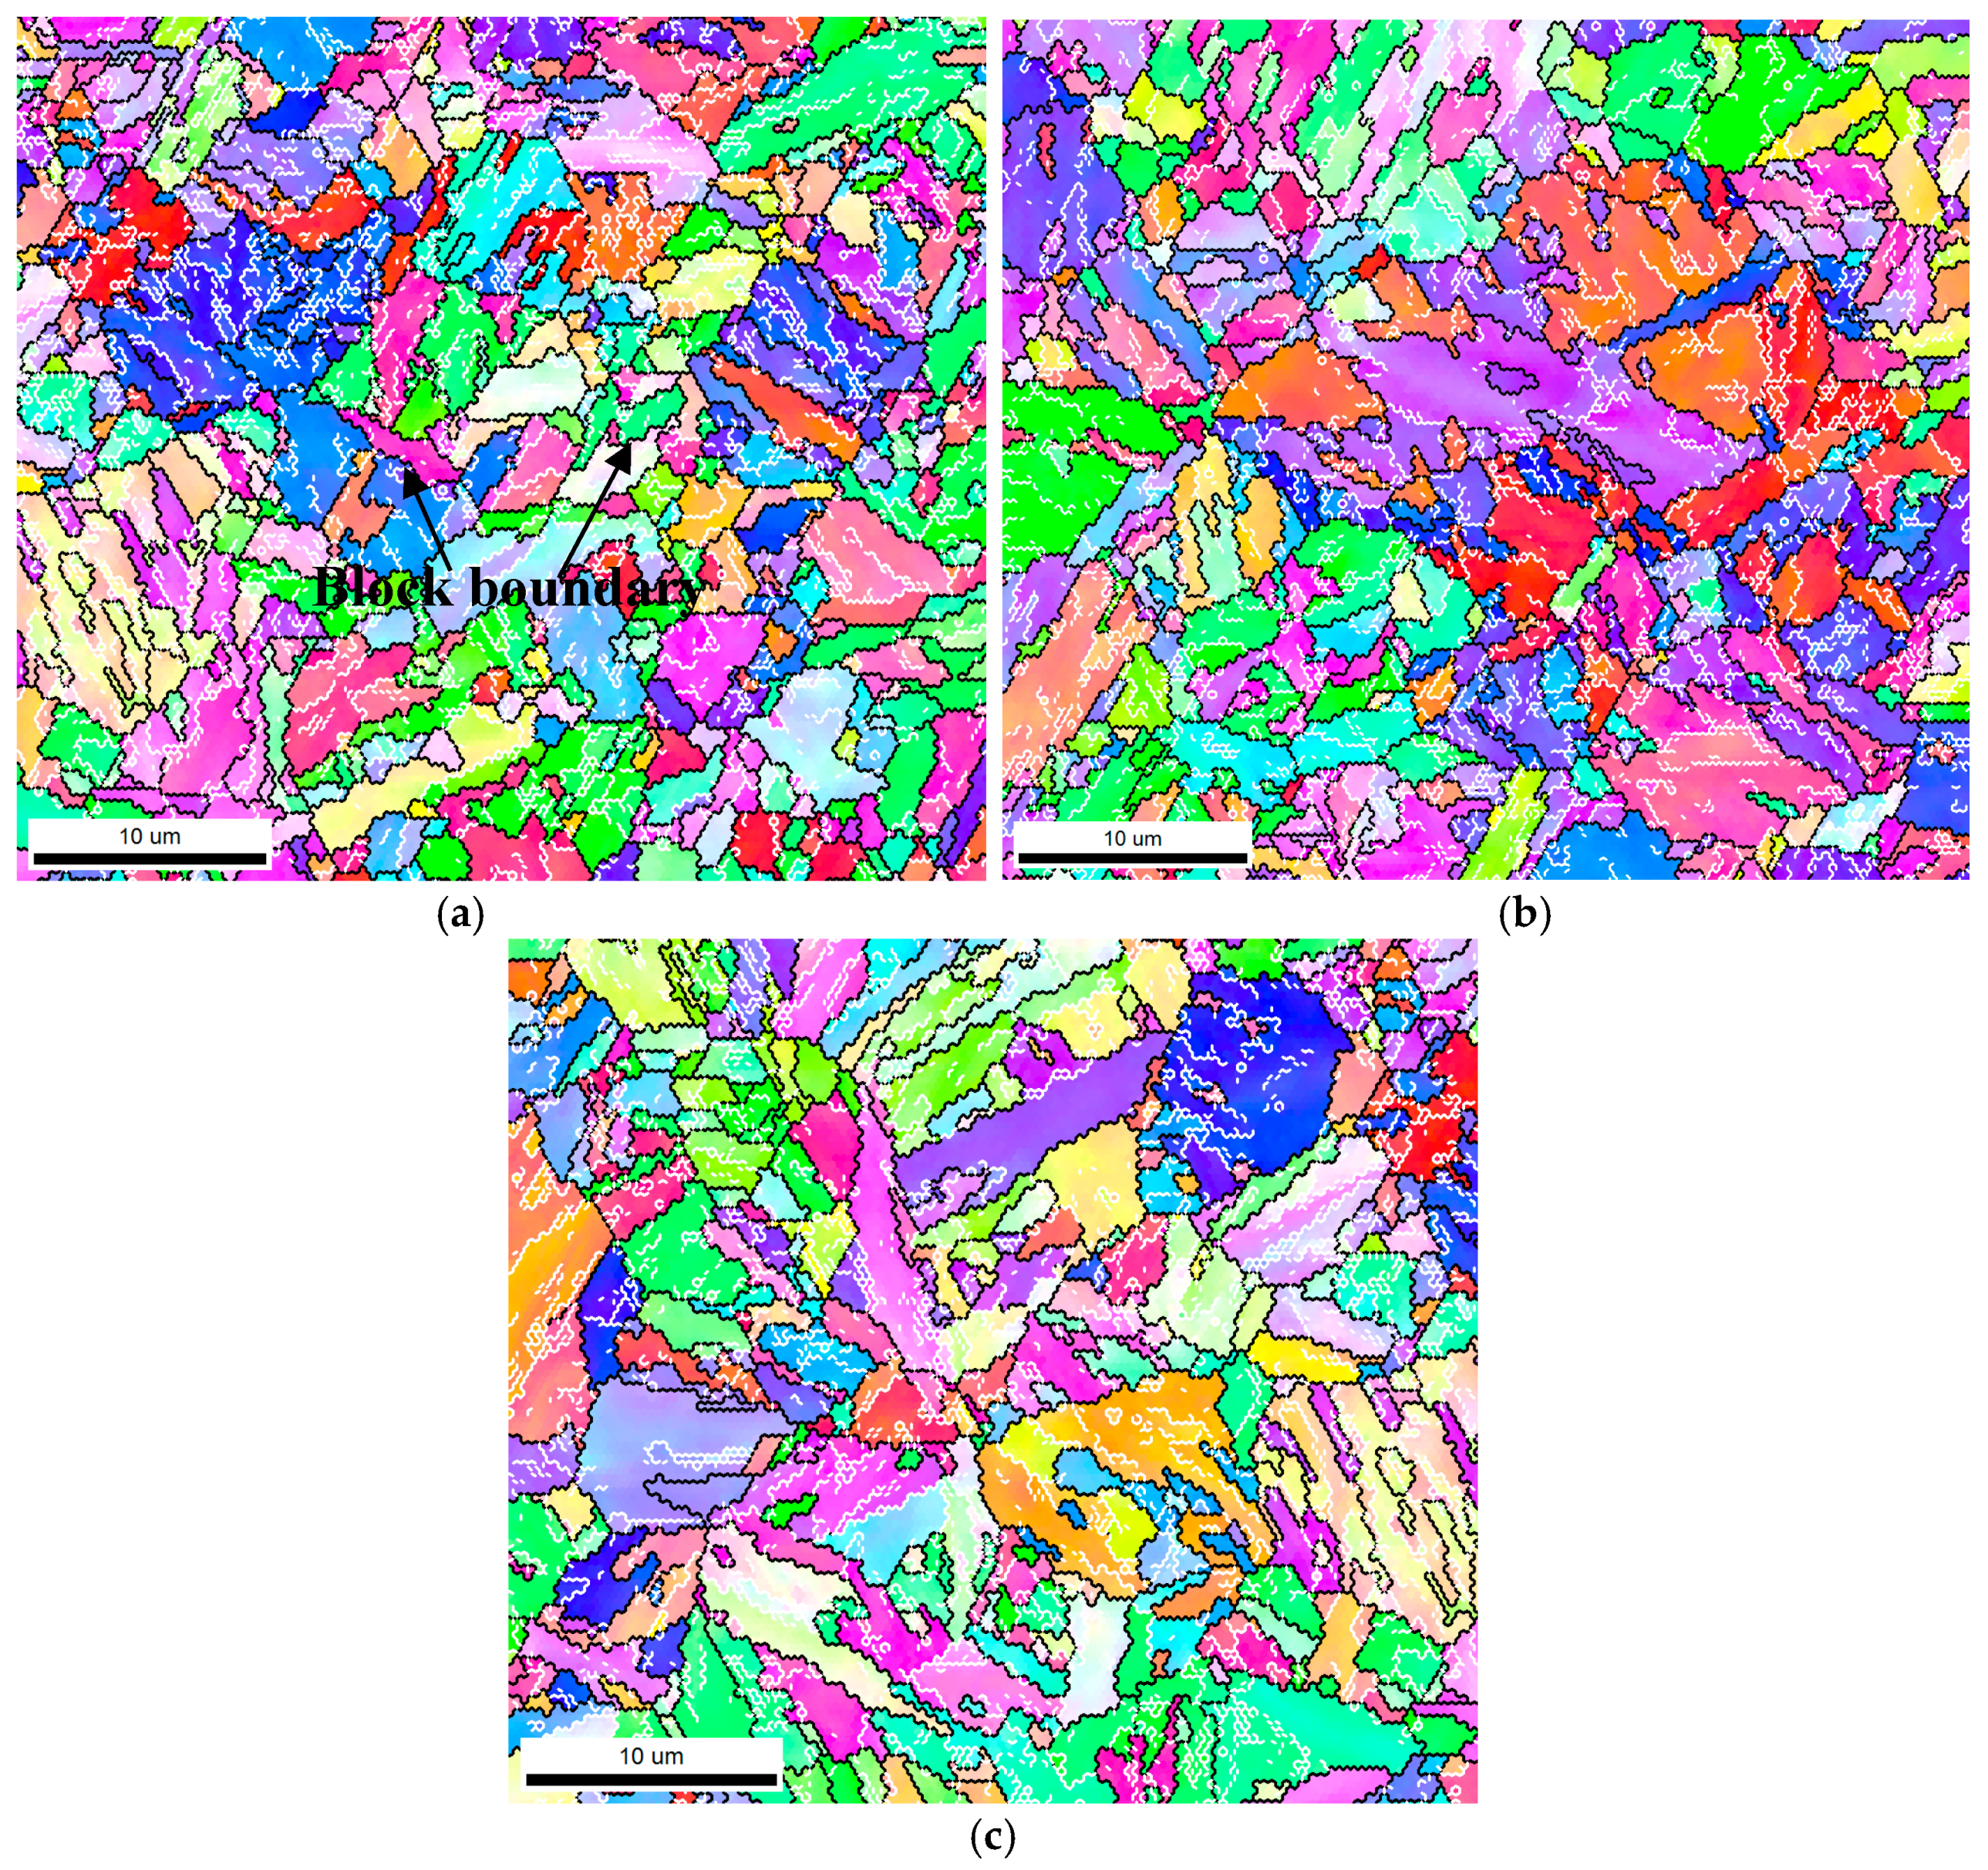
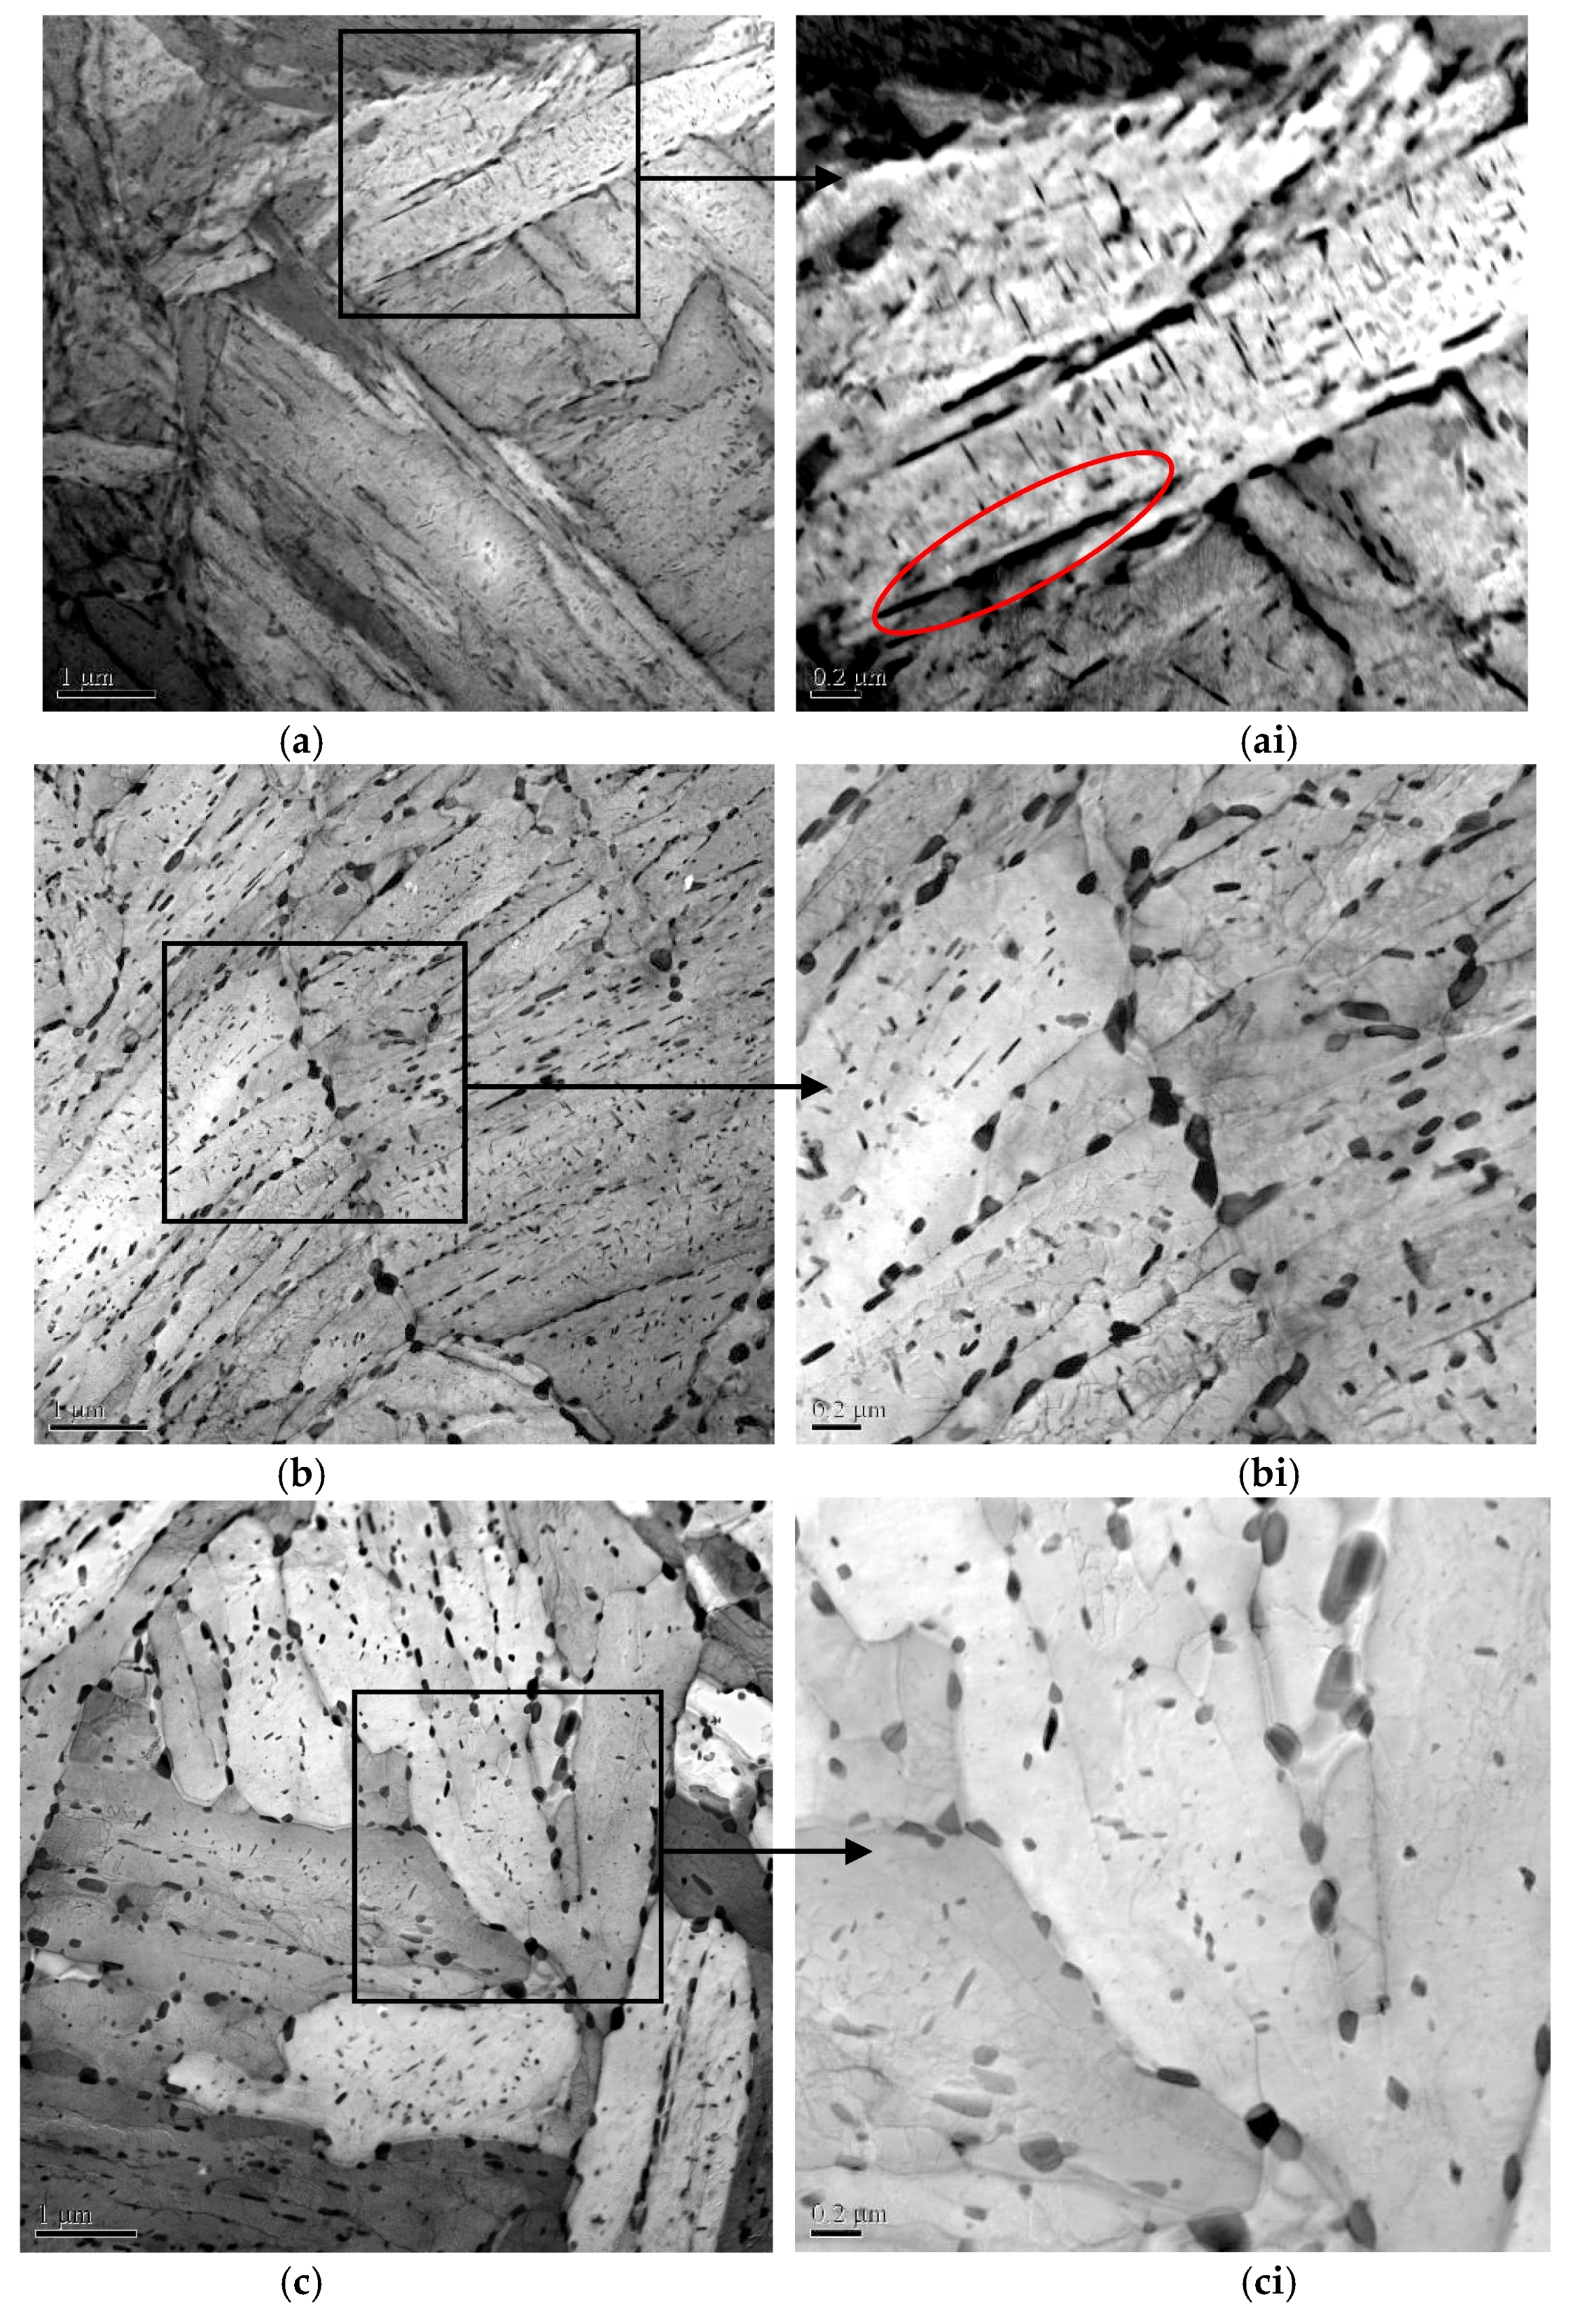
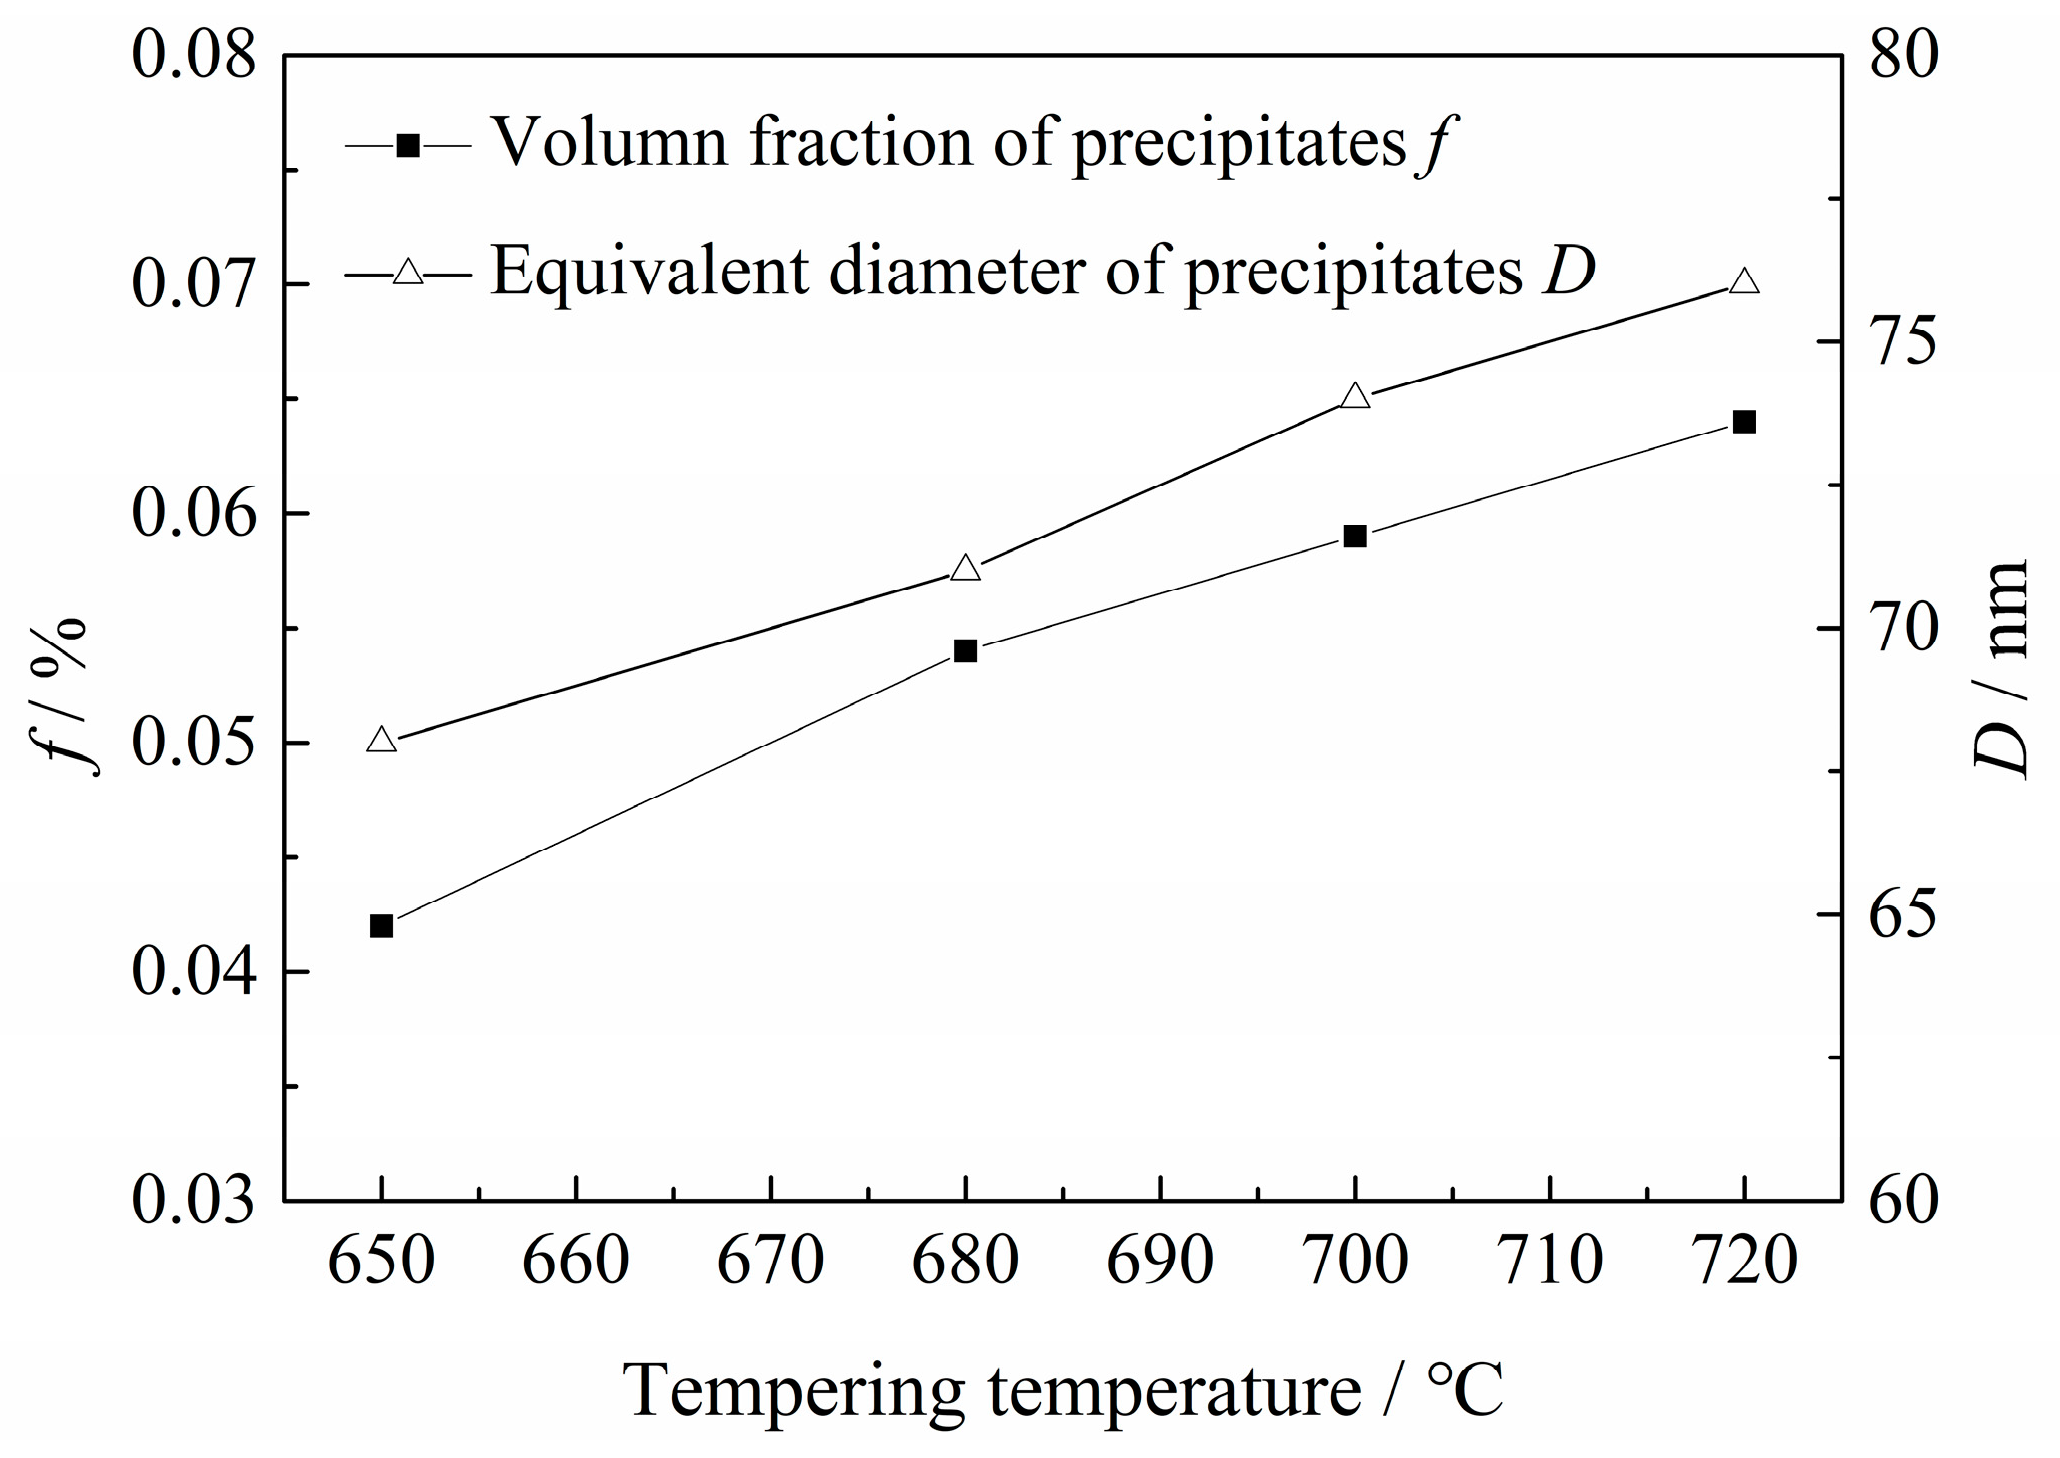
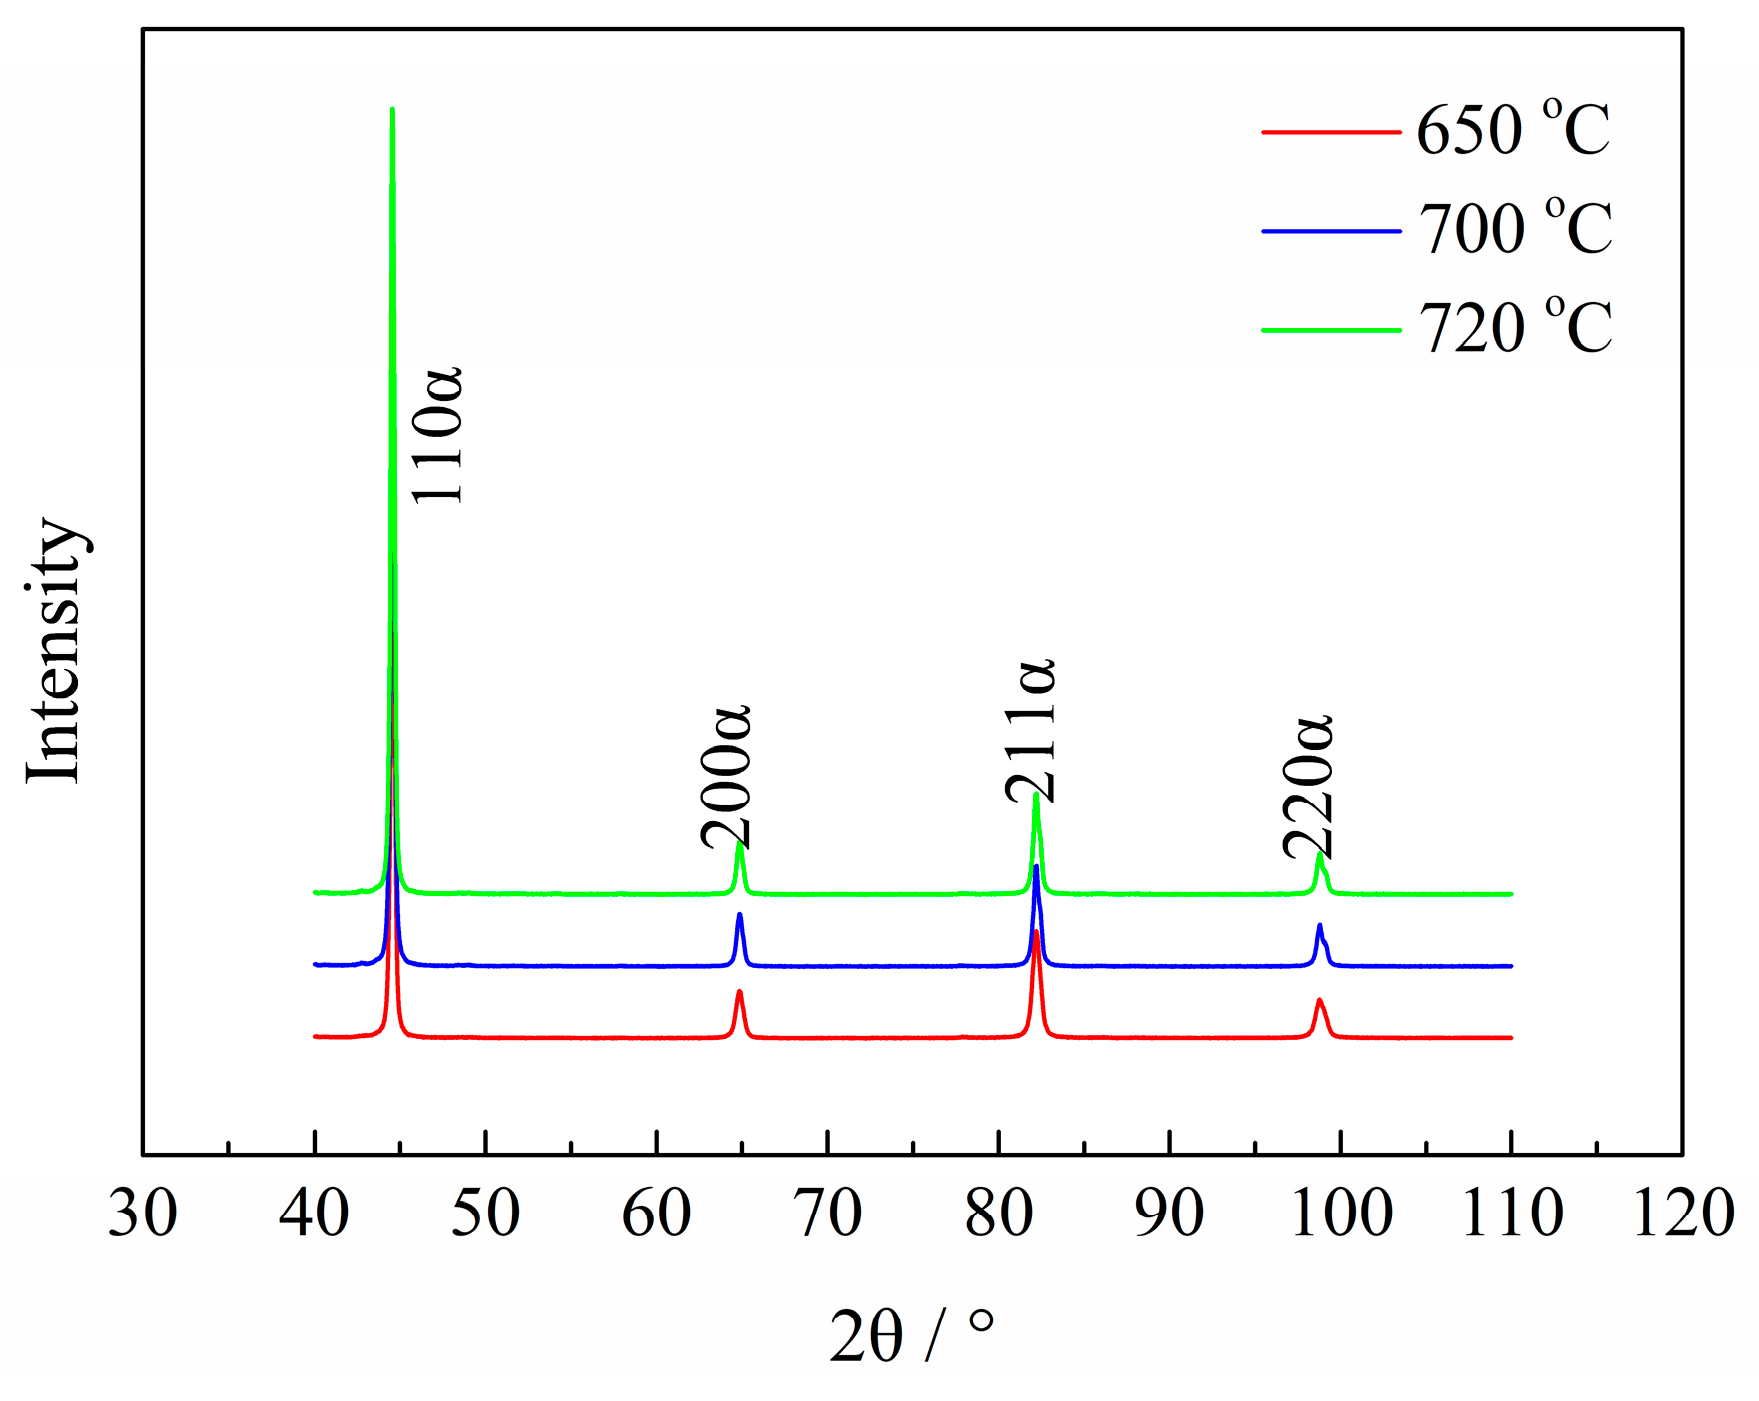
2.3.3. Martensitic Lath and Precipitate Observations

TEM micrographs of each Q&T–treated sample are presented in Figure 9. As the figure shows, the martensite consisted of regular laths in the minority and irregular ones in the majority. The irregular laths had a curved boundary, which were assumed to derive from the polygonization of prior regular laths in as-quenched samples, due to tempering at a high Tt. In contrast, a small quantity of regular laths might possess a particular crystallographic orientation with high thermodynamic stability [35] and could survive heavy tempering. Also, as this figure shows, the polygonized irregular martensitic laths evidently increased with elevating Tt, at the expense of the regular martensitic laths. The average lath width, Wl, was further determined quantitatively and is also summarized in Table 2. Wl obviously increased with increasing Tt, indicating a widening of the martensitic lath, probably due to the interface migration or the merging of two neighboring laths [36].
There still appeared to be a large quantity of rod-like and spherical precipitated particles distributed in the martensitic laths or at their boundaries, as also shown in Figure 9. Meanwhile, the rod-like precipitated particles were spheroidized gradually as the Tt increased. The average equivalent diameter, D and the volume fraction, f, of the precipitates were further estimated quantitatively and are provided as the function of Tt in Figure 10. This shows that both the D and f of precipitates obviously increased with increasing Tt.

2.3.4. Dislocation Estimations

The dislocation density, ρ, of each Q&T–treated sample was determined by XRD pattern, as shown in Figure 11 and summarized in Table 2. The dislocation density decreased from 1.41 × 10¹⁴ to 0.62 × 10¹⁴ m−2 with increasing Tt from 650 °C to 720 °C. The present result is in agreement with a previous work by Masakatsu et al. [37]. They reported that the half-width of the (211) peak in the XRD pattern, indicating the dislocation density, reduced with elevated Tt due to the addition of 0.1 wt % vanadium to the 0.5Cr–0.7Mo steel.

2.4. Hydrogen Permeation

Figure 12 shows the H permeation curves for Q&T–treated samples. The H diffusion coefficient, D0 and the diffusion H concentration, C0, were calculated with Equations (10) and (11) and the results are summarized in Table 3. As the table shows, D0 increased and C0 decreased with increasing Tt, indicating lower H permeability.

3. Discussion

3.1. Relationships among Tempering Temperature, H Mobility and SSC Initiation

3.1.1. Effect of Tempering Temperature on H Permeability

C0, indicating H permeability, decreased with increasing Tt, as shown in Figure 12 and Table 3. Actually, C0 is dominantly dependent on the density of reversible H traps, NT, on the assumption that the irreversible traps could be saturated by the H atoms [38]. According to previous works [39,40,41,42], H traps such as solute atoms, GBs and dislocations were generally regarded as reversible traps, due to their bonding energy being lower than 60 kJ/mol. Among these reversible traps, the solute atoms were assumed to decrease with increasing Tt, due to increased precipitation, as shown in Figure 9 and Figure 10. Accordingly, the number of reversible traps provided by the solute atoms, NT-SA, also decreased with increasing Tt. However, the precipitates in this Q&T–treated Cr–Mo–V–Ti–B martensitic steel were highly diversified and complicated in their structure [43] and hence it is rather intricate to discern between the atoms consumed for these precipitates and the residual solute atoms. Quantification of NT-SA therefore remains challenging. Accordingly, the NT for these Q&T–treated samples at differing Tt were quantified mainly as functions of the GBs (PAG, martensitic packet/block/lath boundaries, etc.) and the dislocations, respectively, to better understand their effects on C0.
The H trap density provided by the GBs, NT-GB, was estimated, with the grain assumed to be an approximate sphere and counted as n per cubic meter, using the following equation [44]:
N T - G B = n S G x G B 2 n V G x a 3
where VG and SG are the volume and surface area of one grain, respectively; the factor of 1/2 is due to one grain plane shared by two grains; xa is atomic distance, 0.26 nm; xGB is the width of GB, about 10 times that of xa. Equation (1) can then be simplified as:
N T - G B = 30 d G x a 2
where dG is the grain size. This equation indicates that the NT-GB is in inverse proportion to dG, by which NT-GB for these Q&T–treated samples were estimated and are listed in Table 4.
The H trap density provided by the dislocations, NT-dis, was estimated by:
N T - dis = 5 ρ dis x a
where ρdis is dislocation density and the factor of 5 is assumed to be the ratio of the dislocation width to xa. The NT-dis for these Q&T–treated samples were calculated and are also listed in Table 4.
As Table 4 shows, the estimated NT-MP, NT-MB and NT-ML provided by the martensitic packet, block and lath boundaries decreased with their increasing size and accordingly their decreasing number of boundaries, whereas NT-PAG remained at almost the same level. As the martensitic lath boundaries normally occupied all the PAG and the martensitic packet/block boundaries, NT-ML contained NT-PAG, NT-MP and NT-MB. In general, the PAG and the martensitic packet/block boundaries were confirmed to be HAGBs [45] and correspondingly the effective reversible traps [34], whereas the lath boundaries in as-quenched martensitic steels were normally accepted as LAGBs with MA ≤ 10° [32], probably contributing little to the C0 [34]. However, according to the EBSD analyses in Figure 8 and the actual TEM observations in Figure 9, the HAGBs surrounding the irregular laths constituted the major fraction of the martensitic lath boundaries due to their polygonization via heavy tempering, essentially supplying much to the C0. In contrast, the remnant LAGBs encircling the regular laths comprised a minor fraction of the martensitic lath boundaries, still contributing little to the C0. Thus, the final NT-GB was calculated approximately by combining the NT-ML (in Table 4) and the fraction of HAGB, fGBMA≥15°, essentially for the polygonized irregular martensitic lath (in Table 2), that is, NT-GB = NT-ML × fGBMA≥15°, with the result presented in Table 4.
Consequently, the amount of reversible H traps provided by the various GBs, the dislocations and even the solute atoms all decreased with increasing Tt and therefore the overall diffusion H concentration (C0) decreased markedly, as shown in Table 3.

3.1.2. Effect of H Permeability on SSC Initiation

A certain number of inclusions with a large size of more than 3 µm were still present in this experimental steel, although it was prepared by melting in an electric furnace and purifying in a vacuum degassing furnace. There appeared mainly two types of complex inclusions in each DCB sample: the massive Al2O3·SiO·CaO and the slender Al2O3·CaO·TiO particles, as shown in Figure 13a,b. The slender one was typically located in a corrosion pit where SSC was initiating. This observation was in agreement with previous work by Schiapparelli et al., in which HIC was triggered at a non-deformable inclusion of Al2O3 [17].
In addition, the local H concentration, Cσ, of the highly stressed regions in the DCB sample can be estimated using the following equation [46]:
C σ = C 0 e x p ( σ h V H / R T )
where C0 is the diffusion H concentration, σh is the hydrostatic stress, VH is the partial molar volume of H in iron (2.1 × 10⁻⁶ m3/mol), R is the gas constant and T is the ambient temperature. As this equation indicates, Cσ decreased as the result of decreased C0. When the H-induced stress concentration exceeded the atomic binding force, SSC eventually initiated.
Susceptibility to SSC initiation can be estimated by the incubation time for SSC origination, ti, which was attained by fitting the crack propagation length (Δa) vs. the time curve, as demonstrated in Figure 1. The optimum imitated Equations (5)–(7) for the samples tempered at 650, 700 and 720 °C, respectively, as follows:
Δ a = 33.6582 34.4650 × 0.9841 t
Δ a = 16.5937 17.0433 × 0.9879 t
Δ a = 11.9662 14.4518 × 0.9820 t
Supposing Δa = 0, the ti for the Q&T–treated samples, tempered at 650, 700 and 720 °C was 1.5, 2.2 and 10.4 h, respectively, indicating a lowered susceptibility to SSC initiation with increasing Tt.
Therefore, the increasing Tt led mainly to martensitic lath polygonization and widening, providing a decreased amount of HAGBs and accordingly reversible H traps, inducing a lowered overall and local diffusion H concentration (C0 and Cσ), leading to a depressed stress concentration around the inclusions and simultaneously a prolonged incubation time and finally decreased susceptibility to SSC initiation.

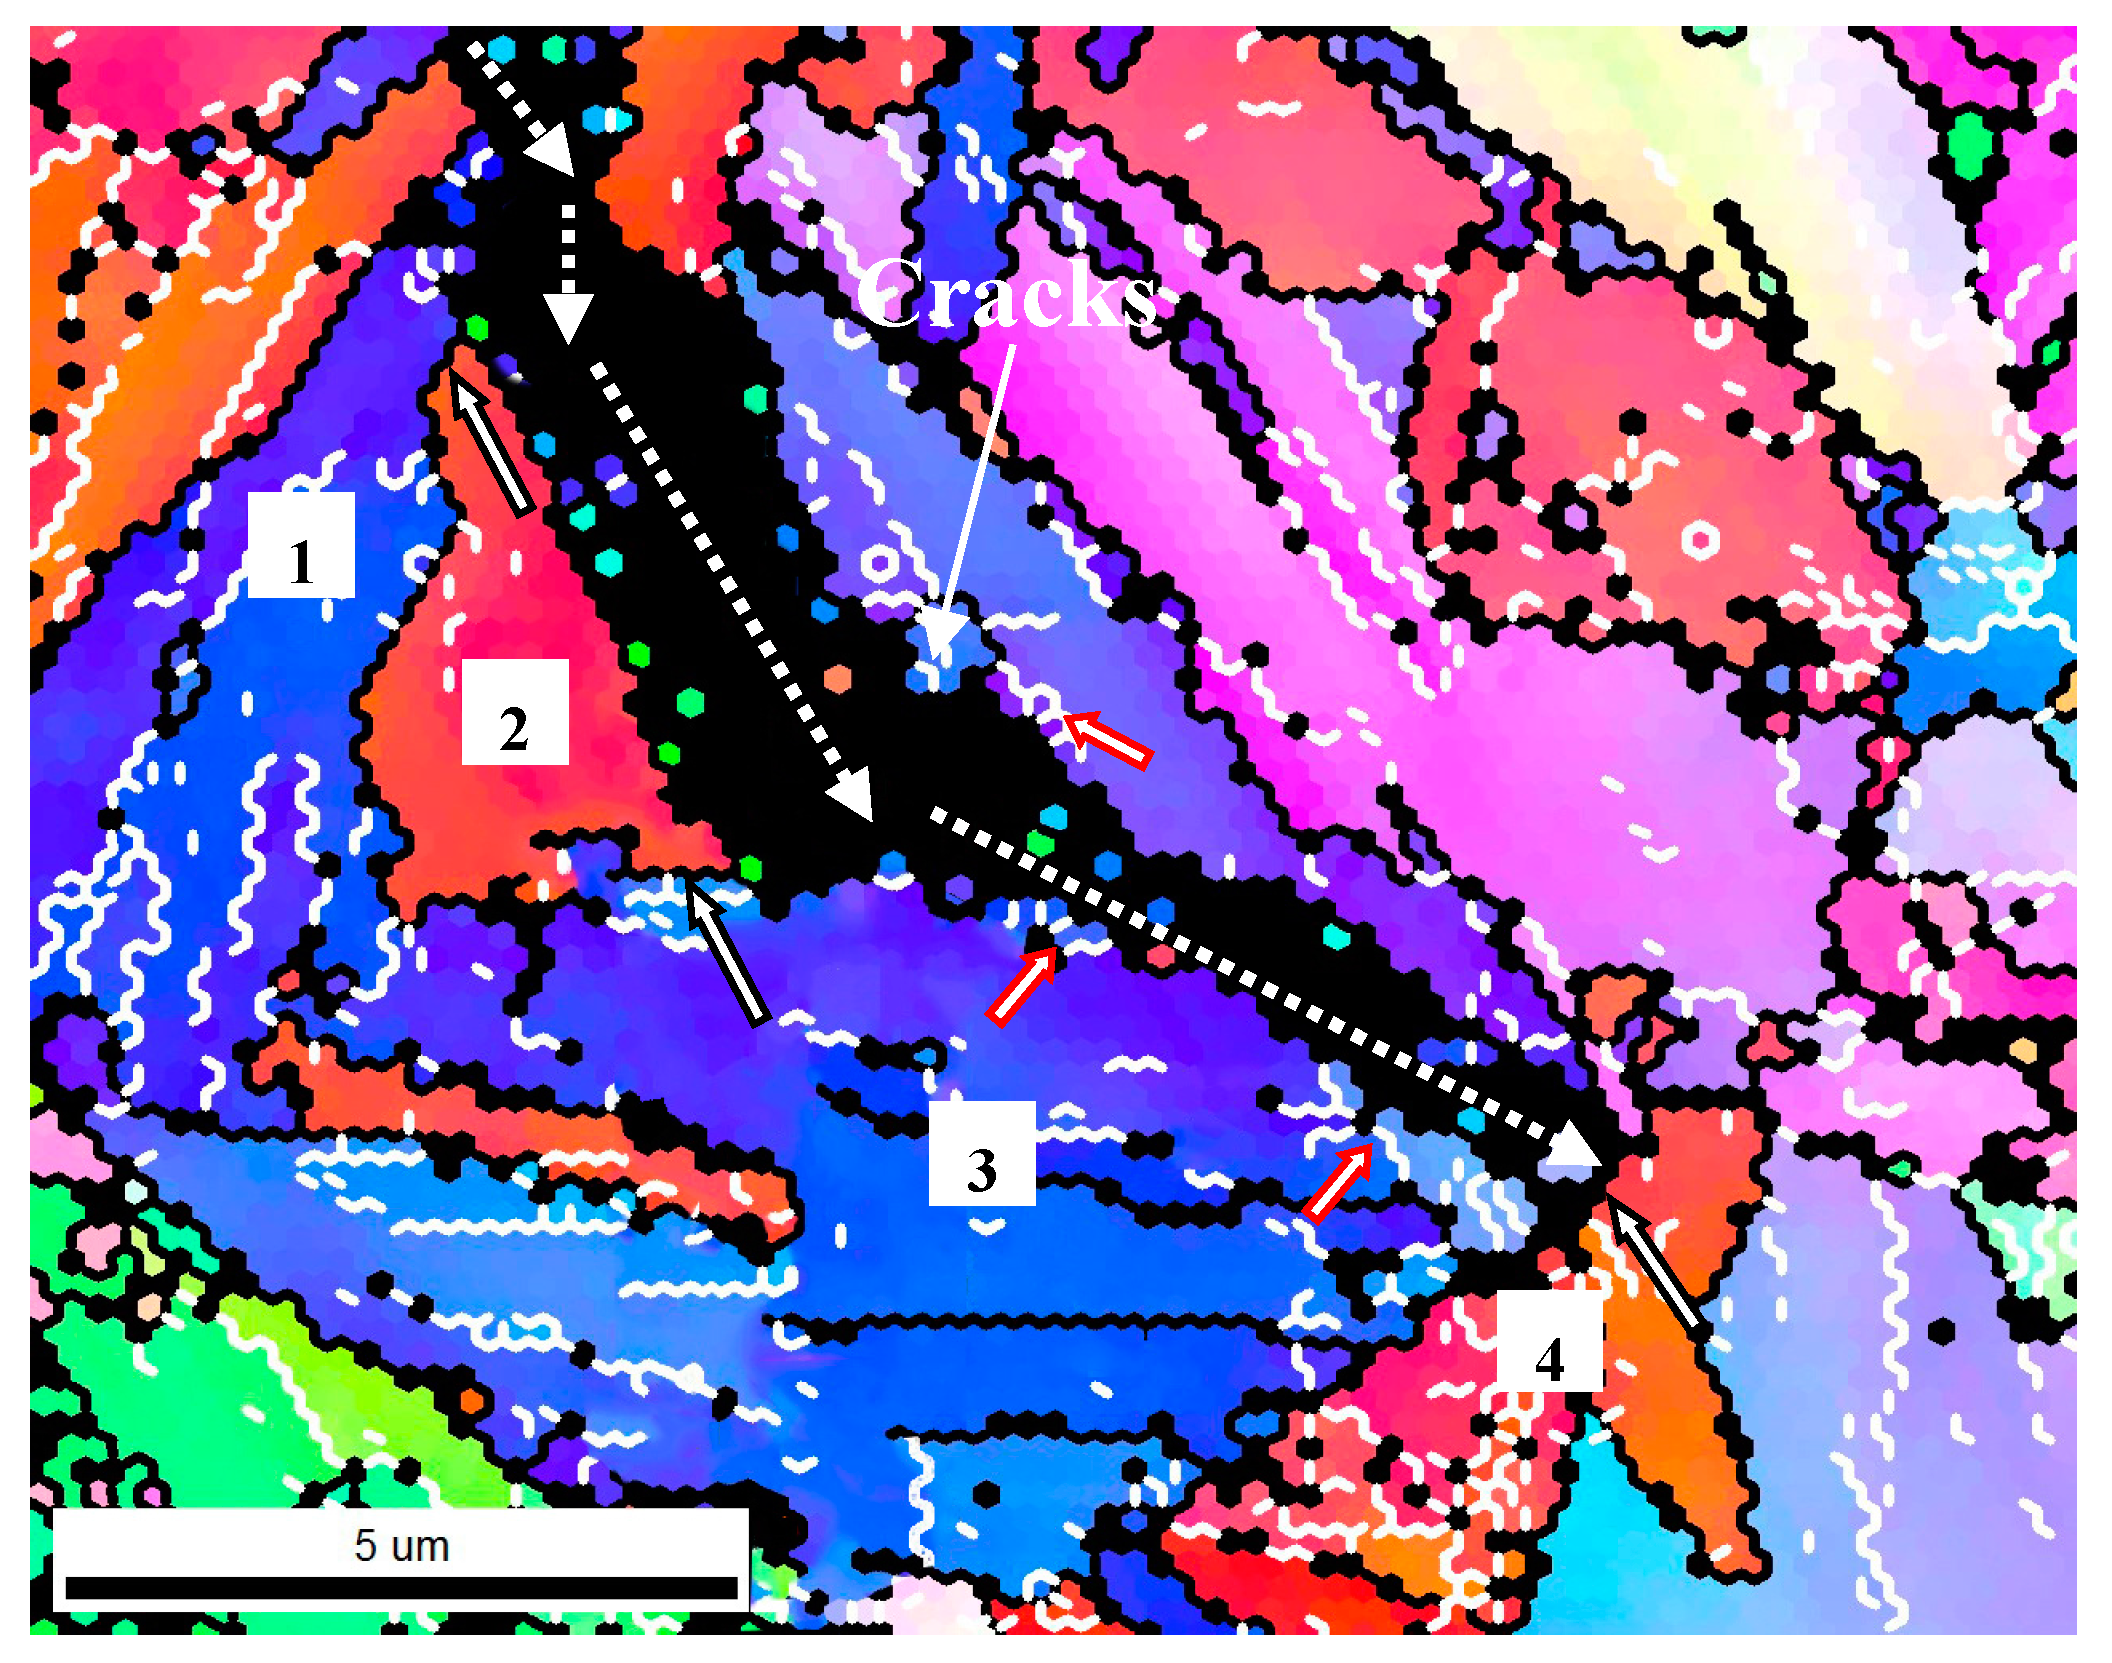
3.2. Effect of GBs on SSC Propagation

To further understand the effect of GBs with certain crystallographic orientations on crack propagation, secondary microcracks underneath the SSC fracture surface of DCB samples were observed and the corresponding misorientation angles between grains adjacent to the crack were analyzed by EBSD, as shown in Figure 14 and Table 5. LAGB/HAGB is generally defined as the grain boundary with a misorientation angle of 2–15°/>15° [47], indicated by the white/black line. It can be seen that the microcrack propagated unimpededly through the LAGBs within grains 1, 2 and 3, indicating that the LAGBs could not hinder the SSC from propagating. In contrast, the microcracks diverted direction when they came across the HAGBs of grains 2 and 3 and finally arrested also at the HAGBs of grains 3 and 4.
Hence, HAGB could play a significant role in hindering SSC propagation, whereas LAGB failed to provide an evident barrier, showing the two different impacts on crack propagation. According to previous observations [48], the change in operating slip system was essential for the GB to act as a barrier for the dislocation movement when the crack came across the GB. For the HAGB, its own operated slip system might induce a dislocation-free zone formation in the adjacent grain and accordingly lead to a significantly diverted direction of the crack. In contrast, LAGB could only yield a relatively low retardation of crack propagation, due to the minor difference in orientation between the two neighboring grains.
The increasing Tt brought about martensitic lath polygonization and widening to a higher degree, providing an increased fraction of HAGBs and also an increased mean GBMA, restraining SSC propagation by lowering their propagation rate (Figure 2), finally resulting in an elevated KISSC value.

4. Materials and Methods

4.1. Materials and Heat Treatment

The 28CrMo48VTiB martensitic steel used for this work was melted in an electric furnace, continuously cast with argon shielding and thermally pieced-rolled-stretched into a seamless tube 177.8 × 10.36 mm (diameter × thickness). The chemical compositions are presented in Table 6.
The samples with dimension 300 × 100 mm were cut from the steel tube, reheated at 890 °C for 20 min and water quenched and consequently tempered at differing Tt of 650, 700 and 720 °C for 60 min.

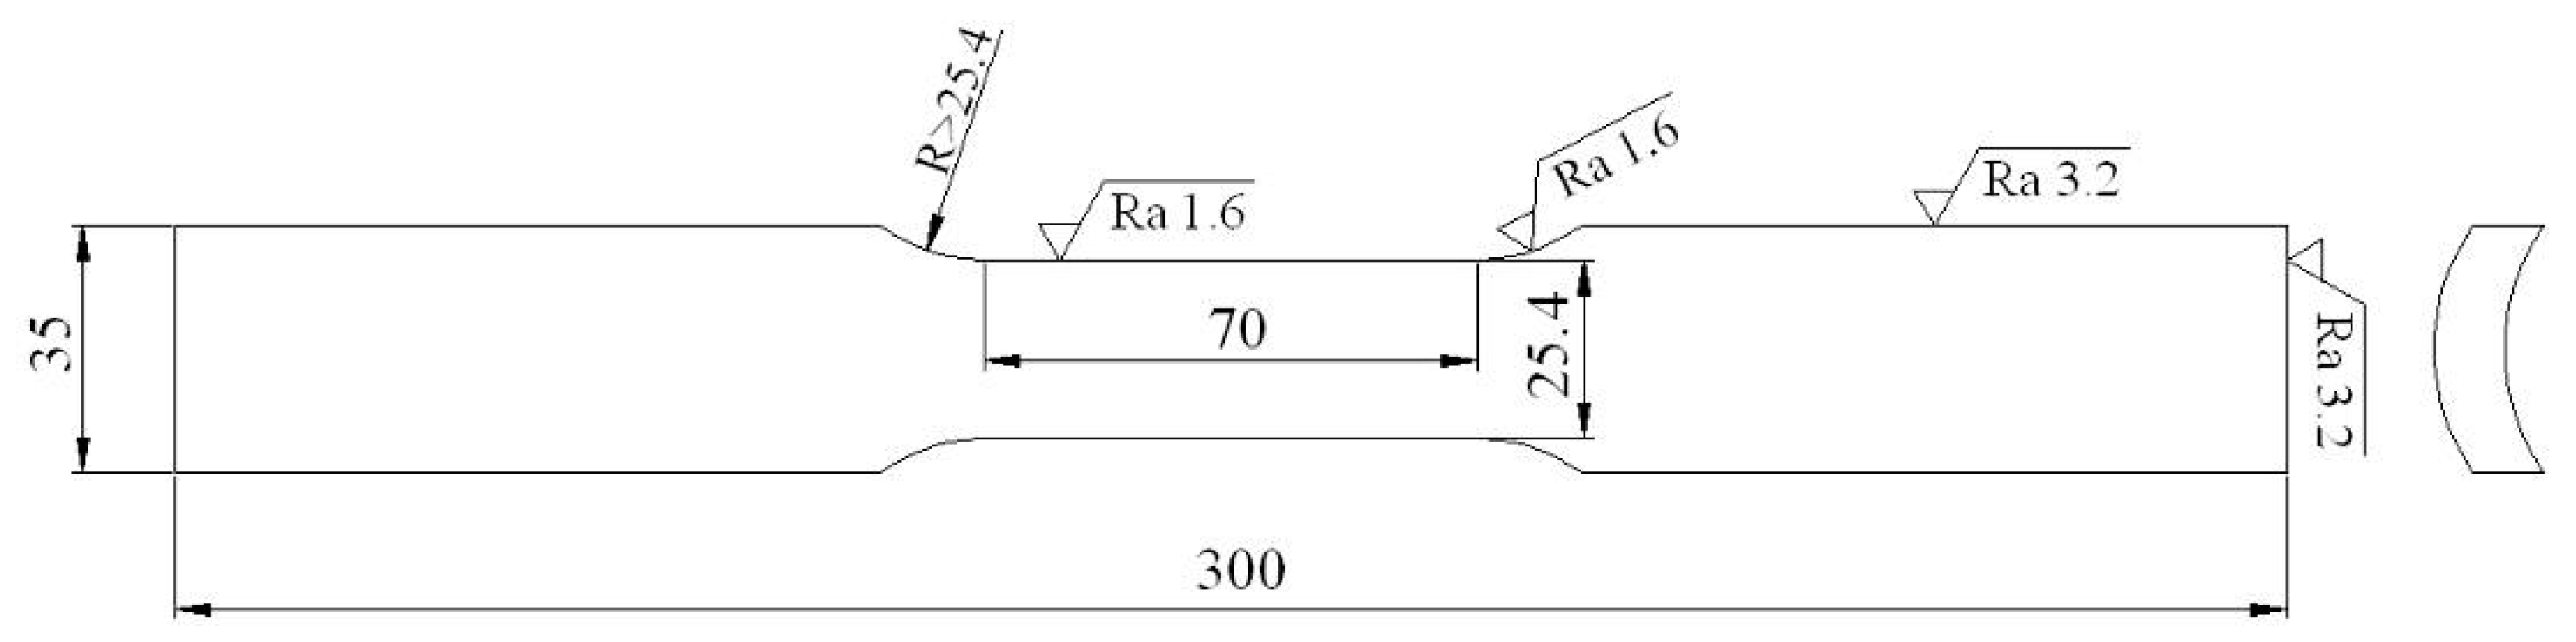
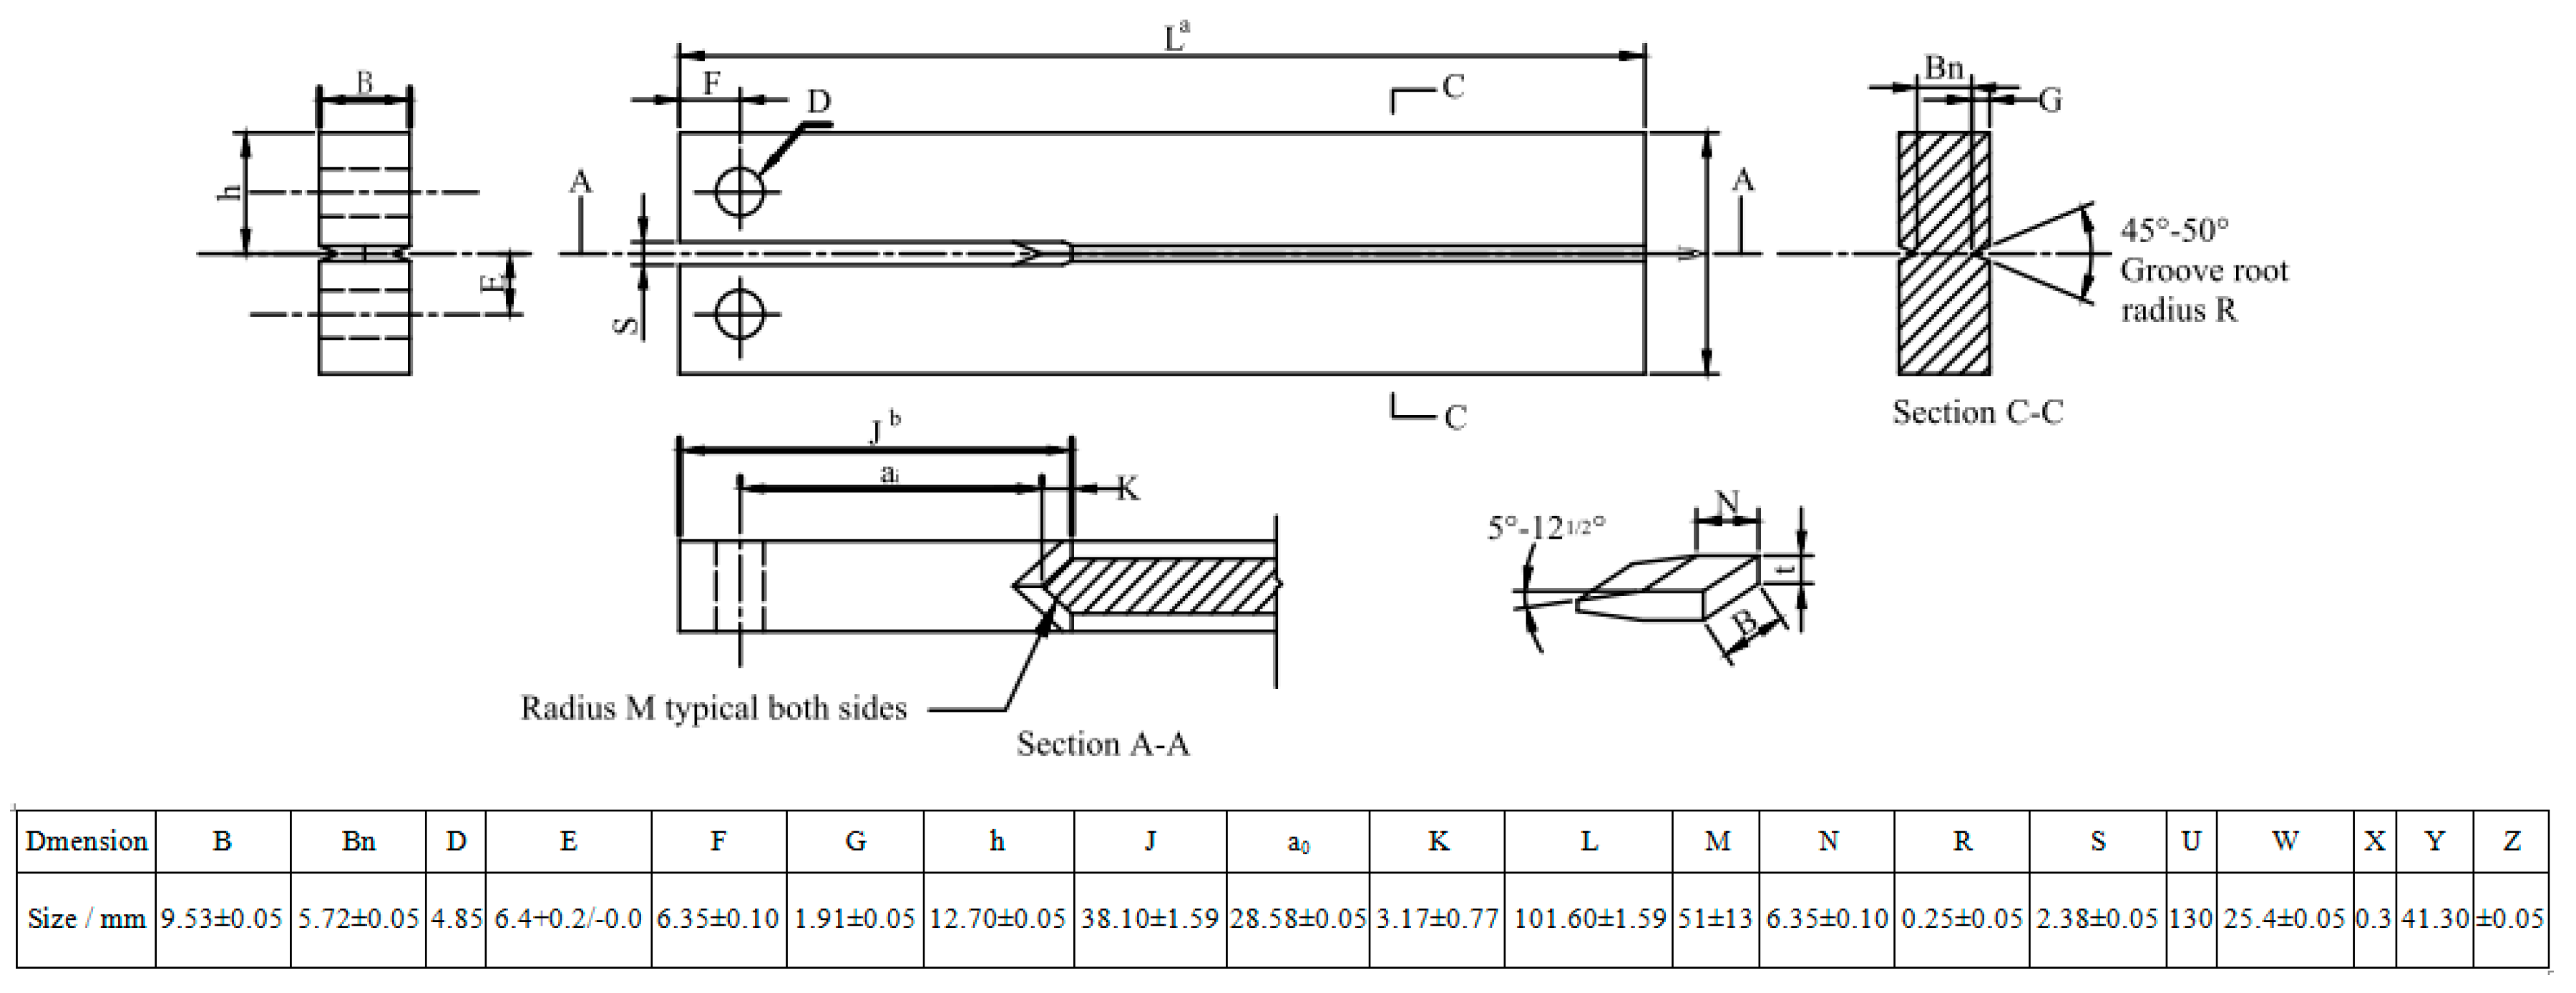
4.2. Estimations of Mechanical Properties and SSC Susceptibility

The conventional tensile properties of each Q&T–treated sample were determined according to the ASTM (American Society for Testing Material) Standard A370-10 [49]. Each sample was machined along the longitudinal direction of the tube, with geometry and dimensions as shown in Figure 15 and tensioned in a CMT5305 Instron machine at room temperature. Two tensions for each sample were performed and their average values are reported. The hardness for each sample was also determined in a Rockwell hardness tester using a load of 1500 N. For precision, the hardness at 6 different positions in each sample were measured and their average values are reported.
The susceptibility to SSC in each sample was estimated with the DCB test, according to the NACE TM0177 standard, Method D [31]. The standard DCB specimen is illustrated in Figure 16. A double-taper wedge with certain thickness was selected to provide the desired arm displacement and load by inserting into the DCB specimen. All DCB tests were performed with their specimens immersed in the same standard NACE TM0177 solution A, consisting of 5.0 wt % NaCl and 0.5 wt % CH3COOH dissolved in distilled water saturated with 1 atm H2S. The pH value of the solution did not exceed 3 at the start and 4 at the end of the test. The tests were performed for 2 weeks at ambient temperature, during which the instantaneous applied stress intensity factor, KIapplied and the threshold stress intensity factor, KISSC, were obtained using Equations (8) and (9):
K Iapplied = p × a i ( 2 3 + 2.38 h / a i ) ( B / B n ) 1 / 3 B h 1.5 ( 26.232 + 51.886 a / h + 8.523 ( a / h ) 2 + 8.5178 ( a / h ) 3 ) ( 26.232 + 51.886 a i / h + 8.523 ( a i / h ) 2 + 8.5178 ( a i / h ) 3 )
K ISSC = p × a ( 2 3 + 2.38 h / a ) ( B / B n ) 1 / 3 B h 1.5
where P is the final equilibrium wedge lift off load, determined from an abrupt change in the slope of load-displacement curve; ai/a is the instant/final crack length of SSC for estimating KIapplied/KISSC, obtained by subtracting 6.35 mm from the distance between the slot end and the mean position of the crack front; h is the arm height; and B and Bn are the DCB specimen and web thickness, respectively. Three parallel DCB tests were performed for each Q&T–treated sample and the average values are reported.
In order to further understand SSC crack initiation and propagation behaviors occurring in the DCB tests and their dependence on metallurgical aspects, the crack propagation length, Δa, as a function of immersing time, t, was measured by the NACE TM0177 standard, Method D [31]. Then the crack propagation rate, da/dt, was obtained by seeking derivation of the Δa vs. t curves. Finally, da/dt as a function of the corresponding KIapplied was described.

4.3. Electrochemical H Permeation Test

The H permeation behavior in each Q&T–treated sample was quantitatively estimated with the EHP test at 298 K using the classical Devanathan-Stachursky technique. The electrolyte for H charging was a solution of 0.5 mol/L H2SO4 and 0.25 g/L CH4N2S, while the electrolyte for H expanding was an aqueous solution of 0.2 mol/L NaOH. The H charging time might depend on the purpose. The sample for the H permeation estimation was 0.8 mm thick, with the nickel-plated surface acting as the anode side. The current was measured when the background current decreased and reached a steady value of 0.1 μm/cm2 or lower.
The diffusion coefficient of H, D0 (cm2/s), was calculated using the following equation:
D 0 = L 2 6 t 0.63
where L is the specimen thickness (cm) and t0.63 is the time lag for 0.63 saturation of permeation current density at the steady state (s). The reversible H concentration, C0 (ppm), was estimated using the following equation:
C 0 = i L F D 0
where i is the steady-state atomic H permeation current, μA/cm2 and F is Faraday’s constant, 9.6485 × 10¹⁰ μA·s/mol.

4.4. Microstructure Observation

The as-quenched sample at 890 °C was etched in a supersaturated picric acid aqueous solution for optical microscopy (OM) observations of the prior austenite grain (PAG). Each Q&T–treated sample was etched in 4% nital for martensitic packet observation in a Hitachi S-3400N scanning electron microscope (SEM). The electron back-scattered diffraction (EBSD) map was obtained by a SUPRA550 field emission scanning electron microscope equipped with a TSL (Tinysoft Statistical analysis Language) orientation imaging microscopy system to reveal the martensitic block substructure and the misorientation angles between the adjacent martensitic substructure boundaries. SSC inducing the fractured surface and the secondary crack in a cross-section of the DCB specimen after each trial were also examined by SEM and EBSD, respectively. The crystallography orientation information of the martensitic packet/block structures next to the secondary crack and their correlations were determined; Channel 5 software from Oxford-HKL was used for the orientation data processing. Each EBSD sample was polished using 0.04 µm colloidal silica slurry in a vibratory polisher for 1 h. The characteristics of the martensitic lath and the distribution, shape and chemical compositions of precipitated particles were determined by examining thin foils or carbon extraction replicas using a JEM-2010 high-resolution transmission electron microscope.
The martensitic structure size for each Q&T–treated sample was quantitatively estimated by averaging at least 200 PAGs, 200 packets, 150 blocks and 100 laths from the OM, SEM, EBSD and TEM micrographs, respectively. For estimating the equivalent diameter (Do) and volume fraction (f) of precipitated particles of different shapes, the rod-like particles were considered with the spherical particles and Do was regarded as the particle size. Then f was calculated with the following equation:
f = N 4 π 3 S 0 D o ( D o 2 ) 3 = N π D o 2 6 S 0 = 2 N S 3 S 0
where N is the number of particles per area, S0 is the specific area for estimation and S is the particle area.
The dislocation density of each Q&T–treated sample was determined by quantitative X-ray diffraction (XRD) analysis. XRD spectra were obtained by scanning over a scanning angle (2θ) range of 40–110° and at a step size of 0.02° in a Rigaku D/max-2500/PC diffractometer (Rigaku, Tokyo, Japan). In order to correct the XRD line broadening resulted from the instrument, the XRD pattern of a standard sample of Si powder which was annealed at 300 °C for 24 h was measured. This diffraction line broadening correction was performed with the data processing via the software of Jade 5 (5.0, Jade Software, Christchurch, New Zealand).

5. Conclusions

The effect of increasing tempering temperature (Tt) on SSC behavior in a Q&T–treated medium carbon Cr–Mo–V martensitic steel was estimated in this work and the conclusions are summarized as follows:
  • KISSC and the overall resistance to SSC of this martensitic steel were obviously enhanced by increasing Tt from 650 to 720 °C.
  • Increased Tt led to decreases in overall and local H concentration around the inclusions, owing to martensitic lath polygonization and widening and resulted in a lowered susceptibility to SSC initiation.
  • Increased Tt brought about a higher fraction of HAGBs and resulted in enhanced resistance to SSC propagation by more frequently diverting the propagating direction and lowering the propagation rate.

Acknowledgments

This work is supported by the National Key Research and Development Program of China (grant No. 2016YFB0301203) and the Tianjin New Materials Science and Technology Major Project (grant No. 16ZXCLGX00150), China.

Author Contributions

Qingfeng Wang and Yu Sun conceived and designed the experiments; Shunjie Gu and Qian Wang performed the experiments; Fucheng Zhang analyzed the data; Zaoneng He contributed analysis tools; Qingfeng Wang and Yu Sun wrote the paper.

Conflicts of Interest

The authors declare no conflict of interest. The founding sponsors had no role in the design of the study; in the collection, analysis, or interpretation of data; in the writing of the manuscript; or in the decision to publish the results.

References

  1. Motoda, K.; Masuda, T. Development of 110-ksi grade OCTG with good resistance to sulfide-stress-corrosion cracking. J. Pet. Technol. 1988, 40, 1232–1236. [Google Scholar] [CrossRef]
  2. Garrison, B.; Urband, B.E.; Prideco, G.; Morey, S. Production and Fit for Service Attributes of C125 High Strength Casing; NACE International: Houston, TX, USA, 2005. [Google Scholar]
  3. Zhang, C.; Wang, Q.; Ren, J.; Li, R.; Wang, M.; Zhang, F.; Sun, K. Effect of martensitic morphology on mechanical properties of an as-quenched and tempered 25CrMo48V Steel. Mater. Sci. Eng. A 2012, 534, 339–346. [Google Scholar] [CrossRef]
  4. Zhang, C.; Wang, Q.; Ren, J.; Li, R.; Wang, M.; Zhang, F.; Yan, Z. Effect of microstructure on the strength of 25CrMo48V martensitic steel tempered at different temperature and time. Mater. Des. 2012, 36, 220–226. [Google Scholar] [CrossRef]
  5. Wang, Q.; Zhang, C.; Li, R.; Gao, J.; Wang, M.; Zhang, F. Characterization of the microstructures and mechanical properties of 25CrMo48V martensitic steel tempered at different times. Mater. Sci. Eng. A 2013, 559, 130–134. [Google Scholar] [CrossRef]
  6. Ming, L.; Wang, Q.; Wang, H.; Zhang, C.; Wei, Z.; Guo, A. A remarkable role of niobium precipitation in refining microstructure and improving toughness of A QT-treated 20CrMo47NbV steel with ultrahigh strength. Mater. Sci. Eng. A 2014, 613, 240–249. [Google Scholar] [CrossRef]
  7. Perez, T.E.; Echaniz, G.; Morales, C. The effect of microstructure on the Kissc low alloy carbon steels. In Corrosion 98; NACE International: Houston, TX, USA, 1998. [Google Scholar]
  8. Turconi, G.L.; Gluseppe, C.; Anelli, E.; Scoppio, L.; Perez, T.E.; Morales, C.; Echaniz, G. Improvement of resistance to SSC initiation and propagation of high strength OCTG through microstructure and precipitation control. In CORROSION 2001; NACE International: Houston, TX, USA, 2001. [Google Scholar]
  9. Kaneko, T.; Okada, Y.; Ikeda, A. Influence of microstructure on SSC susceptibility of low-alloy, high-strength oil country tubular goods. Corrosion 1989, 45, 2–6. [Google Scholar] [CrossRef]
  10. Huang, H.; Shaw, W.J.D. Cold work effects on sulfide stress cracking of pipeline steel exposed to sour environments. Corros. Sci. 1993, 34, 61–78. [Google Scholar] [CrossRef]
  11. Ogundele, G.I.; White, W.E. Some Observations on the corrosion of carbon steel in sour gas environments: Effects of H2S and H2S/CO2/CH4/C3H8 mixtures. Corrosion 1986, 42, 398–408. [Google Scholar] [CrossRef]
  12. Hirth, J.P. Effects of hydrogen on the properties of iron and steel. Metall. Trans. A 1980, 11, 861–890. [Google Scholar] [CrossRef]
  13. Takai, K.; Watanuki, R. Hydrogen in trapping states innocuous to environmental degradation of high-strength steels. ISIJ Int. 2003, 43, 520–526. [Google Scholar] [CrossRef]
  14. Nagumo, M. Function of hydrogen in embrittlement of high-strength steels. ISIJ Int. 2001, 41, 590–598. [Google Scholar] [CrossRef]
  15. Nagumo, M.; Takai, K.; Okuda, N. Nature of hydrogen trapping sites in steels induced by plastic deformation. J. Alloy. Compd. 1999, 293, 310–316. [Google Scholar] [CrossRef]
  16. Akhurst, K.N.; Baker, T.J. The threshold stress intensity for hydrogen-induced crack growth. Metall. Trans. A 1981, 12, 1059–1070. [Google Scholar] [CrossRef]
  17. Schiapparelli, E.; Prado, S.; Tiebas, J.J.; Garibaldi, J. Relation between different inclusion-matrix interfaces in steels and the susceptibility to hydrogen embrittlement. J. Mater. Sci. 1992, 27, 2053–2060. [Google Scholar] [CrossRef]
  18. Fujita, S.; Murakami, Y. A new nonmetallic inclusion rating method by positive use of hydrogen embrittlement phenomenon. Metall. Mater. Trans. A 2013, 44, 303–322. [Google Scholar] [CrossRef]
  19. Todoshchenko, O.; Yagodzinskyy, Y.; Yagodzinska, V.; Saukkonen, T.; Hänninen, H. Hydrogen effects on fracture of high-strength steels with different micro-alloying. Corros. Rev. 2015, 33, 515–527. [Google Scholar] [CrossRef]
  20. Masoumi, M.; Silva, C.C.; de Abreu, H.F.G. Effect of crystallographic orientations on the hydrogen-induced cracking resistance improvement of API 5L X70 pipeline steel under various thermomechanical processing. Corros. Sci. 2016, 111, 121–131. [Google Scholar] [CrossRef]
  21. Masoumi, M.; Tavares, S.S.M.; Pardal, J.M.; Martins, T.R.B.; Gomes da Silva, M.J.; de Abreu, H.F.G. The role of microstructure and grain orientations on intergranular cracking susceptibility of UNS 17400 martensitic stainless steel. Eng. Fail. Anal. 2017, 79, 198–207. [Google Scholar] [CrossRef]
  22. Di Schino, A.; Porcu, G.; Scoppio, L.; Longobardo, M.; Turconi, G.L. Metallurgical Design and Development of C125 Grade for Mild Sour Service Application; NACE Corrosion Paper 06125; NACE International: Houston, TX, USA, 2006; pp. 1–14. [Google Scholar]
  23. Lee, J.-Y.; Lee, S.M. Hydrogen trapping phenomena in metals with B.C.C. and F.C.C. crystals structures by the desorption thermal analysis technique. Surf. Coat. Technol. 1986, 28, 301–314. [Google Scholar] [CrossRef]
  24. Pressouyre, G.M.; Bernstein, I.M. A quantitative analysis of hydrogen trapping. Metall. Mater. Trans. A 1978, 9, 1571–1580. [Google Scholar] [CrossRef]
  25. Villalba, E.; Atrens, A. SCC of commercial steels exposed to high hydrogen fugacity. Eng. Fail. Anal. 2008, 15, 617–641. [Google Scholar] [CrossRef]
  26. Echaniz, G.P.; Perez, T.E.; Pampillo, C.; Newman, R.C.; Procter, R.P.M.; Lorimer, G.W. The Effect of Microstructure on SSC Resistance of Low Alloy Carbon Steels; NACE International: Houston, TX, USA, 1997. [Google Scholar]
  27. Omura, T.; Ohe, T.; Abe, T.; Ueda, M.; Nice, P.I.; Martin, J.W. Sulfide stress cracking (SSC) resistance limits for a 125 Ksi grade high strength low alloy steel OCTG developed for mildly sour service. In CORROSION 2010; NACE International: Houston, TX, USA, 2010. [Google Scholar]
  28. Dadfarnia, M.; Nagao, A.; Wang, S.; Martin, M.L.; Somerday, B.P.; Sofronis, P. Recent advances on hydrogen embrittlement of structural materials. Int. J. Fract. 2015, 196, 223–243. [Google Scholar] [CrossRef]
  29. Frappart, S.; Feaugas, X.; Creus, J.; Thebault, F.; Delattre, L.; Marchebois, H. Hydrogen solubility, diffusivity and trapping in a tempered Fe–C–Cr martensitic steel under various mechanical stress states. Mater. Sci. Eng. A 2012, 534, 384–393. [Google Scholar] [CrossRef]
  30. Saha, S.K.; Hilinski, E.J. Study of C110 critical stress intensity factor (KISSC) in various weak H2S solutions. In Corrosion 2013, March 17, 2013–March 21, 2013; NACE—International Corrosion Conference Series; NACE International: Houston, TX, USA, 2013. [Google Scholar]
  31. NACE Standard. TM0177-2016 Labortory Testing of Metals for Resistance to Sulfide Stress Cracking and Stress Corrosion Cracking in H2S Environments; NACE International: Houston, TX, USA, 2016. [Google Scholar]
  32. Morito, S.; Tanaka, H.; Konishi, R.; Furuhara, T.; Maki, T. The morphology and crystallography of lath martensite in Fe-C alloys. Acta Mater. 2003, 51, 1789–1799. [Google Scholar] [CrossRef]
  33. Qi, J.; Li, Y.; Zhou, H. The retained austenite, twinned substructure and auto-tempered carbide in as-quenched low-carbon martensite. Trans. Met. Heat Treat. 1984, 5, 42–51. [Google Scholar]
  34. Koyama, M.; Yamasaki, D.; Nagashima, T.; Tasan, C.C.; Tsuzaki, K. In situ observations of silver-decoration evolution under hydrogen permeation: Effects of grain boundary misorientation on hydrogen flux in pure iron. Scr. Mater. 2017, 129, 48–51. [Google Scholar] [CrossRef]
  35. Caron, R.N.; Krauss, G. The tempering of Fe-C lath martensite. Metall. Trans. 1972, 3, 2381–2389. [Google Scholar] [CrossRef]
  36. Speich, G.R.; Leslie, W.C. Tempering of steel. Metall. Trans. 1972, 3, 1043–1054. [Google Scholar] [CrossRef]
  37. Masakatsu, U.; Nakamura, S.; Abe, T.; Nakamura, K.; Omura, T.T. Development of 125ksi Grade Hsla Steel Octg For Mildly Sour Environments; NACE International: Houston, TX, USA, 2005. [Google Scholar]
  38. Pressouyre, G.M. Trap theory of Hydrogen embrittlement. Acta Metall. 1980, 28, 895–911. [Google Scholar] [CrossRef]
  39. Tiwari, G.P.; Bose, A.; Chakravartty, J.K.; Wadekar, S.L.; Totlani, M.K.; Arya, R.N.; Fotedar, R.K. A study of internal hydrogen embrittlement of steels. Mater. Sci. Eng. A 2000, 286, 269–281. [Google Scholar] [CrossRef]
  40. Michler, T.; Naumann, J. Microstructural aspects upon hydrogen environment embrittlement of various bcc steels. Int. J. Hydrogen Energy 2010, 35, 821–832. [Google Scholar] [CrossRef]
  41. Solheim, K.G.; Solberg, J.K.; Walmsley, J.; Rosenqvist, F.; Bjørnå, T.H. The role of retained austenite in hydrogen embrittlement of supermartensitic stainless steel. Eng. Fail. Anal. 2013, 34, 140–149. [Google Scholar] [CrossRef]
  42. Maroef, I.; Olson, D.L.; Eberhart, M.; Edwards, G.R. Hydrogen trapping in ferritic steel weld metal. Int. Mater. Rev. 2002, 47, 191–223. [Google Scholar] [CrossRef]
  43. Inoue, A.; Masumoto, T. Carbide reactions (M3C→M7C3→M23C6→M6C) during tempering of rapidly solidified high carbon Cr-W and Cr-Mo steels. Metall. Trans. A 1980, 11, 739–747. [Google Scholar] [CrossRef]
  44. Liu, Y.; Wang, M.; Liu, G. Hydrogen trapping in high strength martensitic steel after austenitized at different temperatures. Int. J. Hydrogen Energy 2013, 38, 14364–14368. [Google Scholar] [CrossRef]
  45. Wang, C.; Wang, M.; Shi, J.; Hui, W.; Dong, H. Effect of microstructural refinement on the toughness of low carbon martensitic steel. Scr. Mater. 2008, 58, 492–495. [Google Scholar] [CrossRef]
  46. Hajilou, T.; Deng, Y.; Rogne, B.R.; Kheradmand, N.; Barnoush, A. In situ electrochemical microcantilever bending test: A new insight into hydrogen enhanced cracking. Scr. Mater. 2017, 132, 17–21. [Google Scholar] [CrossRef]
  47. Cui, H.B.; Xie, G.M.; Luo, Z.A.; Ma, J.; Wang, G.D.; Misra, R.D.K. The microstructural evolution and impact toughness of nugget zone in friction stir welded X100 pipeline steel. J. Alloy. Compd. 2016, 681, 426–433. [Google Scholar] [CrossRef]
  48. Zhong, Y.; Xiao, F.; Zhang, J.; Shan, Y.; Wang, W.; Yang, K. In situ TEM study of the effect of M/A films at grain boundaries on crack propagation in an ultra-fine acicular ferrite pipeline steel. Acta Mater. 2006, 54, 435–443. [Google Scholar] [CrossRef]
  49. ASTM. A370-10 Standard Test Methods and Definitions for Mechanical Testing of Steel Products; ASTM International: West Conshohocken, PA, USA, 2010. [Google Scholar] [CrossRef]
Figure 1. Δa as a function of immersion duration time (t) for Q&T–treated samples at differing Tt.
Materials 11 00412 g001
Figure 2. da/dt vs. KIapplied for Q&T–treated samples at differing Tt.
Materials 11 00412 g002
Figure 3. Typical macroscopic observation of sulfide stress cracking (SSC) fracture in double cantilever beam (DCB) sample tempered at 700 °C.
Materials 11 00412 g003
Figure 4. Typical SEM observation of corrosion film covering SSC fracture surface in (a) DCB sample and (b) its EDS (energy dispersive spectroscopy) spectrum.
Materials 11 00412 g004
Figure 5. Typical SEM observations of real SSC fracture surface in DCB sample tempered at (a) 650; (b) 700; and (c) 720 °C, with the corrosion film removed.
Materials 11 00412 g005aMaterials 11 00412 g005b
Figure 6. Typical prior austenite grain (PAG) observation of as-quenched sample at 890 °C.
Materials 11 00412 g006
Figure 7. Typical SEM observations of martensitic packet in Q&T–treated samples at differing Tt of (a) 650; (b) 700; and (c) 720 °C.
Materials 11 00412 g007
Figure 8. Typical electron back-scattered diffraction (EBSD) orientation maps showing martensitic packet and block in Q&T–treated samples at differing Tt of (a) 650; (b) 700 and (c) 720 °C.
Materials 11 00412 g008
Figure 9. Typical TEM observations of martensite lath and precipitate in Q&T–treated samples at differing Tt of (a) 650; (b) 700; and (c) 720 °C and their enlarged micrographs (ai, bi and ci). The red frame showing the rod-like precipitated particles distributed in the martensitic laths boundaries.
Materials 11 00412 g009
Figure 10. D and f of the precipitates in Q&T–treated samples varied with Tt.
Materials 11 00412 g010
Figure 11. XRD patterns of Q&T–treated samples at differing Tt.
Materials 11 00412 g011
Figure 12. H permeation curves for Q&T–treated samples at differing Tt.
Materials 11 00412 g012
Figure 13. (a) Corrosion pit and (b) secondary microcrack typically initiating from massive Al2O3·SiO·CaO and slender Al2O3·SiO·CaO·TiO complex inclusions, respectively, underneath the SSC fracture surface of DCB sample tempered at 700 °C.
Materials 11 00412 g013
Figure 14. Typical inverse pole figure map displaying grain boundaries with different crystal orientations in a Q&T–treated sample at Tt = 700 °C. Dotted arrow line stands for the crack propagation direction; black solid arrow line denotes high-angle grain boundaries (HAGBs) and red solid arrow lines indicate low-angle grain boundaries (LAGBs).
Materials 11 00412 g014
Figure 15. Geometry and dimensions of the tensile specimen.
Materials 11 00412 g015
Figure 16. Typical illustration of standard DCB specimen.
Materials 11 00412 g016
Table 1. Summary of mechanical properties and KISSC value for quenching and tempering (Q&T)–treated samples. YS: yield strength; TS: tensile strength; EL: elongation; HRC: hardness.
SampleTt/°CYS/MPaTS/MPaEL/%HRCKISSC/MPa·mm0.5
1650100710621835.417.16
27007768572325.129.02
37207288052523.433.26
Table 2. Quantitative determinations of PAG and martensitic substructure features in Q&T–treated samples at differing Tt.
Tt/°CDγ/μmDp/μmDb/μmWl/μmfGBMA≥15°/%ρ/1014 m−2
6507.63.731.150.3266.81.41
7007.54.011.320.5369.80.84
7207.14.201.350.5870.50.62
Table 3. H permeation test results for Q&T–treated samples at differing Tt.
Tt/°CDo/10−7cm2/sCo/ppm
6500.486.45
7001.781.87
7202.200.86
Table 4. Summary of calculated NT provided by various grain boundaries (GBs) and the dislocations.
Tt/°C650700720
NT-PAG/1025 m−35.85.96.2
NT-MP/1025 m−311.911.110.6
NT-MB/1025 m−338.633.632.9
NT-ML/1025 m−3138.783.776.5
NT-GB/1025 m−392.658.453.9
NT-dis/1025 m−30.270.160.12
Table 5. Effects of HAGBs on SSC propagation behavior shown in Figure 14.
Grain BoundaryMisorientation Angle (°)Cracking Behavior
1 and 249.3Deviated
2 and 335.6Deviated
3 and 459.5Arrested
Table 6. Chemical compositions of 28CrMo48VTiB steel (wt %).
CSiMnPSCrMoVTiB
0.280.250.400.0080.0021.000.800.150.015trace

