3.1. Micro Dynamic Observation of the Contact Interface in a Single Friction Period
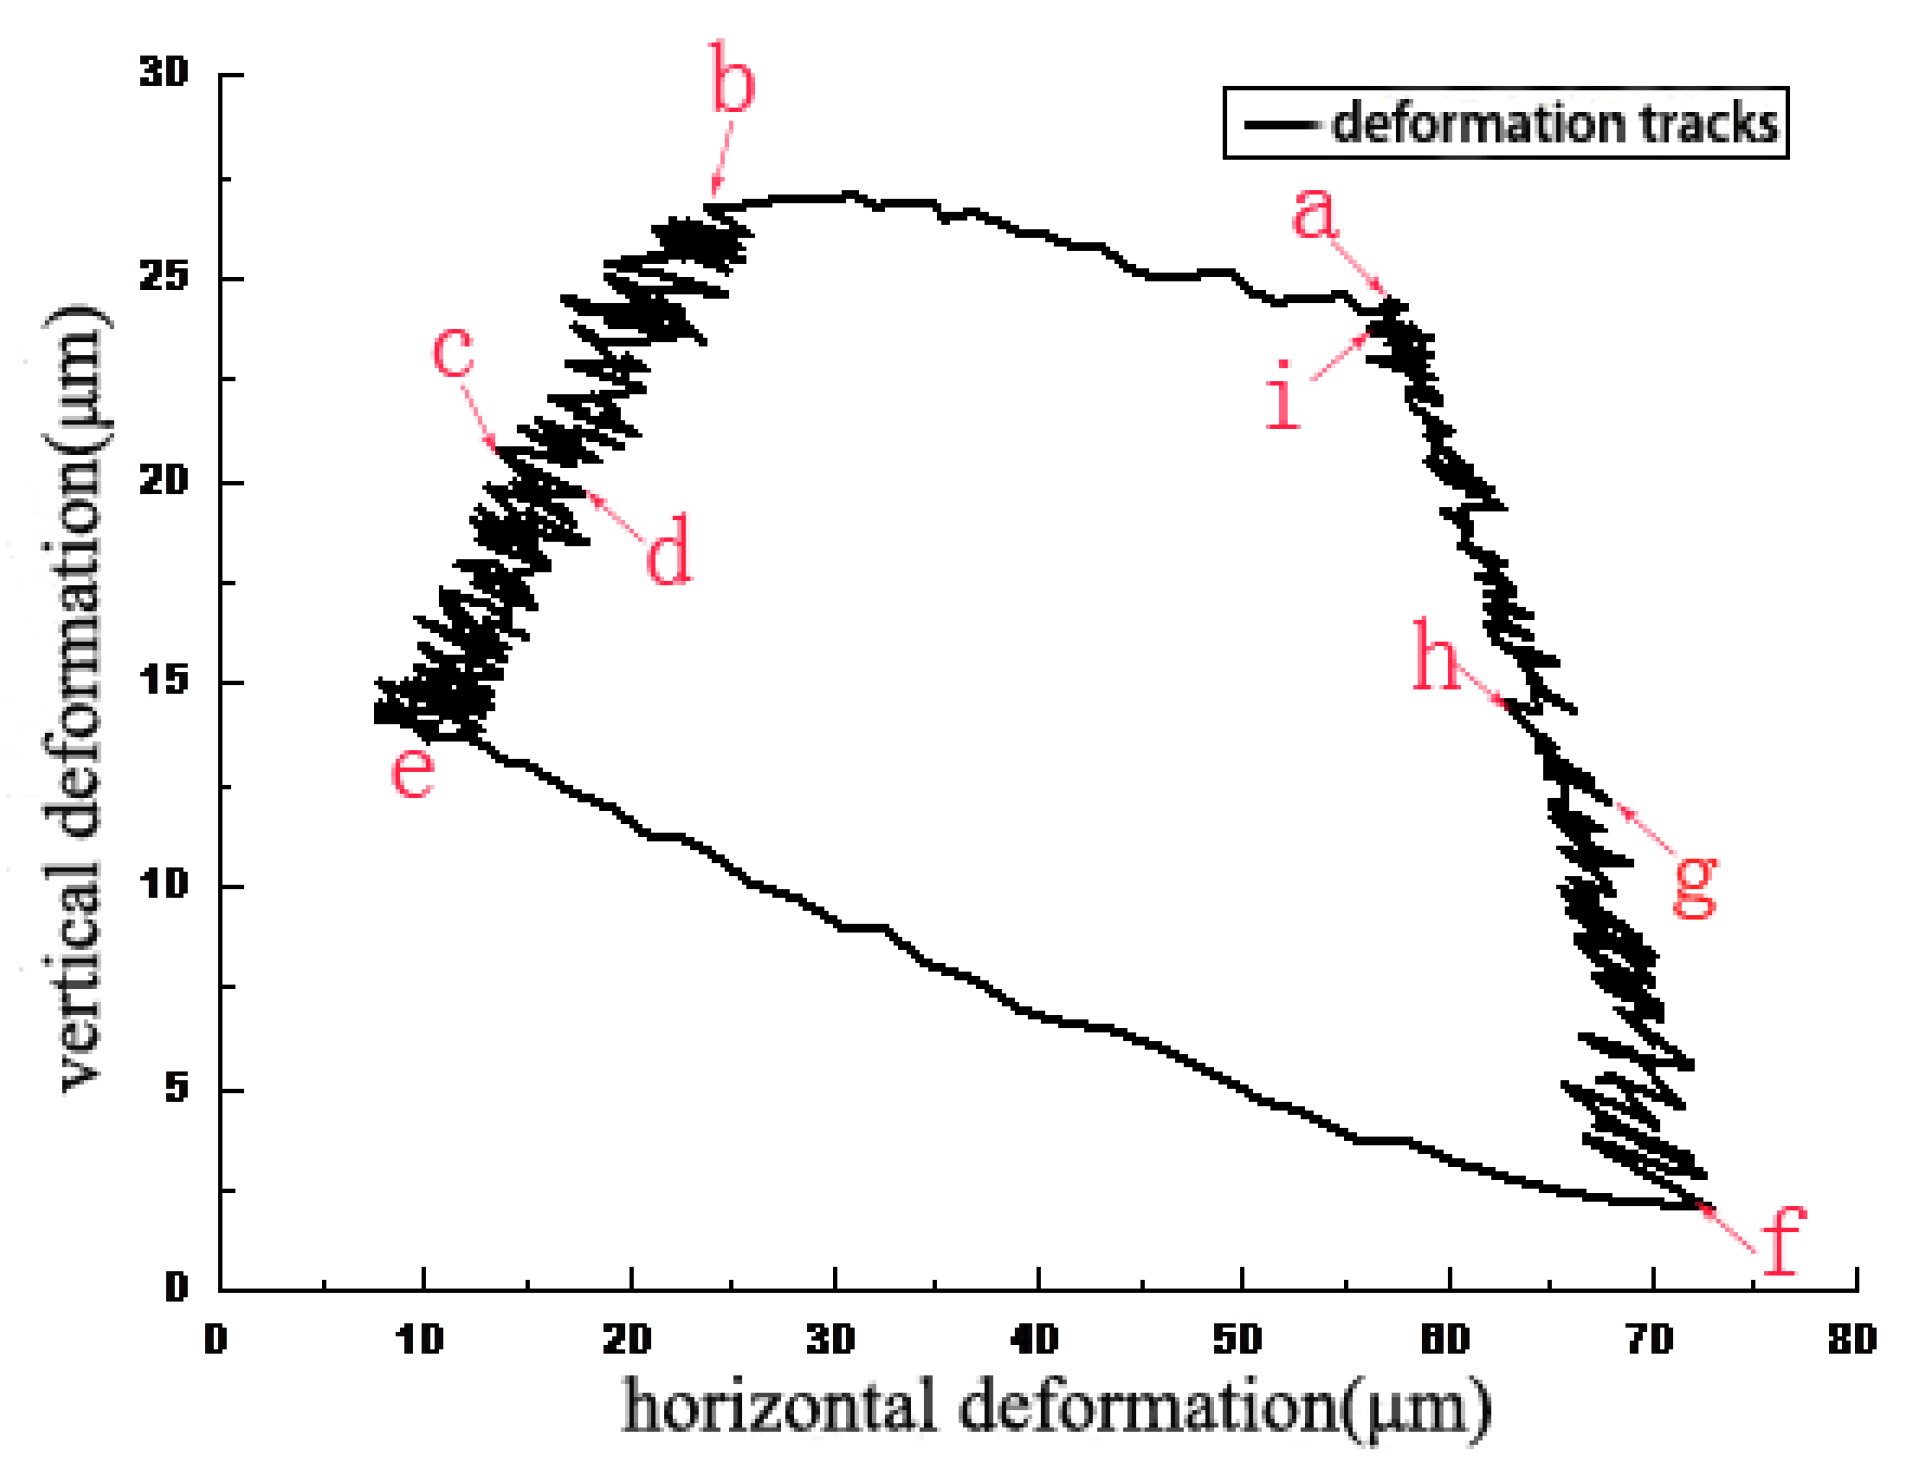
Figure 3 illustrates the deformation track of the marked point
l in a single friction cycle relating to the X and Y axes when contact pressure and sliding speed are 2 MPa and 3 mm/s, respectively. The points
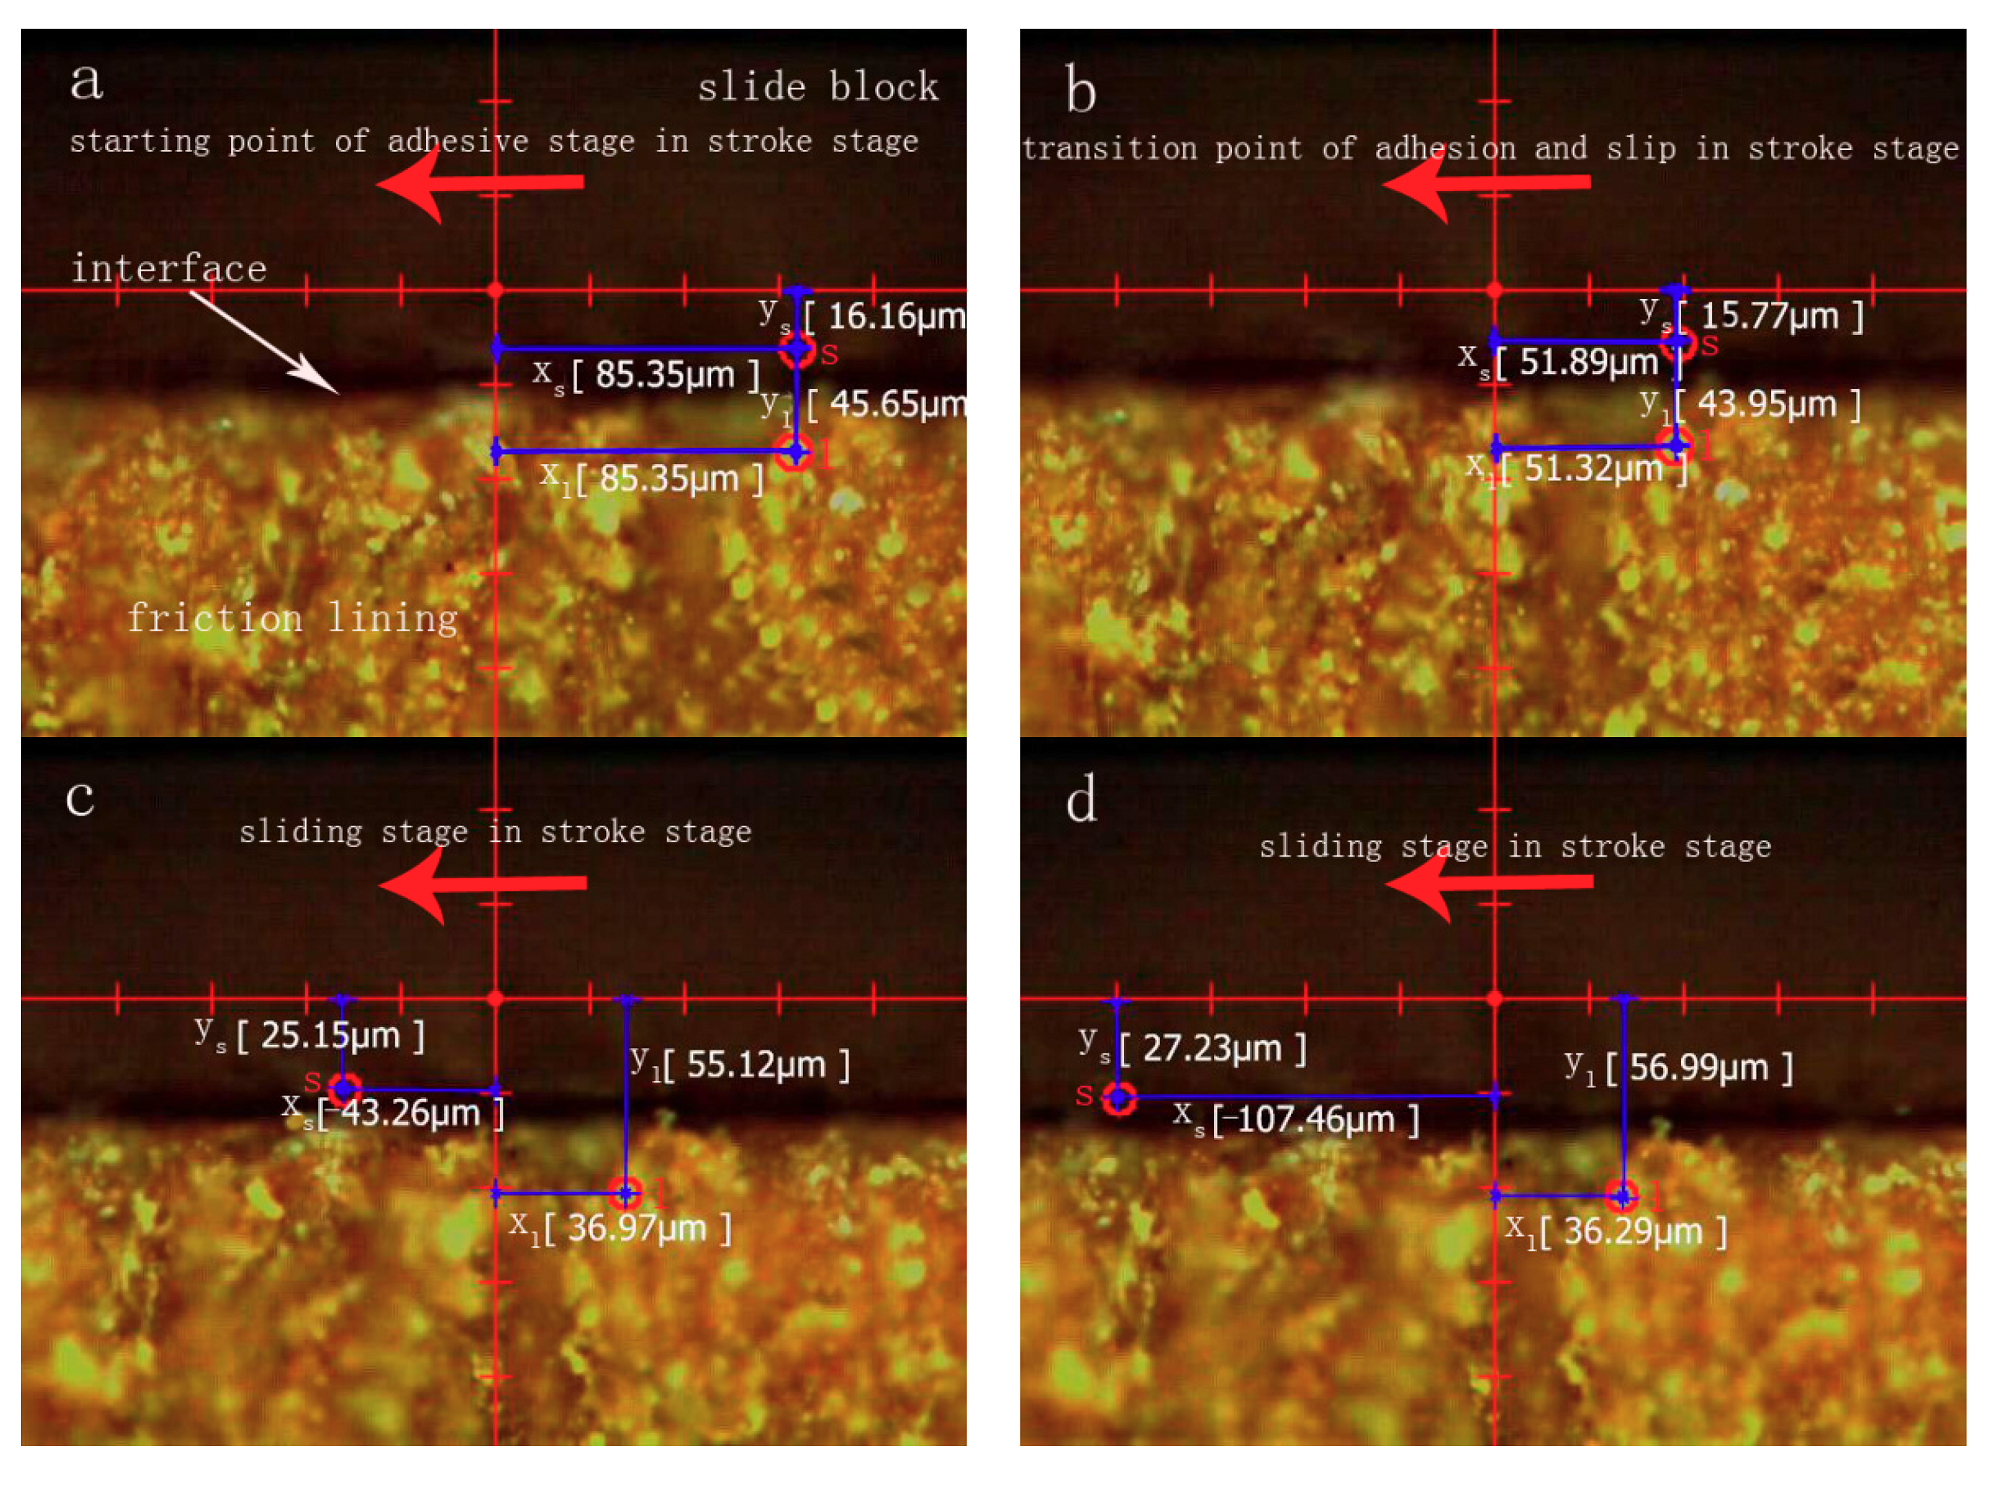
a–i are chosen around the counter clockwise rotation of the deformation track. Then the instantaneous contact situation of the contact interface and the position change of marked points
s and
l in the moments of points
a–i are shown in
Figure 4. The first half of the sliding cycle, that is, the process of sliding from the initial zero position to the set position, is defined as the stroke stage. The latter half of the cycle is defined as return stage, which is the process of sliding from the set position to the initial zero position at the same speed. The deformation track of marked point
l towards left from point
a to point
b in the stroke stage is shown in
Figure 3.
Figure 4a,b shows that both horizontal positions X
s and X
l of marked points
s and
l deform from 85.35 μm to 51.89 μm. This indicates that no relative displacement occurred between marked points
s and
l in this period, which is defined as adhesive stage.
The deformation track of marked point
l downwards and left from point
b to point
e in the stroke stage is shown in
Figure 3, where an instantaneous deformation track (from point
c to point
d) is chosen.
Figure 4c,d shows that the position X
l of marked point
l holds at about 36.97 μm, the position X
s of marked point
s slides from −43.26 μm to −107.46 μm, and the position Y
l of marked point
l deforms from 55.12 μm to 56.99 μm, the position Y
s of marked point
s moves from 25.15 μm to 27.23 μm. A position change means that the vertical distance ∆Y between marked points
l and
s holds at about 29.97 μm and an instantaneous horizontal displacement ∆X between marked points
l and
s occurs in the period which can be defined as the sliding stage. Moreover, the interfacial contact from point
c to point
d can represent the typical contact situation of the period from point
b to point
e, therefore the total period from point
b to point
e can be defined as a sliding stage.
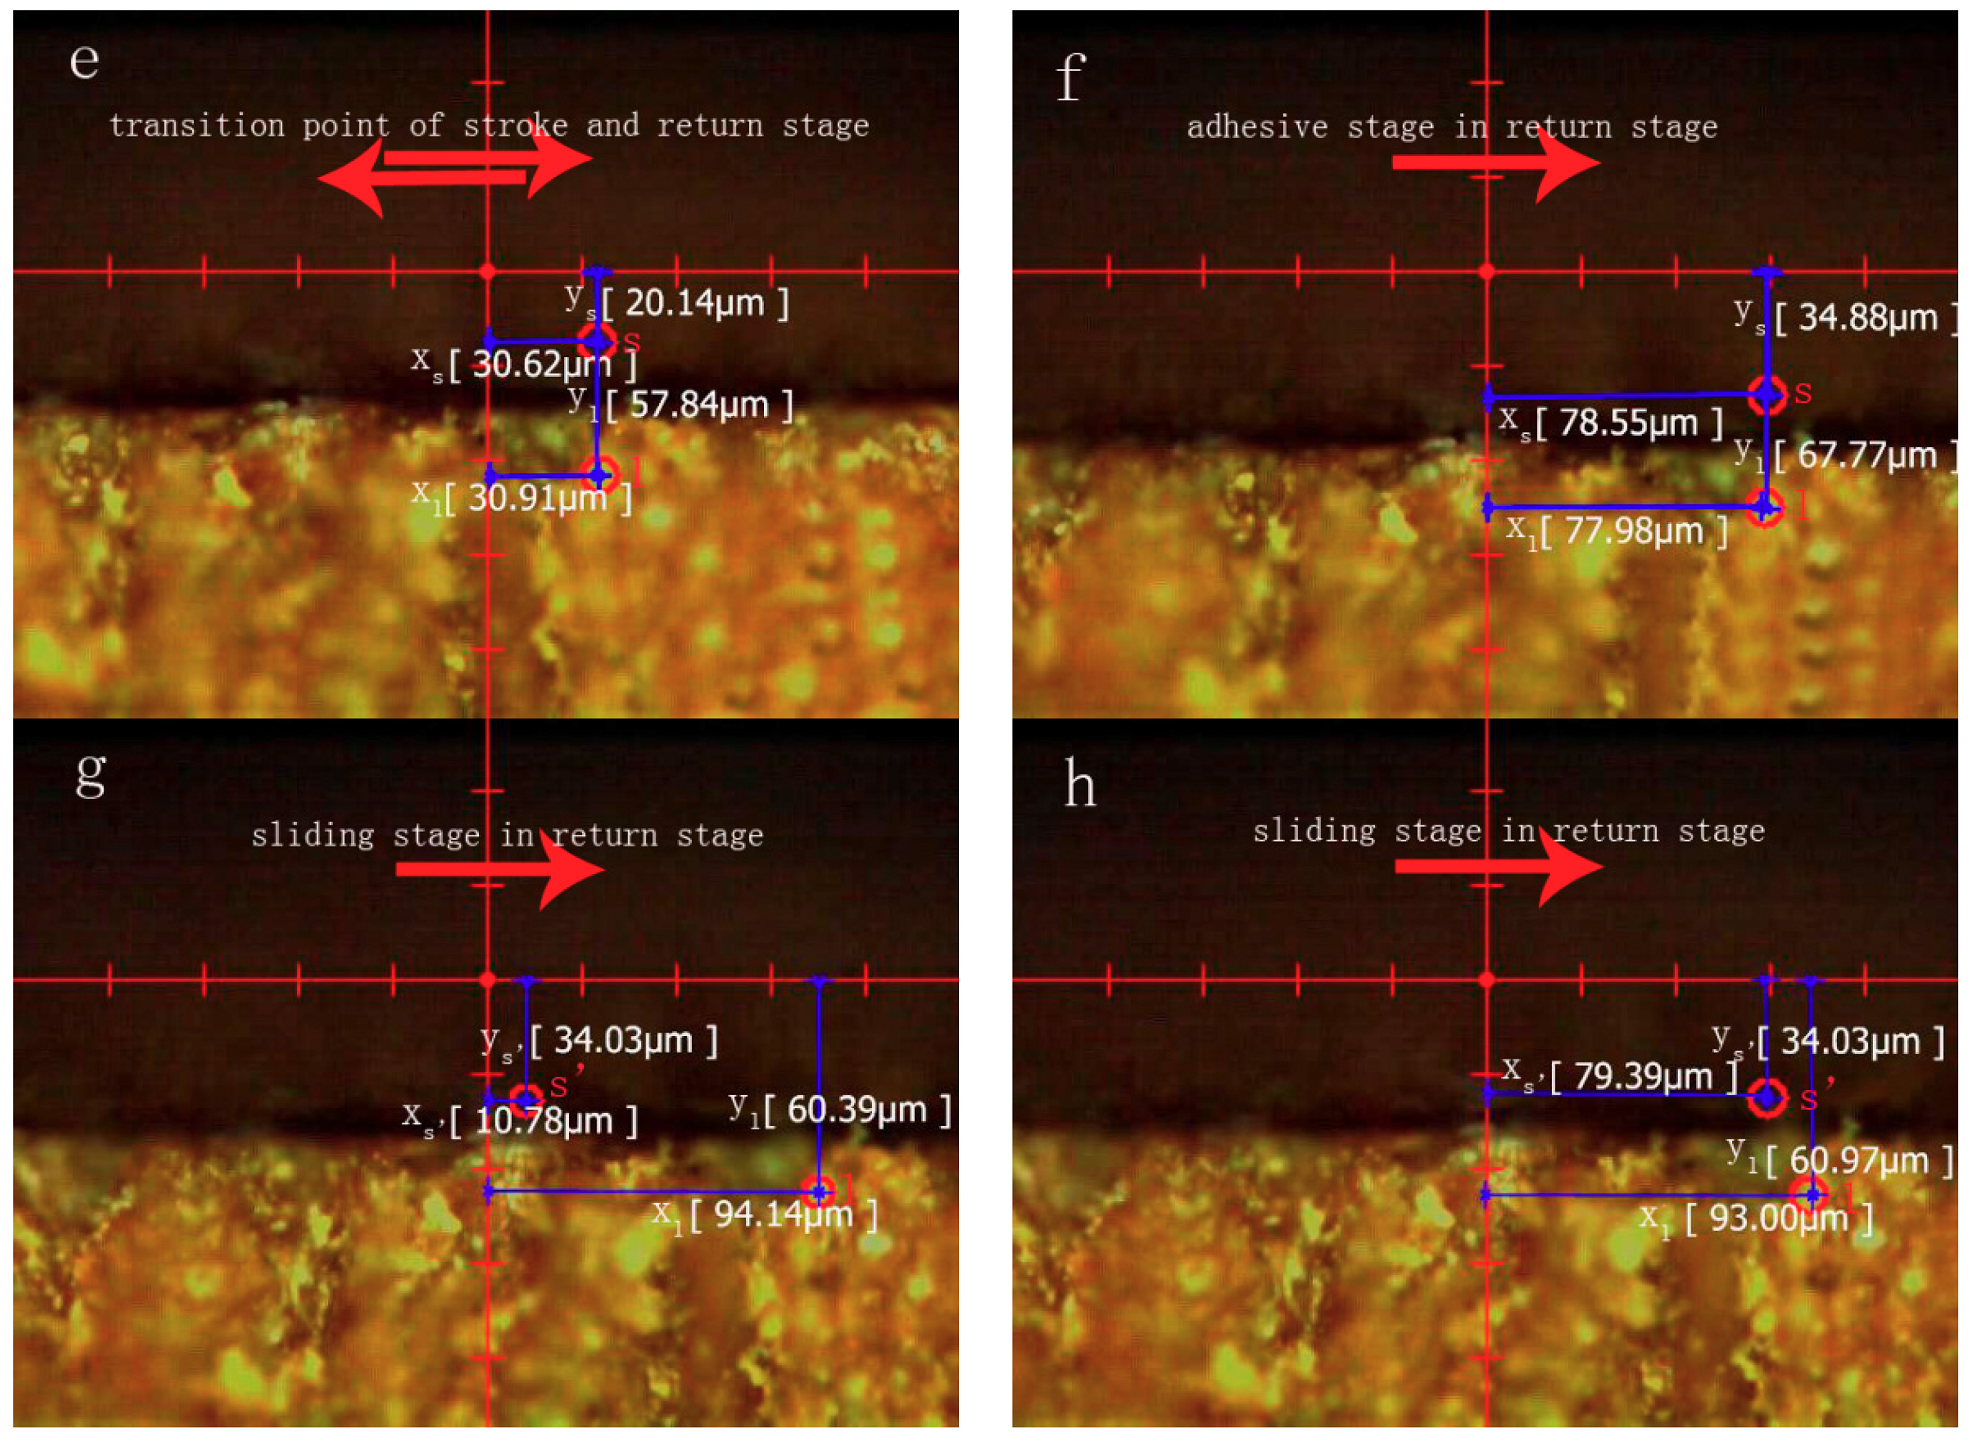
The total return stage can also be divided into two stages including adhesive stage and sliding stage. A position change of marked point
l relating to that of marked point
s in the stroke stage is also same as in the return stage. The deformation track of marked point
l downwards and right from point
e to point
f in the return stage is shown in
Figure 3.
Figure 4e,f shows that X
l and X
s deform from 30.62 μm to 97.54 μm due to interfacial adhesive force. This phenomenon means that no relative displacement occurs in the period which can be defined as the adhesive stage.
The deformation track of marked point
l upwards and left from point
f to point
i in the return stage is shown in
Figure 3, where a typical instantaneous deformation track (from point
g to point
h) is chosen. A new marked point
s’ is chosen because the marked point
s in the circular column moves out the field of view.
Figure 4g,h shows that X
s, rapidly slides from 10.78 μm to 79.39 μm, where X
l, Y
l and Y
s’ hold at about 94.14 μm, 60.39 μm, and 34.03 μm, respectively. The phenomenon reveals that ∆Y remains static and ∆X rapidly increases in the period, which can be defined as the sliding stage.
3.2. Microscopic Friction Mechanism of Lining Contact Interface in a Single Friction Period
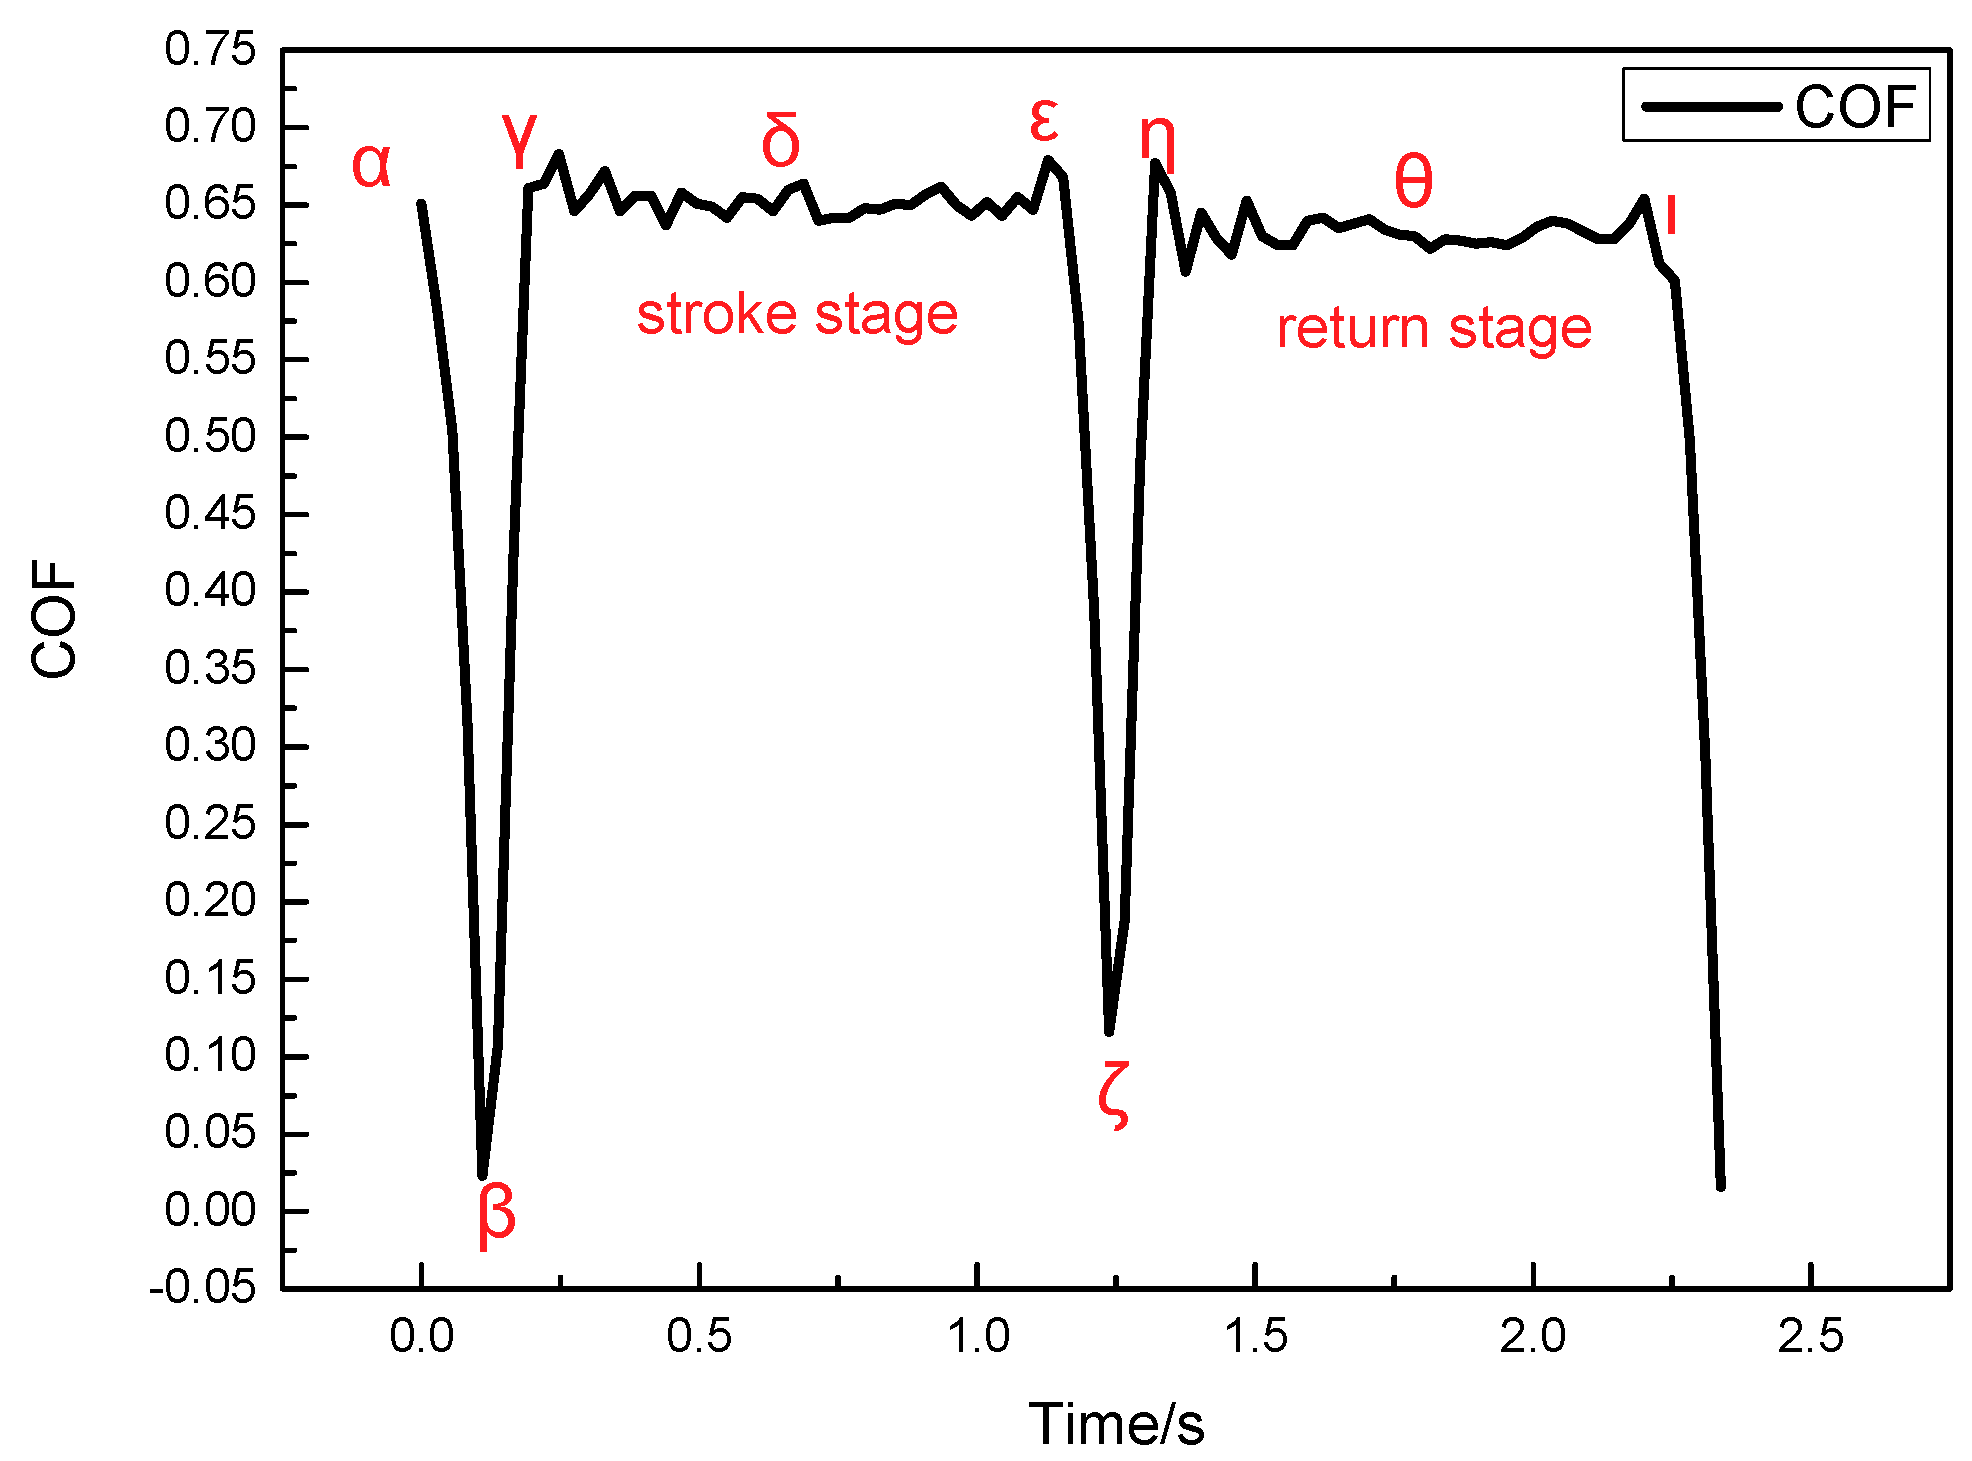
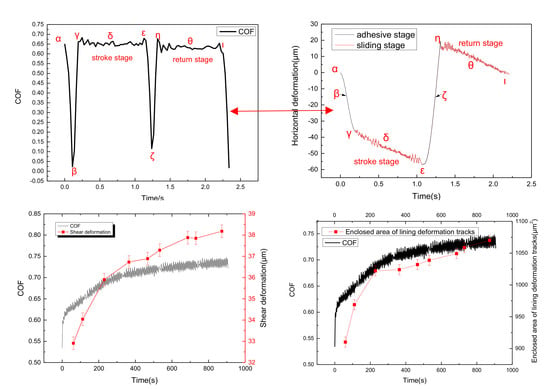
Figure 5 shows the curve of friction coefficient in a single friction period at the contact pressure of 2 MPa and the sliding speed of 3 mm/s.
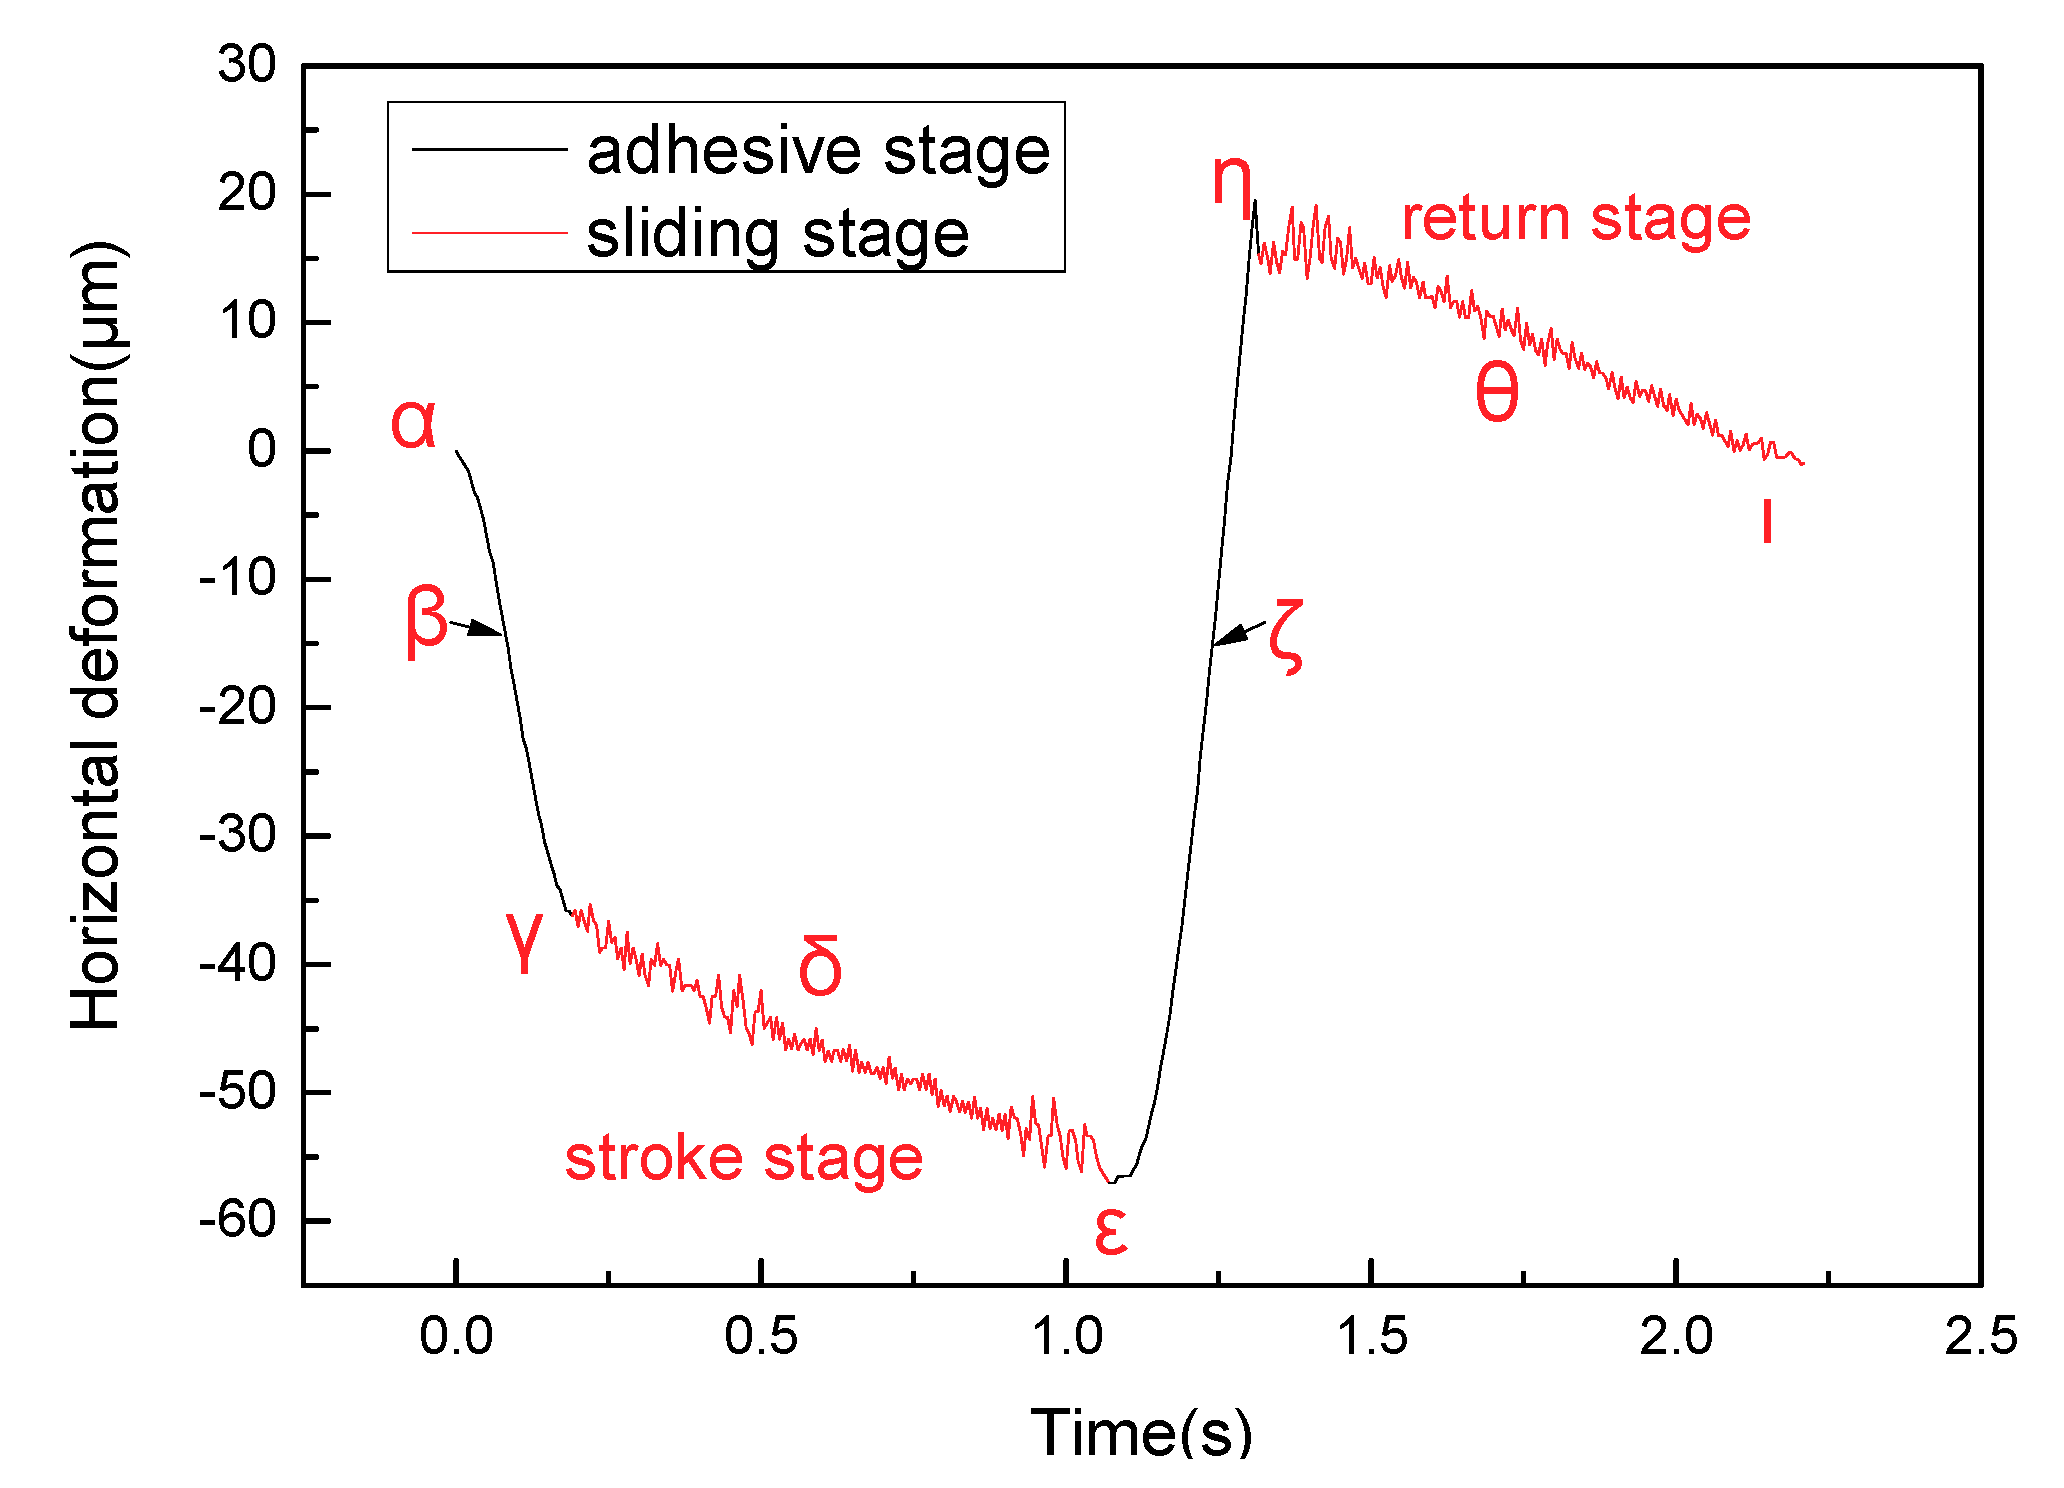
Figure 6 shows the shear deformation curve of lining surface in the sliding frictional process. Seven
α–
θ marking points in the curve are obtained due to the law of friction coefficient and shear deformation. Friction coefficient from point
α to point
β rapidly decreases in the stroke stage (shown in
Figure 5). The interfacial contact situation of this period (adhesive stage in the stroke stage in
Figure 4) shows that this stage is in a state of adhesion. Then point
β in
Figure 6 indicates that the residual shear deformation of the lining surface is elastically recovered, which leads the sticky points on the contact surface to be in a state of equilibrium, and for adhesive force to decrease to zero. After point
β, the friction coefficient of the lining rapidly increases and reaches a maximum in point
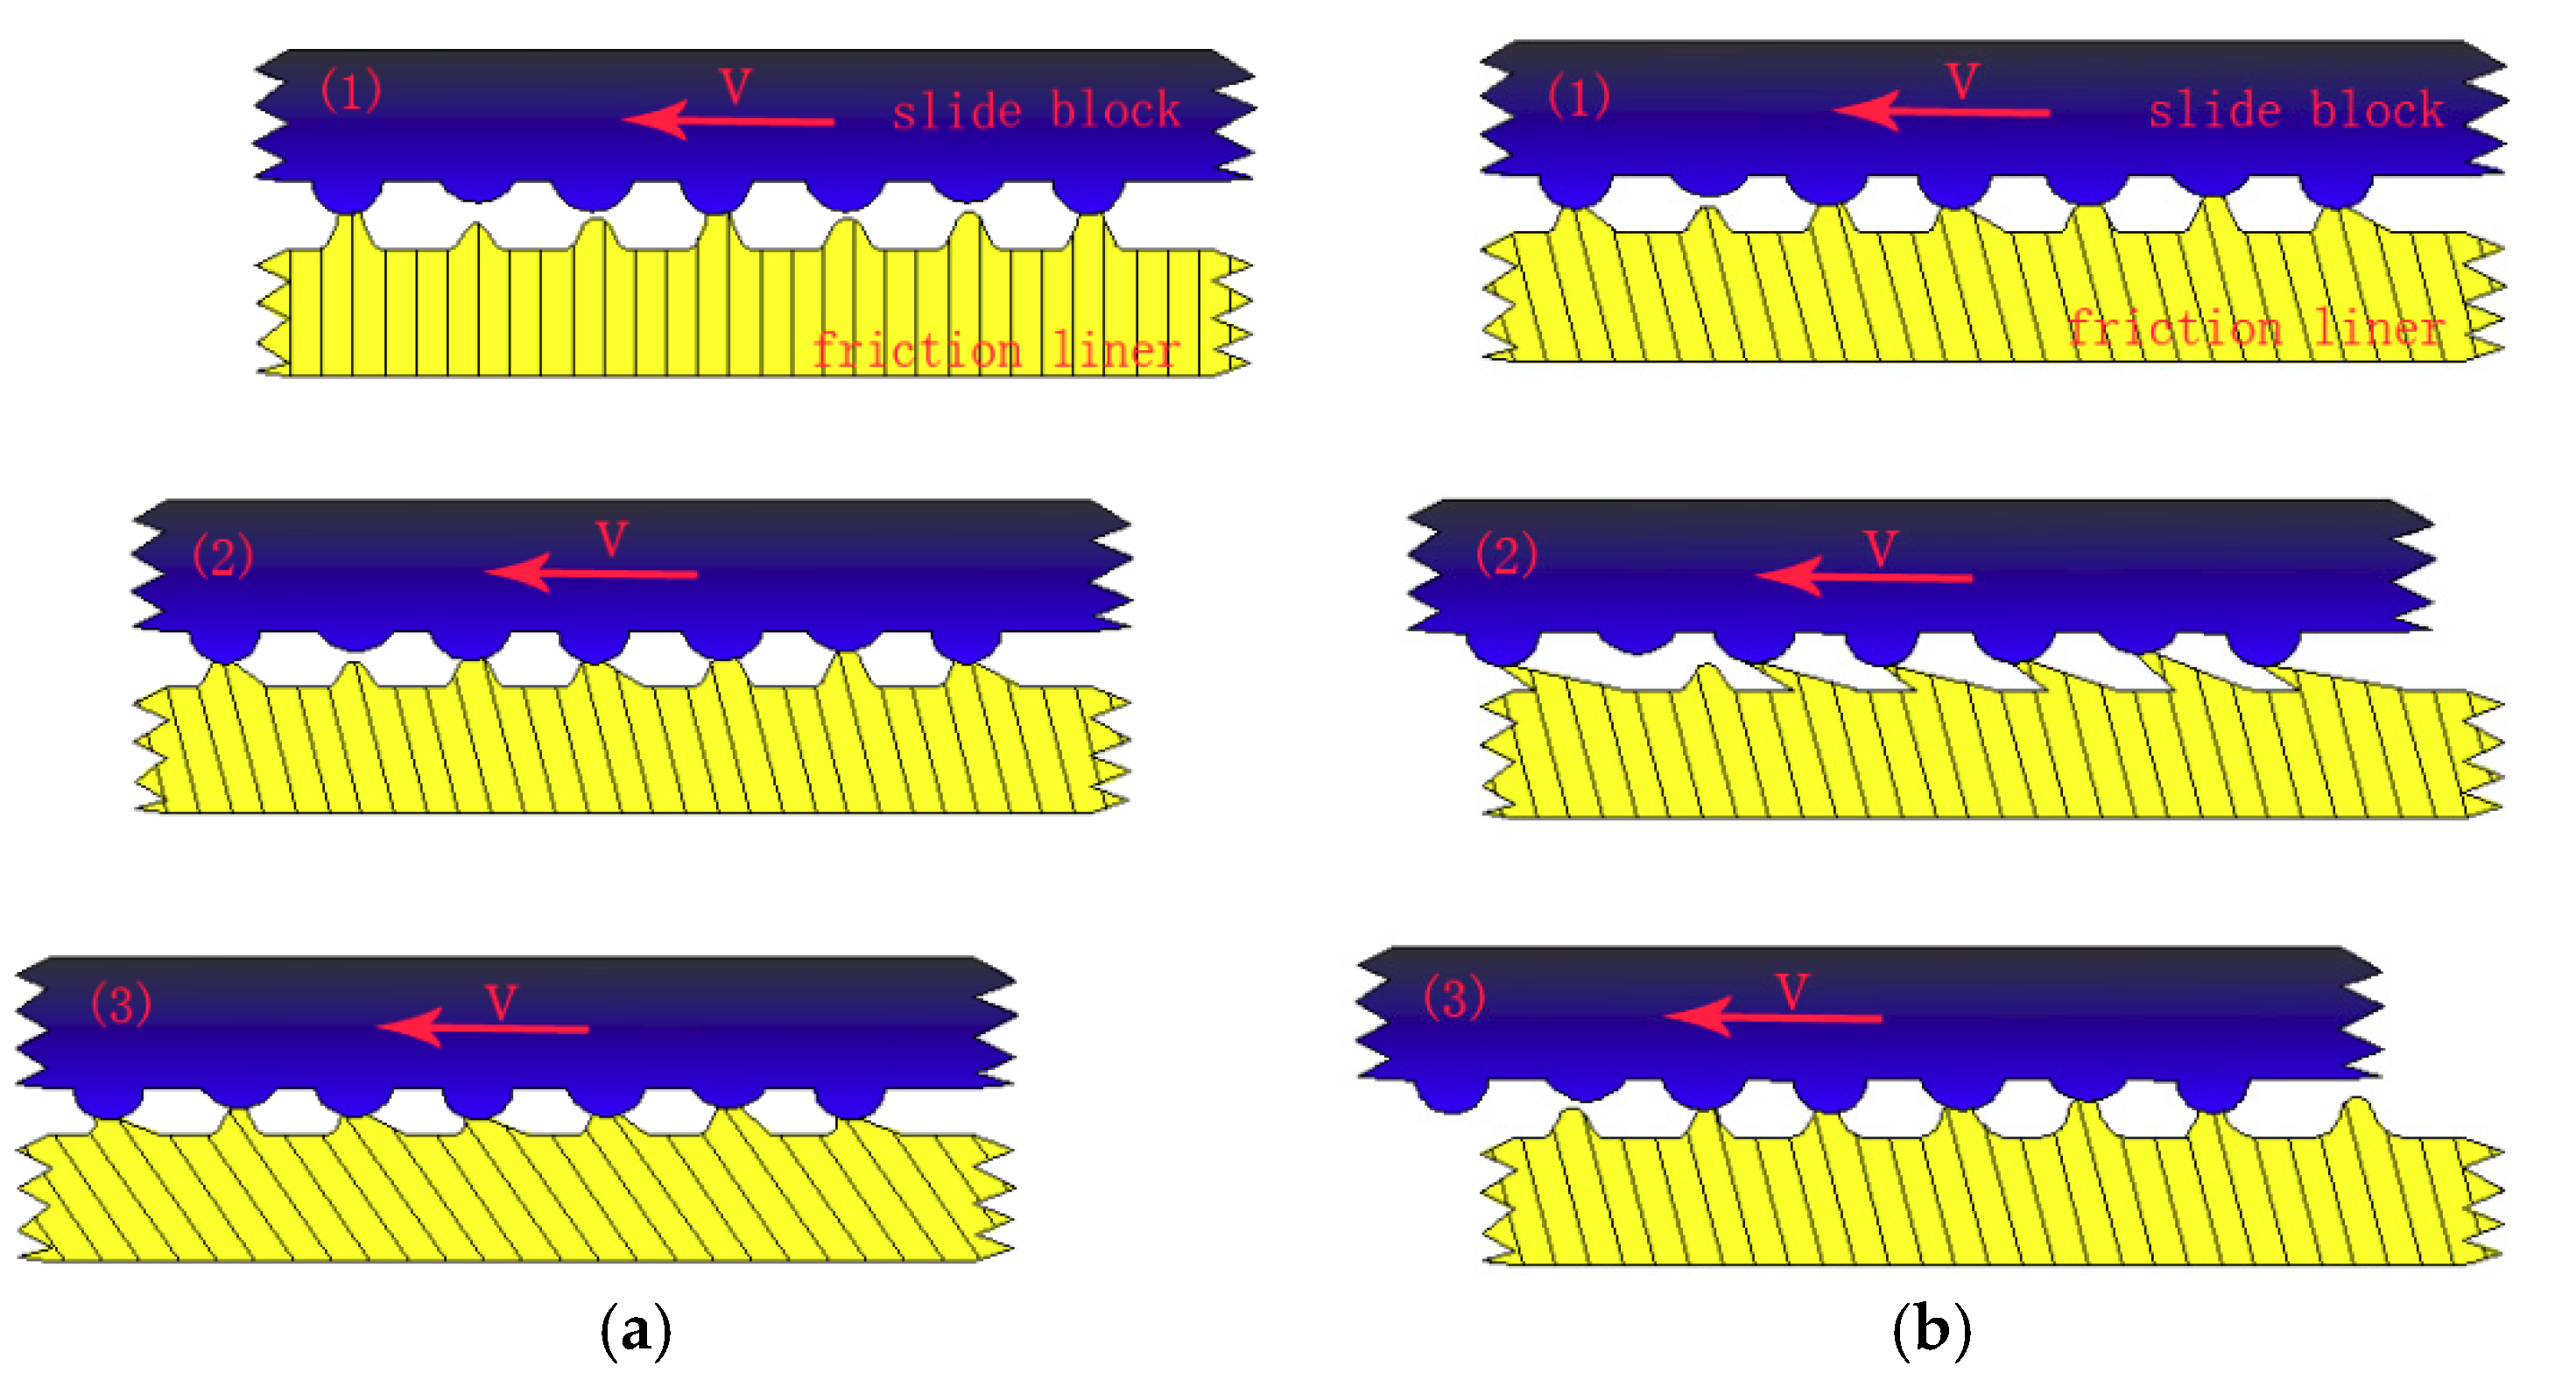
γ. The reason is that the contact interface is still in a state of adhesion and no relative displacement occurs. Furthermore, with the development of slip, the adhesive shear deformation of the lining surface rapidly increases, and sticky points deform, contributing to the occurrence of new sticky points between the smaller micro bulge and the surface of the circular column. The phenomenon can lead to the increase in sticky points and real contact area. Thus, adhesive friction coefficient increases (adhesive friction mechanism in
Figure 7: stage 1 is a state of adhesion, stage 2 and stage 3 are the adhesive deformation stage and no relative displacement). Then ∆X
l reaches a maximum (34.03 μm) as the adhesive friction coefficient reaches a maximum. Overall, the variety of friction coefficient from point
α to point
γ is caused by adhesive friction, and a positive proportional relationship occurs between ∆X
l in the adhesive stage and the adhesive friction coefficient.
Figure 5 shows the friction coefficient from point
γ to point
ε in the stroke stage presenting a state of steady situation. The interfacial contact situation (sliding stage in the stroke stage in
Figure 4) shows that the stage is in a state of sliding situation. Moreover, the occurrence of an instantaneous displacement contributes to the break of the sticky points, and new sticky points are built in new places (the adhesive mechanism in the sliding stage in
Figure 7: stage 1 is a state of adhesion, stage 2 is the adhesive deformation stage, stage 3 has an instantaneous displacement and new sticky points are built in new places). A dynamic equilibrium is built between the formation and break of sticky points in the reciprocating frictional process. The repeated tensile, fracture and relaxation of molecular bonds occurs in the process of the formation of new bonds and the fracture of old bonds [
18]. This contributes to the relatively steady variety of ∆X
l and real contact area. Adhesive friction, therefore, is in a state of steady situation. Furthermore, the frictional mechanism in adhesive and sliding stages reveals that parts of the sticky points are in a state of fracture in the sliding stage [
18], causing the adhesive friction coefficient in this period to be evidently smaller than that at the end of adhesive stage. Moreover, as the friction lining is a kind of viscoelastic material, tiny micro bulges in the contact surface generate repeated cyclic deformation when the surface of the friction lining is in a state of sliding situation in this period. Then, the repeated cyclic deformation can generate horizontal hysteresis force, hindering the movement of the circular column, and the behavior is defined as hysteresis friction [
18]. Overall, the friction in this period includes adhesive and hysteresis friction.
Point
ε is the transition point of the stroke and return stage (shown in
Figure 5), surface shear deformation of the lining rapidly recovers after point
ε (shown in
Figure 6), and the friction coefficient rapidly decreases to a minimum at point
ζ. The period from point
ζ to point
η is referred to as the adhesive stage, where real contact area gradually increases. Furthermore, the adhesive friction coefficient increases to a maximum at maximum shear deformation (66.63 μm) at the point
η. The period from point
η to point
θ is called the sliding stage, where the real contact area and instantaneous sliding speed reach a steady situation. These behaviors contribute to a steady variation trend of friction coefficient. Overall, the variation trend in the return stage is the same as that in the stroke stage.
3.3. Friction Mechanism in the Total Experimental Process
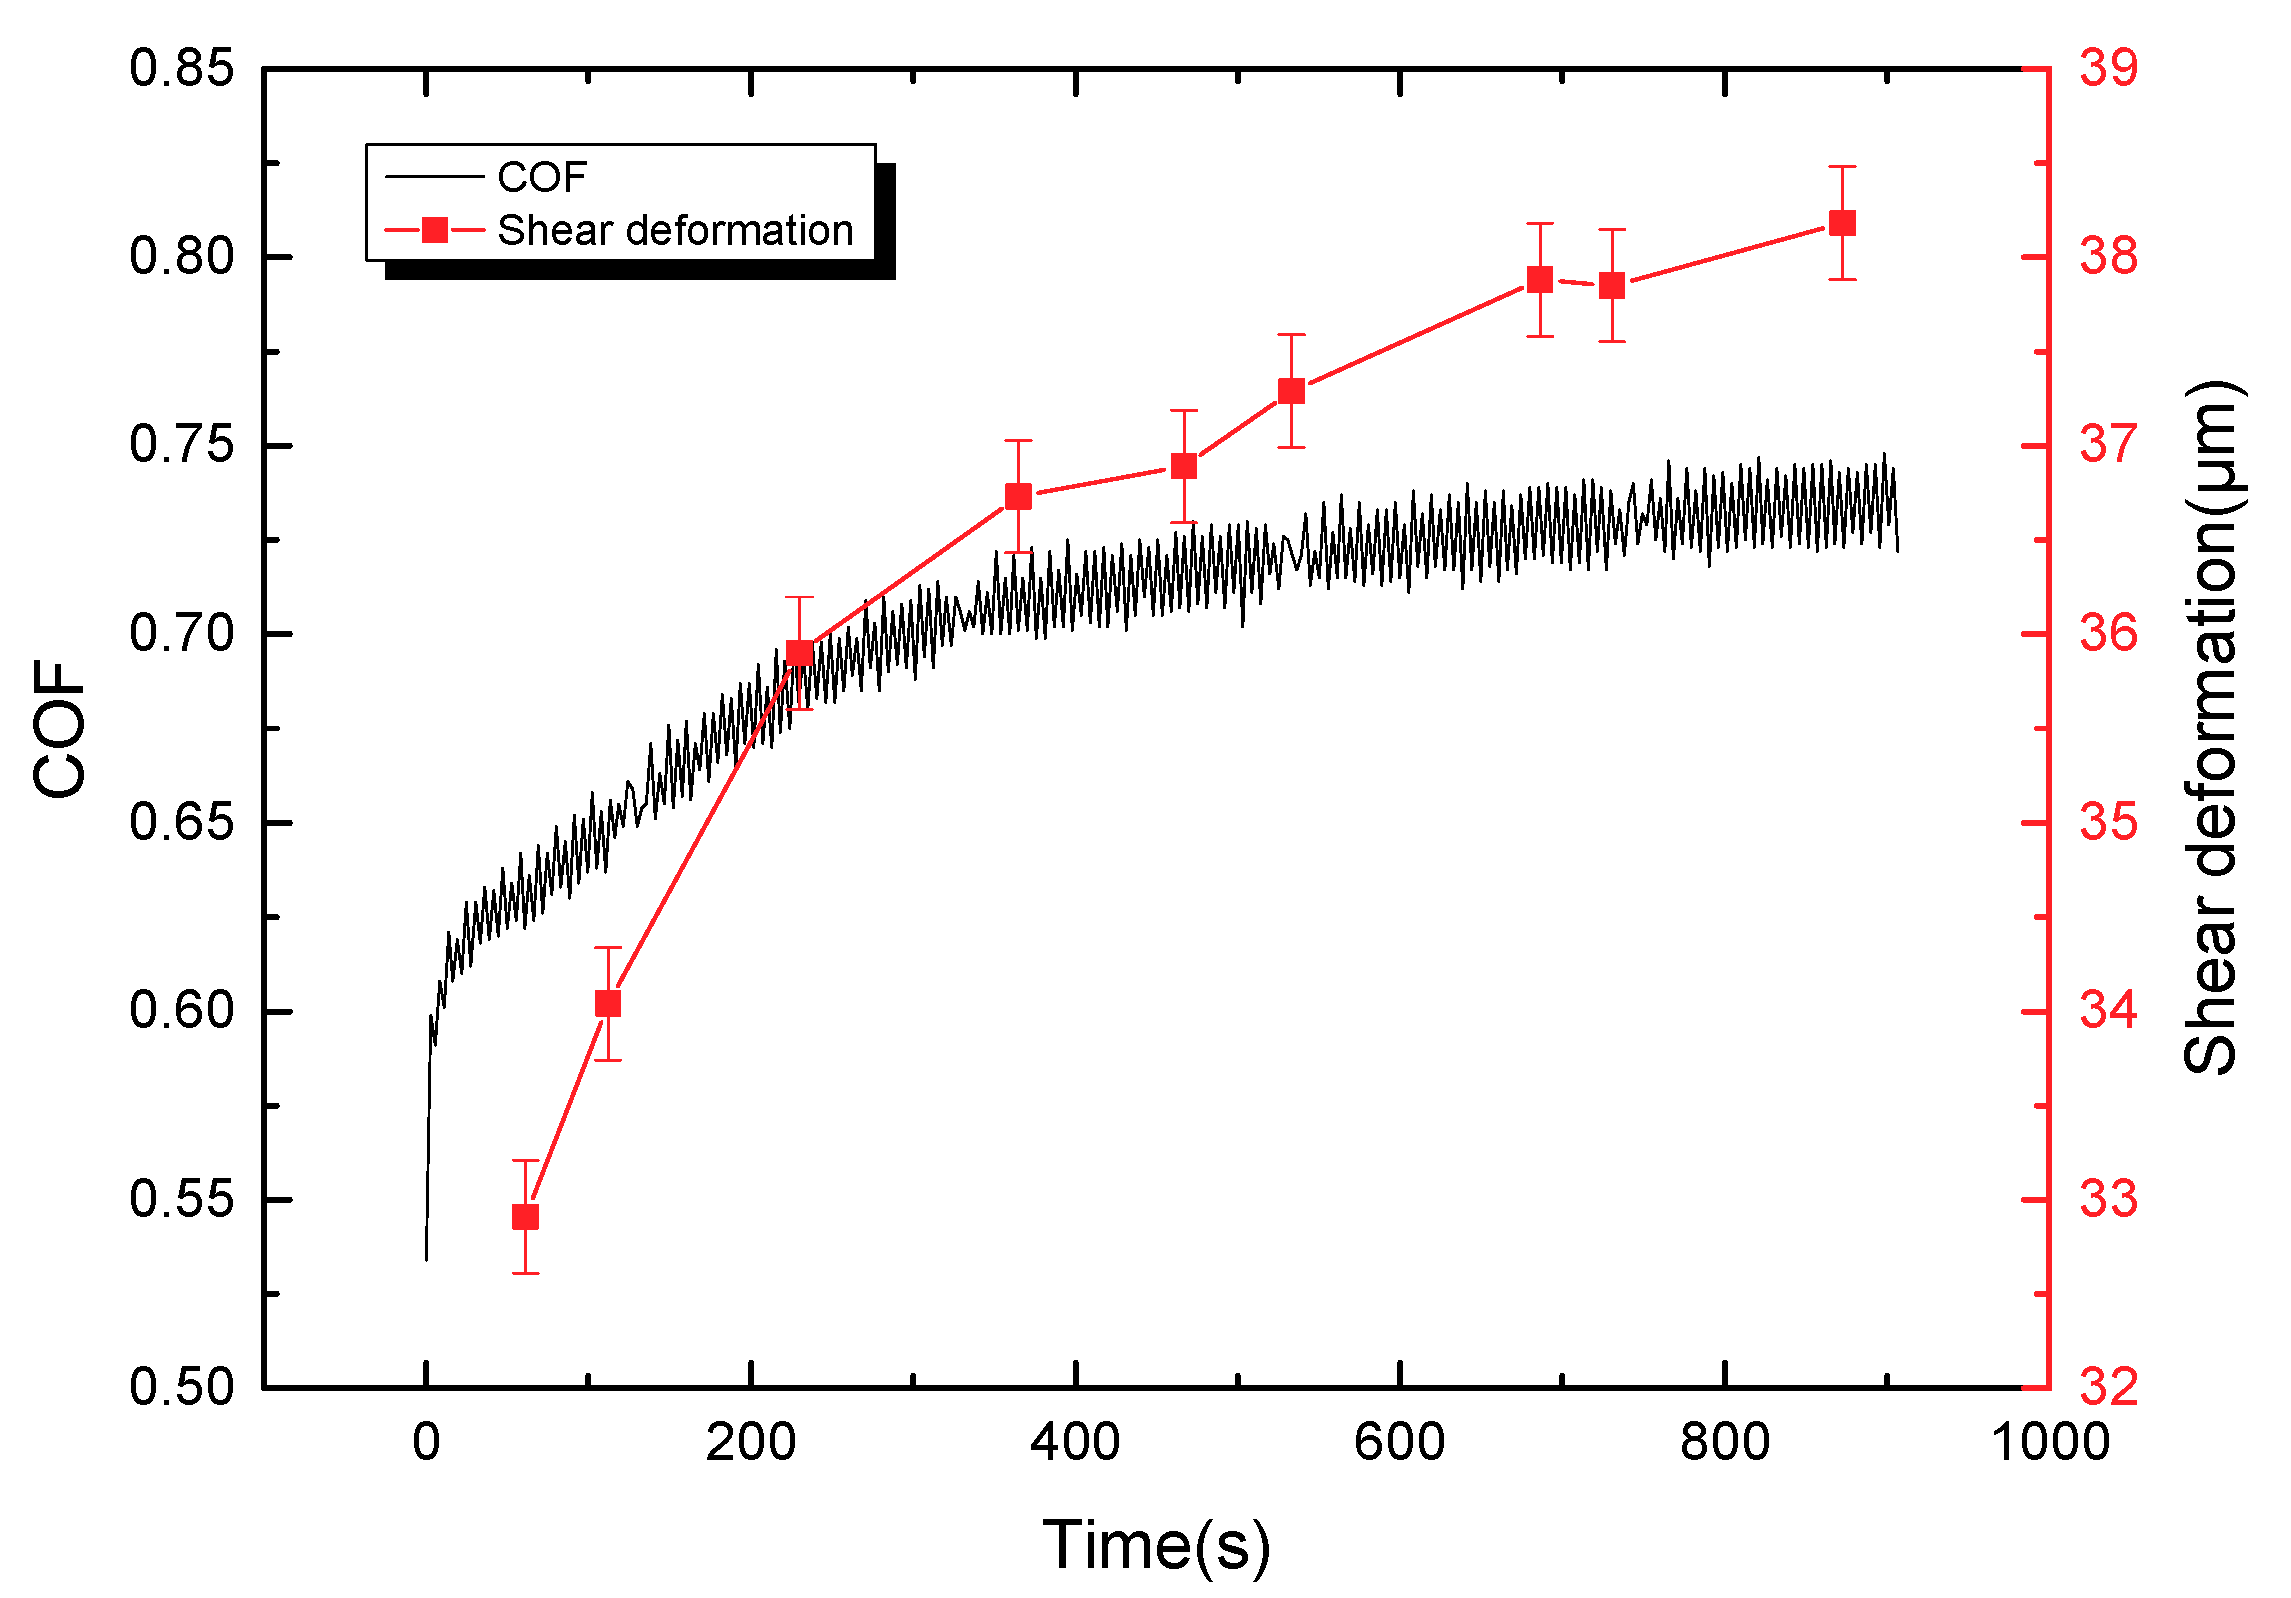
Figure 8 shows that the friction coefficient and shear deformation of lining material with time in the sliding stage of the stroke stage; and the curve of the friction coefficient is similar to that of the shear deformation. The shear deformation of the lining surface increases in the sliding process, which causes the separation between polymer chains and fillers. The entanglement among polymer chains was broken, and aggregates are decomposed. The phenomena can damage the network structure of friction lining and contribute to the rapid decrease of storage modulus [
19,
20]. Moreover, the destroyed internal network structure can improve the movement of fillers and polymer chains, which can increase the internal friction force and release much more energy [
19,
21], leading to the increase of the loss modulus. Furthermore, based on Moore’s adhesion friction theory, the viscoelastic property of lining can be divided into adhesive and hysteresis friction coefficients. For hysteresis friction coefficient, the following Equation (1) is used:
where:
μh is the hysteresis friction coefficient,
Kh is a constant,
p is the contact positive pressure,
E″ is the loss modulus and
E’ is the storage modulus.
Following Equation (2) was used for calculating adhesive friction coefficient:
where:
μa is the adhesive friction coefficient,
Ka is a constant and Exponent
r = 0.2.
With the increase of surface shear deformation of the friction lining, the storage modulus decreases, and the loss modulus increases. The hysteresis and adhesive friction coefficients, therefore, increase with the viscoelastic property of the friction lining. Overall, the friction coefficient of friction lining increases with the shear deformation in the reciprocating frictional process.
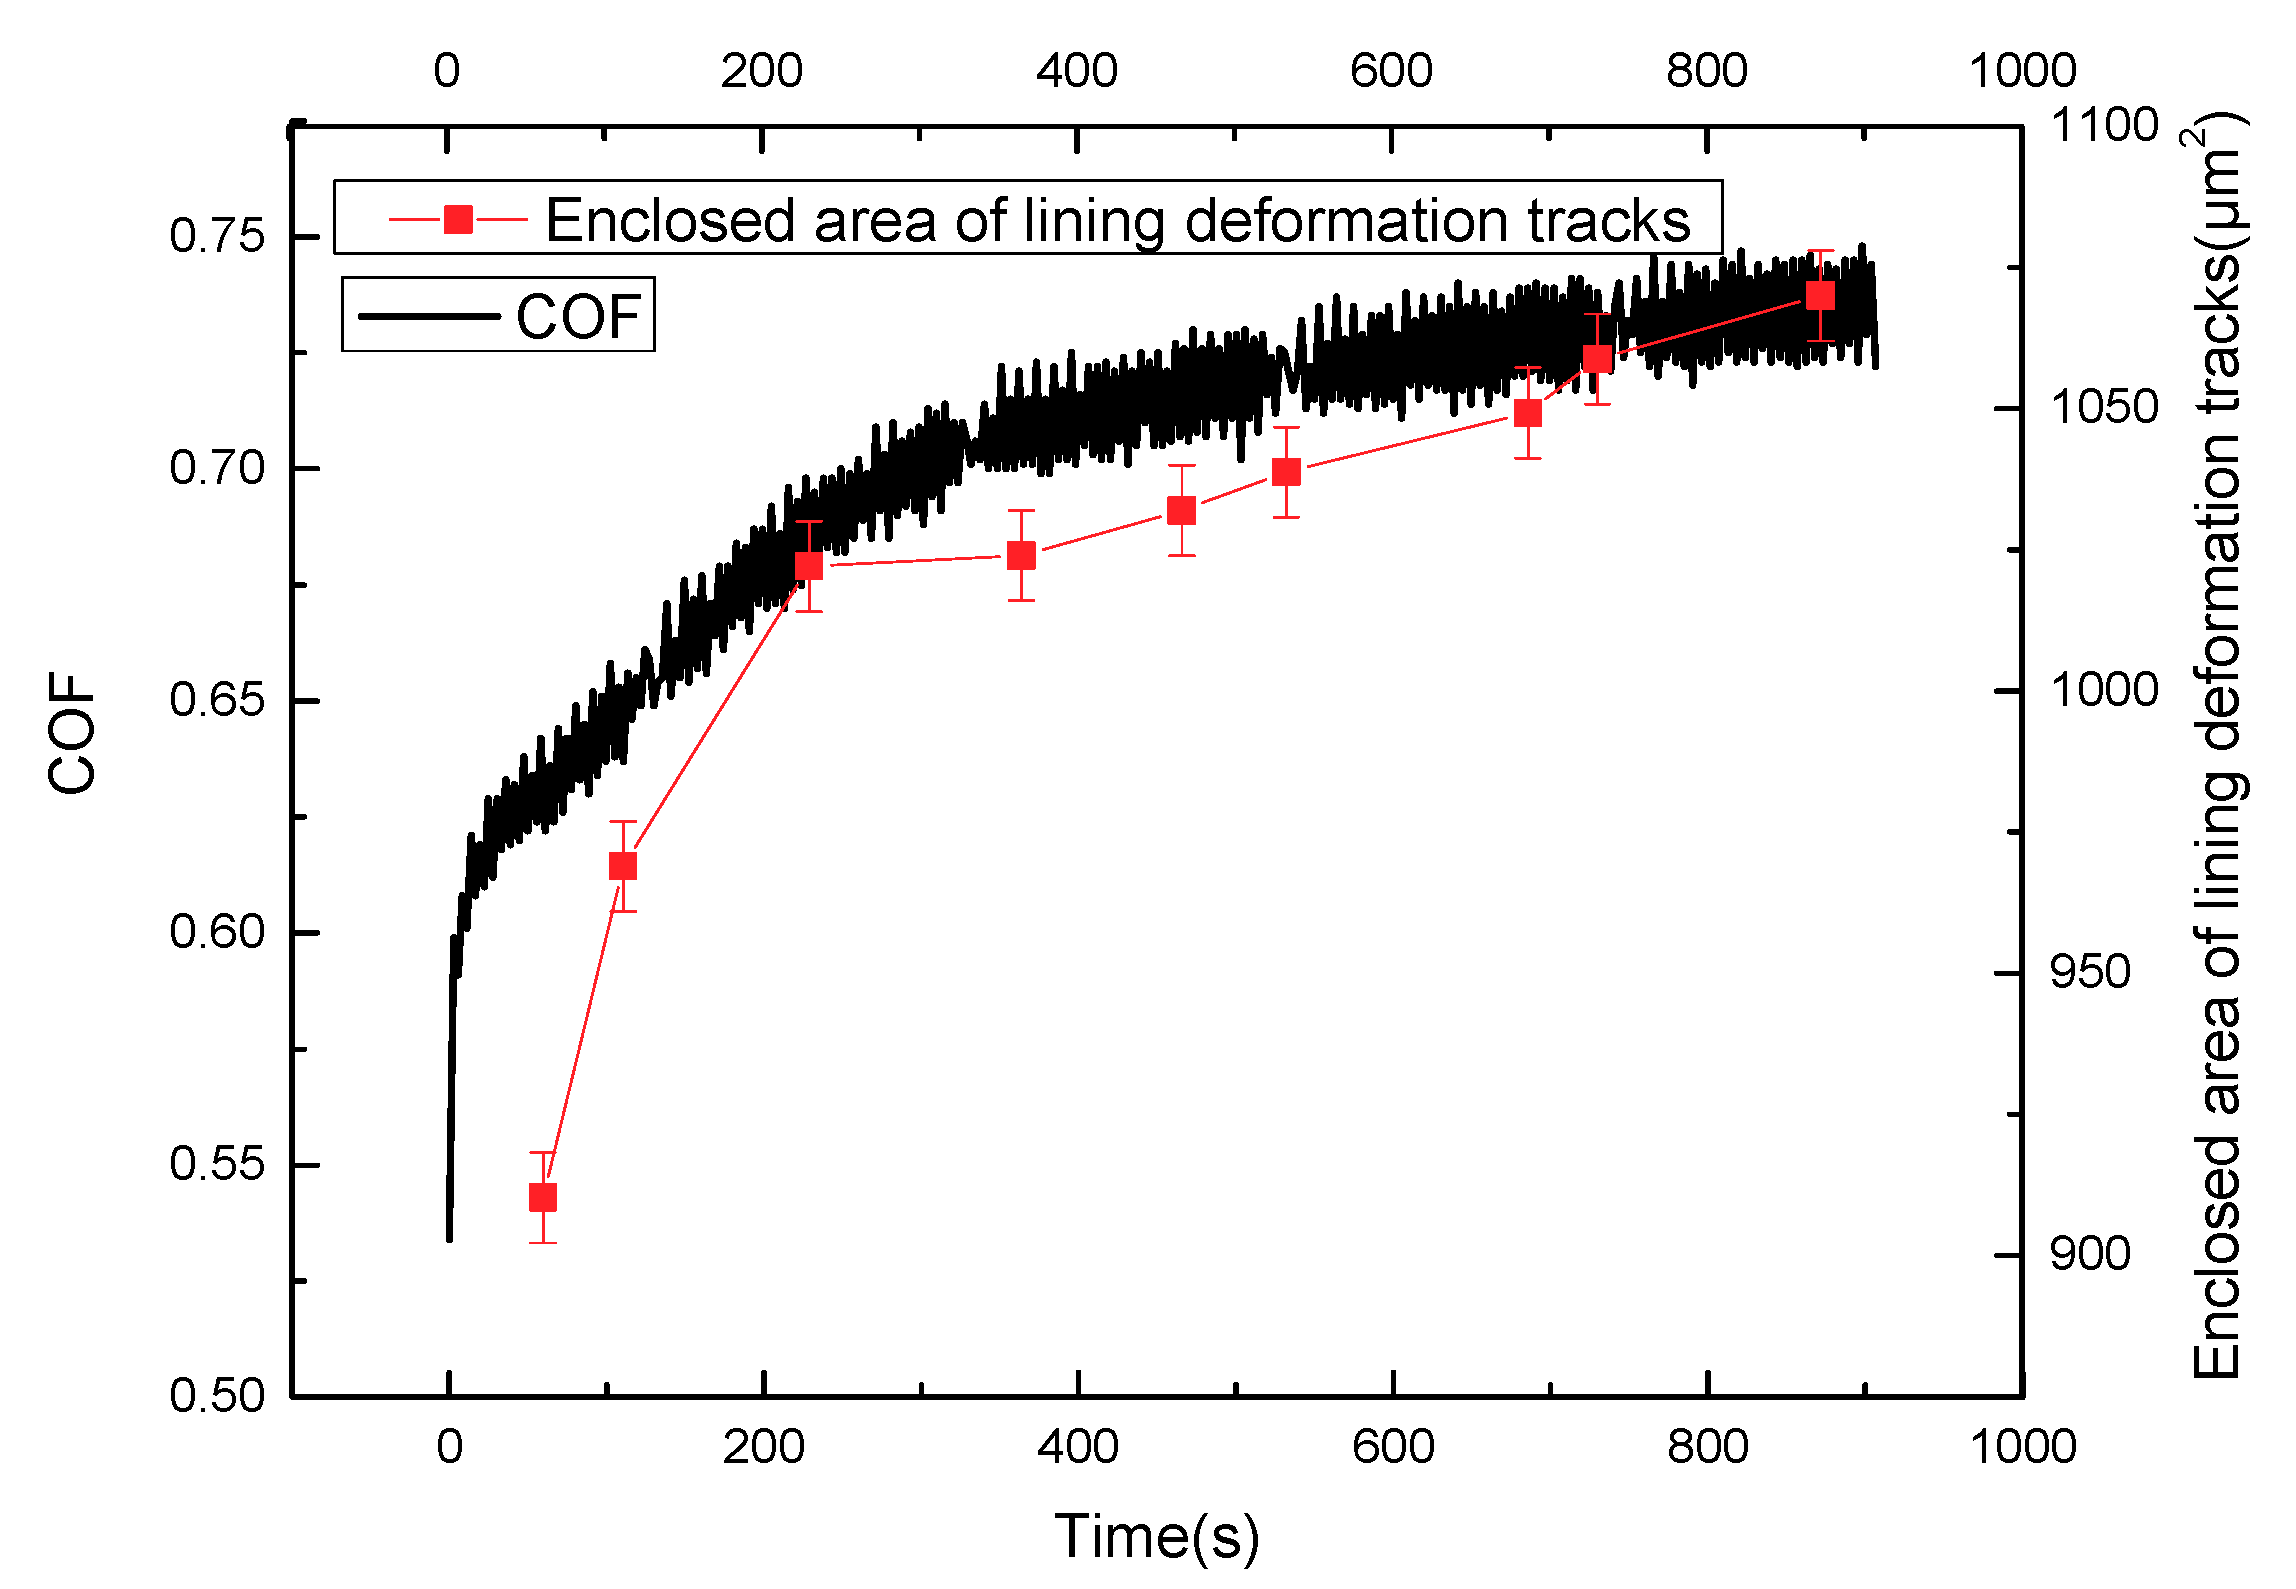
Figure 9 shows that the friction coefficient and enclosed area of the deformation tracks vary with time in the sliding stage of the stroke stage; and the curve of the friction coefficient is similar to that of the enclosed area of the deformation tracks. Moreover, the repeated cyclic deformation of the lining surface occurs in the sliding process, which leads to the relative movement among fillers and polymer chains. The movements can generate internal friction force in the network structure, hindering the deformation of the lining surface and, furthermore, generating horizontal force (hysteresis friction force) on the micro bulges of the lining contact interface to hinder the slip of circular column. The work of deformation in the process of deformation is greater than that released in the process of recovery. A part of the energy stored in the lining material is converted into hysteresis energy. The value of energy loss can be marked by the enclosed area of marked point
l of the deformation tracks in a single period (shown in
Figure 4).
With the increase of the enclosed area of deformation tracks on the lining surface, the loss modulus increases in the sliding process, leading to the increase of the internal friction force of material. This phenomenon can cause the hysteresis friction force of micro bulges on the contact interface to hinder the movement of slide. Overall, the friction coefficient of lining material increases with the increasing loss modulus in the reciprocating sliding process.
3.4. Influence from Sliding Speed on the Friction Mechanism of Friction Lining
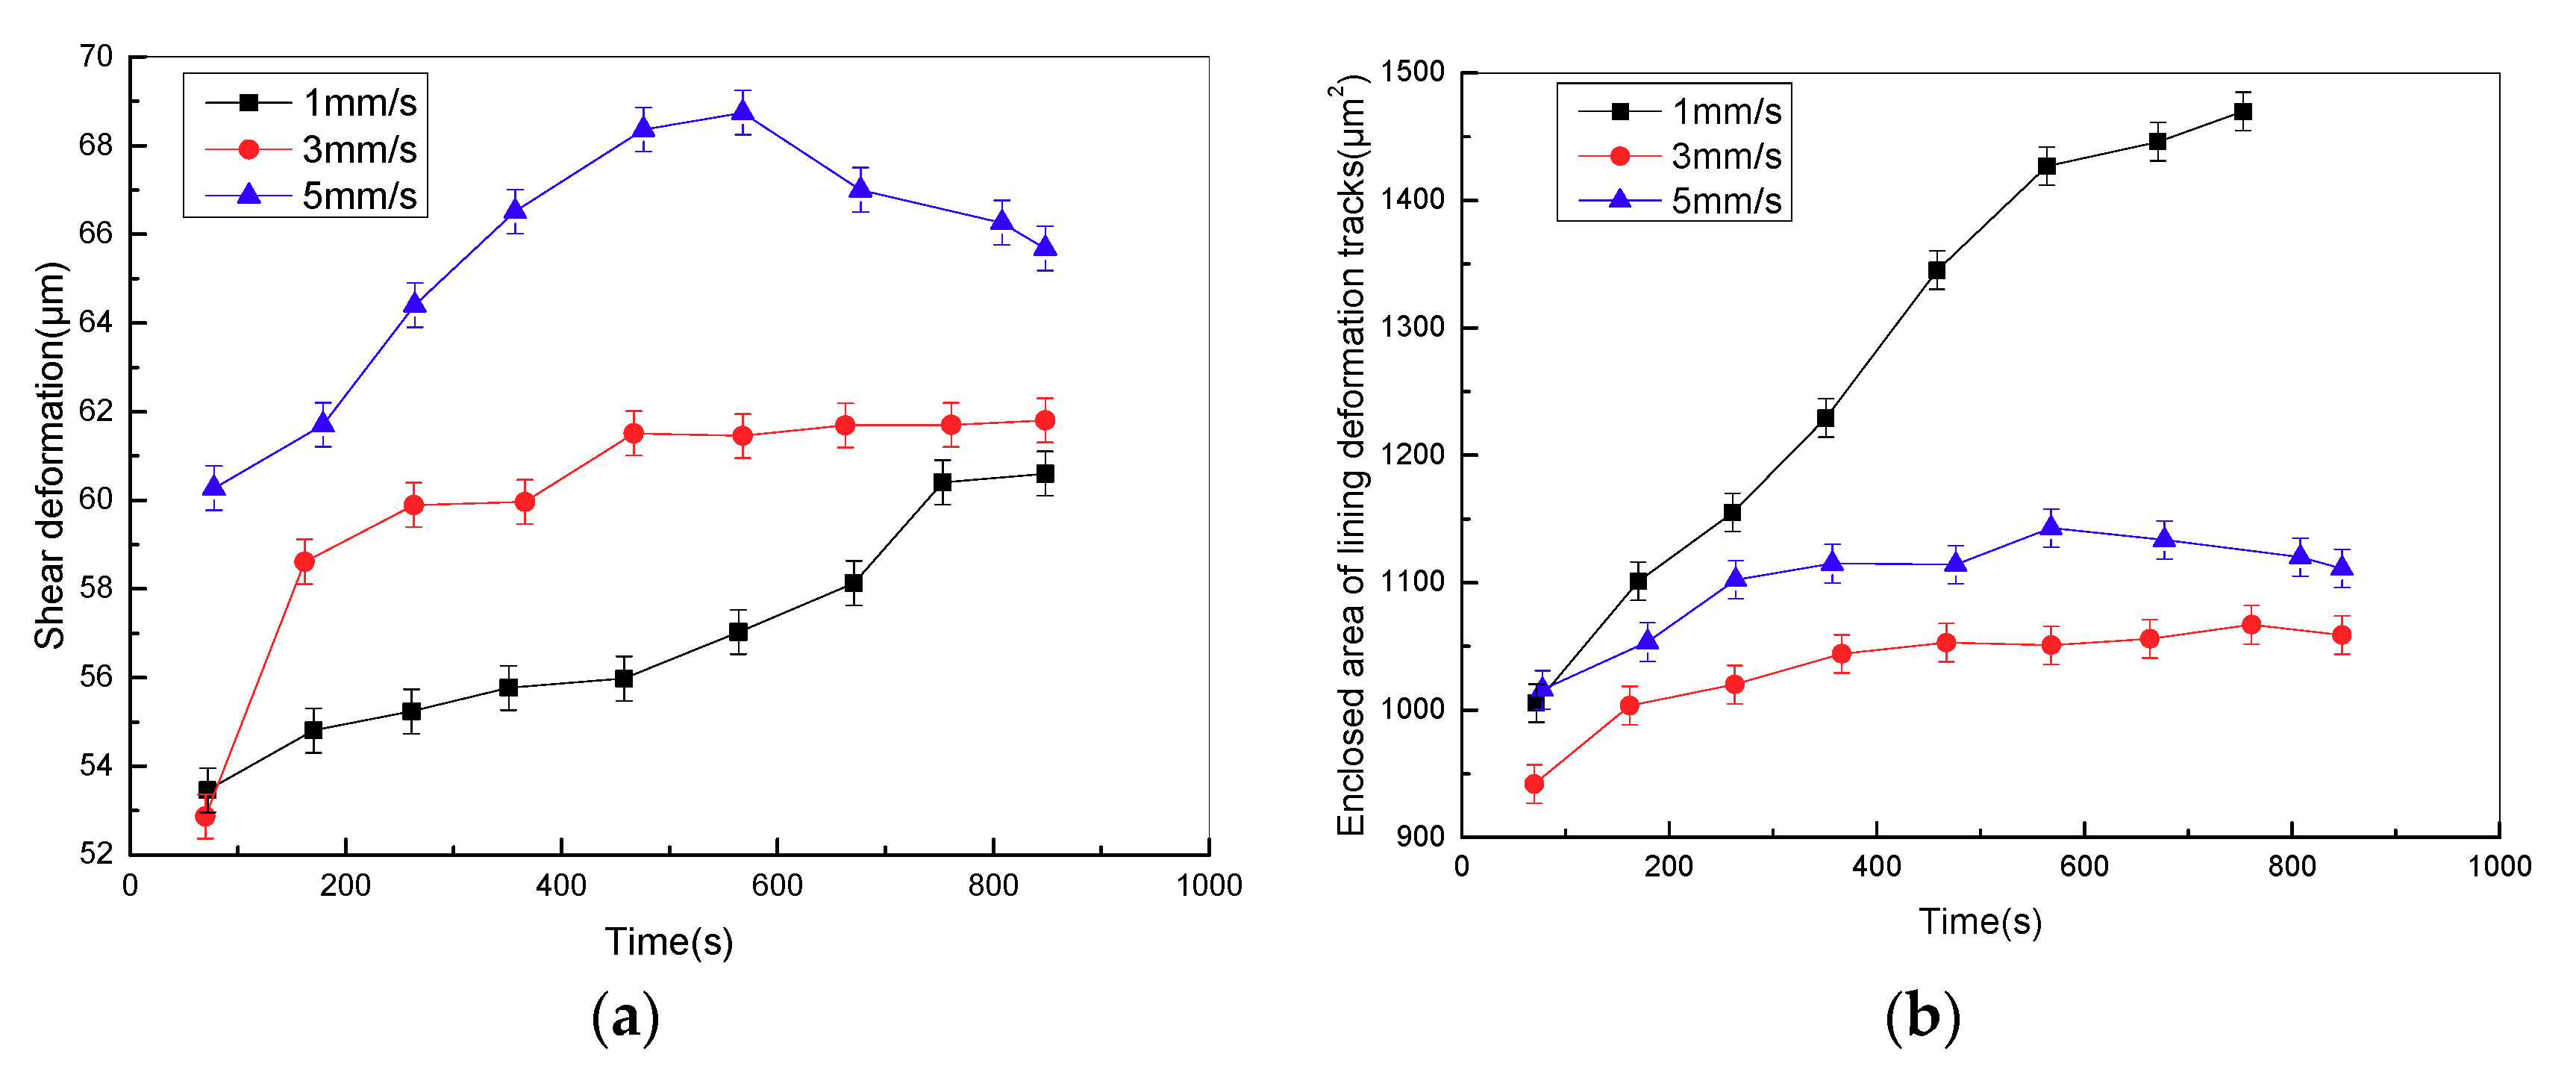
Figure 10a shows the variation curve of the surface shear deformation of friction lining in the stroke stage with various sliding speeds at the contact pressure of 2 MPa. Surface shear deformation of friction lining increases with the increase of sliding speeds. Then the storage modulus decreases, and the loss modulus increases as the amount of surface shear deformation increases. Furthermore, with the increase of sliding speed, the frequency of cyclic stress applied on the surface of the friction lining increases. In the low-frequency zone, the moving distance of fillers and polymer chains in the network structure increases at the same time as the frequency increases, which means that the loss energy overcoming internal friction resistance increases, and the loss modulus of lining material increases [
19]. The adhesive friction coefficient increases with the loss modulus based on Equation (2), as both frequency and strain can lead to the increase in the loss modulus of friction lining. In addition, the enclosed area of the lining surface deformation tracks firstly decreases, and then increases with the sliding speeds (shown in
Figure 10b). This ultimately contributes to the hysteresis energy loss of friction lining presenting a trend that first decreases and then increases, and hysteresis friction presents the same variety trend. Consequently, the friction mechanism of friction lining mainly includes adhesive friction in the low-speed zone; and the friction mechanism of friction lining is adhesive and hysteresis frictions occur in the high-speed zone.
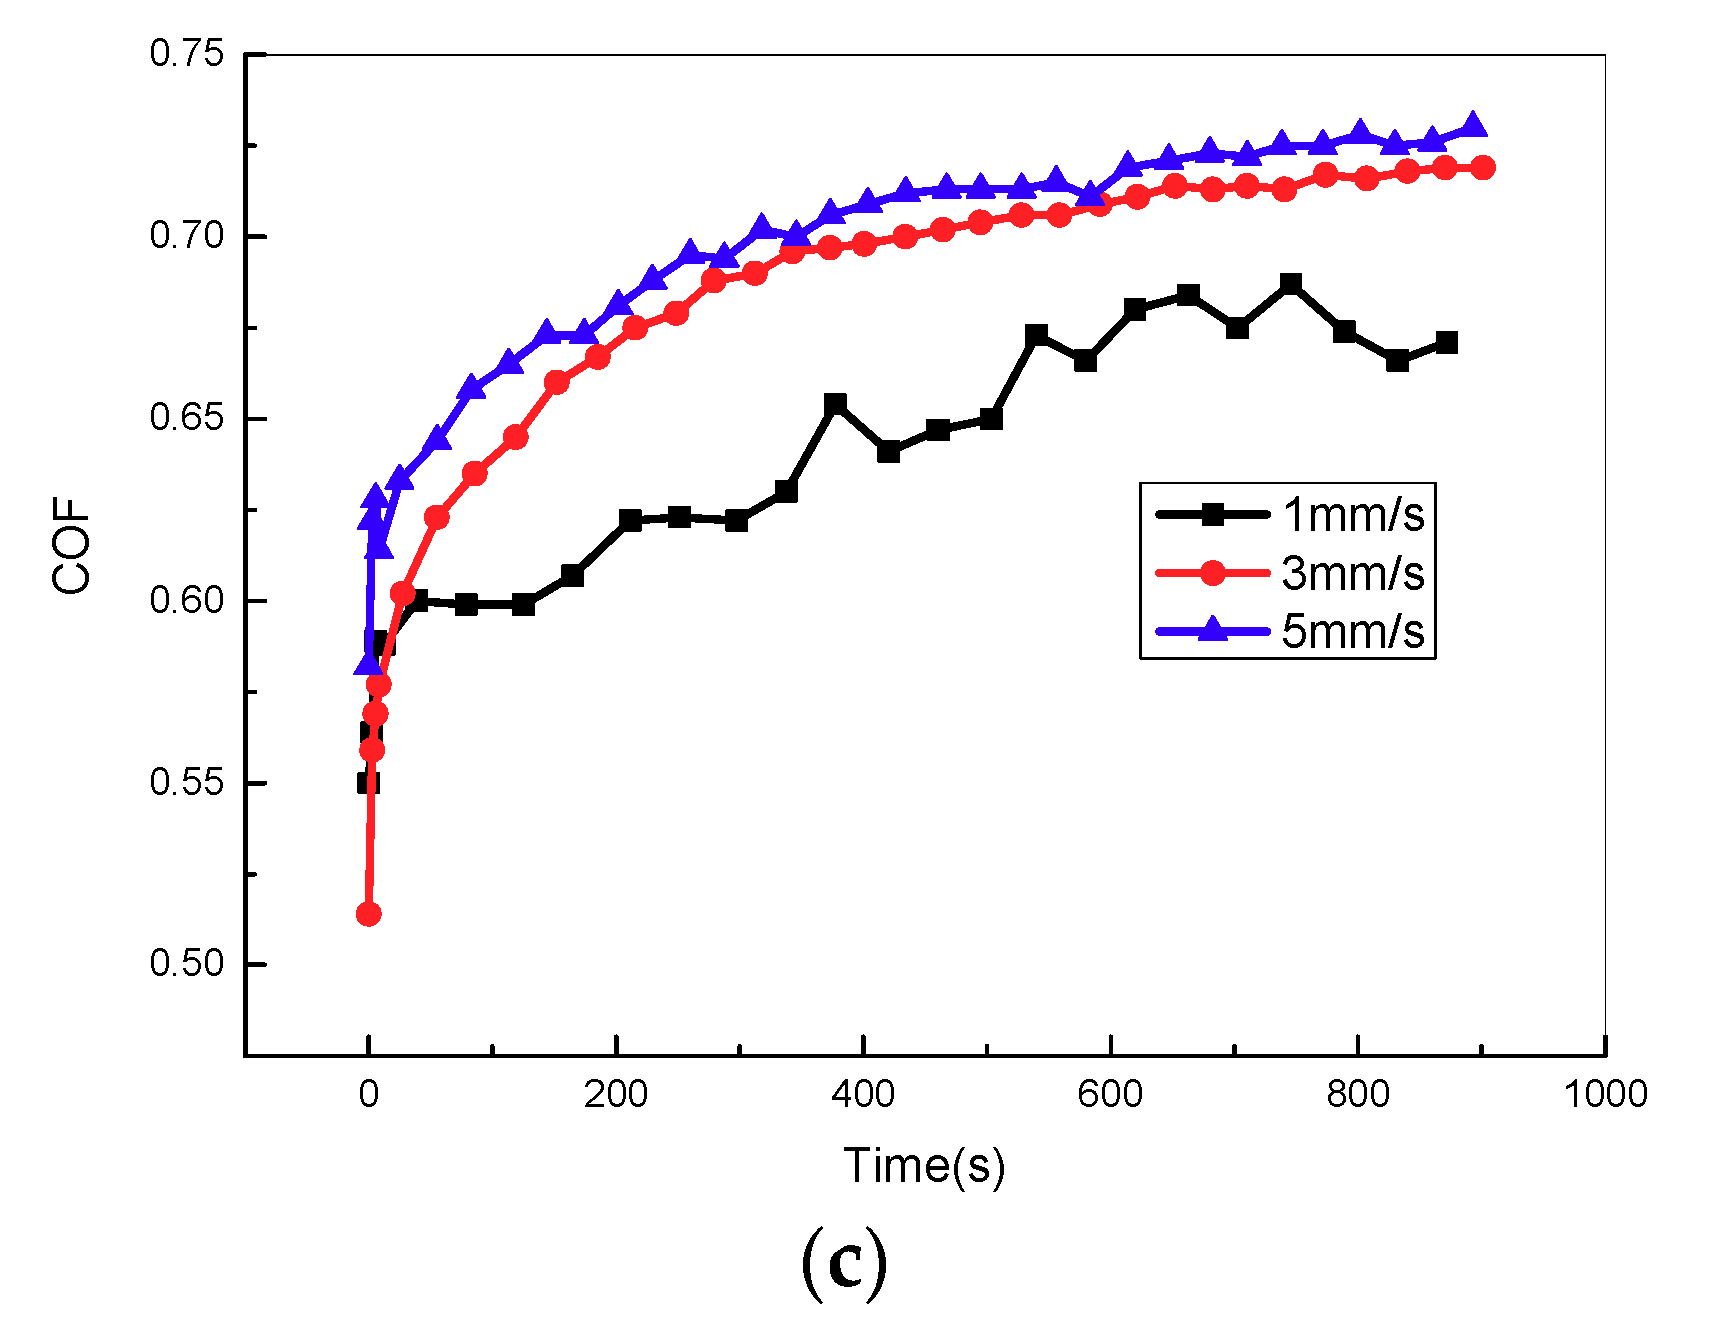
Figure 10c shows the variation curve of the friction coefficient in the stroke stage with different sliding speeds at the contact pressure of 2 MPa. The friction coefficient increases with sliding speeds. In the low sliding speed zone, adhesive friction coefficient increases with the loss modulus based on Equation (2), as both frequency and strain can lead to the increase in the loss modulus of friction lining. In the high sliding speed zone, the storage modulus of friction lining relies more on strain than frequency under constant pressure, thus the increasing strain leads to the increase in hysteresis friction coefficient. Both frequency and strain can lead to the increase of the loss modulus, which contributes to the increase in adhesive friction coefficient. Therefore, the friction coefficient presents an increasing trend with the sliding speeds.
3.5. Influence from Contact Pressure on the Frictional Mechanism of Friction Lining
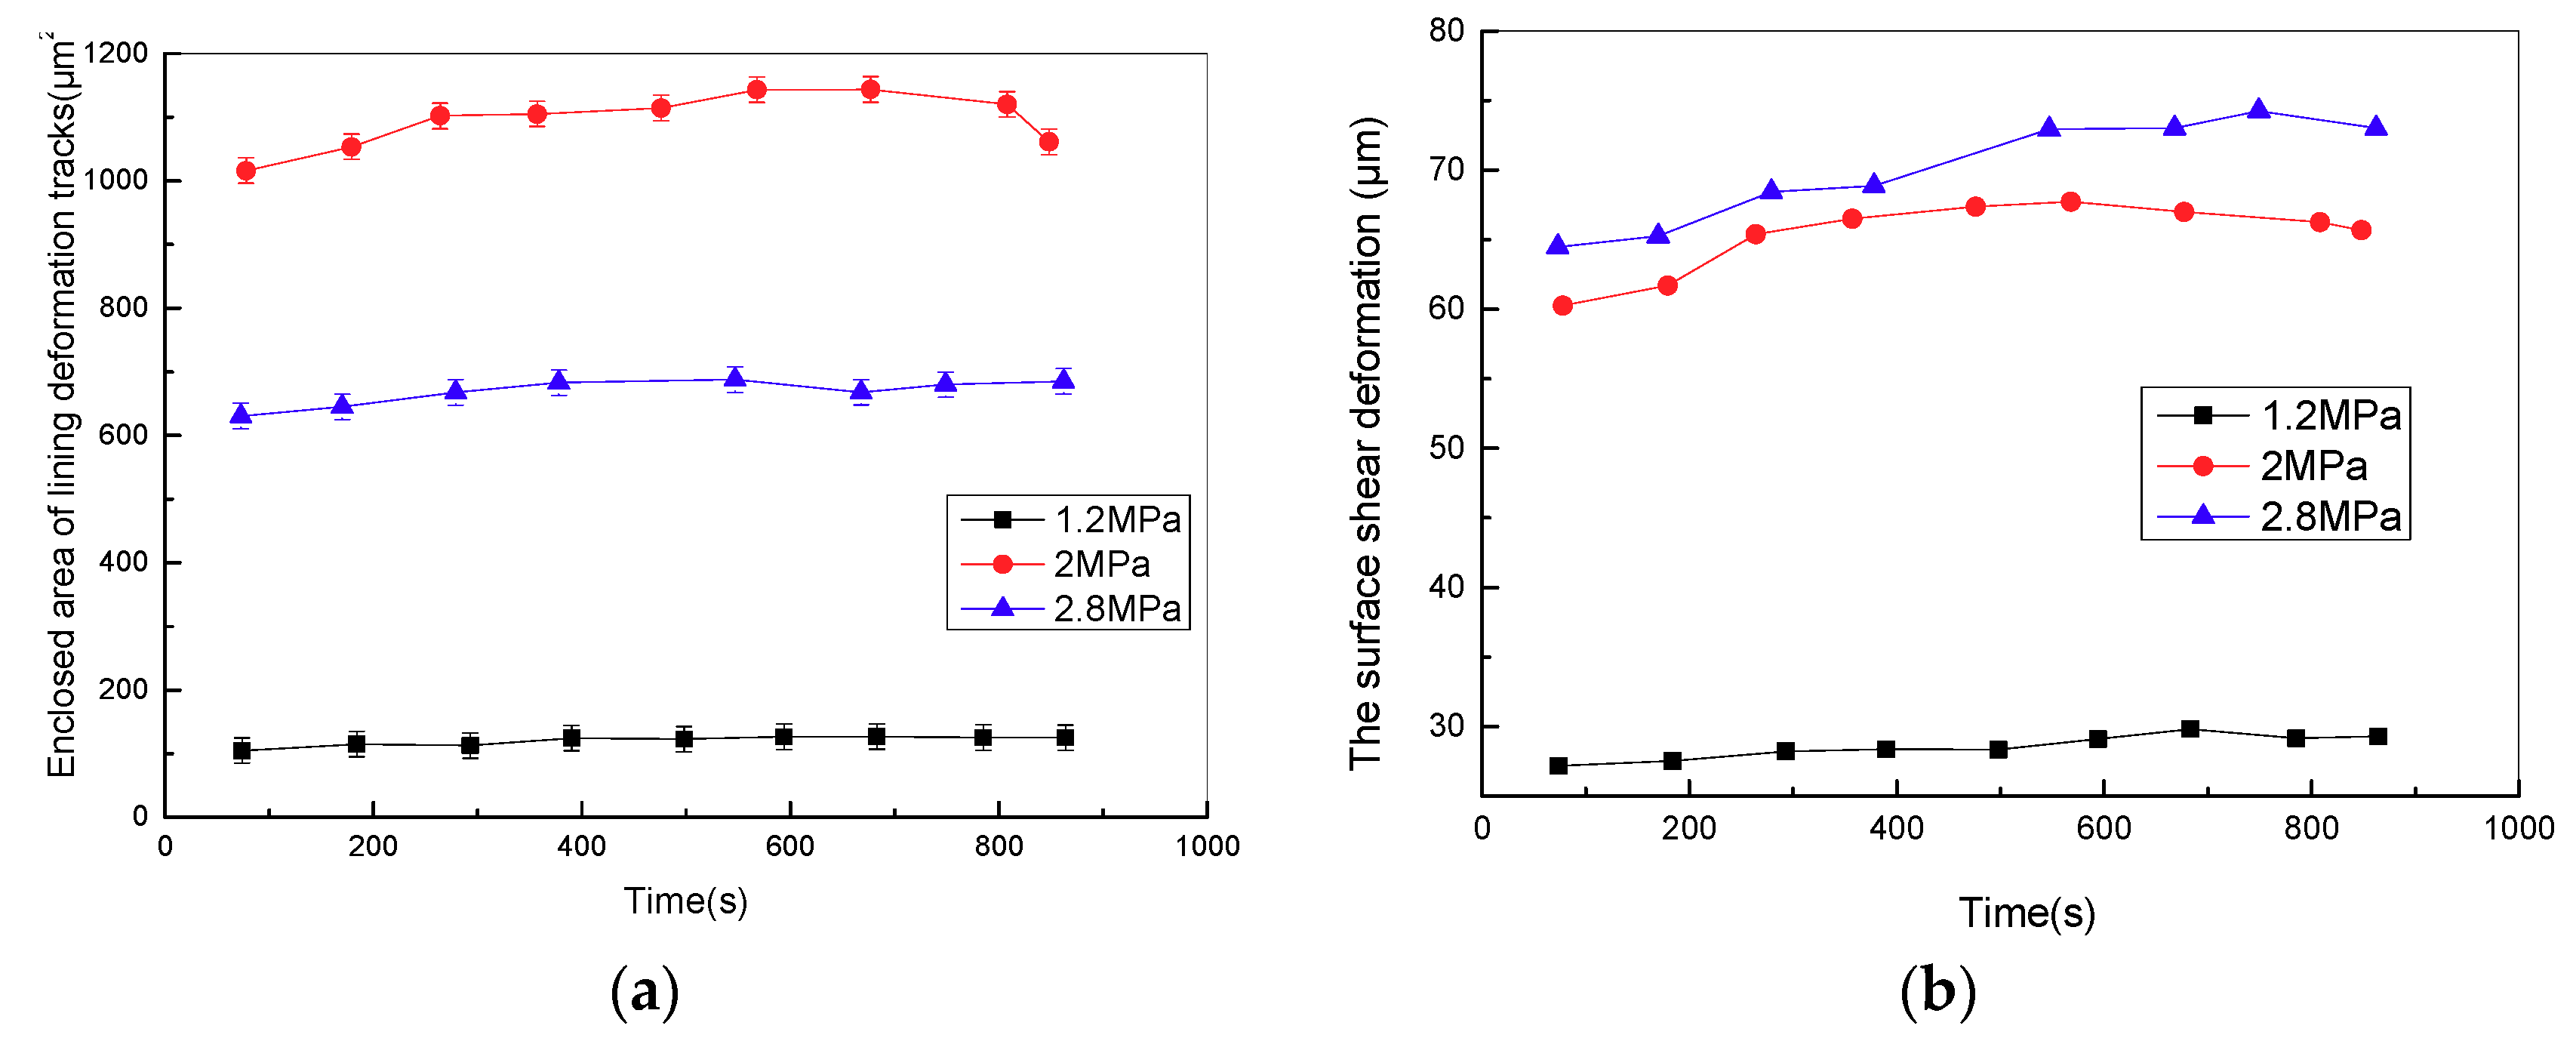
Figure 11 shows the variation curve of the enclosed area of surface deformation tracks in the sliding stage of the stroke period with various pressures at the sliding speed of 5 mm/s. It is evident that the enclosed area of surface deformation tracks firstly increases and then decreases, which means that the hysteresis energy loss of friction lining increases first, and then decreases with pressure, and the hysteresis friction coefficient presents a similar trend to the hysteresis energy loss. Moreover, the surface shear deformation of lining in the stroke stage increases with contact pressure (shown in
Figure 11b). This phenomenon results in the decrease of the storage modulus and the increase of the loss modulus of friction lining. Therefore, Equation (2) reveals that adhesive friction coefficient increases with the viscoelastic property of friction lining. Overall, in the low-pressure zone (1.2–2 MPa), the friction mechanism of friction lining mainly includes hysteresis friction, whereas in the high-pressure zone (2–2.8 MPa), the friction mechanism of friction lining mainly includes adhesive friction.
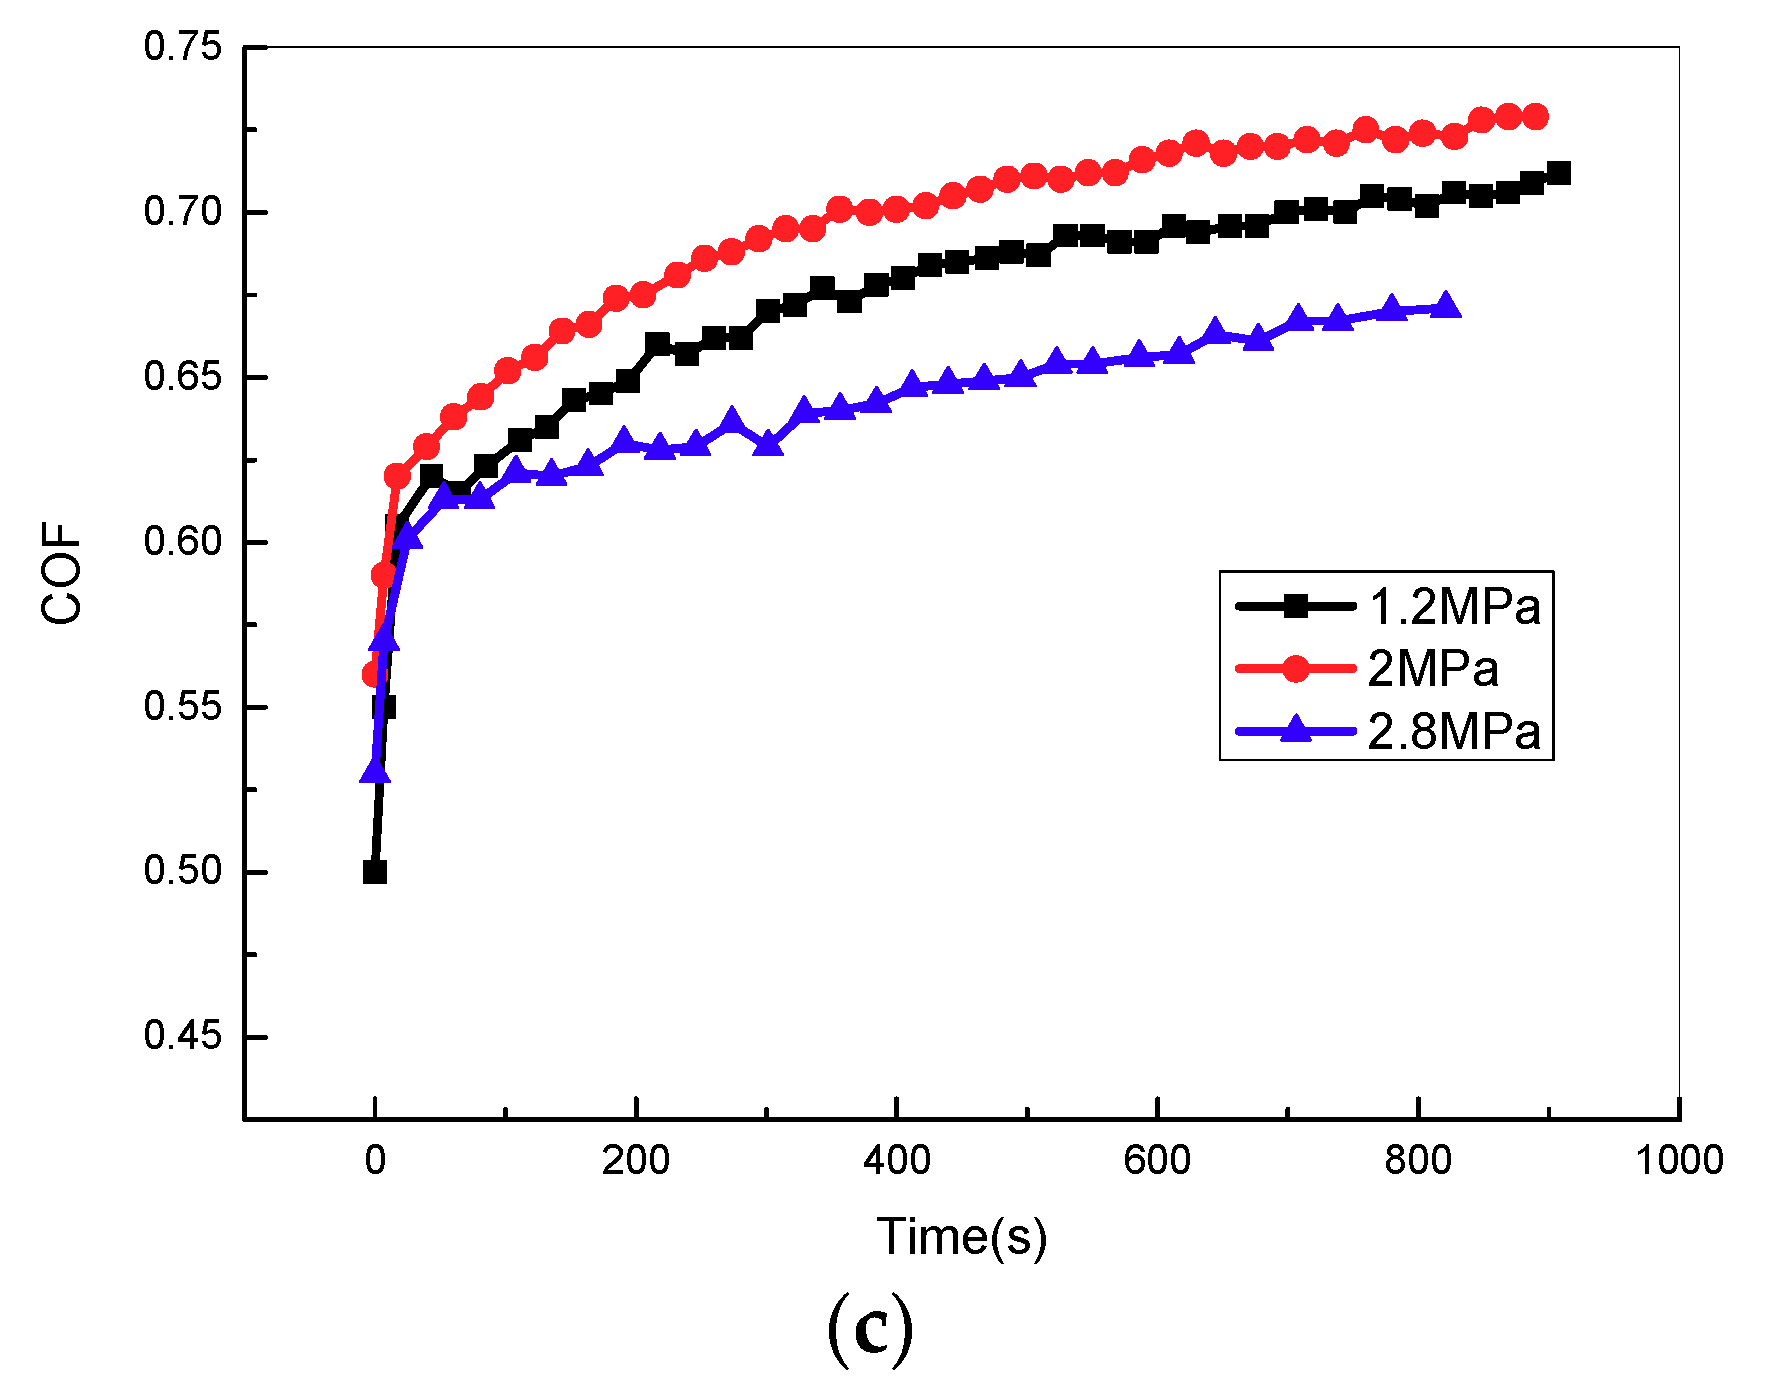
Figure 11c illustrates the variation curve of the friction coefficient in the stroke stage with various pressures at the sliding speed of 5 mm/s. The friction coefficient first increases, and then decreases with the increase of contact pressure. Hysteresis friction is the main friction mechanism of friction lining in the low-pressure zone. Equation (1) shows that the hysteresis friction coefficient of friction lining increases with contact pressure, leading to the increase of the friction coefficient. In the high-pressure zone, the main friction mechanism of friction lining is adhesive friction. Equation (2) shows that the adhesive friction coefficient of friction lining decreases with the increase of contact pressure, leading to the decrease of the friction coefficient. Overall, the friction coefficient increases first and then decreases with the increase of the contact pressure.
