Article

Use of the Wilshire Equations to Correlate and Extrapolate Creep Data of Inconel 617 and Nimonic 105

1
National Energy Technology Laboratory, 626 Cochrans Mill Road, Pittsburgh, PA 15236, USA
2
Mechanical Engineering Department, University of Texas Rio Grande Valley, 1201 West University Drive, Edinburg, TX 78539, USA
3
KeyLogic Systems, Inc., 3168 Collins Ferry Road, Morgantown, WV 26505, USA
*
Author to whom correspondence should be addressed.
Materials 2018, 11(12), 2534; https://doi.org/10.3390/ma11122534
Submission received: 16 November 2018 / Revised: 6 December 2018 / Accepted: 11 December 2018 / Published: 13 December 2018

Abstract

:
Advanced power plant alloys must endure high temperatures and pressures for durations at which creep data are often not available, necessitating the extrapolation of creep life. A recently developed creep life extrapolation method is the Wilshire equations, with which multiple approaches can be used to increase the goodness of fit of available experimental data and improve the confidence level of calculating long-term creep strength at times well beyond the available experimental data. In this article, the Wilshire equation is used to extrapolate the creep life of Inconel 617 and Nimonic 105 to 100,000 h. The use of (a) different methods to determine creep activation energy, (b) region splitting, (c) heat- and processing-specific tensile strength data, and (d) short-duration test data were investigated to determine their effects on correlation and extrapolation. For Inconel 617, using the activation energy of lattice self-diffusion as Q C * resulted in a poor fit with the experimental data. Additionally, the error of calculated rupture times worsened when splitting regions. For Nimonic 105, the error was reduced when heat- and processing-specific tensile strengths were used. Extrapolating Inconel 617 creep strength to 100,000 h life gave conservative results when compared to values calculated by the European Creep Collaborative Committee.

1. Introduction

Innovations in power generation require materials that are capable of withstanding high temperatures and stresses for at least 100,000 h of operation time. The high temperatures and pressures found in advanced power plants can induce creep failure in alloys. Consequently, alloys must be tested so that creep failures are avoided during service. However, data regarding creep of new advanced power plant alloys are often not available at times relevant to the required design life. In particular, nickel-based superalloys—promising alloys for ultra-supercritical power plant applications—have no creep rupture data at 100,000 h in the literature. The longest creep rupture test of a nickel-based superalloy known to the authors—an Inconel 617 specimen last reported at 90,936 h—is ongoing and is the result of a joint effort led by the U.S. Department of Energy and the Ohio Coal Development Office [1,2]. The same effort produced creep rupture data for Inconel 617 to 43,706 h (completed), and Inconel 740 to 30,957 h (completed) and 56,550 h (ongoing). In a similar effort, creep rupture data of Nimonic 105 was generated to 34,955 h [3,4]. Hence, extrapolating the creep life of these alloys is necessary to determine if they are suitable for use.
Various methods have been proposed to extrapolate creep life. The Wilshire equations [5] are a recently-developed extrapolation method that has been used to predict long-term creep behavior of high-temperature, creep-resistant alloys [6]. Different approaches have been used to fit the Wilshire equation to creep rupture data. In this article, the Wilshire equation for time to rupture and the Larson–Miller parameter (LMP) equation are used to correlate and extrapolate the creep life of two nickel-based superalloys, Inconel 617 and Nimonic 105. The Wilshire equation’s goodness of fit and the error of the calculated rupture times resulting from the use of different creep activation energy ( Q C * ) values determined by various methods are compared. This article also investigates the effect of splitting creep rupture data into above- and below-yield stress regions, the effect of heat- and processing-specific tensile strength (TS) values, and examines the ability of the Wilshire equation to predict creep life greater than 10,000 h using data with rupture times less than 10,000 h. Additionally, the calculations of the Wilshire and LMP equations are compared. The paper is constructed as follows: Section 2 gives a brief overview of the Wilshire and LMP equations; Section 3 discusses the data sets and methods used to obtain Q C * , split stress regions, and how Larson–Miller fitting parameters were obtained; Section 4 outlines the calculations and results of the study; and the final section presents conclusions.

2. Wilshire and Larson–Miller Parameter Equations

The classic power law equation, which is a combination of the Arrhenius [7] and Norton [8] equations, is the most established description of the creep of materials. The equation is defined as:
ε ˙ m = A σ n e Q C / R T ,
where ε ˙ m is the minimum creep rate, A is a material parameter, σ is applied stress, n is the stress exponent, QC is the creep activation energy, R is the universal gas constant, and T is absolute temperature. The Monkman–Grant equation [9] is defined as:
ε ˙ m α   t r = C M ,
where tr is the time to rupture, CM is a constant, and α is the slope of log t r vs. log ε ˙ m . This equation can be coupled with Equation (1), with α set equal to 1, to produce the following time-to-rupture-based version of the classic power law equation
t r = C M A σ n e Q C / R T .
However, this equation is unreliable for predicting creep life at temperatures, stresses, and durations at which there are no experimental data available. This is due to the changing and difficult-to-predict stress exponent [10,11], which is a function of stress and temperature. Additionally, creep activation energy is a function of applied stress. Therefore, a creep activation energy that has been calculated in one stress region cannot be extrapolated to another. Many techniques to extrapolate creep life reliably from limited data have been proposed [12,13], including the relatively new Wilshire equation and the well-established Larson–Miller parameter equation.

2.1. Wilshire Equation

In 2007, Wilshire and Battenbough [5] developed a physically-based yet fairly simple method to represent creep life as a function of applied stress and temperature in uniaxial tests. The proposed equations are:
σ σ T S = exp ( k 1 [ t r exp ( Q C * R T ) ] u ) ,
σ σ T S = exp ( k 2 [ ε ˙ m exp ( Q C * R T ) ] v ) . ,
σ σ T S = exp ( k 3 [ t ε exp ( Q C * R T ) ] w ) ,
where σ / σ T S is the ratio of applied stress to ultimate tensile strength, t r is time to rupture, ε ˙ m is minimum creep rate, t ε is time to strain, Q C * is creep activation energy determined at constant σ / σ T S , R is the universal gas constant, T is absolute temperature, and k 1 , u, k 2 , v, k 3 , and w are fitting constants. Heat- and processing-specific tensile strength values may be used if data were collected from specimens of multiple heats. Applied stress can be normalized by yield strength (σYS), but normalization by ultimate tensile strength causes the stress ratio to always lie between zero and one. The boundaries of the Wilshire equations are
t r 0 ,   ε ˙ m   ,   t ε 0   when   σ σ T S 1 , t r , ε ˙ m   0 ,   t ε   when   σ σ T S 0 .

2.2. Larson–Miller Parameter Equation

A common method used to extrapolate creep life is the Larson–Miller parameter equation [14], which predates the Wilshire equation by half a century. The LMP equation is:
LMP = T ( log 10 ( t r ) + C ) ,
where T is absolute temperature, C is a material constant, and t r is time to rupture. The LMP, a function of stress, is often described by the following fitting function.
LMP ( σ ) = B 0 + B 1 log ( σ ) + B 2 log ( σ ) 2 + B 3 log ( σ ) 3 + B m log ( σ ) m .

3. Methods

3.1. Data

The Wilshire and Larson–Miller parameter equations both require the following data from creep rupture tests: temperature, applied stress, and time to rupture. Additionally, the Wilshire equation requires the material’s ultimate tensile strength at each test temperature. Yield strength values are not included in the Wilshire equations, but according to Wilshire and Battenbough [5] can be used to group high- and low-stress data for analysis. Data were obtained from tables or extracted from plots in various publications using Dagra digitization software (version 2.0.12) [15].

3.1.1. Inconel 617

Inconel 617 tensile and yield strength data were obtained and extracted from a conference presentation [16]. The data is composed of multiple datasets and there is noticeable scatter in the plotted data. A trendline of the average tensile strength of the combined datasets was used for the extraction of data. Creep test data were extracted from five sources [1,17,18,19,20], the longest of which extends to 43,706 h. A total of 420 creep rupture data points were extracted; 386 have a rupture time less than 10,000 h and 354 have an applied stress less than yield strength.

3.1.2. Nimonic 105

For Nimonic 105, tensile and yield strength values and creep rupture data were obtained from two technical reports [3,4] and email correspondence with one of their authors [21]. Specimens with the following processing conditions were tested at temperatures from 760 to 816 °C for up to 34,955 h: as-processed (AP), peak-aged (PA), and over-aged (OA). Heat- and processing-specific tensile and yield strength values are available at 760 and 816 °C. Linear interpolation was used to calculate tensile and yield strength values at intermediate temperatures. Of the 33 specimens, eight were aged at 774 °C for one or two years prior to testing. It is not known which of the eight specimens were aged for each timeframe, so tensile and yield strength values for both timeframes were averaged. Tensile and yield strength values at 760 and 816 °C for each heat and processing condition are shown in Table A1 of Appendix A. All data points have an applied stress less than yield strength and 16 data points have a rupture time less than 10,000 h. The overall scatter of the data is low compared to that of Inconel 617.

3.2. Wilshire Equation

Although three versions of the Wilshire equation exist, in this study Equation (4)—the Wilshire equation for time to rupture—is used. Several methods have been used in the literature to determine Q C * . In this work, Q C * was determined using multiple methods.
First, Q C * values were determined using Arrhenius plots. This method is the most well-known, and it is assumed [22] that Wilshire used this method in his papers [4,5,23,24,25,26,27,28,29,30,31]. For this approach, existing creep data is regressed and rupture times at constant stress ratios are calculated. This work uses least squares regression and stress ratios at every tenth value (i.e., σ / σ T S = 0.1, 0.2, 0.3, etc.) with suitable data at each test temperature. Next, an Arrhenius plot of the natural log of time to rupture vs. the inverse absolute temperature is generated. For each stress ratio, a Q C * value is defined as the slope of a line of best fit multiplied by the universal gas constant. An average is then taken of all Q C * values to determine the final Q C * value.
Second, Q C * values were determined by optimizing the correlation of data on a Wilshire plot (ln[tr exp(− Q C * /RT)] vs. ln[−ln(σ/σTS)]), as performed by Whittaker [32,33,34] and Jeffs [35]. When calculating Q C * using an Arrhenius plot, the delta between the stress ratios influences the final average Q C * value (e.g., σ / σ T S   = 0.1, 0.2 and 0.3 compared to σ / σ T S = 0.1, 0.15, 0.2, 0.25, and 0.3). This presents a concern when calculating an average Q C * , since the stress ratios are not mathematically derived, but chosen based on the judgement of the user. Determining Q C * by optimizing the correlation of data on a Wilshire plot eliminates concern over the variance of Q C * at arbitrarily-chosen stress ratios. The technique used to optimize the correlation of data is generally not defined in the literature and may vary between authors. In this work, Q C * values ranging from 1 to 500 kJ/mol were iterated with a step size of 1 kJ/mol to find the best correlation, which was quantified by the coefficient of determination (R2).
Third, in some articles [5,24,25,26,27,28,29,32,36] the reasonableness of the calculated value of Q C * is assessed by comparing it to an experimentally-measured or theoretically-calculated activation energy of lattice self-diffusion. If a value for the activation energy of lattice self-diffusion is known, it may be expedient to use this value as Q C * rather than calculate a value from the experimental data.
After Q C * has been determined, the u and k1 fitting constants are respectively defined as the slope and exponential of the y-intercept of a best fit line on a Wilshire plot. Multiple linear regions may be visible on this plot, which would suggest that the data be separated into regions to improve the goodness of fit of the Wilshire equation. Gray and Whittaker [37] point out that Wilshire split regions using two different methods. Regions were consistently split where σ was equal to σYS, but in one case, Q C * and new fitting constants were recalculated for each region [33], while in another case, the original Q C * value was used and only the fitting constants were recalculated for each region [4]. The latter case is known to under-predict creep life [38], and the former case, which more accurately describes the underlying physical processes [37,39,40], was used by Whittaker and Wilshire to extrapolate the creep life of Grade 22, 23, and 24 steels [39]. In this study, both region-splitting techniques are used. Evans proposed a method to handle data from multiple batches [41], but this method requires a more complicated analysis that is outside the scope of this study, so it was not utilized.

3.3. Larson–Miller Parameter Equation

In the Larson–Miller parameter equation, the material constant C is often set to 20 [12]. However, C can be calculated if desired. The method described by Zhu et al. [42] was used to calculate C in this work. The accuracy of Equation (8), the LMP fitting function, increases with the number of terms that are used. For this study, four terms were deemed to be sufficient so the parameters B0, B1, B2 and B3 were obtained. With this information, tr can be estimated for any given combination of temperature and stress.
Following the method detailed by Zhu et al. [42], the matrix laboratory software (MATLAB, version 2018b) surface fitting tool was used to determine the LMP equation constants. The Larson–Miller parameter equation was arranged as:
z = B 0 + B 1 y + B 2 y 2 + B 3 y 3 x C ,
where
z = log ( t r ) ,     x = T ,     y = log ( σ ) .

4. Results and Discussion

4.1. Investigation of Multiple Methods to Determine Q C * , Region-Splitting, the Use of Heat- and Processing-Specific Tensile Strength Values, and the Use of Short-Term Creep Rupture Data to Extrapolate Creep Life

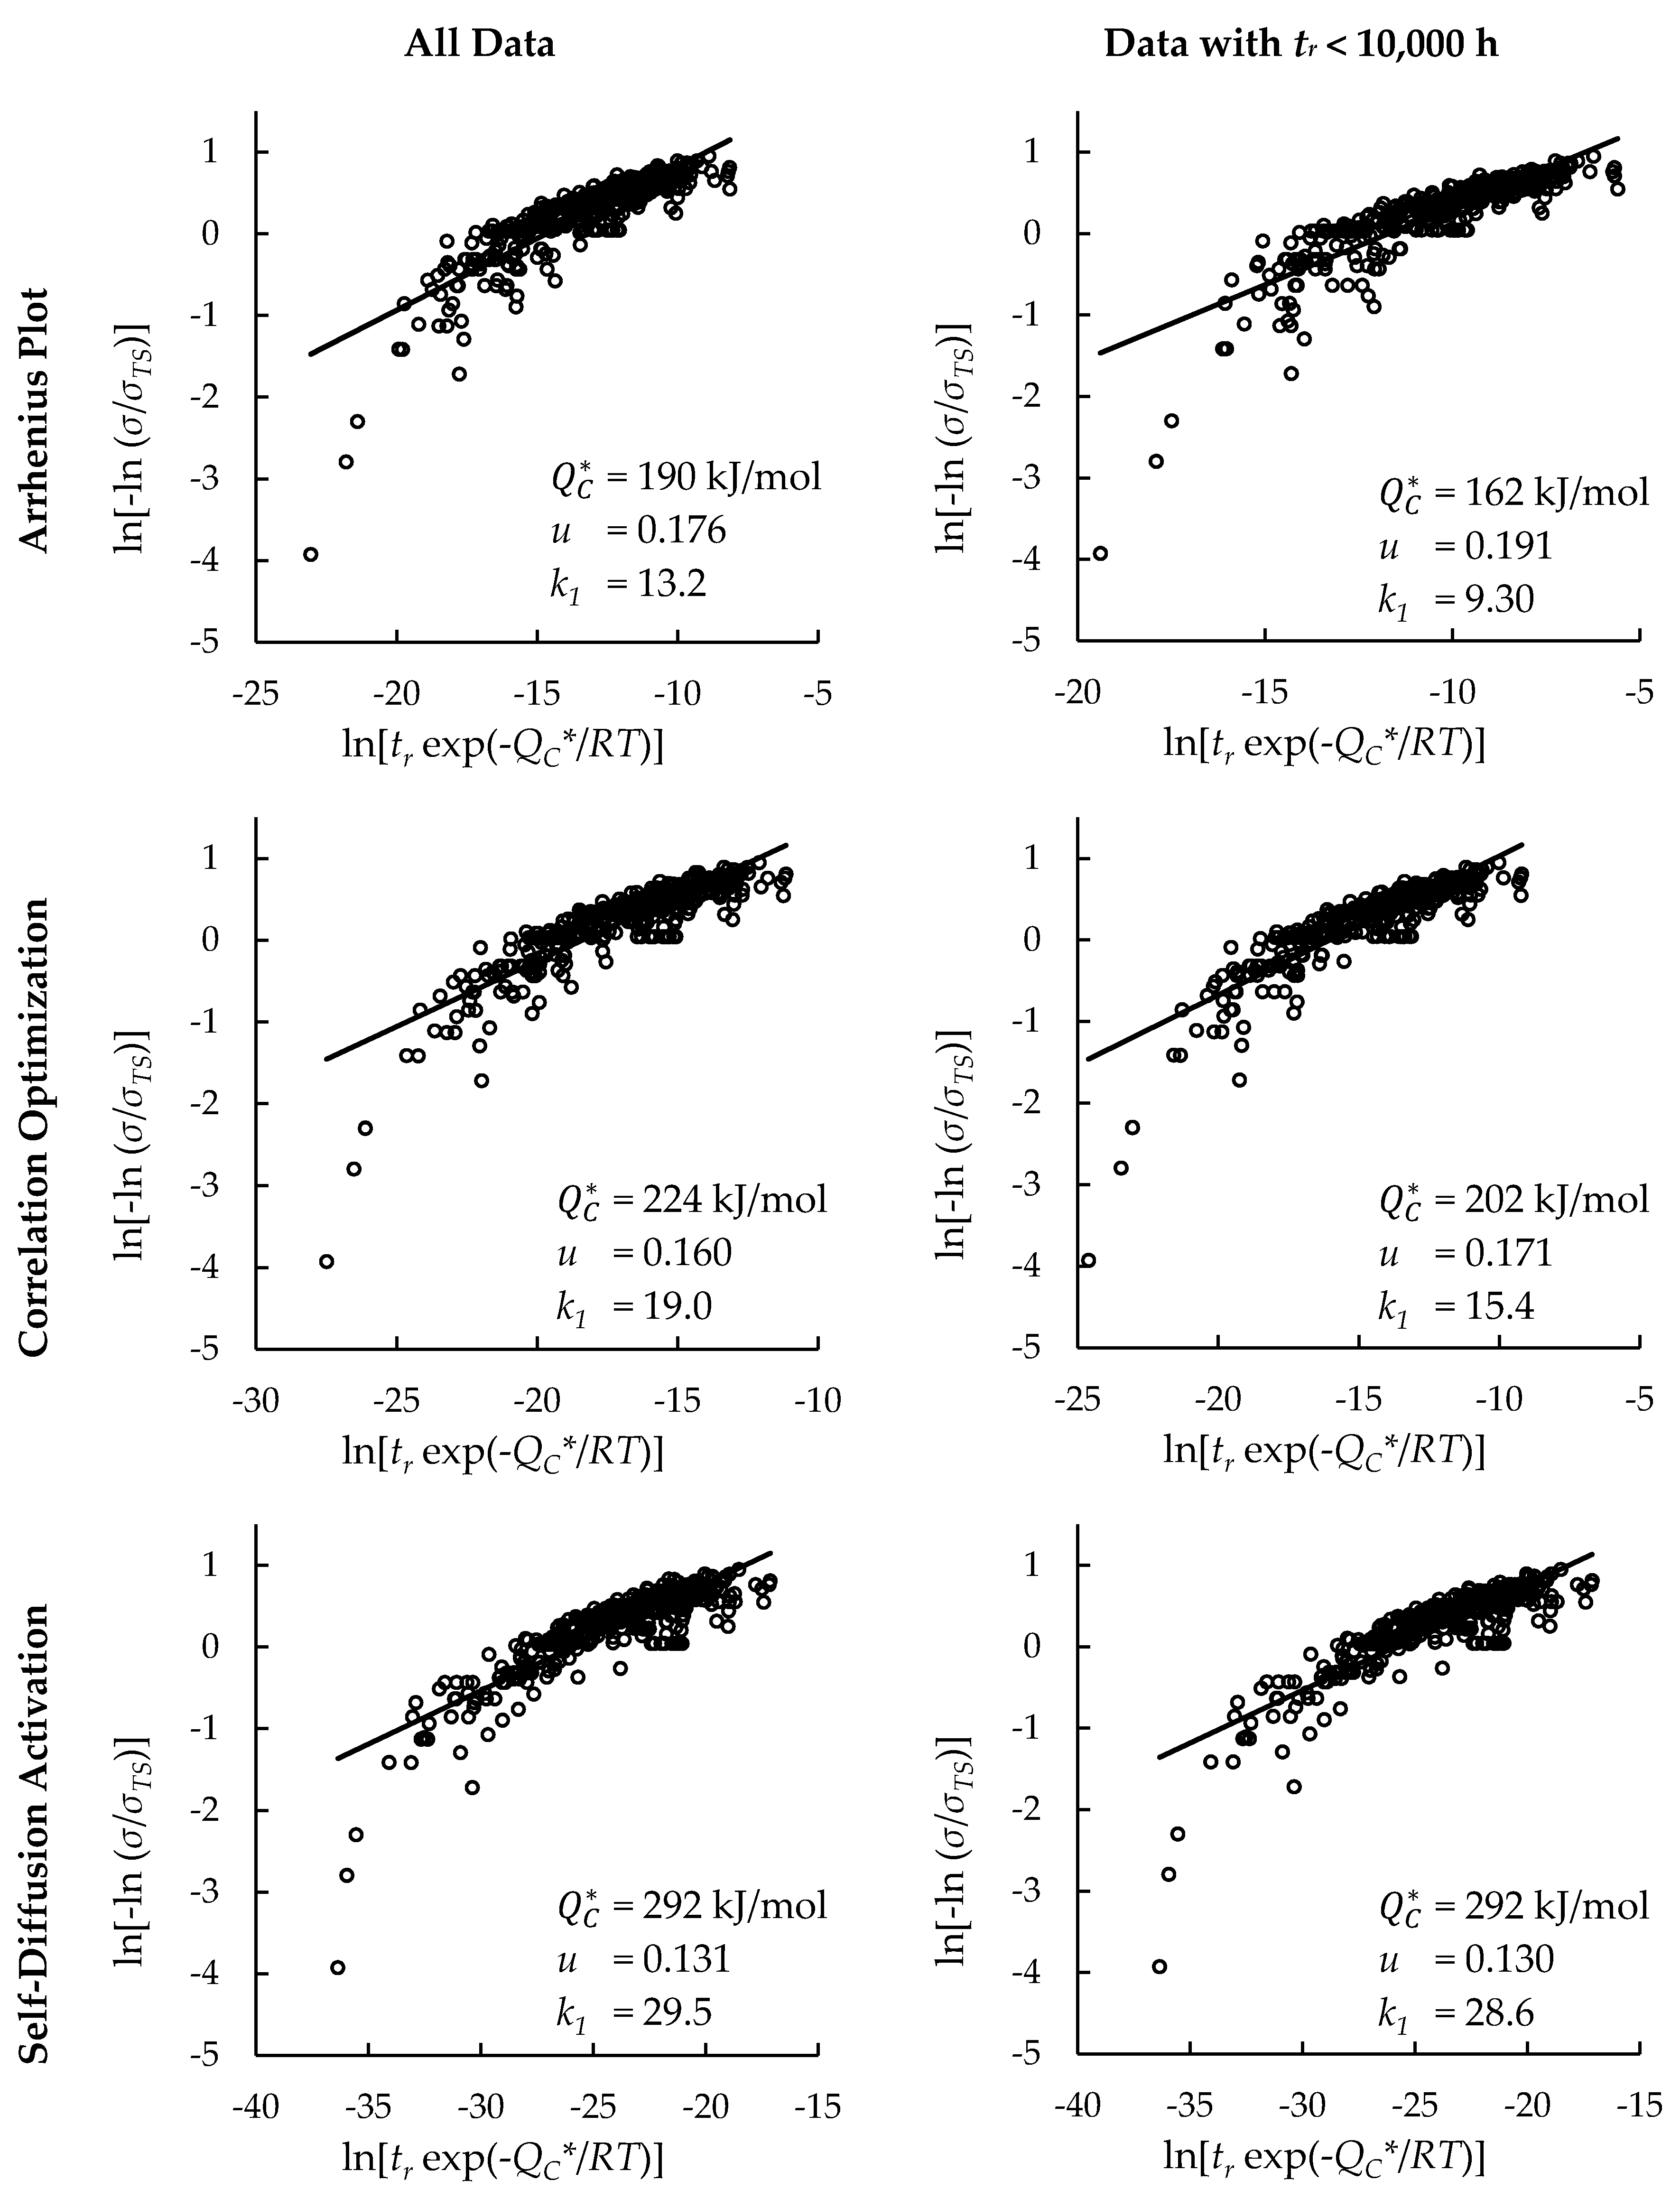
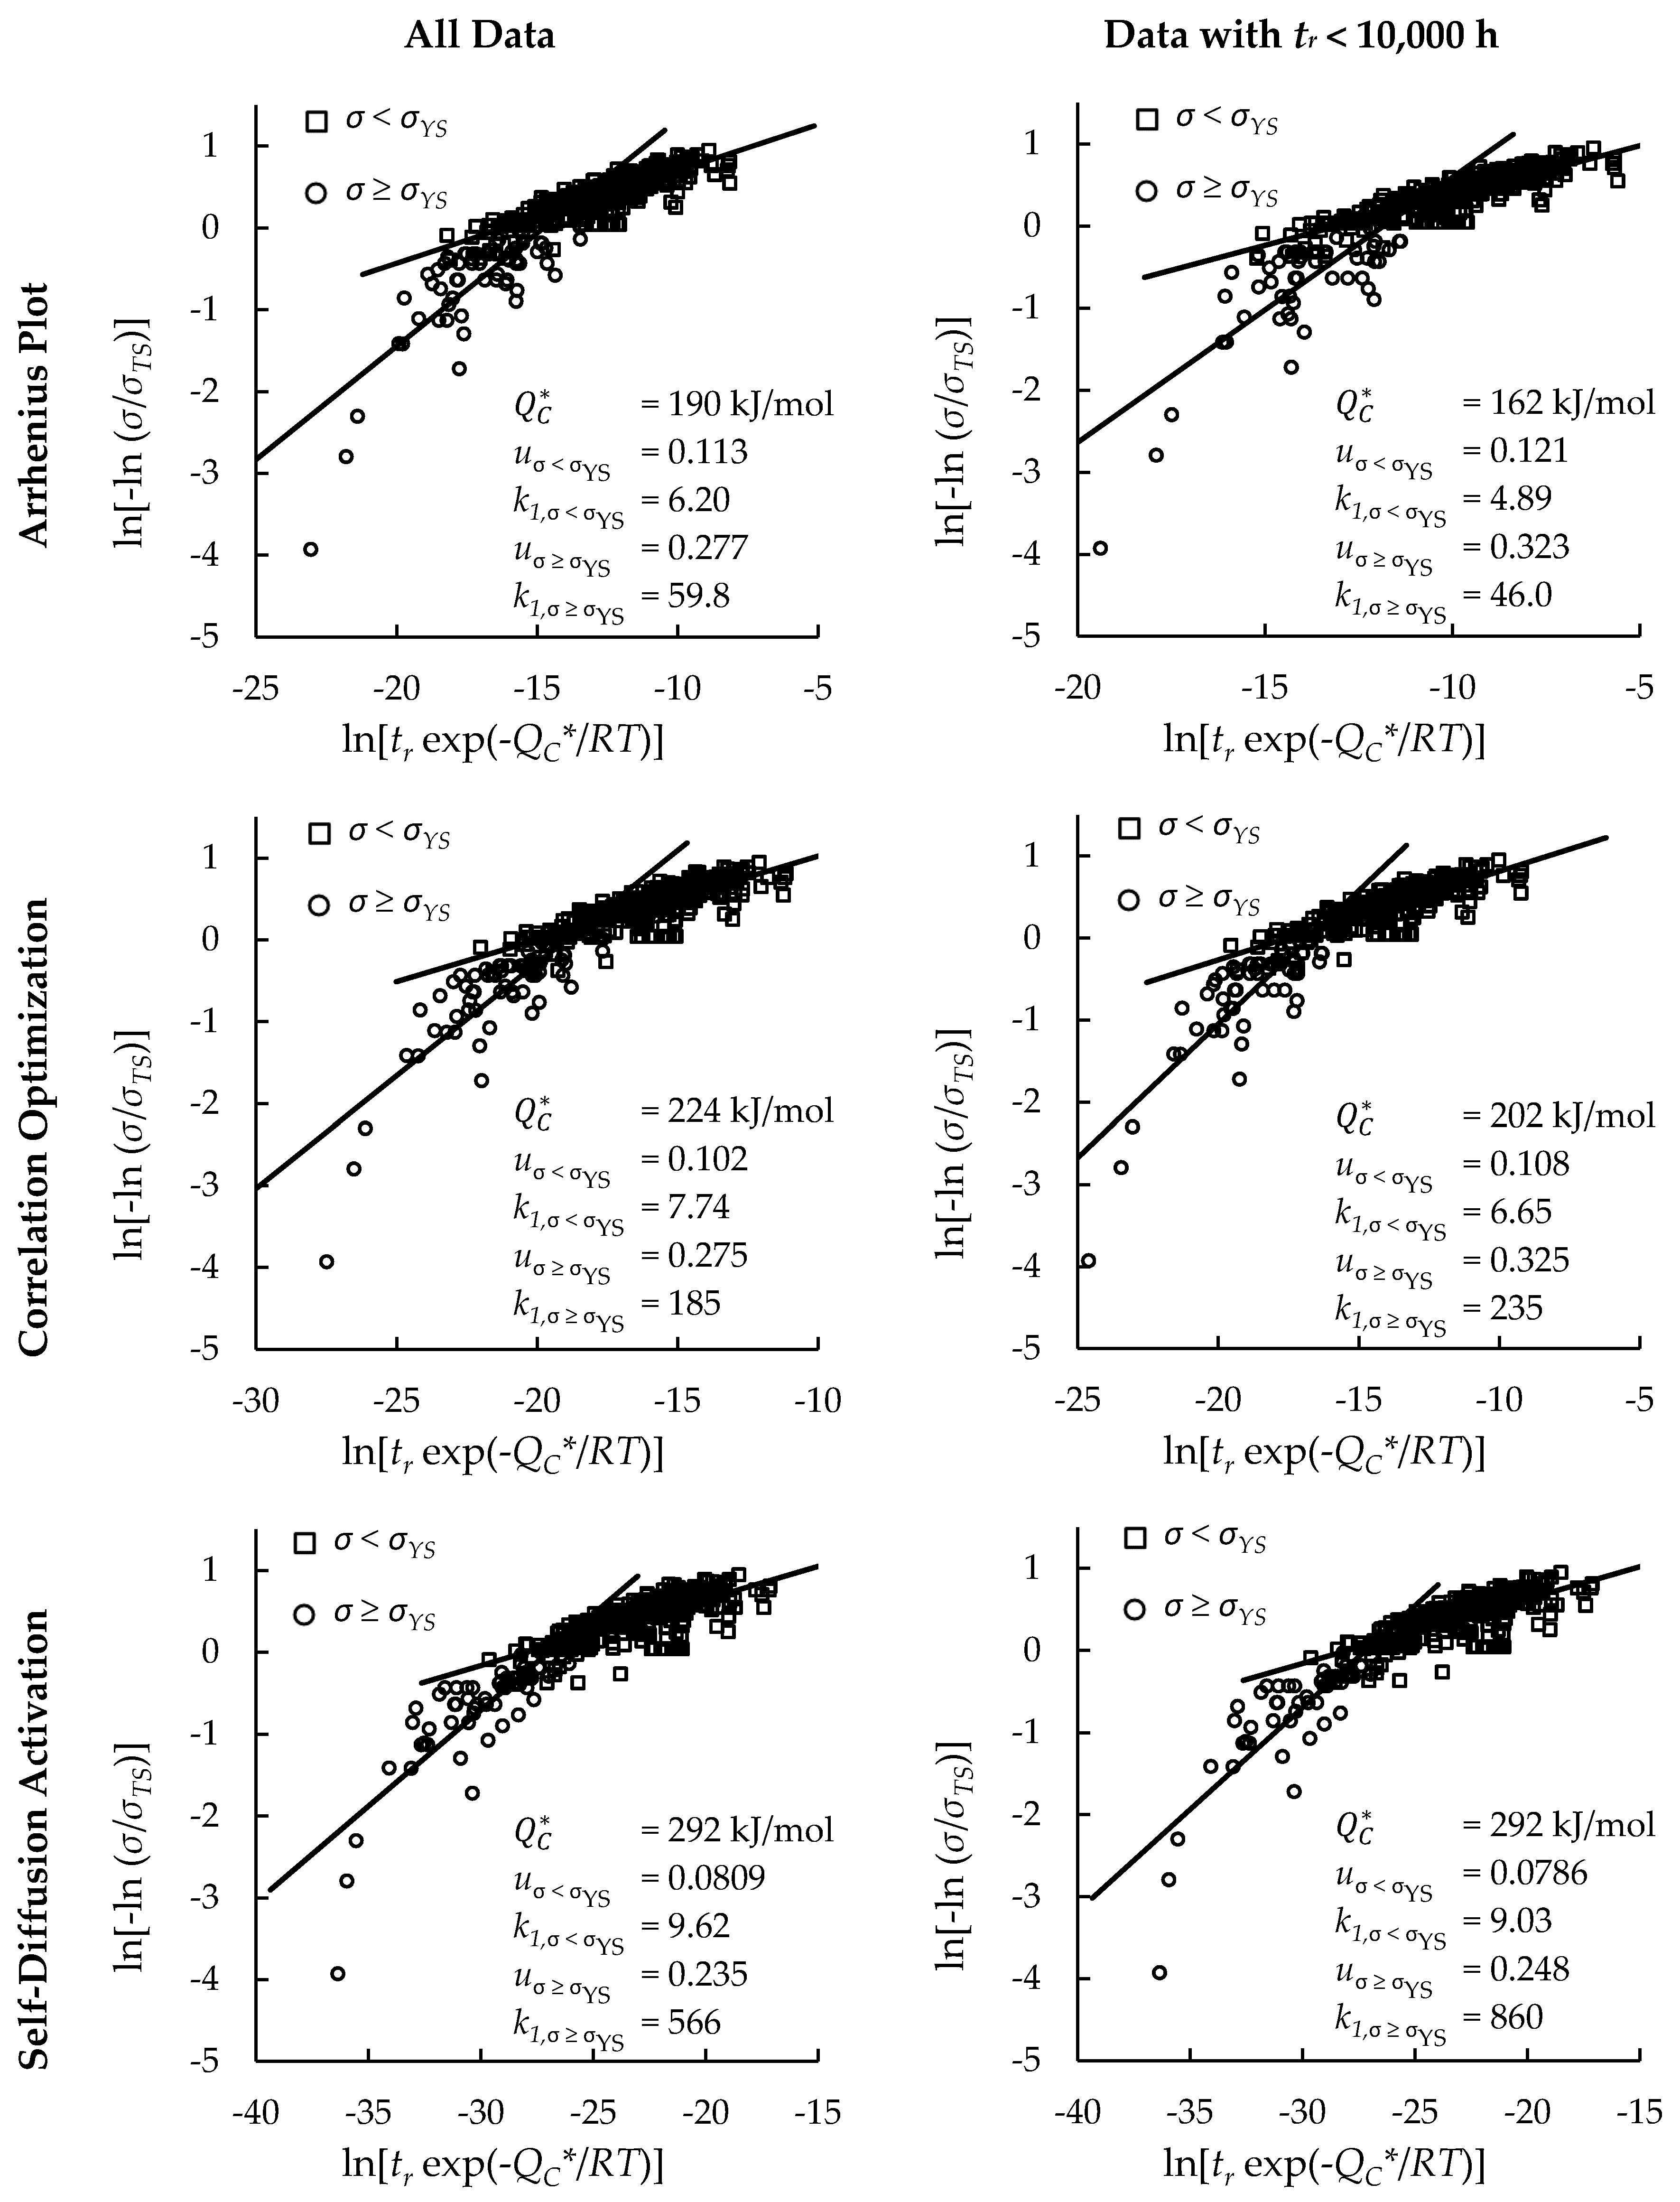
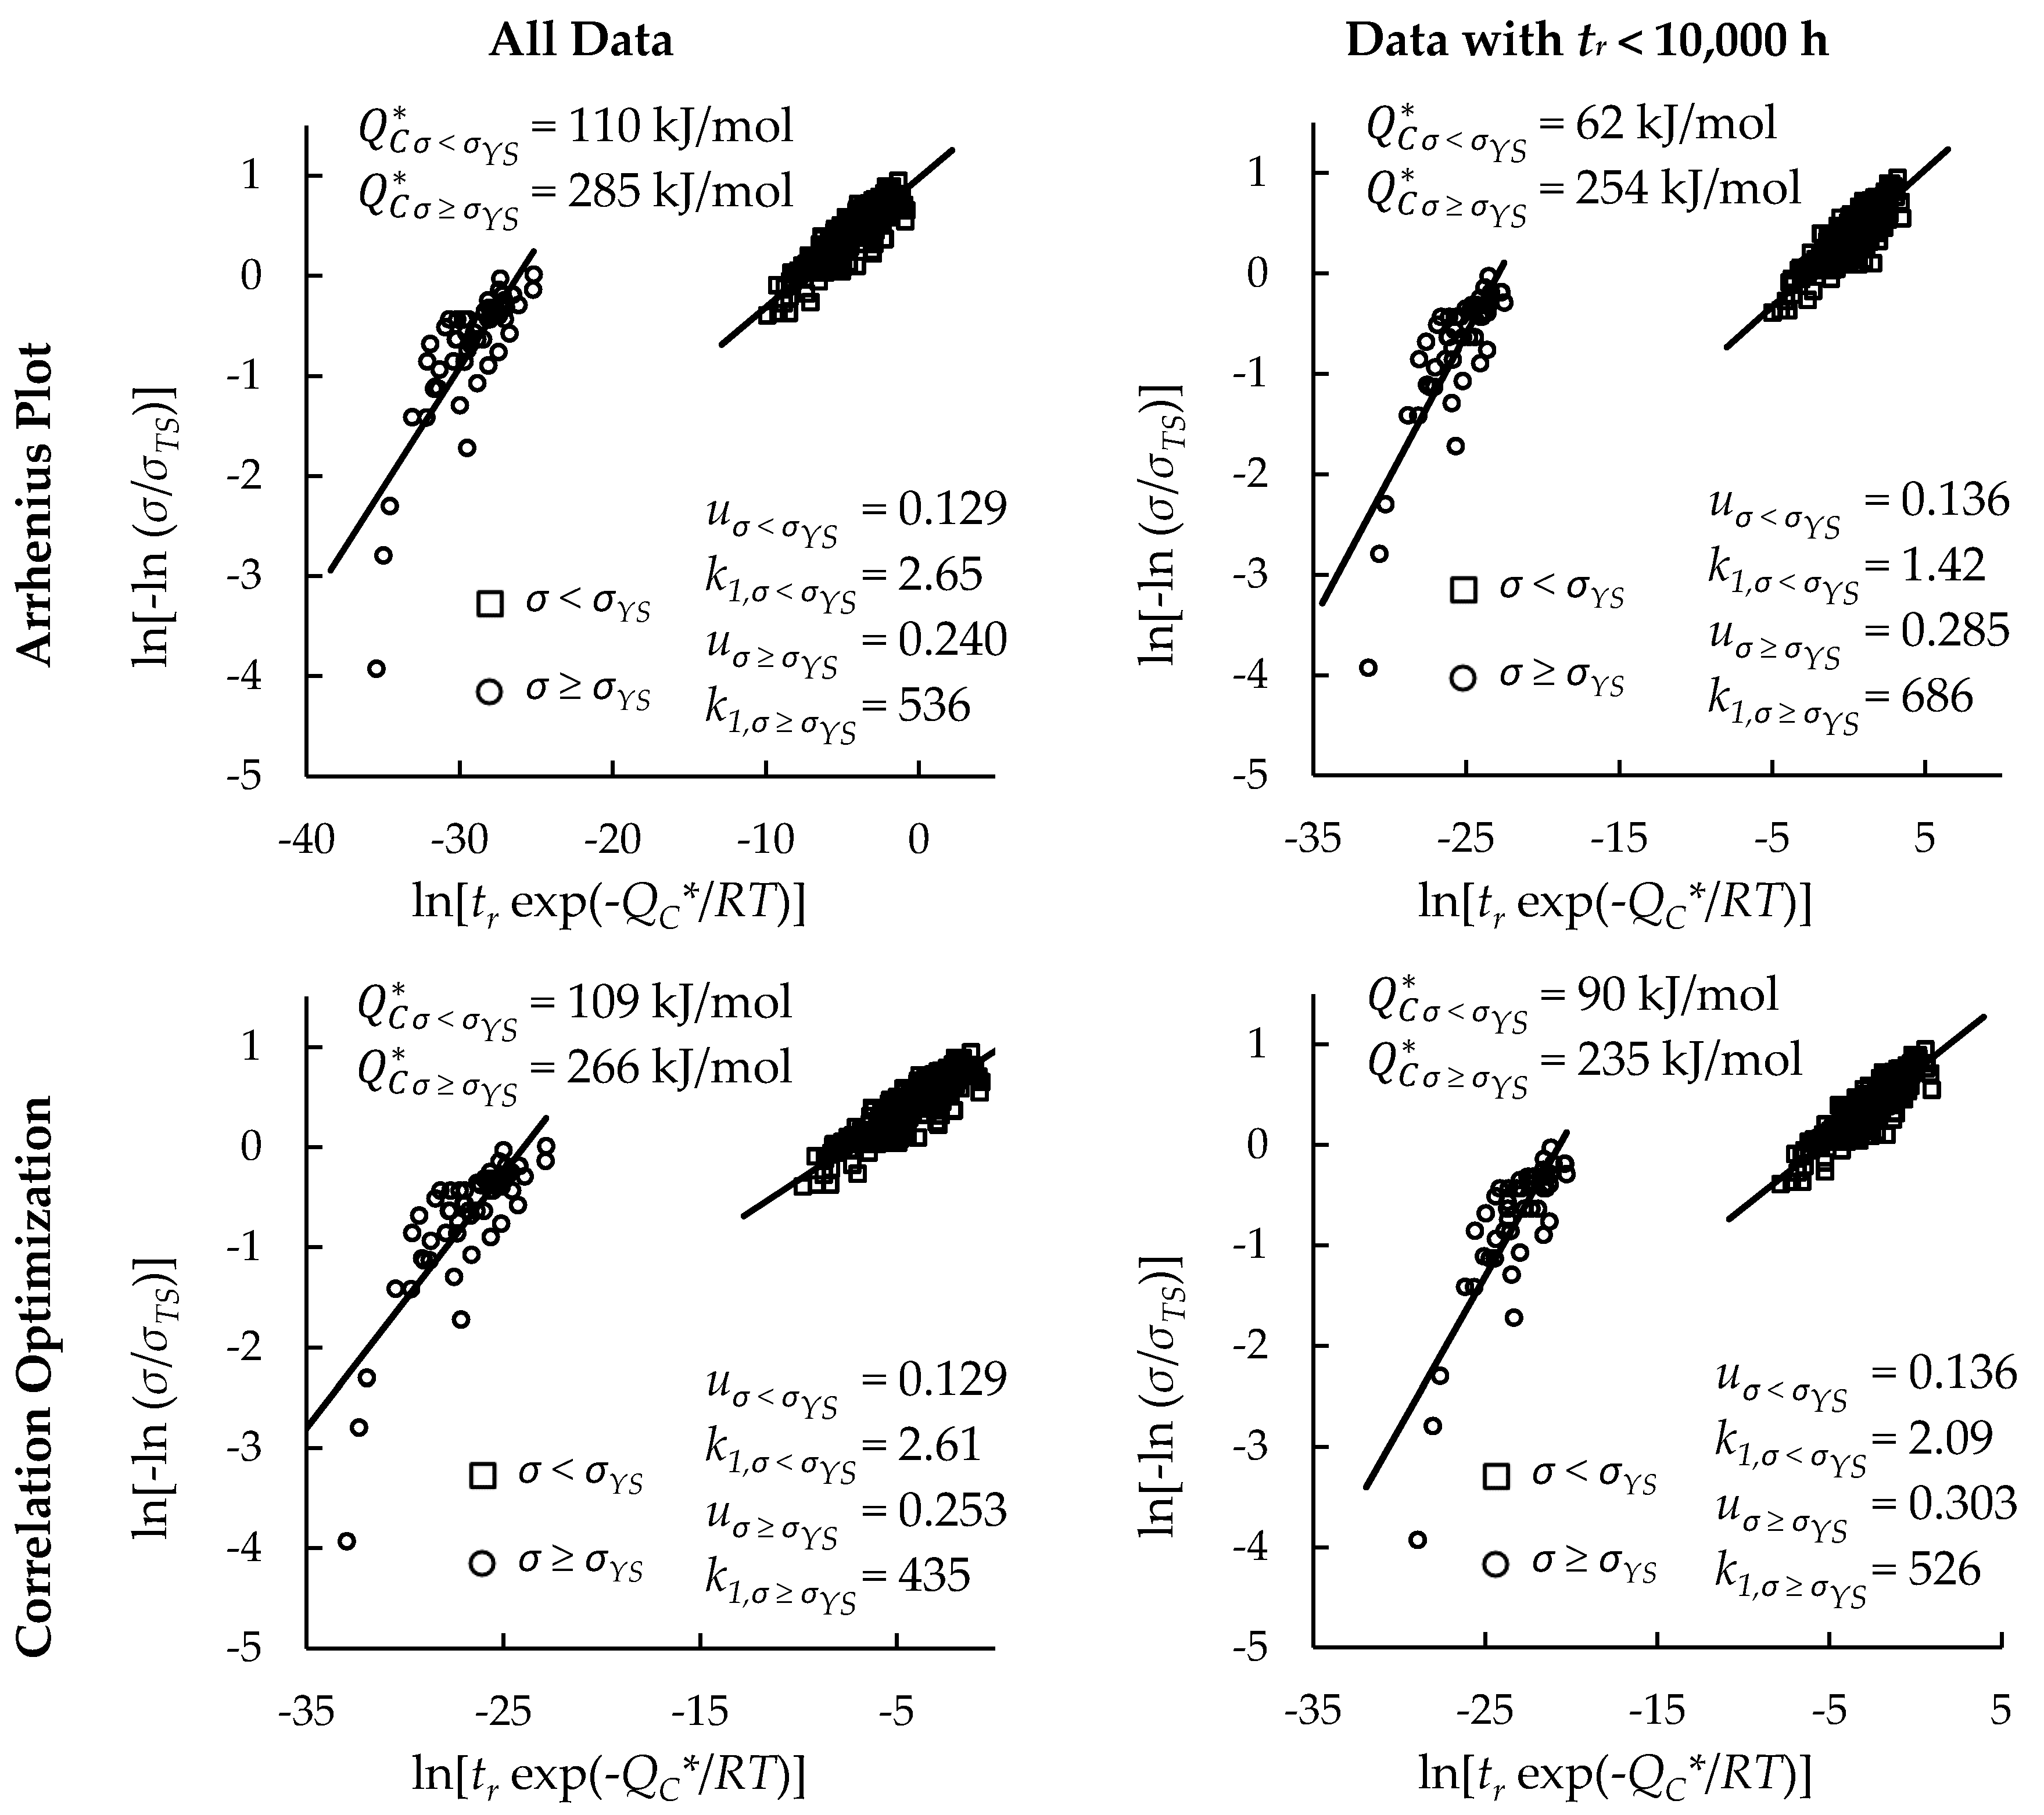
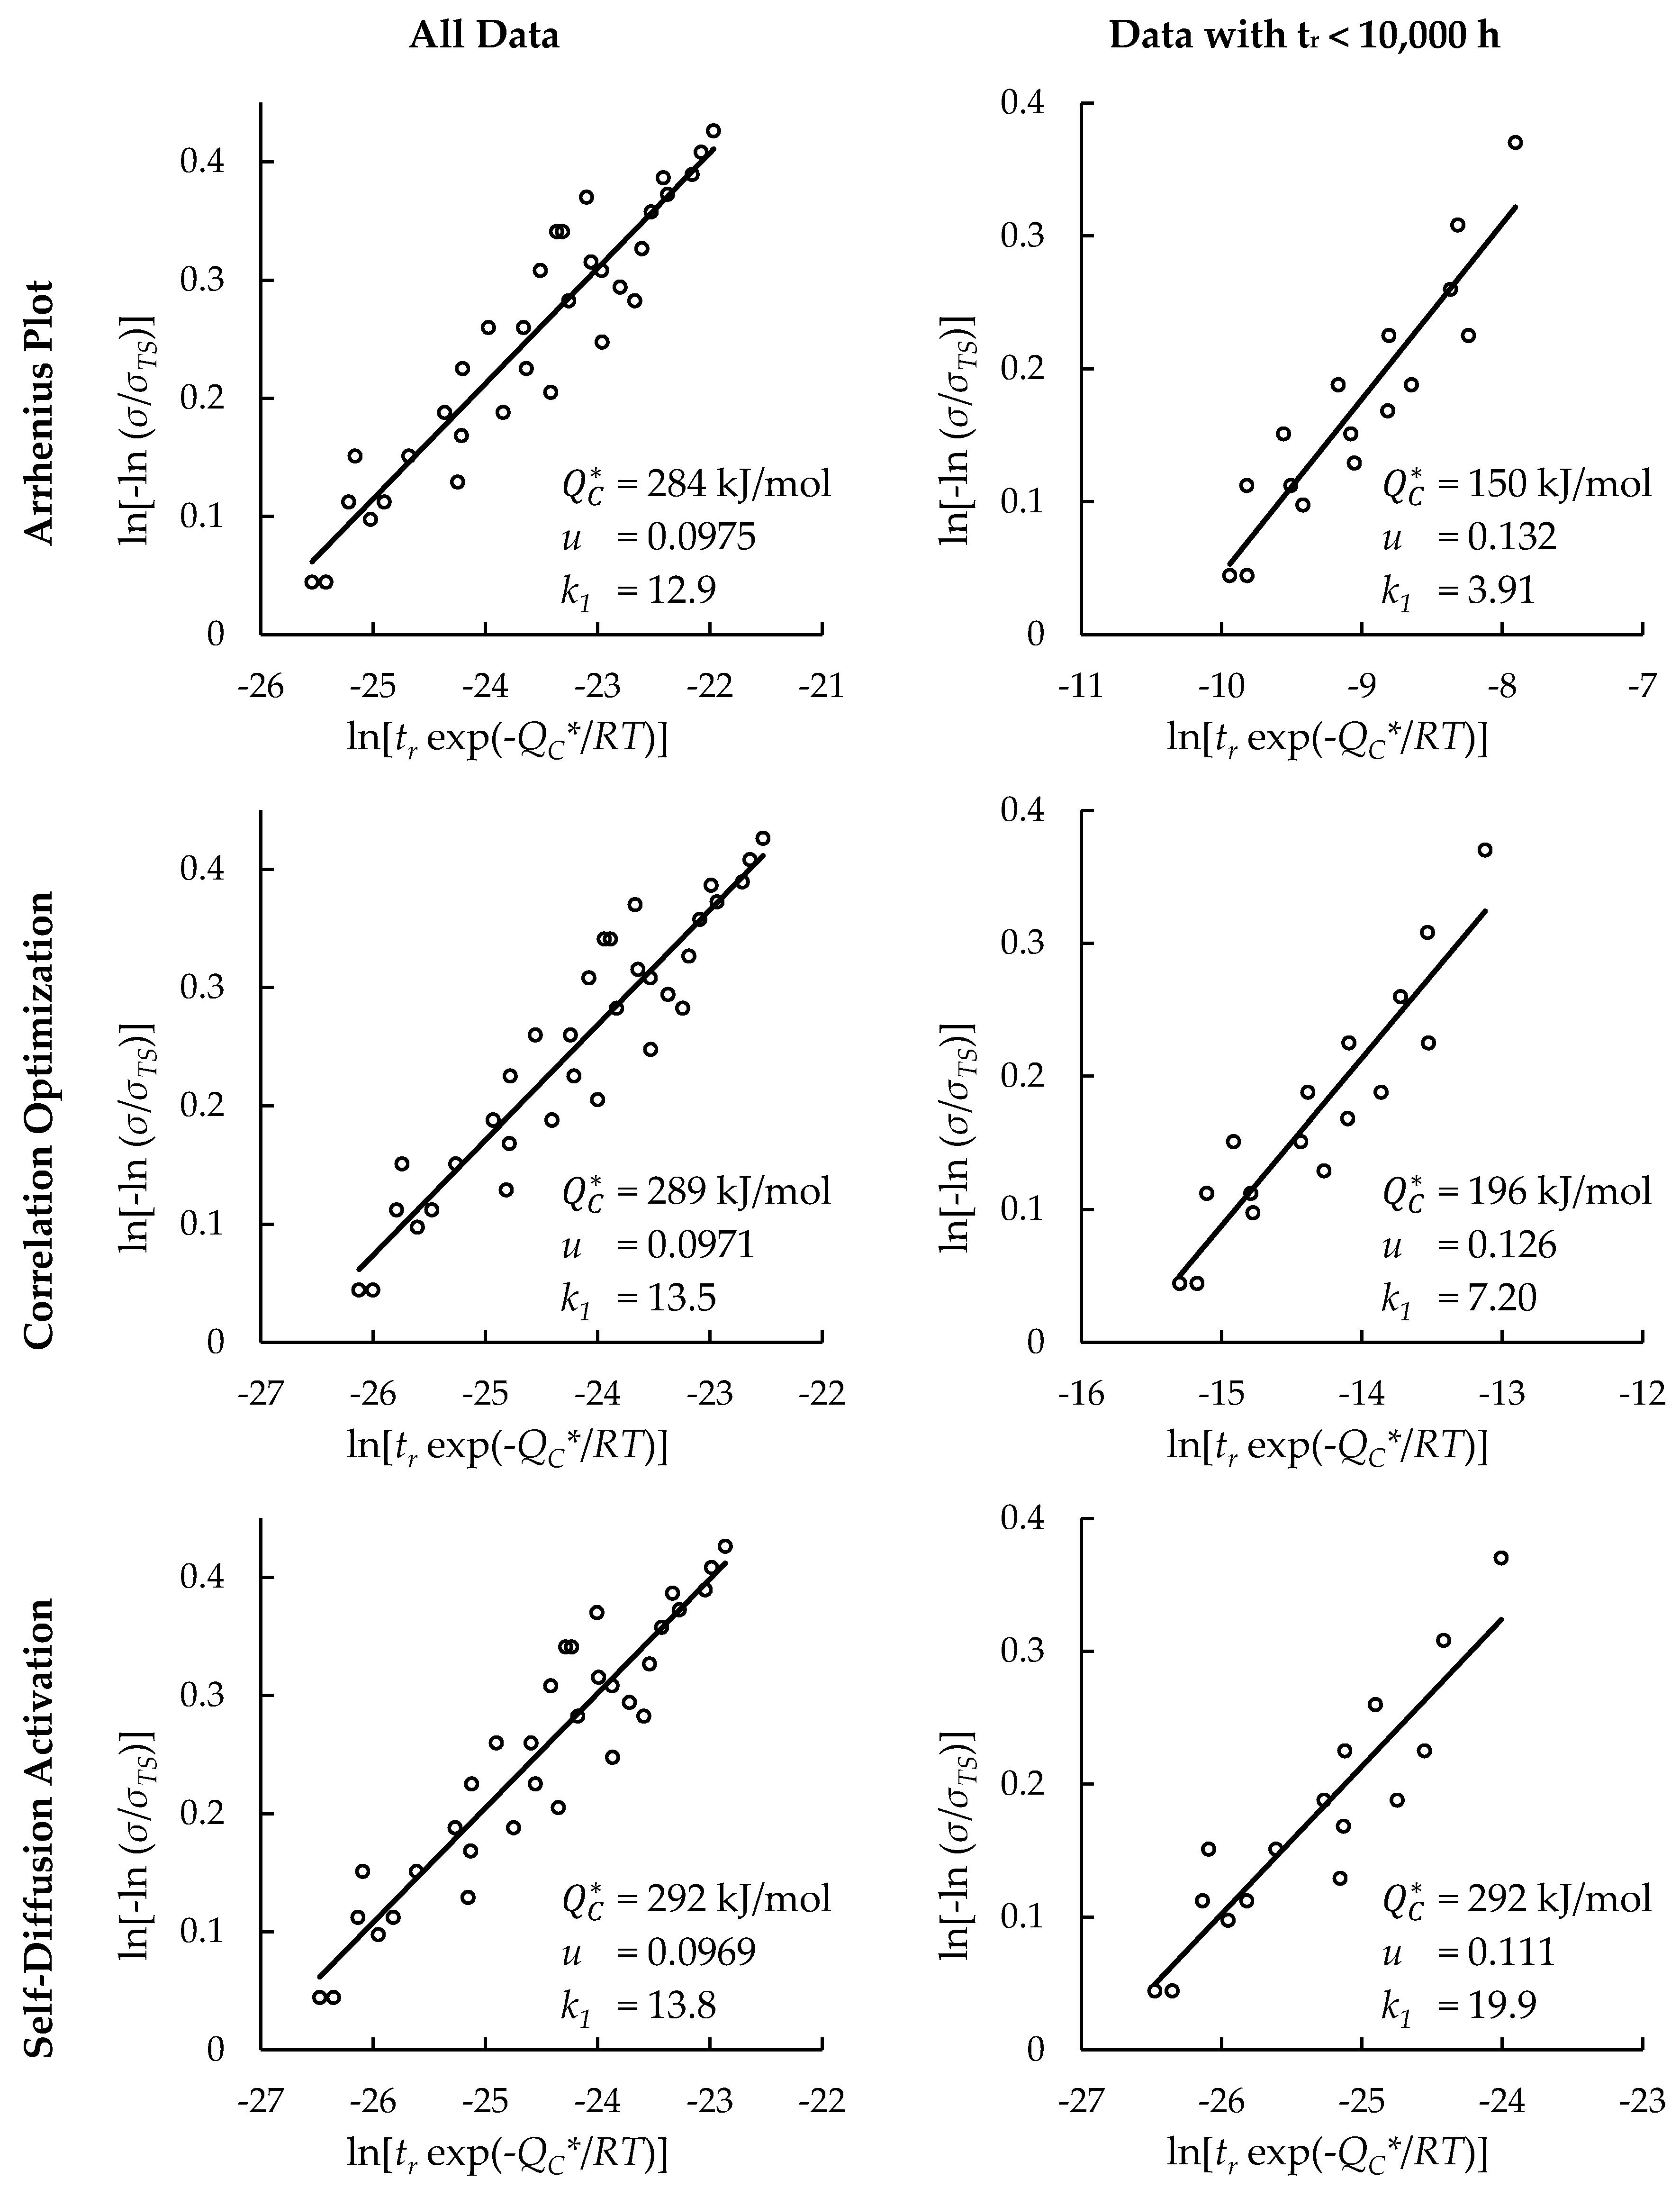
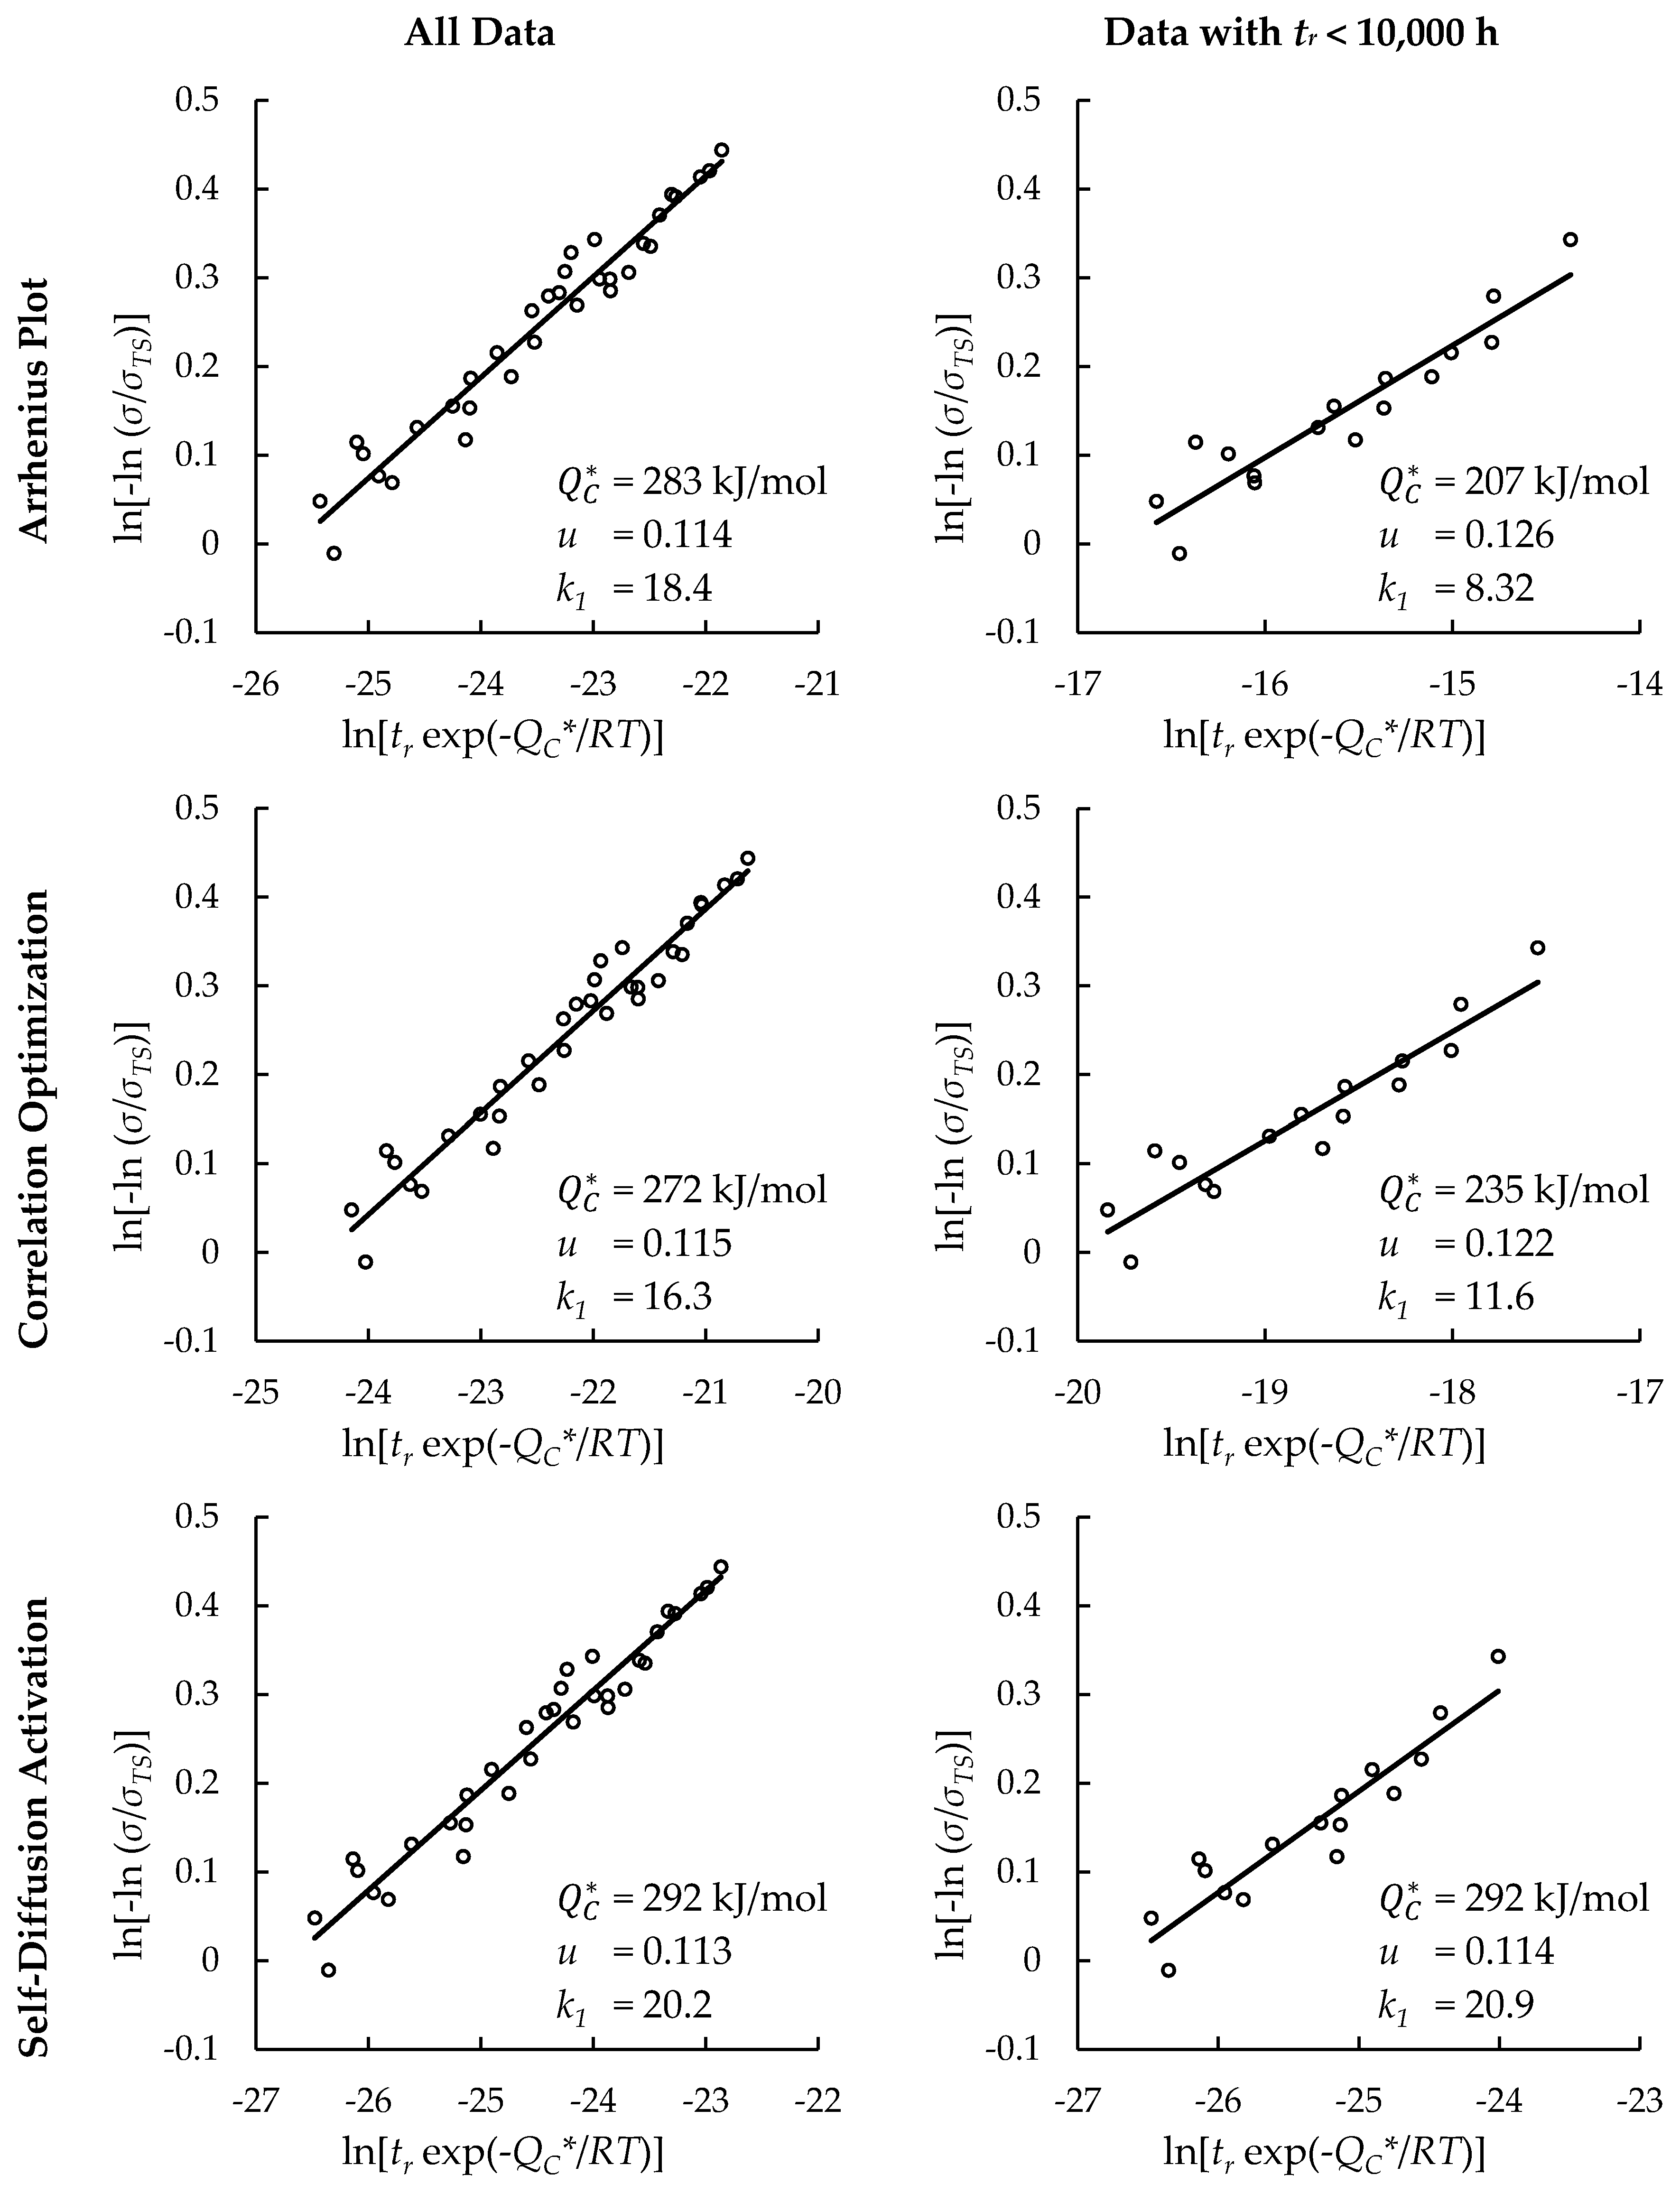
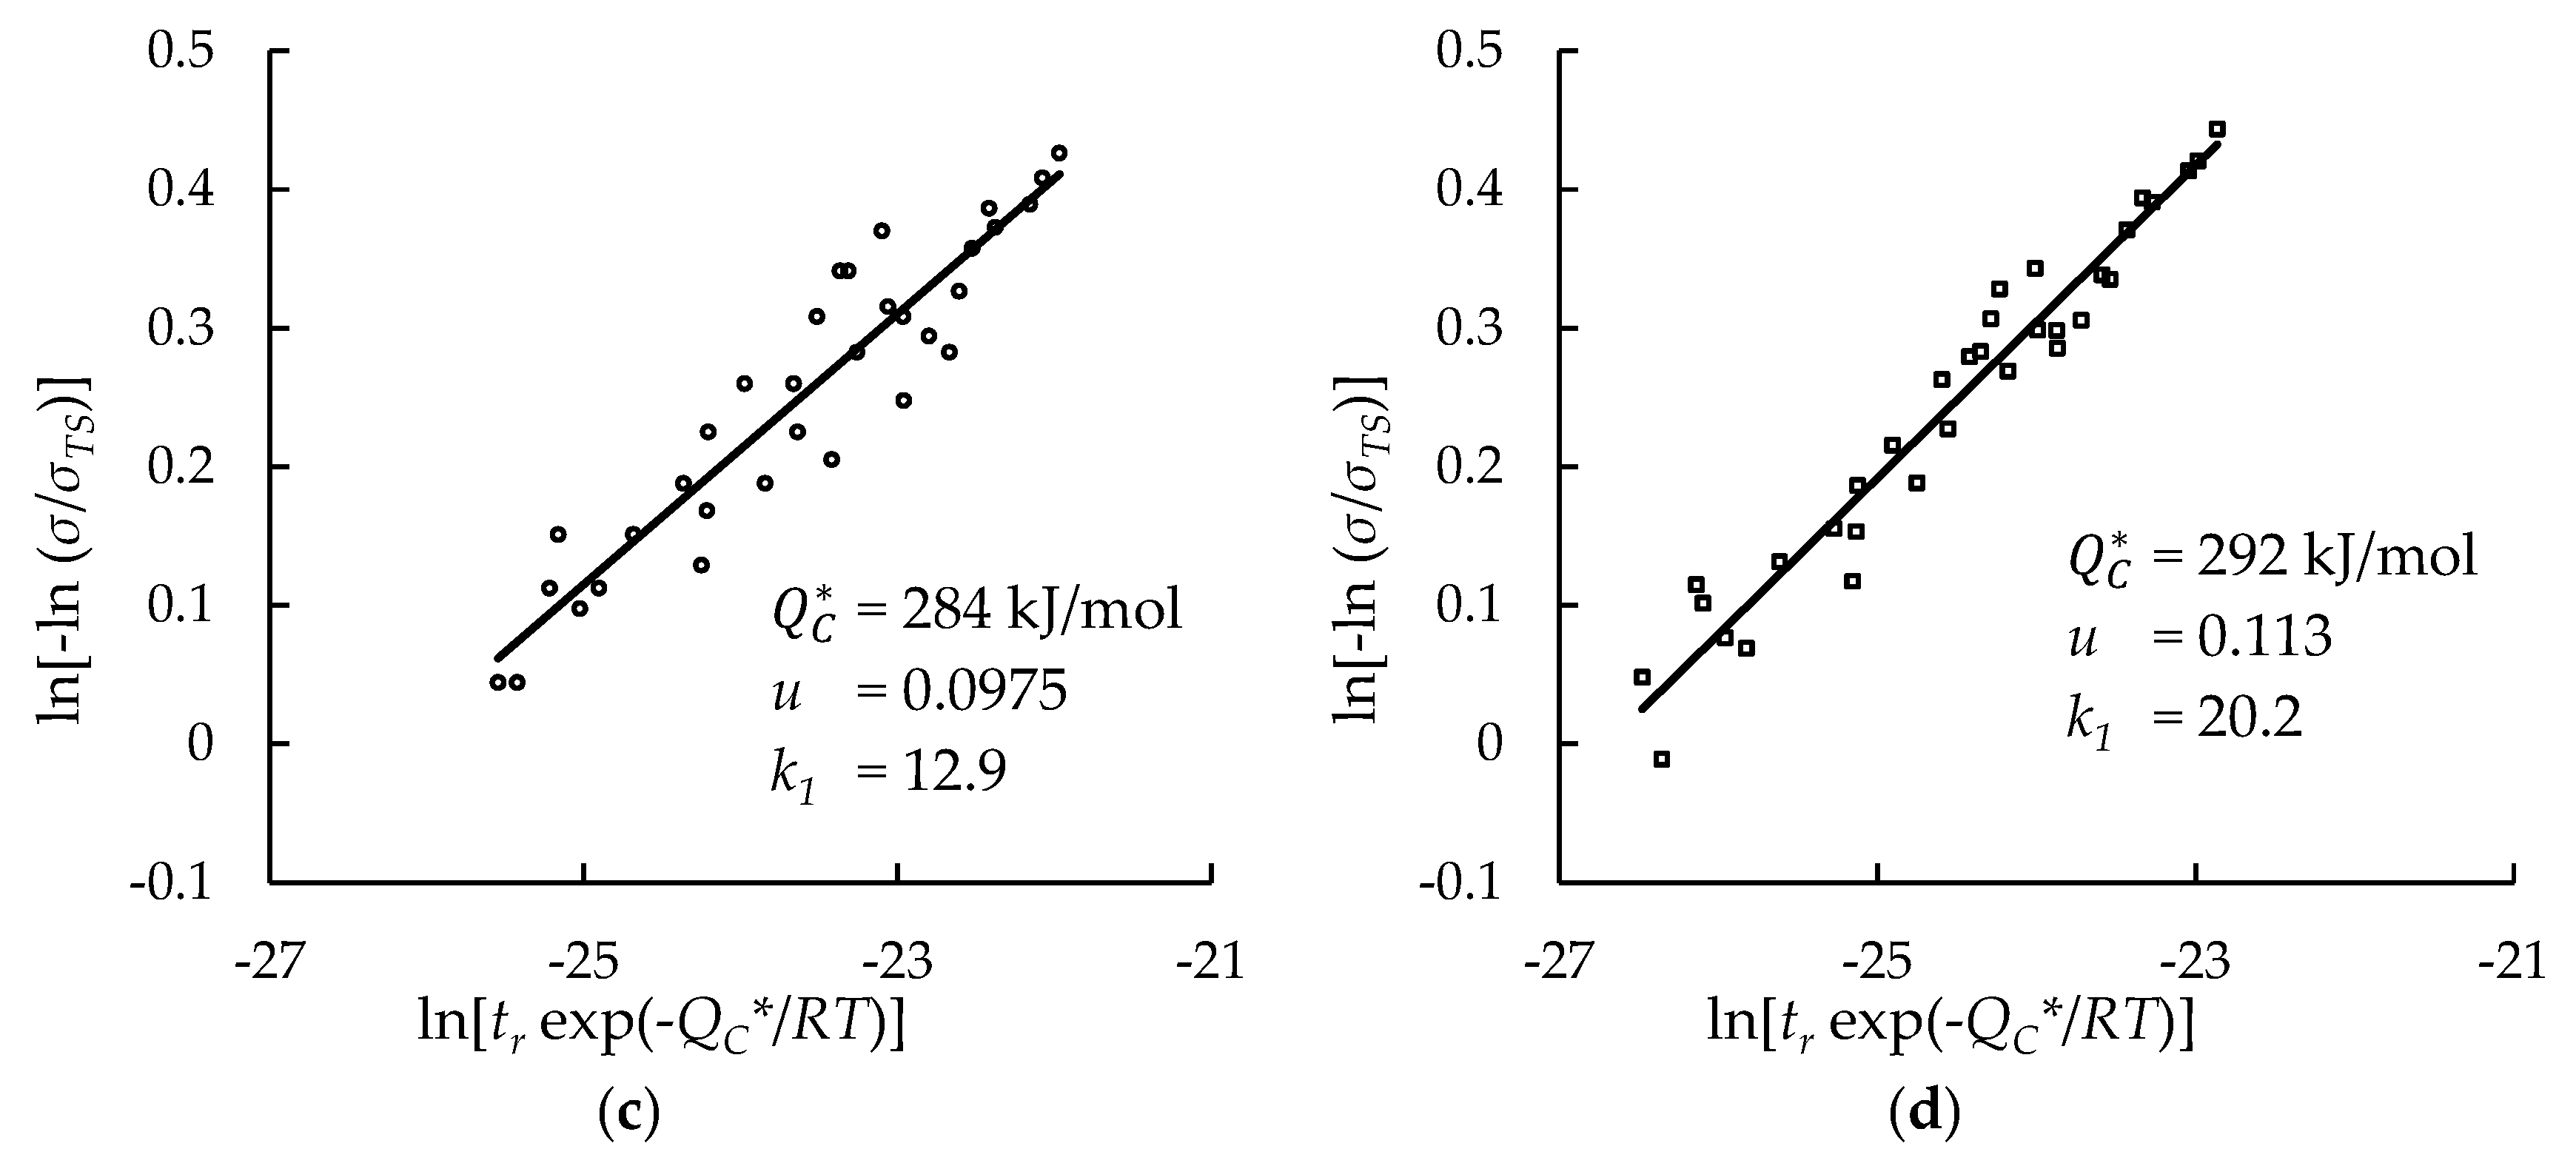
Creep rupture data for Inconel 617 and Nimonic 105 were split into two data sets for each alloy; one consisted of all data, while the other was limited to data with rupture times less than 10,000 h. The purpose of the limited data set is to show the efficacy of extrapolating short-term test data to longer times, as it has been claimed that the Wilshire equation is well-suited to do so [4,5,25,27,28,33]. For each data set, values of Q C * were determined using Arrhenius plots (shown in Table 1 and Table 2), by optimizing the correlation of data on Wilshire plots (shown in Table 3 and Table 4), and using the activation energy of self-diffusion of nickel in a nickel lattice, 292 kJ/mol [43]. Since tensile strength values for each heat and processing condition are available for Nimonic 105, the effect of their use compared to the use of average values was investigated. Average tensile strength values were determined at each temperature using tensile strength values of all heats and processing conditions. Wilshire plots for each case were generated to show the goodness of fit of the data. To improve the goodness of fit, Wilshire plots for Inconel 617 were split into two regions: σ < σYS and σσYS. Wilshire plots for Nimonic 105 were not split into regions because no data points have an applied stress higher than yield strength and no visible break appears in the data. For Inconel 617, negative Q C * values were calculated using Arrhenius plots at two stress ratios, 0.4 and 0.5, for data with an applied stress less than yield strength. These negative Q C * values were omitted from average Q C * calculations. Representative Wilshire plots are shown in Figure 1. Plots of all cases are provided as Figure A1, Figure A2, Figure A3, Figure A4 and Figure A5 in Appendix A. For both alloys, Q C * values much lower than the activation energy of self-diffusion of nickel in a nickel lattice were occasionally obtained. Similarly, low Q C * values have been obtained by others [33,35,44].
For all cases, time to rupture was calculated at the stress and temperature of each experimental data point. The error of the calculated rupture times in hours was measured using mean squared error (MSE), defined as
MSE = i = 1 n ( t r , c a l c u l a t e d , i t r , e x p e r i m e n t a l , i ) 2 n .
The Wilshire equation’s goodness of fit (quantified by R2) for each data set and error obtained by applying the calculated Q C * values and fitting constants to all creep rupture data are presented in Table 5 and Table 6.
For Inconel 617, the activation energy of self-diffusion of nickel in a nickel lattice gave the worst goodness of fit and error in all cases. Creep activation energy values at stresses below yield strength are much lower than those above yield strength. Both methods calculated much lower Q C * values, ranging from 62 to 110 kJ/mol, than the published activation energy of self-diffusion of nickel in a nickel lattice, 292 kJ/mol. For data with an applied stress above yield strength, the calculated Q C * values are slightly lower, but still near the activation energy of self-diffusion of nickel in a nickel lattice. Contrary to expectations, region splitting worsened the error in all cases. Additionally, using data with rupture times less than 10,000 h to calculate Q C * and the fitting constants yielded errors similar to using all data. Regardless of the method used to calculate Q C * , relatively poor fits of the Wilshire equation to the Inconel 617 data were obtained. A similar issue of large data scatter of Inconel 617 has been reported by others [45,46].
For Nimonic 105, the goodness of fit and error improved dramatically from the use of heat- and processing-specific tensile strength values; for the data set with all data, the coefficient of determination increased from 0.88 to 0.95 and the mean squared error was reduced by about 70%. All three methods to determine Q C * gave a similar goodness of fit and error with all data. Compared to using all data, the calculated Q C * values are much lower and the goodness of fit is worse when using data with rupture times less than 10,000 h.
Figure 2 shows the correlation of the Wilshire equation and error at each potential value of Q C * , which were obtained when using the correlation optimization method to determine Q C * .
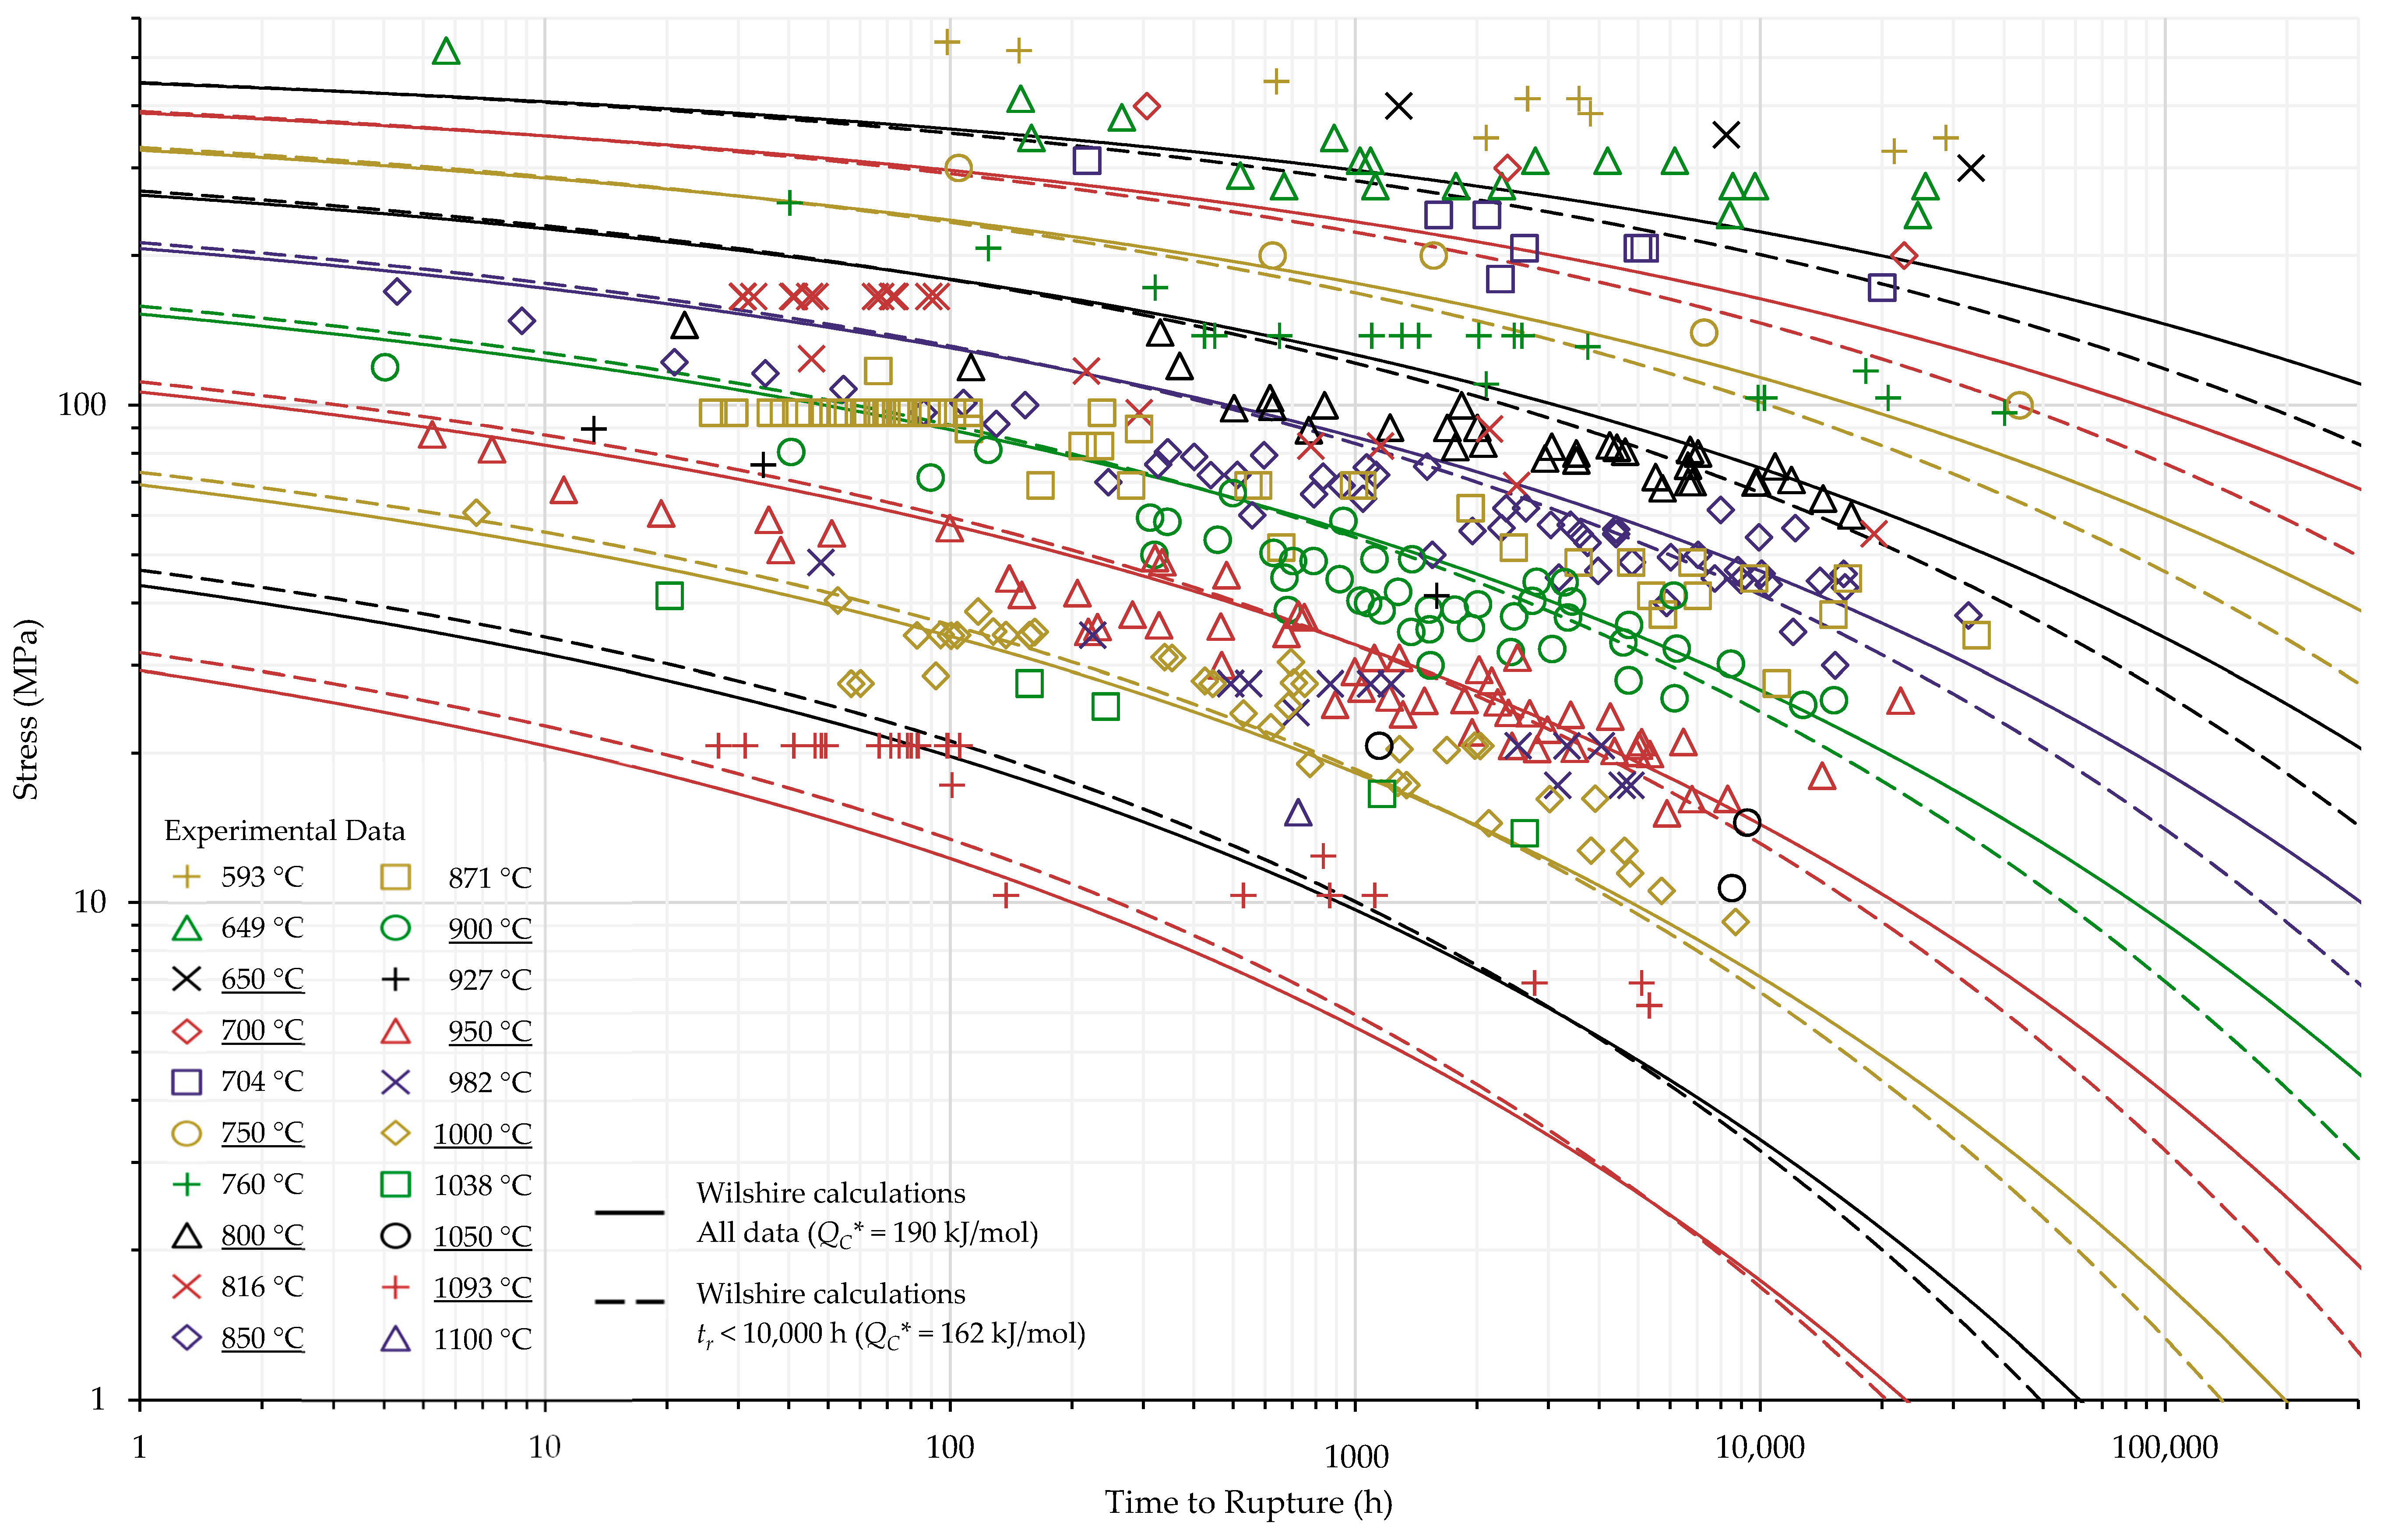
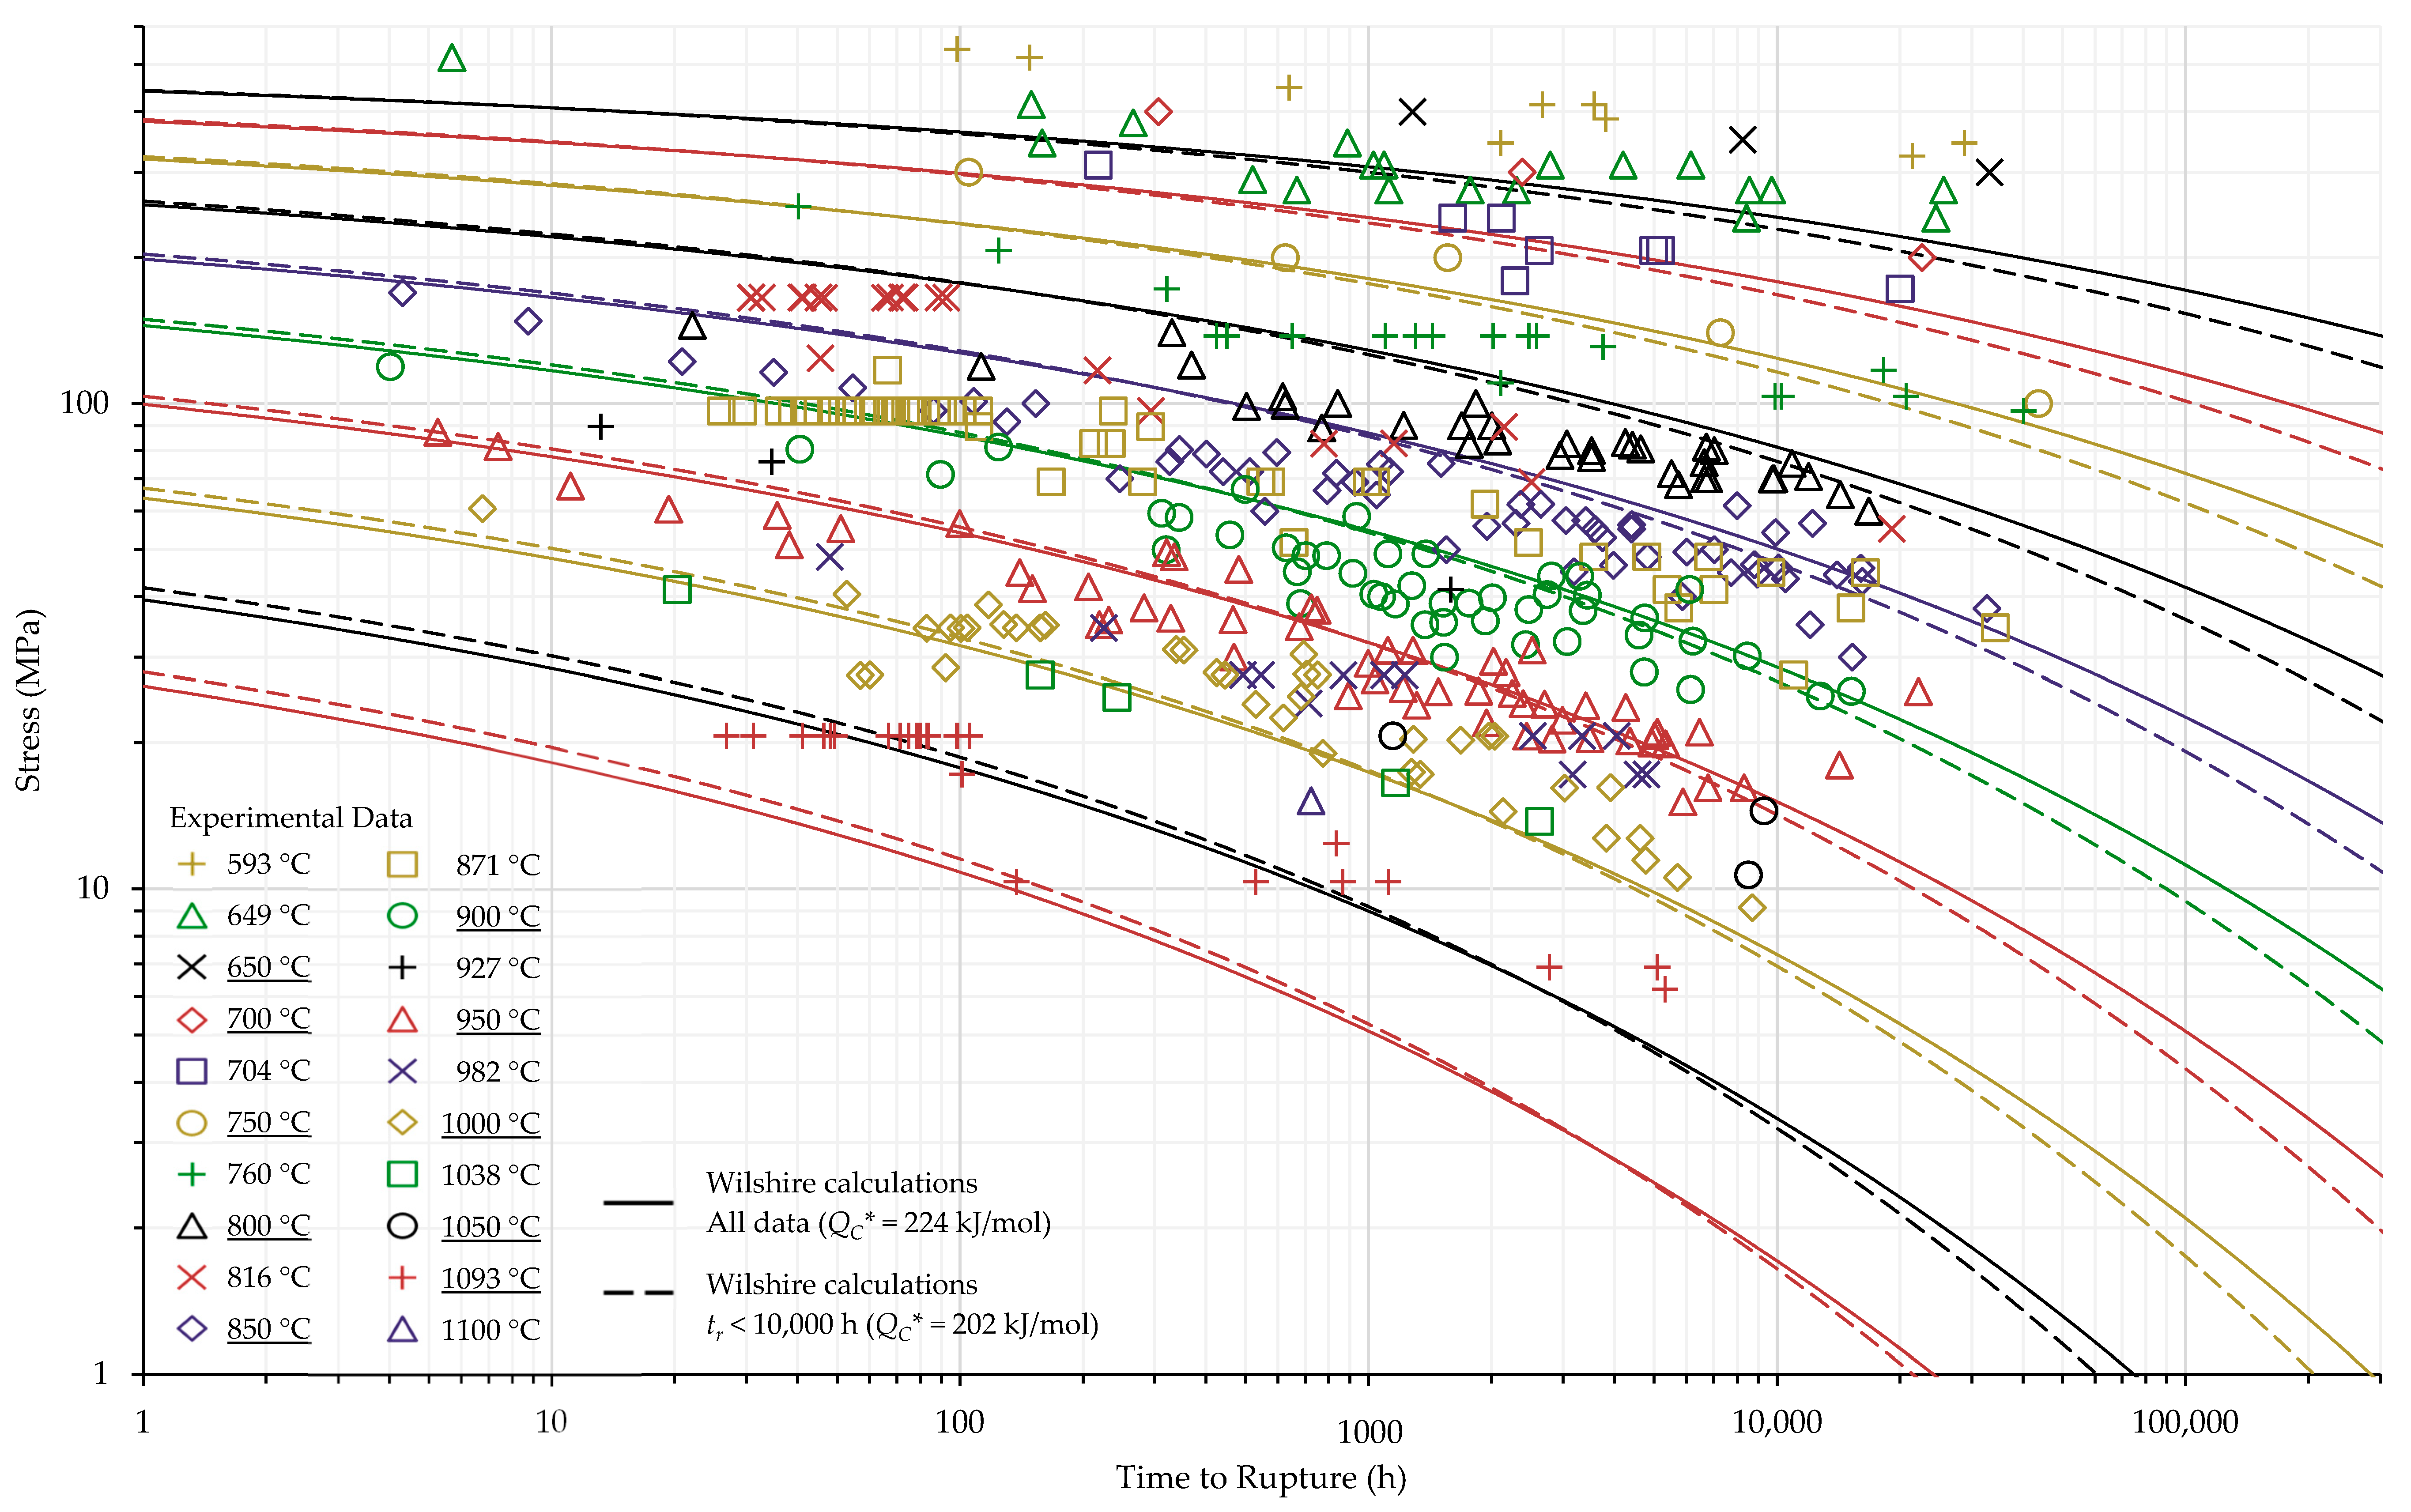
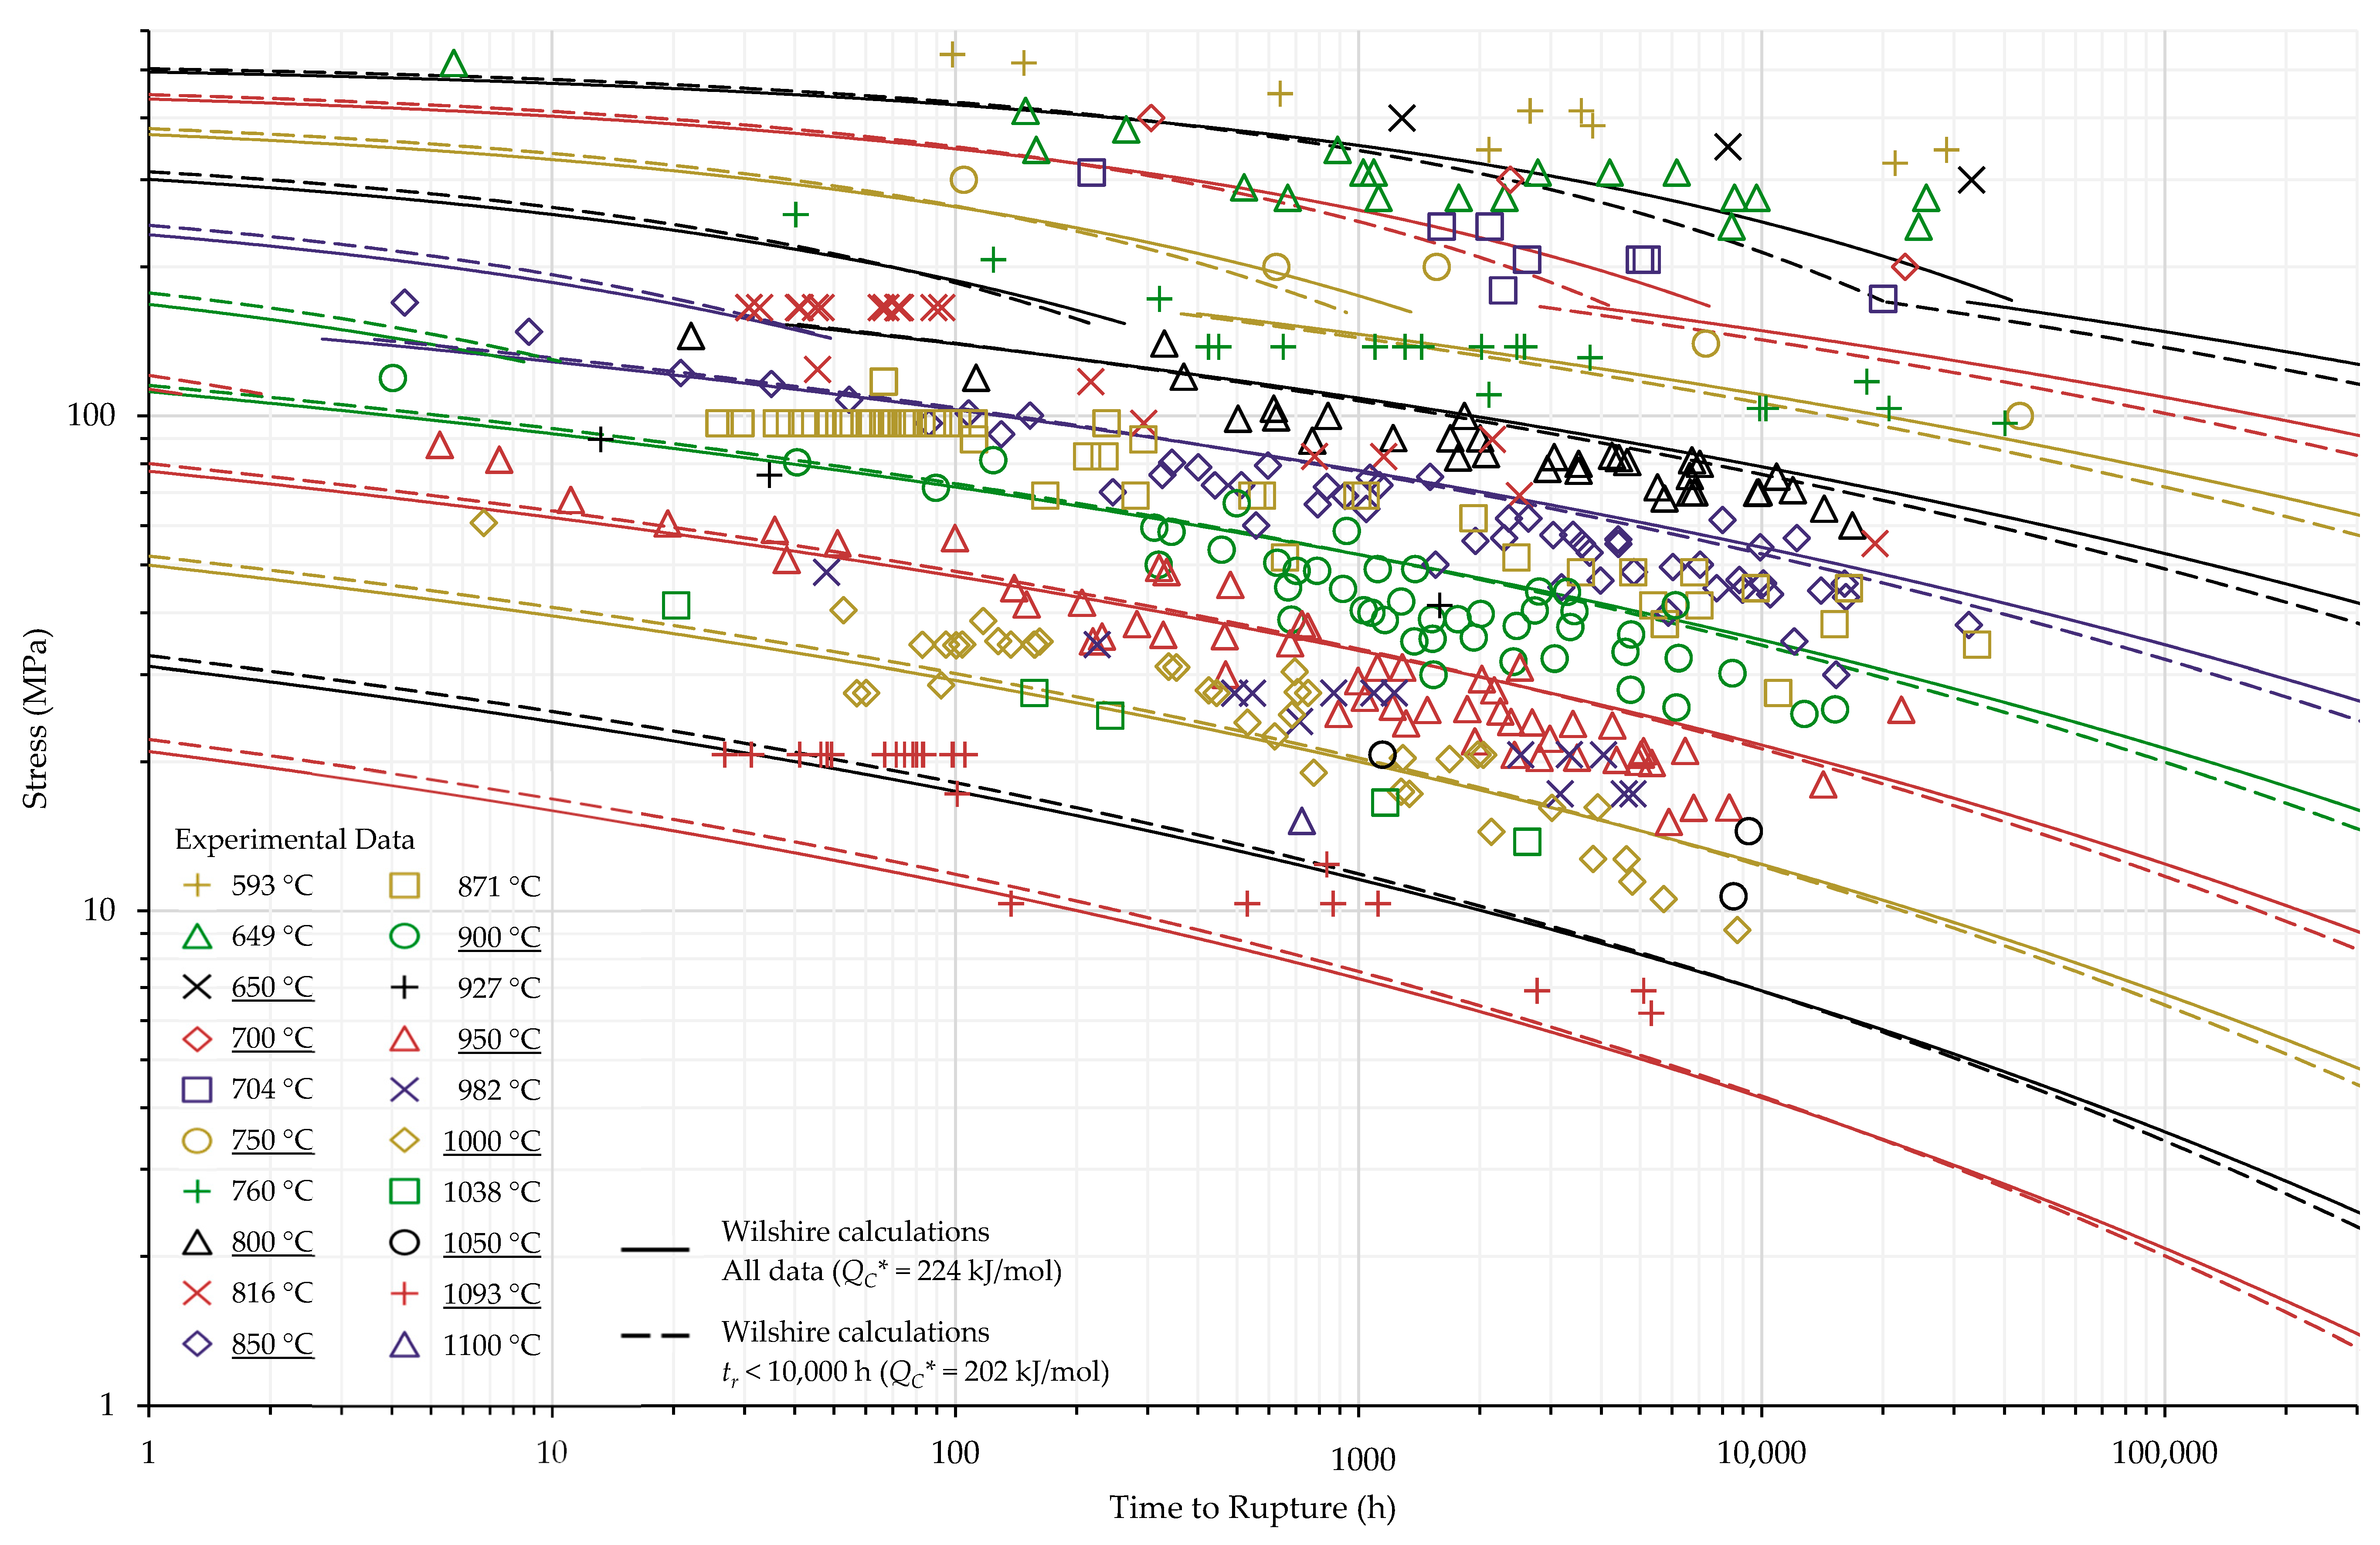
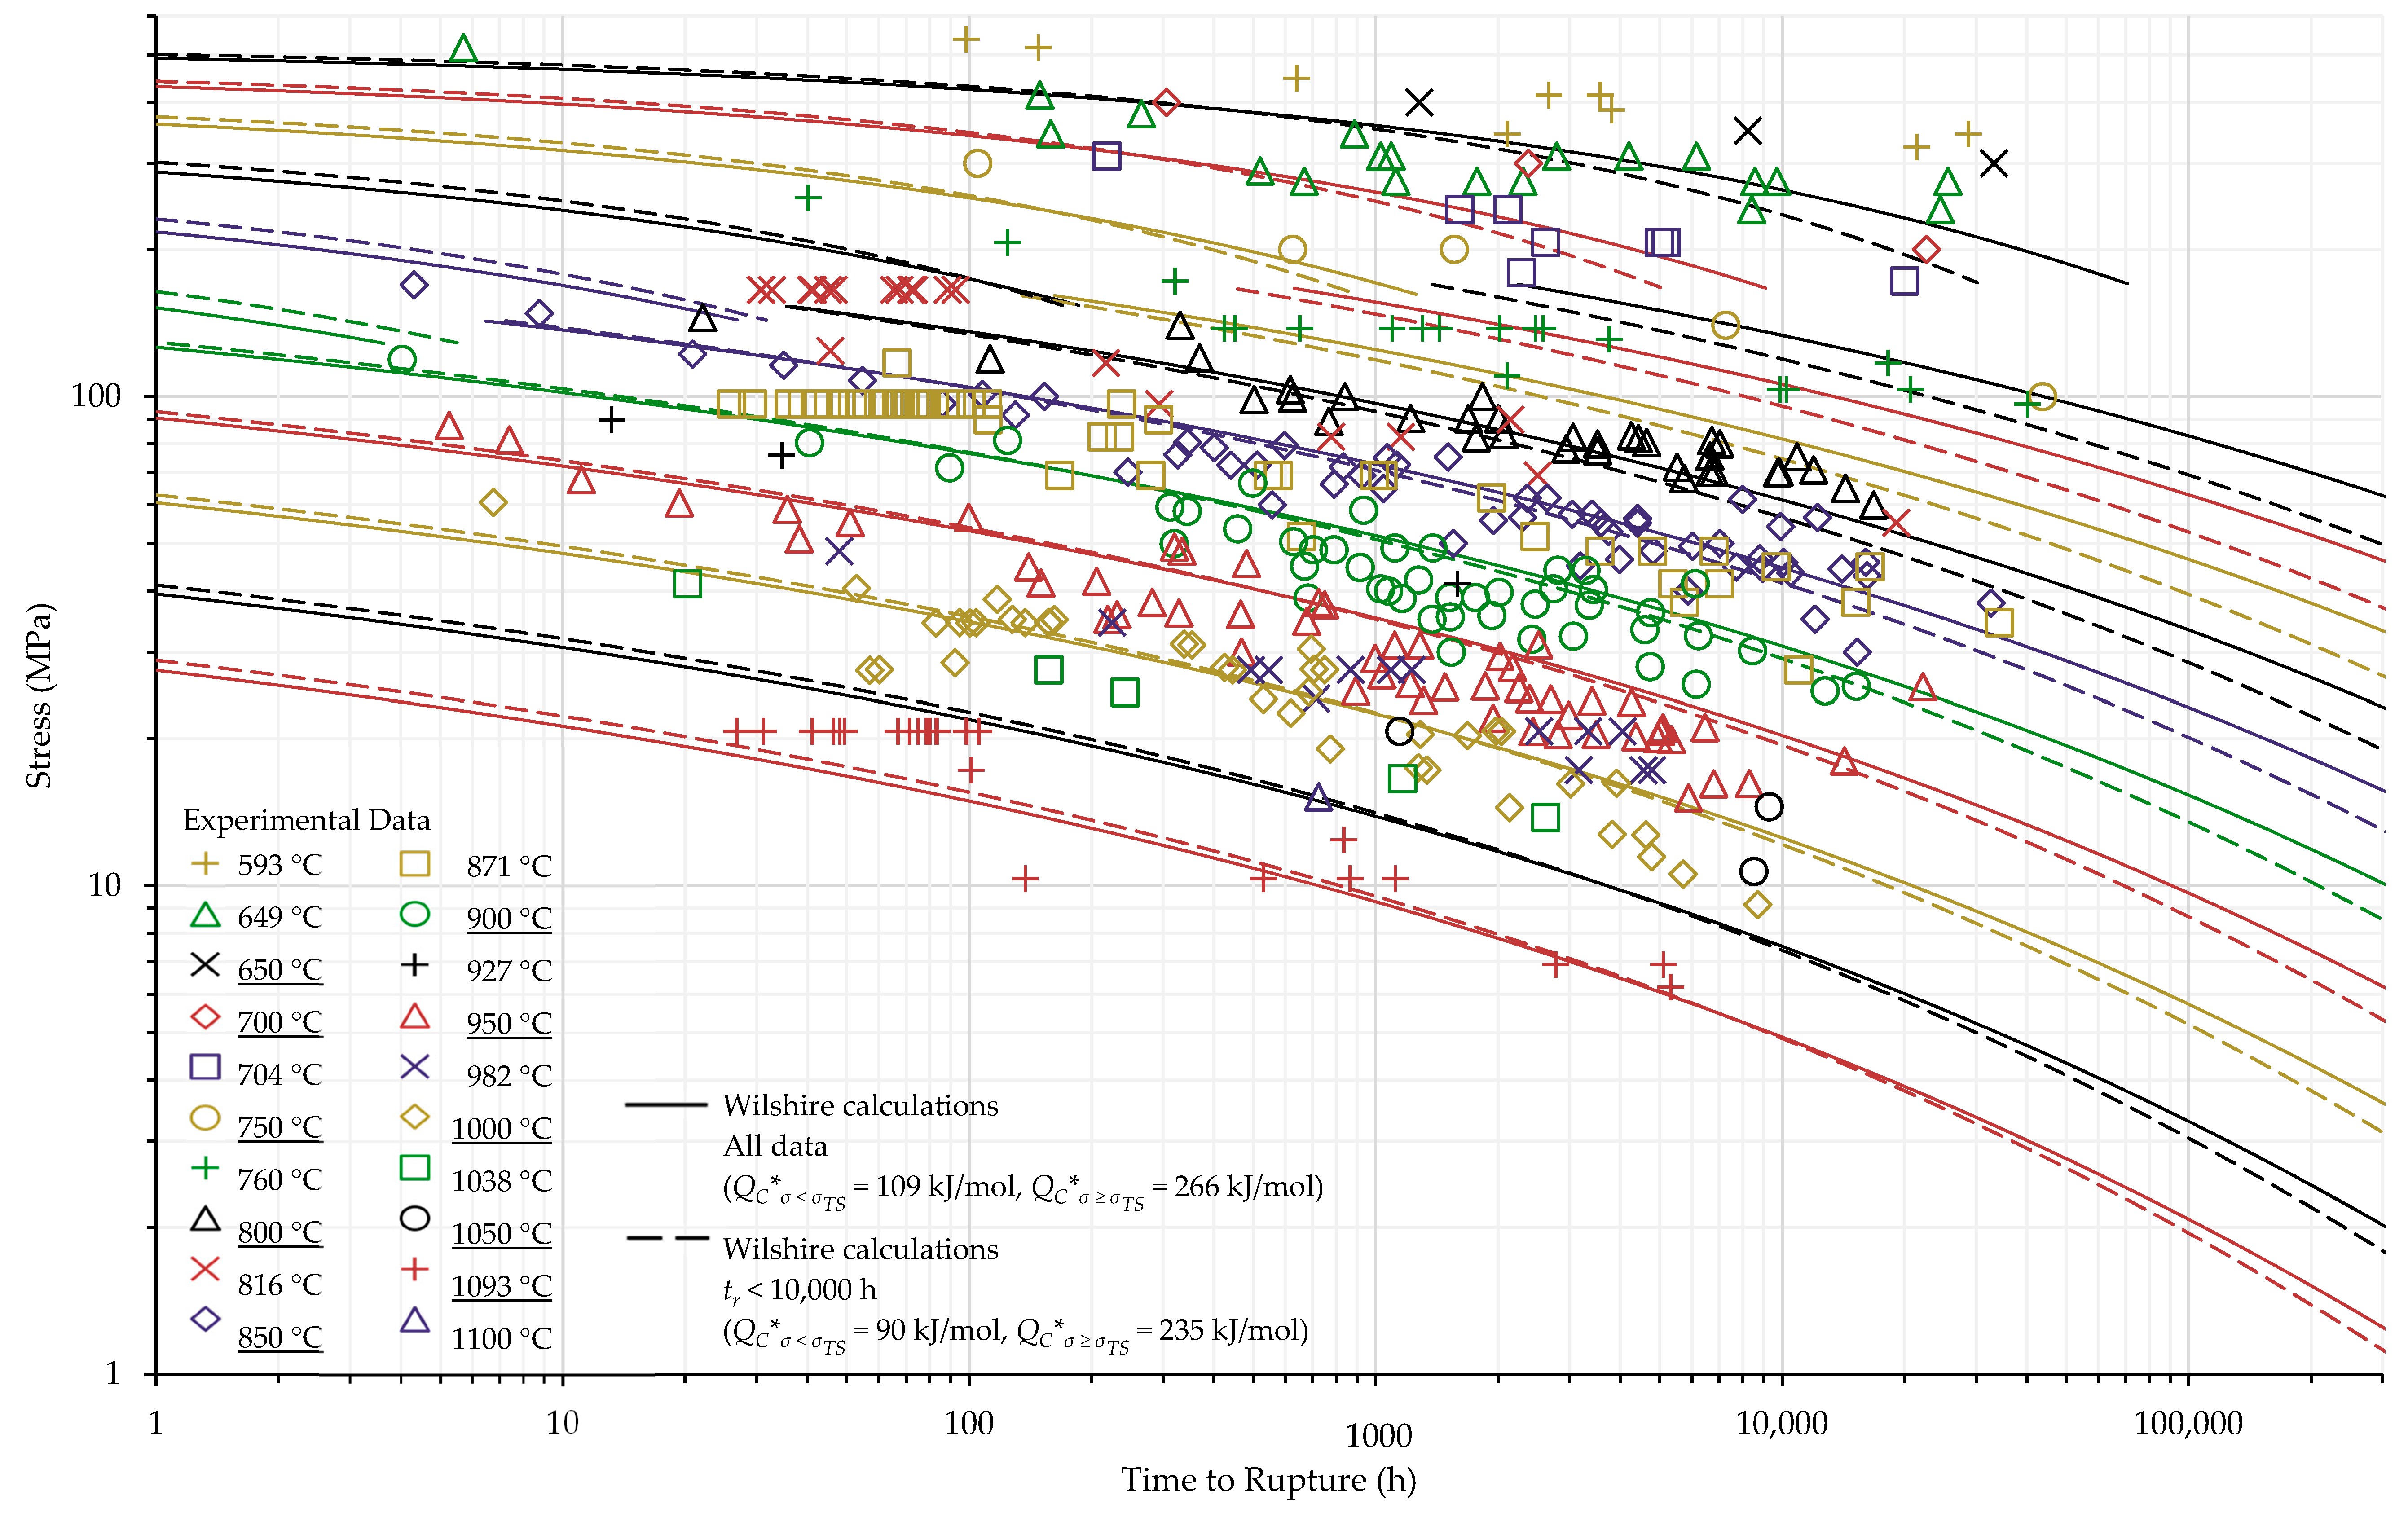
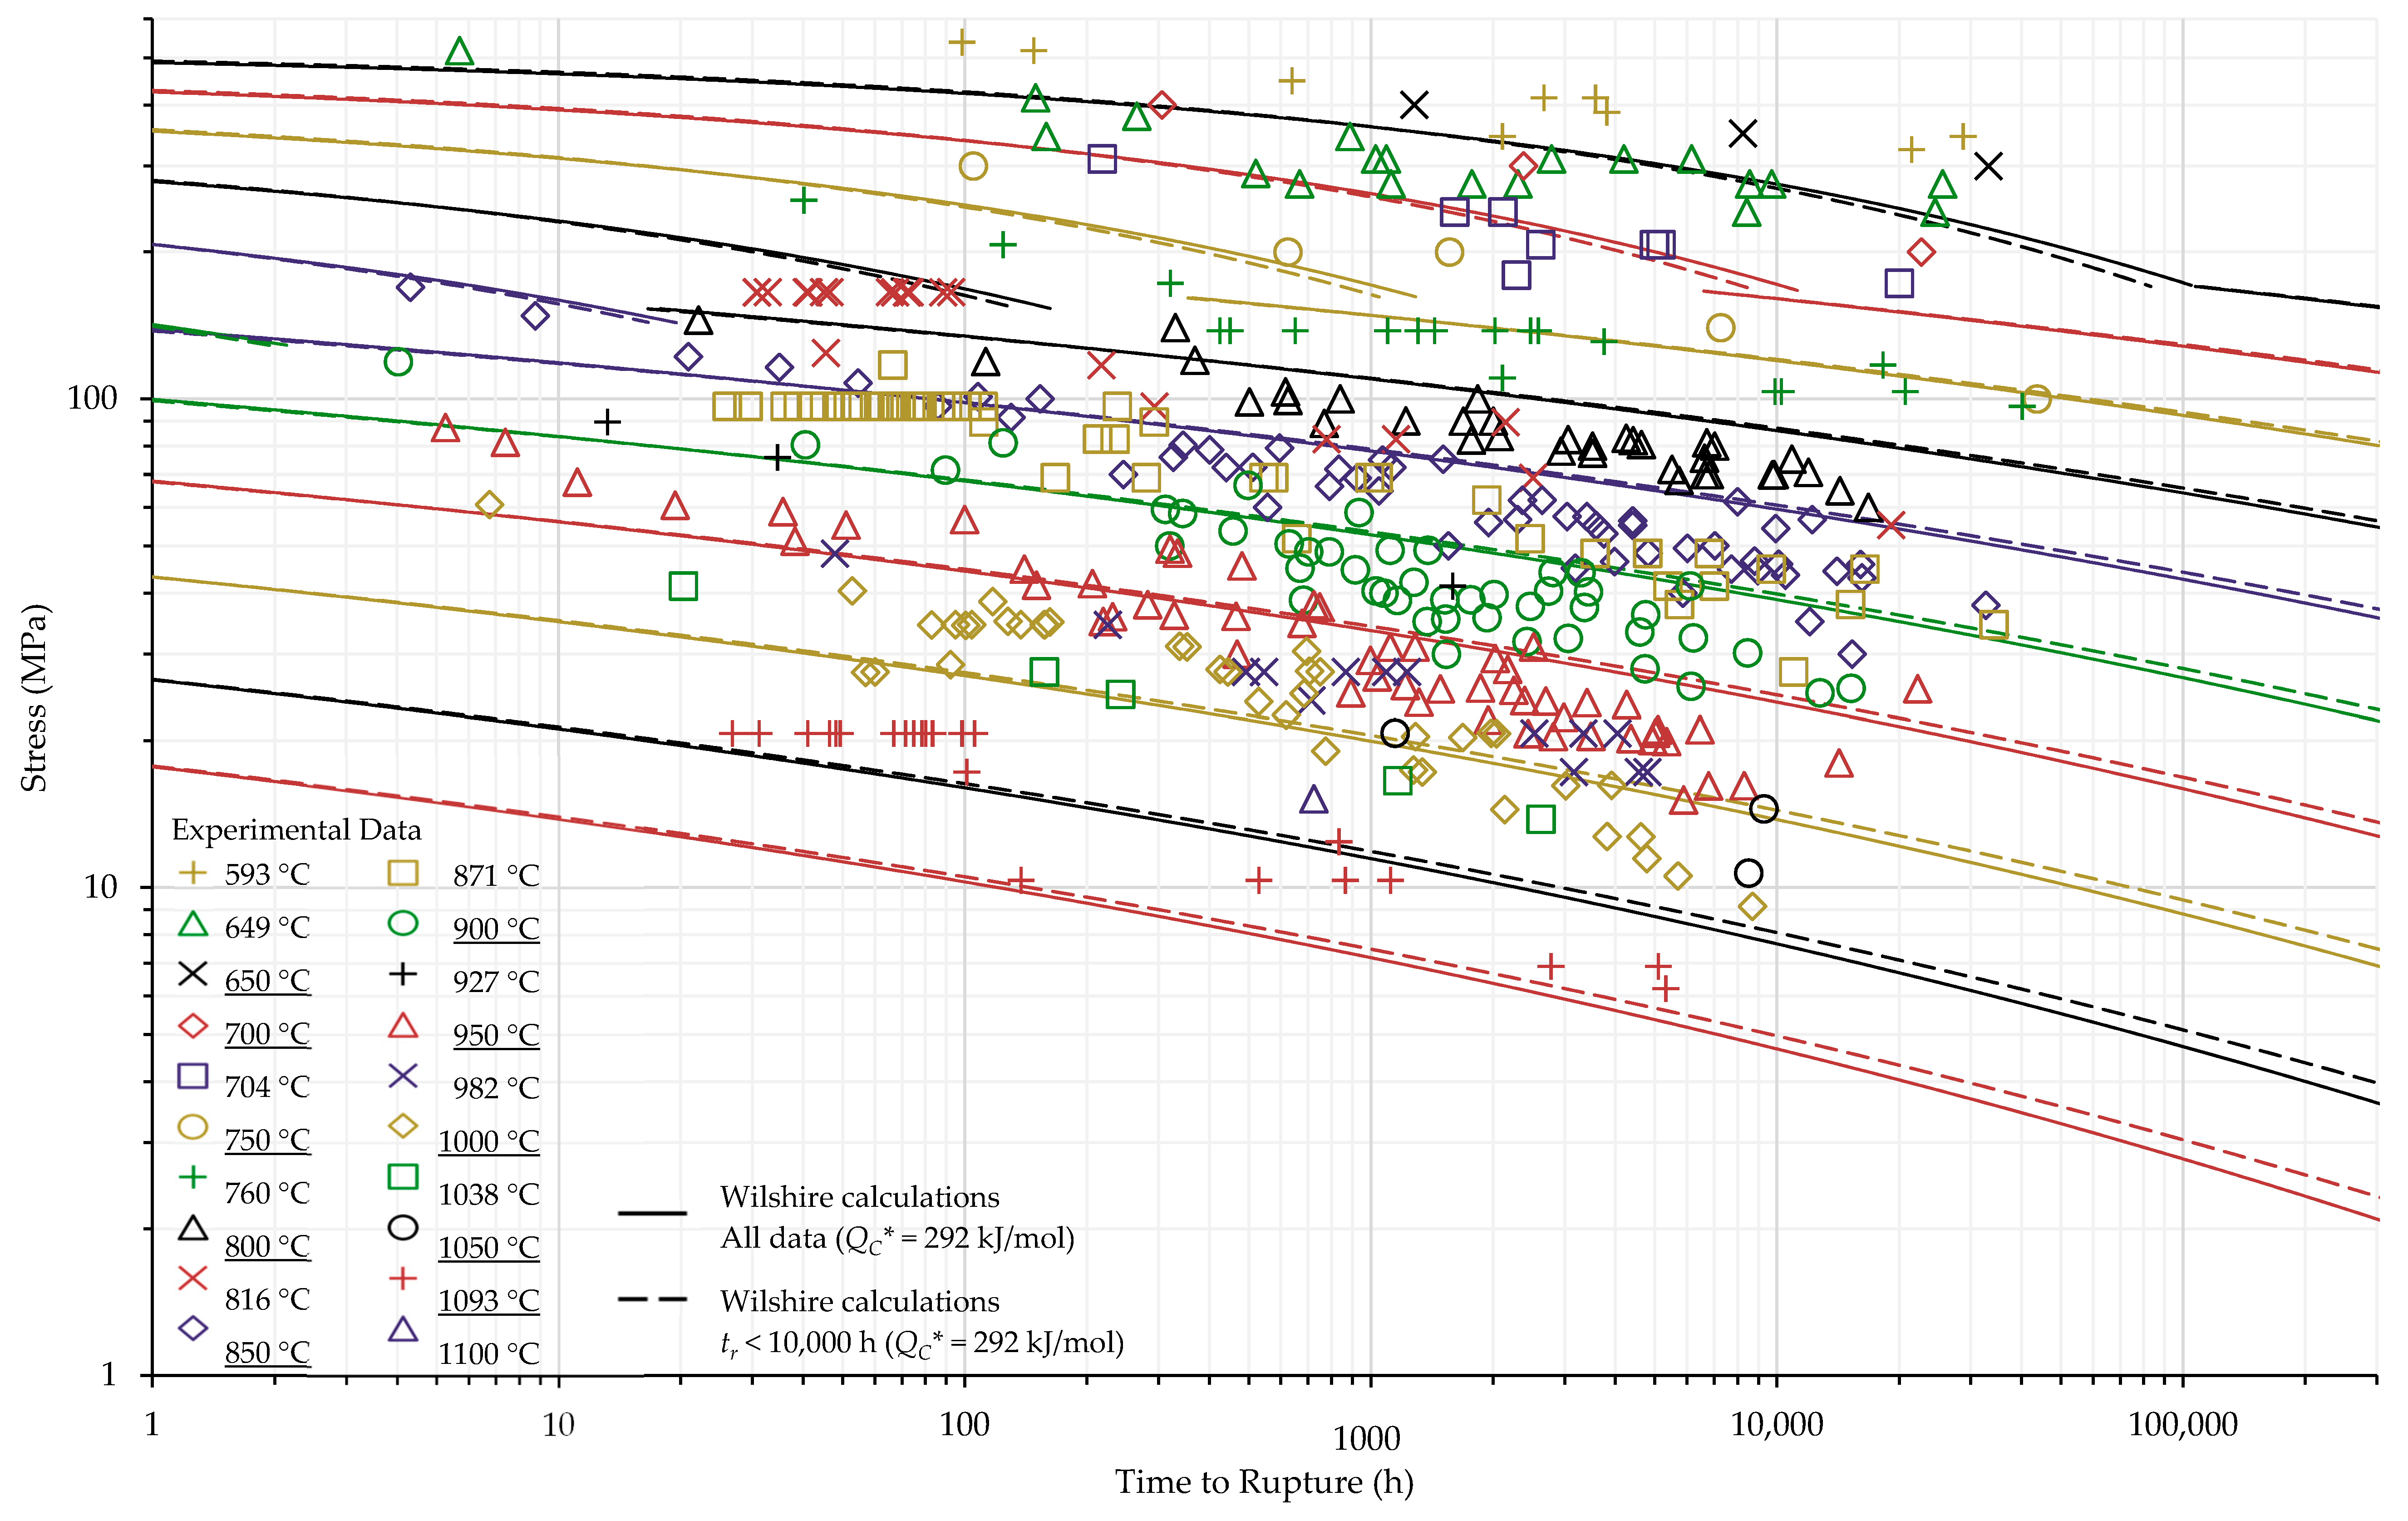
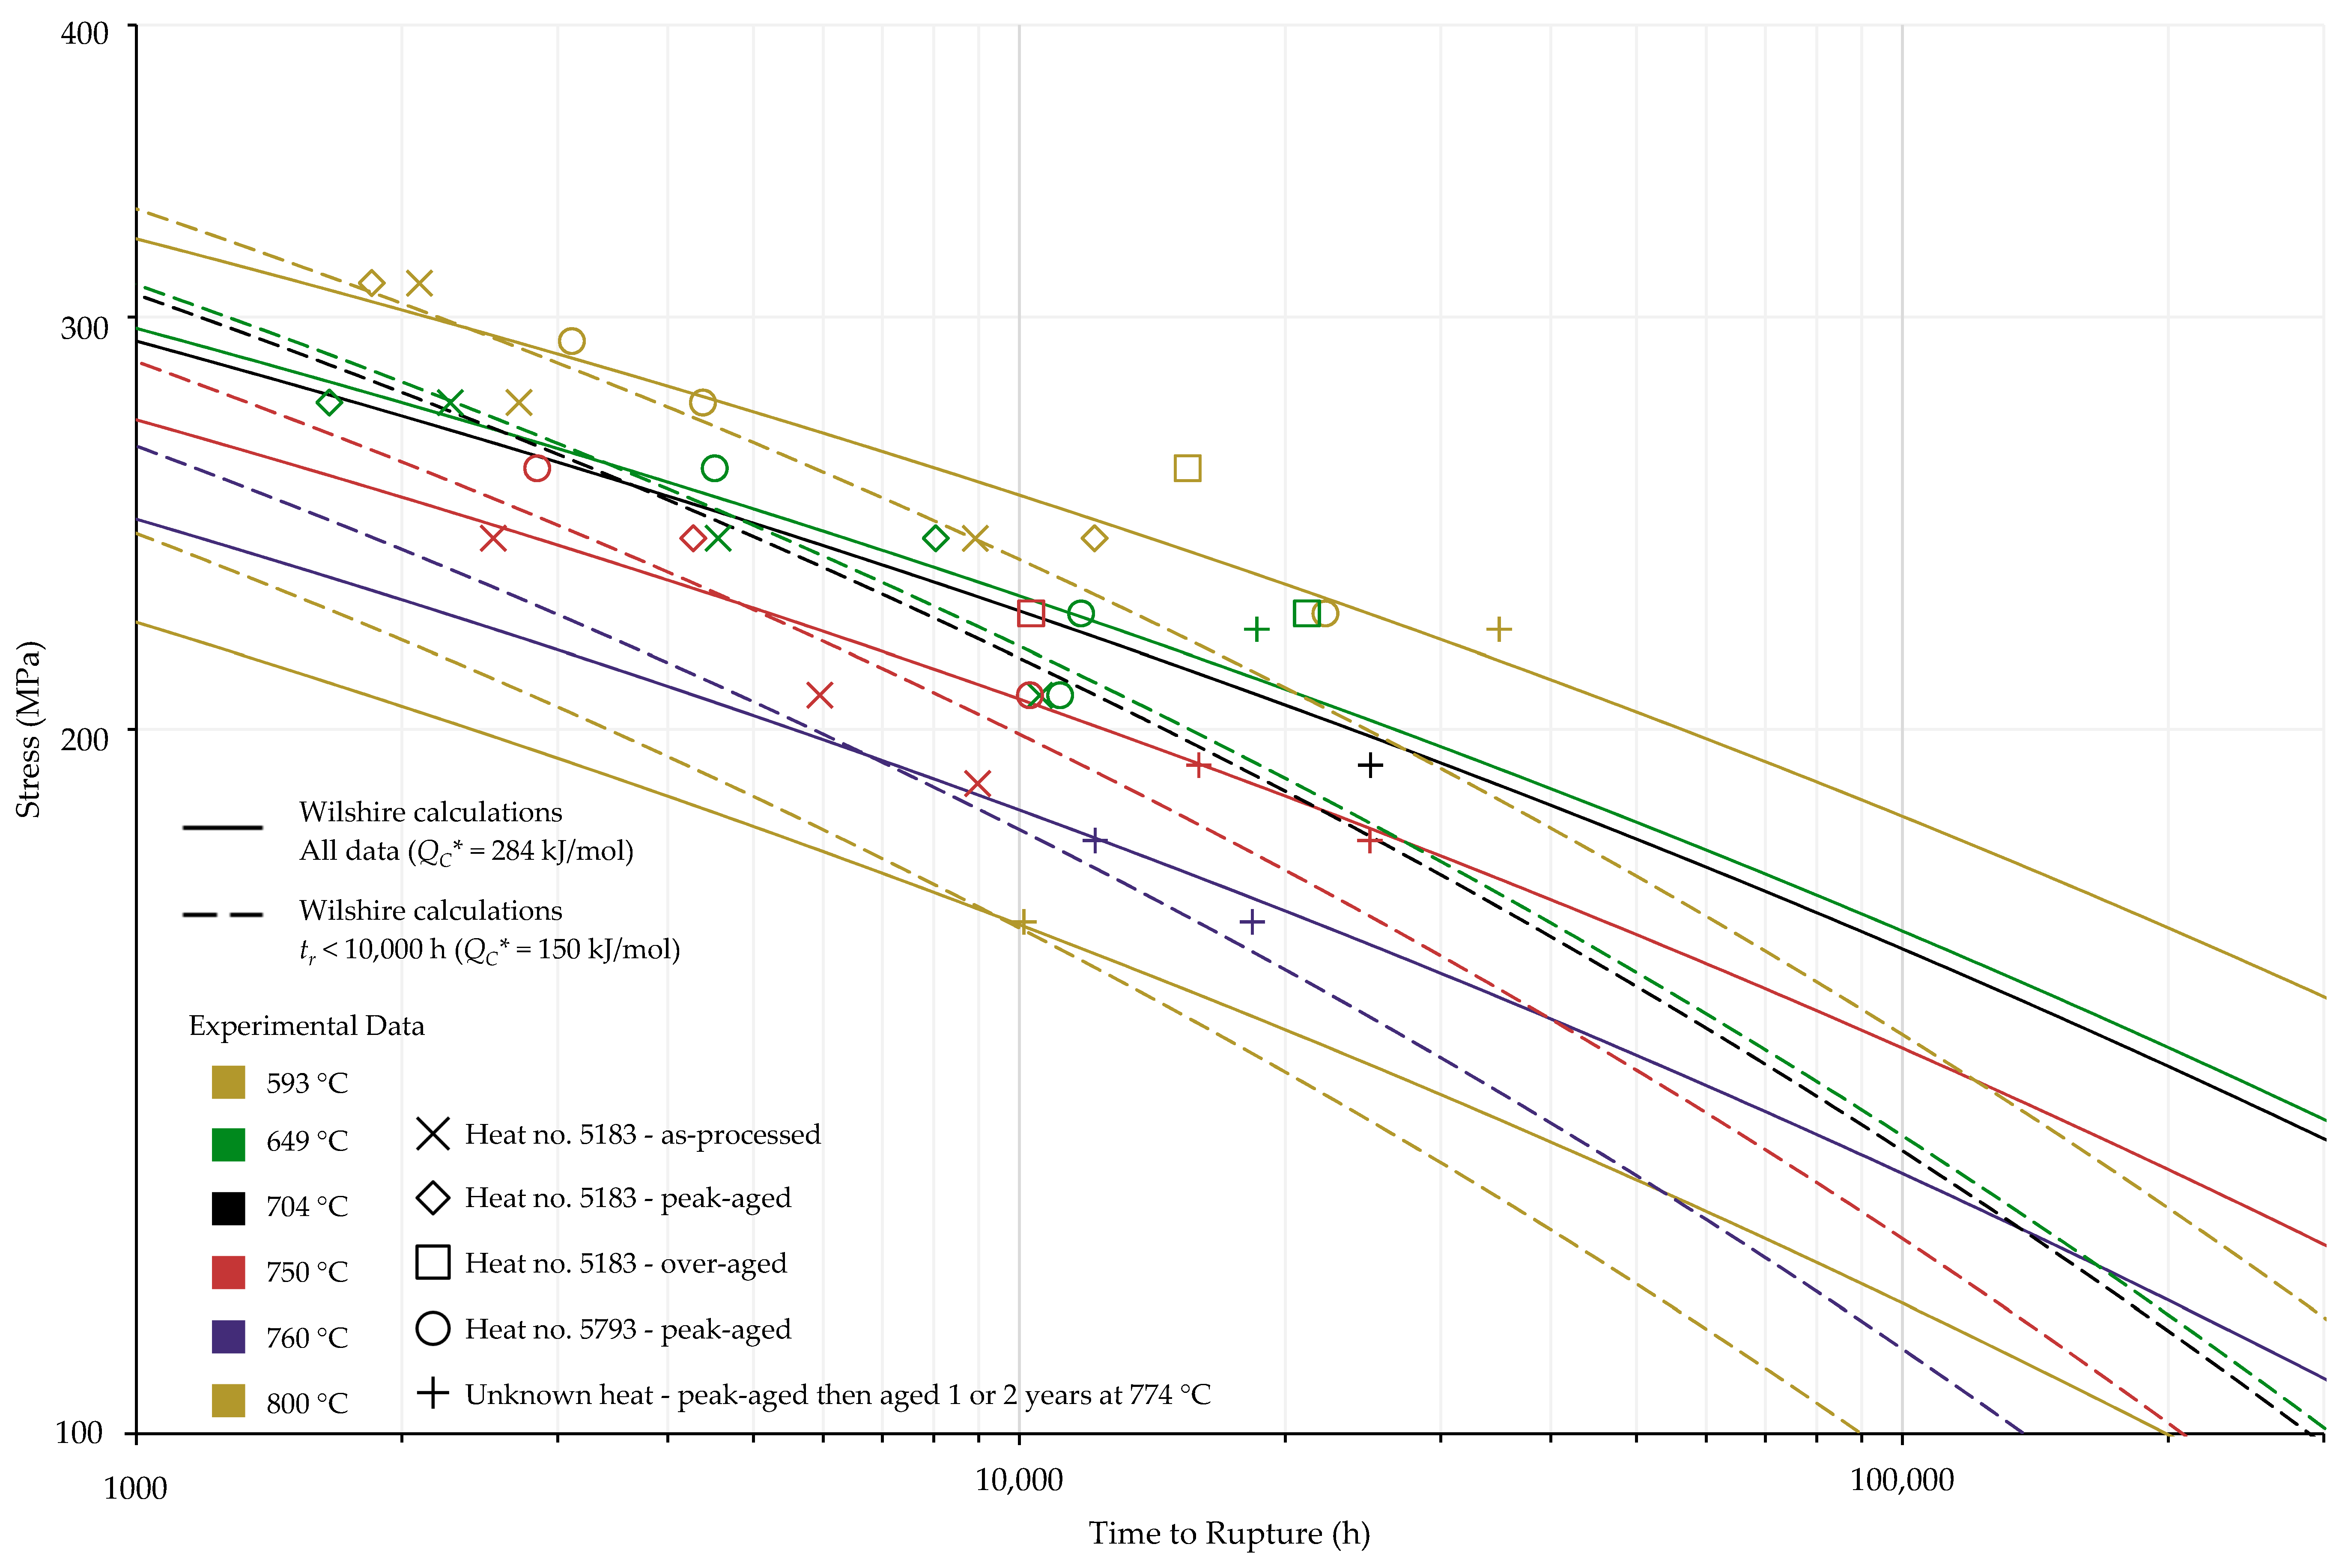
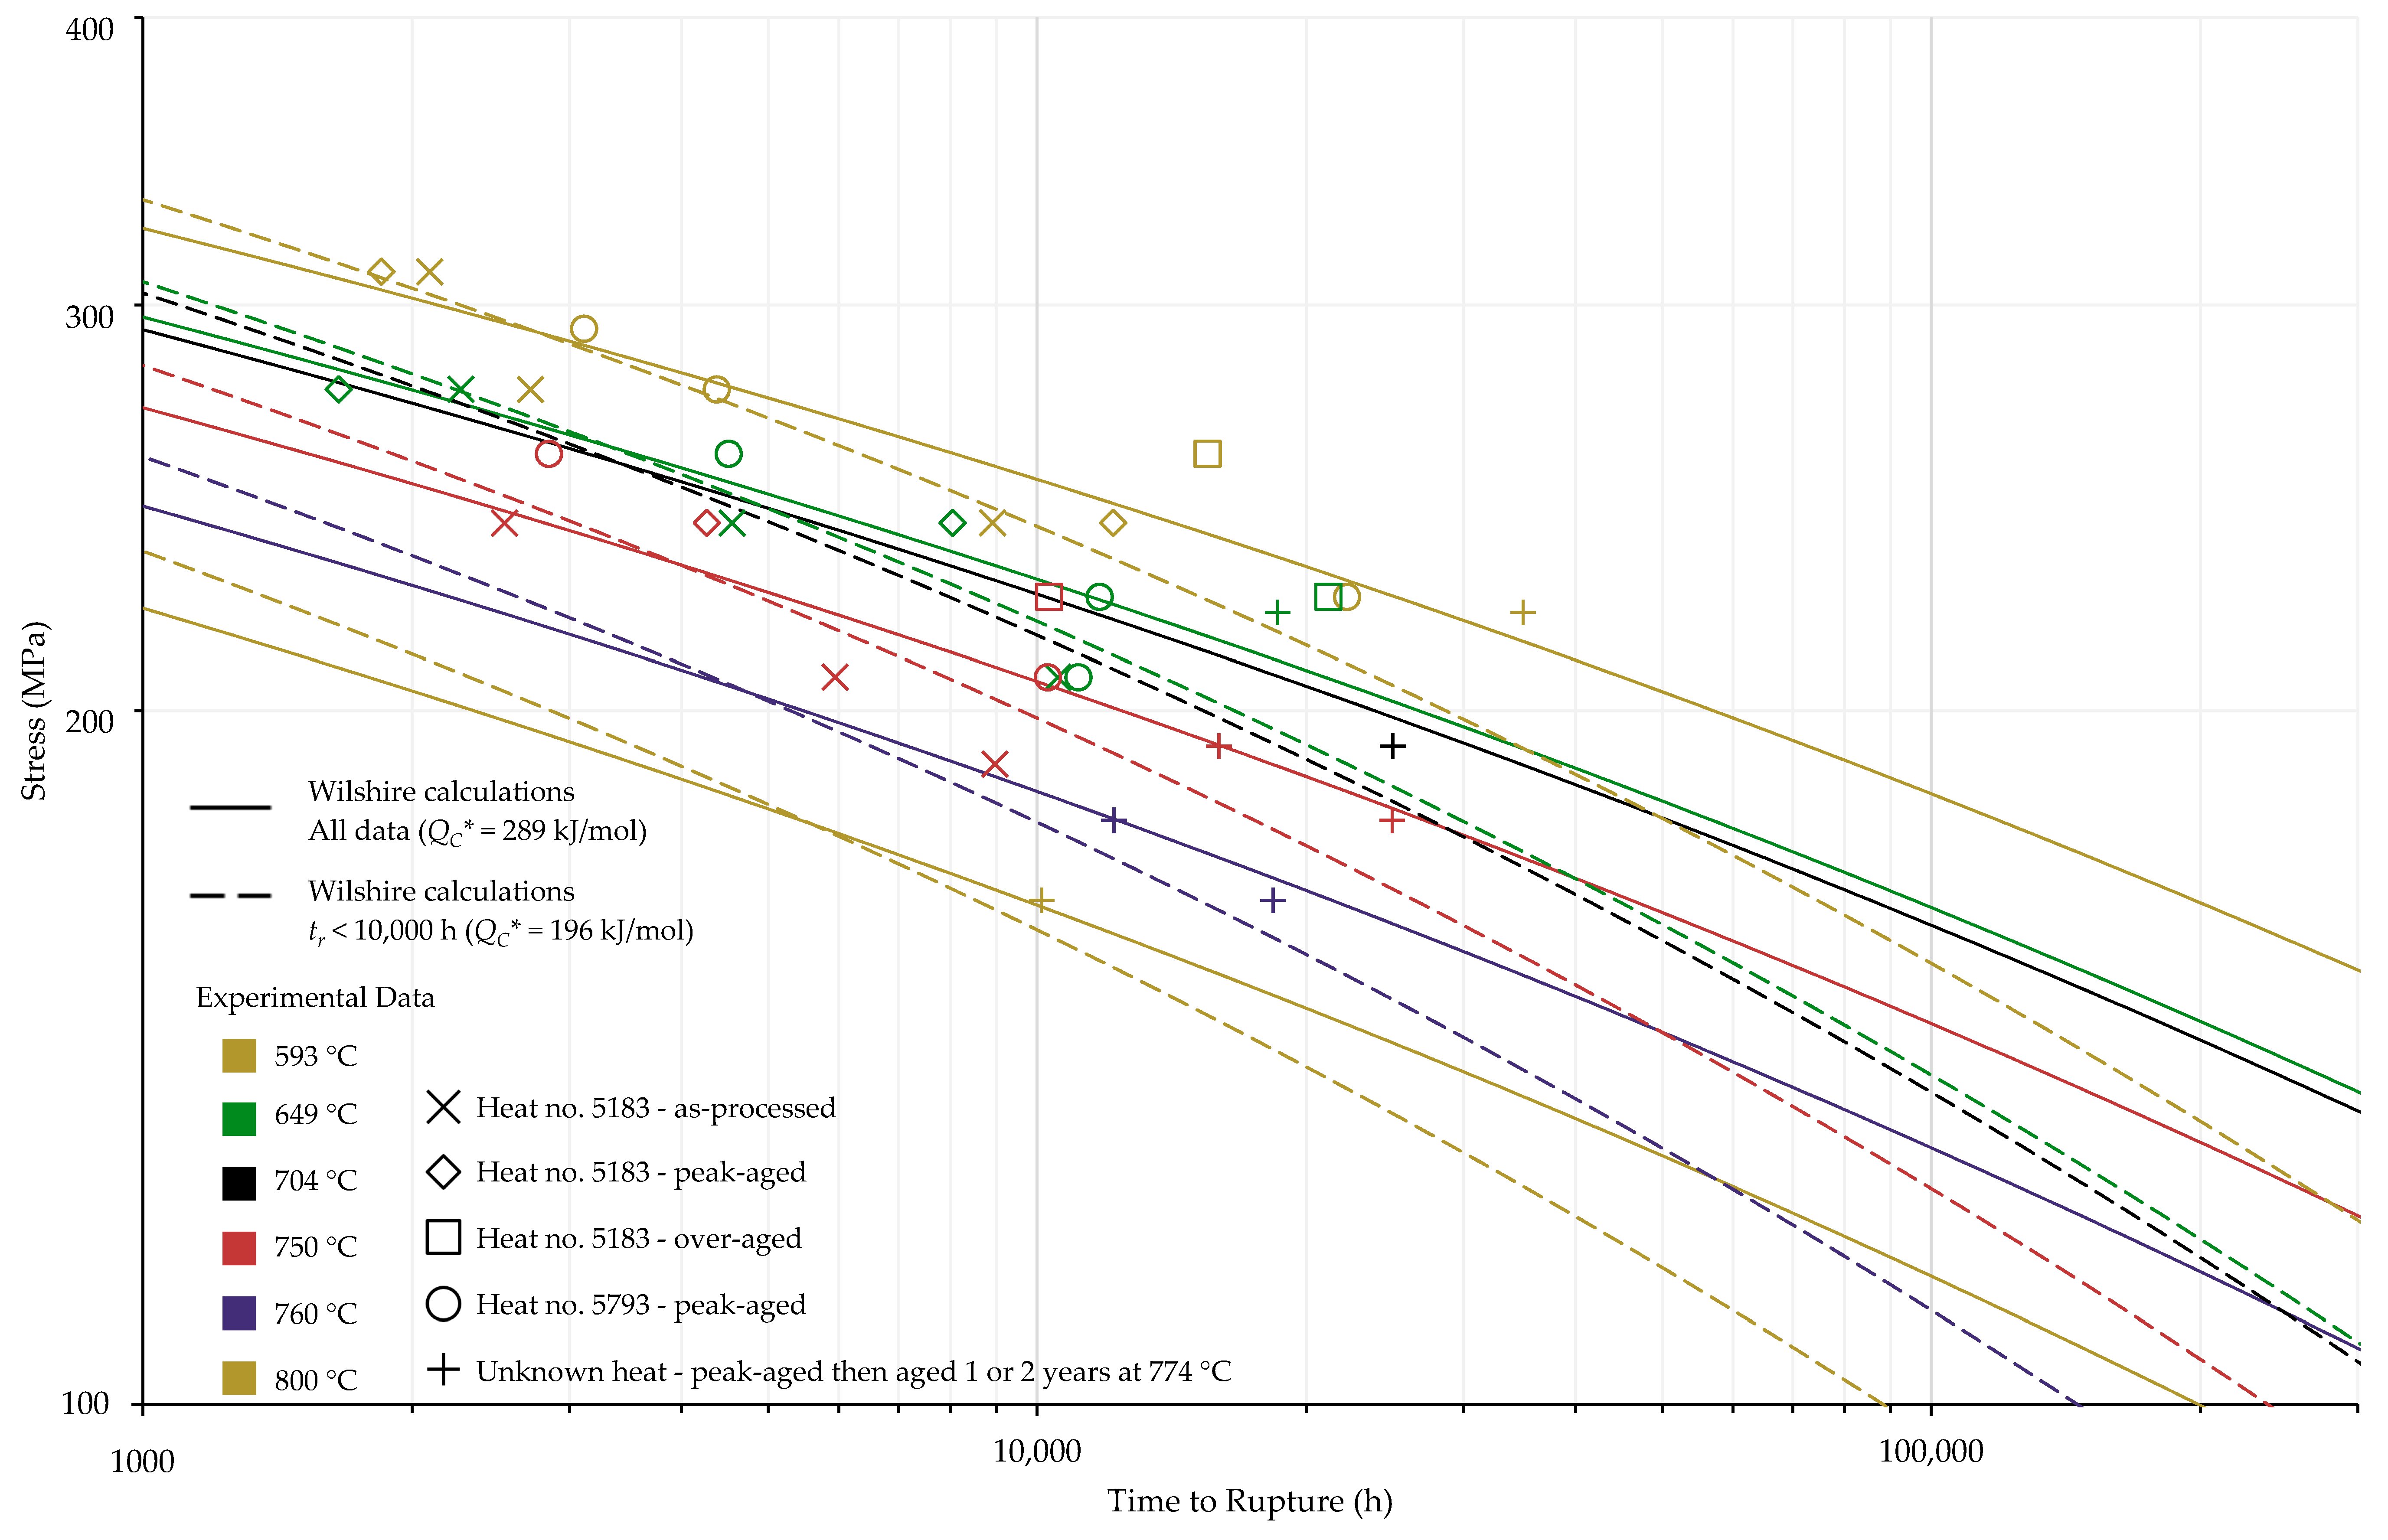
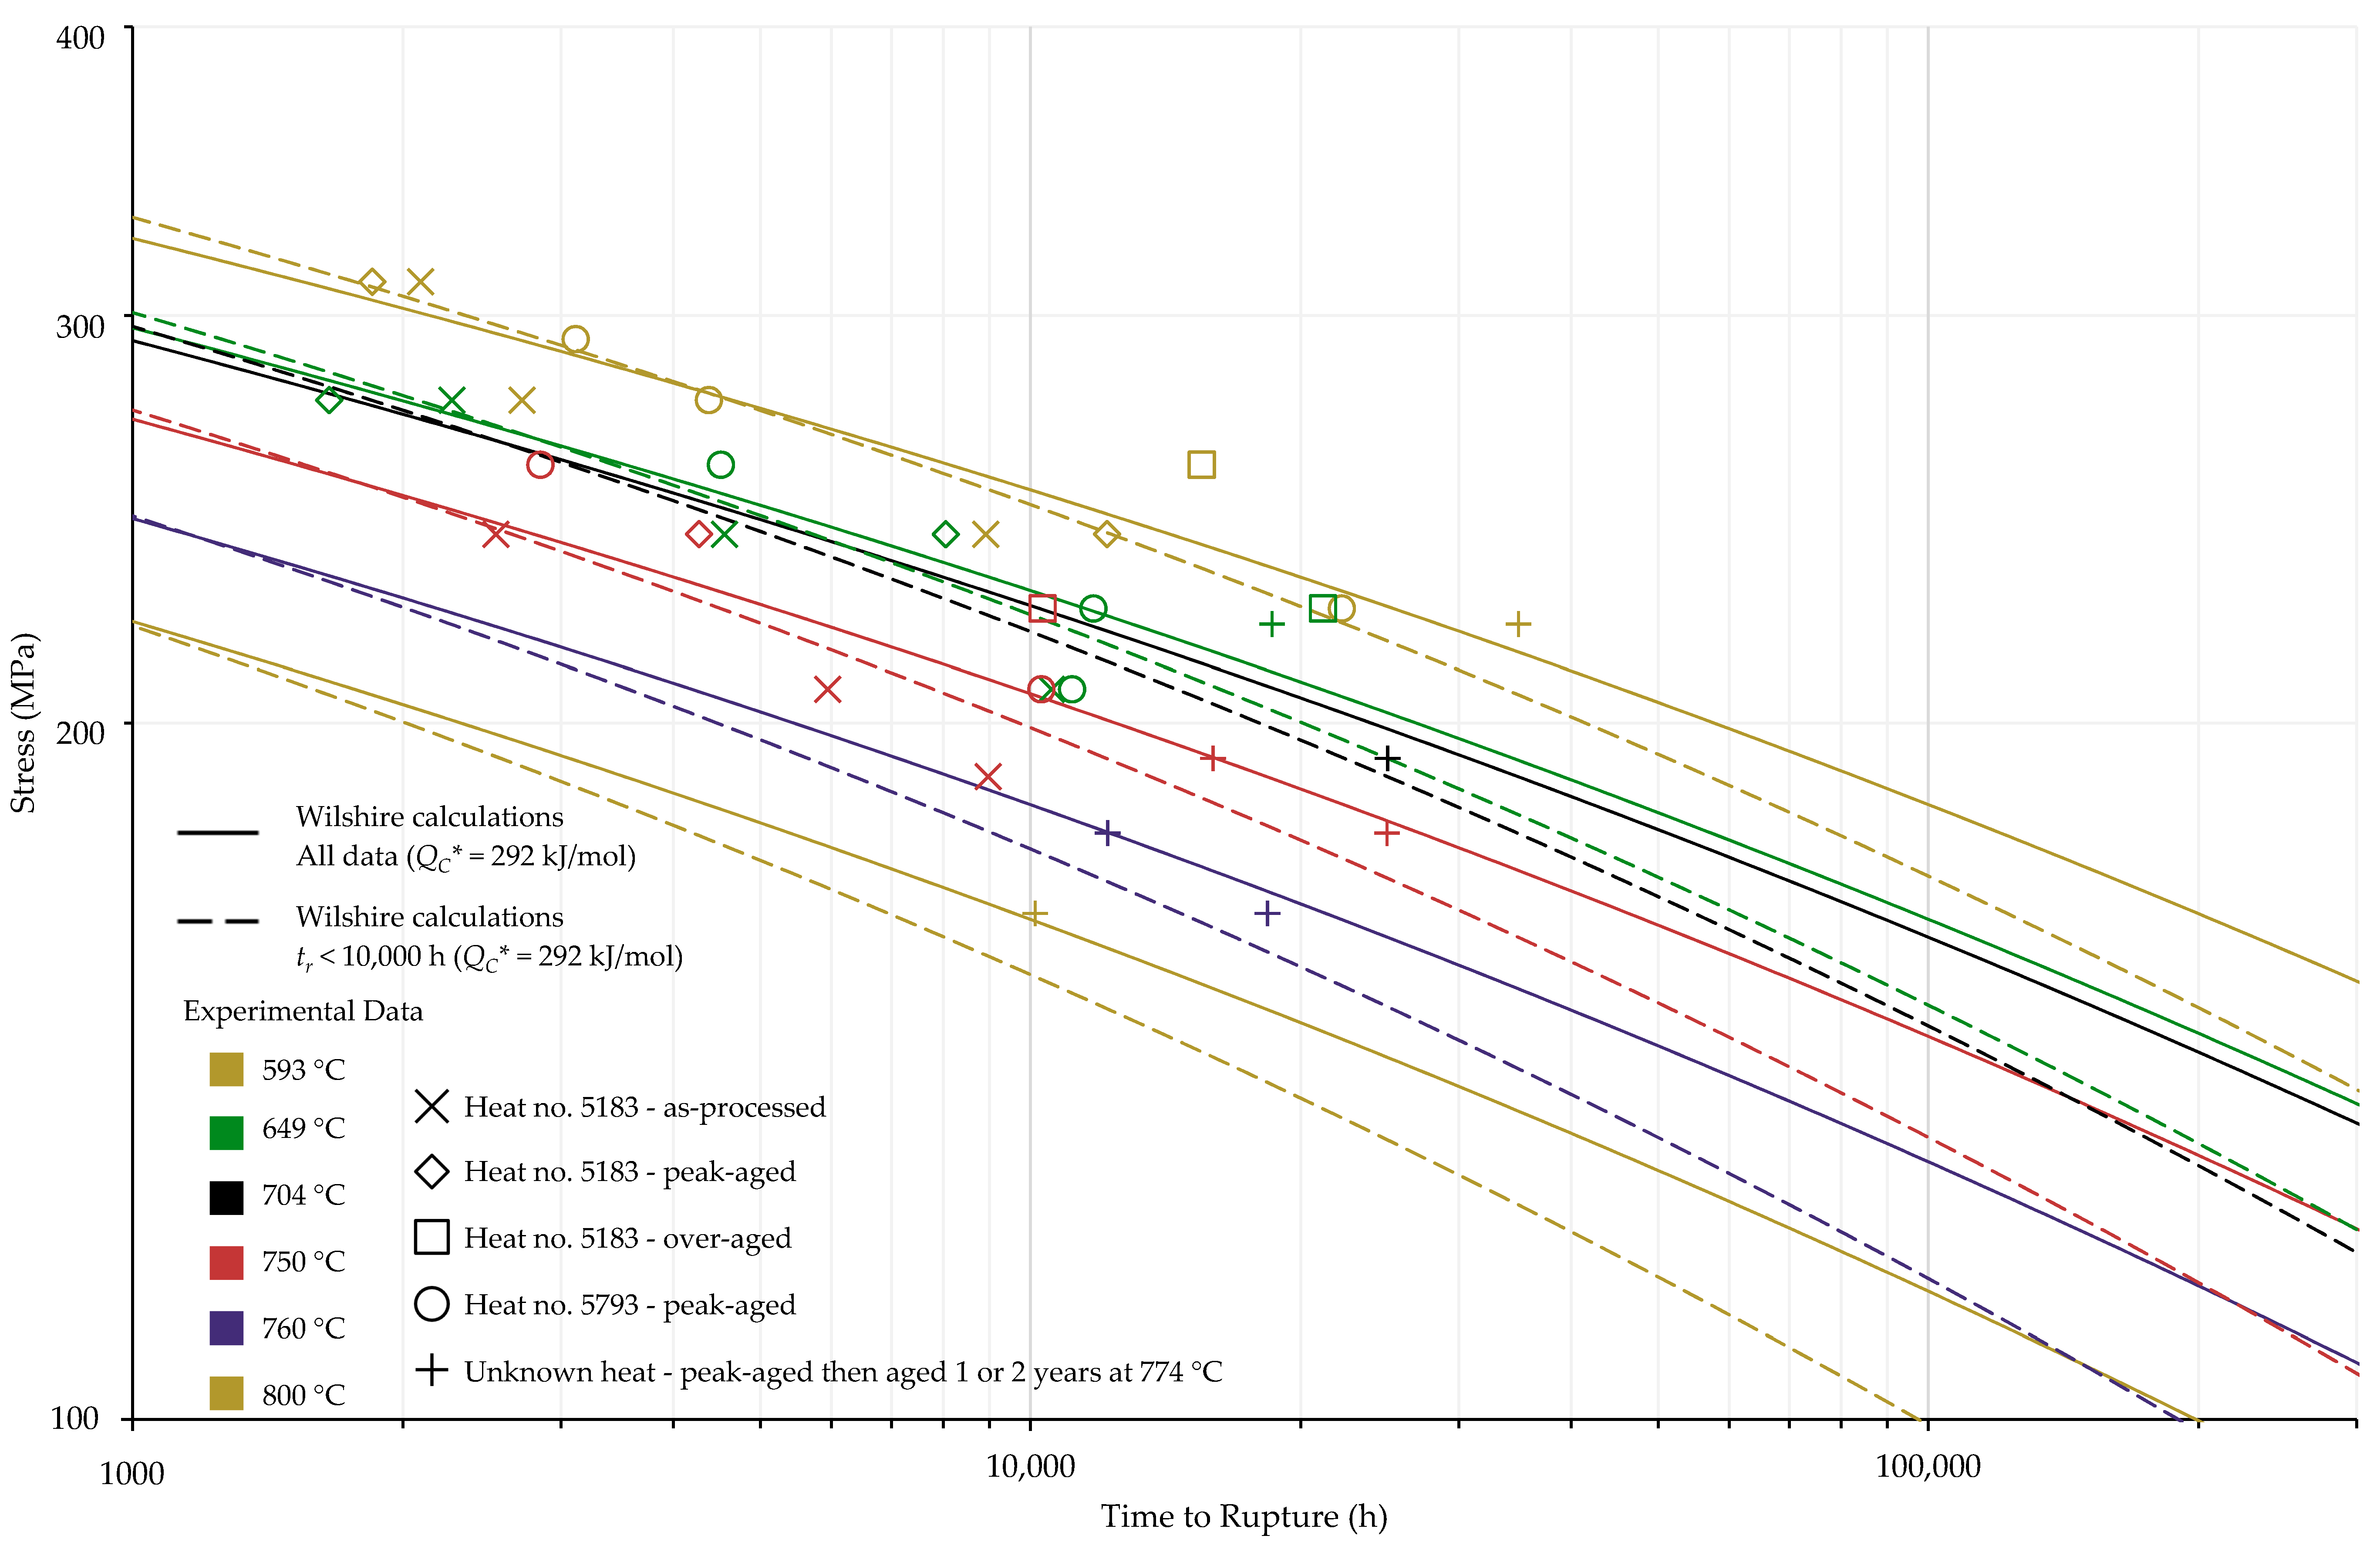
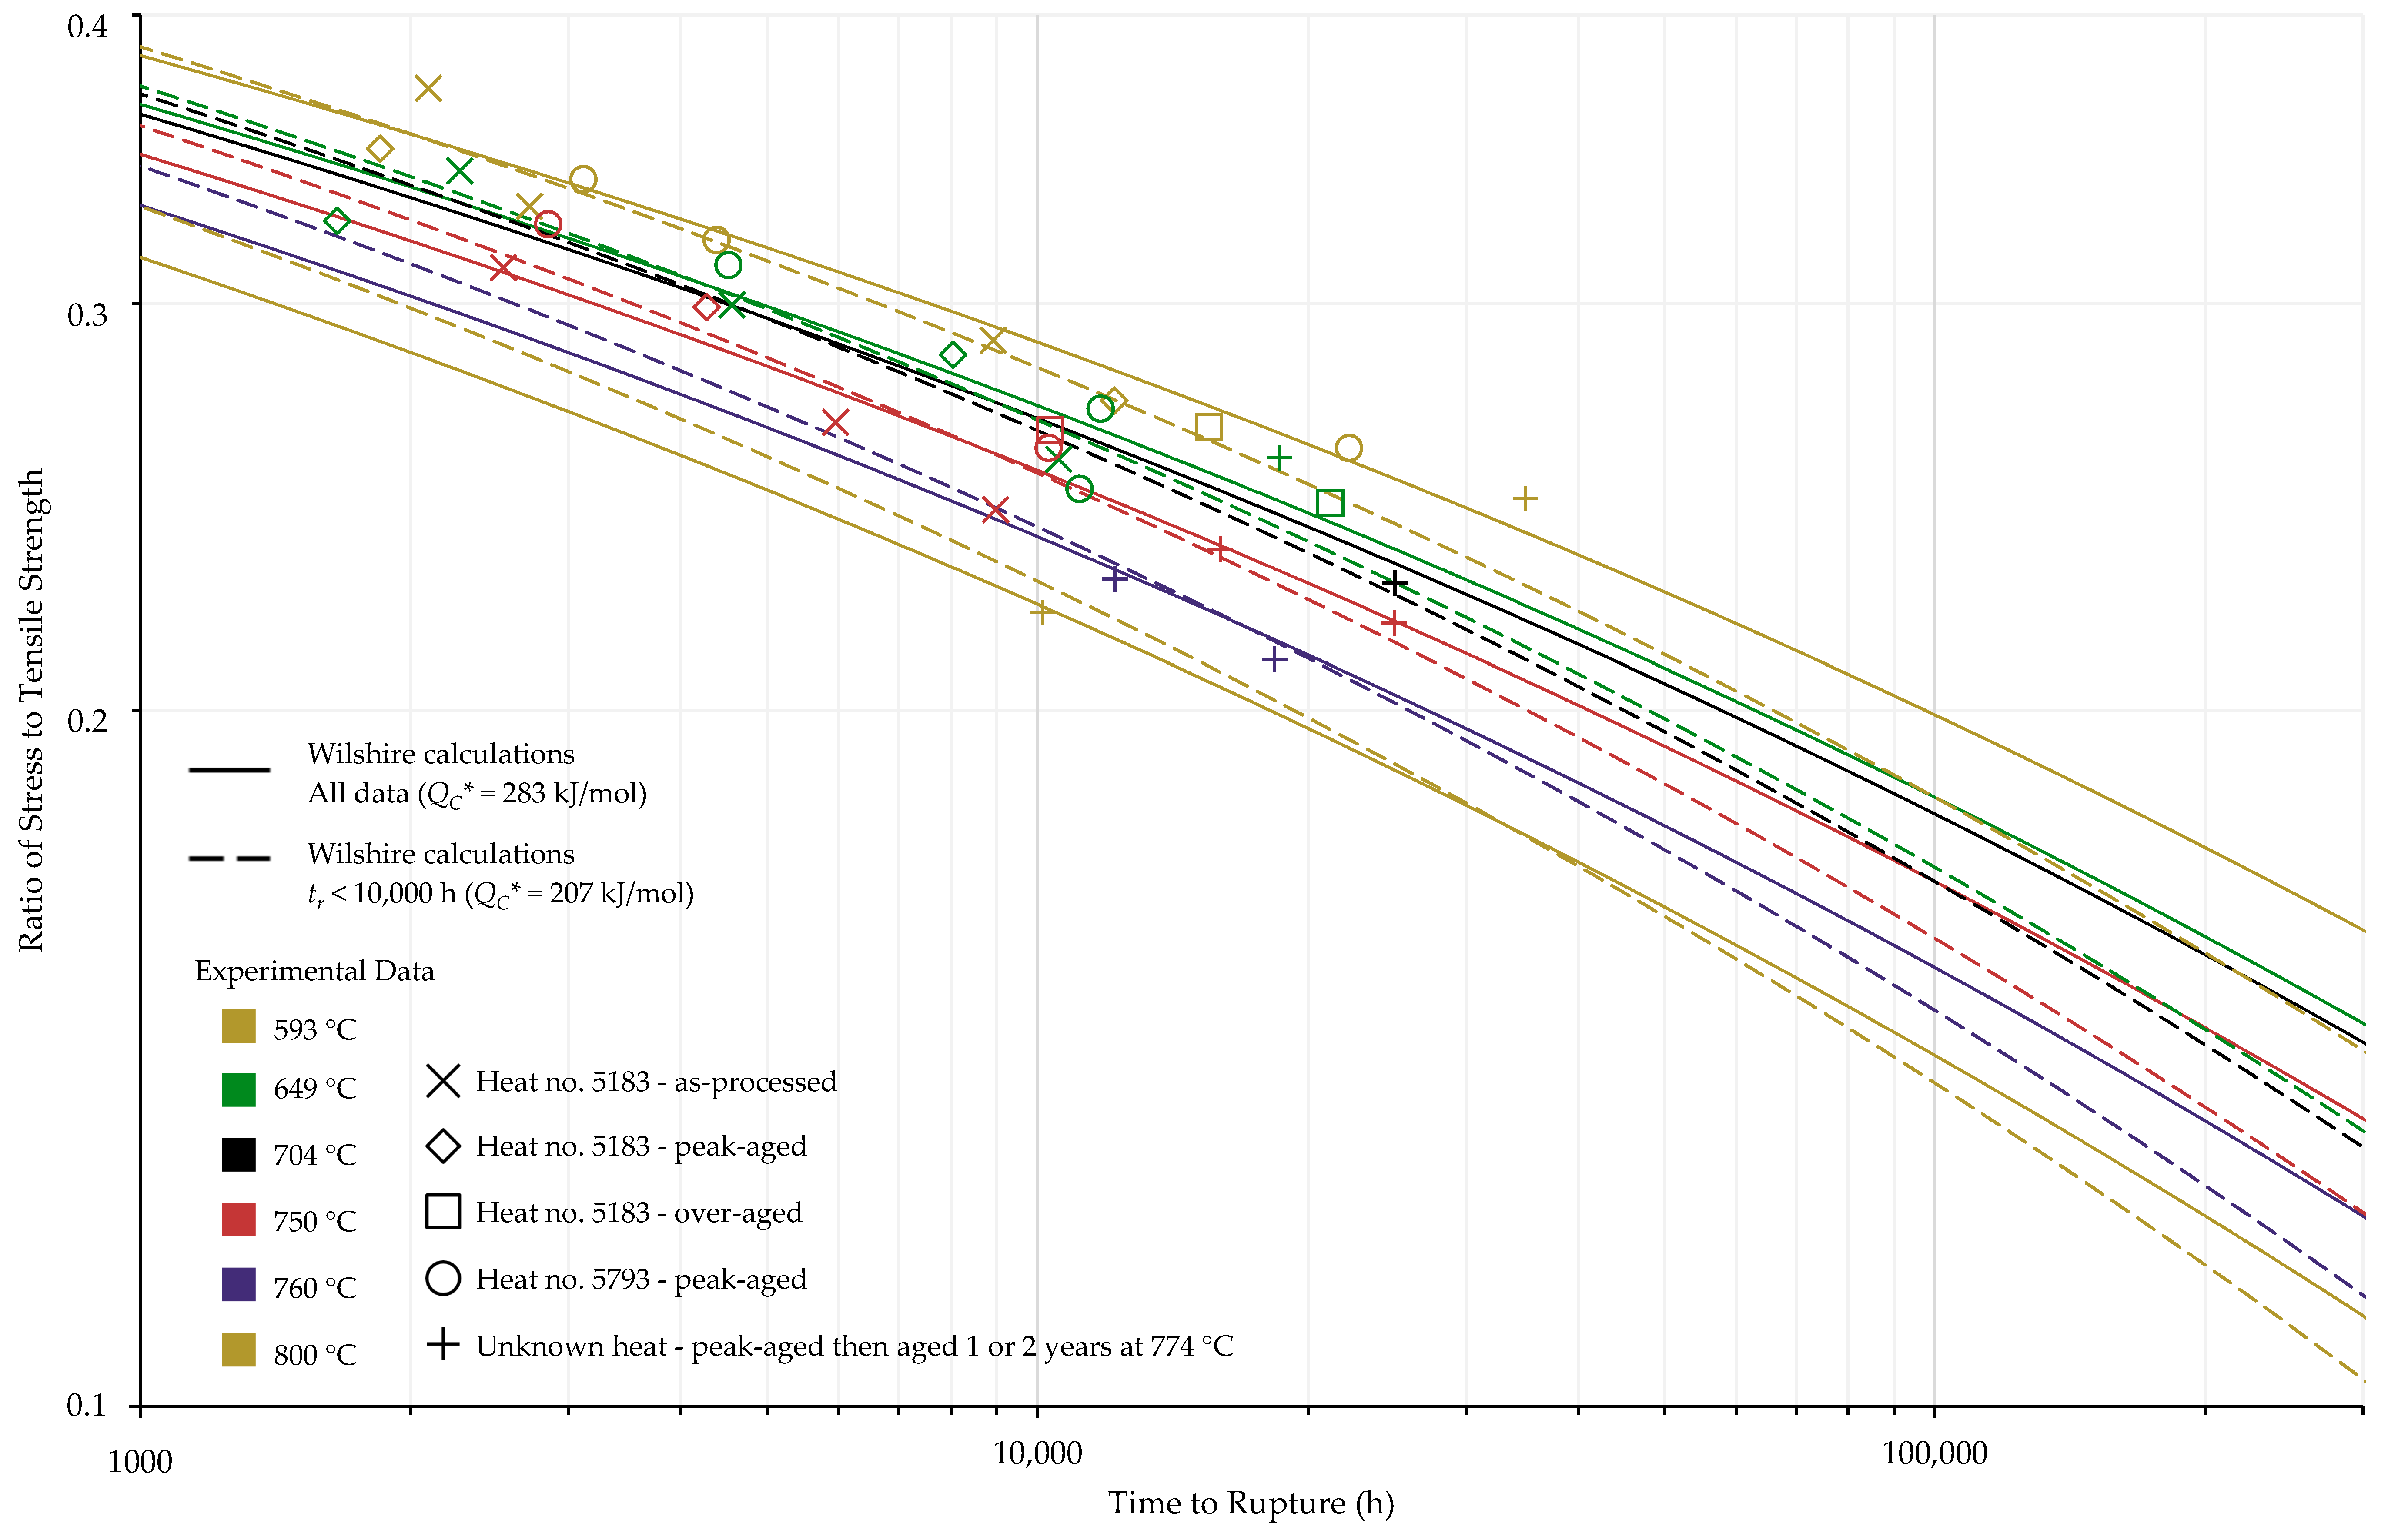
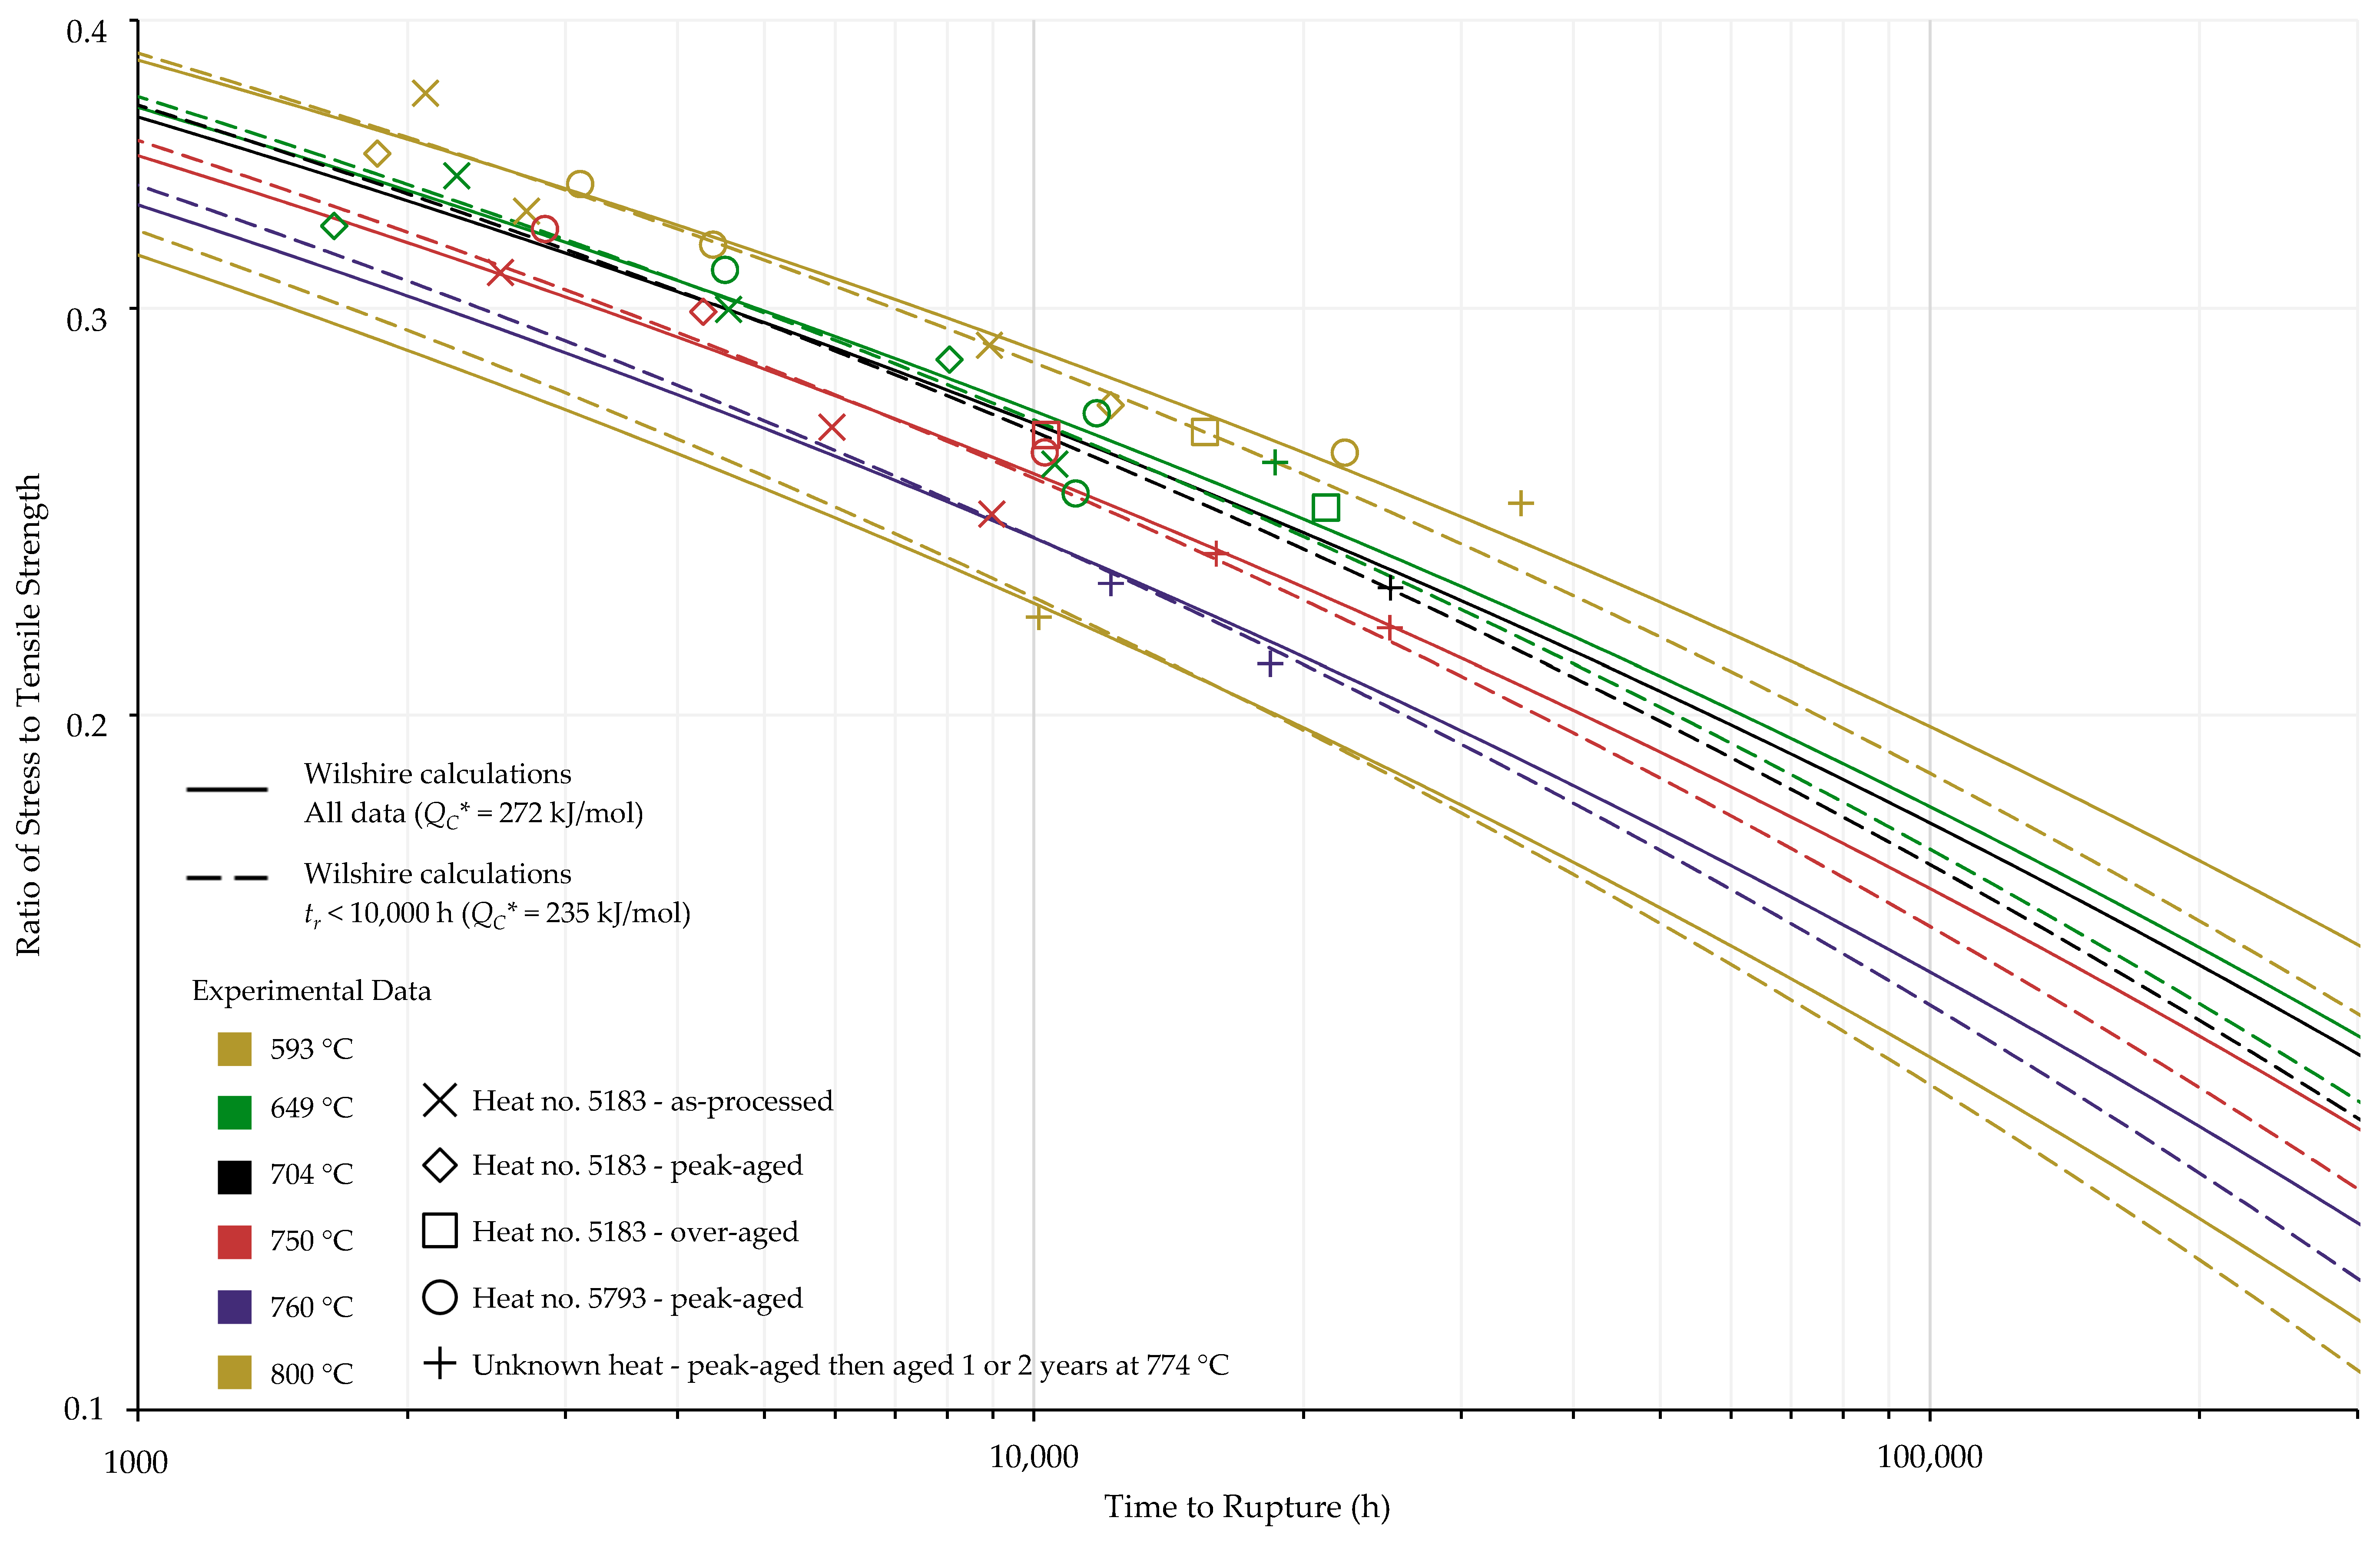
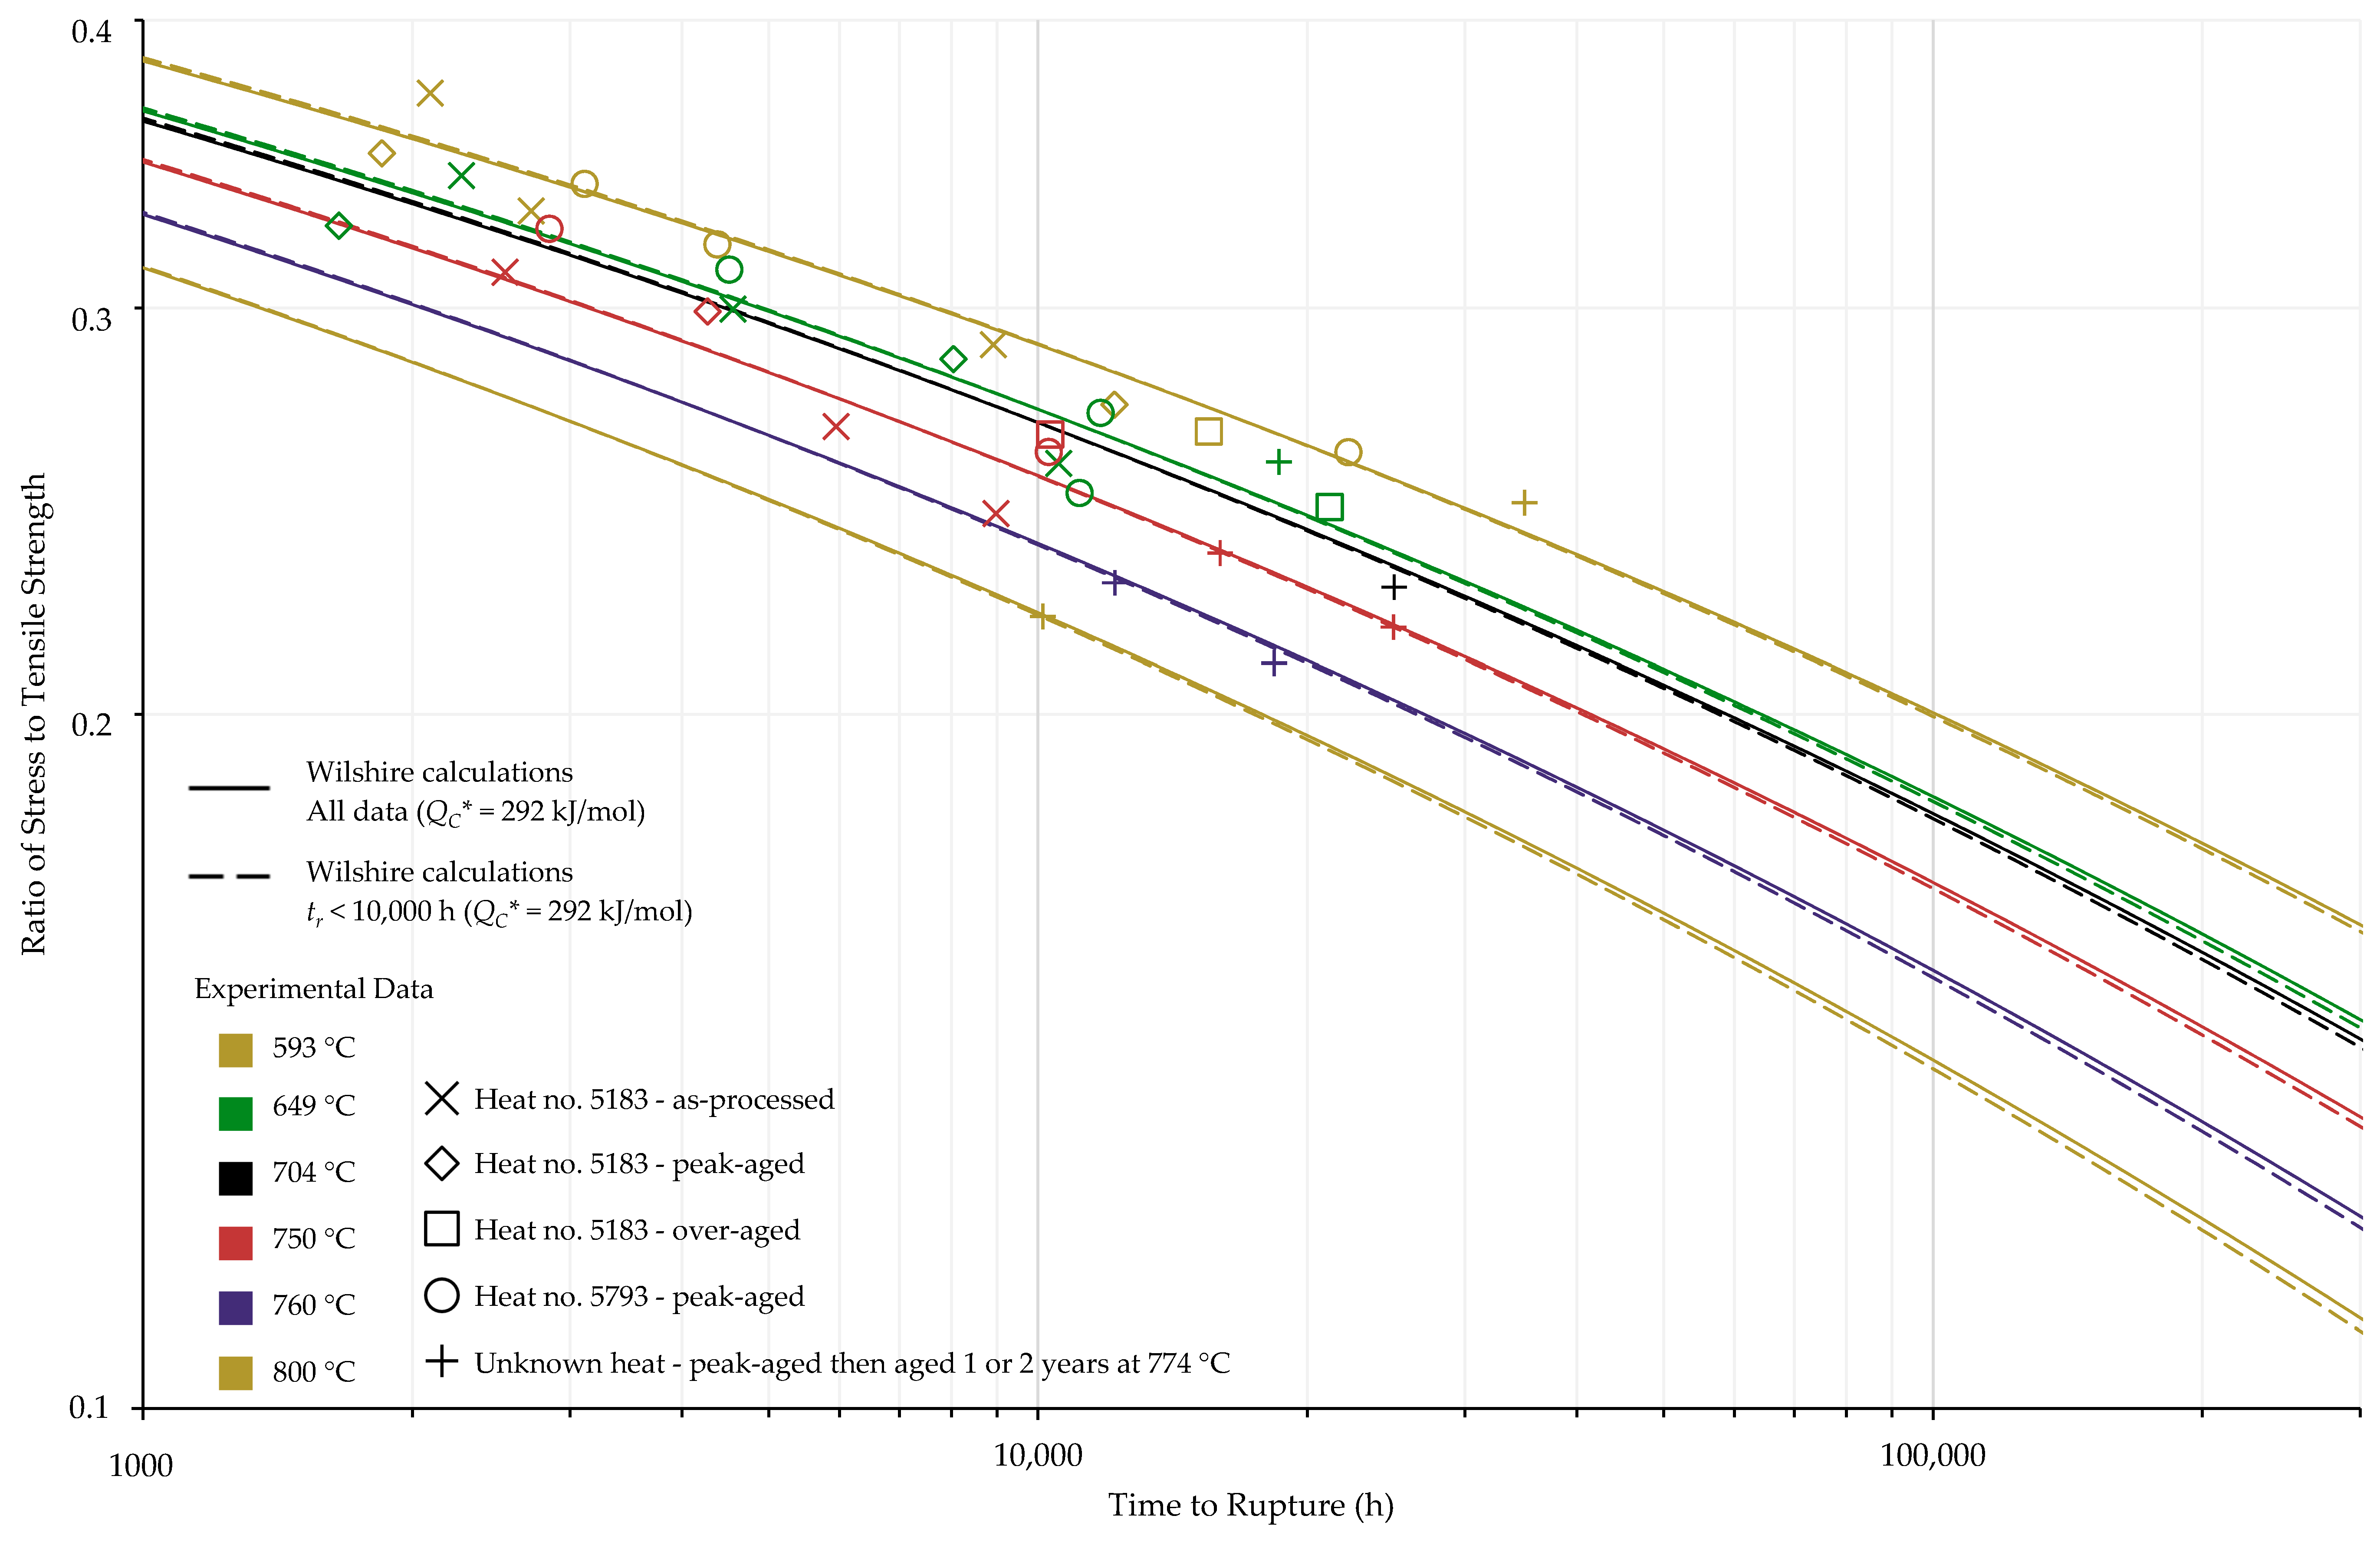
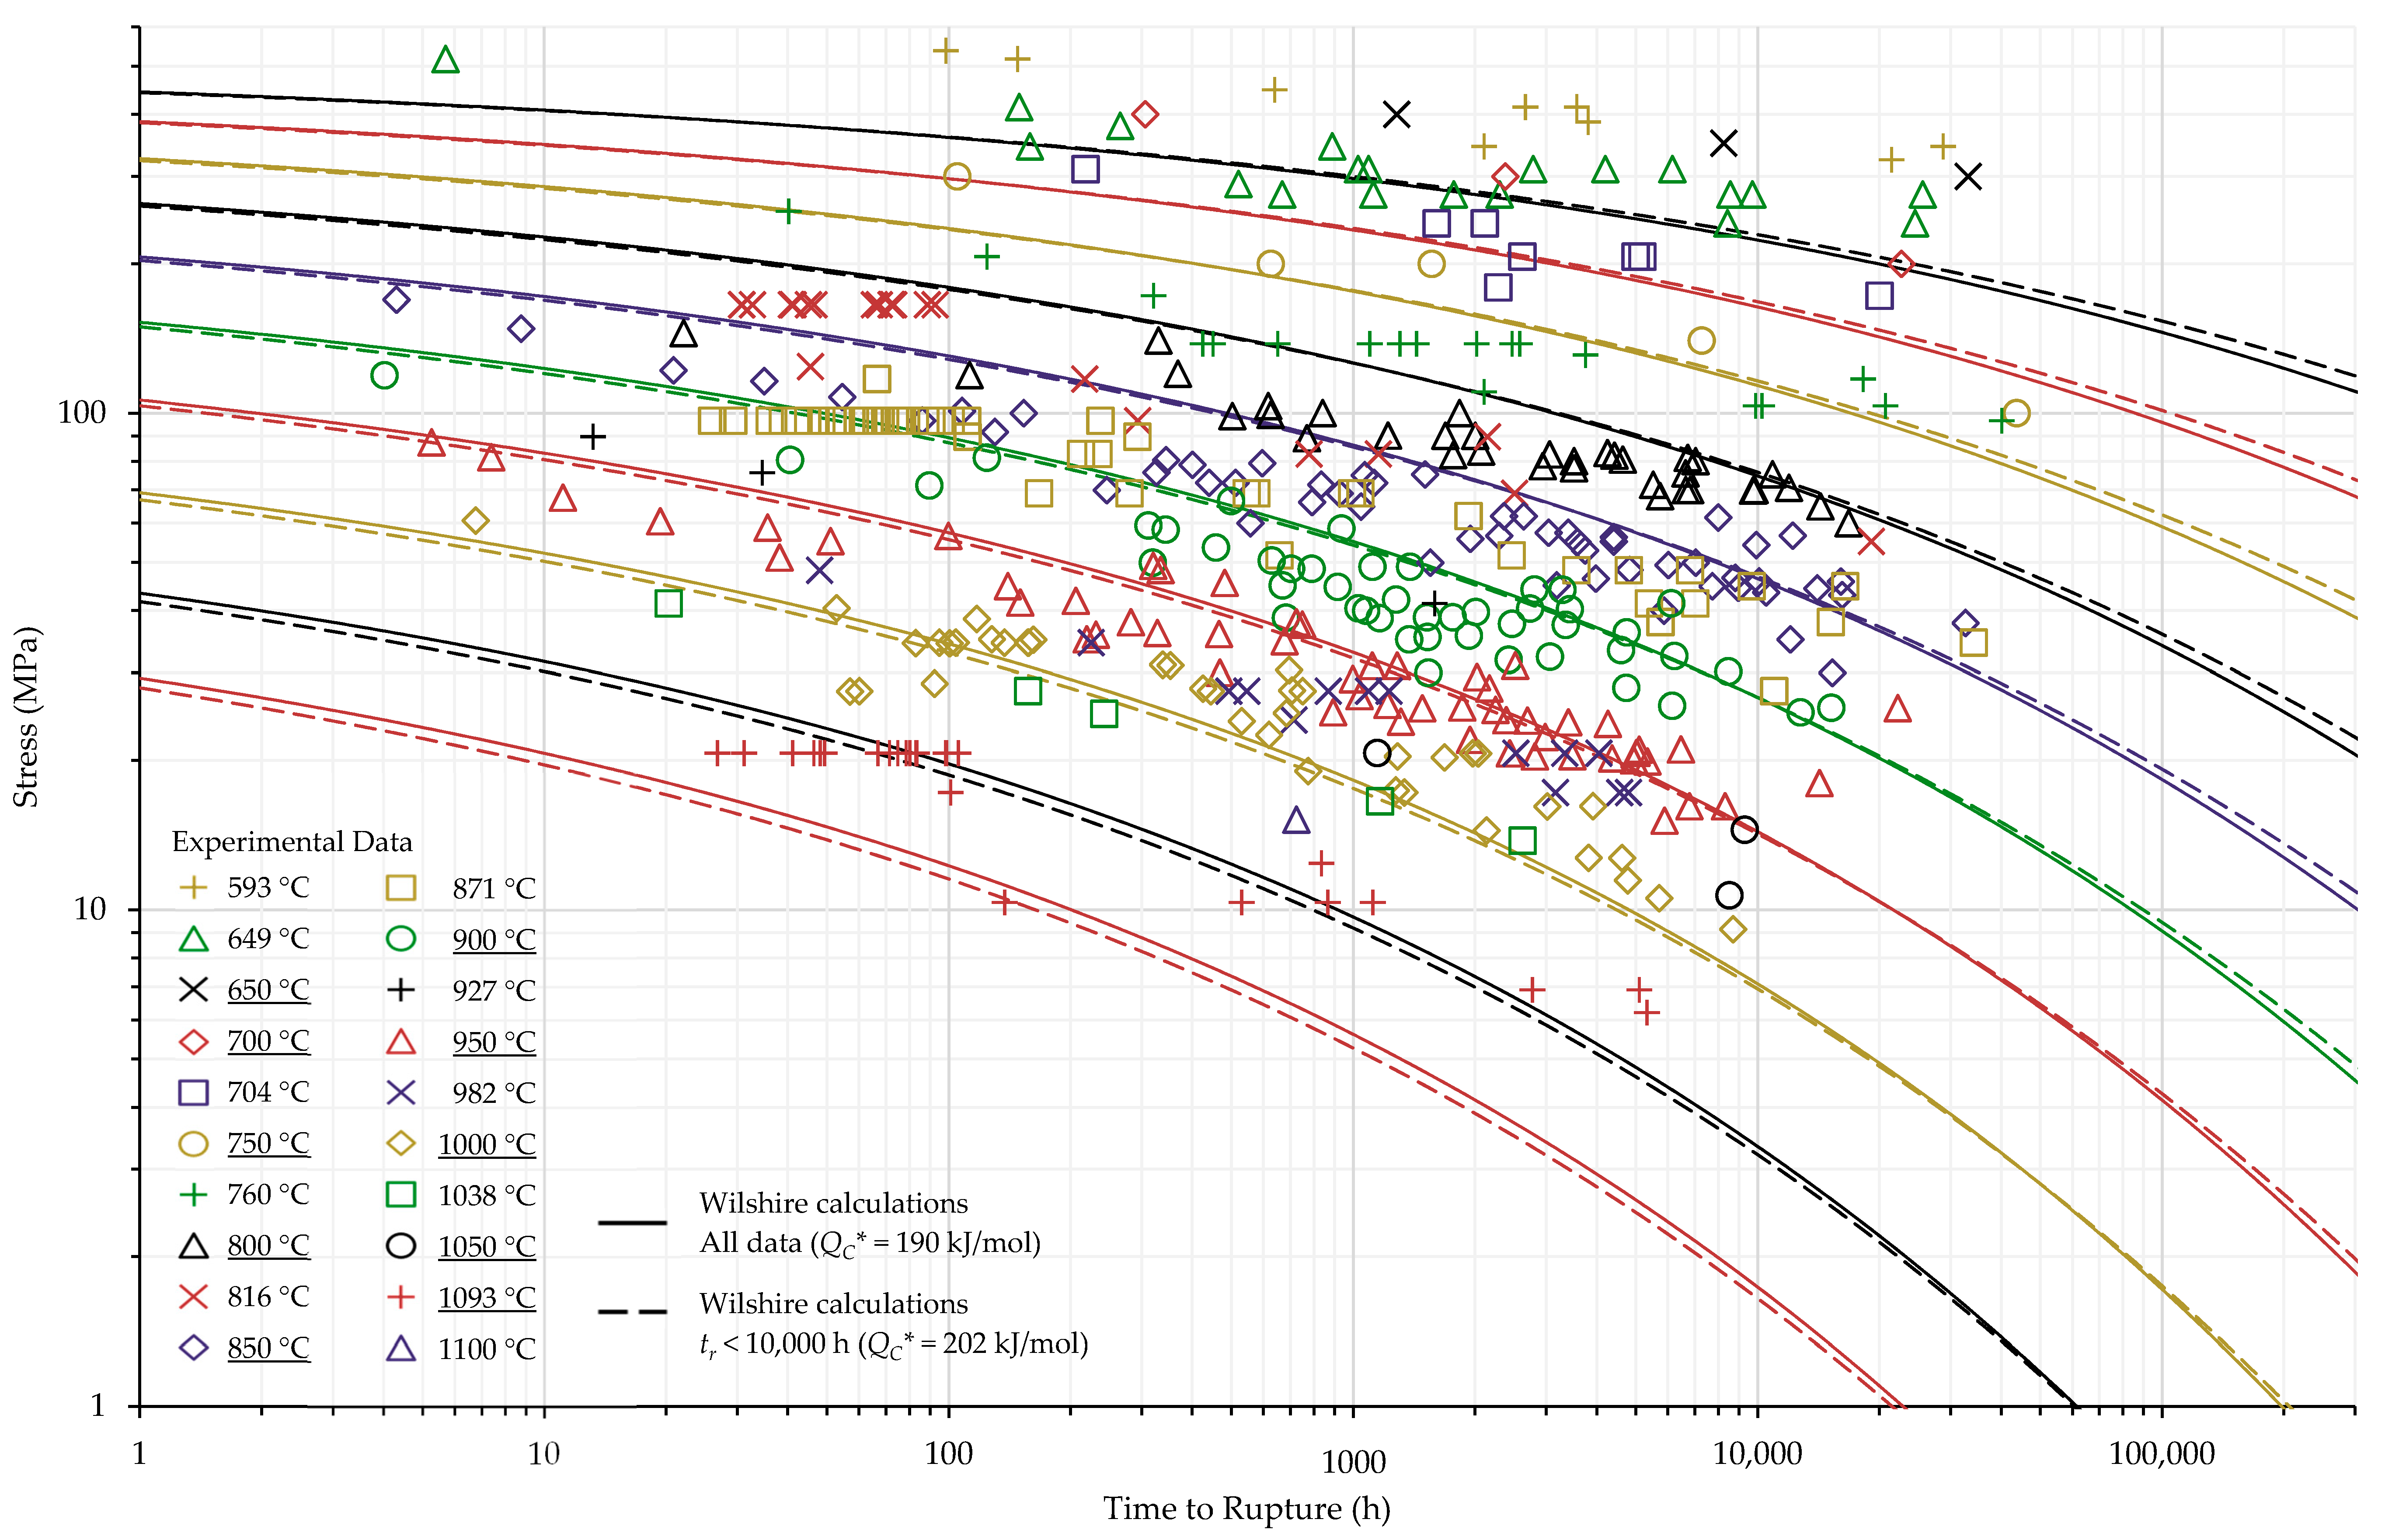
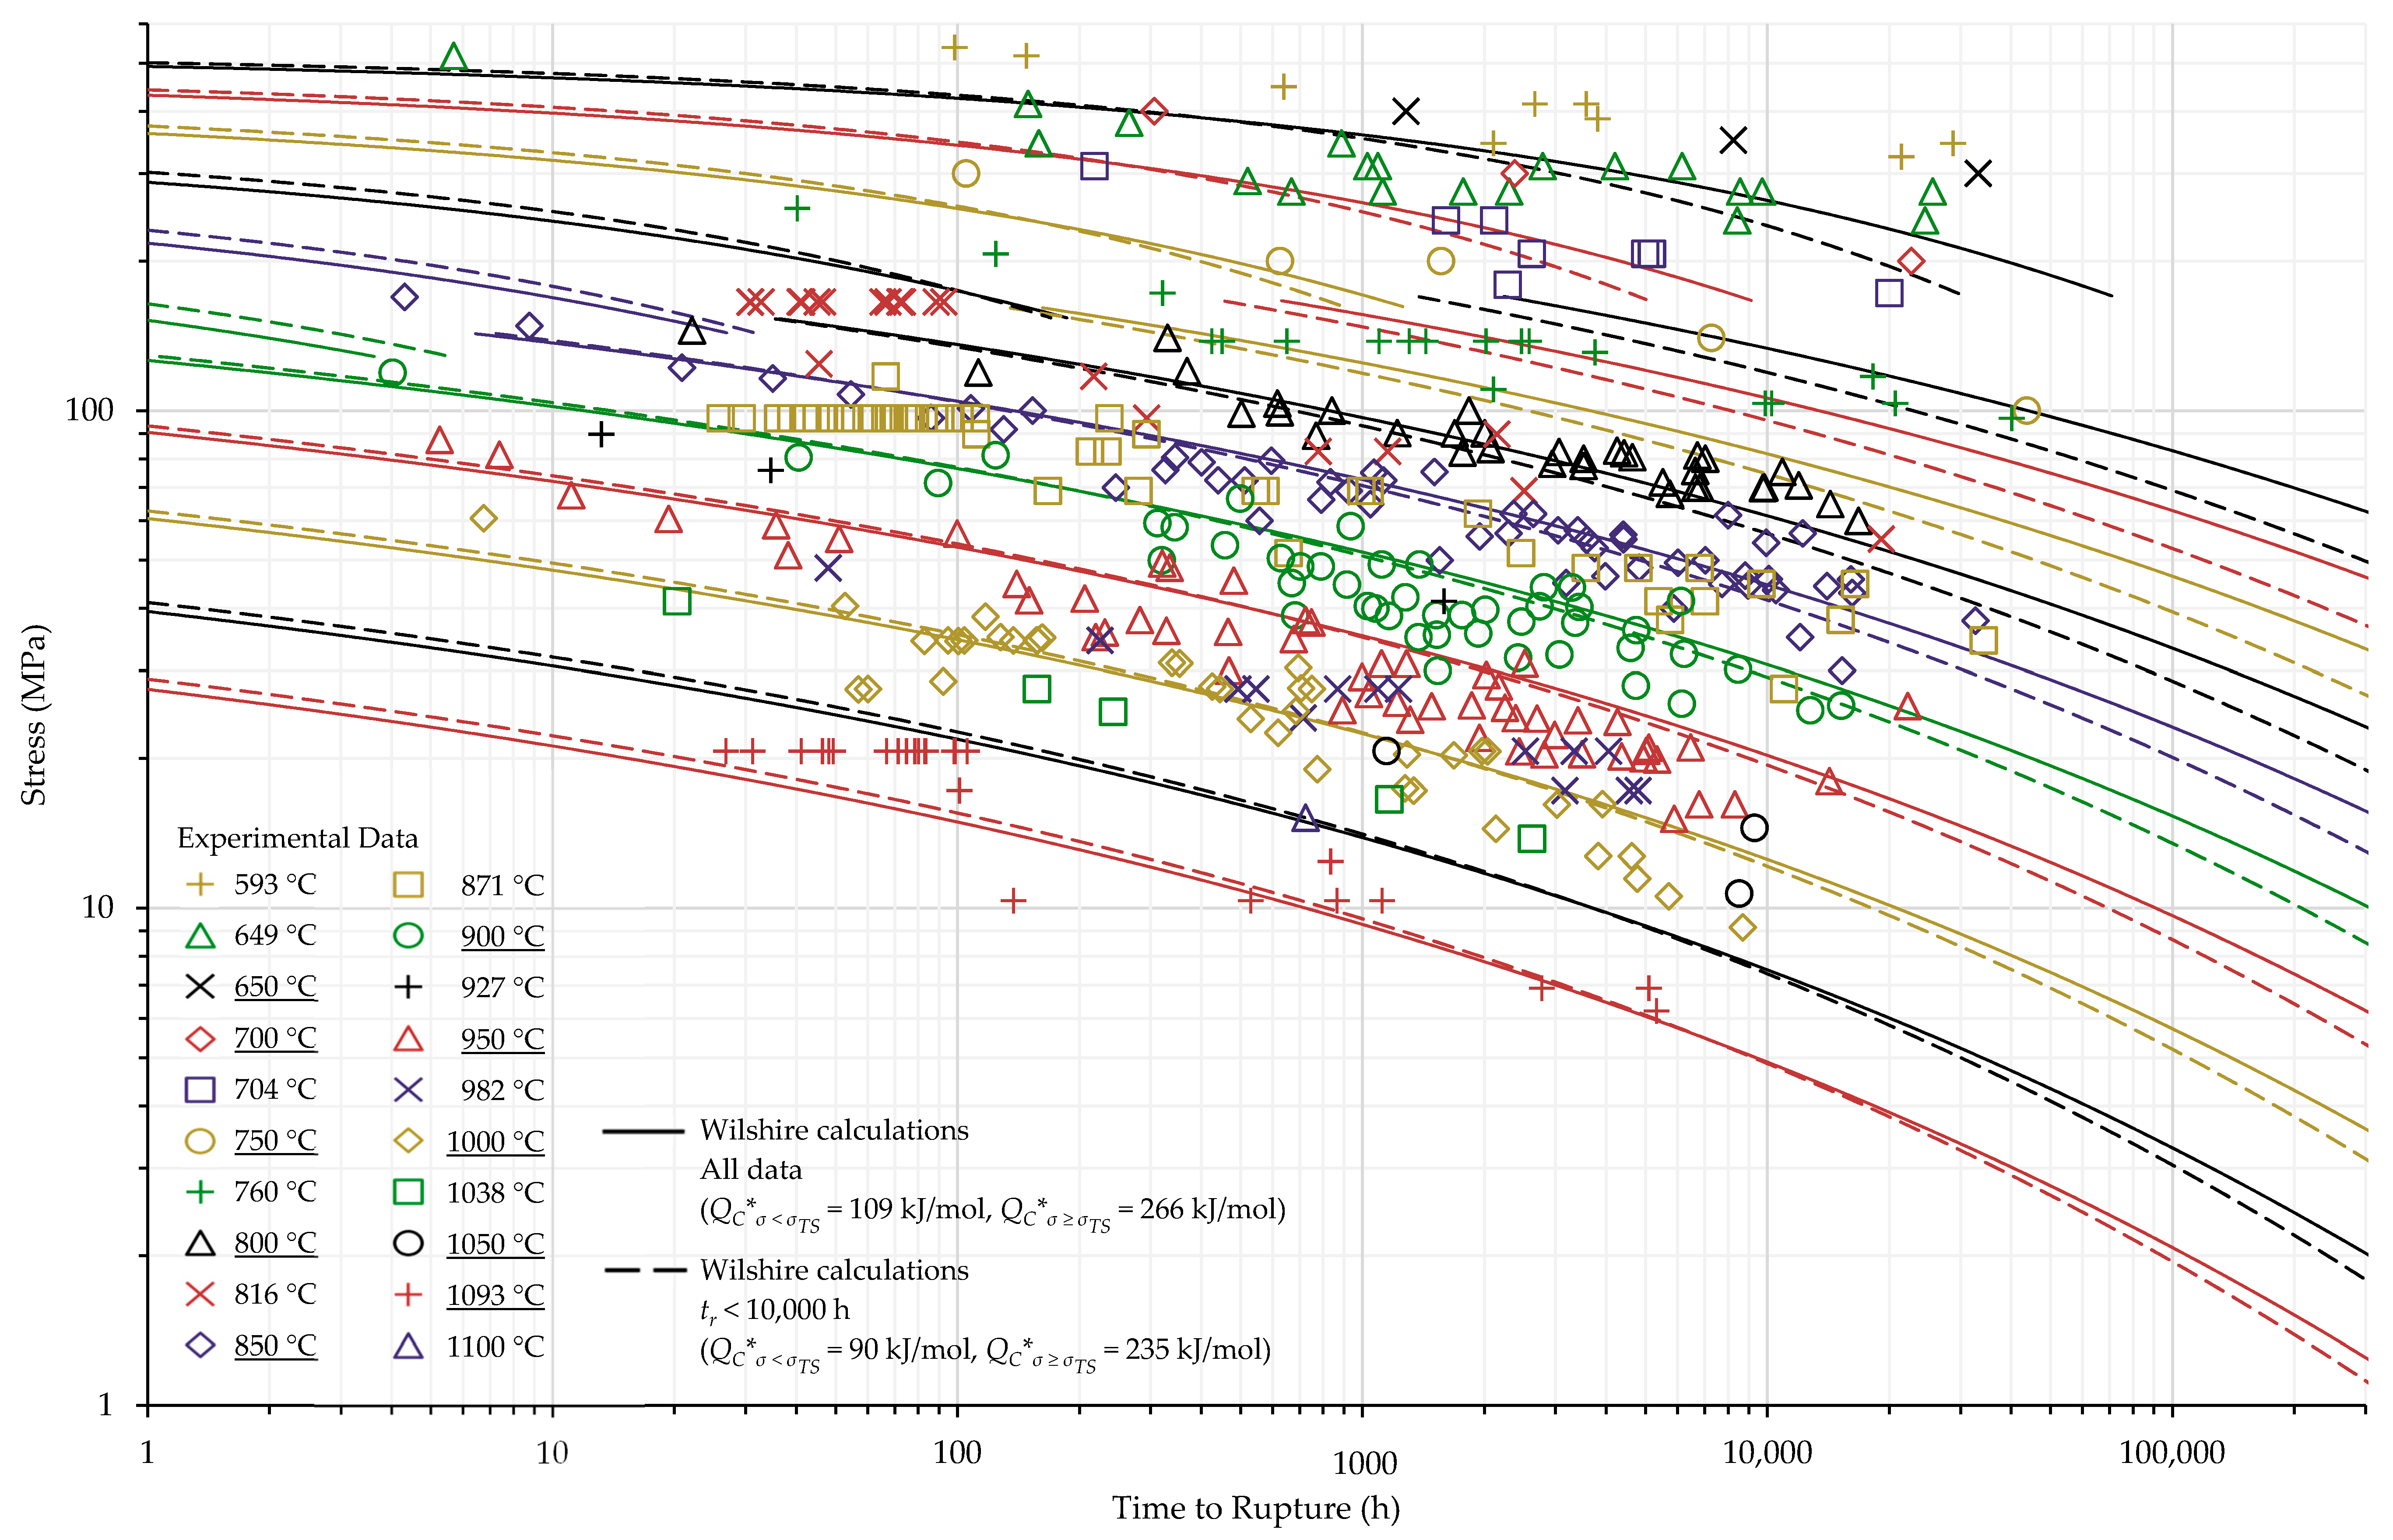
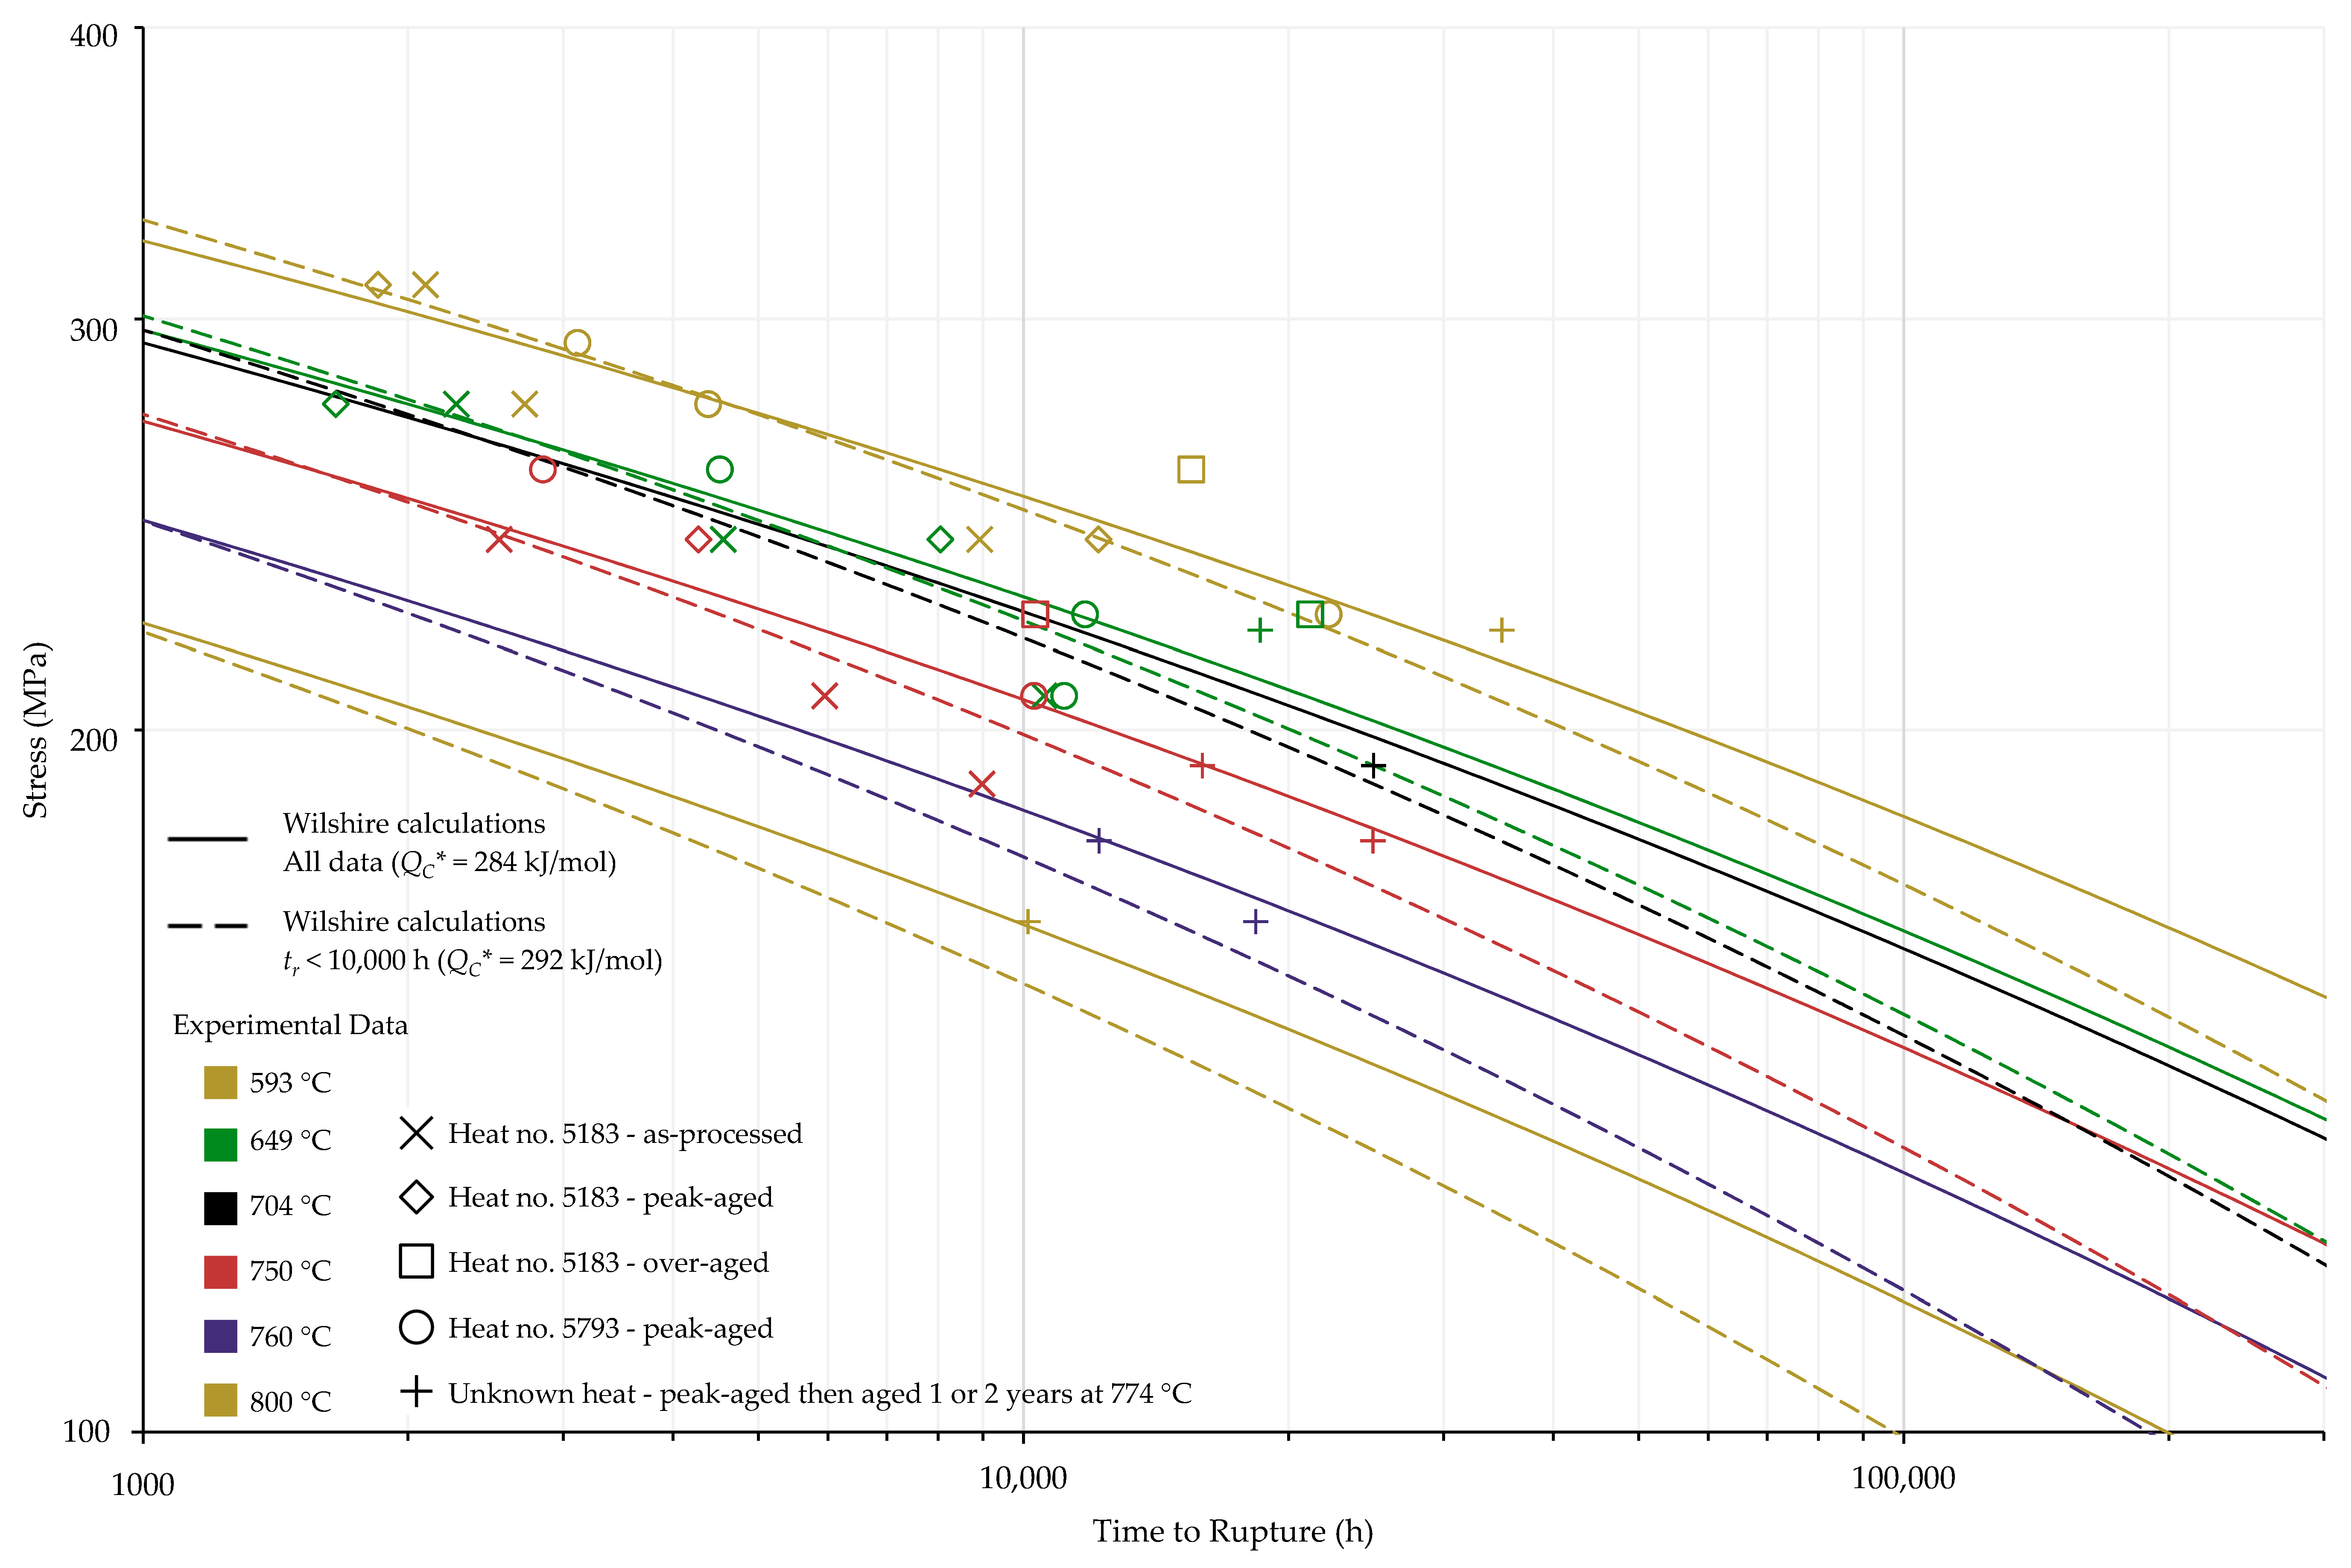
The calculations of the Wilshire equation were plotted as stress vs. time to rupture. Plots for the method that provided the lowest error for each case are shown in Figure 3, Figure 4, Figure 5 and Figure 6, while the remaining plots are shown in Figure A6, Figure A7, Figure A8, Figure A9, Figure A10, Figure A11, Figure A12, Figure A13, Figure A14, Figure A15, Figure A16, Figure A17, Figure A18 and Figure A19 in Appendix A. For ease of displaying calculations for Nimonic 105 using heat- and processing-specific tensile strength values, the y axis of Figure 6 is shown as stress normalized by tensile strength. Calculated times to rupture for each data point and method to determine Q C * for Nimonic 105 are shown in Table A2 in Appendix A. When splitting the data into above- and below-yield stress regions, the time to rupture at the transition from one region to the other is not calculated to be the same value in each region. Due to this, the split-region calculations of the Wilshire equation can yield zero or two stress values at some rupture times. The Inconel 617 plots show the tendency of the single-region rupture stress calculations to become more conservative than the split-region calculations as time increases.
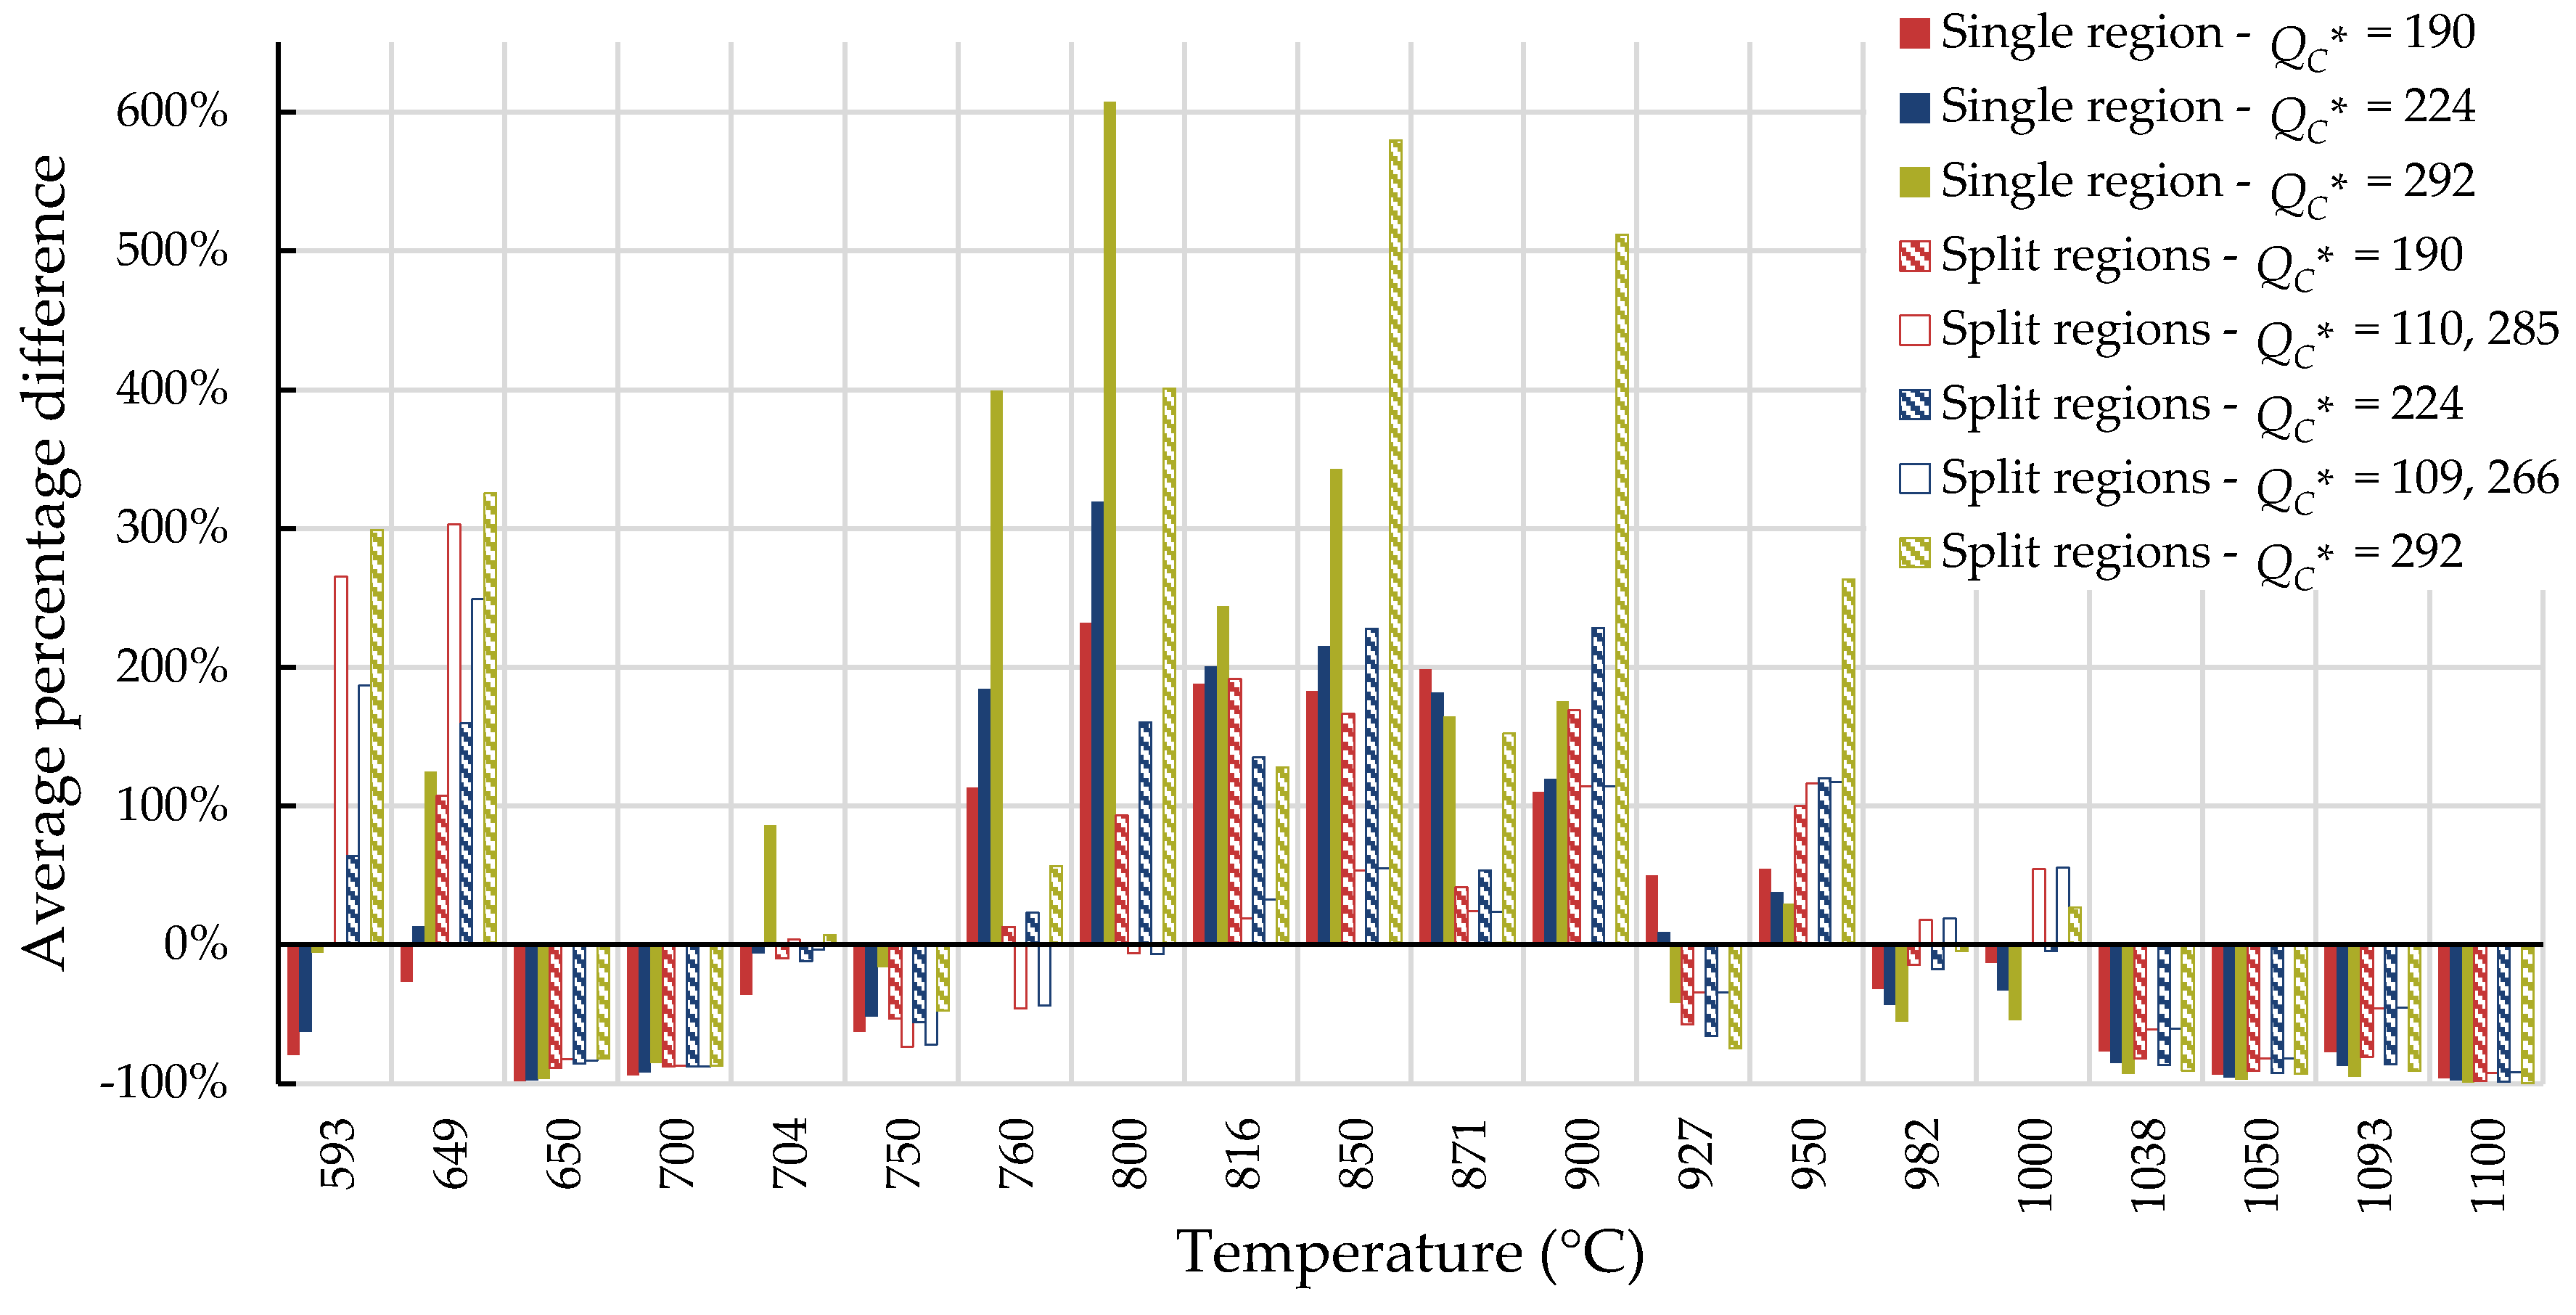
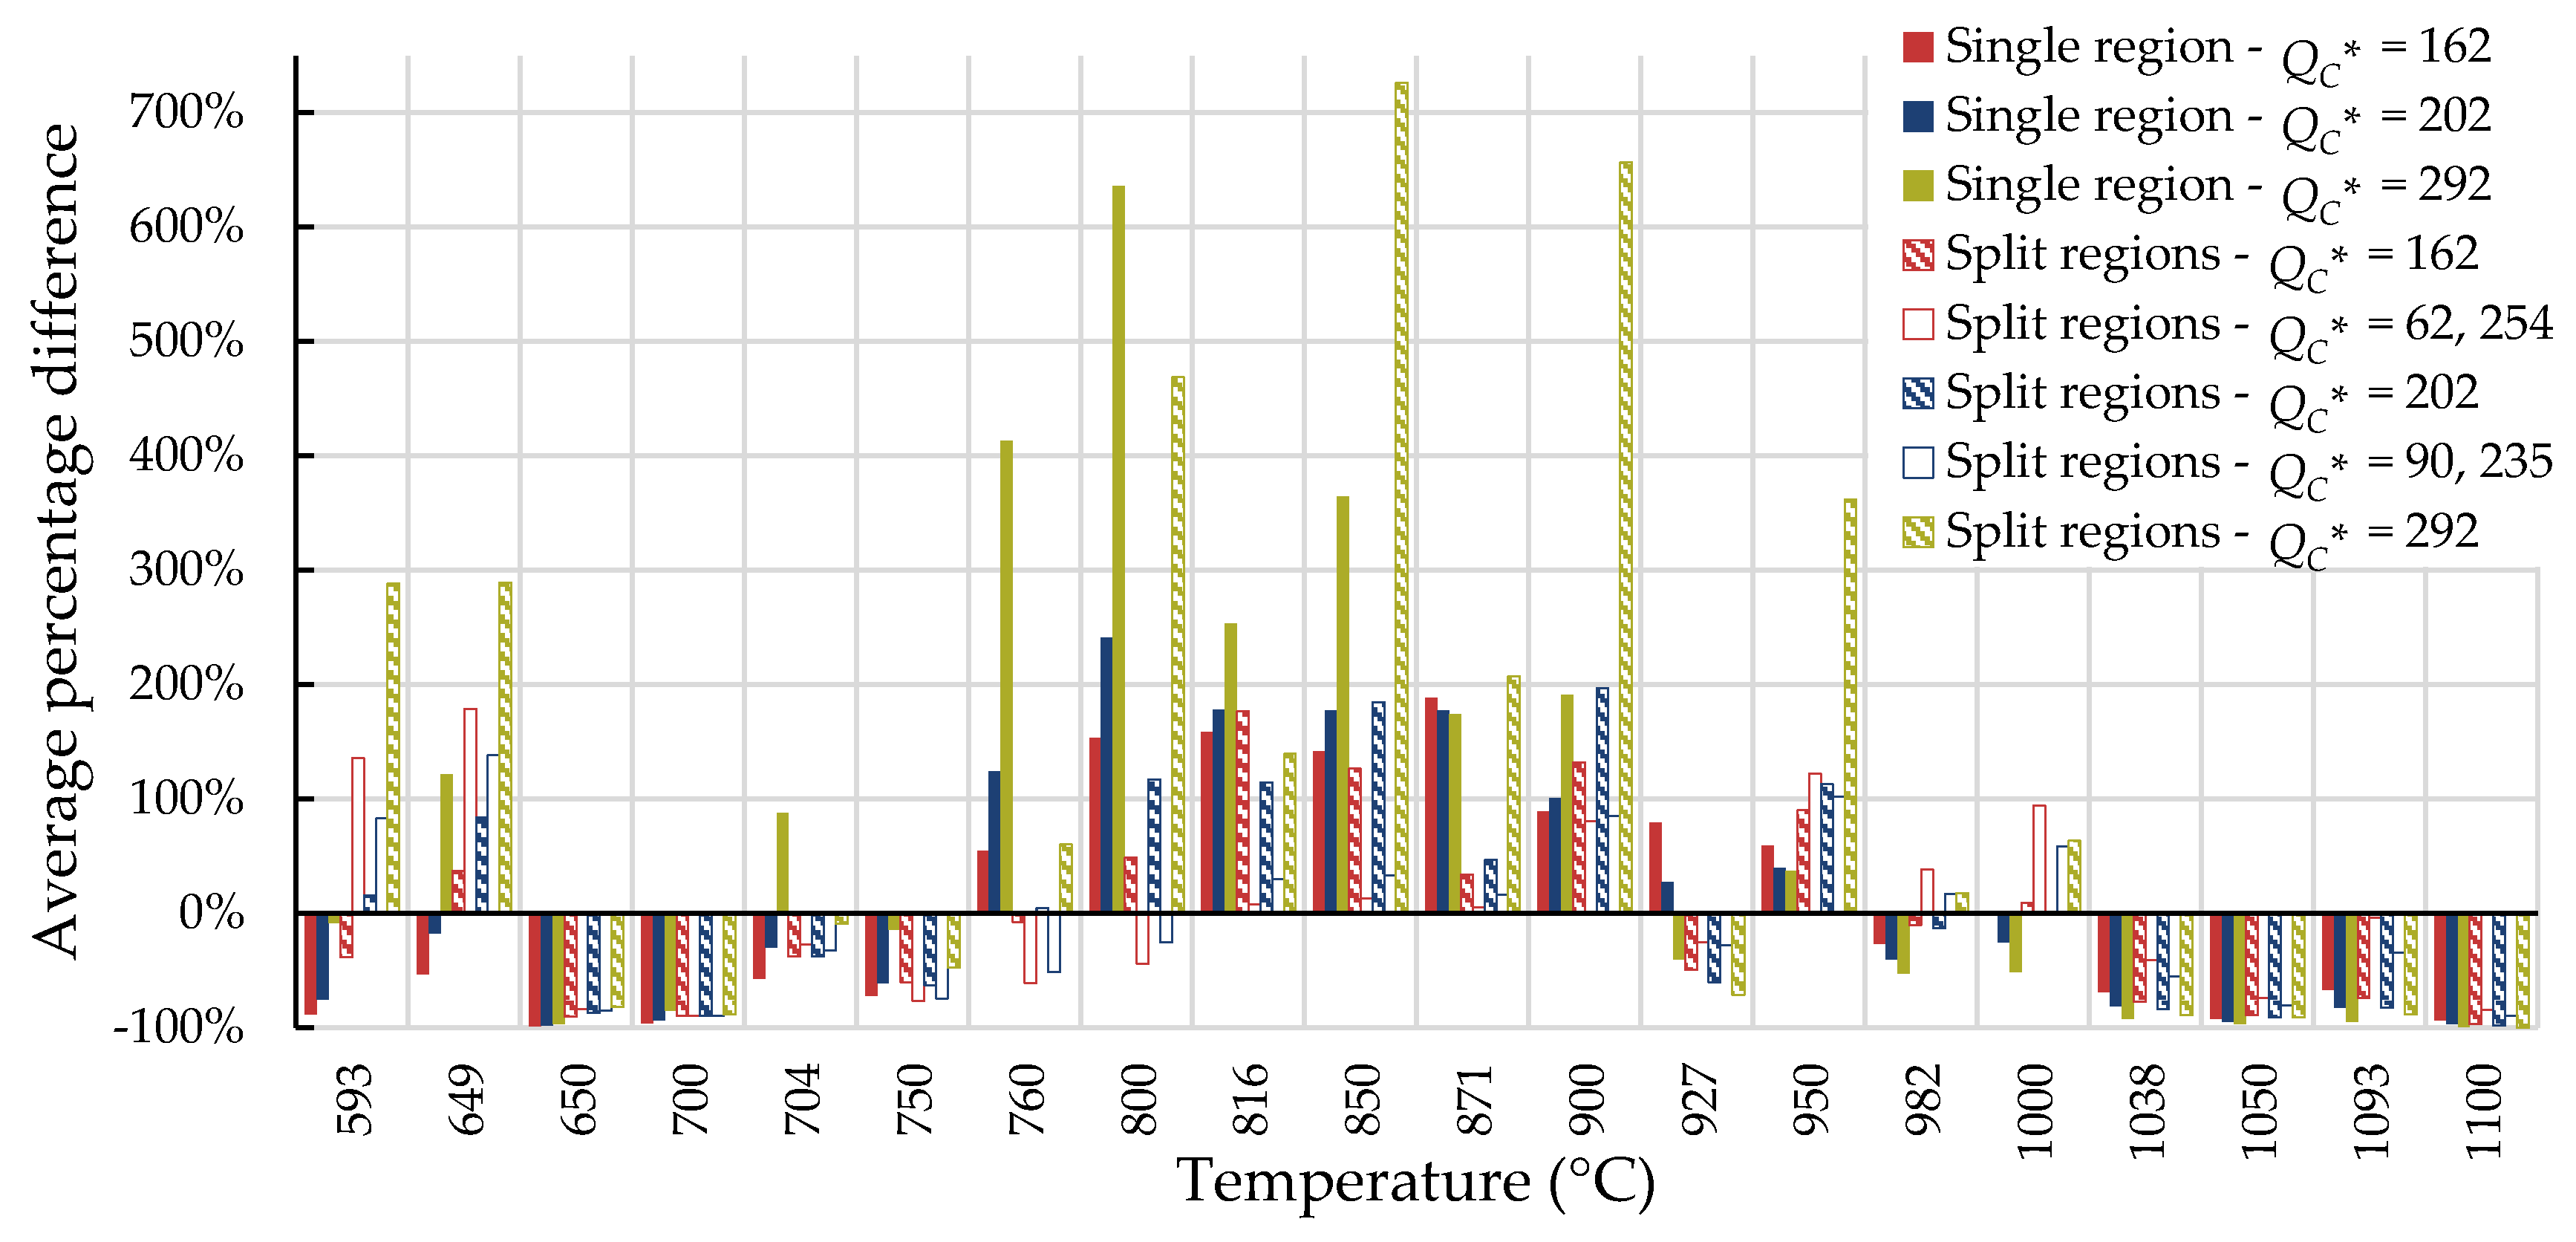
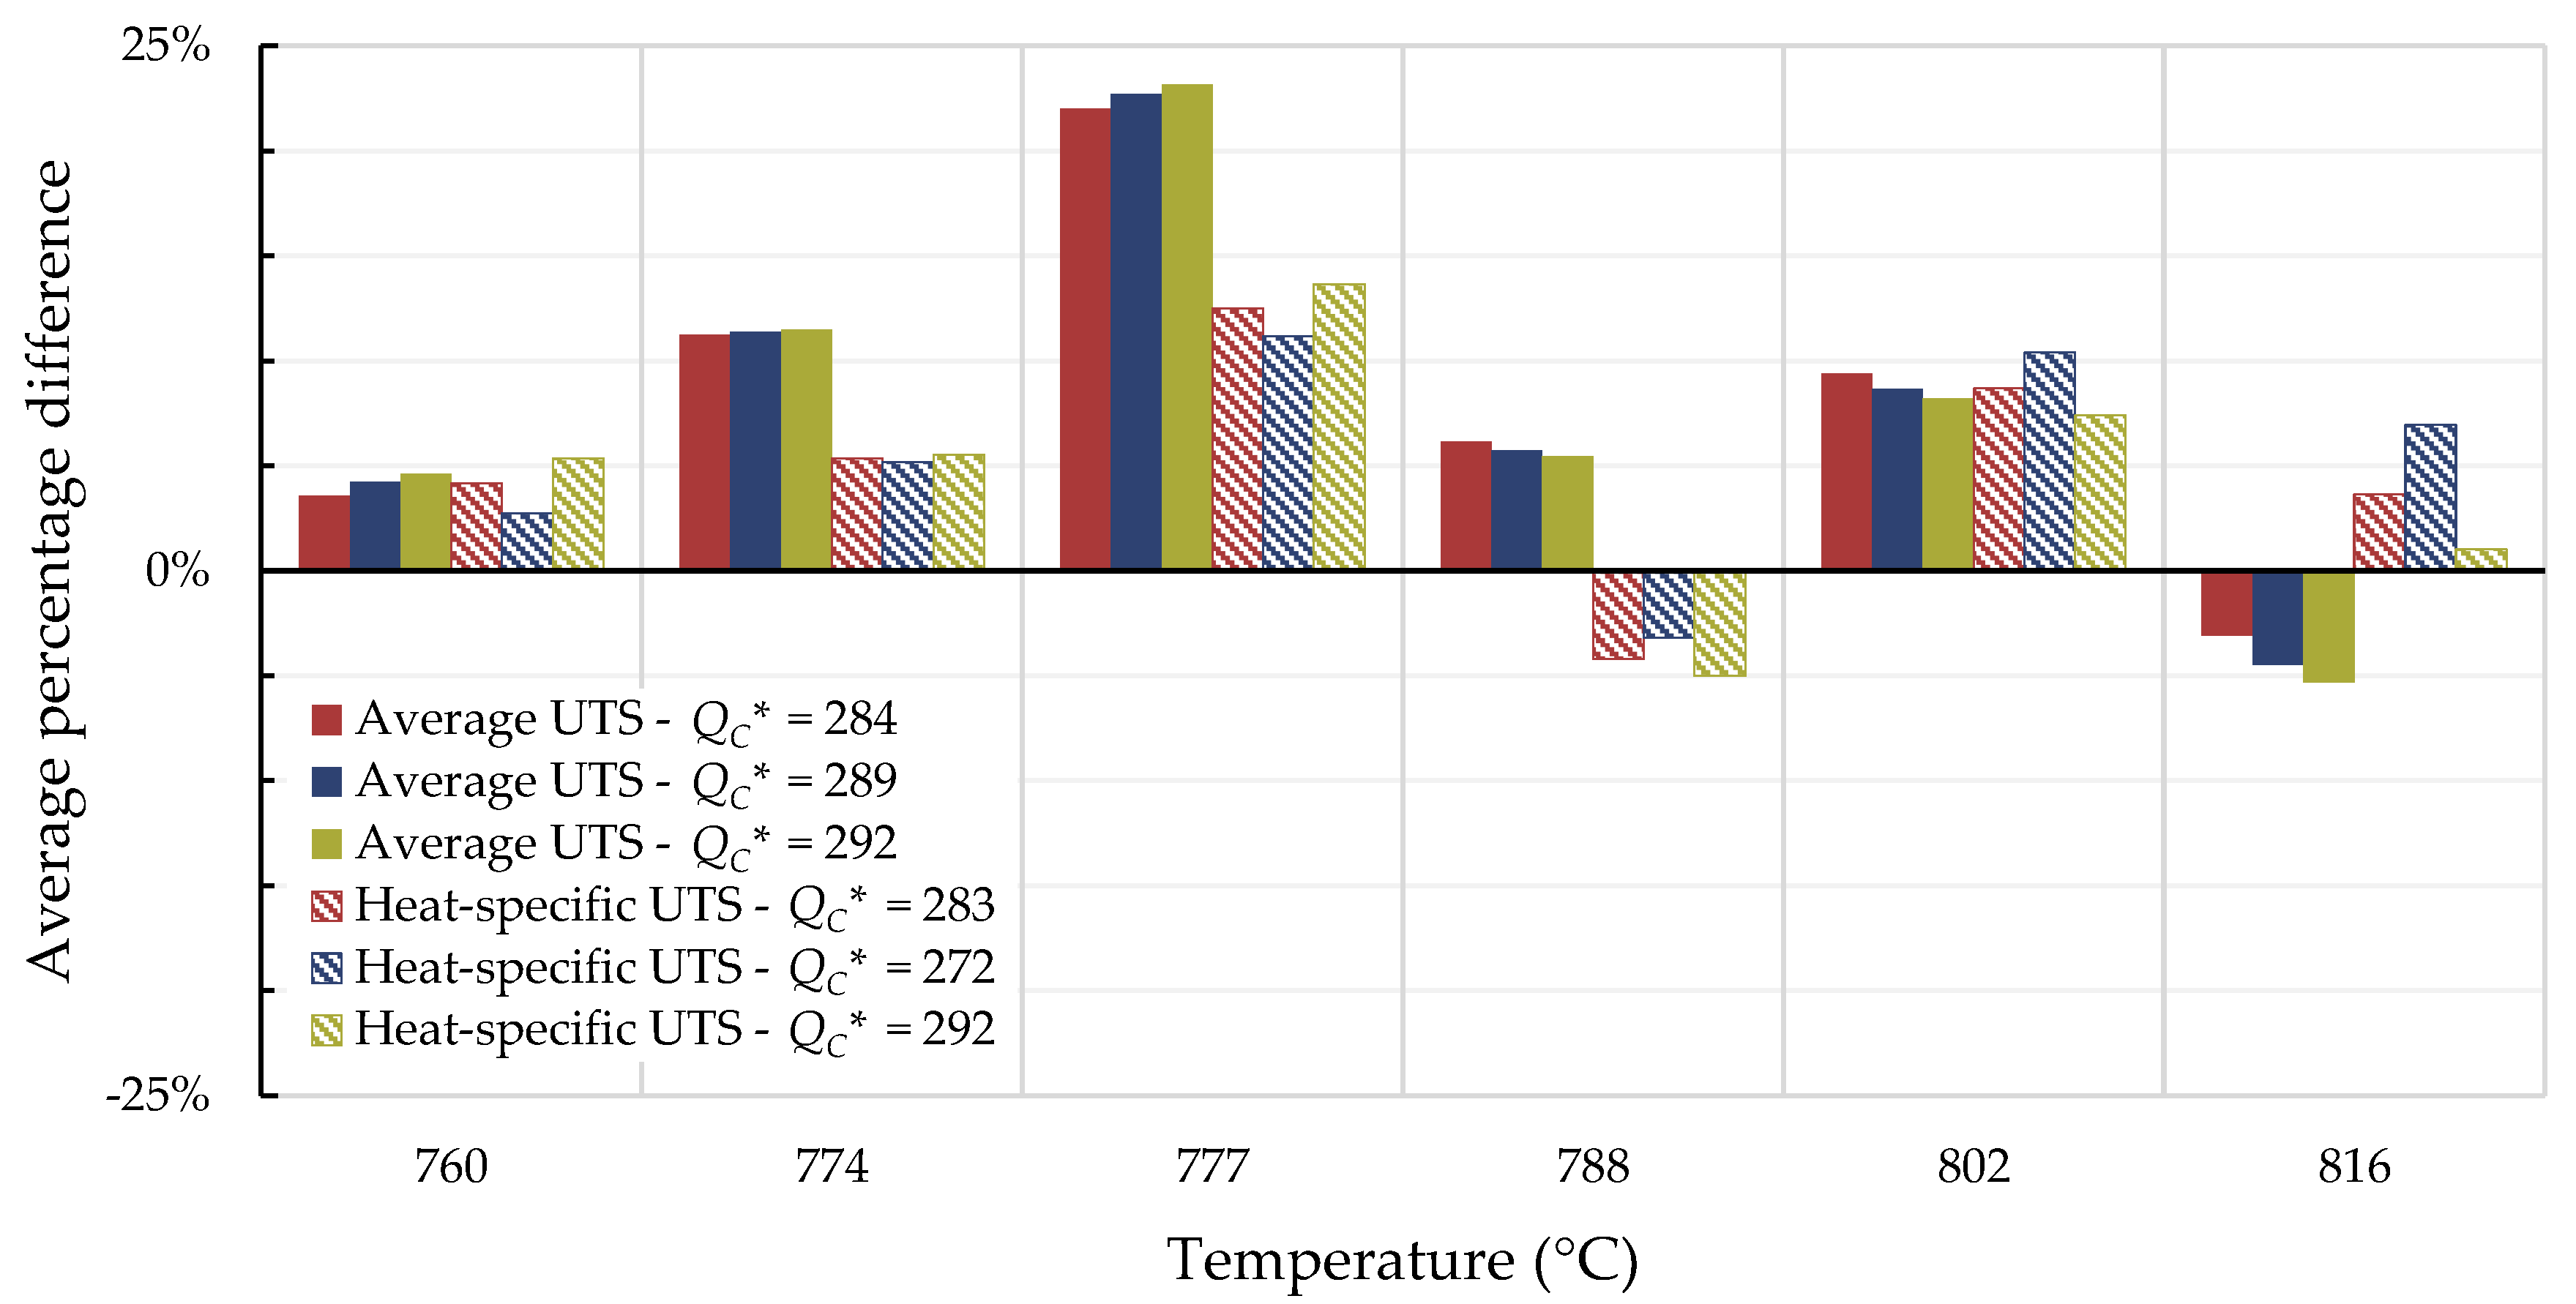
From an engineering perspective, determining the average percentage difference between the calculated and experimentally-obtained rupture times is a reasonable way to show the tendency of the Wilshire equation to over- or under-predict creep life. For use by boiler pressure vessel design code organizations it is desirable that conservative estimations of creep life are produced. Average percentage difference is defined as
Average   Percentage   Difference = i = 1 n ( t r , c a l c u l a t e d , i t r , e x p e r i m e n t a l , i t r , e x p e r i m e n t a l , i ) n × 100 .
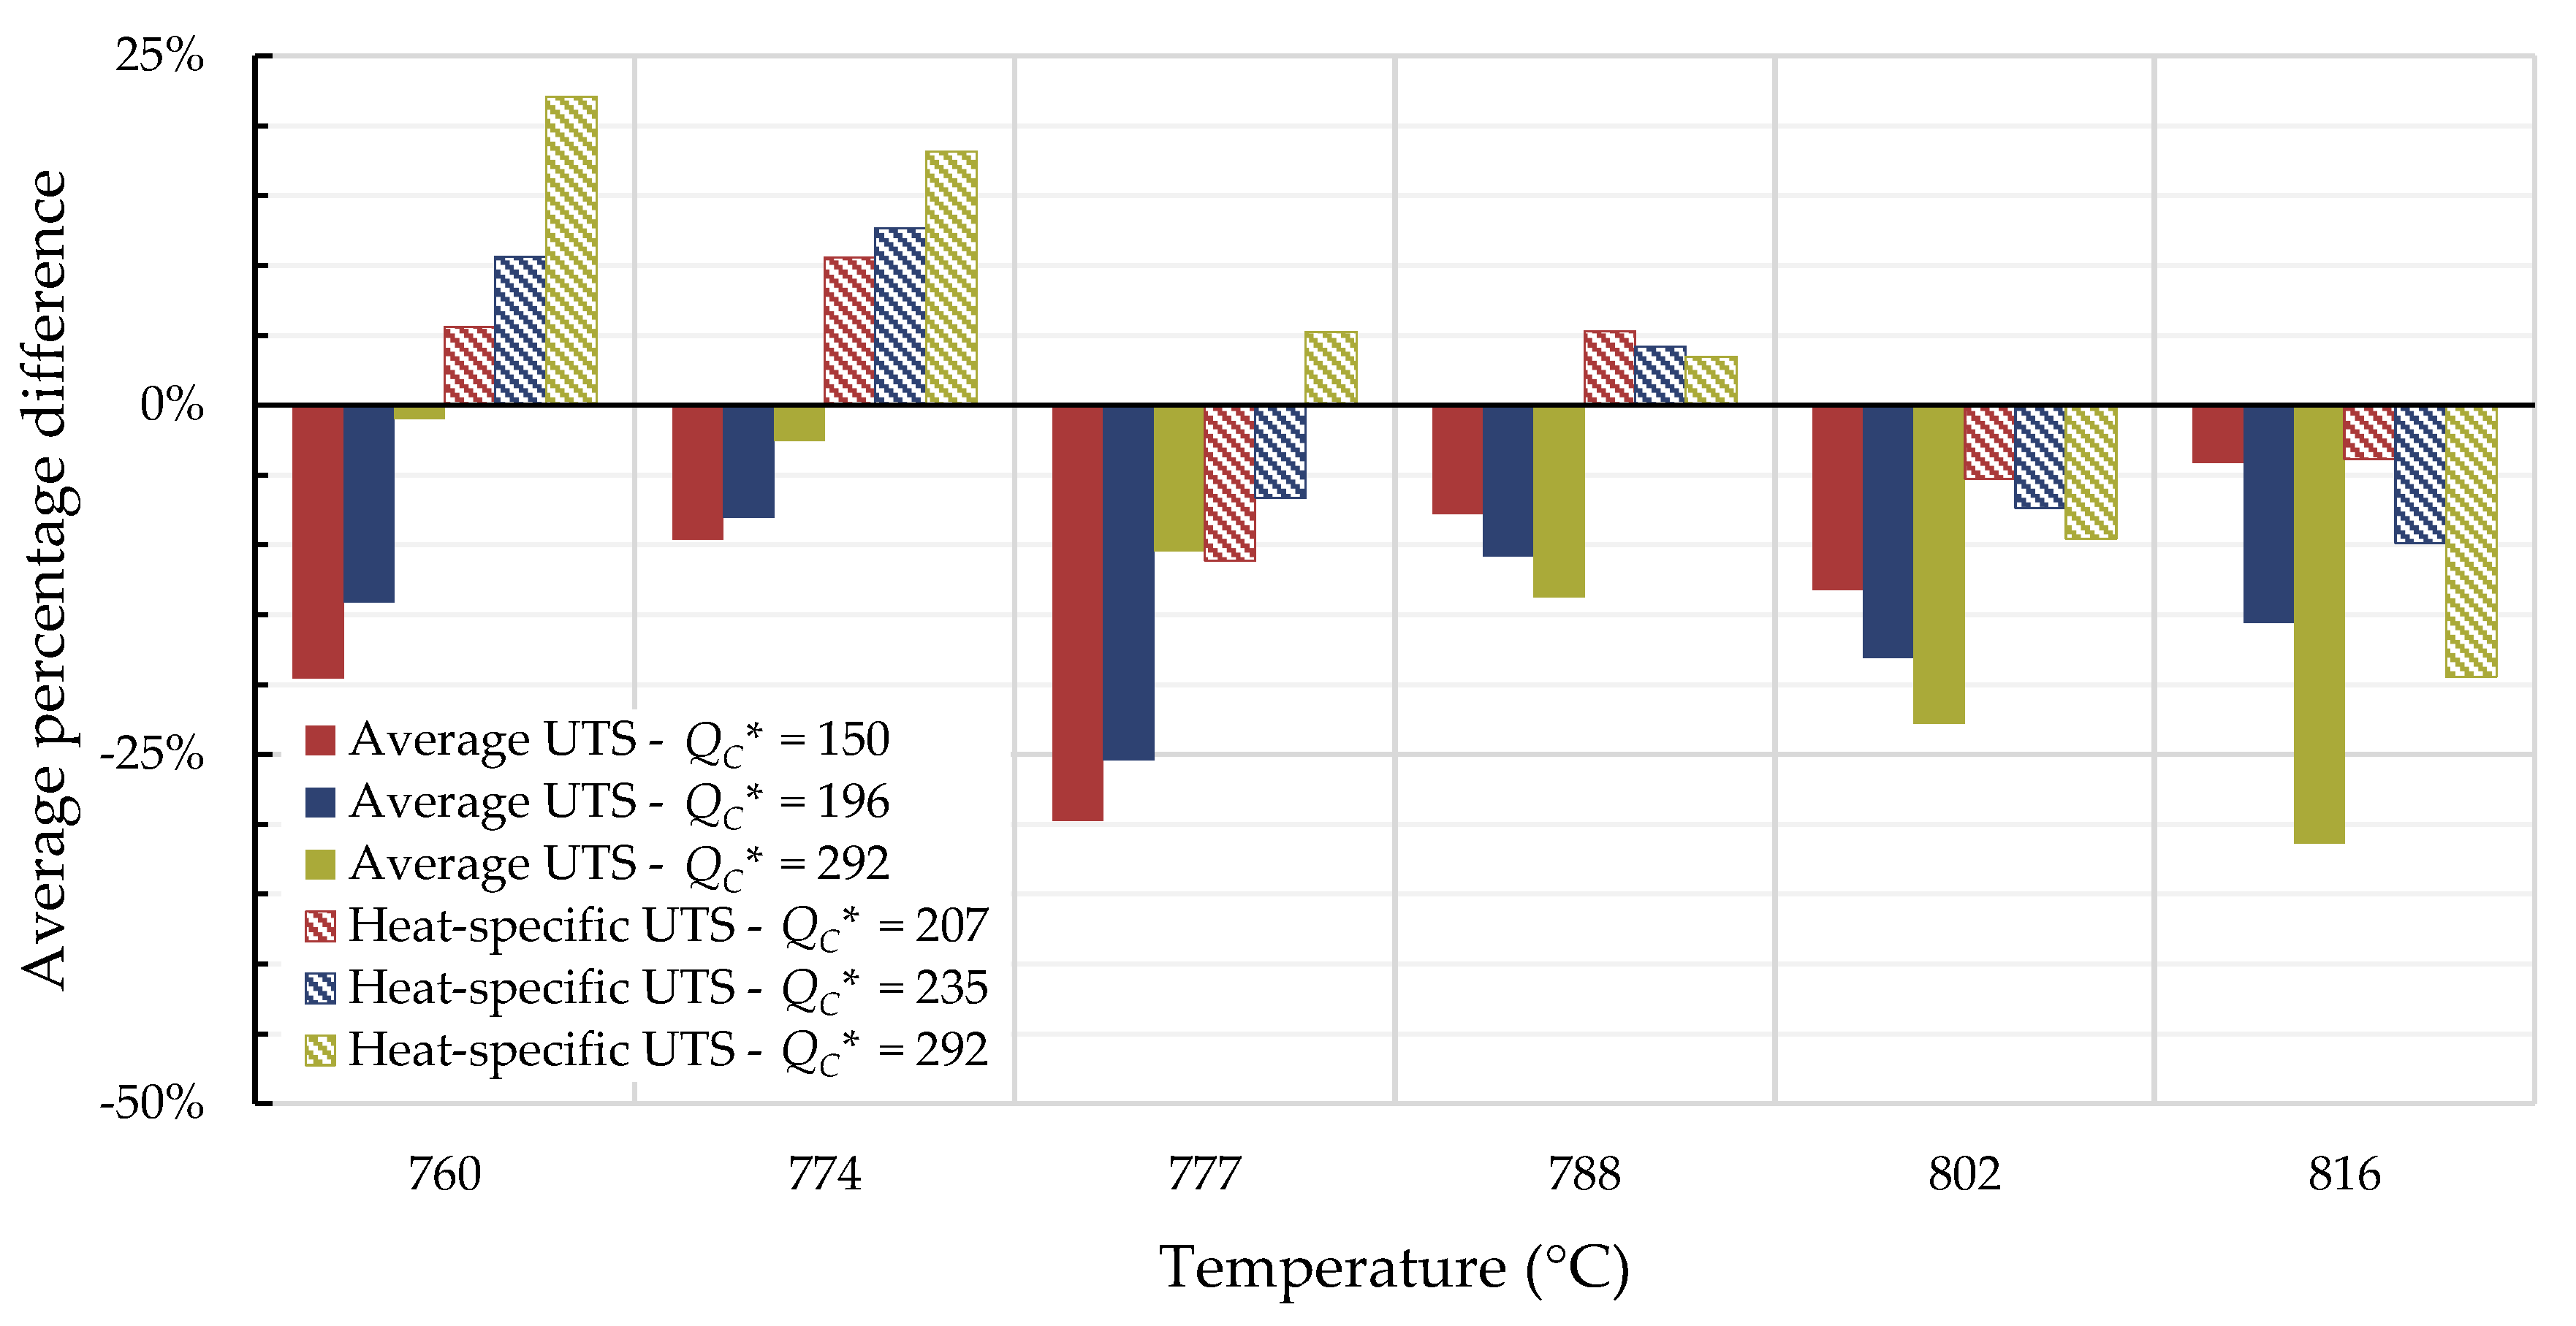
For all cases, the average percentage difference was calculated at each temperature, and the results are shown in Figure 7, Figure 8, Figure 9 and Figure 10.
For Inconel 617, calculations from 800 to 900 °C are generally not conservative and those beyond 1000 °C tend to be conservative regardless of the method used. Use of the self-diffusion activation energy of nickel in a nickel lattice as Q C * gave the largest overpredictions of creep life for single- and split-region analyses. For Nimonic 105, the use of heat- and processing-specific tensile strength data usually—but not always—improved the average percentage difference.
The European Creep Collaborative Committee (ECCC) has extrapolated the creep life of various alloys to 100,000 h, including Inconel 617 [47]. As mentioned by Bullough, et al. [48], an interim Inconel 617B ECCC data sheet exists and a revision is in progress. A comparison of the creep strengths for rupture at 100,000 h specified by the ECCC and those obtained using the Wilshire equation are shown in Table 7 at temperatures that are common to both the ECCC’s data sheet and the data used in this paper. The calculations of the Wilshire equation are closest to the values in the Inconel 617 ECCC data sheet when all data are treated as a single region and Q C * is determined by optimizing the correlation of data on a Wilshire plot. Calculated creep strength values for rupture at 100,000 h for Nimonic 105 are presented in Table 8. For both alloys, the use of data with rupture times less than 10,000 h to calculate Q C * generally resulted in lower calculated creep strengths for rupture at 100,000 h.

4.2. Comparison of Calculations of the Wilshire and Larson-Miller Parameter Equations

The Larson-Miller parameter equation was used to provide calculations for comparison with the calculations of the Wilshire equation. Equation (9) and the MATLAB surface fitting tool were used to correlate the experimental data to the LMP equation and the resulting coefficients and goodness of fit are shown in Table 9.
Time to rupture was calculated at the stress and temperature of each experimental data point using the LMP equation. The mean squared error of the calculated rupture times is compared to the lowest error obtained using the Wilshire equation with all data in Table 10. The error of the Wilshire calculations is lower than that of the LMP equation for both alloys. The best goodness of fit was achieved with the LMP equation for Inconel 617 and with the Wilshire equation for Nimonic 105.
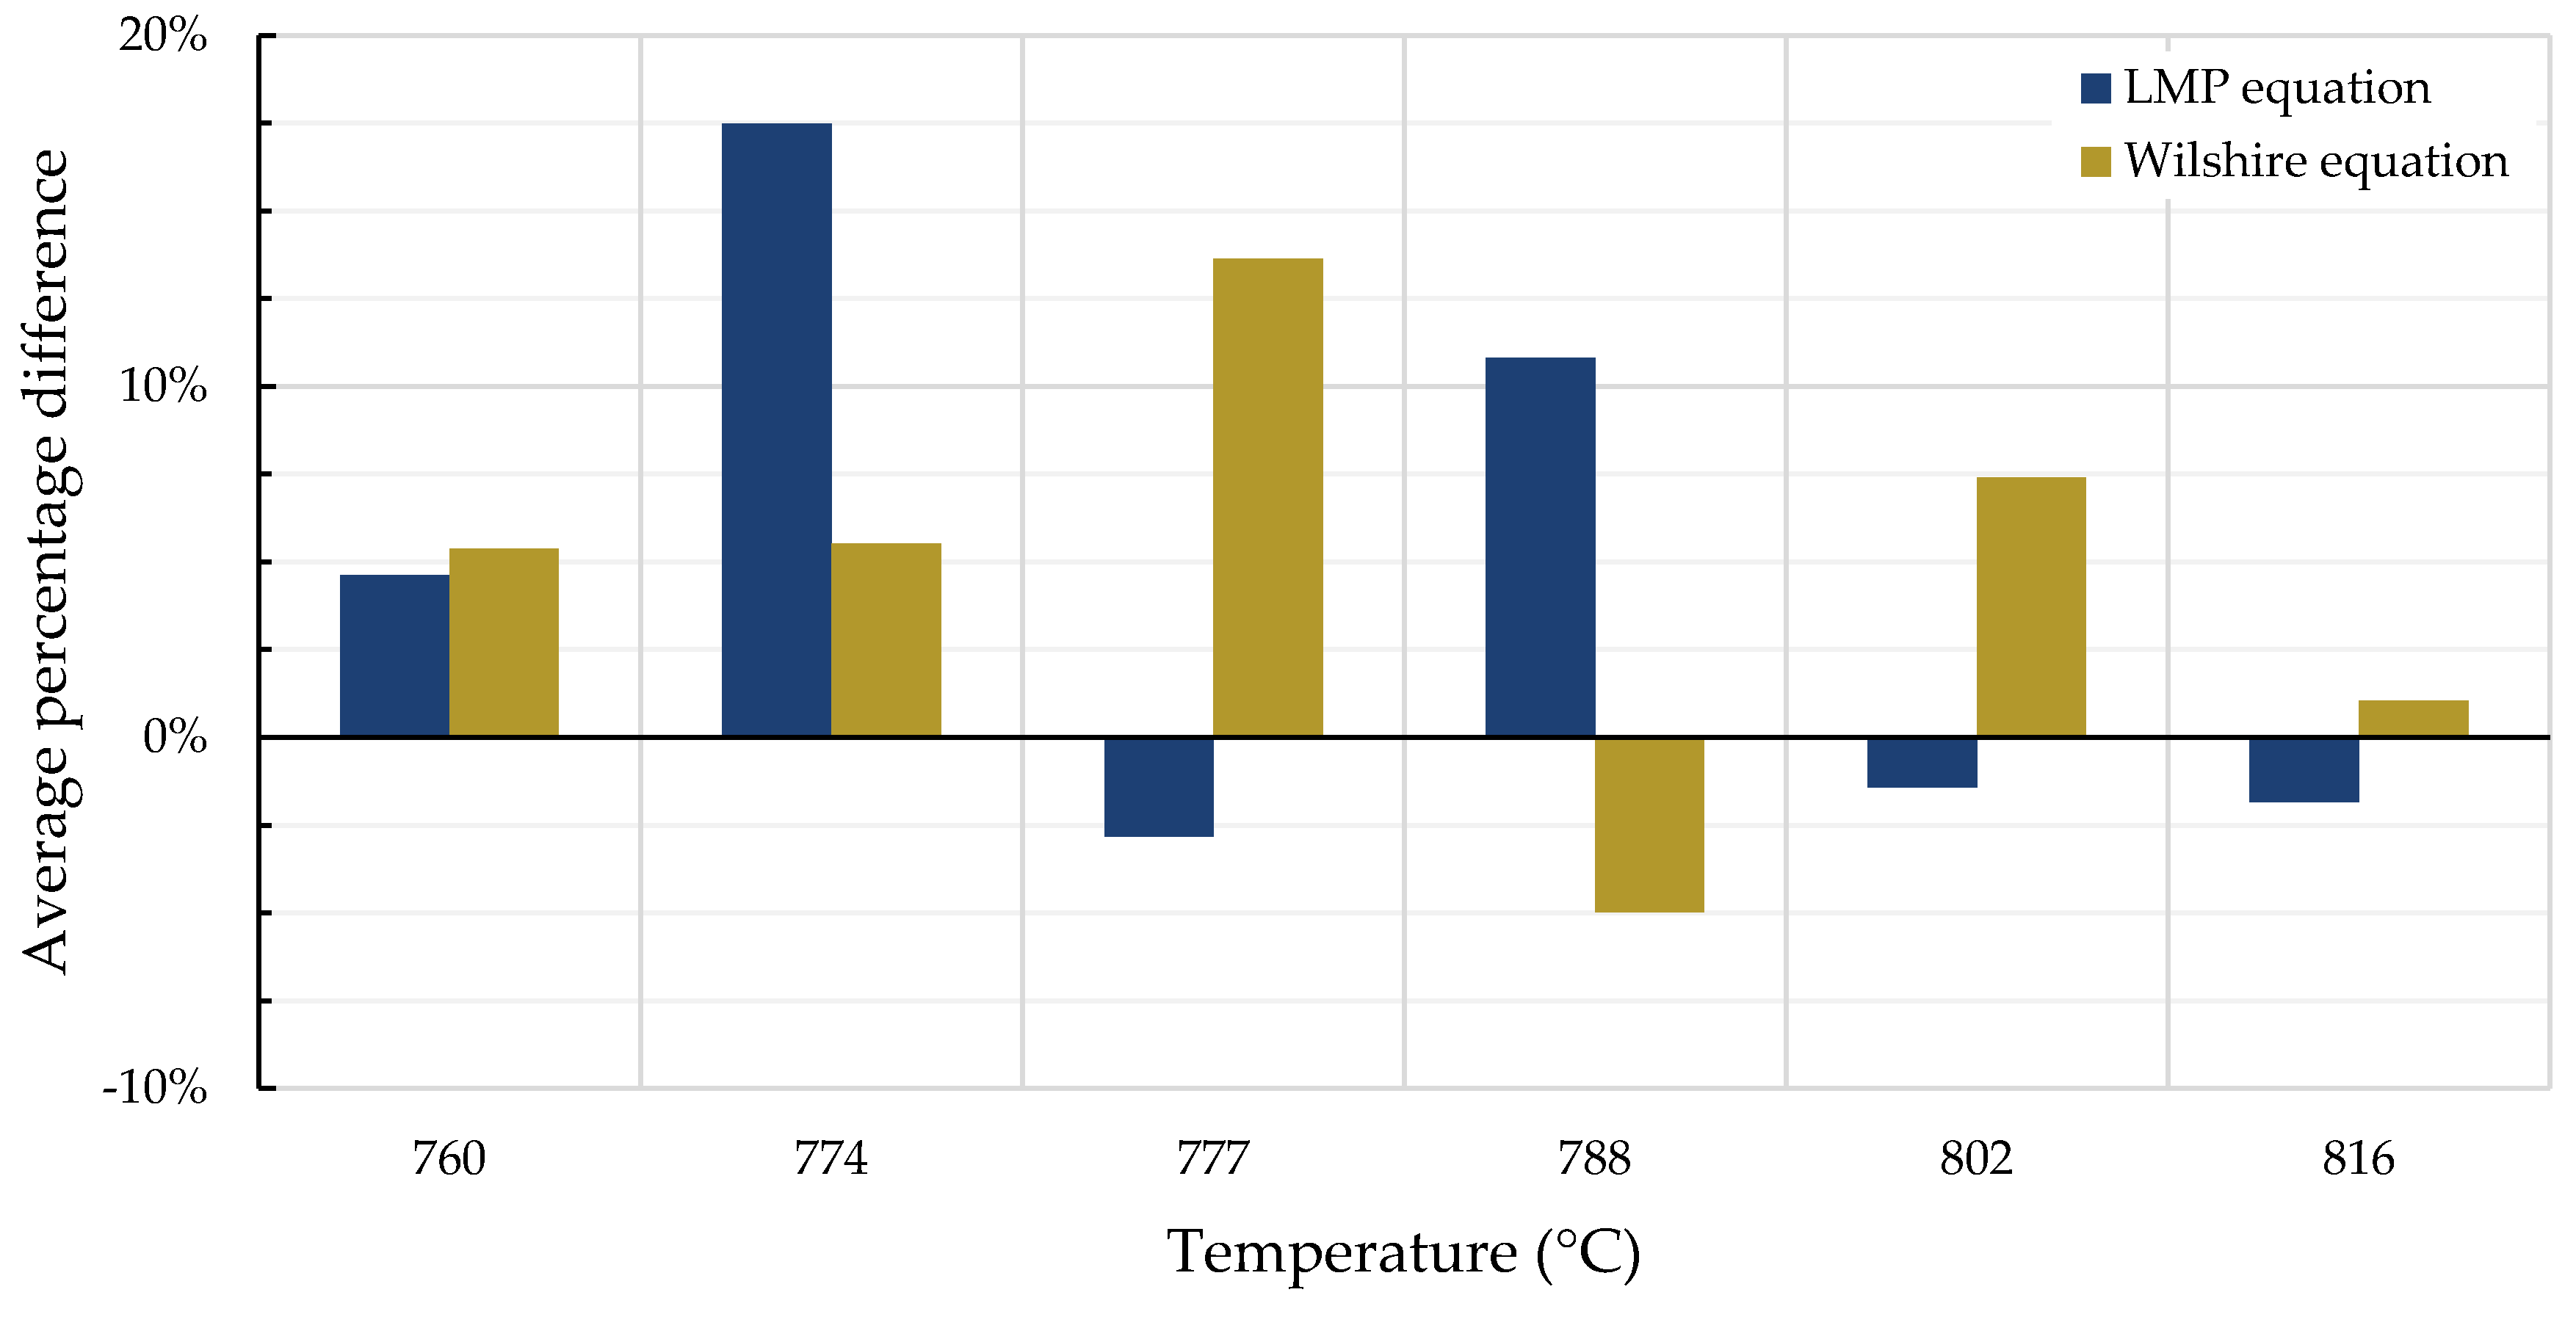
A comparison of the tendency for each equation to over- or under-predict creep life—quantified as the average percentage difference between calculated and experimentally-obtained rupture times—is shown in Figure 11 and Figure 12. For Inconel 617, the over- and under-predictions of the LMP equation are generally less severe than those of the Wilshire equation, except at the two lowest temperatures.
The percentage differences of the calculated rupture time for the longest test duration of each alloy is defined as
Percentage   Difference = t r , c a l c u l a t e d t r , e x p e r i m e n t a l t r , e x p e r i m e n t a l × 100 .
As shown in Table 11 the calculated rupture time for both equations was conservative for each alloy compared to the longest experimental test data points. The LMP equation yielded more conservative estimates than the Wilshire equation.
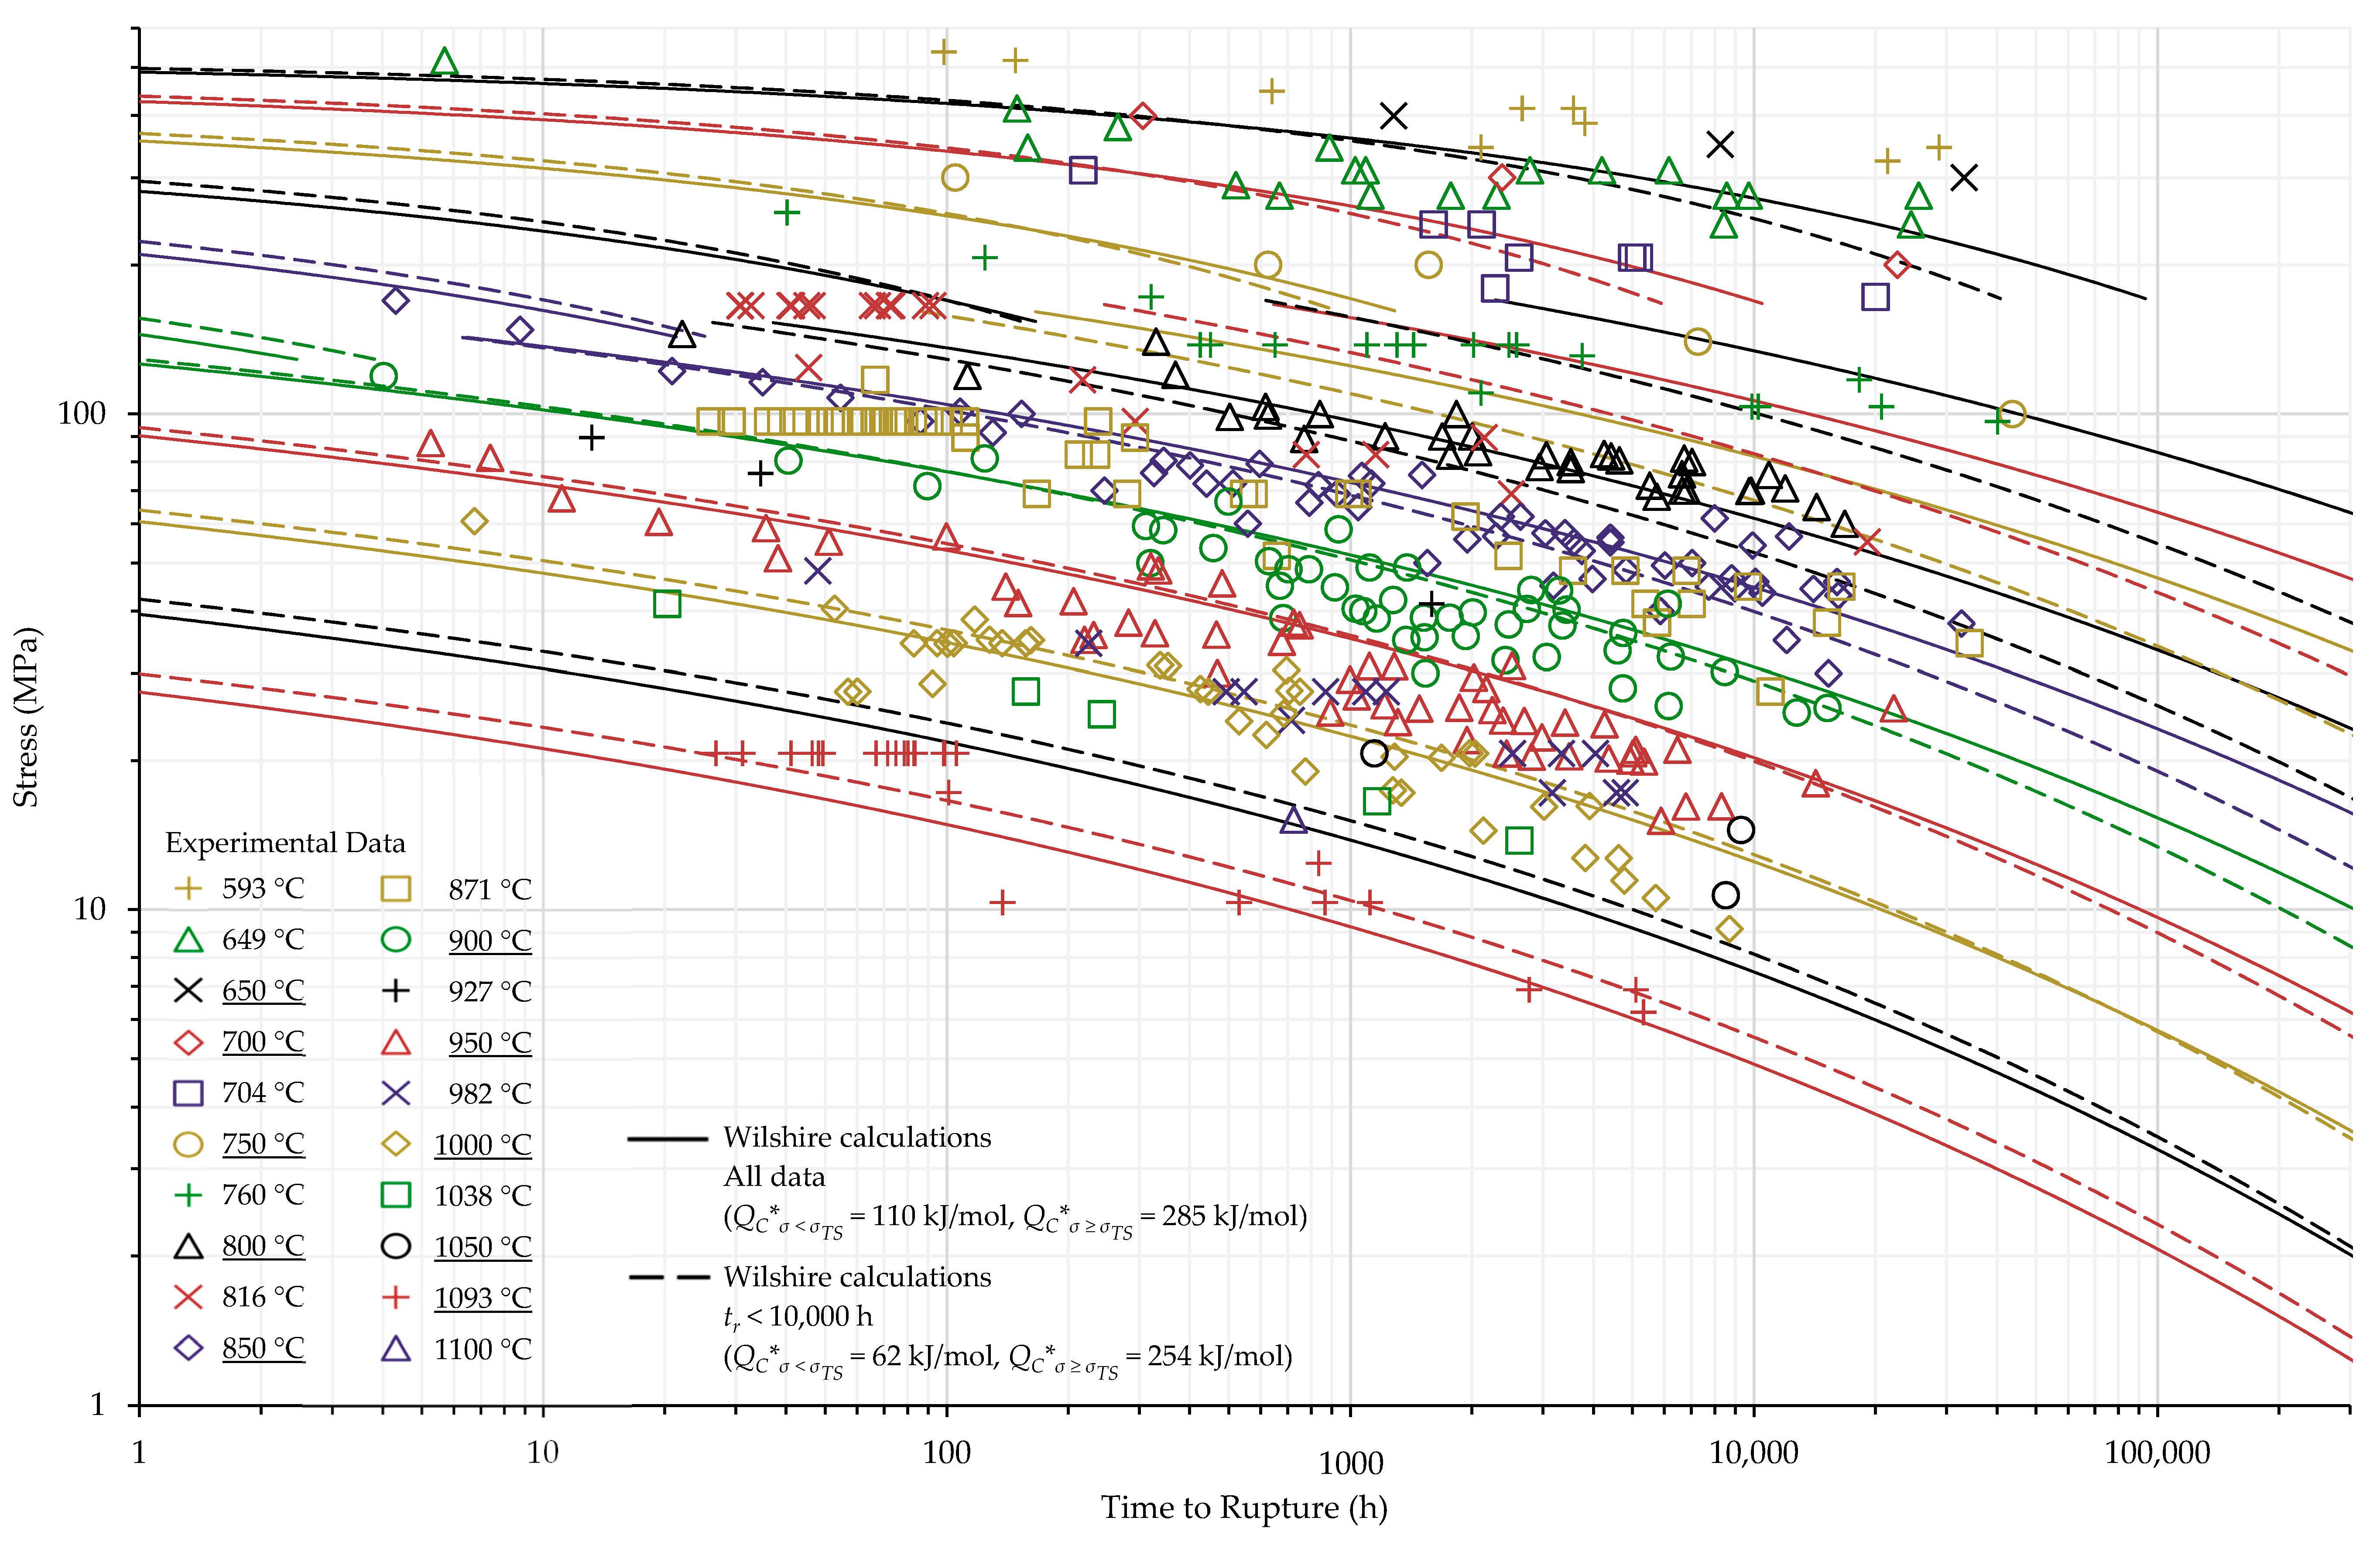
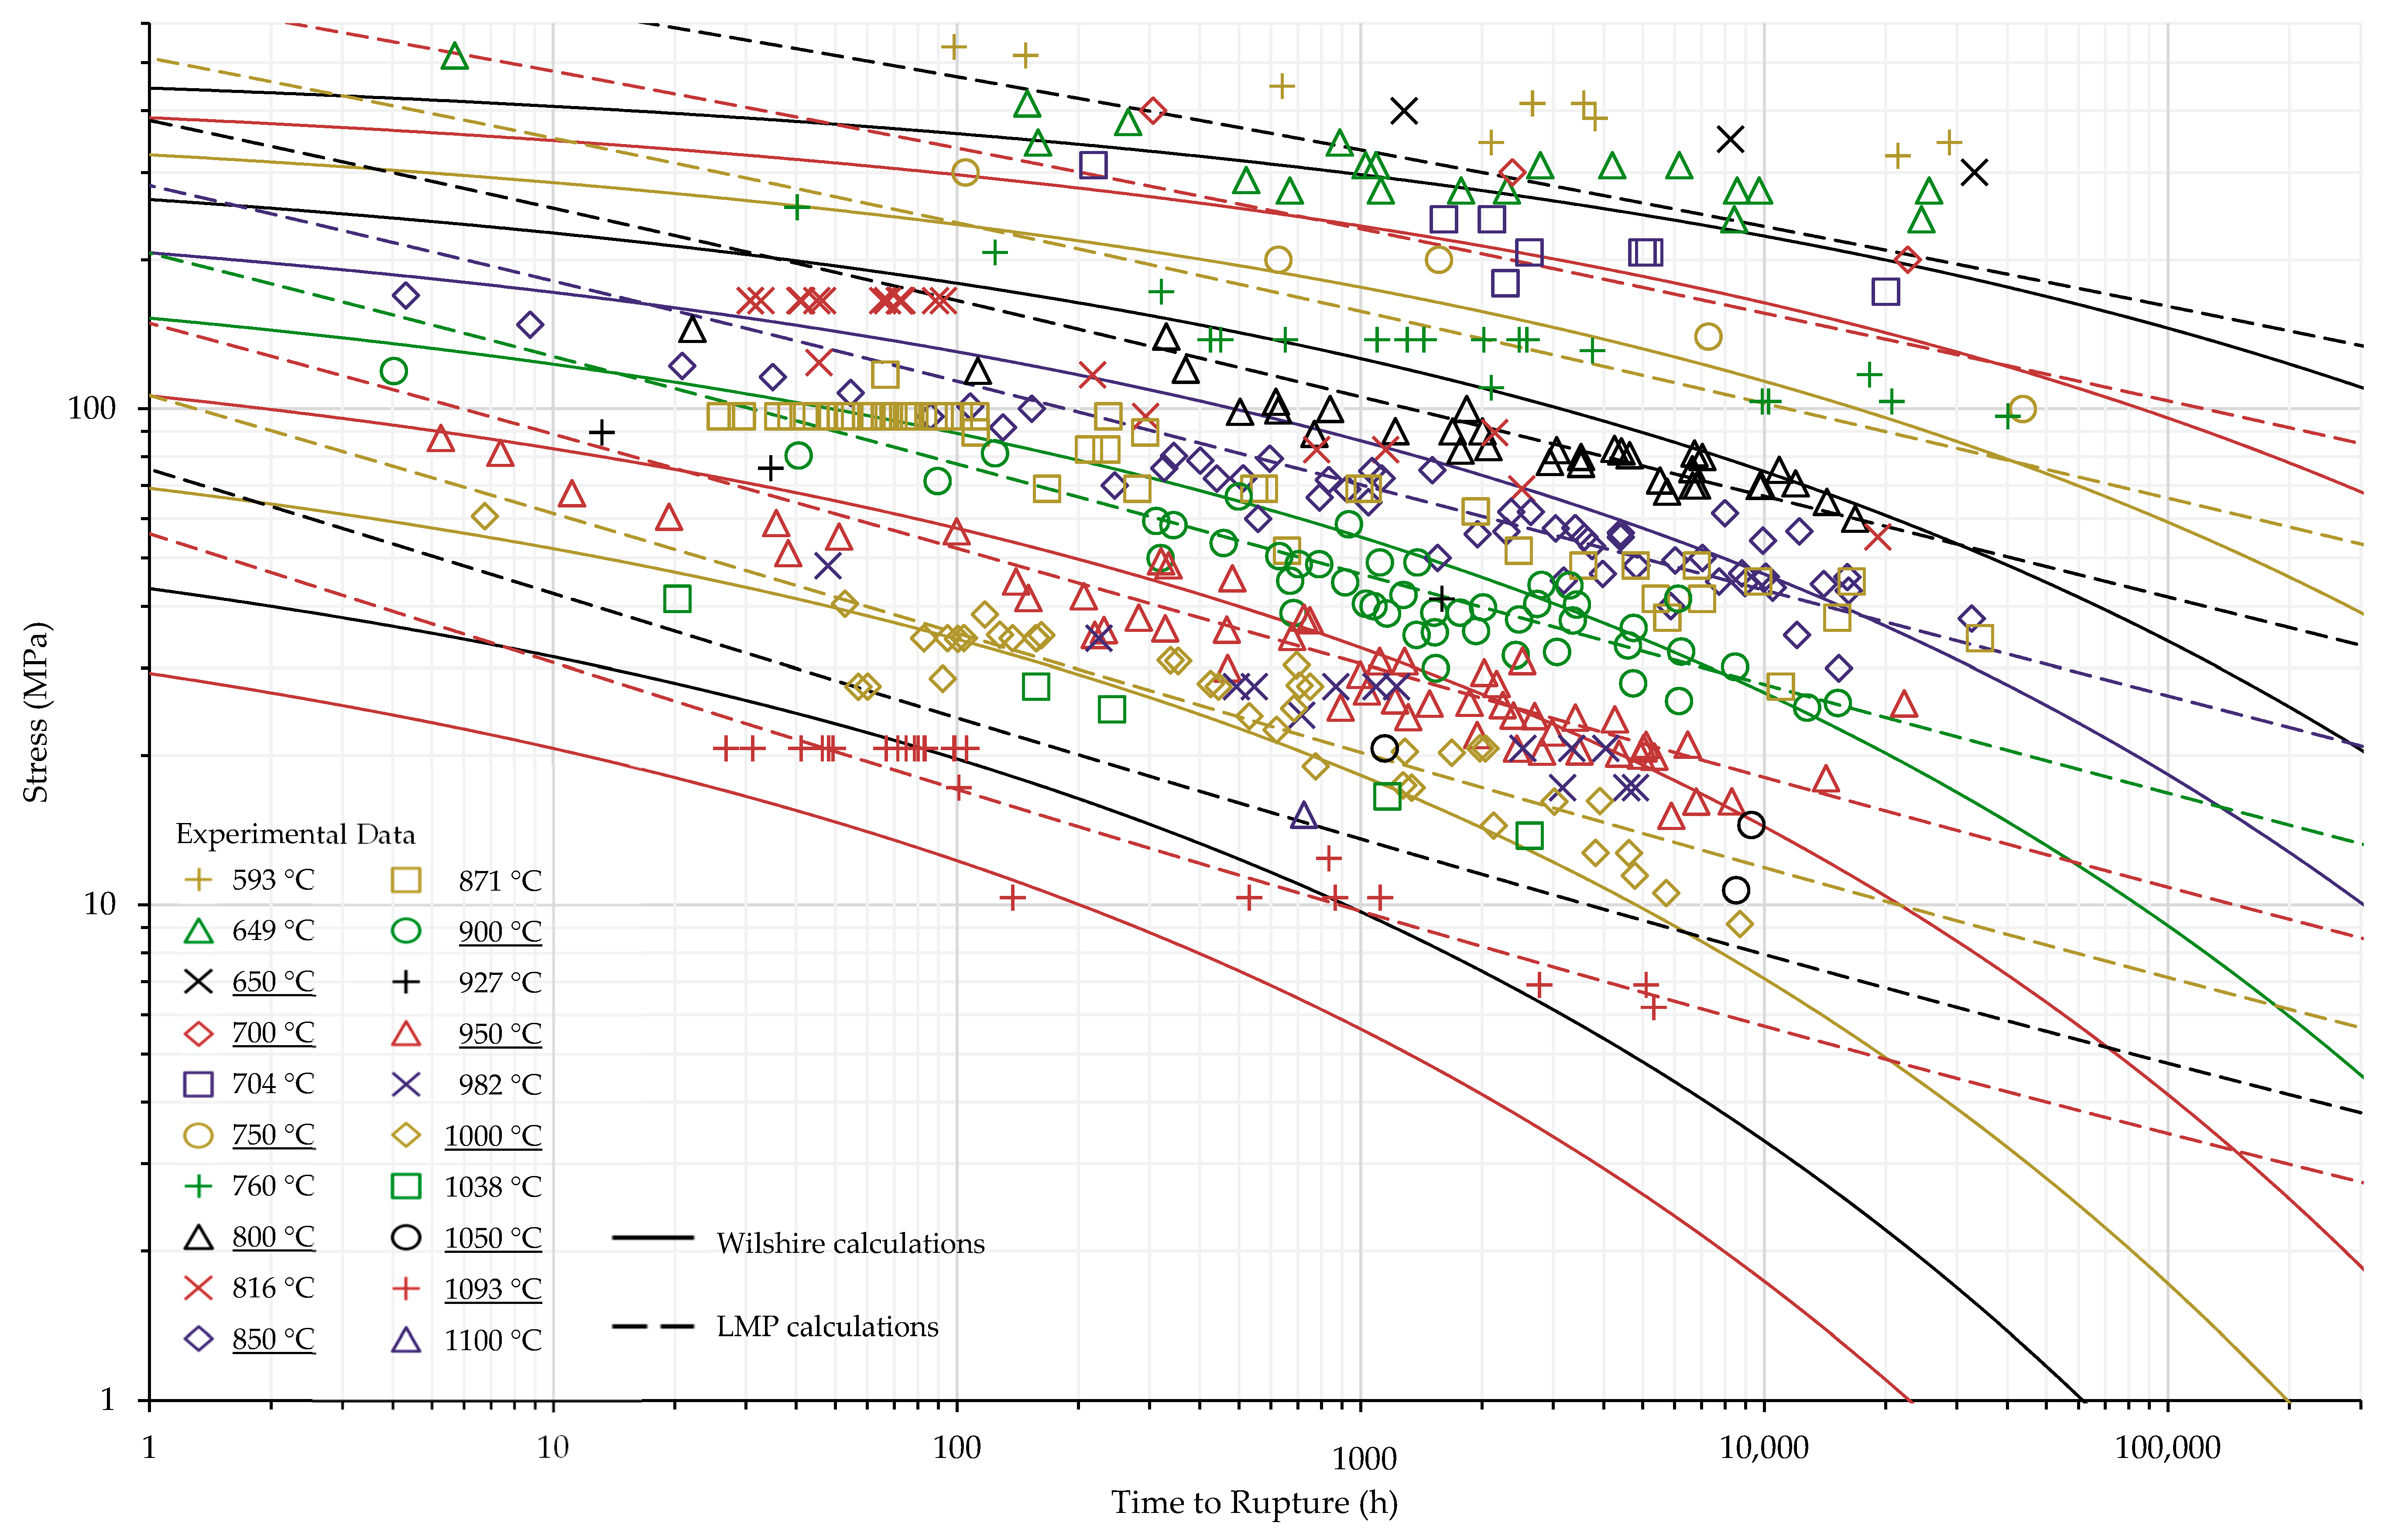
Calculated creep strengths for rupture at 100,000 h using the LMP and Wilshire equations are presented in Table 12 and Table 13. Figure 13 and Figure 14 show experimental creep data, calculations of the LMP equation, and calculations of the Wilshire equation using the Q C * value that yielded the lowest error. For ease of displaying the calculations, the y axis of Figure 14 is stress normalized by tensile strength, and the stresses calculated using the LMP equation are normalized by average tensile strength values. Calculated times to rupture for each data point and method to determine Q C * for Nimonic 105 are shown in Table A2 in Appendix A. The form of the stress function used in the LMP equation can result in multiple values of stress to be calculated at a single rupture time; however, this issue was not observed for either data set. For Inconel 617, the calculations of the Wilshire equation are more conservative than those of the LMP equation at failure times approaching and beyond 100,000 h. Nimonic 105 exhibited the same behavior at 800 and 850 °C. For Inconel 617, both the Wilshire and LMP equations predicted 100,000 h creep strengths lower or only slightly higher than the values calculated by the ECCC, including the temperature range of 800 to 900 °C where both equations overpredicted creep life vs. the experimental data (see Figure 11).

5. Conclusions

This study investigated multiple methods to determine Q C * , the effect of region-splitting, the use of short-term creep rupture data to extrapolate creep life, and the use of heat- and processing-specific tensile strength values, all of which are techniques that have been used or proposed to increase the accuracy of the Wilshire equation.
The large temperature span of Inconel 617 data, over 500 °C, may be the cause for relatively poor fits of both the Wilshire and LMP models to the data. At higher temperatures, greater than 850 °C, microstructural changes that affect creep strength may be accelerated, or other strength degradation phenomena might become significant that do not occur at lower temperatures. For Inconel 617, the mean squared error of the calculated creep life using the self-diffusion activation energy of nickel in a nickel lattice as Q C * was about an order of magnitude greater than the other methods to determine Q C * . The large scatter and temperature range may have exacerbated potential error introduced by using the self-diffusion activation energy as Q C * , rather than using a value calculated from the data. With the well-behaved Nimonic 105 data, a very similar goodness of fit was obtained using any of the three methods for determining Q C * . It is possible that calculations of the Wilshire equation are not significantly affected by the Q C * value when a small data set with low scatter is used. If a high degree of fit to the data is required, the authors recommend that self-diffusion activation energy not be used as Q C * due to the potential for large error, as seen for Inconel 617. Using the Q C * value that provided the lowest error, the longest time to rupture for both alloys was underpredicted, which is much more desirable than overprediction. Contrary to expectations, treating the data as a single region—rather than splitting the data into above- and below-yield stress regions—provided the lowest mean squared errors for Inconel 617. The use of heat- and processing-specific tensile strength values greatly improved the goodness of fit of the Wilshire equation to the Nimonic 105 data and reduced the error in all cases. For Inconel 617, the use of data with rupture times less than 10,000 h to extrapolate creep life gave roughly similar goodness of fit and error compared to using all data. Surprisingly, for Nimonic 105 the use of data with rupture times less than 10,000 h to extrapolate creep life resulted in a significant reduction in goodness of fit and error compared to using all data, e.g., R2 of 0.880 versus 0.950 when Q C * was determined using the correlation optimization method. Considering that the longest Nimonic 105 experimental data point was 34,995 h time to rupture, this result would suggest that further investigation should be made of the ability of the Wilshire equation to accurately predict long-term creep strength from short-term creep rupture strength data.
In its basic form, the Wilshire equation is a simple method to quickly estimate long-term creep life using only three fitting constants—yet if an extensive analysis with a high level of precision is required, its complexity can be increased to improve the statistical fit of the Wilshire equation to available data. Evans [41,49,50,51,52,53,54] has proposed more sophisticated methods of fitting the Wilshire equation to complex data sets, including the handling of data collected from specimens of multiple batches [41], determining Q C * as a function of temperature [41], statistically determining the number of stress regions [49], and utilizing additional batch characteristics [50]. The Wilshire equation is modular in that many combinations of these methods can be used, which gives it flexibility for a wide variety of applications. If only a preliminary estimate of long-term creep strength (e.g., at 100,000 h or longer design life) is needed, such as in the early stages of new alloy development, use of the Wilshire equation in its original form with Q C * equal to the activation energy of self-diffusion would probably be sufficient. More complex analyses (which, in essence, increase the number of fitting constants) would be needed if the intent is to use the Wilshire equation for component design or for establishing long-term creep strength values for design codes, instead of the equations now used in various design codes, and which contain more than three fitting constants.

Author Contributions

Conceptualization, V.C.III; Methodology, V.C.III, C.G. and M.R.; Validation, C.G. and M.R.; Formal Analysis, C.G. and M.R.; Investigation, V.C.III, C.G., and M.R.; Resources, V.C.III; Data Curation, V.C.III, C.G., and M.R.; Writing—Original Draft Preparation, C.G. and M.R; Writing—Review & Editing, V.C.III; Visualization, C.G. and M.R.; Supervision, V.C. III; Project Administration, V.C. III; Funding Acquisition, V.C.III.
Funding: KeyLogic Systems, Inc.’s contributions to this work were funded by the National Energy Technology Laboratory under the Mission Execution and Strategic Analysis contract (DE-FE0025912) for support services.

Acknowledgments

This research was made possible thanks to the Mickey Leland Fellowship Program, a United States Department of Energy funded program.

Conflicts of Interest

The authors declare no conflict of interest.

Disclaimer

This report was prepared as an account of work sponsored by an agency of the United States Government. Neither the United States Government nor any agency thereof, nor any of their employees, makes any warranty, express or implied, or assumes any legal liability or responsibility for the accuracy, completeness, or usefulness of any information, apparatus, product, or process disclosed, or represents that its use would not infringe privately owned rights. Reference therein to any specific commercial product, process, or service by trade name, trademark, manufacturer, or otherwise does not necessarily constitute or imply its endorsement, recommendation, or favoring by the United States Government or any agency thereof. The views and opinions of authors expressed therein do not necessarily state or reflect those of the United States Government or any agency thereof.

Appendix A

Figure A1. Wilshire plots of Inconel 617 creep rupture data treated as a single region.
Materials 11 02534 g0a1
Figure A2. Wilshire plots of Inconel 617 creep rupture data split into above- and below-yield stress regions.
Materials 11 02534 g0a2
Figure A3. Wilshire plots of Inconel 617 creep rupture data split into above- and below-yield stress regions.
Materials 11 02534 g0a3
Figure A4. Wilshire plots of Nimonic 105 creep rupture data using average tensile strength values.
Materials 11 02534 g0a4
Figure A5. Wilshire plots of Nimonic 105 creep rupture data using heat- and processing-specific tensile strength values.
Materials 11 02534 g0a5
Figure A6. Single region calculations of the Wilshire equation with Q C * determined using Arrhenius plots for Inconel 617 shown at underlined temperatures.
Materials 11 02534 g0a6
Figure A7. Single region calculations of the Wilshire equation with Q C * determined by optimizing the correlation of data on a Wilshire plot for Inconel 617 shown at underlined temperatures.
Materials 11 02534 g0a7
Figure A8. Single region calculations of the Wilshire equation with the self-diffusion activation energy of nickel in a nickel lattice as Q C * for Inconel 617 shown at underlined temperatures.
Materials 11 02534 g0a8
Figure A9. Split region calculations of the Wilshire equation with Q C * determined using Arrhenius plots for Inconel 617 shown at underlined temperatures.
Materials 11 02534 g0a9
Figure A10. Split region calculations of the Wilshire equation with Q C * determined using Arrhenius plots for Inconel 617 shown at underlined temperatures.
Materials 11 02534 g0a10
Figure A11. Split region calculations of the Wilshire equation with Q C * determined by optimizing the correlation of data on a Wilshire plot for Inconel 617 shown at underlined temperatures.
Materials 11 02534 g0a11
Figure A12. Split region calculations of the Wilshire equation with Q C * determined by optimizing the correlation of data on a Wilshire plot for Inconel 617 shown at underlined temperatures.
Materials 11 02534 g0a12
Figure A13. Single region calculations of the Wilshire equation with the self-diffusion activation energy of nickel in a nickel lattice as Q C * for Inconel 617 shown at underlined temperatures.
Materials 11 02534 g0a13
Figure A14. Calculations of the Wilshire equation for Nimonic 105 using average tensile strength values with Q C * determined using Arrhenius plots.
Materials 11 02534 g0a14
Figure A15. Calculations of the Wilshire equation for Nimonic 105 using average tensile strength values with Q C * determined by optimizing the correlation of data on a Wilshire plot.
Materials 11 02534 g0a15
Figure A16. Calculations of the Wilshire equation for Nimonic 105 using average tensile strength values with the self-diffusion activation energy of nickel in a nickel lattice as Q C * .
Materials 11 02534 g0a16
Figure A17. Split region calculations of the Wilshire equation for Nimonic 105 using heat- and processing-specific tensile strength values with Q C * determined using Arrhenius plots.
Materials 11 02534 g0a17
Figure A18. Calculations of the Wilshire equation for Nimonic 105 using heat- and processing-specific tensile strength values with Q C * determined by optimizing the correlation of data on a Wilshire plot.
Materials 11 02534 g0a18
Figure A19. Calculations of the Wilshire equation for Nimonic 105 using heat- and processing-specific tensile strength values with the self-diffusion activation energy of nickel in a nickel lattice as Q C * .
Materials 11 02534 g0a19
Table A1. Nimonic 105 tensile strength values [3,4,21].
TemperatureHeat No.Processing ConditionTensile Strength (MPa)Yield Strength (MPa)
760 °C5183AP834737
PA886724
OA975722
5793PA863719
UnknownPA 1893687
816 °C5183AP718680
PA728625
OA720605
5793PA729672
UnknownPA 1751610
1 Aged for 1–2 years at 774 °C.
Table A2. Calculated times to rupture (h) for each method to determine Q C * for Nimonic 105.
Heat No. [3,4,21]Processing Condition [3,4,21]Temperature (°C) [3,4,21]Applied Stress (MPa) [3,4,21]Heat- and Processing-Specific TS (MPa) [3,4,21]Experimental Time to Rupture (h) [3,4,21]Calculated Time to Rupture (h)
Case 1Case 2Case 3Case 4Case 5Case 6Case 7Case 8Case 9Case 10Case 11Case 12LMP Equation
5183AP76031083420921545154515451771177317681281132413401401140013781729
5183AP76027683427134617463846514572451446203170335036375054526357174950
5183AP760241834891414,06814,20114,28112,01111,68812,28479348571999811,94912,79514,84313,395
5183AP77427680522681999198919842091211020751933189117342699266525892640
5183AP77424180545606351635263525695566357224979498249206590669769667052
5183AP77420780510,54620,87920,98821,05515,97615,64316,26113,13213,44814,32616,52017,29619,30118,524
5183AP78824177625372834280927932677272026433094287124073600347532443775
5183AP78820777659469720968396627791779077958398798272349324928193199792
5183AP788190776896918,34818,32918,31913,51313,40113,61414,03213,50312,73915,23015,40316,05616,106
5183OA76025997515,51580328088812273887242751113,68114,97418,2287751818491858187
5183OA77422491121,17311,45011,48111,49994929366959816,94017,45418,96810,38810,71411,53911,405
5183OA78822484710,3175221518851684546458245188812838676285770565554736067
5183PA76031088618491545154515451771177317682060215522622170219922391729
5183PA76024188612,17014,06814,20114,28112,01111,68812,28411,61812,66515,22211,94912,79514,84313,395
5183PA77427684716551999198919842091211020752793275726022699266525892640
5183PA77424184780456351635263525695566357226913697270646590669769667052
5183PA78824180742742834280927932677272026434036377032263600347532443775
5793PA76029386331142667267326762842282528542592272629143308339835742949
5793PA76027686343824617463846514572451446204025427847335054526357174950
5793PA76022486322,21624,87225,16825,34819,68219,01220,25515,49117,00420,90218,55420,15124,17721,804
5793PA77425982945193553354435393442344834363808378536614207421542364338
5793PA77420782911,12320,87920,98821,05515,97615,64316,26115,61516,05717,33916,52017,29619,30118,524
5793PA77422482911,74611,45011,48111,4999492936695989679984010,23510,38810,71411,53911,405
5793PA78825979628451550153215211587162515562278209917172259214819352337
5793PA78820779610,2779720968396627791779077959791934185689324928193199792
UnknownPA76022189334,95527,91228,25828,46921,75020,97922,41220,81623,01328,94920,28222,09226,68624,039
UnknownPA77422185718,58312,89912,94012,96510,52410,36910,65613,01313,32314,18411,38911,78212,77912,557
UnknownPA77719385024,99430,49930,67530,78221,94221,42722,38525,30325,98428,40222,21923,33626,30624,288
UnknownPA78819382215,97516,13716,11216,09812,09012,00912,16317,52216,95116,27213,79313,90414,38414,544
UnknownPA78817982224,95127,08927,10827,12118,94218,69019,16426,19025,58225,34020,57721,01322,41422,110
UnknownPA80217978612,18712,40012,29812,23991169185906616,57015,04412,70811,45911,12910,68711,758
UnknownPA80216578618,36321,50021,37421,30114,68914,69414,69625,33823,24120,29517,52717,25917,12018,490
UnknownPA81616575110,12298119669958570617210694516,03513,69210,2289733912281579935
Case 1: Data Set = All Data, Average TS values, Q C * Determination Method = Arrhenius Plot, Q C * = 284, u = 0.0975, k1 = 12.9.
Case 2: Data Set = All Data, Average TS values, Q C * Determination Method = Correlation Optimization, Q C * = 289, u = 0.0971, k1 = 13.5.
Case 3: Data Set = All Data, Average TS values, Q C * Determination Method = Self-diffusion Activation, Q C * = 292, u = 0.0969, k1 = 13.8.
Case 4: Data Set = All Data, Heat- and processing-specific TS values, Q C * Determination Method = Arrhenius Plot, Q C * = 283, u = 0.114, k1 = 18.4.
Case 5: Data Set = All Data, Heat- and processing-specific TS values, Q C * Determination Method = Correlation Optimization, Q C * = 272, u = 0.115, k1 = 16.3.
Case 6: Data Set = All Data, Heat- and processing-specific TS values, Q C * Determination Method = Self-diffusion Activation, Q C * = 292, u = 0.113, k1 = 20.2.
Case 7: Data Set = Data with tr < 10,000 h, Average TS values, Q C * Determination Method = Arrhenius Plot, Q C * = 150, u = 0.132, k1 = 3.91.
Case 8: Data Set = Data with tr < 10,000 h, Average TS values, Q C * Determination Method = Correlation Optimization, Q C * = 196, u = 0.126, k1 = 7.20.
Case 9: Data Set = Data with tr < 10,000 h, Average TS values, Q C * Determination Method = Self-diffusion Activation, Q C * = 292, u = 0.111, k1 = 19.9.
Case 10: Data Set = Data with tr < 10,000 h, Heat- and processing-specific TS values, Q C * Determination Method = Arrhenius Plot, Q C * = 207, u = 0.126, k1 = 8.32.
Case 11: Data Set = Data with tr < 10,000 h, Heat- and processing-specific TS values, Q C * Determination Method = Correlation Optimization, Q C * = 235, u = 0.122, k1 = 11.6.
Case 12: Data Set = Data with tr < 10,000 h, Heat- and processing-specific TS values, Q C * Determination Method = Self-diffusion Activation, Q C * = 292, u = 0.114, k1 = 20.9.

References

  1. Purgert, R.; Shingledecker, J.; Pschirer, J.; Ganta, R.; Weitzel, P.; Sarver, J.; Vitalis, B.; Gagliano, M.; Stanko, G.; Tortorelli, P. Boiler Materials for Ultra Supercritical Coal Power Plants; Report No. DOE-EIO-EPRI-01NT41175; US Department of Energy: Washington, DC, USA, 2016. [CrossRef]
  2. Tortorelli, P.F.; Wang, H.; Unocic, K.A.; Santella, M.L.; Shingledecker, J.P.; Cedro III, V. Long-Term Creep-Rupture Behavior of Inconel® 740 and Haynes® 282. In Proceedings of the ASME 2014 Symposium on Elevated Temperature Application of Materials for Fossil, Nuclear, and Petrochemical Industries, Seattle, WA, USA, 25–27 March 2014. [Google Scholar] [CrossRef]
  3. Viswanathan, R.; Hawk, J.; Schwant, R.; Saha, D.; Totemeier, T.; Goodstine, S.; McNally, M.; Allen, D.B.; Purgert, R. Steam Turbine Materials for Ultrasupercritical Coal Power Plants; US Department of Energy: Washington, DC, USA, 2009. [CrossRef]
  4. Purgert, R.; Shingledecker, J.; Saha, D.; Thangirala, M.; Booras, G.; Powers, J.; Riley, C.; Hendrix, H. Materials for Advanced Ultrasupercritical Steam Turbines; US Department of Energy: Washington, DC, USA, 2015. [CrossRef]
  5. Wilshire, B.; Battenbough, A.J. Creep and creep fracture of polycrystalline copper. Mater. Sci. Eng. A 2007, 443, 156–166. [Google Scholar] [CrossRef]
  6. Wilshire, B.; Scharning, P.J. A new methodology for analysis of creep and creep fracture data for 9–12% chromium steels. Int. Mater. Rev. 2008, 53, 91–104. [Google Scholar] [CrossRef]
  7. Arrhenius, S.A. Über die Dissociationswärme und den Einfluß der Temperatur auf den Dissociationsgrad der Elektrolyte. Z. Phys. Chem. 1889, 4, 96–116. [Google Scholar] [CrossRef]
  8. Norton, F.H. The Creep of Steels at High Temperatures; McGraw-Hill: New York, NY, USA, 1929. [Google Scholar]
  9. Monkman, F.C.; Grant, N.J. An empirical relationship between rupture life and minimum creep rate in creep-rupture tests. Proc. Am. Soc. Test Mater. 1956, 56, 593–620. [Google Scholar]
  10. Bonora, N.; Esposito, L. Mechanism based creep model incorporating damage. J. Eng. Mater. Technol. 2010, 132, 021013. [Google Scholar] [CrossRef]
  11. Esposito, L.; Bonora, N.; De Vita, G. Creep modelling of 316H stainless steel over a wide range of stress. Proc. Struct. Int. 2016, 2, 927–933. [Google Scholar] [CrossRef]
  12. Abdallah, Z.; Gray, V.; Whittaker, M.; Perkins, K. A critical analysis of the conventionally employed creep lifing methods. Materials 2014, 5, 3371–3398. [Google Scholar] [CrossRef]
  13. Bolton, J. Reliable analysis and extrapolation of creep rupture data. Int. J. Pres. Ves. Pip. 2017, 157, 1–19. [Google Scholar] [CrossRef]
  14. Larson, F.R.; Miller, J. A Time-Temperature Relationship for Rupture and Creep Stresses. Trans. ASME 1952, 74, 765–771. [Google Scholar]
  15. Dagra Data Digitizer. Available online: http://www.datadigitization.com/ (accessed on 2 May 2018).
  16. Lillo, T. High Temperature Alloy 617 Properties for Engineering Design: Program Overview & Approach to ASME Code Qualification. In Proceedings of the Technical Meeting on High-Temperature Qualification of High Temperature Gas Cooled Reactor Materials, Vienna, Austria, 10–13 June 2014. [Google Scholar]
  17. Schubert, F.; Bruch, U.; Cook, R.; Diehl, H.; Ennis, P.J.; Jakobeit, W.; Penkalla, H.J.; Heesen, E.T.; Ullrich, G. Creep rupture behavior of candidate materials for nuclear process heat applications. Nucl. Technol. 1984, 66, 227–240. [Google Scholar] [CrossRef]
  18. Kim, W.G.; Park, J.Y.; Ekaputra, I.M.W.; Kim, S.J.; Kim, M.H.; Kim, Y.W. Creep deformation and rupture behavior of Alloy 617. Eng. Fail. Anal. 2015, 58, 441–451. [Google Scholar] [CrossRef]
  19. Kim, W.G.; Ekaputra, I.M.W.; Park, J.Y.; Kim, M.H.; Kim, Y.W. Investigation of creep rupture properties in air and He environments of alloy 617 at 800 °C. Nucl. Eng. Des. 2016, 306, 177–185. [Google Scholar] [CrossRef]
  20. Ren, W.; Swindeman, R.W. Assessment of Existing Alloy 617 Data for Gen IV Materials Handbook; Report No. ORNL/TM-2005/510; US Department of Energy: Washington, DC, USA, 2015. [CrossRef]
  21. Saha, D.; (General Electric Company, Power & Water Division, Schenectady, NY, USA). Personal communication, 2012.
  22. Cedro, V., III; Garcia, C.; Render, M. Use of the Wilshire Equations to Correlate and Extrapolate Creep Data of HR6W and Sanicro 25. Materials 2018, 11, 1585. [Google Scholar] [CrossRef] [PubMed]
  23. Wilshire, B.; Scharning, P.J.; Hurst, R. New methodology for long term creep data generation for power plant components. Energy Mater. 2007, 2, 84–88. [Google Scholar] [CrossRef]
  24. Wilshire, B.; Scharning, P.J. Theoretical and practical approaches to creep of Waspaloy. Mater. Sci. Technol. 2009, 25, 242–248. [Google Scholar] [CrossRef]
  25. Wilshire, B.; Scharning, P.J. Prediction of long term creep data for forged 1Cr–1Mo–0.25V steel. Mater. Sci. Technol. 2008, 24, 1–9. [Google Scholar] [CrossRef]
  26. Wilshire, B.; Scharning, P.J. Long-term creep life prediction for a high chromium steel. Scr. Mater. 2007, 56, 701–704. [Google Scholar] [CrossRef]
  27. Wilshire, B.; Scharning, P.J. Extrapolation of creep life data for 1Cr–0.5 Mo steel. Int. J. Pres. Ves. Pip. 2008, 85, 739–743. [Google Scholar] [CrossRef]
  28. Wilshire, B.; Scharning, P.J. Creep and creep fracture of commercial aluminum alloys. J. Mater. Sci. 2008, 43, 3992–4000. [Google Scholar] [CrossRef]
  29. Wilshire, B.; Scharning, P.J.; Hurst, R. A new approach to creep data assessment. Mater. Sci. Eng. A 2009, 510, 3–6. [Google Scholar] [CrossRef] [Green Version]
  30. Wilshire, B.; Whittaker, M.T. The role of grain boundaries in creep strain accumulation. Acta Mater. 2009, 57, 4115–4124. [Google Scholar] [CrossRef]
  31. Wilshire, B.; Scharning, P.J. Creep ductilities of 9–12% chromium steels. Scr. Mater. 2007, 56, 1023–1026. [Google Scholar] [CrossRef]
  32. Whittaker, M.T.; Harrison, W.J. Evolution of Wilshire equations for creep life prediction. Mater. High Temp. 2014, 31, 233–238. [Google Scholar] [CrossRef] [Green Version]
  33. Whittaker, M.T.; Evans, M.; Wilshire, B. Long-term creep data prediction for type 316H stainless steel. Mater. Sci. Eng. A 2012, 552, 145–150. [Google Scholar] [CrossRef] [Green Version]
  34. Whittaker, M.T.; Harrison, W.J.; Lancaster, R.J.; Williams, S. An analysis of modern creep lifing methodologies in the titanium alloy Ti6-4. Mater. Sci. Eng. A 2013, 577, 114–119. [Google Scholar] [CrossRef] [Green Version]
  35. Jeffs, S.P.; Lancaster, R.J.; Garcia, T.E. Creep lifing methodologies applied to a single crystal superalloy by use of small scale test techniques. Mater. Sci. Eng. A 2015, 636, 529–535. [Google Scholar] [CrossRef]
  36. Whittaker, M.T.; Wilshire, B. Long term creep life prediction for Grade 22 (2.25Cr–1Mo) steels. Mater. Sci. Technol. 2011, 27, 642–647. [Google Scholar] [CrossRef]
  37. Gray, V.; Whittaker, M. The changing constants of creep: A letter on region splitting in creep lifing. Mater. Sci. Eng. A 2015, 632, 96–102. [Google Scholar] [CrossRef]
  38. Whittaker, M.; Wilshire, B. Creep and creep fracture of 2.25 Cr–1.6 W steels (Grade 23). Mater. Sci. Eng. A 2010, 527, 4932–4938. [Google Scholar] [CrossRef]
  39. Whittaker, M.; Wilshire, B. Advanced procedures for long-term creep data prediction for 2.25 chromium steels. Metall. Mater. Trans. A 2013, 44, 136–153. [Google Scholar] [CrossRef]
  40. Whittaker, M.; Harrison, W.; Deen, C.; Rae, C.; Williams, S. Creep deformation by dislocation movement in Waspaloy. Materials 2017, 10, 61. [Google Scholar] [CrossRef] [PubMed]
  41. Evans, M. A Re-Evaluation of the Causes of Deformation in 1Cr-1Mo-0.25 V Steel for Turbine Rotors and Shafts Based on iso-Thermal Plots of the Wilshire Equation and the Modelling of Batch to Batch Variation. Materials 2017, 10, 575. [Google Scholar] [CrossRef] [PubMed]
  42. Zhu, X.W.; Cheng, H.H.; Shen, M.H.; Pan, J.P. Determination of C Parameter of Larson-miller Equation for 15CrMo steel. Adv. Mater. Res. 2013, 791, 374–377. [Google Scholar] [CrossRef]
  43. MacEwan, J.R.; MacEwan, J.U.; Yaffe, L. Self-diffusion in polycrystalline Nickel. Can. J. Chem. 1959, 37, 1623–1628. [Google Scholar] [CrossRef]
  44. Whittaker, M.; Wilshire, B.; Brear, J. Creep fracture of the centrifugally-cast superaustenitic steels, HK40 and HP40. Mater. Sci. Eng. A 2013, 580, 391–396. [Google Scholar] [CrossRef]
  45. Fujio, A.; Tabuchi, M.; Hayakawa, M. Influence of Data Scattering on Estimation of 100,000 hrs Creep Rupture Strength of Alloy 617 at 700 °C by Larson–Miller Method. J. Press. Vessel Technol. 2017, 139, 011403. [Google Scholar] [CrossRef]
  46. Woo-Gon, K.; Yin, S.N.; Kim, Y.W.; Ryu, W.S. Creep behaviour and long-term creep life extrapolation of alloy 617 for a very high temperature gas-cooled reactor. Trans. Indian Inst. Met. 2010, 63, 145–150. [Google Scholar] [CrossRef]
  47. ECCC Data Sheets 2017. Available online: http://eccc.c-s-m.it/layout_html_standard/en/eccc_european_creep_collaborative_committee/eccc_data_sheets_2017.html (accessed on 21 August 2018).
  48. Bullough, C.; Krein, R.; Lombardi, P.; Spindler, M.; Poggio, E. Development of an ECCC Interim Creep Rupture Datasheet for Alloy 617B using a Strength Averaging and Blending Approach. In Proceedings of the 4th International ECCC Creep & Fracture Conference, Düsseldorf, Germany, 10–14 September 2017. [Google Scholar]
  49. Evans, M. A Statistical Test for Identifying the Number of Creep Regimes When Using the Wilshire Equations for Creep Property Predictions. Metall. Mater. Trans. A 2016, 47, 6593–6607. [Google Scholar] [CrossRef]
  50. Evans, M. Incorporating specific batch characteristics such as chemistry, heat treatment, hardness and grain size into the Wilshire equations for safe life prediction in high temperature applications: An application to 12Cr stainless steel bars for turbine blades. Appl. Math. Model. 2016, 40, 10342–10359. [Google Scholar] [CrossRef]
  51. Evans, M. Formalisation of Wilshire–Scharning methodology to creep life prediction with application to 1Cr–1Mo–0·25V rotor steel. Mater. Sci. Technol. 2010, 26, 309–317. [Google Scholar] [CrossRef]
  52. Evans, M. Obtaining confidence limits for safe creep life in the presence of multi batch hierarchical databases: An application to 18Cr–12Ni–Mo steel. Appl. Math. Model. 2011, 35, 2838–2854. [Google Scholar] [CrossRef]
  53. Evans, M. The importance of creep strain in linking together the Wilshire equations for minimum creep rates and times to various strains (including the rupture strain): An illustration using 1CrMoV rotor steel. J. Mater. Sci. 2014, 49, 329–339. [Google Scholar] [CrossRef]
  54. Evans, M. Constraints Imposed by the Wilshire Methodology on Creep Rupture Data and Procedures for Testing the Validity of Such Constraints: Illustration Using 1Cr-1Mo-0.25 V Steel. Metall. Mater. Trans. A 2015, 46, 937–947. [Google Scholar] [CrossRef]
Figure 1. Goodness of fit of creep rupture data on Wilshire plots for: (a) Inconel 617 data treated as a single region; (b) Inconel 617 data split into above- and below-yield stress regions; (c) Nimonic 105 data with averaged tensile strength values; and (d) Nimonic 105 data with heat- and processing-specific tensile strength values.
Materials 11 02534 g001aMaterials 11 02534 g001b
Figure 2. R2 and MSE vs. Q C * for all data.
Materials 11 02534 g002
Figure 3. Single region calculations of the Wilshire equation with the lowest error for Inconel 617 shown at underlined temperatures.
Materials 11 02534 g003
Figure 4. Split region calculations of the Wilshire equation with the lowest error for Inconel 617 shown at underlined temperatures.
Materials 11 02534 g004
Figure 5. Calculations of the Wilshire equation with the lowest error for Nimonic 105 using averaged tensile strength values.
Materials 11 02534 g005
Figure 6. Calculations of the Wilshire equation with the lowest error for Nimonic 105 using heat- and processing-specific tensile strength values.
Materials 11 02534 g006
Figure 7. Average percentage difference at each temperature for Inconel 617 using all data to calculate Q C * (kJ/mol).
Materials 11 02534 g007
Figure 8. Average percentage difference at each temperature for Inconel 617 using data with times to rupture less than 10,000 h to calculate Q C * (kJ/mol).
Materials 11 02534 g008
Figure 9. Average percentage difference at each temperature for Nimonic 105 using all data to calculate Q C * (kJ/mol).
Materials 11 02534 g009
Figure 10. Average percentage difference at each temperature for Nimonic 105 using data with times to rupture less than 10,000 h to calculate Q C * (kJ/mol).
Materials 11 02534 g010
Figure 11. Average percentage difference of calculated and experimental rupture times for Inconel 617.
Materials 11 02534 g011
Figure 12. Average percentage difference of calculated and experimental rupture times for Nimonic 105.
Materials 11 02534 g012
Figure 13. Calculated rupture times for Inconel 617 shown at underlined temperatures.
Materials 11 02534 g013
Figure 14. Calculated rupture times for Nimonic 105.
Materials 11 02534 g014
Table 1. Inconel 617 Q C * values (kJ/mol) determined using Arrhenius plots.
Data SetStress RegionAverage Q C * σ / σ T S
0.10.20.30.40.50.60.70.80.9
All DataAll σ1906312211819325236217328401
σ < σYS11072152108−12 a−154 a
σ ≥ σYS28553031827416128401
tr < 10,000 hAll σ162506010615722730715126376
σ < σYS62456873−6 a−132 a
σ ≥ σYS25441328527814826376
a Omitted from average Q C * calculation.
Table 2. Nimonic 105 Q C * values (kJ/mol) determined using Arrhenius plots.
Data SetTensile StrengthAverage Q C * σ / σ T S
0.20.3
All DataAverage284372196
Heat- and processing-specific283311255
tr < 10,000 hAverage150150
Heat- and processing-specific207207
Table 3. Inconel 617 Q C * values (kJ/mol) determined using Arrhenius plots.
Data SetTensile Strength Q C *
All DataAll σ224
σ < σYS109
σσYS266
tr < 10,000 hAll σ202
σ < σYS90
σσYS235
Table 4. Nimonic 105 Q C * values (kJ/mol) determined by optimizing the correlation of data on Wilshire plots.
Data SetTensile Strength Q C *
All DataAverage289
Heat- and processing-specific272
tr < 10,000 hAverage196
Heat- and processing-specific235
Table 5. Quality of fit and error for Inconel 617.
Data SetSplit Regions? Q C * Determination Method Q C * All   σ Q C * σ < σ YS Q C * σ σ YS R2
All σ
R2
σ < σYS
R2
σσYS
MSE
All DataNoArrhenius Plot1900.742 2.11 × 10 7
Correlation Optimization2240.750 2.49 × 10 7
Self-Diffusion Activation2920.732 1.35 × 10 8
YesArrhenius Plot1900.7220.594 6.45 × 10 7
1102850.7940.677 3.58 × 10 7
Correlation Optimization2240.6650.657 1.74 × 10 8
1092660.7940.680 3.16 × 10 7
Self-Diffusion Activation2920.5420.674 2.74 × 10 9
tr < 10,000 hNoArrhenius Plot1620.724 2.31 × 10 7
Correlation Optimization2020.741 2.10 × 10 7
Self-Diffusion Activation2920.720 1.56 × 10 8
YesArrhenius Plot1620.7570.568 3.80 × 10 7
622540.7950.701 2.96 × 10 7
Correlation Optimization2020.6910.671 9.96 × 10 7
902350.8110.700 2.69 × 10 7
Self-Diffusion Activation2920.5300.682 4.76 × 10 9
Table 6. Quality of fit and error for Nimonic 105.
Data SetTensile Strength Q C * Determination Method Q C *
All σ
R2
All σ
MSE
All DataAverageArrhenius Plot2840.880 2.00 × 10 7
Correlation Optimization2890.880 2.01 × 10 7
Self-Diffusion Activation2920.880 2.02 × 10 7
Heat- and processing-specificArrhenius Plot2830.950 5.71 × 10 6
Correlation Optimization2720.950 5.96 × 10 6
Self-Diffusion Activation2920.949 5.58 × 10 6
tr < 10,000 hAverageArrhenius Plot1500.849 3.24 × 10 7
Correlation Optimization1960.854 2.86 × 10 7
Self-Diffusion Activation2920.838 2.02 × 10 7
Heat- and processing-specificArrhenius Plot2070.879 1.98 × 10 7
Correlation Optimization2350.880 1.81 × 10 7
Self-Diffusion Activation2920.875 1.67 × 10 7
Table 7. Calculated creep strength for rupture of Inconel 617 at 100,000 h (MPa).
Data SetSplit Regions? Q C *   Determination   Method Q C * All   σ Q C * σ < σ YS Q C * σ σ YS 650 (°C)700 (°C)750 (°C)760 (°C)800 (°C)850 (°C)900 (°C)
All DataNoArrhenius Plot19014695.859.053.234.018.39.07
Correlation Optimization22417111571.864.841.822.611.2
Self-Diffusion Activation29221014694.586.057.132.016.4
YesArrhenius Plot19013196.167.963.146.330.318.8
11028583.663.346.643.833.423.215.3
Correlation Optimization22414810977.271.852.734.421.3
10926683.062.946.443.633.323.115.3
Self-Diffusion Activation29217312892.586.364.242.726.8
tr < 10,000 hNoArrhenius Plot16211876.246.241.526.314.06.93
Correlation Optimization20215310162.456.235.919.29.44
Self-Diffusion Activation29221014695.486.958.032.716.9
YesArrhenius Plot16211483.959.555.340.726.916.8
6225454.743.634.032.225.819.013.4
Correlation Optimization20213710171.866.749.032.220.0
9023569.152.839.437.028.620.113.5
Self-Diffusion Activation292N/A 112993.987.865.744.128.0
ECCC Inconel 617 Data Sheet (Year: 2005)1791126862412414.9
ECCC Interim Inconel 617B Data Sheet (Year: 2014)22212970.662.739.9
1 The Wilshire equation did not yield a creep strength for rupture at 100,000 h in either the above- or below-yield stress region calculations (see Figure A13).
Table 8. Calculated creep strength for rupture of Nimonic 105 at 100,000 h (MPa).
Data SetTensile Strength Q C *   Determination   Method Q C * Heat and Processing Condition760 (°C)774 (°C)777 (°C)788 (°C)802 (°C)816 (°C)
All DataAverageArrhenius Plot284183164161146129114
Correlation Optimization289184164161146129114
Self-Diffusion Activation292184164161146129113
Heat- and processing-specificArrhenius Plot2835183 AP166148144131116102
5183 PA176155151136119103
5183 OA194167162143121102
5793 PA172152148134118103
Unknown PA 1178157153139122106
Correlation Optimization2725183 AP165147143130115102
5183 PA175154150136119103
5183 OA193166161142121102
5793 PA170151148134118104
Unknown PA 1176156153138122107
Self-Diffusion Activation2925183 AP167148145131116102
5183 PA177156152136119103
5183 OA195168163143121102
5793 PA173153149134118103
Unknown PA 1179158154139122106
tr < 10,000 hAverageArrhenius Plot15014813413212110997
Correlation Optimization19615513913612411097
Self-diffusion Activation29217215114813211599
Heat- and processing-specificArrhenius Plot2075183 AP15313813512411199
5183 PA162145141129114100
5183 OA17915615113511699
5793 PA158142139127113101
Unknown PA 1164147143131117103
Correlation Optimization2355183 AP15714113812611299
5183 PA167148144131115101
5183 OA18415915513711799
5793 PA163145142129114101
Unknown PA 1168150146133118104
Self-Diffusion Activation2925183 AP166147144130115101
5183 PA177155151136118102
5183 OA194167162142120101
5793 PA172152148134117102
Unknown PA 1178157153138121105
1 Aged for 1–2 years at 774 °C.
Table 9. MATLAB calculations of the LMP coefficients and goodness of fit.
Alloy B 0 B 1 B 2 B 3 CR2
Inconel 61732,630−81141749−357.216.020.837
Nimonic 105354,200−426,900185,600−27,28016.880.842
Table 10. Goodness of fit and error of Wilshire and LMP calculations.
AlloyEquationR2MSE
Inconel 617LMP Equation0.837 2.69 × 10 7
Wilshire Equation 10.742 2.11 × 10 7
Nimonic 105LMP Equation0.842 1.68 × 10 7
Wilshire Equation 20.949 5.58 × 10 6
1 Data treated as a single region with Q C * calculated using Arrhenius plots; 2 Heat- and processing-specific tensile strength data with the self-diffusion activation energy of nickel in a nickel lattice as Q C * .
Table 11. Percentage differences of the calculated rupture times for the longest test durations.
AlloyCalculation MethodPercentage DifferenceExperimental Values of Longest Test Duration
Temperature (°C)Stress (MPa)Time to Rupture (h)
Inconel 617LMP Equation−73.8%75010043,706
Wilshire Equation 1−61.0%
Nimonic 105LMP Equation−31.2%76022134,955
Wilshire Equation 2−17.2%
1 Data treated as a single region with Q C * calculated using Arrhenius plots; 2 Heat- and processing-specific tensile strength data with the self-diffusion activation energy of nickel in a nickel lattice as Q C * .
Table 12. Calculated creep strength for rupture at 100,000 h (MPa) of Inconel 617.
Calculation Method650 °C700 °C750 °C800 °C850 °C900 °C950 °C1000 °C
LMP Equation16110466.041.726.416.810.87.13
Wilshire Equation 114595.859.034.018.39.074.141.72
ECCC (Year: 2005)17911268412414.9
1 Data treated as a single region with Q C * calculated using Arrhenius plots.
Table 13. Calculated creep strength for rupture at 100,000 h (MPa) of Nimonic 105.
Calculation MethodHeat and Processing Condition700 °C750 °C800 °C850 °C
LMP Equation27318912999.7
Wilshire Equation15183 AP27018211772.5
5183 PA29719412170.8
5183 OA35121712463.1
5793 PA28218812072.7
Unknown PA 229419512474.4
1 Heat- and processing-specific tensile strength data with the self-diffusion activation energy of nickel in a nickel lattice as Q C * ; 2 Aged for 1–2 years at 774 °C.