Abstract
Influence of C12A7 (12CaO·7Al2O3) as a functional component on hydration properties of Ordinary Portland Cement is studied using isothermal microcalorimetric technique, X-ray diffraction analysis, and thermodynamic calculation. Meanwhile, hydrate assemblages are simulated by hydrothermal software. C2AH8 (2CaO·Al2O3·8H2O) is generated as a transition phase during the hydration of pure C12A7, while formation of CAH10 (CaO·Al2O3·10H2O) is uncertain. Heat-releasing behavior of Ordinary Portland Cement (OPC) could be noticeably affected by C12A7, especially for the duration of interaction at boundary stage reduces with C12A7 replacement. Correspondingly, all hydration kinetic parameters first increase and then diminish with C12A7 replacement. Simulation results manifest in the main hydration products of OPC being ettringite, C-S-H (Calcium-Silicate-Hydrate) gel, portlandite and brucite. Increasing C12A7 replacement accelerates the consumption rates of gypsum and calcite that are typically included in OPC, and thus the ettringite content is changed and carbonate phases will be produced. Therefore, the microstructure properties of hydrated products of OPC are affected and the compressive strength is influenced. These predications are in good agreement with experimental findings. C12A7 can be used as a functional component to adjust the consumption rate of suphates in OPC, and also components of carbonate phases can be modified in hydrate assemblage.
1. Introduction
Mayenite (12CaO·7Al2O3 or C12A7, throughout this article, cement short hand notation is used: A, Al2O3; F, Fe2O3; C, CaO; H, H2O; C, CaCO3; S, SiO2) is a main mineral phases of calcium aluminate cements (CACs), and will be formed during the formation of C3A [1]. Unlike other mineral phases in clinker, C12A7 possesses the zeolitic structure, and two nearly free bonded O2− can be easily substituted by monovalent elements [2,3], such as F−, OH−, Cl−, etc. The derived materials have unique physicochemical properties, and can be used in geopolymeric cements and mineral-based accelerators.
Combining high hydration activity and ion adoption ability of C12A7, Hirao et al. [4] invented an eco-cement by employing Cl-containing industrial wastes as raw materials, and the cement exhibited a good foreground in solving the industrial pollution. Xie et al. [5] developed a mineral-based sewage purifying agent to eliminate sulphates in waste water, and practical applications proved that the agent could reduce sulphates concentration by at least 75% in 20 min. Moreover, the agent avoided secondary pollution during sewage purification.
However, hydration of C12A7 could be affected by many factors. Wang et al. [6] reported that increasing initial alkalinity would accelerate the hydration of C12A7. Han et al. [7] found that rising temperature can also promote the hydration of C12A7, but it was less effective than increasing initial alkalinity. Edmonds et al. [8] concluded that C12A7 hydrated fast at 4 °C and very rapidly at 40 °C, whereas the hydration was comparatively low at 20 °C. Damidot et al. [9] reported that hydration of C12A7 was profoundly boosted by gypsum, due to the fact that the AH3 amount generated by the hydration of C12A7 with gypsum was about two times higher than that of the control group. Park [10] published that the lattice parameters of C12A7 reduced with F- adoption increasing, also the hydration properties of C12A7 were affected.
From the 1980s, C12A7 have attracted much attention in mineral-based accelerators. Park et al. [11] proved that compared with other silicate- or aluminate-based accelerators, like C12A7, CaF2 and C4A3s, the demand of C12A7-based accelerators was least, while the relevant groups had the fastest setting capacity, best mechanical properties, lowest chloride ion permeability, strongest freezing-thawing resistance and smallest strength decrease. Won et al. [12] developed a new type of C12A7-based accelerator, and the mechanical strength of shotcrete with this accelerator was much high than that of shotcrete with the existing C12A7-based accelerator. Further, the influence of this new accelerator on the durability of shotcrete was investigated [13], and it was found that shotcrete containing the new accelerator showed higher long-term age strength, better freezing-thawing resistance, lower chloride ion penetration and greater anti-carbonation ability than that of shortcrete with the existing C12A7-based accelerator. However, it should be emphasized that although the strength of shotcrete including C12A7-based accelerators could continually increase with hydration age, they were still lower than that of the control groups without C12A7-based accelerators.
Apart from that, C12A7 has also been used in geopolymers to improve setting and early-age strength. Rovnanik [14] described that the setting procession of fly ash geopolymer was remarkably promoted by C12A7, but compared with the control group without C12A7, early-age strength of groups with C12A7 increased while long-term strength deteriorated. Majumbar et al. [15] blended C12A7 with granulated blast furnace slag (GBFS) at a weight ratio of 1:1, and then hydrated the mixtures at various water-to-binder ratios, and cured the samples at different temperatures. Finally, strength reduction was founded at 1 year of age in pure C12A7 paste, caused by the conversion of aluminate hydrates. However, strength continually increased with hydration age for pastes, mortars and concretes including both C12A7 and GBFS. The author attributed this phenomenon to the formation of C2AsH8 (2CaO·Al2O3·CaSO4·8H2O) and concluded that C12A7 can be used in repair work.
Up to now, existing studies on C12A7 have mainly focused on the heat releasing behavior, setting and hardening properties, mechanical performance and durability, etc. Few reports concerning the influence of C12A7 on hydration kinetic process and hydrate assemblage of Ordinary Portland Cement (OPC) are published. Therefore, this work primarily investigates these issues.
2. Materials and Methods
2.1. Raw Materials and Preparing Methods
Pure C12A7 is synthesized by solid reactions between particles of analytical grade Ca(OH)2 and Al(OH)3. According to the CaO-Al2O3 diagram, C12A7 melts congruently at 1392 ± 5 °C [16]. Formation of the liquid phase can greatly promote reactions between solid particles, but the final products may clot seriously and cause crucible damage. Therefore, calcination temperature is set at 1350 °C in this work. Raw material powders are mixed by the ball grinding method using a high-energy planetary mill of Pulverisette 7 model provided by FRITSCH Company, Markt Einersheim, Germany at 500 revolutions per minute for 10 min a time and repeated three times. Then, the mixed powders are compacted under 30 MPa pressure into cylindrical pellets. Further, these pellets are sintered with a heat rate of 10 °C/min from room temperature to 1350 °C and maintained at the desired temperature for 4 or 8 h in atmosphere. After that, a quenching procedure is conducted by a rapid air cooling method, aiming to maintain the hydration activity of synthesized C12A7. Free lime (free-CaO) content in synthesized C12A7 is determined by the glycerine-ethanol method and phase identification is performed by X-ray diffraction (XRD).
In previous studies [11,12,13], it has been pointed out that the optimum dosage of C12A7-based accelerator locates in the range from 5% to 8%. Though a higher dosage of C12A7-based accelerator may leads to faster setting and hardening abilities of cement pastes or mortars, their mechanical properties may also be affected. Therefore, in the presented work, C12A7 substitutes OPC by weight with replacement levels of 2.5%, 5.0% and 7.5%. Both pastes and mortars are prepared to investigate the influence of C12A7. Pastes with OPC-C12A7 complex binder hydrate at 20 °C for a certain period and their heat releasing behaviors are monitored by an isothermal calorimeter. The water-to-binder ratio of all paste groups are fixed at 0.4, and samples are labeled as M2, M5 and M7, wherein M signifies that mayenite is involved, and the control group without C12A7 is labeled as M0. Meanwhile, mortars with OPC-C12A7 complex binder are also prepared to further examine the influence of C12A7 on a macro scale. ISO standard sand according to Chinese code is used [17]. The water-to-binder ratio of all mortar groups are fixed at 0.4, and the binder-to-sand ratio is constant at 0.5. The specimen size is 40 mm × 40 mm × 160 mm. Mortars are prepared by an A200C mixer produced by Hobart UK company, Peterborough, Canada. Powders and sands are first stirred slowly in dry state for 60 s, and then water is poured and continuously stirred for another 120 s. After standing for 60 s, the mixture is rapidly stirred for 60 s. The whole mixing procedure lasts for 240 s. Mortars are demoulded in 24 h after pouring, and then cured at 20 °C in Ca(OH)2 saturated solution for 14 and 28 d, respectively. Similar to notations of pastes samples, mortar samples are labeled as S0, S2, S5 and S7, wherein the numbers possess the same meaning as that in pastes experiments. Compressive strength and flexture strength of mortars at 14 and 28 d ages are tested. The specified testing procedures can be seen in Chinese code GB/T 17671-1999 [17]. The OPC type is PI 52.5 cement produced by Wuhan Yadong factory, Wuhan, China, complying to Chinese standard GB 175-2007 [18]. The Blaine-specific surface area of selected cement is 341 m2/kg. Calculated Gibbs free energy of selected cement is 53.4 kJ/mol, according to the method proposed by Dong [19], wherein Arrhenius Euqation was used. Chemical composition of OPC is compiled in Table 1, and clinker phase contents are calculated based on Bogue equations [20]. As seen in Table 1, silicates are the main mineral phases and account for 70.7% on the whole. Calcite typically included in OPC can be founded. The amounts of gypsum, hemihydrate and anhydrite are determined by thermogravimetric analysis. Generally, readily soluble alkali in OPC are commonly sulphates and their amounts are determined according to ASTM C114-69 through concentrations of easy soluble alkalis in distilled water at a water-to-solid ratio of 10 after an equilibration time of 10 min. The remaining K, Na, Mg and S are assumed to be present as minor constituents in solid solution with the main clinker phases shown in Table 2 [15].

Table 1.
Chemical composition of cement /100 g.
Table 2.
Trace elements adopted in main clinker phases [15].
2.2. Instruments
Composition of OPC is analyzed by chemical titration and X-Ray Fluorescence (XRF) on Axios provided by PANalytical Company. Thermogravity and differential thermogravimetric (TG/DTG) analysis are used to determine gypsum content on SDT-Q600 model provided by TA Instruments, New Castle, DE, USA, with a resolution of ± 0.0001 mg in temperature range up to 1000 °C. The heating rate is 10 °C /min and the flow of protective gas of nitrogen (N2) is 100 mL/min.
Phase identification of C12A7 and hydrated products are performed via XRD method on Bruker D8 Advanced diffractometer, Karlsruhe, Germany, operating at 40 kV and 30 mA, using Cu Kα radiation and a Ni-filter in 2θ = 10°–70° range. The scanning step is 0.05° and scanning speed is 2 °/min.
Hydration behavior of pure C12A7 and OPC-C12A7 complex binder are monitored by isothermal microcalorimetric technique on a TAM Air provided by TA Company. Twenty mililiters of glass ampoules are used and reference material is distilled water. All samples hydrate at 20 °C. Pure C12A7 sample is mixed by internal stirring for 30 s, while samples with OPC-C12A7 complex binder are mixed by external stirring methods. The TAM Air maintains a set temperature within ± 0.02 °C and the minimum detection limit is 4 μW.
Hydrate assemblages are simulated by GEMS software, which is a broad-purpose geochemical modeling code that uses Gibbs energy minimization and computes equilibrium phase assemblage in a complex chemical system from its total bulk elemental composition.
2.3. Hydration Kinetic Model
Krstulović et al. [21] divided the hydration of Portland cement into three stages, such as the nucleation and crystal growth (NG) stage, the interaction at phase boundaries (I) stage and the diffusion (D) stage. The hydration of NG stage can be described by the basic Avrami-Erofeev equation presented as below.
where t represents hydration time. α(t) signifies the hydration degree at time t. n denotes reaction order. KNG means the reaction rate constant of NG stage.
The hydration of I stage can be described by Equation (2).
where KI demonstrates the reaction rate constant of I stage.
For D stage, the following Jander equation is used.
where KD illustrates the reaction rate constant of D stage.
Hydration degree is determined through the hydrothermal method according to Equation (4).
where Q(t) is the accumulative hydration heat at time t. Q∞ is the total amount of hydration heat when hydration completely finishes. Q∞ is calculated by integration over time of the normalized measured heat flow with the correct conversion to J/g.
Calculation methods of the above-mentioned Equations (1)–(3) have been introduced in detail in a previous study [22]. Studies performed by He et al. [23,24], Han et al. [7], Zhou et al. [25] and Tian et al. [26] all confirmed that the Krstulovic-Dabic hydration kinetic model was effective to simulate the hydration process of OPC, sulphoaluminate cement (SAC), and also complex cementitious materials involving silica fume, fly ash or GBFS.
3. Results
3.1. Hydration Properties of Pure C12A7
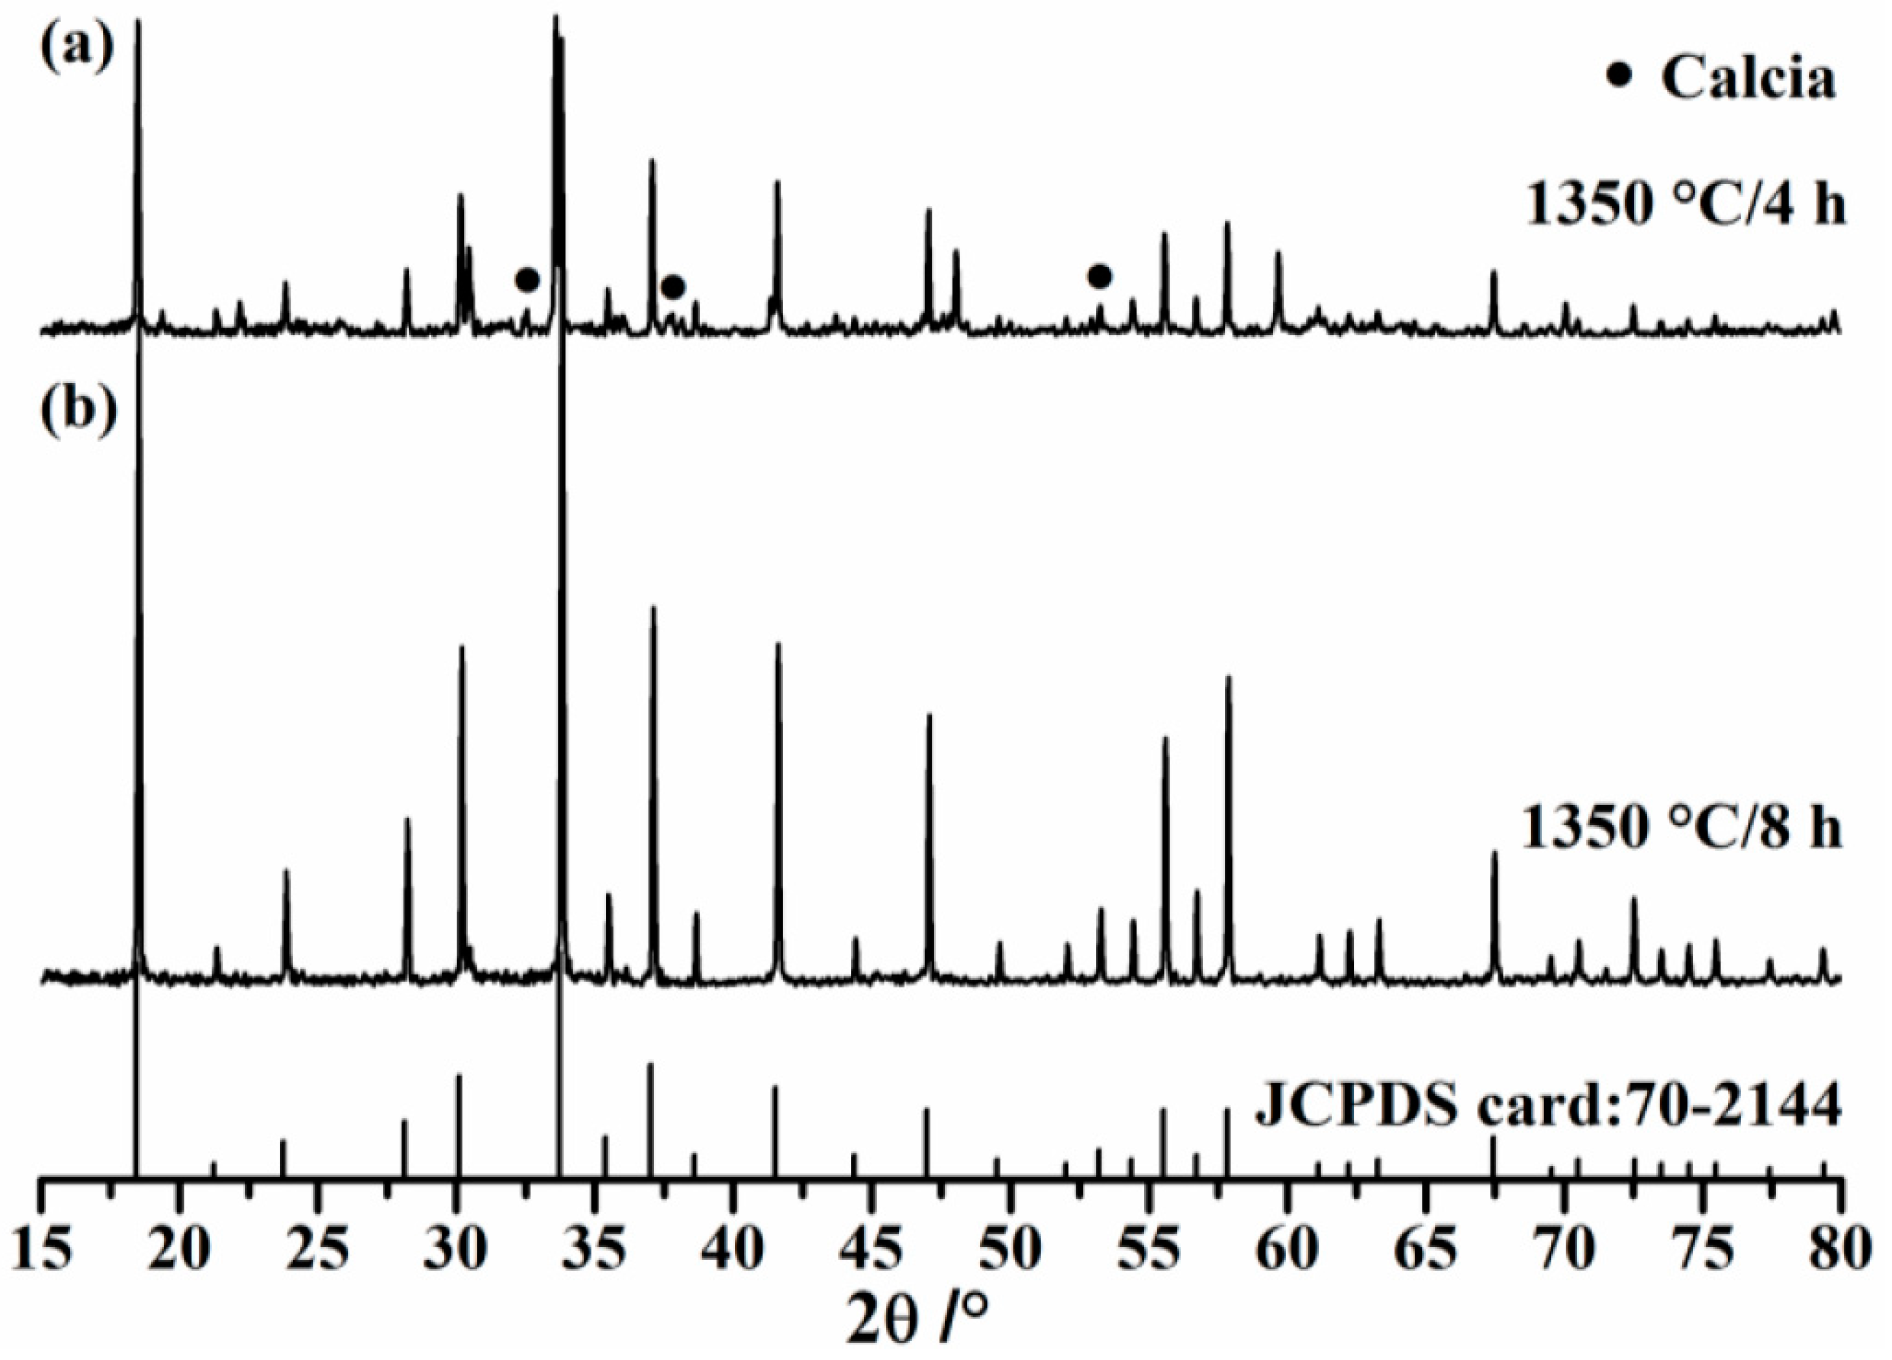
The effect of calcination duration on synthesis effect in C12A7 preparation is demonstrated in Figure 1. XRD spectra of samples calcined at 1350 °C for 4 and 8 h are shown in Figure 1a,b, respectively. It can be clearly observed that characteristics belonging to calcia (JCPDS file:77-2376) are present in Figure 1a, indicating that free-CaO content is pretty high. However, signals of calcia completely disappear and peak intensities of mayenite increase dramatically in Figure 1b, meaning that C12A7 (JCPDS file:70-2144) is the only crystal phase. Actually, free-CaO content of synthesized C12A7 is so low that the solution does not change to red during the refluxing procession, also meaning that free-CaO content of synthesized C12A7 is under the detection limit of the glycerin-ethanol titration method.
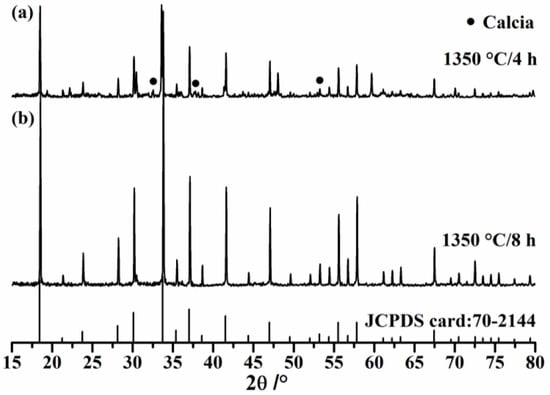
Figure 1.
XRD spectra of synthesized C12A7.
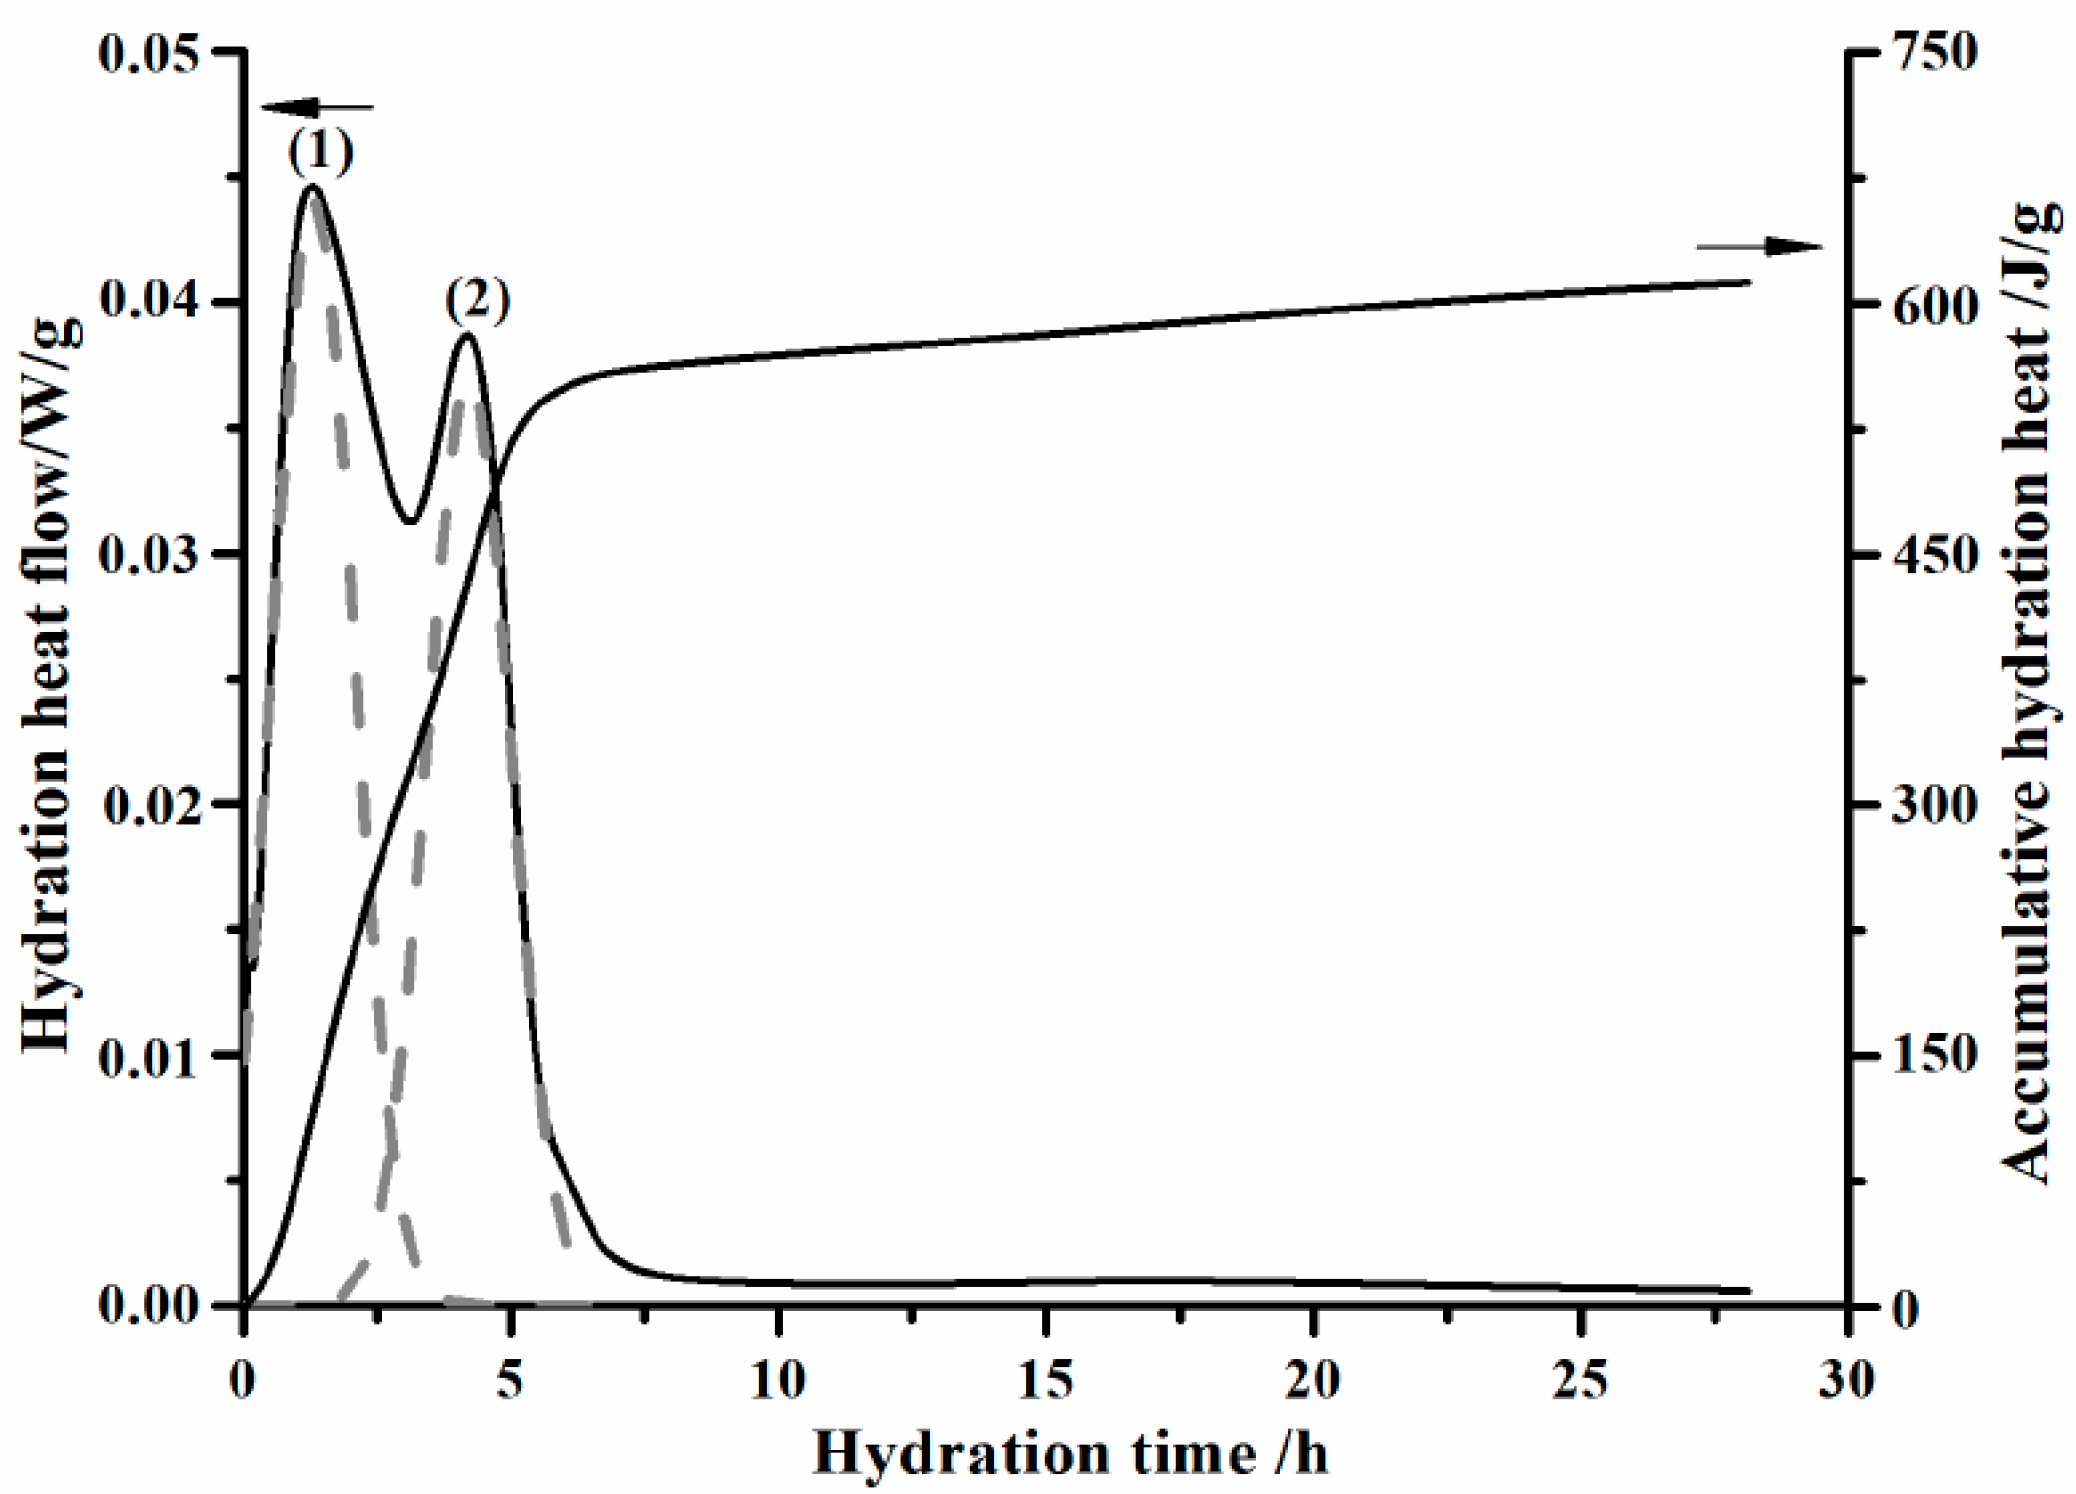
Hydration heat flow and accumulative hydration heat during pure C12A7 hydrating are shown in Figure 2. Pure C12A7 hydrates at 20 °C with a water to C12A7 ratio by weight of 10. Two exothermic peaks will appear during the initial 6 h hydration of C12A7. Appearance times of peak (1) and peak (2) are 1.3 and 4.2 h, respectively. Generally, it is widely accepted that peak (1) correlates to the formation of transition phases, while peak (2) is caused by the conversion of the metastable transition phase to stable hydrogarnet phase of katoite (C3AH6) [8,9,27]. Actually, the conversion is usually considered as one of the fundamental reasons of volume shrinkage and strength reduction of CACs.
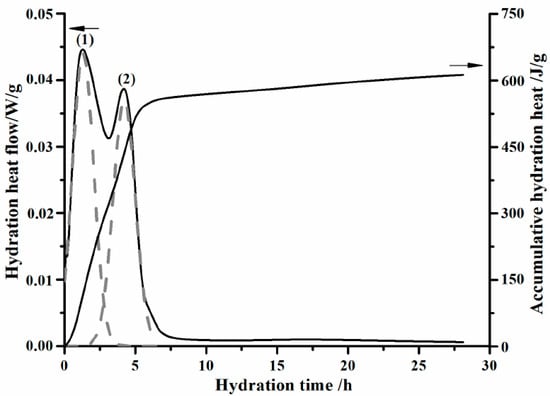
Figure 2.
Hydration heat flow and accumulative hydration heat curves of synthesized C12A7 over hydration time.
It can also be observed from Figure 2 that the intensity of peak (1) is slightly higher than that of peak (2), making peak (2) appear as a shoulder peak of peak (1). Hydration between peak (1) and (2) is controlled by the nucleation process of amorphous AH3. Unlike the hydration of OPC and C3S [28], there is no dormant period in the hydration process of C12A7. Moreover, Damidot et al. [9] stated that a short induction period lasting for about 4 h with moderate heat flow existed between peak (1) and (2). A similar phenomenon can also be seen in the work by Edmonds et al. [8]. However, this phenomenon has not been found in our work, even though the hydration heat flow curve is plotted over the same time scale. Reasons may correlate to the properties of sample and experimental technique. Taking the work by Damidot et al. [9] as a case, pure C12A7 was prepared through the solid reaction between particles of CaCO3 and alumina, and the sintering process was followed by a slow cooling period. Therefore, hydration activity of synthesized C12A7 may be affected. What is more, the whole heat-releasing process during the hydration of C12A7 starting from the contact between C12A7 and water has not been well captured in previous work. So far, there is no consensus on the constitution of transition phases. It is well known that C4AH13 (4CaO·Al2O3·13H2O) would not be generated during the hydration of C12A7, while the presence of C2AH8 and CAH10 is still under debate [8,9,10,27,29]. Damidot et al. [9,27] proposed a hydration route for C12A7 wherein C2AH8 was the unique transition phase, and its formation and conversion processes were described by Equations (5) and (8), respectively. Das et al. [29] claimed that CAH10 would be produced as the only transition phase according to Equation (6), and the conversion process followed reaction (9). After systematically investigating the influence of temperature on formation and conversion of transition phases, Edmonds et al. [8] stated that both C2AH8 and CAH10 can be produced during the hydration of C12A7 at 4 °C, and the formation mechanism was described by Equation (7). However, no trace of CAH10 was spotted when C12A7 hydrated at 20 or 40 °C. The disappearance of CAH10 related to the fact that temperature affected the conversion of transition phases greatly. Further, Edmonds et al. [8] pointed out that conversion of C2AH8 to C3AH6 (3CaO·Al2O3·6H2O) was significantly accelerated when temperature rose to 40 °C.
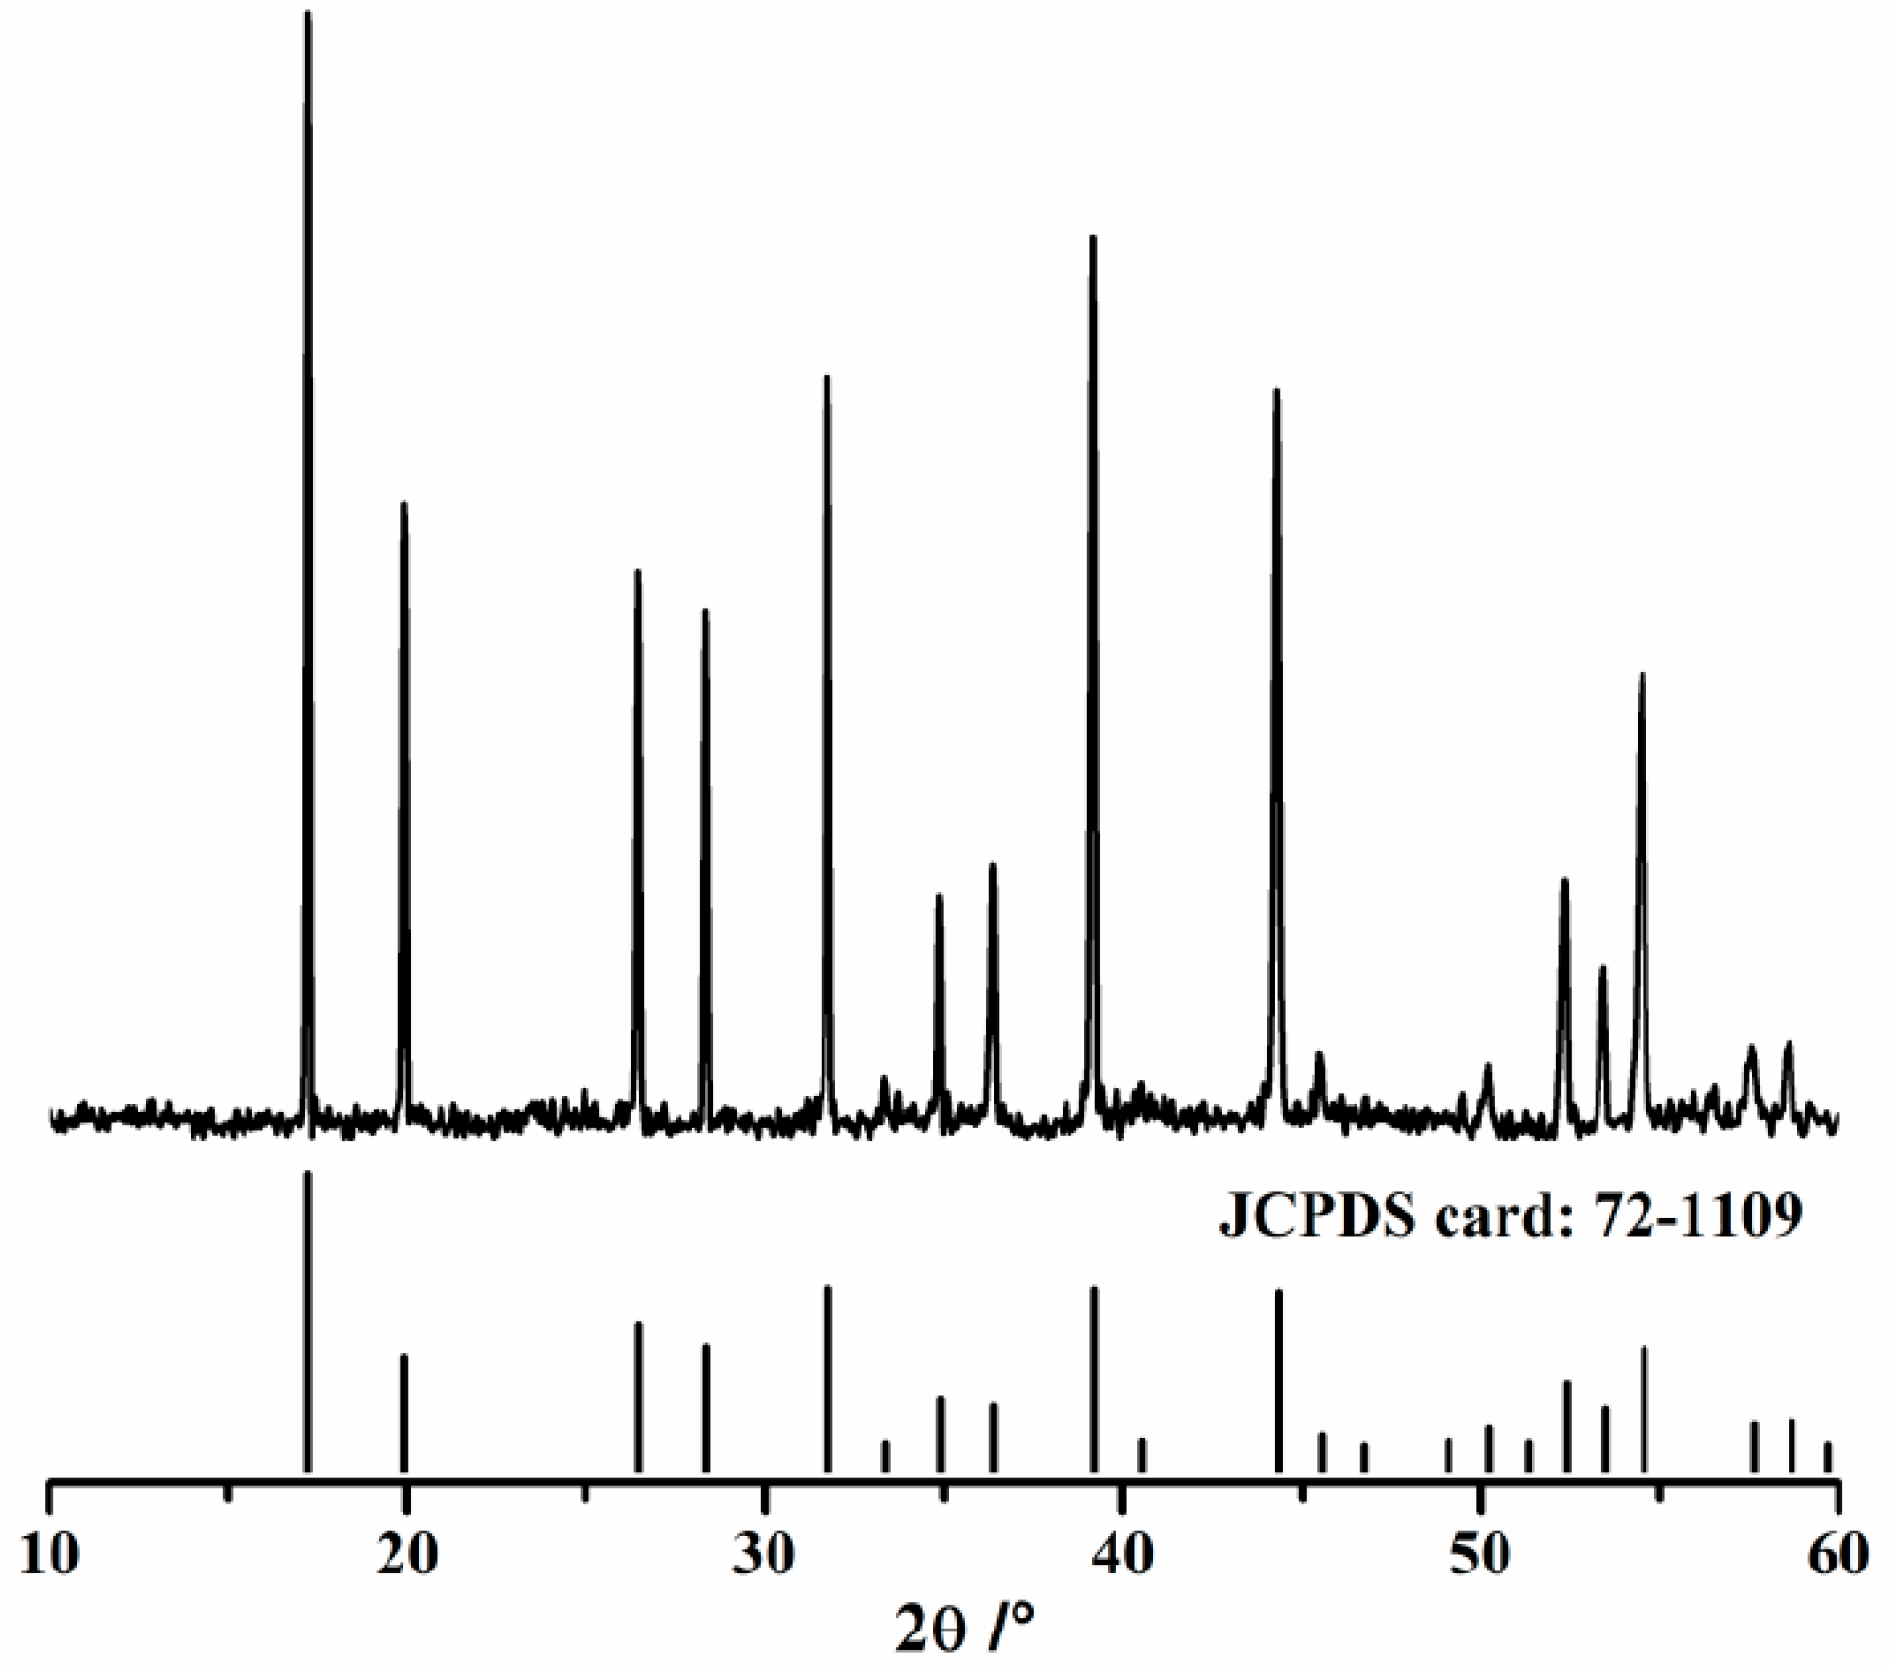
Phase identification of hydrated products of pure C12A7 is depicted in Figure 3. The sample is gained by hydrating C12A7 in a sealed bottle for 24 h at 20 °C with a water-to-C12A7 ratio by weight of 10, and then the suspension is mixed with ethanol to stop hydration. Finally, the mixture is centrifuged and sediments are ground by hand in an agate mortar using acetone as a grinding aid for 10 min, and dried at 50 °C for 7 days in a vacuum oven. As seen in Figure 3, C3AH6 (JCPDS card: 72-1109) is the only crystal phase in hydrated products and no characteristics of portlandite appear, indicating that Equations (6) and (10) would not happen during the hydration of C12A7.

Figure 3.
XRD spectrum of hydrated products of C12A7.
Based on the relevant thermodynamic data compiled in Table 3, enthalpy change and Gibbs free energy variance of Equations (5), (7)–(9) and (11) can be calculated. As hydrated products of Equation (6) do not comply to practical founding, enthalpy changes and free energy variances of Equations (6) and (10) are not computed. As seen in Table 4, formation of transition phases is exothermic, whereas the conversion process of these transition phases is endothermic. Therefore, the conversion process of transition phases can be seriously affected by temperature on the micro scale, leading the hydration of C12A7 to be prominently influenced by temperature on the macro scale.
Table 3.
Standard thermodynamic properties at 298 K.
Table 4.
Thermodynamic parameter changes of reactions might happened at 298 K.
Based on the above analysis, C3AH6 and AH3 (Al(OH)3) may be produced by two ways, i.e., Equation (5)→Equation (8) and Equation (7)→Equation (8) + Equation (9). Their enthalpy change and free energy variance are equivalent to Equation (11), which overall describes the hydration of C12A7. The coherences manifest that it is difficult to clearly distinguish the reactions incorporated in C12A7 hydration. However, it can be concluded that C2AH8 would be definitely generated during the hydration of C12A7, whereas CAH10 is uncertain.
3.2. Effect of C12A7 on Heat-Releasing Behavior
Influence of C12A7 on hydration of OPC is shown in Figure 4; pertinent samples hydrate at a water-to-complex binder ratio by weight of 0.4, and the sample weights 5 g. Notations of M0, M2, M5 and M7 denote that C12A7 replacements are 0%, 2.5%, 5.0% and 7.5%, respectively. According to the work by Taylor [15], at most four peaks would appear on the hydration heat flow curve of OPC. In this work, three peaks can be obviously detected during the hydration of each batch. Peak (1) appears immediately when hydration starts, while main peak (2) and shoulder peak (3) emerge at about 8 and 13 h, respectively. However, the last one, peak (4), is less distinct and uneasy to detect. For M7 group, peak (4) occurs at about 16.5 h, while for other groups, peak (4) cannot be observed.
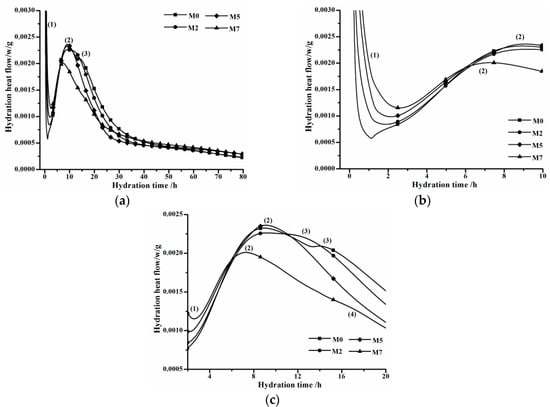
Figure 4.
Hydration heat flow curves of samples with various C12A7 replacements plotted in different hydration time ranges. (a) in the rage from 0 to 80 h; (b) in the range from 0 to 10 h; (c) in the range from 2 to 20 h.
Generally, peak (1) relates to ions dissolving and initial hydration. Main peak (2) correlates to the precipitation of portlandite and C-S-H gel. Shoulder peak (3) is concerned with renewing the formation of ettringite (AFt) [15]. The last and less distinct peak (4) seems to be in connection with the hydration of the ferrite phase or the conversion of AFt to AFm. The rising of peak (1) intensity is caused by the fact that ion dissolving ability of C12A7 is pretty high, even more rapid than that of C3A. Main peak (2) seems independent of C12A7 replacement, for the regularity between changing tendency of main peak (2) and C12A7 replacement is not evident. The arrival time of shoulder peak (3) reduces with C12A7 replacement increasing, and finally it merges with main peak (2). For instance, for M0 and M2 groups, arrival times of shoulder peak (3) are 14.25 and 12.11 h, respectively, whereas for M5 and M7 groups, shoulder peak (3) disappears. The absence of shoulder peak (3) indicates that the hydration of aluminates, especially the formation of ettringite, may be largely affected by C12A7.
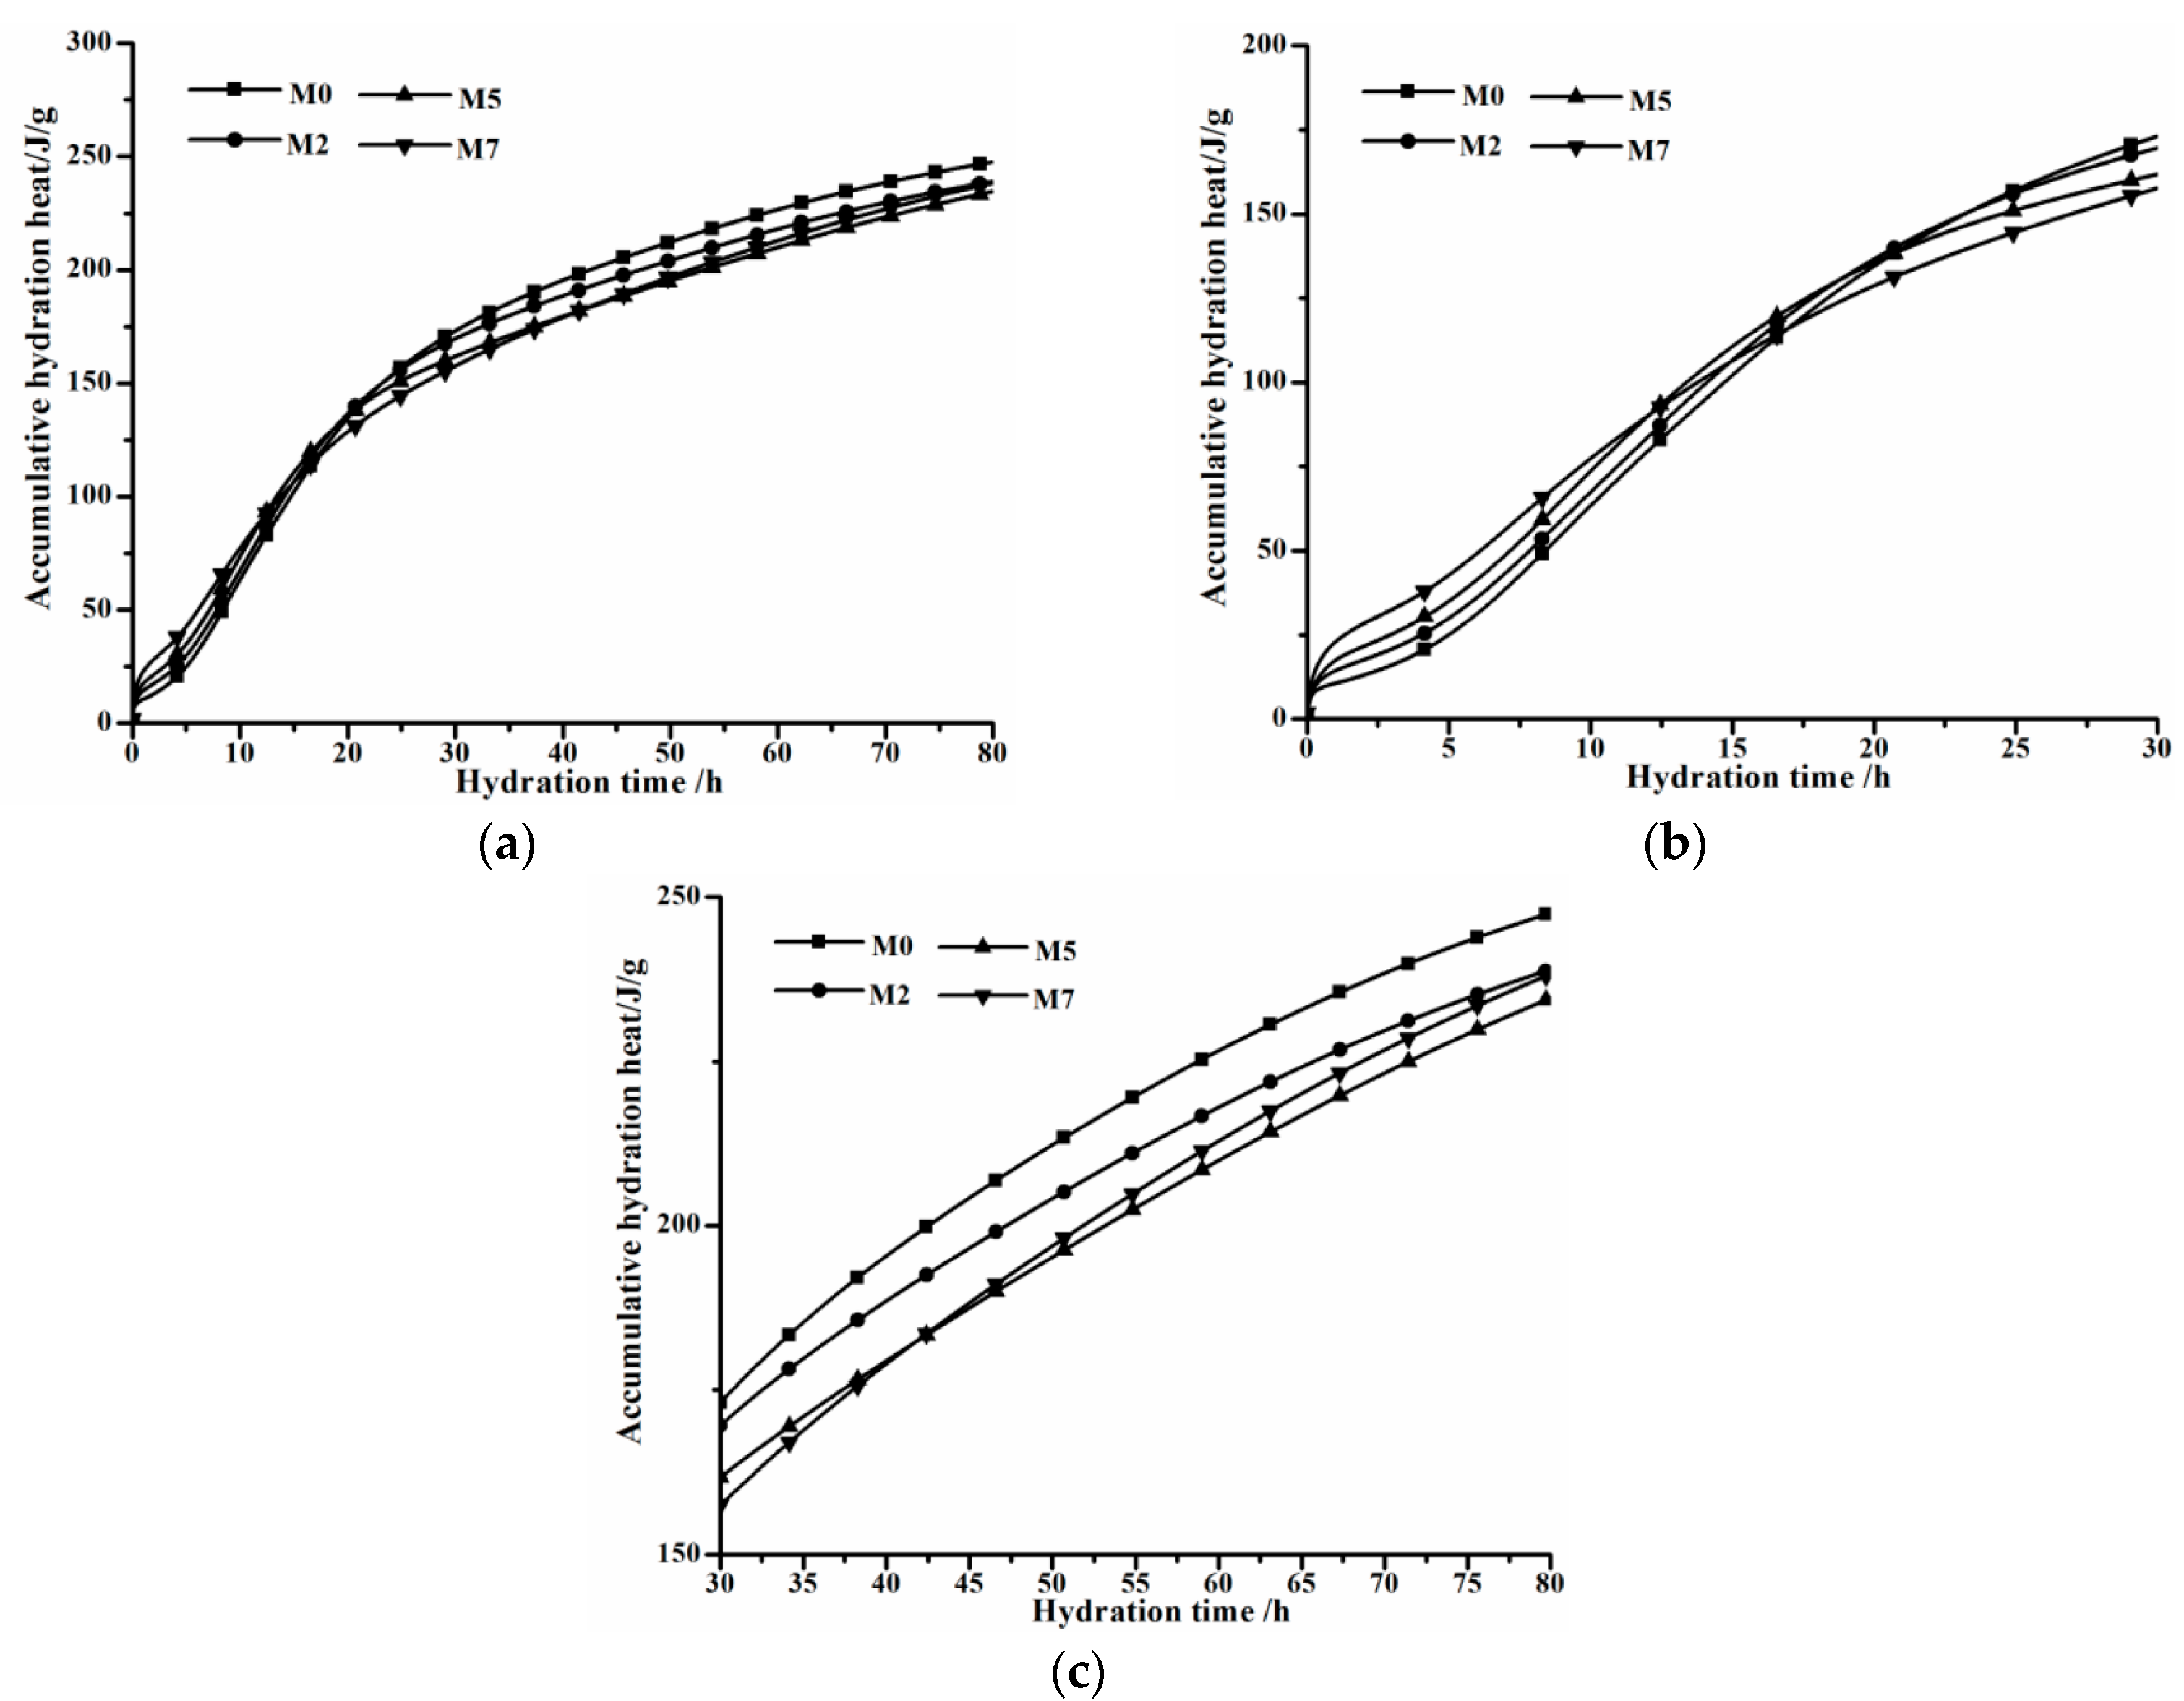
The influence of C12A7 on the hydration of OPC can be directly seen from the accumulative hydration heat present in Figure 5. Accumulative hydration heat curves in the whole range are shown in Figure 5a, while two enlarged plots with different hydration time scales are displayed in Figure 5b,c, respectively. It can be observed that C12A7 promotes initial stage hydration of OPC and then suppresses later hydration. Generally, as C12A7 replacement rises, accumulative hydration heat before 15 h increases, and then accumulative hydration heat of groups with C12A7 are all lower than that of control group M0. This phenomenon relates to the fact that a large amount of heat would be released during the hydration of C12A7, and also hydration activity and ion releasing ability of C12A7 are pretty high. Compared with the control group, more hydrated products wrap on unhydrated particles in groups with C12A7, preventing the contact of unhydrated particle from water. Thereby, further hydration of these unhydrated particles is suppressed, resulting in accumulative hydration heats of relevant groups being lower than that of the control group.
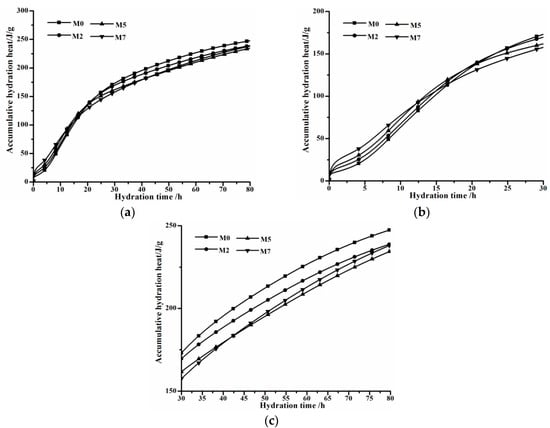
Figure 5.
Accumulative hydration heat curves of groups with various C12A7 replacements. (a): in the 0–80 h range; (b) in the 0–30 h range; (c) in the 30–80 h range.
3.3. Effect of C12A7 on Hydration Kinetic Processes
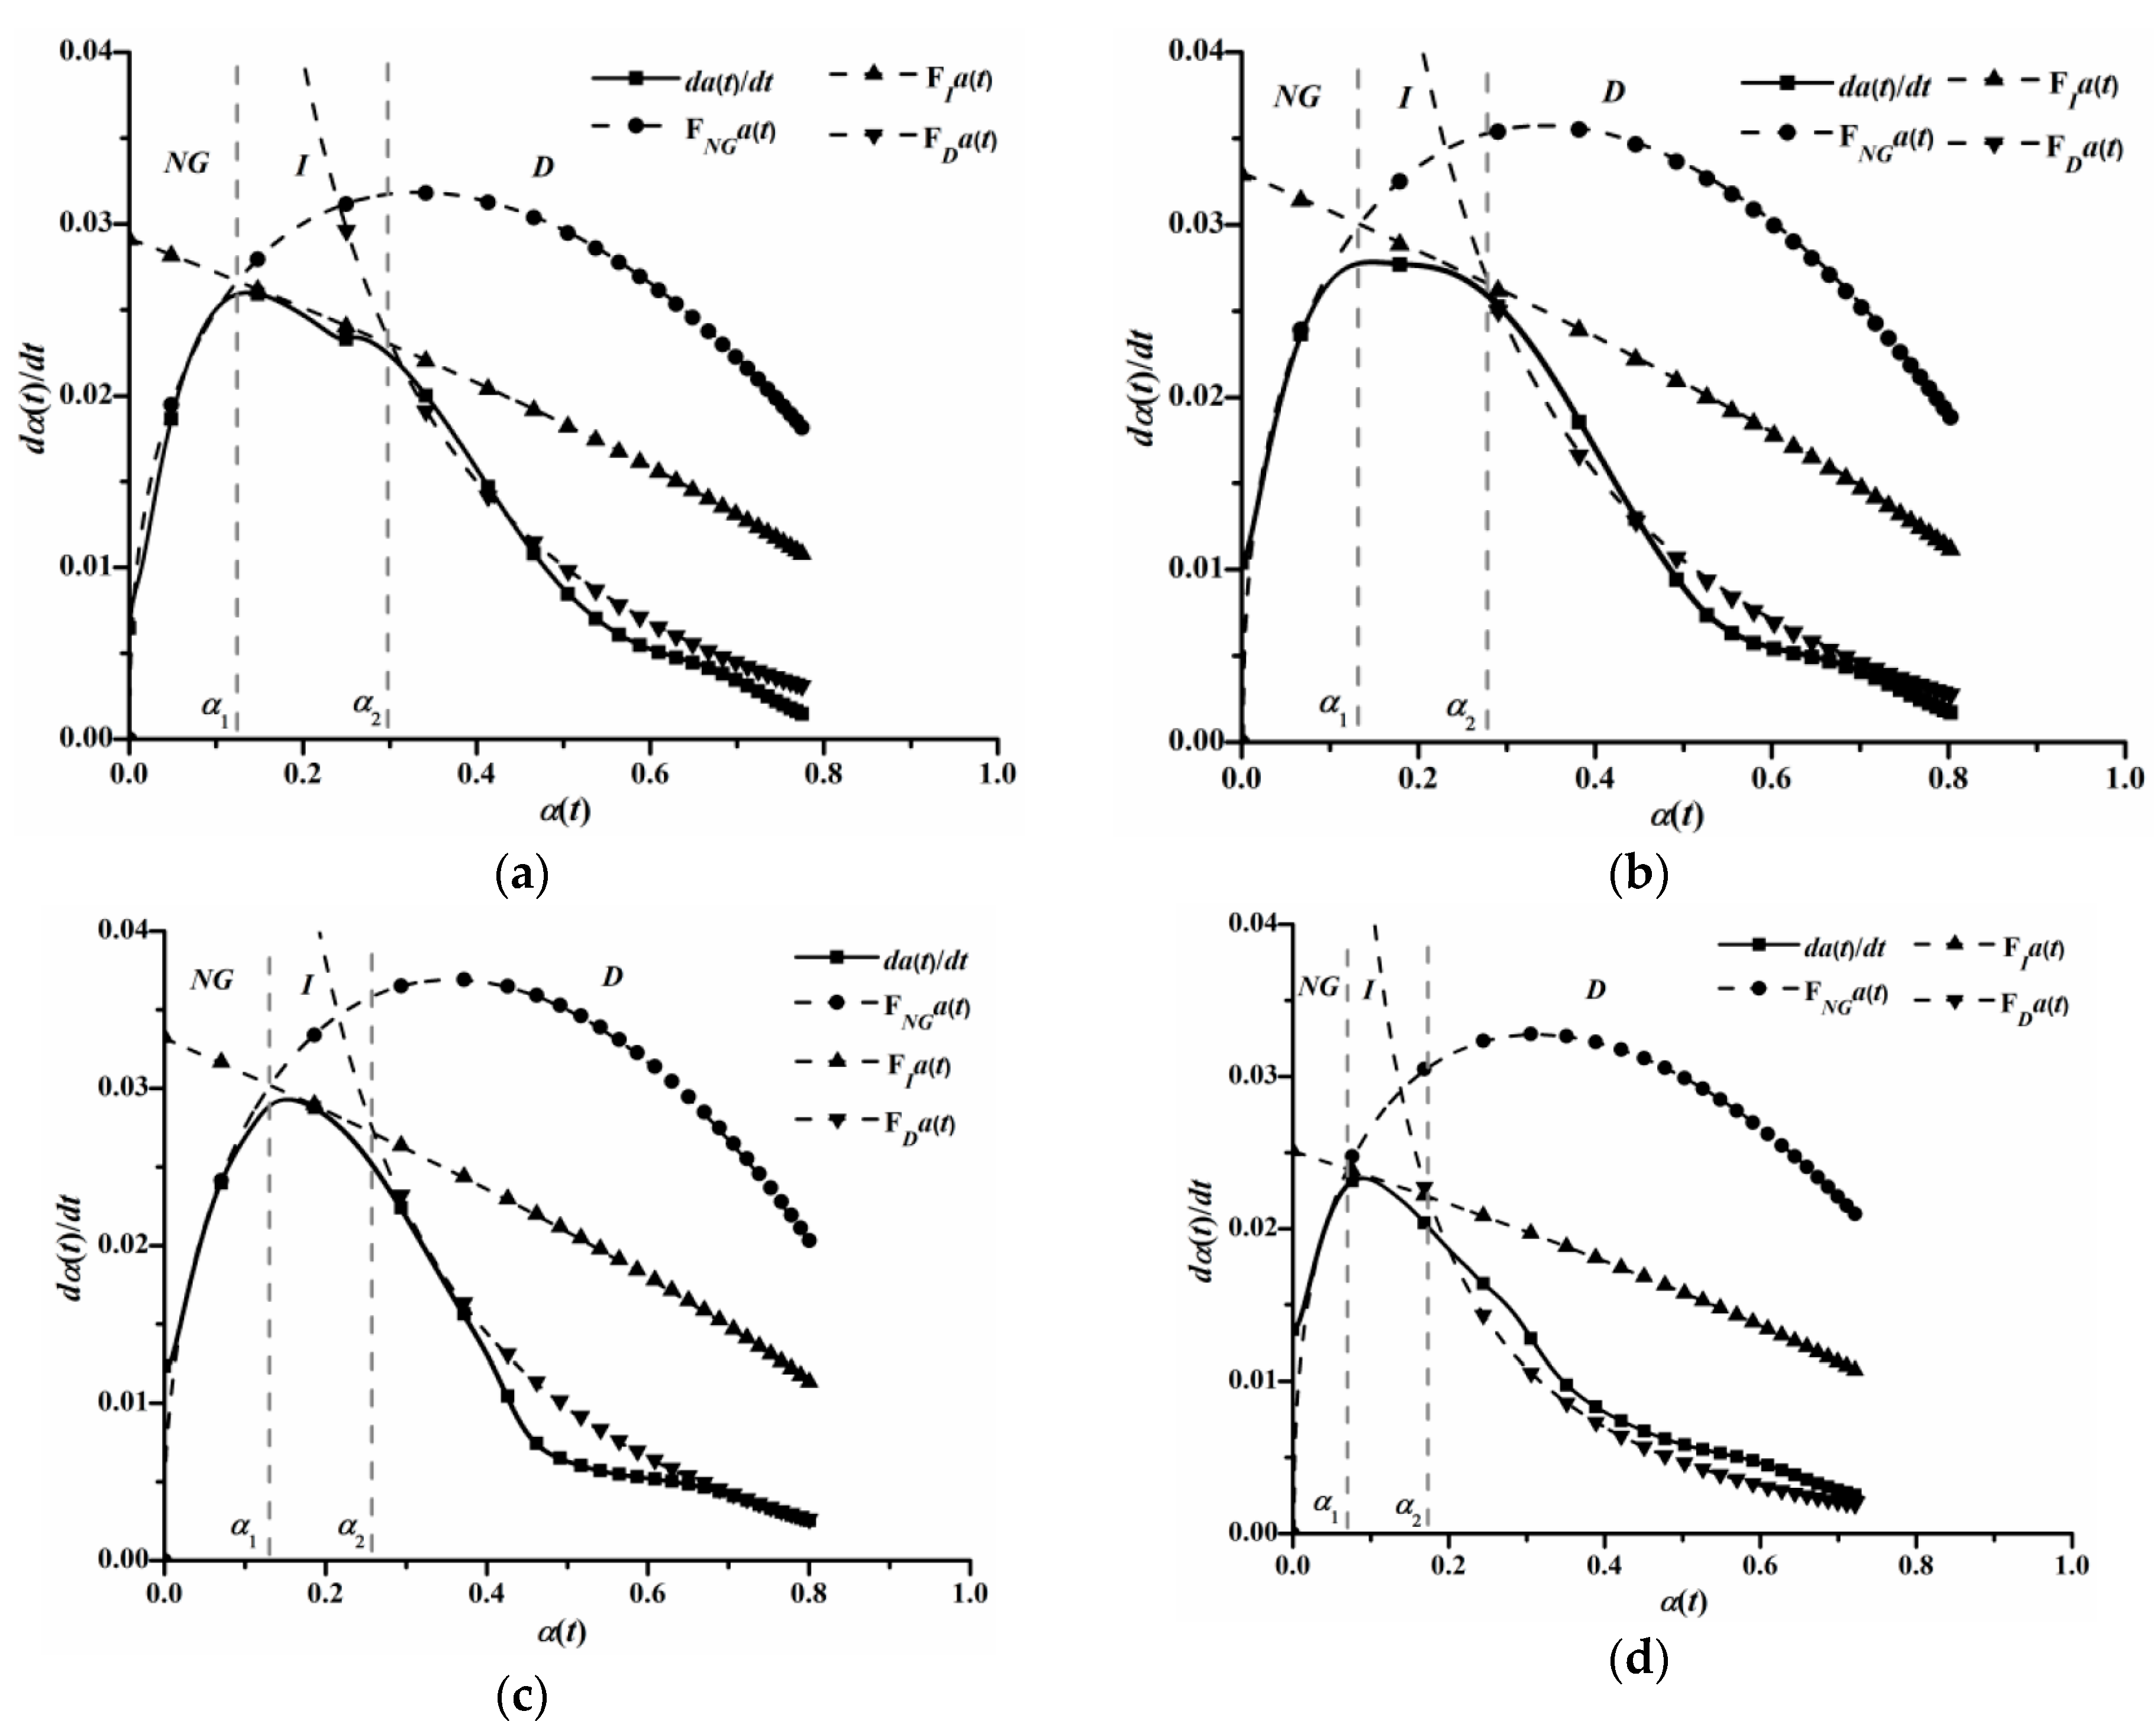
The influence of C12A7 on heat-releasing behavior of OPC on the macro scale may associate with variances of hydration kinetic processes of OPC on the micro scale. Figure 6 shows the analysis results of hydration kinetic processes. Hydration in three stages can be described by Equations (12)–(14), using hydration kinetic parameters such as reaction order and reaction rate constant. As seen in Figure 6, the hydration kinetic model has a moderate fitting effect to M0, M2, M5 and M7 groups.
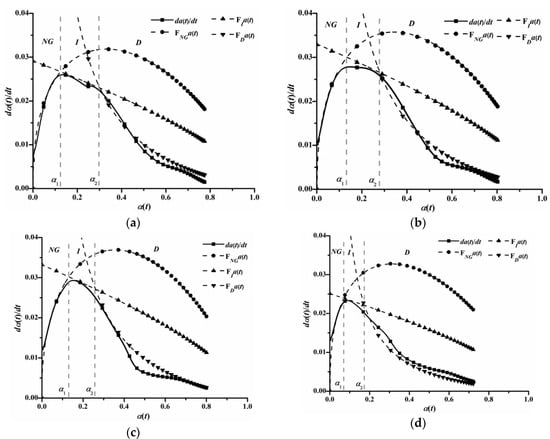
Figure 6.
Hydration kinetic process curves of groups with various C12A7 replacements. (a) M0; (b) M2; (c) M5; (d) M7.
Hydration kinetic Parameters are summarized in Table 5. Due to the fact that NG stage hydration is highly controlled by autocatalytic reactions of cementitious materials [7], as well as the fact that diffusion resistance of Ca2+ in I and D stages is pretty large, the reaction rate of the NG stage is much larger than ones of I and D stages [33]. It can be observed that both reaction order and reaction rate constant of NG stage increase when C12A7 replacement rises in the range from 0 to 5%, and then reduces with C12A7 replacement when C12A7 replacement surpasses 5%. Changing the tendency of reaction rate constants of I and D stages resembles that of the NG stage. However, the hydration kinetic parameter of D stage decreases if C12A7 replacement is higher than 2.5%. It seems that C12A7 exerts a greater impact on D stage than the other two stages.
Table 5.
Parameters determined by hydration kinetic model.
Hydration activity of C12A7 is much higher than other clinker phases, such C3A, C3S, C4AF and C2S, and also ion releasing ability of C12A7 is greater than theirs. Correspondingly, Ca2+ and AlO2− concentrations in pore solution would greatly increase if OPC is substituted by C12A7, leading to an increase of hydration kinetic parameters of the NG and I stage. Moreover, the formation rate of hydrated products is also enhanced, this increases the migration barrier for Ca2+ diffusion, resulting in a reduction of I stage parameters. It can also be observed from Table 5 that all hydration kinetic parameters of the M7 group are lower than the ones of other groups, which is in good agreement with isothermal microcalorimetric experimental results. This phenomenon may concern high C12A7 replacement, and the mechanism is under further investigation.
The duration of each hydration stage and the corresponding hydration degree are compiled in Table 6. C12A7 exerts no significant effect on α1, while α2 consistently decreases with C12A7 replacement rising. Consequently, the duration of I stage steadily reduces with the increase of C12A7 replacement, suggesting the arrival time of saturation point of Ca2+ concentration decreases [32]. Meanwhile, the duration of D stage increases with the rising of C12A7 replacement. Therefore, the hydration kinetic process of OPC has a trend to change from NG-I-D to NG-D, this coincides well with microcalorimetric experimental results, wherein the arrival time of shoulder peak (3) diminishes with the rising of C12A7 replacement and finally emerges with main peak (2). As mentioned above, the formation rate of hydrated products is noticeably accelerated after C12A7 replacing, and more hydrated products would precipitate on the surface of unhydrated particles. Consequently, it becomes more difficult for water to permeate through the hydrated products’ layer, and also the energy barrier of ion migration, such as Ca2+, AlO2−, OH−, etc. is higher than before. Hence, the hydration of OPC steps into the diffusion stage early.
Table 6.
Critical points of hydration degree and duration of each hydration stage.
3.4. Effect of C12A7 on Hydrate Assemblages
Simulation of hydrate assemblages are performed using the Gibbs free energy minimization program GEMS. According to the work conducted by Lothenbach et al. [34], calculated hydration degrees of individual clinker phases are used as a hydration time-dependent input. Also, the experimental hydration degree of C12A7 determined in Section 3.2 is used. For the sake of simplicity, interactions among individual mineral phases are not under consideration.
Besides, Fe in the complex binder is predicted to precipitate as amorphous FH3 (Fe(OH)3) gel, as it is more thermodynamically stable than other phases, like Fe-ettringite, hydrotalcite and carbonates. MgO presented in the cementitious system is predicted to precipitate initially as brucite, and later converts to hydrotalcite. What is more, interactions between sulphates and carbonates are not considered. On one hand, a very tiny amount of thaumasite can precipitate at 20 °C. On the other hand, according to the work by Schmidt et al. [35], thaumasite was only generated under the condition that SO3/Al2O3 molar ratio exceeded 3.0, but in this work, SO3/Al2O3 molar ratio in all samples are lower than critical value. In addition, performance variances of gypsum, hemihydrate and anhydrite are not considered, and are uniformly denoted as gypsum in simulation results.
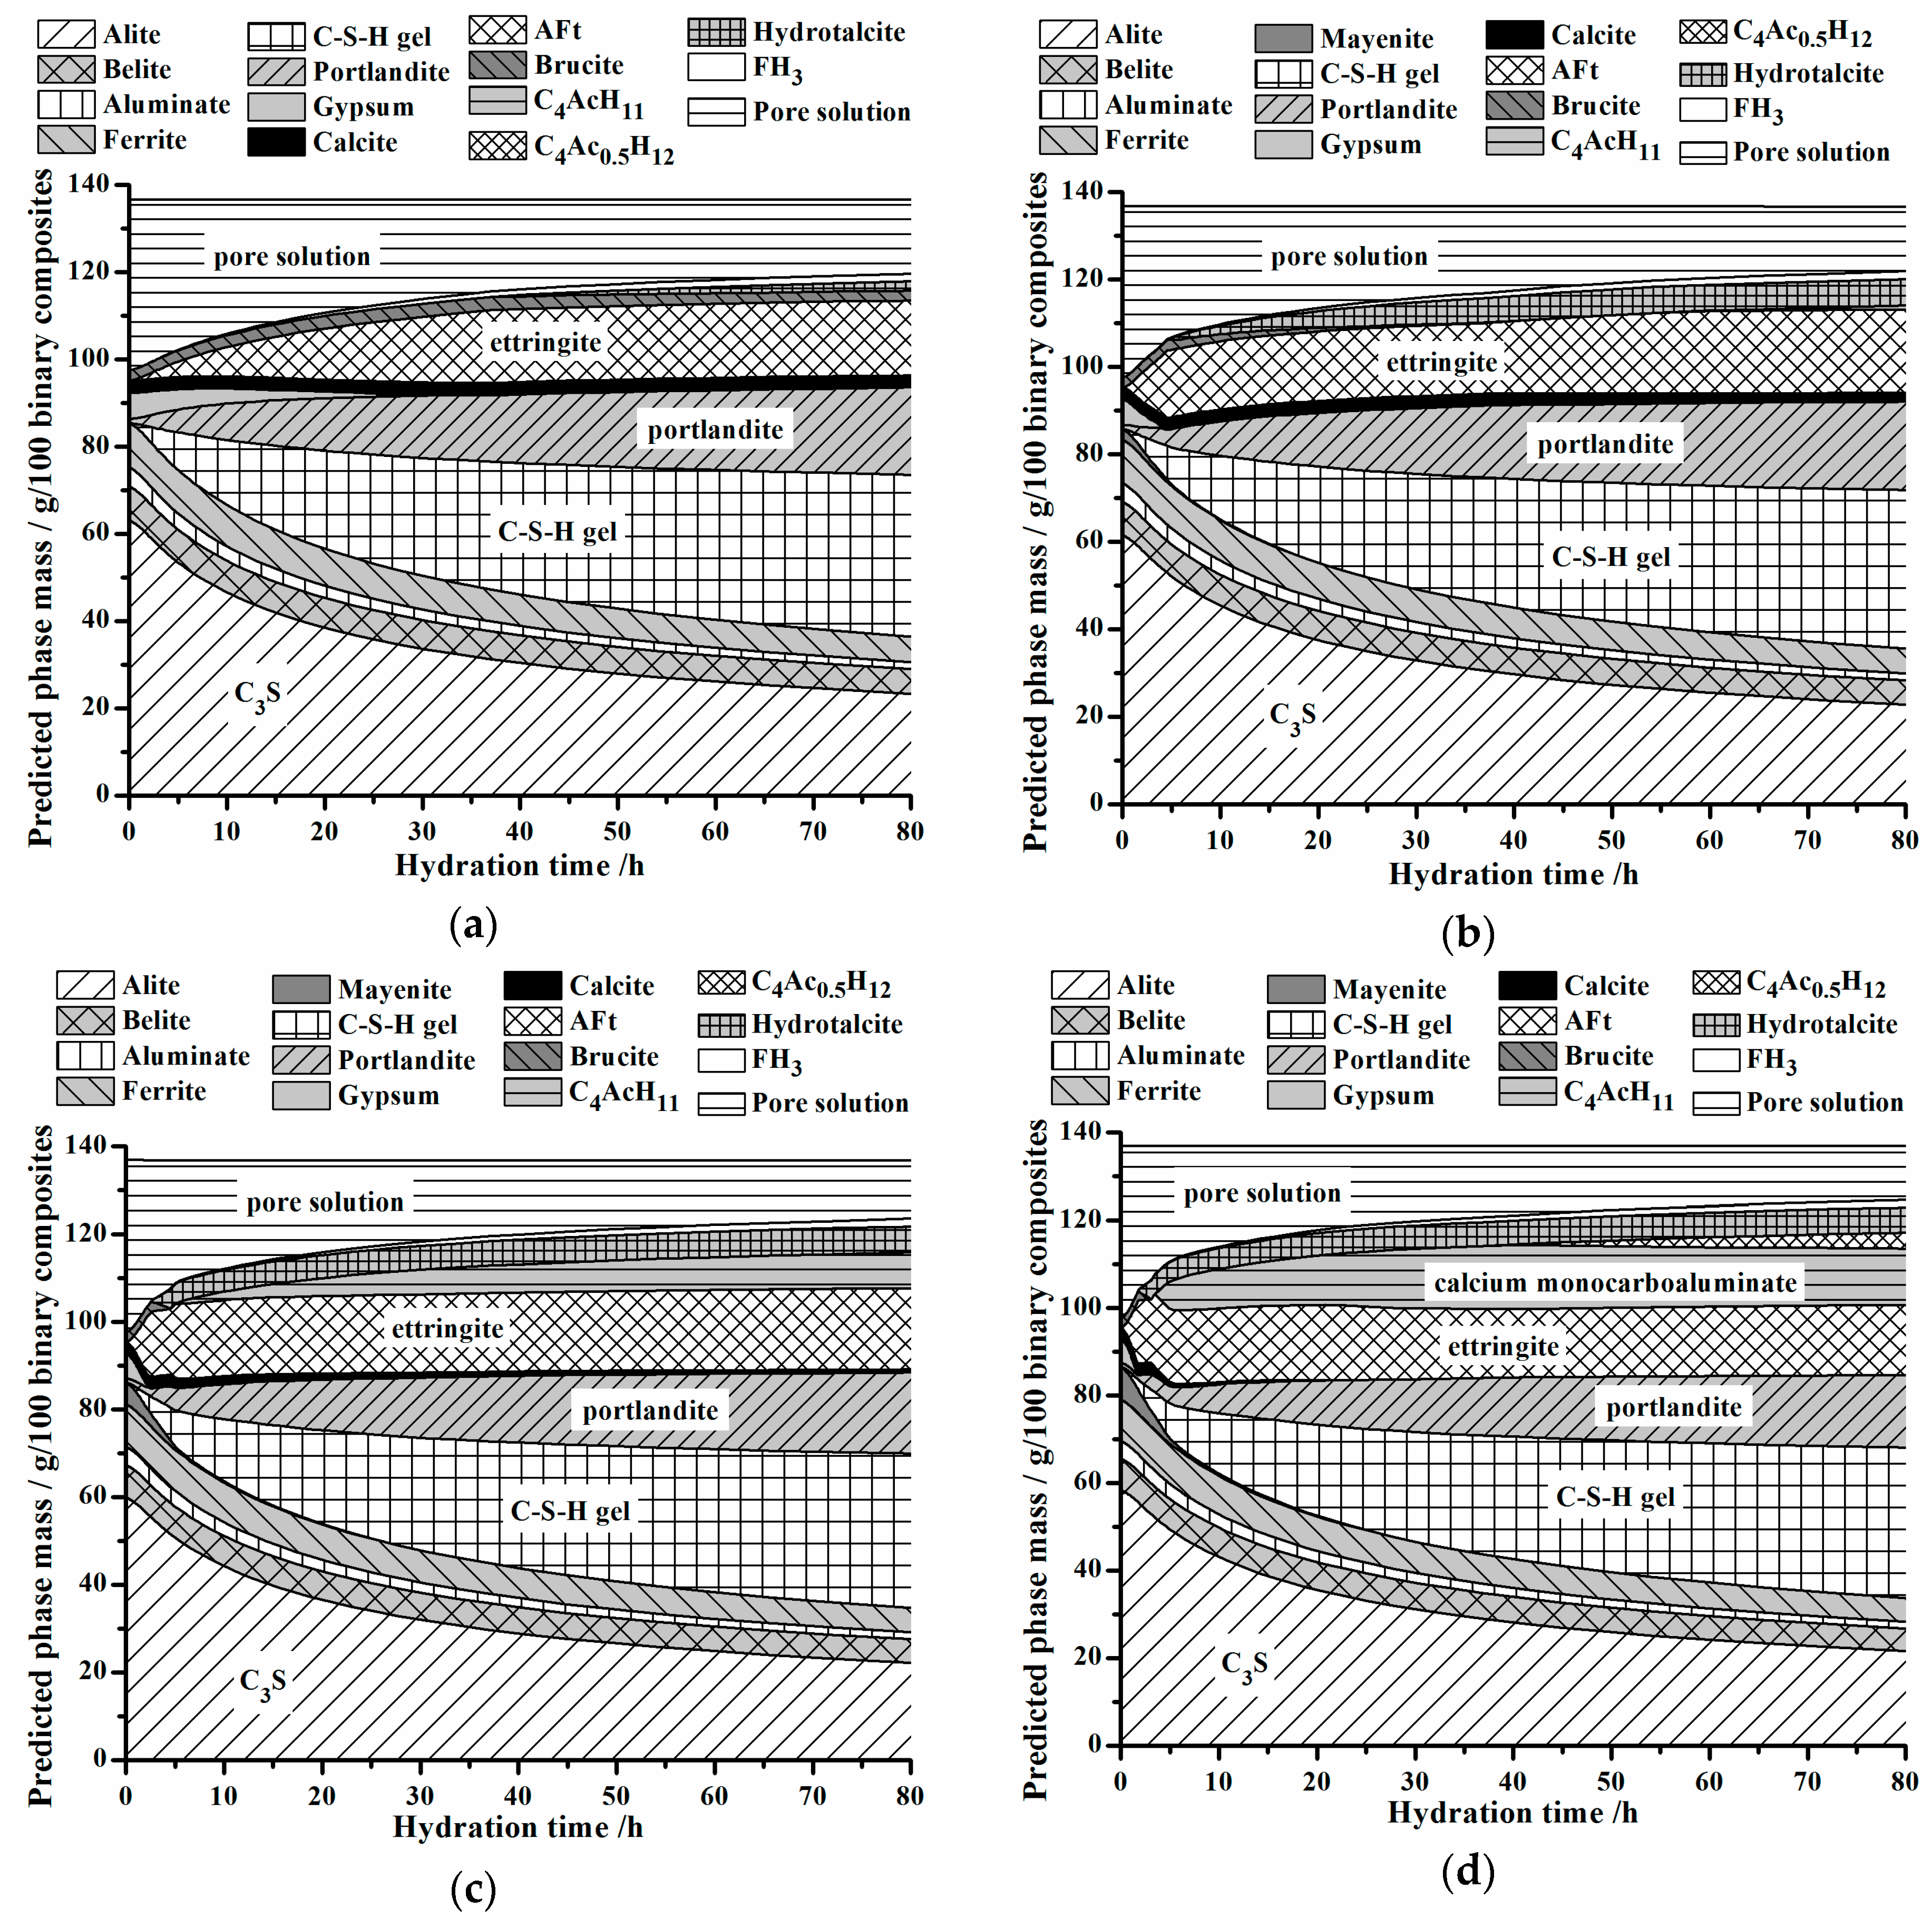
Simulation results of hydrate assemblages are depicted in Figure 7. It can be observed that main hydrated products of OPC are C-S-H gel, portlandite, ettringite, amorphous FH3 gel and Mg-containing phases, such as brucite and hydrotalcite, and no trace of C3AH6 is found. Meanwhile, AFm is absent in all groups. Lothenbach et al. [34] also found an absence of AFm in their studies, and stated that more work should be done in future research.
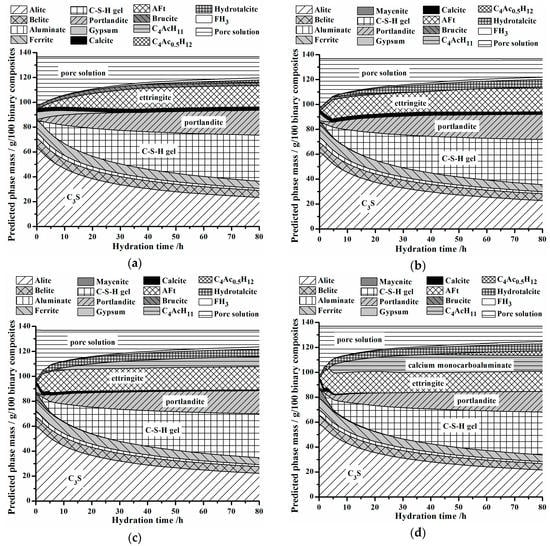
Figure 7.
Predicted hydrate assemblages at different hydration ages with w/c = 0.4 at 20 °C. (a) M0; (b) M2; (c) M5; (d) M7.
Basically, hydrate assemblages, consumption rate of gypsum and the role of calcite are affected by the addition of C12A7. For example, there are no calcium carboaluminates in the M0 group. For the M2 group, calcium monocarboaluminate appears at about 75 h and even calcium hemicarboaluminate presents at ca. 40 h in M7 group. Gypsum is completely consumed at around 1 d for M0 group, while it takes about just 5 h for the M2 group and even shorter for the M7 group.
Generally, simulation results manifest that the formation of carbonate phases like calcium monocarboaluminate and calcium hemicarboaluminate is affected by the addition of C12A7. Above analysis also makes clear that participation degree of calcite into cement hydration would remarkably increase if OPC is substituted by C12A7, rather than typically being employed in OPC as an inert filler to mainly reduce the total amount of hydration heat, diminish the potential risk of cracking and raise total economy. Thus, utilization efficiencies of each mineral phase in OPC are profoundly enhanced.
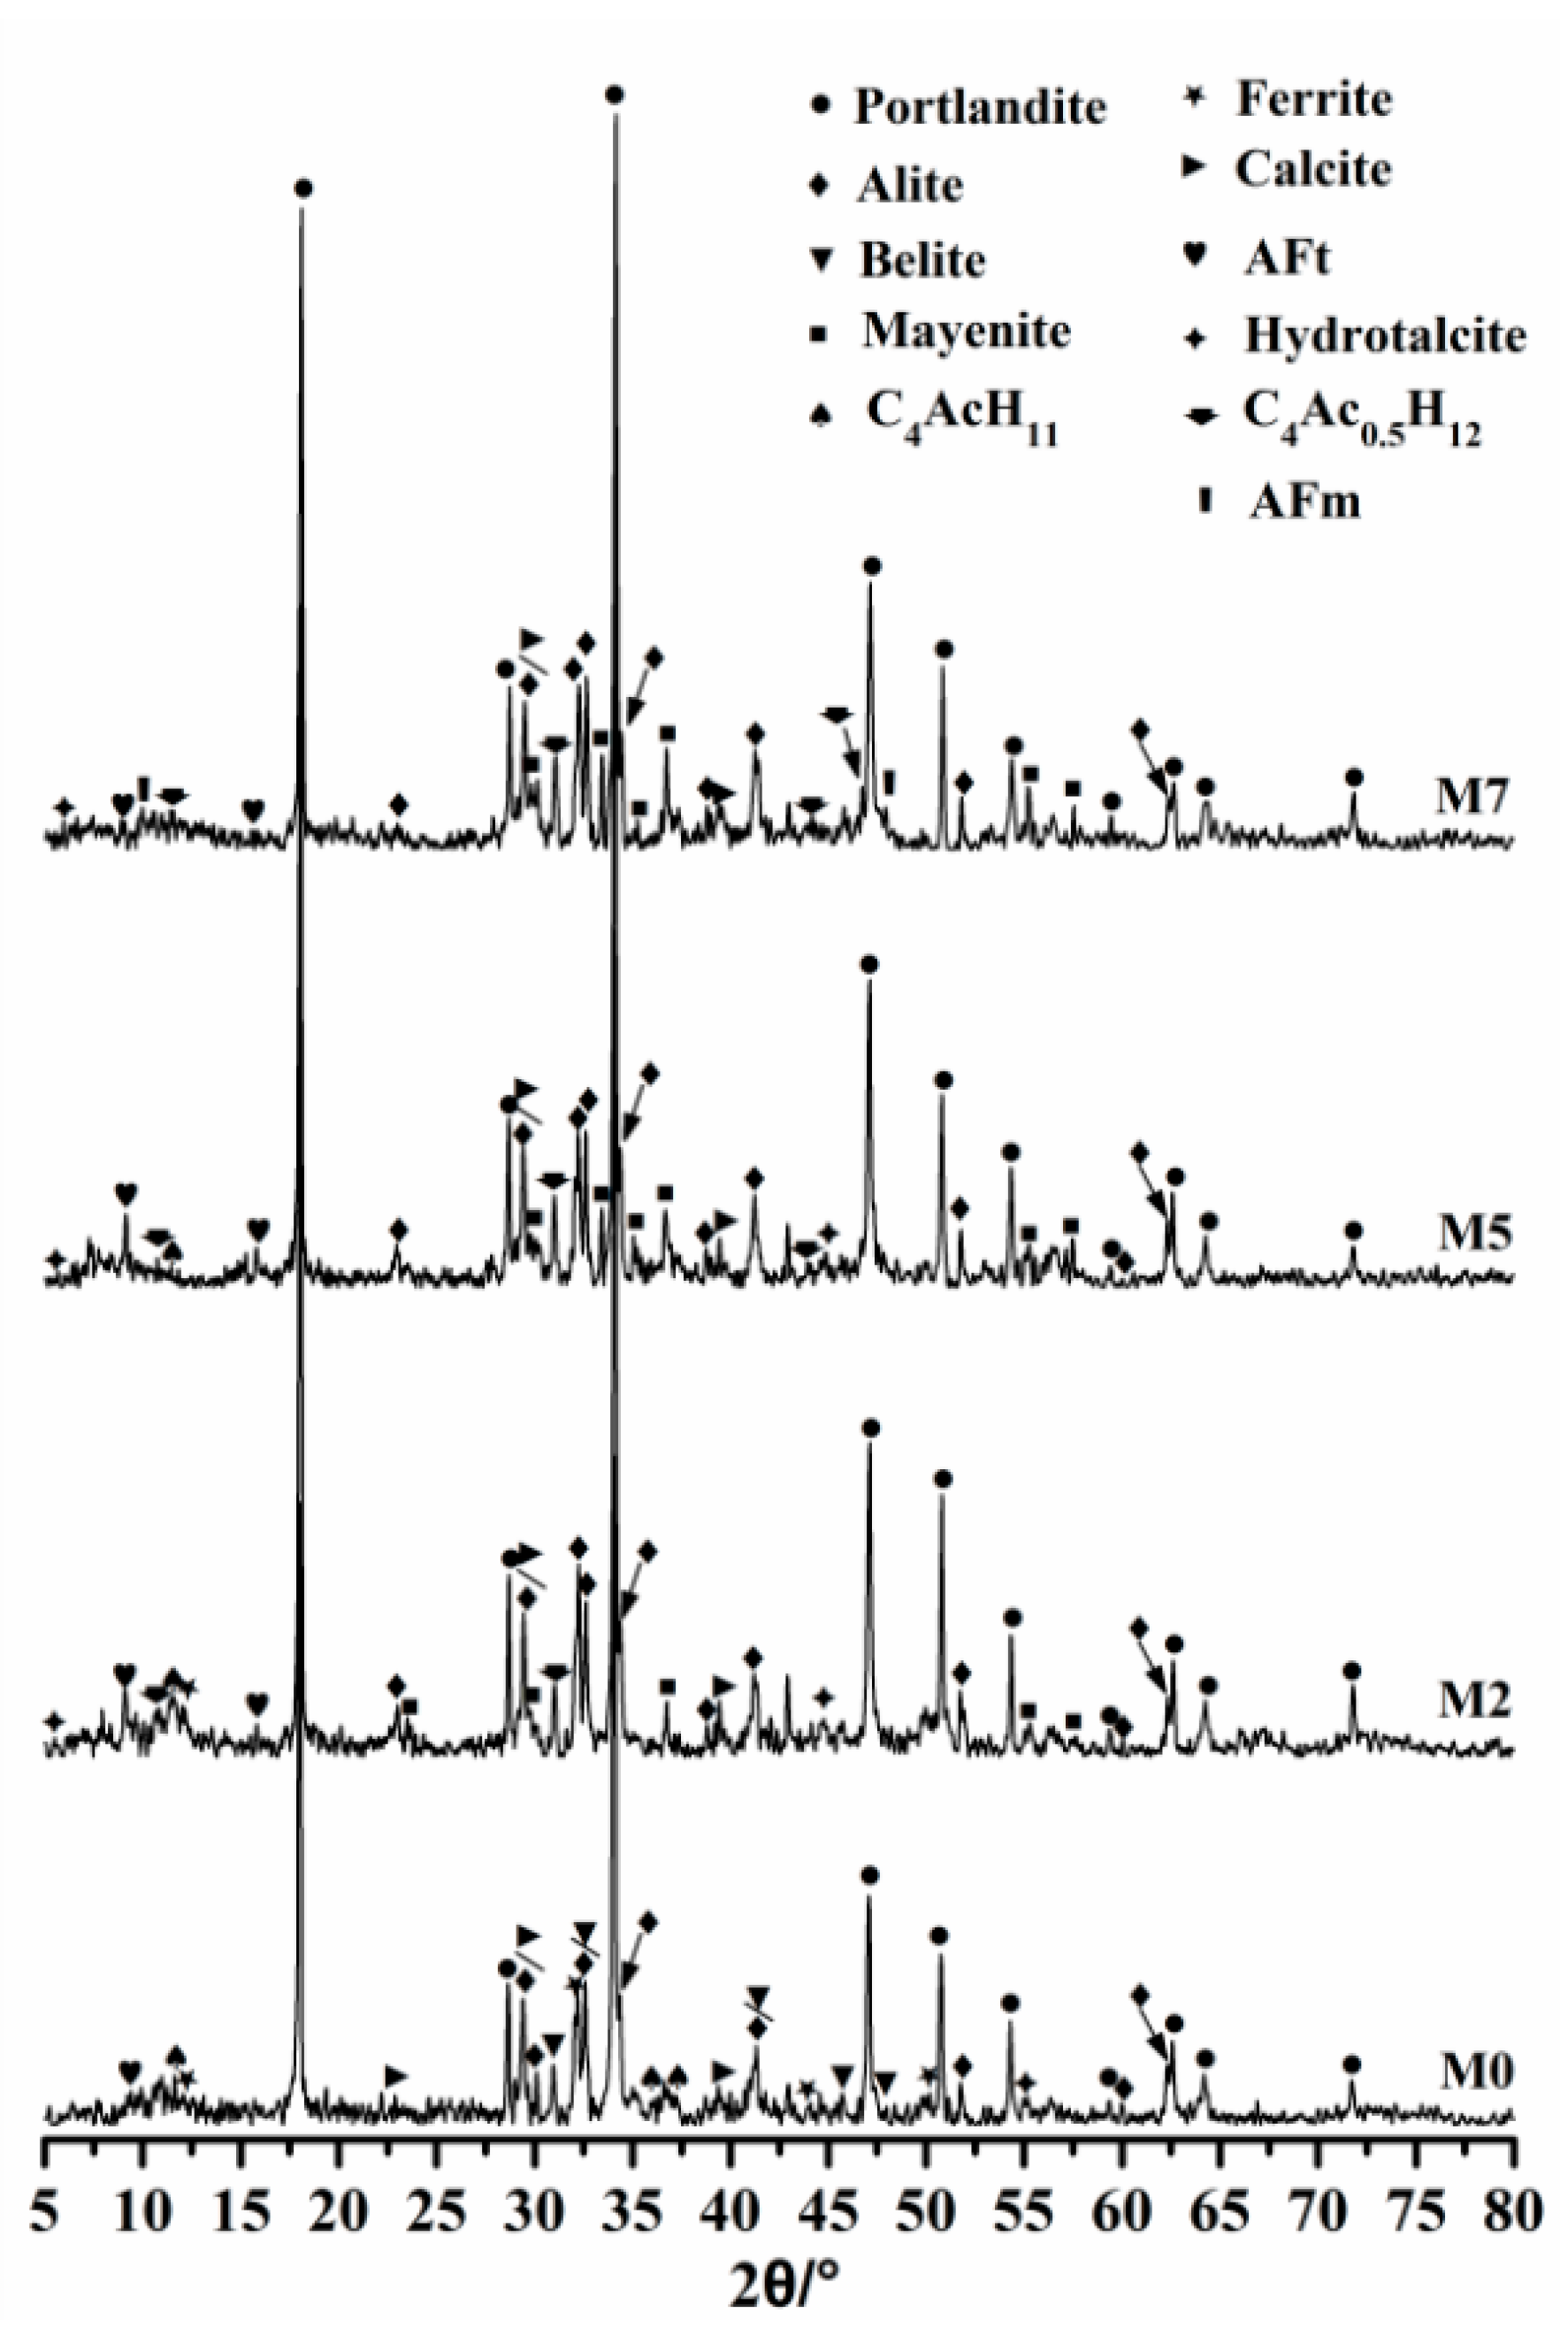
Simulation results are further verified by the XRD method. Experimental findings of phase identification of hydrated products are shown in Figure 8. These hydrated products are obtained by hydrating related groups at 20 °C for 3 days with a w/b = 0.4. It can be obviously found that dissimilarities occur between experimental results and simulated ones. In practical experiments, C12A7 still remains even after the sample hydrating for 3 days, and intensities of its diffraction peaks increase with C12A7 replacement. The presence of C12A7 is caused by the fact that hydration activity of C12A7 is considerably higher than that of OPC, and it is difficult to mix C12A7 and OPC uniformly by hand. Existences of brucite and amorphous FH3 gel are unable to be detected by XRD. Moreover, presences of AFt, AFm and hydrotalcite are also uneasy to be observed. For one thing, these materials are in poor crystallinity, and intensities of diffraction peaks are very weak. As seen in Figure 8, intensities of diffraction peaks belonging to hydrotalcite are close to the ones of background noises. Something else to note is that many diffraction peaks of these phases are overlapping with the ones of portlandite, silicates, ferrites and calcite, and thus it is difficult to distinguish their belonging clearly.

Figure 8.
XRD spectra of hydrated products at 3 d age with a w/b = 0.4 at 20 °C.
Basically, simulation results are in good agreement with the experimental findings. It can be observed in Figure 8 that the intensity of the diffraction peak that appeared at about 2θ = 30.9° increases with C12A7 replacement, indicating that the amount of calcium hemicarboaluminate rises as well. This coincides with the simulation results very well. Besides, a signal belonging to AFt appears at 2θ = 9.2°, and its intensity increases with C12A7 replacement except for M7 group. Besides, a less distinct peak that occurs at 2θ = 5.5° signifies the existence of hydrotalcite. Disregarding the amount of each phase, the simulated composition of hydrated products basically conforms to XRD analysis. However, it should be noted that a peak attributed to AFm emerges at 2θ = 9.98°, denoting that AFm is formed in the M7 group. This is inconsistent with the simulation results, meaning the simulation route should be further revised in future investigation.
3.5. Effect of C12A7 on Mechanical Strehgthes
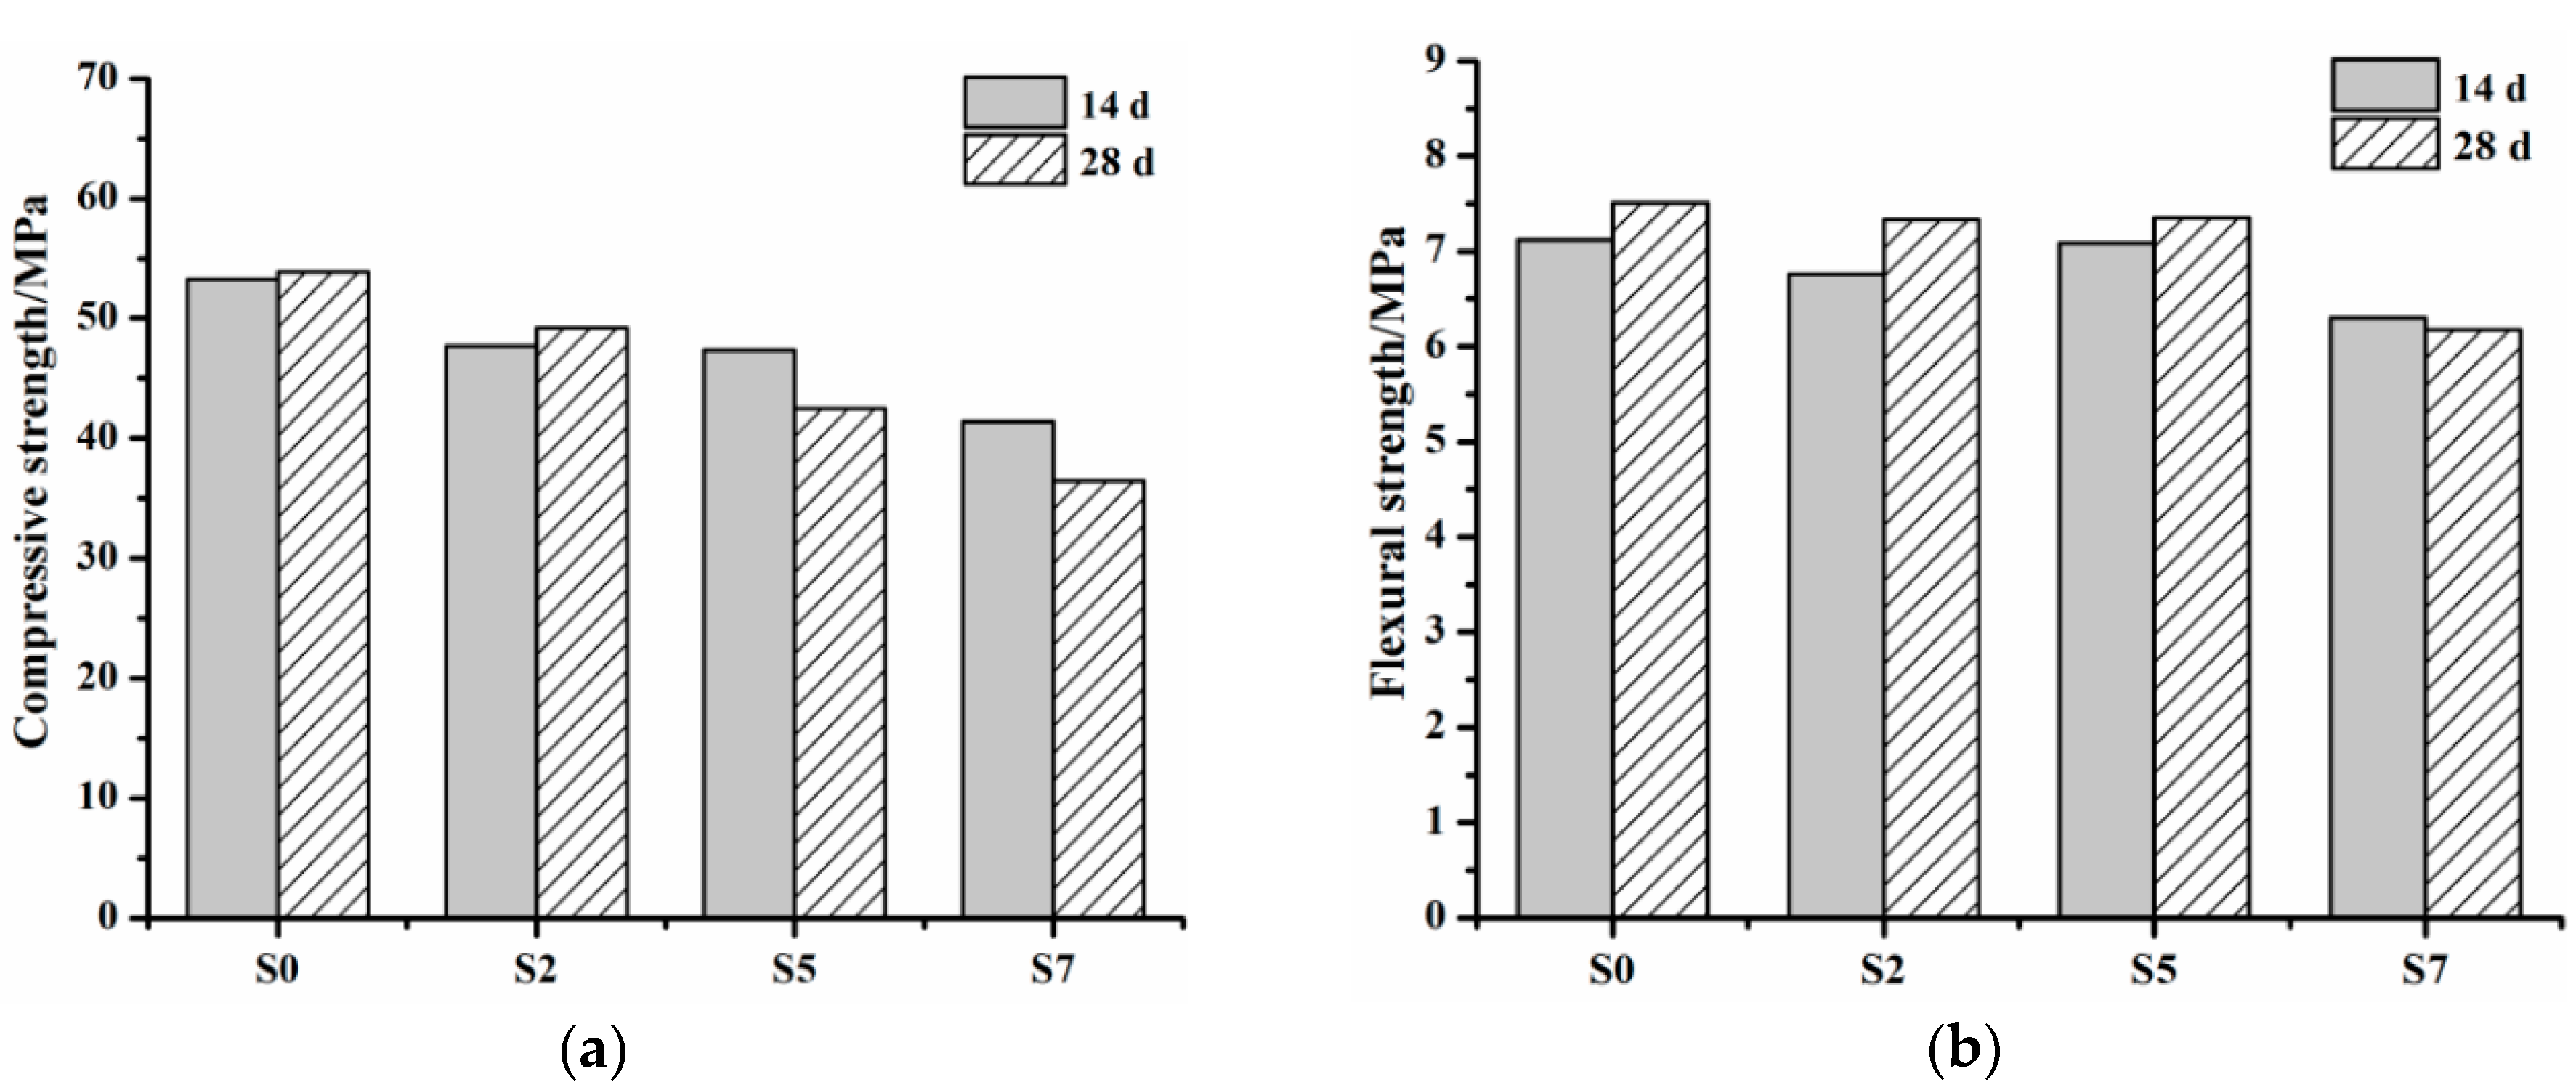
The influence of C12A7 on compressive strength of mortar groups at 14 and 28 d ages is demonstrated in Figure 9a. Basically, the compressive strengths of groups with C12A7 are lower than that of the reference group, and it can be clearly seen that a reduction of compressive strength with the rising of C12A7 replacement exists. Moreover, compressive strength shrinkage can be seen in S5 and S7 groups. For instance, compressive strength of S5 group at 28 d age is 10.2% lower than that at 14 d age, and for S7 group, the value is 12.1%. It seems that a higher C12A7 replacement would produce a larger compressive strength shrinkage. The changing trend of flexural strength of mortar groups at 14 and 28 d ages with the increasing of C12A7 replacement can be seen in Figure 9b. Unlike compressive strength, flexural strength of groups with C12A7 stays more or less the same with the reference group if C12A7 replacement is not higher than 5%. For example, flexural strengths of S0, S2 and S5 groups at 14 d age are 7.1, 6.8 and 7.1 MPa, respectively, and at 28 d age are 7.5, 7.3 and 7.3 MPa, respectively. Similarly, a slightly shrinkage of flexural strength can be seen in the S7 group. For example, flexural strength of the S7 group at 28 d age is 1.9% lower than that at 14 d age. These experimental findings reveal that C12A7 replacement should be controlled in a reasonable range.
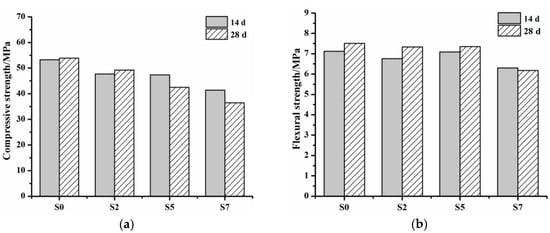
Figure 9.
Compressive strength and flexural strength of mortar groups at 14 and 28 d ages. (a) Compressive strength of mortar groups at 14 and 28 d ages; (b) Flexural strength of mortar groups at 14 and 28 d ages.
The decrease of compressive strength of mortar groups with C12A7 comparing to the reference group without C12A7 may relate to the hydration of C12A7. Unlike the second hydration behaviors of pozzolanic materials such as fly ash, slag, silica, metakaolin, etc. [36], only the above-mentioned aluminate hydrates would be formed during the hydration of C12A7. These aluminate hydrates could further react with gypsum or AFt to produce AFm, leading to a reduction of AFt/AFm ratio in hydrate assemblages. Thereby, the skeleton effect of AFt is weakened and microstructure mechanical properties of hydrated products are influenced [37]. Moreover, C12A7 reacts with water rapidly, and its hydrated products could precipitate on the surface of unhydrated OPC particles, so that the hydration of OPC is affected. This coincides well with the forgoing hydration kinetic analysis results. Besides, rapid hydration of C12A7 may cause flocculation in the system, and thus defective regions would form in the paste matrix of mortars.
The changing trend of compressive strength with hydration age in this work is a bit different from previous research, wherein compressive strength shrinkage had not been found [13]. This may relate to the fact that a proper amount of other mineral phases such as NaCO, CaSO4, NaAlO2 and Ca(OH)2 were added together with C12A7 in previous research [13], whereas only pure C12A7 substitutes OPC in the presented work. The mineral phases may have a combined effect on the properties of hydrated products of OPC, and thus the compressive strength of shotrete could continuously rise at a later age. Since the hydration activity of C12A7 is pretty high, it is reasonable to postulate that C12A7 does not possess shape effect, filling effect, second hydration ability, etc., like waste recycled glass [38]. Therefore, the influence of C12A7 mainly relates to its hydration behavior, properties of hydrated products and interactions of hydrated products between C12A7 and OPC. In the presented work, the shrinkage of compressive strength perhaps correlates to the conversions among aluminate hydrates in hydrated products of C12A7.
4. Conclusions
Hydration behavior of pure C12A7 is systematically studied, and its influence on the hydration of OPC is evaluated in the presented work.
The hydration of C12A7 involves a transition phase-forming stage and a transition phase-converting stage. Thermodynamic calculation reveals that the transition phase-forming stage is exothermic, while the later converting stage is endothermic. This is why temperature exerts significant effects on the hydration of C12A7. Metastable transition phase C2AH8 is produced during the hydration of C12A7, whereas the formation of CAH10 is still uncertain.
Heat-releasing behavior of OPC can be greatly influenced by C12A7, and thus accumulative hydration heat increases with C12A7 replacement rising in the initial 15 h hydration; whereas all accumulative hydration heats of groups with C12A7 are lower than that of the control group after 15 h.
The influence of C12A7 on heat-releasing behavior of OPC may be caused by the changing of the hydration kinetic process. All hydration kinetic parameters first rise, and then reduce with C12A7 replacement increasing. The duration of I stage consistently decreases with C12A7 replacement, showing that the relevant hydration kinetic process has a trend to change from NG-I-D to NG-D.
Hydrate assemblage of OPC can be greatly affected by C12A7. The consumption rate of gypsum and calcite can be greatly accelerated by increasing C12A7 replacement. Participation degree of calcite to hydration would be profoundly enhanced by increasing C12A7 replacement. Calcium hemicarboaluminate is formed in the high C12A7 content group. Therefore, the utilization efficiency of calcite typically included in OPC can be adjusted by controlling C12A7 replacement. It seems that C12A7 can be employed as a functional component for OPC to adjust the consumption rate of sulphates, and also the amount and type of carbonate phases in hydrated products can be modified.
The influence of C12A7 on the compressive strength of mortars is greater than on flexural strength. Compressive strength of mortars with C12A7 is lower than that of the reference group without C12A7. Meanwhile, compressive strength reduces with C12A7 replacement increasing. A shrinkage of compressive strength at a later age is detected when C12A7 replacement is no less than 5%. It seems that the influence of C12A7 on the compressive strength of mortars mainly relates to its hydration behavior, properties of hydrated products and interactions of hydrated products between C12A7 and OPC.
In view of the forgoing analysis, C12A7 has a significant impact on the hydration of OPC. However, interactions among clinker phases are not considered during simulations, and the effects of C12A7 on their hydration are not taken into account. These issues will be comprehensively researched in future investigations.
Author Contributions
Z.H. conceived and designed the experiments; Y.L. performed the experiments and wrote the paper.
Funding
This research was funded by the China Ministry of Science and Technology [2015CB655101], National Natural Science Foundation of China (NSFC) [51379163].
Conflicts of Interest
The authors declare no conflict of interest.
References
- Mohamed, B.M.; Sharp, J.H. Kinetics and mechanism of formation of tricalcium aluminate, Ca3Al2O6. Thermochim. Acta 2002, 388, 105–114. [Google Scholar] [CrossRef]
- Nishio, Y.; Nomura, K.; Miyakawa, M.; Hayashi, K.; Yanagi, H.; Kamiya, T.; Hosono, H. Fabrication and transport properties of 12CaO·7Al2O3 (C12A7) electride nanowire. Phys. Status Solidi A Appl. Res. 2008, 205, 2047–2051. [Google Scholar] [CrossRef]
- Tong, Z.F.; Xie, S.L.; Zhang, L.H.; Chen, T.; Liu, W. Preparation and application of the 12CaO·7Al2O3 material. Nonferr. Met. Sci. Eng. 2011, 2, 16–21. [Google Scholar]
- Hirao, H.; Yokoyama, S. Behavior of chloride ions in hardened eco-cement: A new type portland cement made from municipal waste incinerator ash. Concr. Res. Technol. 2003, 13, 129–138. [Google Scholar] [CrossRef]
- Xie, Y.G.; Sheng, X.; Wang, Y.C.; Li, L.H. Study on sulfate treatment in water by mayenite. China Water Waste Water 2008, 24, 92–94. [Google Scholar]
- Wang, Q.; Yang, J.W.; Yan, P.Y. Influence of initial alkalinity on the hydration of steel slag. Sci. China Technol. Sci. 2012, 55, 3378–3387. [Google Scholar] [CrossRef]
- Han, F.H.; Wang, D.M.; Yan, P.Y. Hydration kinetics of composite binder containing different content of slag or fly ash. J. China Ceram. Soc. 2014, 42, 613–620. [Google Scholar] [CrossRef]
- Edmonds, R.N.; Majumdar, A.J. The hydration of 12CaO.7Al2O3 at different temperatures. Cem. Concr. Res. 1988, 18, 473–478. [Google Scholar] [CrossRef]
- Damidot, D.; Rettel, A. Effect of gypsum on CA and C12A7 Hydration at room temperature. In Proceedings of the 11th International Congress on the Chemistry of Cement (ICCC), Durban, South Africa, 11–16 May 2003. [Google Scholar]
- Park, C.K. Characteristics and hydration of C12−xA7·x(CaF2) (x = 0~1.5) minerals. Cem. Concr. Res. 1998, 28, 1357–1362. [Google Scholar] [CrossRef]
- Park, H.G.; Sung, S.K.; Park, C.G.; Won, J.P. Influence of a C12A7 mineral-based accelerator on the strength and durability of shotcrete. Cem. Concr. Res. 2008, 38, 379–385. [Google Scholar] [CrossRef]
- Won, J.P.; Hwang, U.J.; Kim, C.K.; Lee, S.J. Mechanical performance of shotcrete made with a high-strength cement-based mineral accelerator. Constr. Build. Mater. 2013, 49, 175–183. [Google Scholar] [CrossRef]
- Won, J.P.; Hwang, U.J.; Lee, S.J. Enhanced long-term strength and durability of shotcrete with high-strength C12A7 mineral-based accelerator. Cem. Concr. Res. 2015, 76, 121–129. [Google Scholar] [CrossRef]
- Rovnanik, P. Influence of C12A7 admixture on setting properties of fly ash geopolymer. Ceram. Silikaty 2011, 54, 362–367. [Google Scholar]
- Taylor, H.F.W. Portland cement and its major constituent phase. In Cement Chemistry, 2nd ed.; Thomas Telford Services Ltd.: London, UK, 1997; p. 77. [Google Scholar]
- Castel, E.; Ik Shin, T.; Fourcade, S.; Decourt, R.; Maglione, M.; García-Víllora, E.; Shimamura, K. Effect of annealing under O2 and H2 on the piezoelectric parameters of the Ca12Al14O33 single crystals. J. Appl. Phys. 2012, 111, 054107. [Google Scholar] [CrossRef]
- GB/T 17671-1999. The Quality and Technology Supervision Bureau. Method of Testing Cements—Determination of Strength; China Standard Press: Beijing, China, 2014. [Google Scholar]
- GB/T 175-2007. The Quality and Technology Supervision Bureau. Common Portland Cement; China Standard Press: Beijing, China, 2015. [Google Scholar]
- Dong, J.H.; Li, Z.Y. Effect of Temperature on Heat Release Behavior of Hydration of Cement. J. Build. Mat. 2010, 13, 676–677. [Google Scholar] [CrossRef]
- Hewlett, P.C. The constitution and specification of portland cement. In Lea's Chemistry of Cement and Concrete, 4th ed.; Butterworth-Heinemann: Oxford, UK, 2004; p. 324. [Google Scholar]
- Krstulović, R.; Dabić, P. A conceptual model of the cement hydration process. Cem. Concr. Res. 2000, 30, 693–698. [Google Scholar] [CrossRef]
- Yan, P.; Zheng, F. Kinetics model for the hydration mechanism of cementitious materials. J. Ceram. Soc. 2006, 34, 555–559. [Google Scholar]
- He, Z.; Yang, H.; Hu, S.; Liu, M. Hydration mechanism of silica fume-sulphoaluminate cement. J. Wuhan Univer. Technol. Mater. Sci. Ed. 2013, 28, 1128–1133. [Google Scholar] [CrossRef]
- He, Z.; Yang, H.M.; Liu, M.Y. Hydration Mechanism of Sulphoaluminate Cement. J. Wuhan Univer. Technol. Mater. Sci. Ed. 2014, 29, 70–74. [Google Scholar] [CrossRef]
- Zhou, H.; Liu, J.; Liu, J.; Li, C. Hydration kinetics process of low alkalinity sulphoaluminate cement and its thermodynamical properties. Procedia Eng. 2012, 27, 323–331. [Google Scholar] [CrossRef]
- Tian, Y.; Jin, X.Y.; Jin, N.G. Micro expressions of cement hydration kinetics. Rare Met. Mater. Eng. 2010, 39, 216–219. [Google Scholar]
- Damidot, D.; Sorrentino, F. Modification of the hydration process from C12A7 to C3A at 20 °C. In Proceedings of the 10th International Congress on the Chemistry of Cement (ICCC), Goteborg, Sweden, 2–6 June 1997. [Google Scholar]
- Kirby, D.M.; Biernacki, J.J. The Effect of water-to-cement ratio on the hydration kinetics of tricalcium silicate cements: Testing the two-step hydration hypothesis. Cem. Concr. Res. 2012, 42, 1147–1156. [Google Scholar] [CrossRef]
- Das, S.K.; Mitra, A.; Das, P.P.K. Thermal analysis of hydrated calcium aluminates. J. Therm. Anal. Calorim. 1996, 47, 765–774. [Google Scholar] [CrossRef]
- Thoenen, T.; Kulik, D. Nagra/PSI chemical thermodynamic database 01/01 for the GEM-Selektor (V.2-PSI) Geochemical Modeling Code, PSI. Available online: http://les.web.psi.ch/Software/GEMS-PSI/doc/pdf/TM-44-03-04-web.pdf. 2003. (accessed on 10 September 2018).
- Matschei, T.; Lothenbach, B.; Glasser, F.P. Thermodynamic properties of portland cement hydrates in the system CaO-Al2O3-SiO2-CaSO4-CaCO3-H2O. Cem. Concr. Res. 1997, 37, 1397–1410. [Google Scholar] [CrossRef]
- Lothenbach, B.; Matschei, T.; Möschner, G.; Glasser, F.P. Thermodynamic modelling of the effect of temperature on the hydration and porosity of portland cement. Cem. Concr. Res. 2008, 38, 1–18. [Google Scholar] [CrossRef]
- Han, F.H.; Zhang, Z.Q.; Yan, P.Y. Early hydration properties of steel slag under high alkalinity. J. Chin. Electron Micros. Soc. 2012, 33, 343–348. [Google Scholar]
- Lothenbach, B.; Winnefeld, F. Thermodynamic modelling of the hydration of portland cement. Cem. Concr. Res. 2006, 36, 209–226. [Google Scholar] [CrossRef]
- Schmidt, T.; Lothenbach, B.; Romer, M.; Scrivener, K. A thermodynamic and experimental study of the conditions of thaumasite formation. Cem. Concr. Res. 2008, 38, 337–349. [Google Scholar] [CrossRef]
- Paul, S.C.; van Rooyen, A.S.; van Zijl, G.P. Properties of cement-based composites using nanoparticles: A comprehensive review. Constr. Build. Mater. 2018, 189, 1019–1034. [Google Scholar] [CrossRef]
- He, Z.; Cao, G.X.; Li, Y.; Liu, L.L. Influence of potassium-sodium ratio on the early age cracking sensitivity of cementitious materials with high alkalinity. J. Hydraul. Eng. 2016, 47, 1–9. [Google Scholar] [CrossRef]
- Paul, S.C.; Šavija, B.; Babafemi, A.J. A comprehensive review on mechanical and durability properties of cement-based materials containing waste recycle glass. J. Clean. Prod. 2018, 198, 891–906. [Google Scholar] [CrossRef]

© 2018 by the authors. Licensee MDPI, Basel, Switzerland. This article is an open access article distributed under the terms and conditions of the Creative Commons Attribution (CC BY) license (http://creativecommons.org/licenses/by/4.0/).