Temperature Modeling of AISI 1045 Steel during Surface Hardening Processes


Abstract
:1. Introduction
2. Finite Element Analysis Modeling
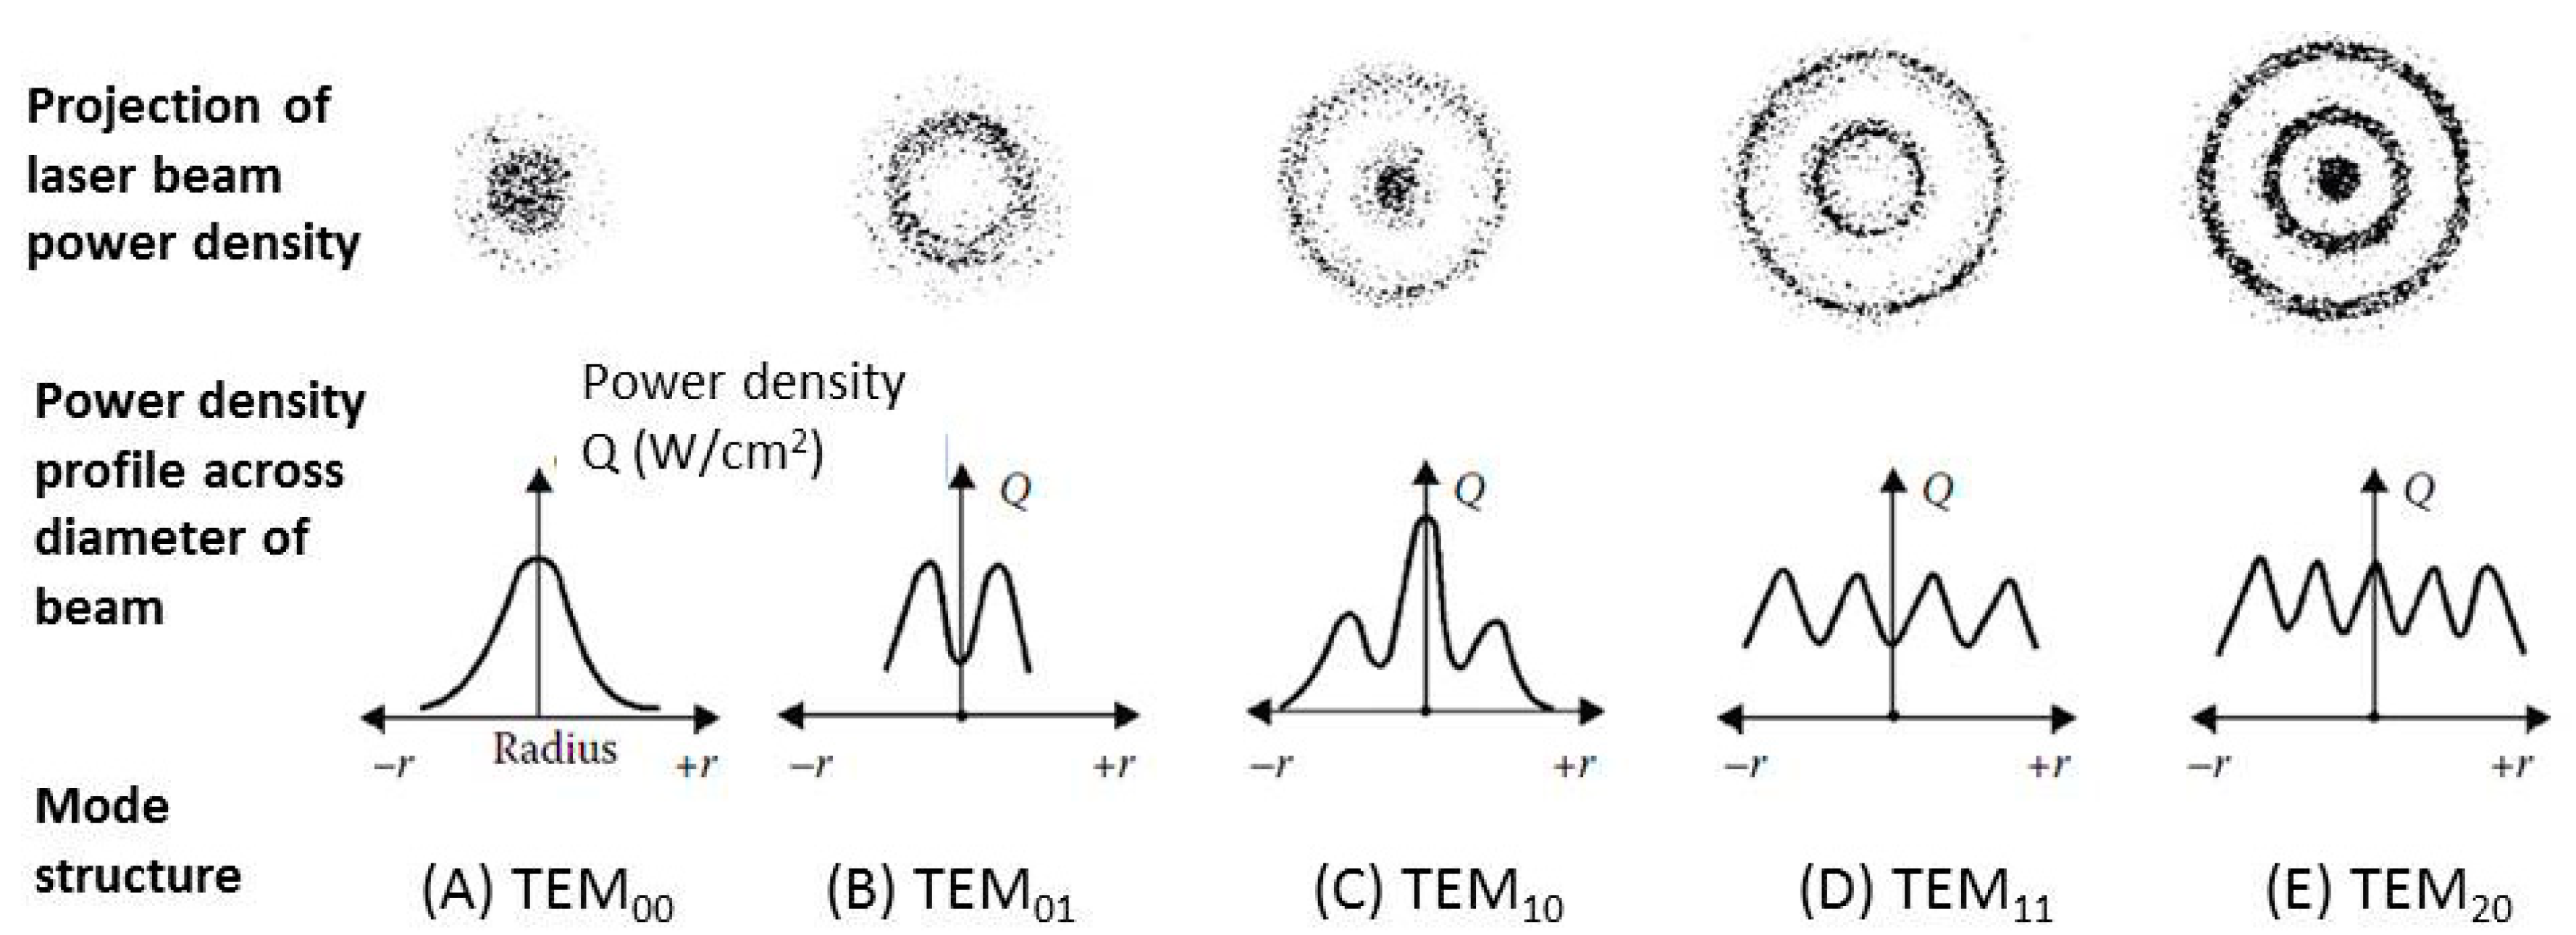
2.1. Construction of the Thermal Source Models
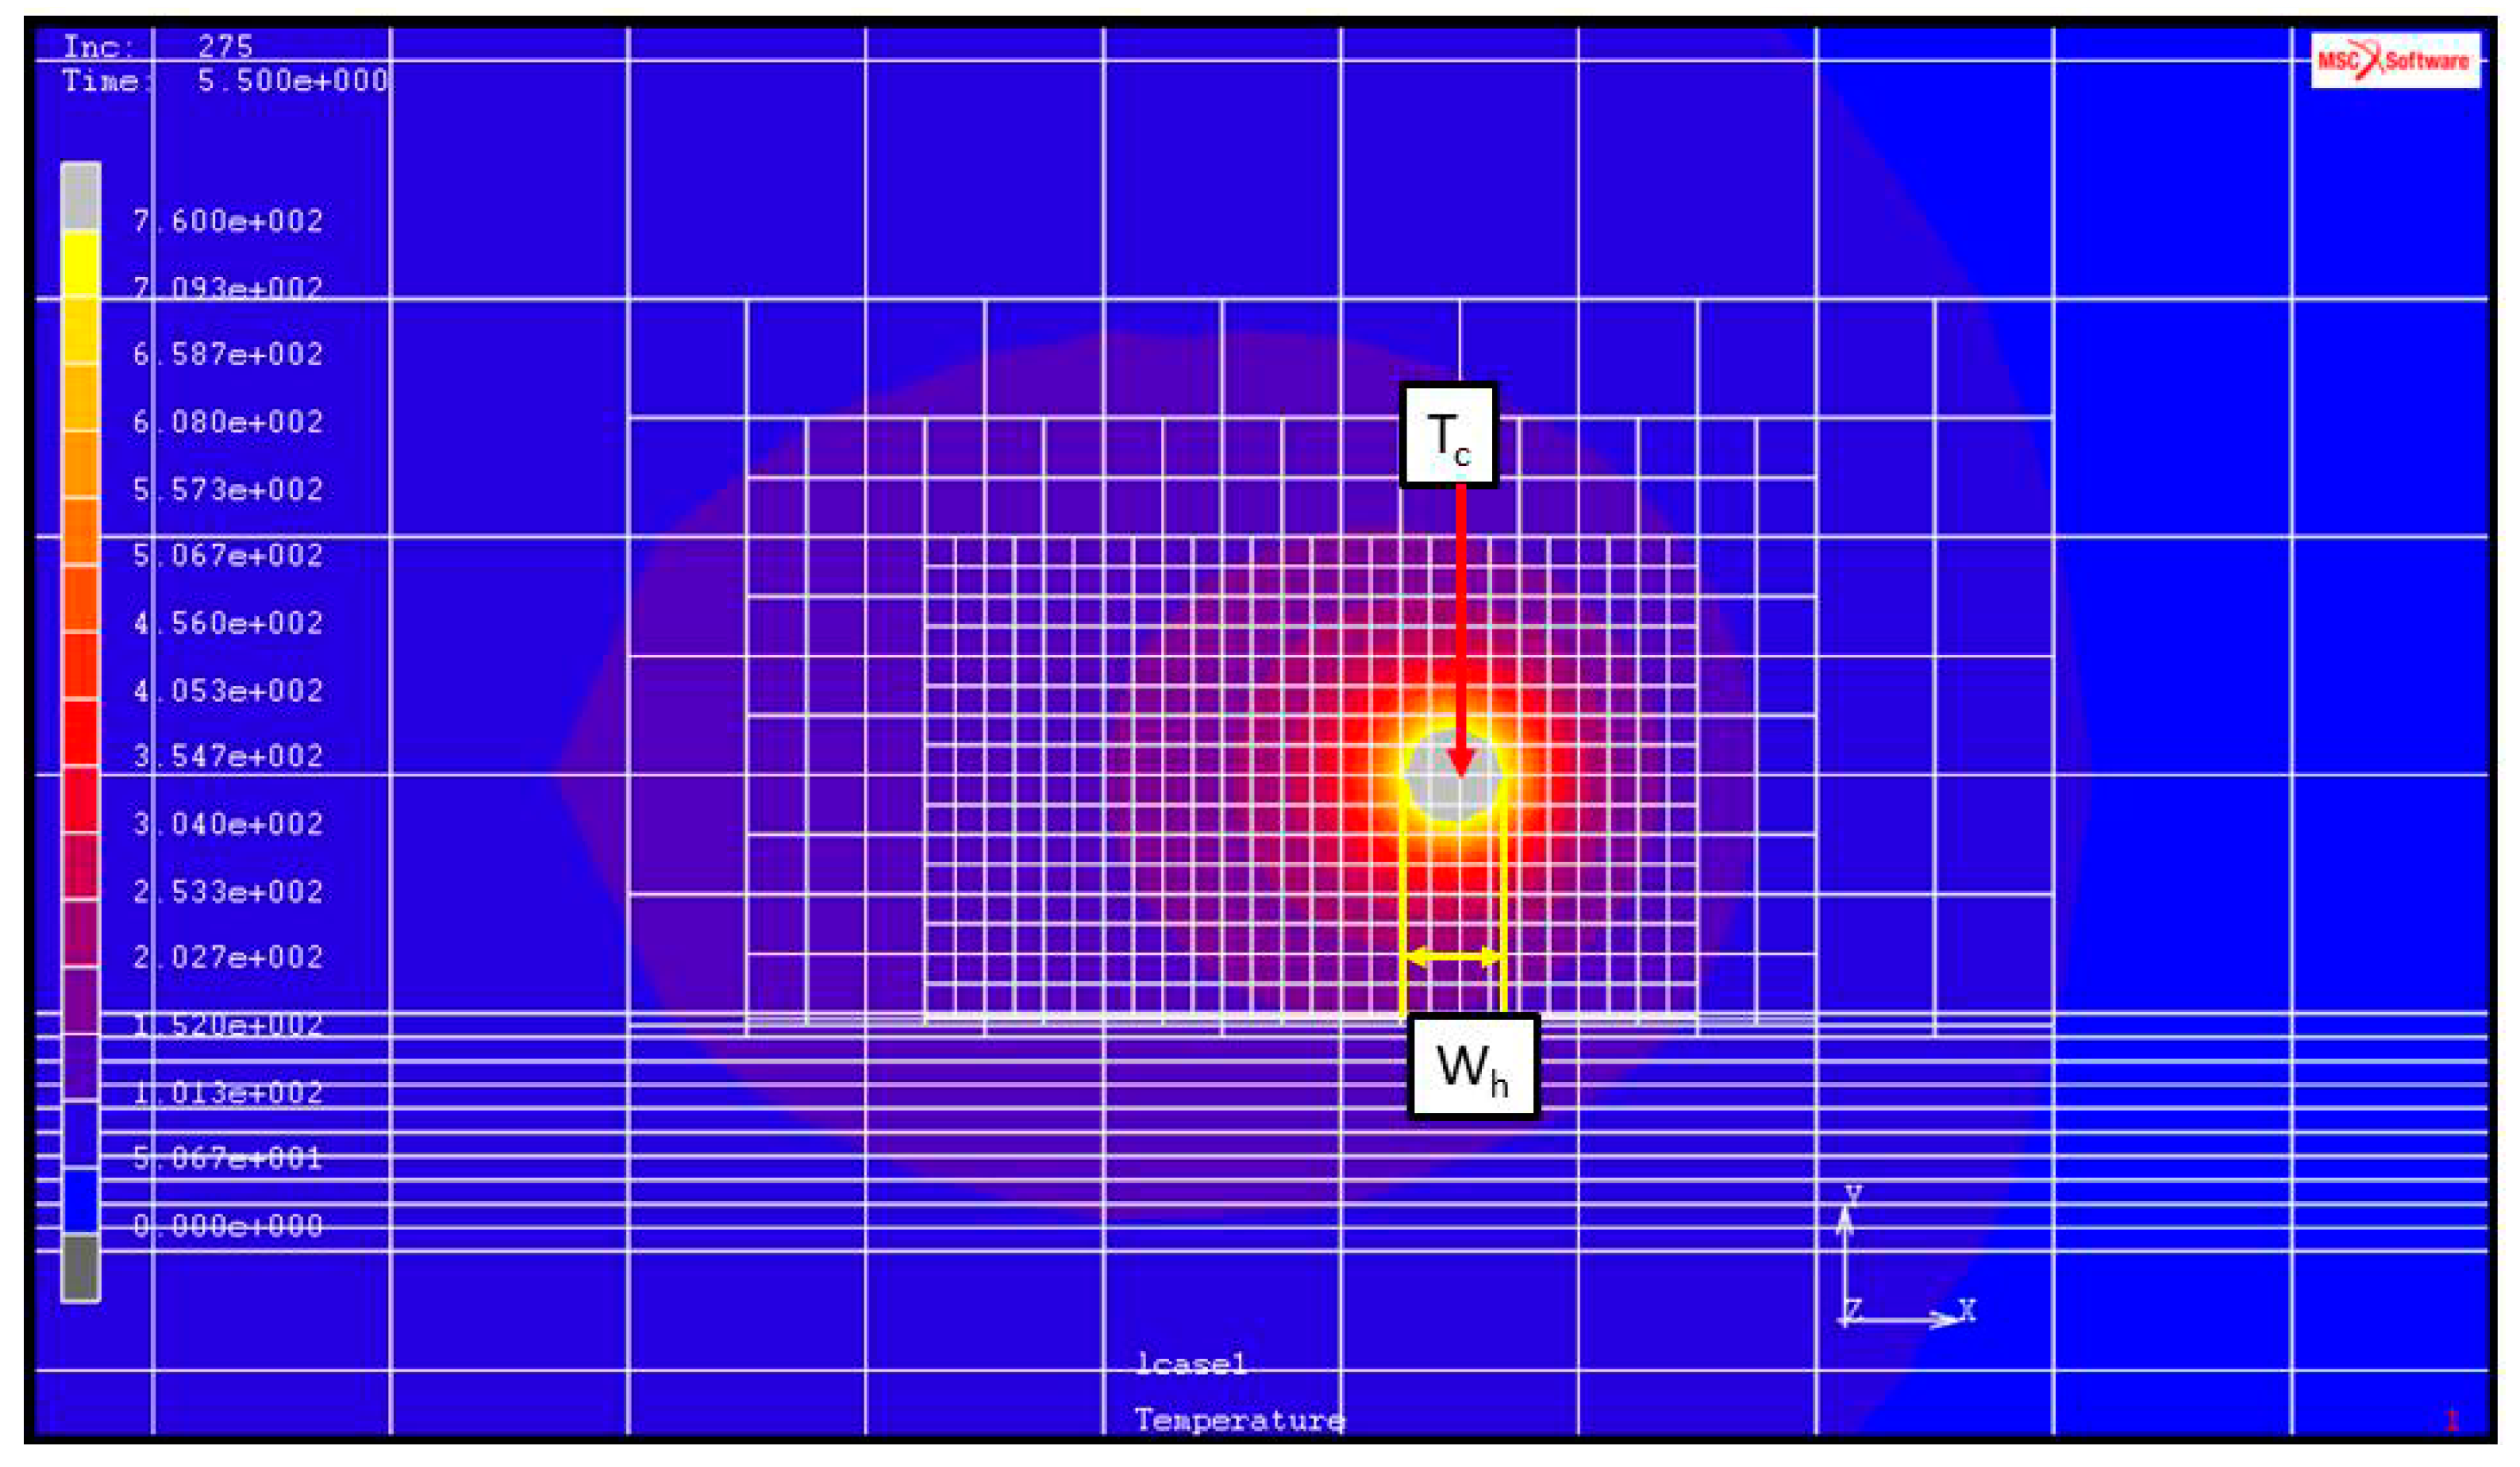
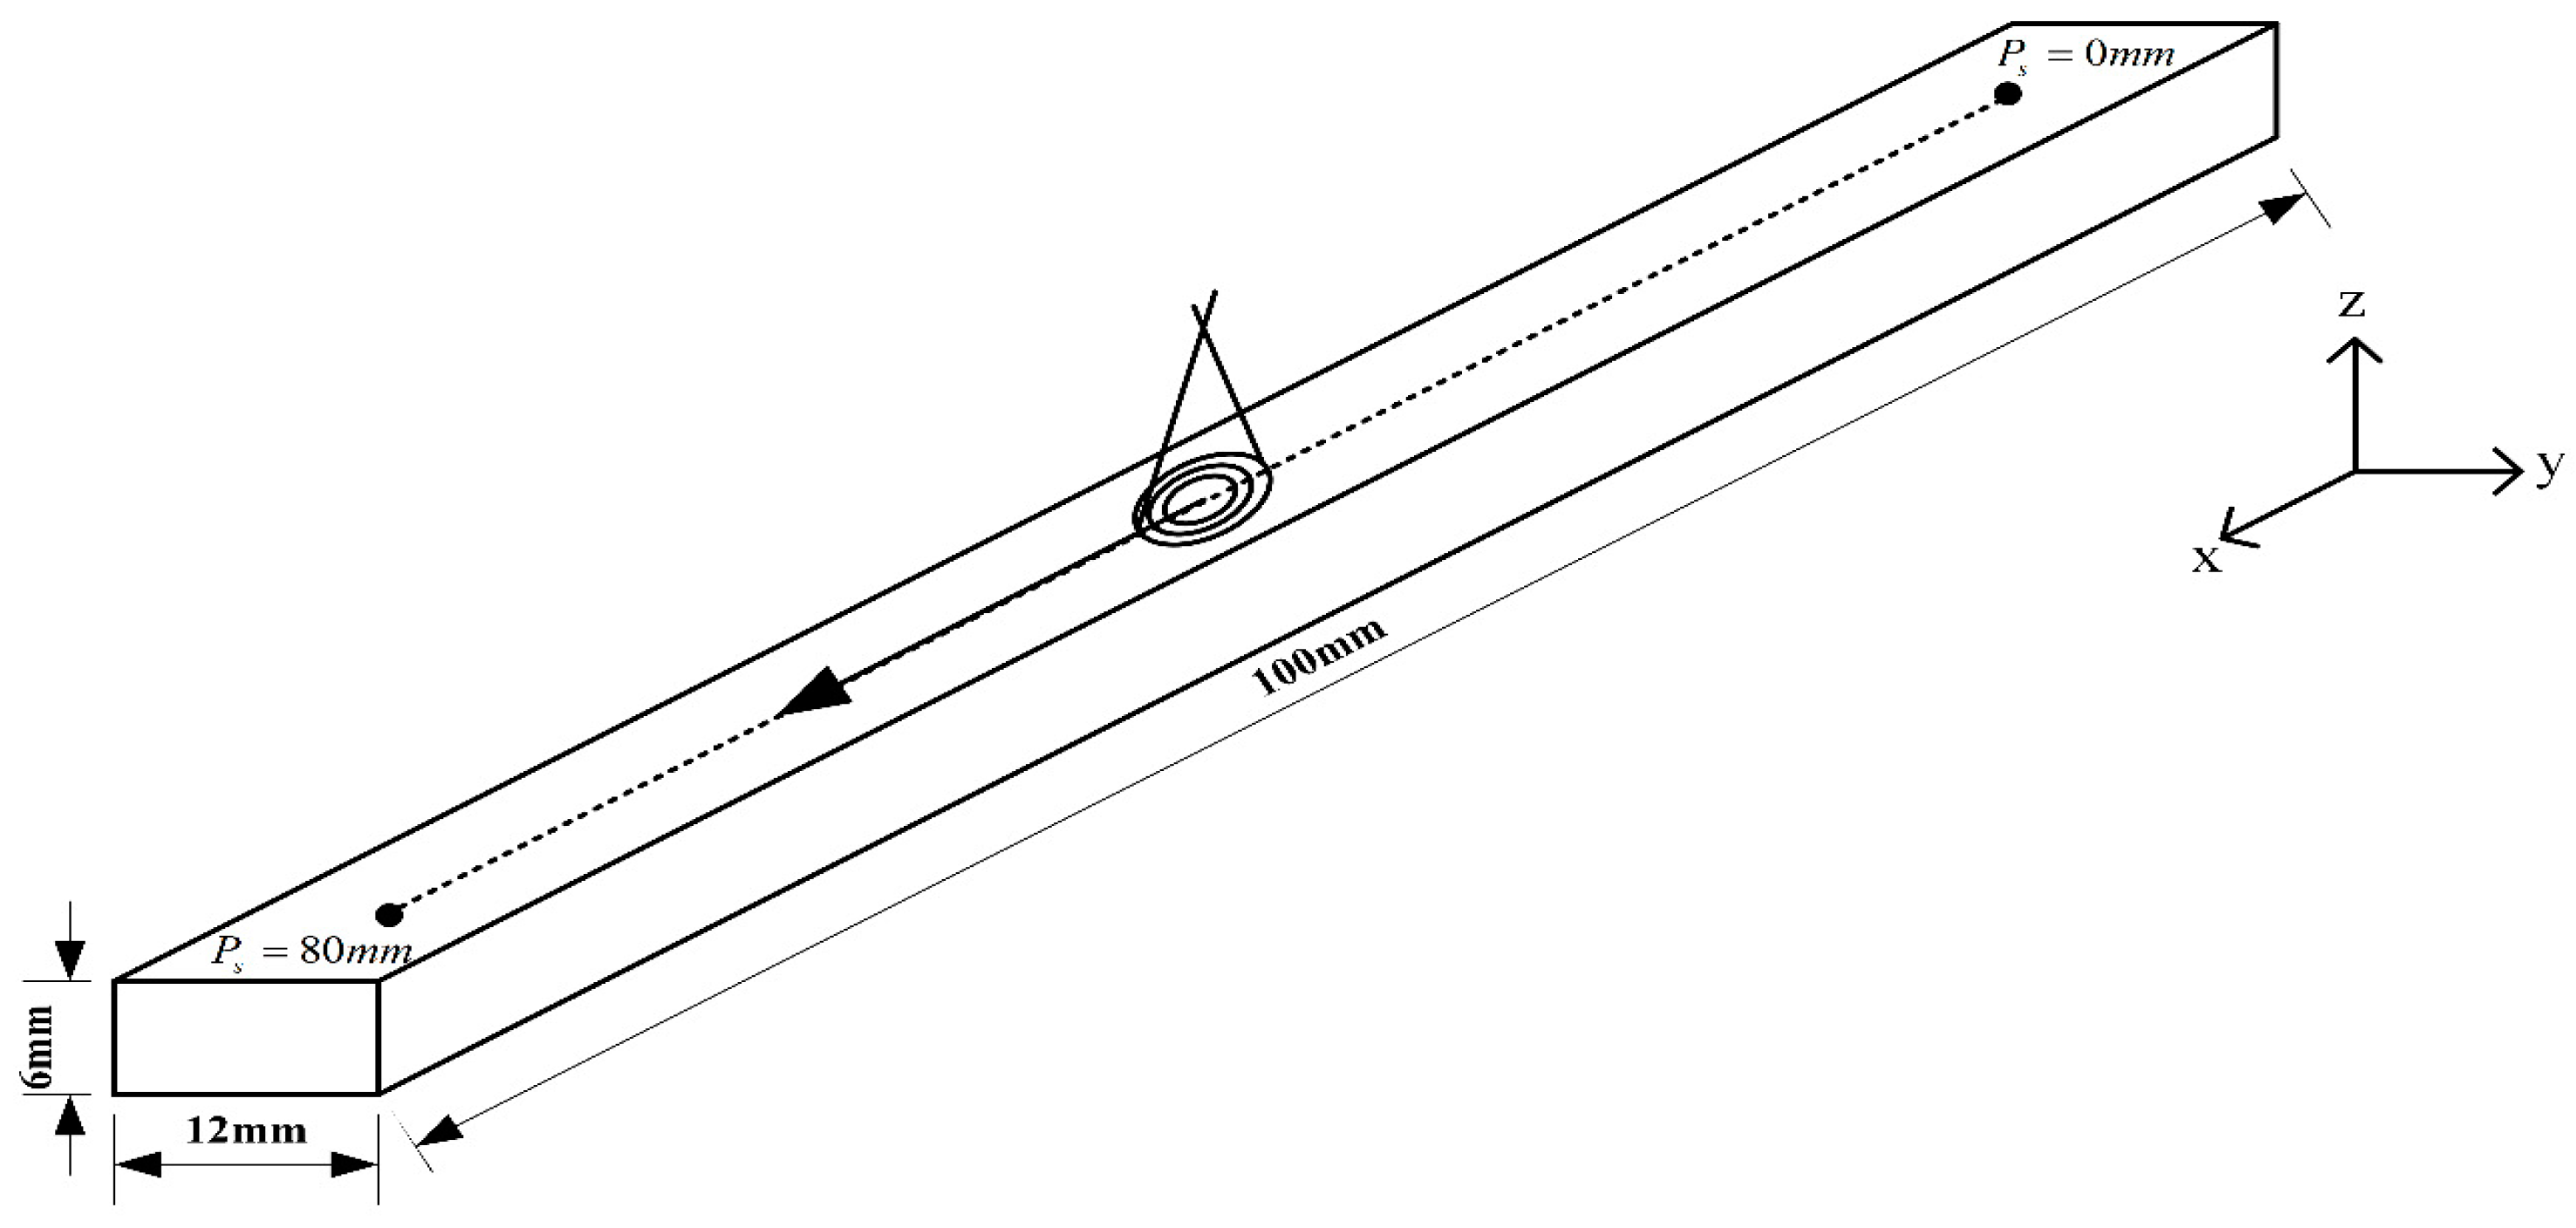
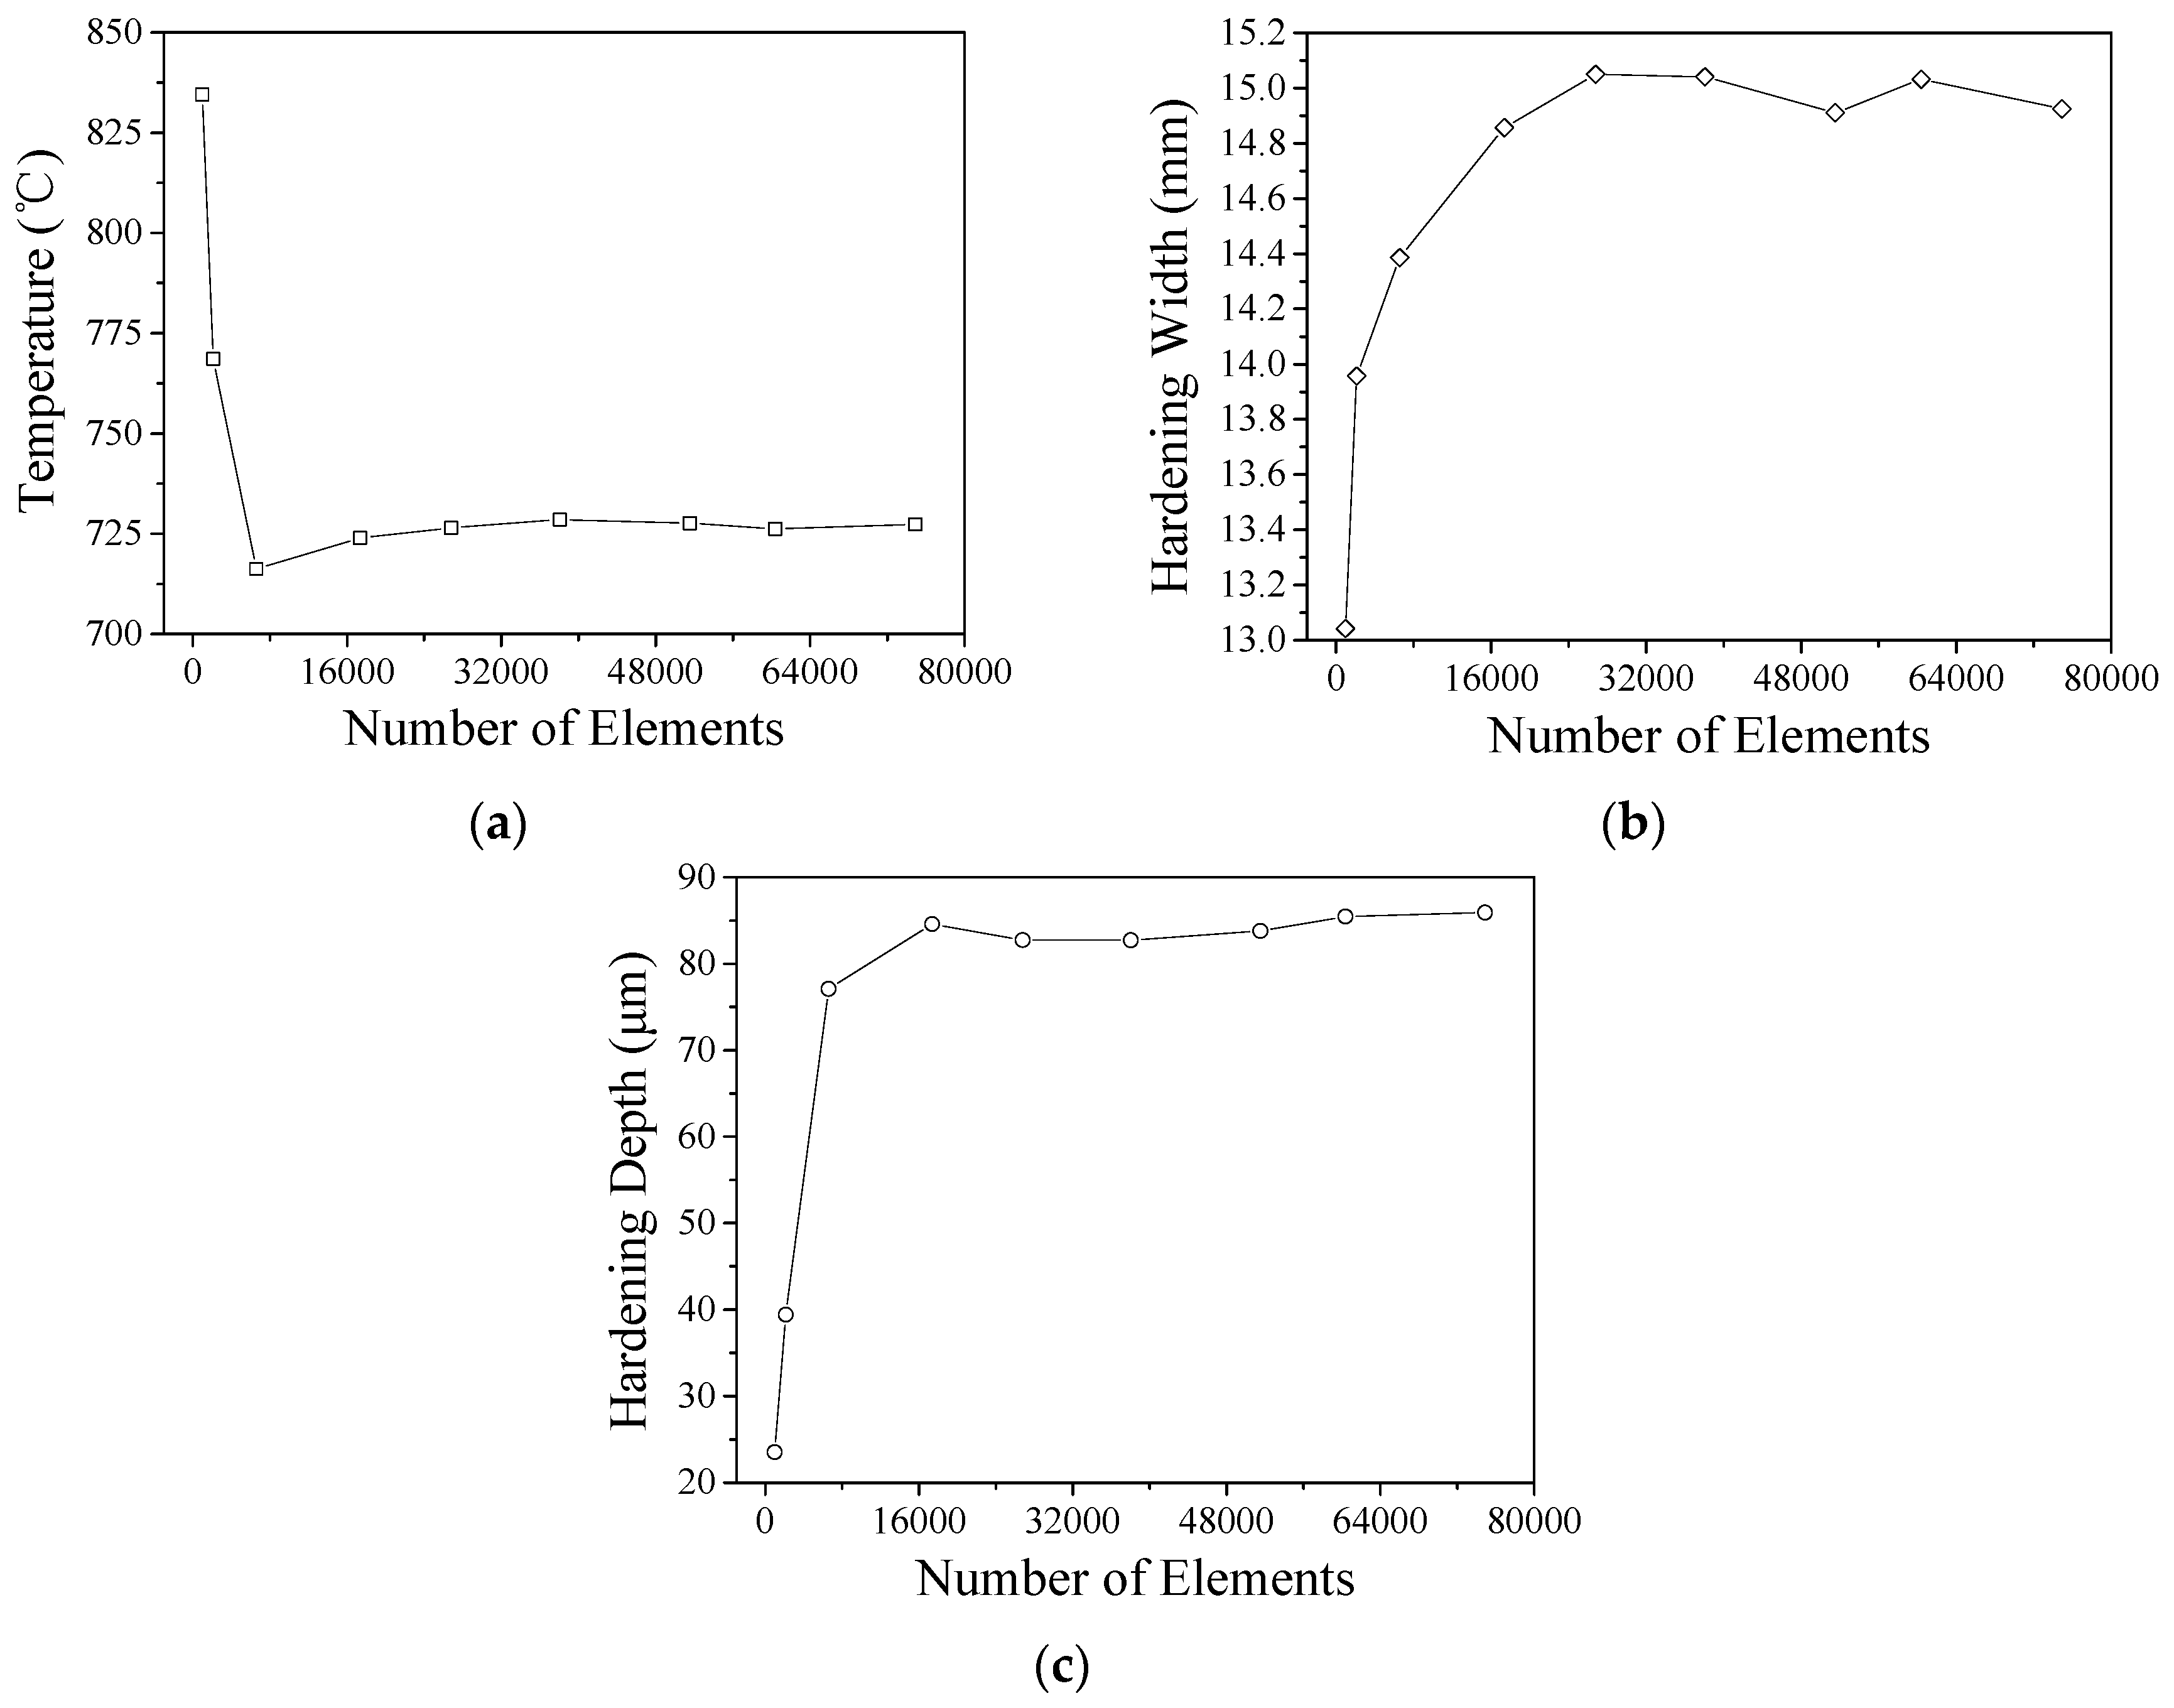
2.2. FE Model for Single-Track Laser Heat Treatment
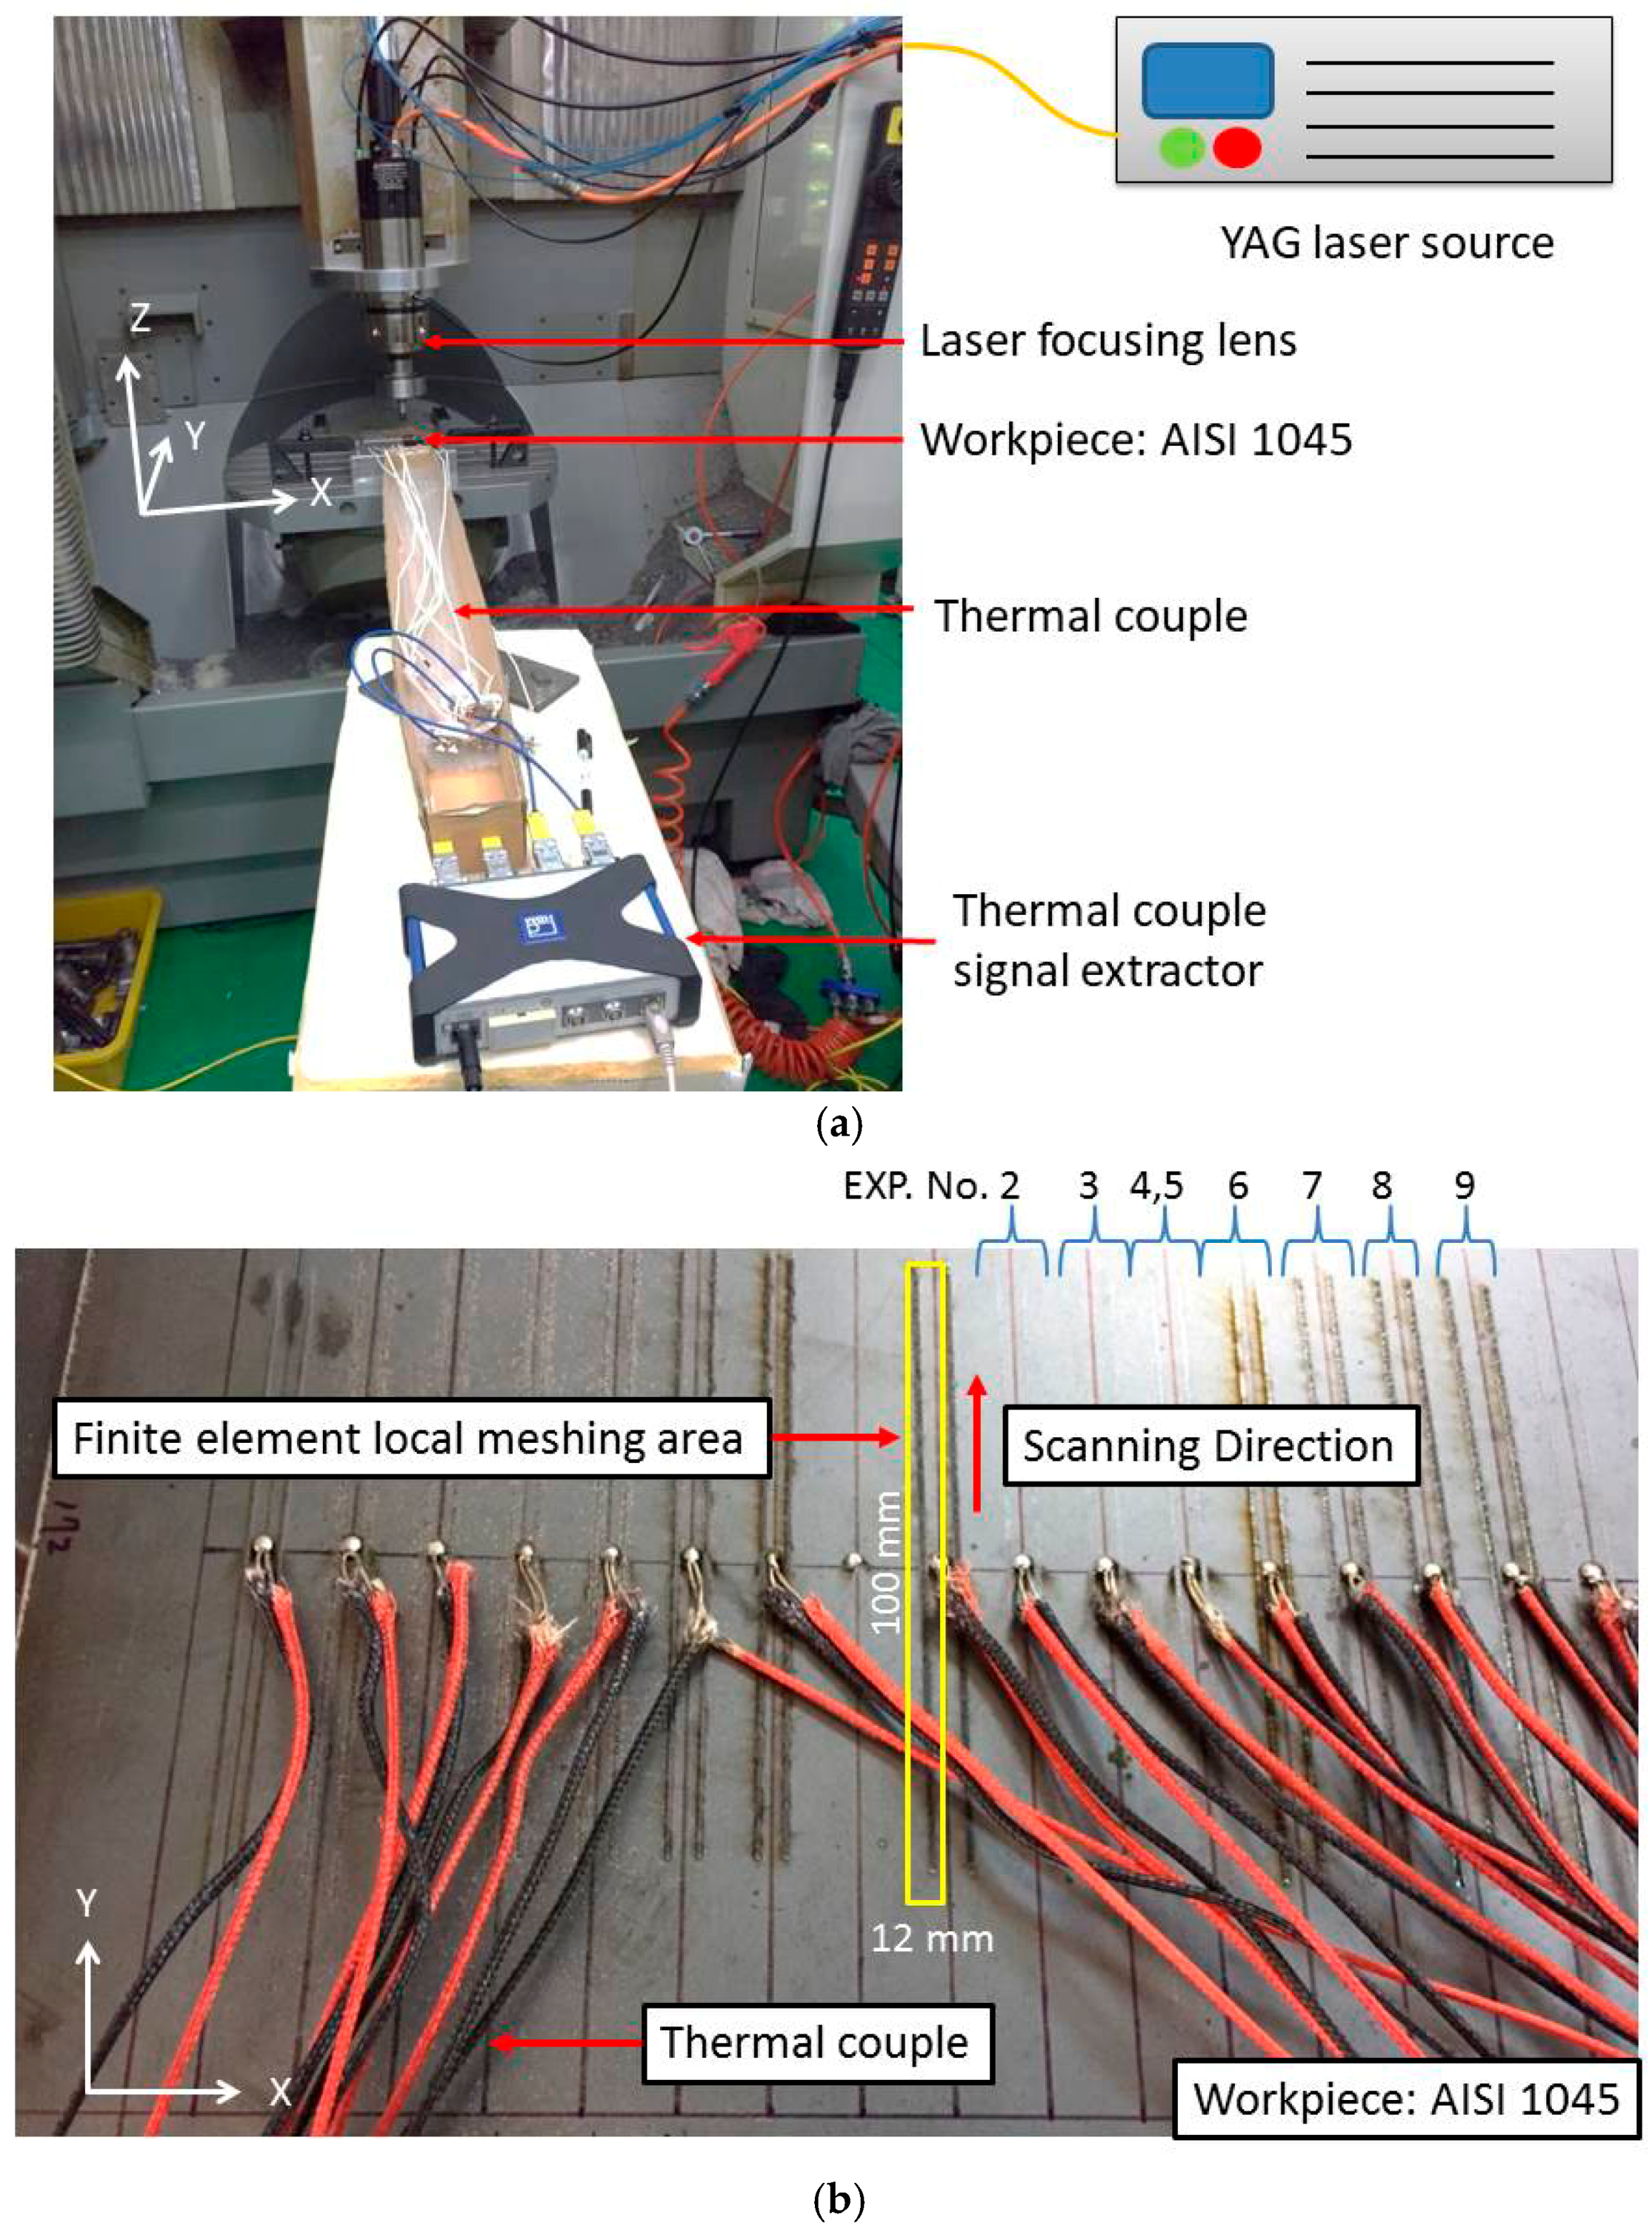
2.3. Experimental Setup
3. Results and Discussion
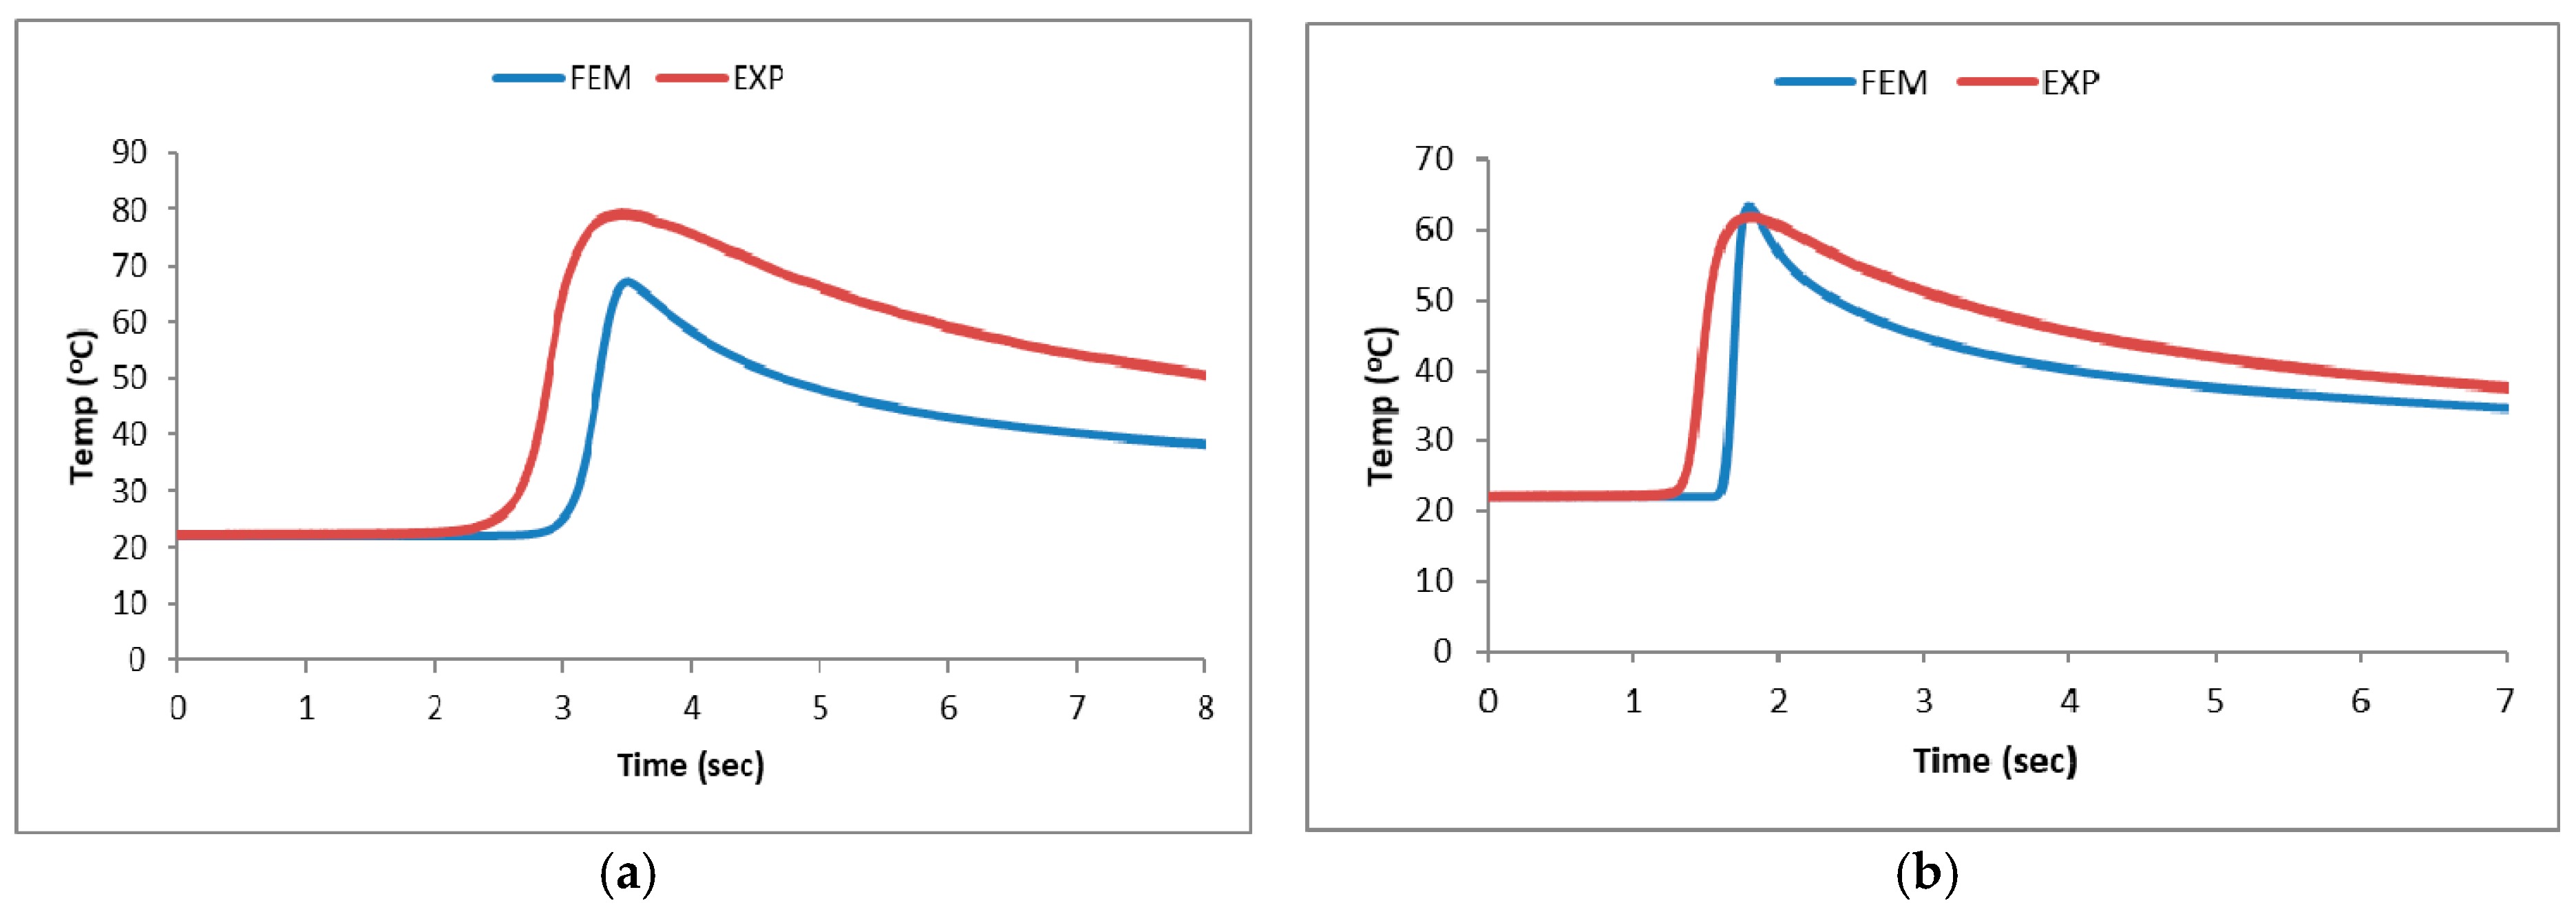
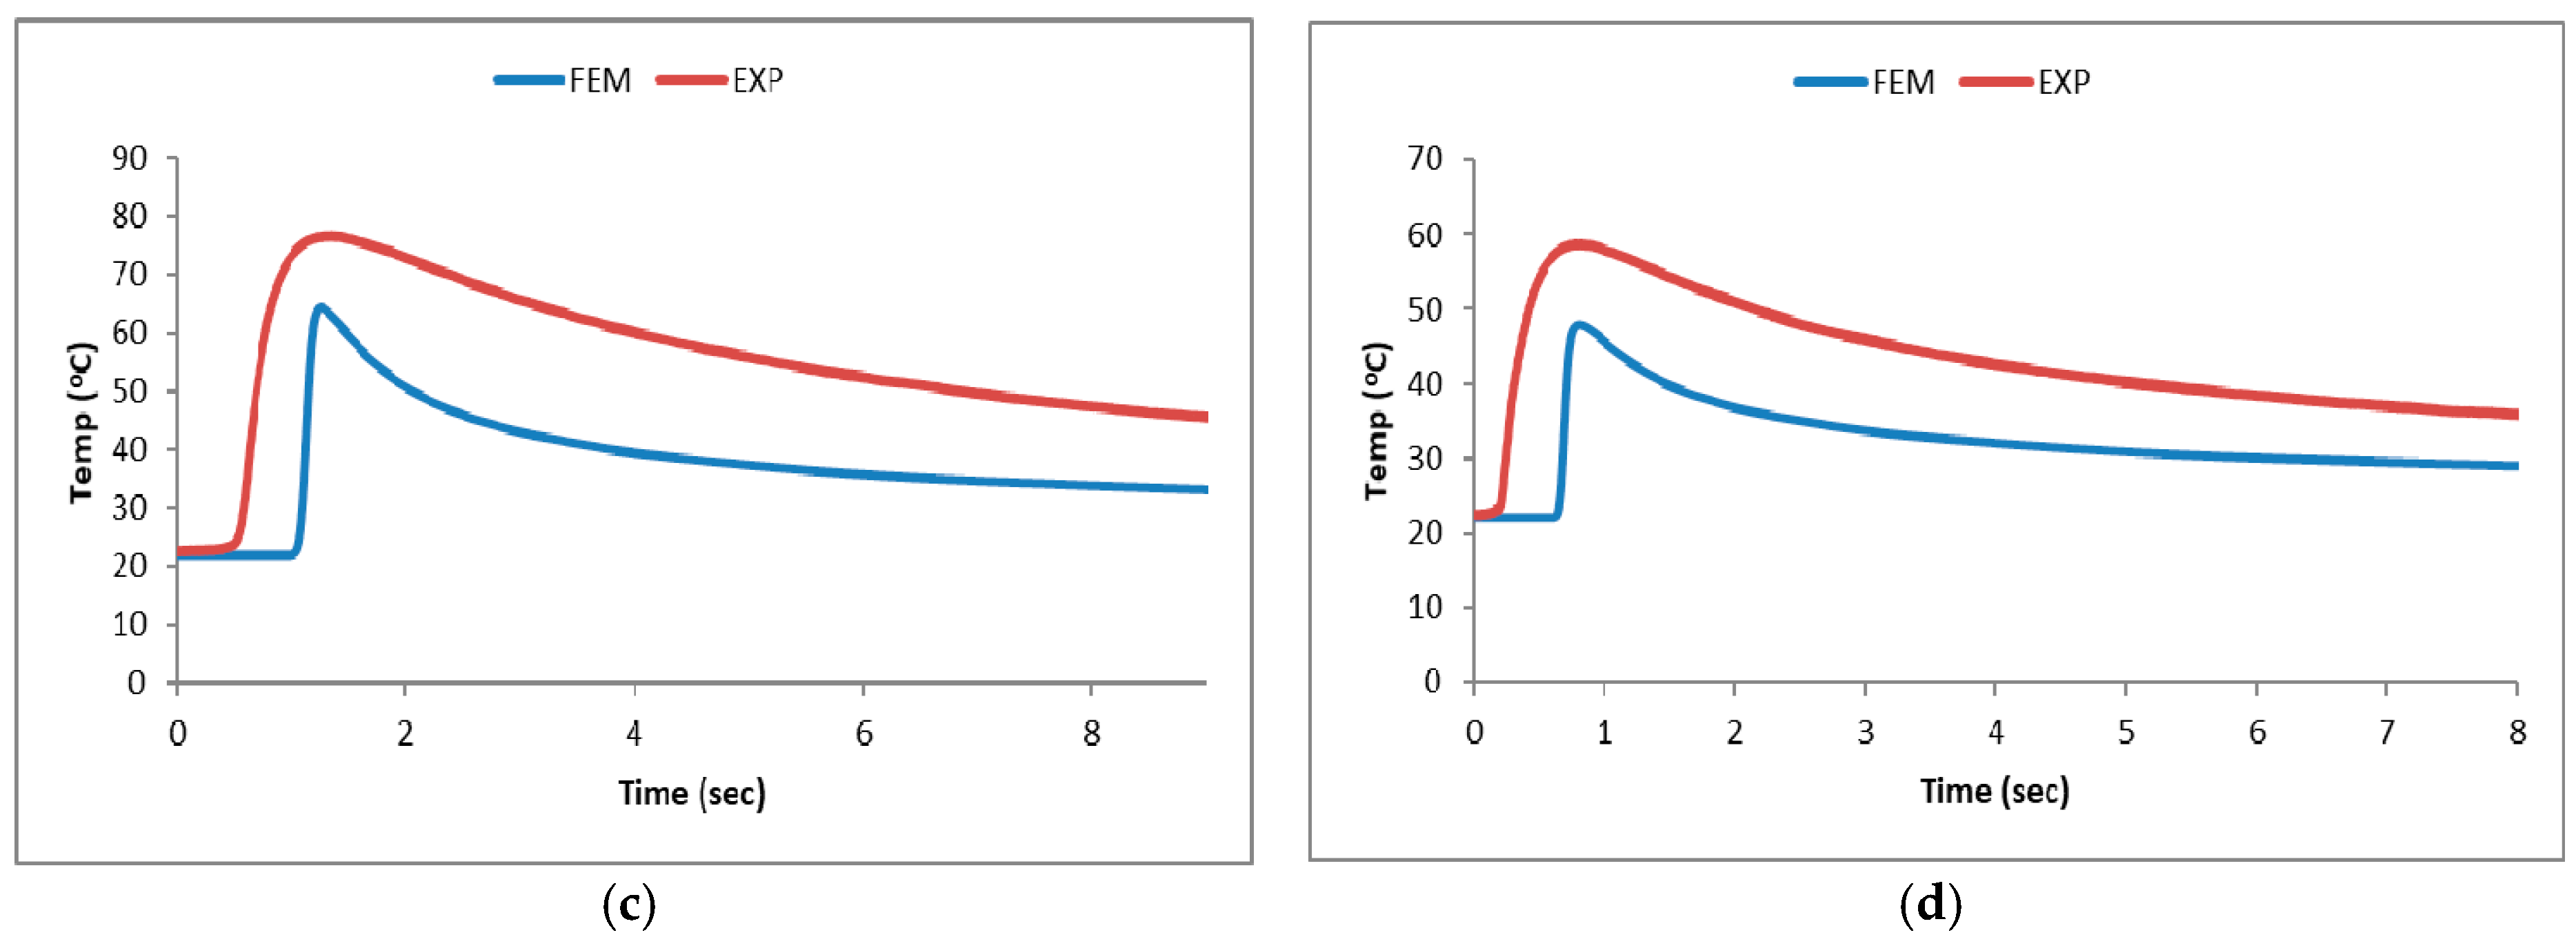
3.1. Results of Finite Element Analysis and Experimental Results
3.2. Discussion of Parameters
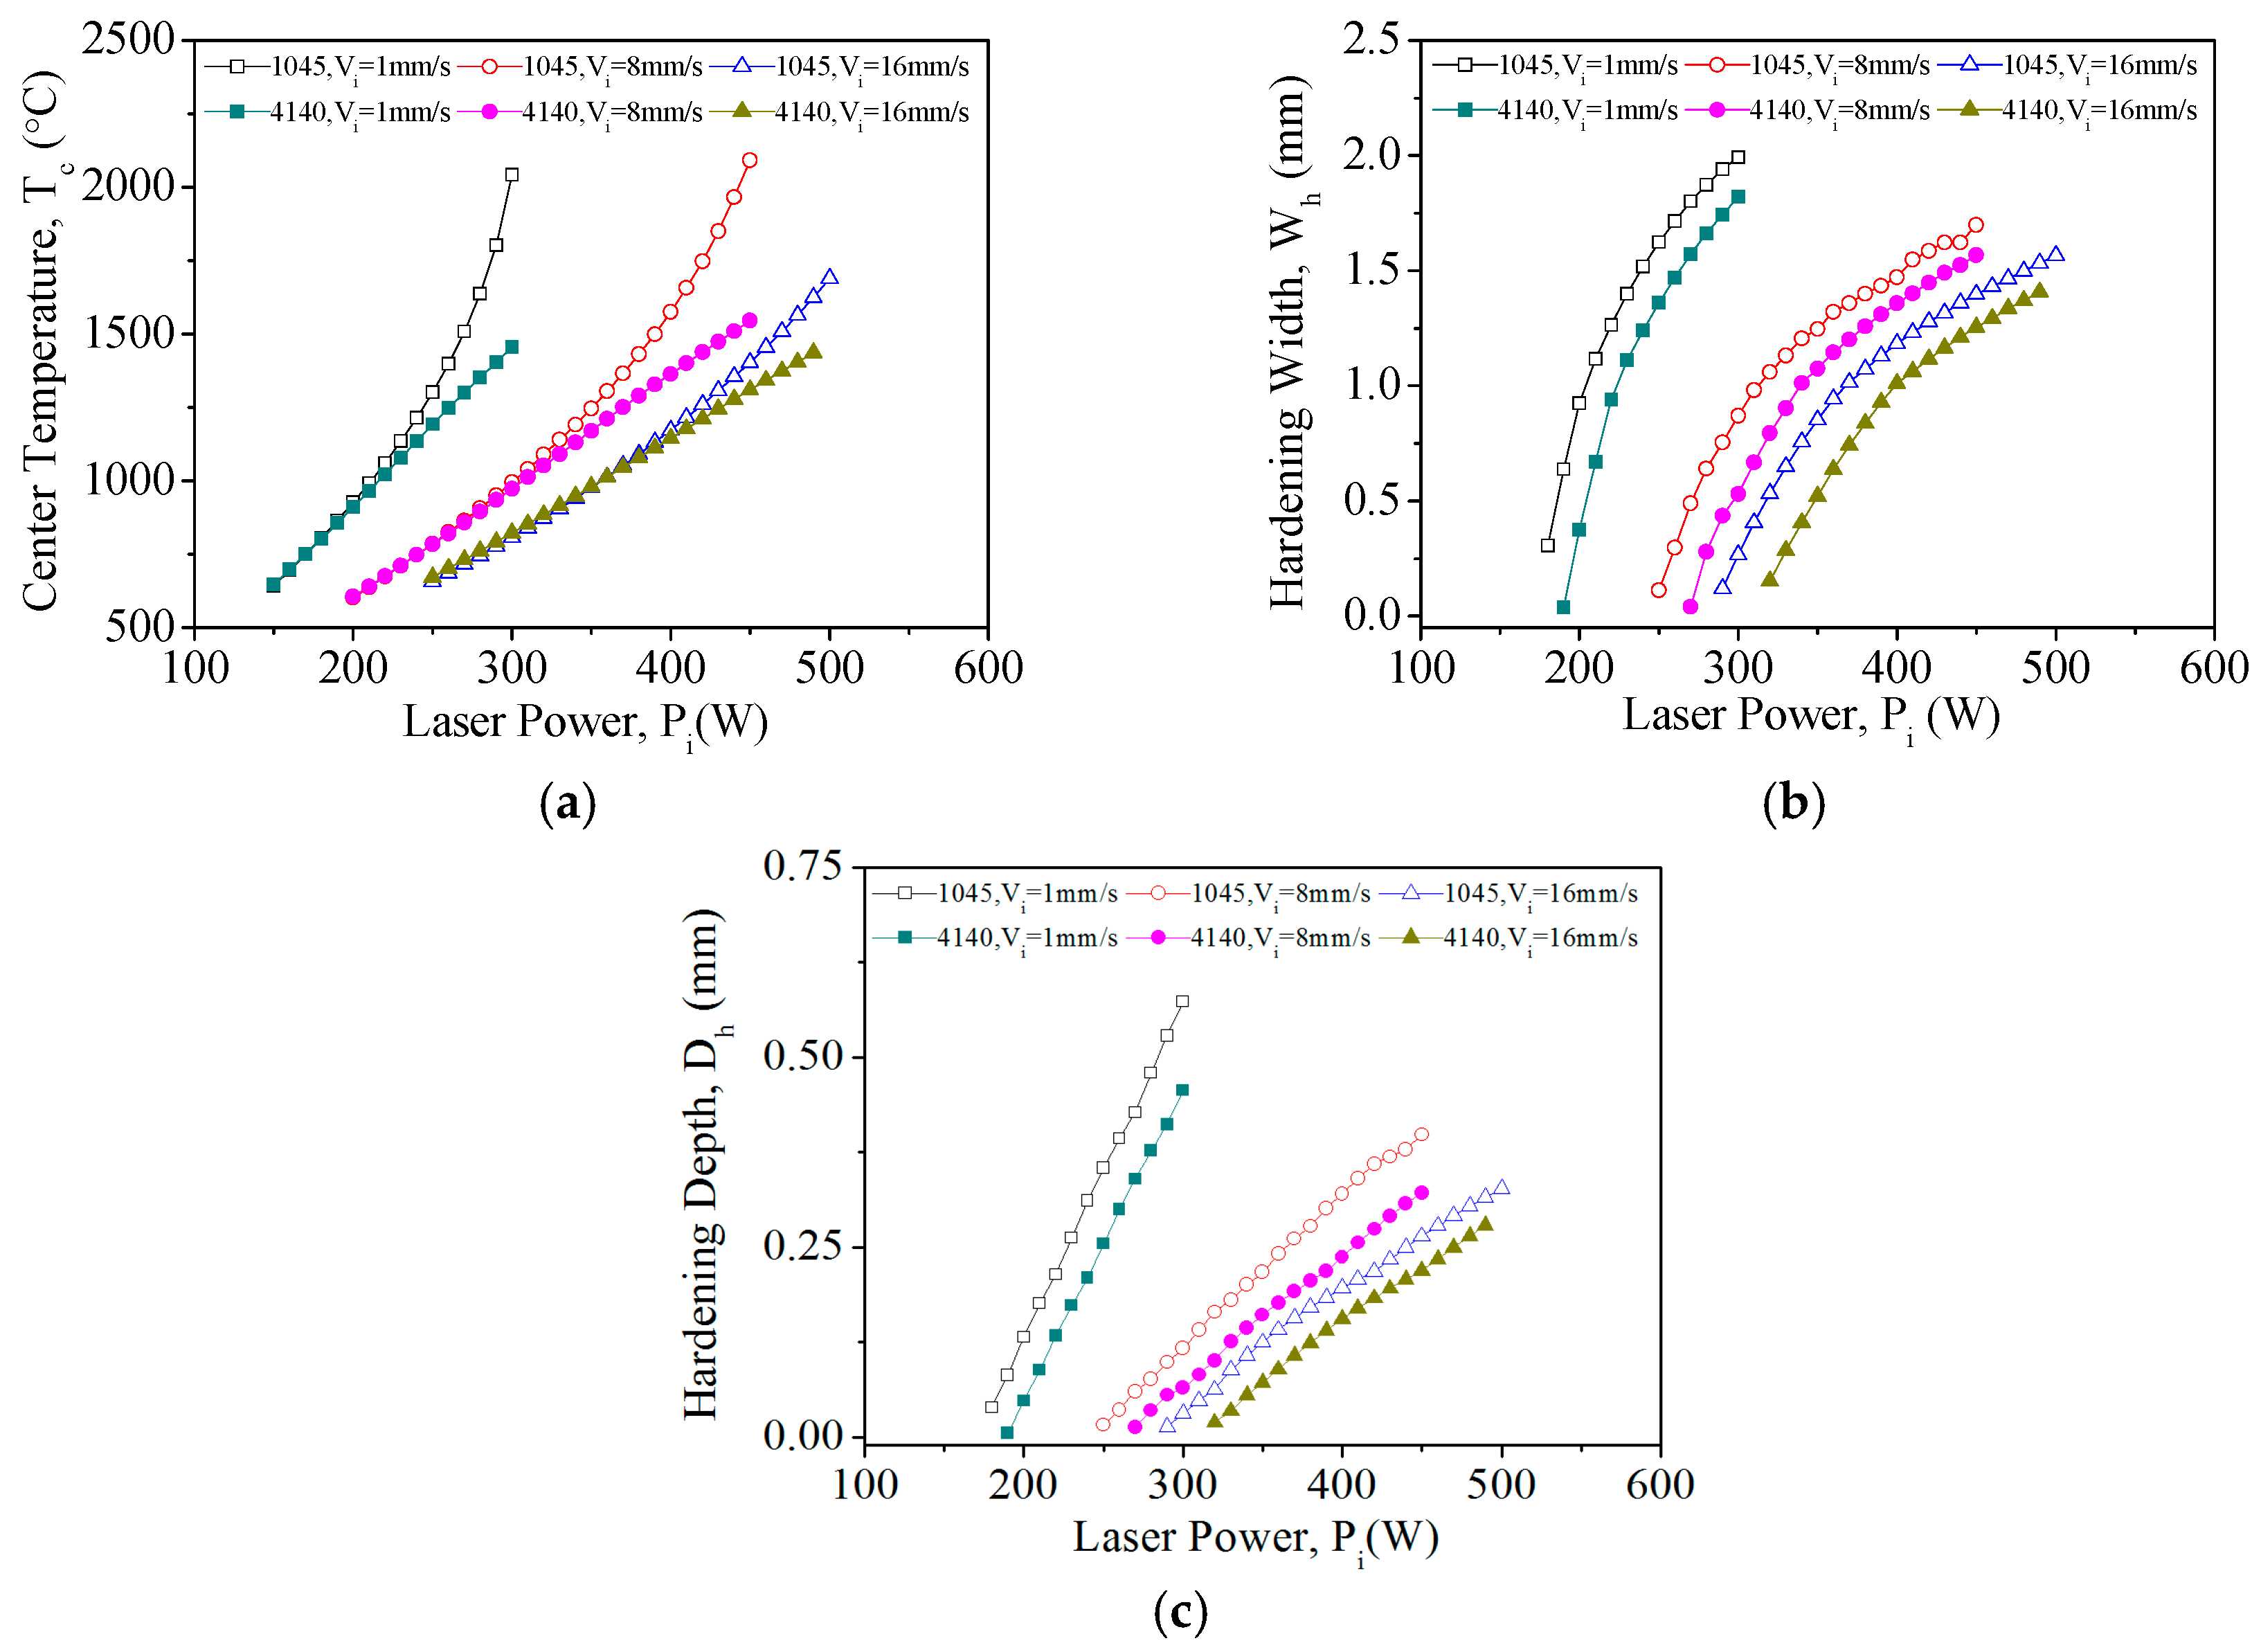
3.2.1. Laser Power
3.2.2. Laser Scanning Speed
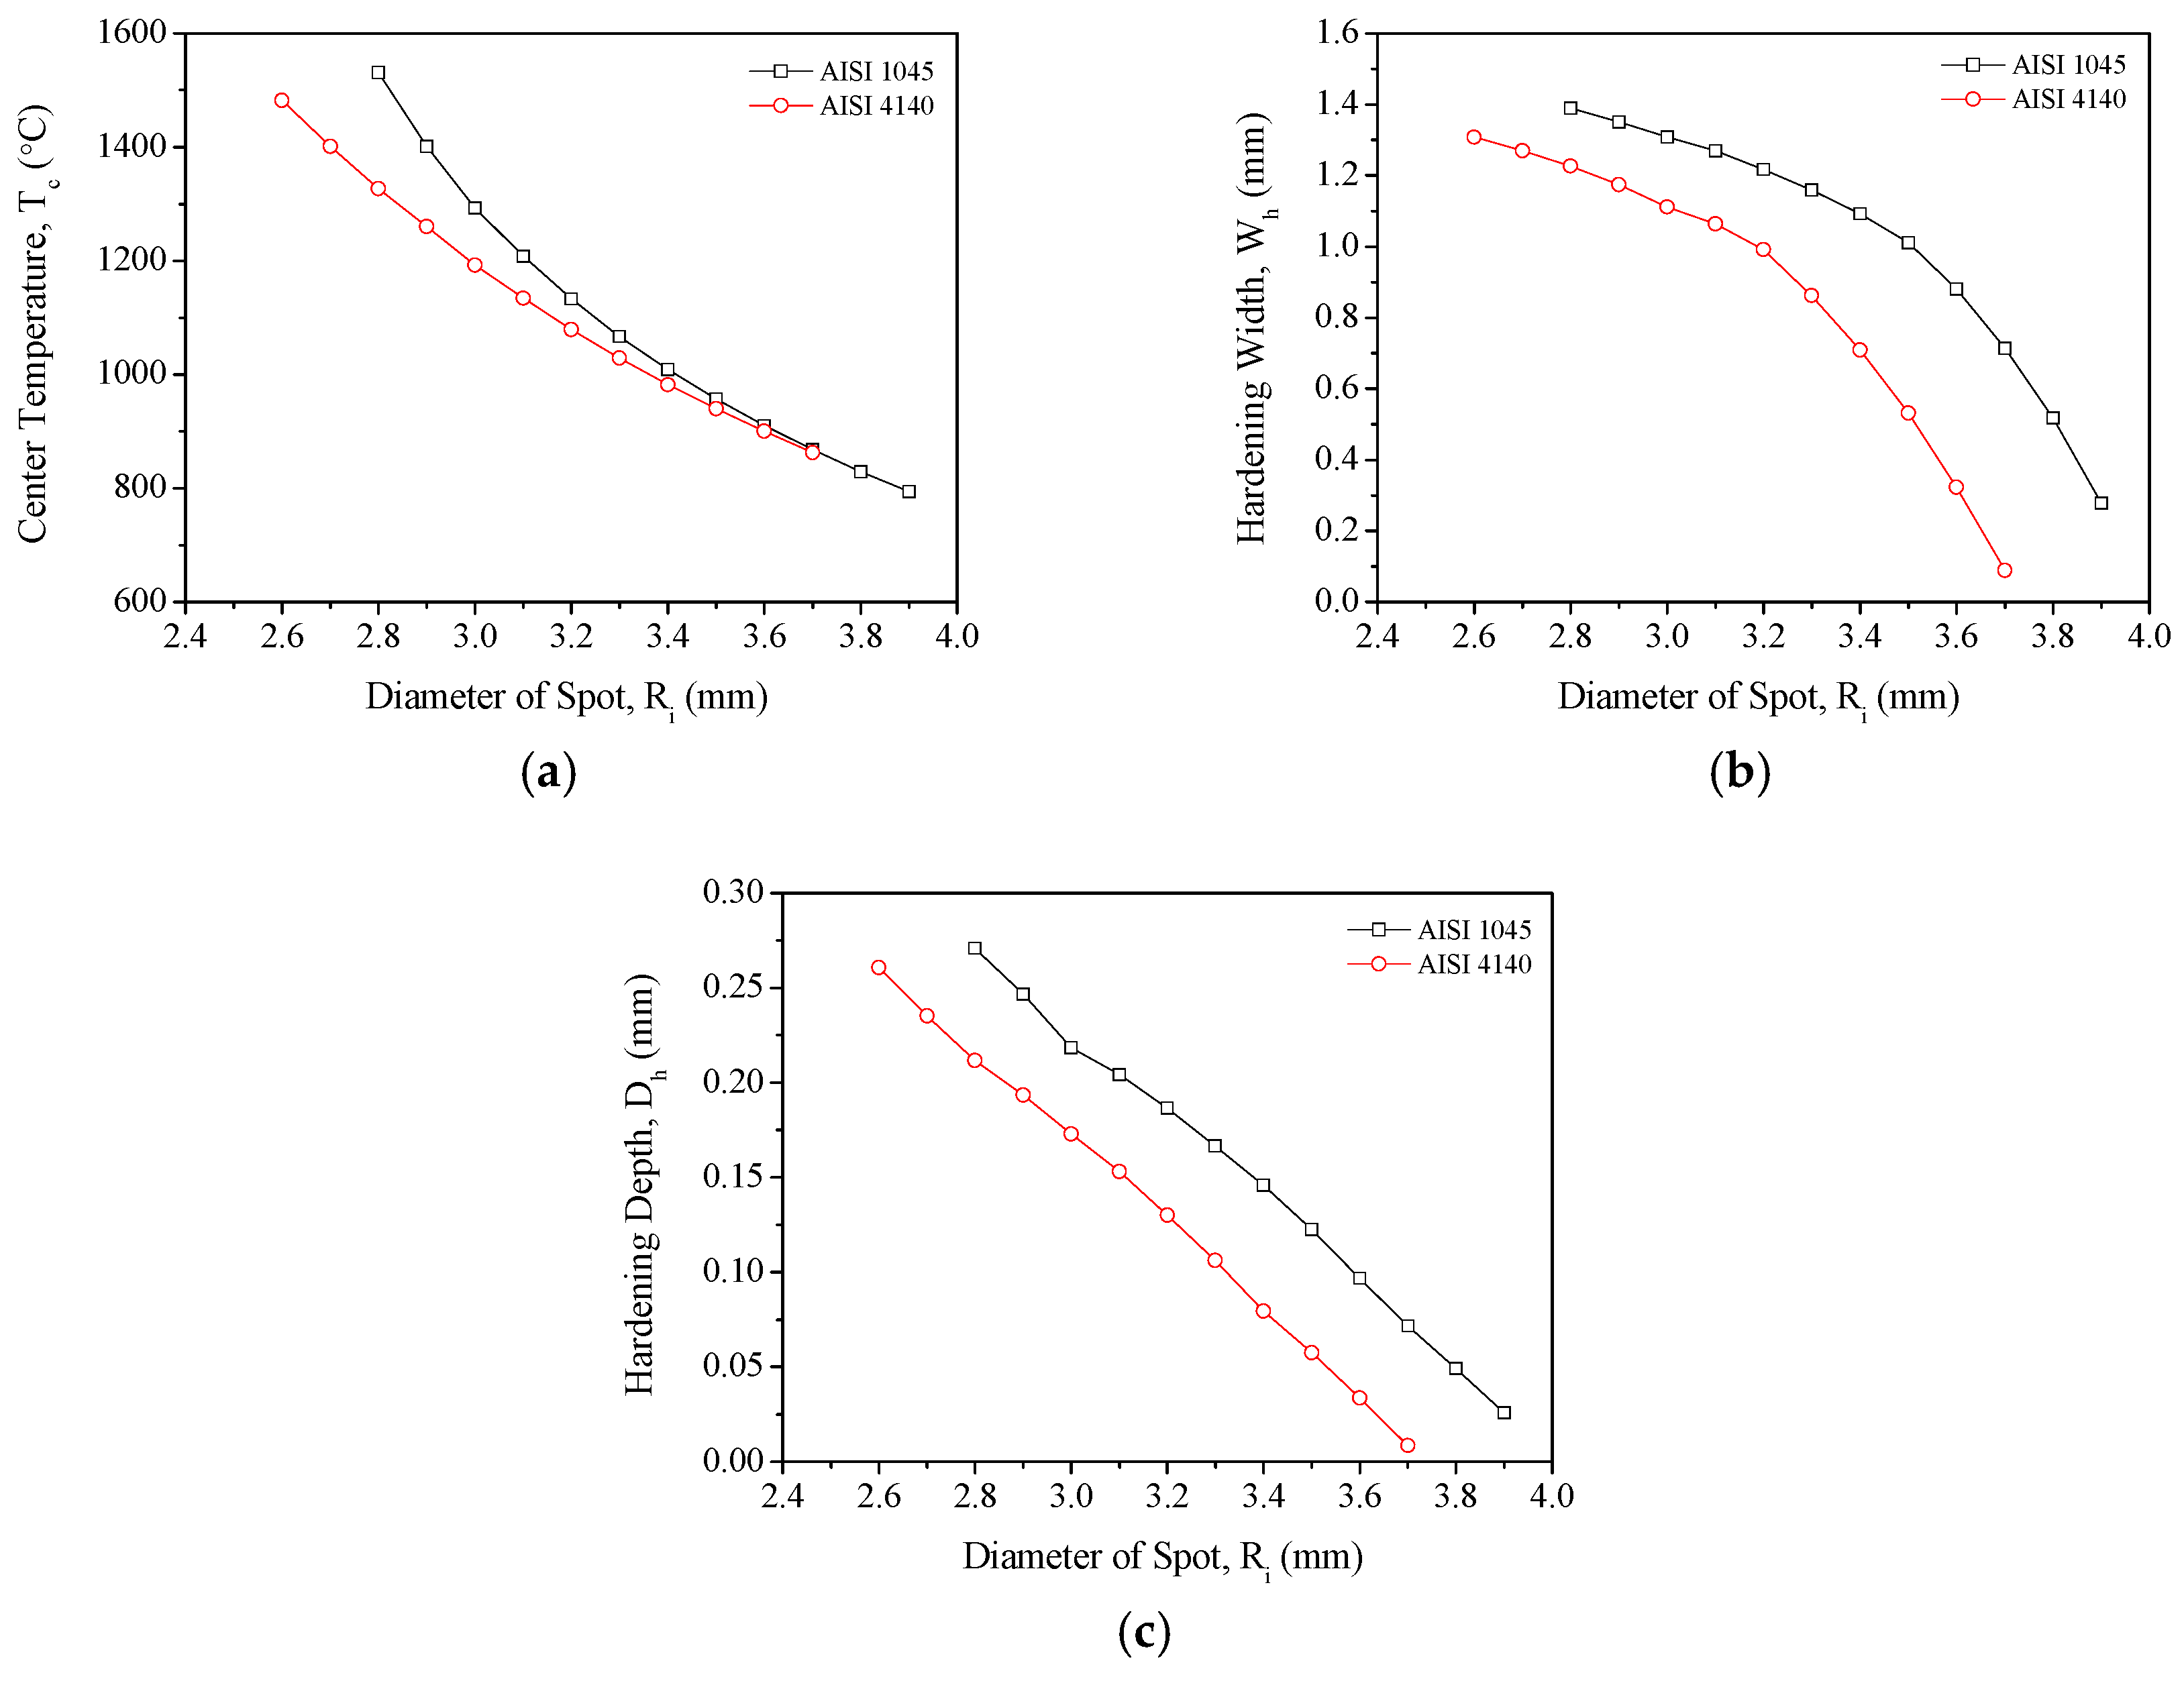
3.2.3. Laser Spot Size
4. Conclusions
Author Contributions
Acknowledgments
Conflicts of Interest
References
- Golovin, A.F. The Centennial of D. K. Chernov’s Discovery of Polymorphous Transformations in Steel (1868–1968). Met. Sci. Heat Treat. 1968, 10, 5. [Google Scholar] [CrossRef]
- Wissenbach, K.; Gillner, A.; Dausinger, F.; Beyer, E.; Wissenbach, K. Oberflächenbehandlung mit Laserstrahlung, Allgemaine Grundlagen; Springer: Berlin, Germany, 1998. [Google Scholar]
- Ganeev, R.A. Low-Power Laser Hardening of Steels. J. Mater. Process. Technol. 2002, 121, 414–419. [Google Scholar] [CrossRef]
- Skvarenina, S.; Shin, Y.C. Predictive Modeling and Experimental Results for Laser Hardening of AISI 1536 Steel with Complex Geometric Features by a High Power Diode Laser. Surf. Coat. Technol. 2006, 201, 2256–2269. [Google Scholar] [CrossRef]
- Lakhkar, R.S.; Shin, Y.C.; Krane, M.J.M. Predictive Modeling of Multi-Track Laser Hardening of AISI 4140 Steel. Mater. Sci. Eng. A 2008, 480, 209–217. [Google Scholar] [CrossRef]
- Bailey, N.S.; Tan, W.; Shin, Y.C. Predictive Modeling and Experimental Results for Residual Stresses in Laser Hardening of AISI 4140 Steel by a High Power Diode Laser. Surf. Coat. Technol. 2009, 203, 2003–2012. [Google Scholar] [CrossRef]
- Farahi, G.H.; Sistaninia, M. Thermal Analysis of Laser Hardening for Different Moving Patterns. IJE Trans. A Basics 2009, 22, 169–180. [Google Scholar]
- Lambiase, F.; Ilio, A.M.D.; Paoletti, A. Prediction of Laser Hardening by Means of Neural Network. Procedia CIRP 2013, 12, 181–186. [Google Scholar] [CrossRef]
- Babic, M.; Balic, J.; Milfelner, M.; Belic, I.; Kokol, P.; Zorman, M.; Panjan, P. Robot Laser Hardening and the Problem of Overlapping Laser Beam. Adv. Prod. Eng. Manag. 2013, 8, 25–32. [Google Scholar] [CrossRef]
- El-Batahgy, A.M.; Ramadan, R.A.; Moussa, A.R. Laser Surface Hardening of Tool Steels—Experimental and Numerical Analysis. J. Surf. Eng. Mater. Adv. Technol. 2013, 3, 146–153. [Google Scholar] [CrossRef]
- Heitkemper, M.; Fischer, A.; Bohne, C.; Pyzalla, A. Laser Surface Treatment of the High-Nitrogen Steel X30CrMoN15. In Proceedings of the 6th International Tooling Conference on the Use of Tool Steels: Experience and Research, Karlstadt, Sweden, 10–13 September 2002; Volume 2, pp. 785–795. [Google Scholar]
- Ki, H.; So, S.; Kim, S. Laser Transformation Hardening of Carbon Steel Sheets Using a Heat Sink. J. Mater. Process. Technol. 2014, 214, 2693–2705. [Google Scholar] [CrossRef]
- Orazi, L.; Liverani, E.; Ascari, A.; Fortunato, A.; Tomesani, L. Laser Surface Hardening of Large Cylindrical Components Utilizing Ring Spot Geometry. CIRP Ann.-Manuf. Technol. 2014, 63, 233–236. [Google Scholar] [CrossRef]
- Kostov, V.; Gibmeier, J.; Wanner, A. Laser Surface Hardening of Steel: Effect of Process Atmosphere on the Microstructure and Residual Stresses. Mater. Sci. Forum 2014, 772, 149–153. [Google Scholar] [CrossRef]
- Li, R.; Jin, Y.; Li, Z.; Qi, K. A Comparative Study of High-Power Diode Laser and CO2 Laser Surface Hardening of AISI 1045 Steel. J. Mater. Eng. Perform. 2014, 23, 3085–3091. [Google Scholar] [CrossRef]
- Liverani, E.; Lutey, A.H.A.; Ascari, A.; Fortunato, A.; Tomesani, L. A Complete Residual Stress Model for Laser Surface Hardening of Complex Medium Carbon Steel Components. Surf. Coat. Technol. 2016, 302, 100–106. [Google Scholar] [CrossRef]
- Sarkar, S.; Gopinath, M.; Chakraborty, S.S.; Syed, B.; Nath, A.K. Analysis of Temperature and Surface Hardening of Low Carbon Thin Steel Sheets Using Yb-Fiber Laser. Surf. Coat. Technol. 2016, 302, 344–358. [Google Scholar] [CrossRef]
- Bouquet, J.; Camp, D.V.; Peeters, B.; Massa, J.; Lauwers, B. Machining and Selective Laser Hardening of Complex Shaped Components on a Multi-Axis Machining Center. In Proceedings of the MTTRF 2016 Annual Meeting, San Francisco, CA, USA, 5–7 July 2016; pp. 90–100. [Google Scholar]
- Bouquet, J.; Camp, D.V.; Malek, O.; Haaf, P.T.; Vanmeensel, K.; Lauwers, B. Aiming for Improved Lifetime of Die and Mold Components Through an Integrated Laser Hardening Operation, Combining Machining and a Selective Heat Treatment in One Setup. Procedia CIRP 2016, 46, 541–544. [Google Scholar] [CrossRef]
- Farshidianfar, M.H.; Khajepouhor, A.; Gerlich, A. Real-Time Monitoring and Prediction of Martensite Formation and Hardening Depth during Laser Heat Treatment. Surf. Coat. Technol. 2017, 315, 326–334. [Google Scholar] [CrossRef]
- Guarino, S.; Barletta, M.; Afilal, A. High Power Diode Laser (HPDL) Surface Hardening of Low Carbon Steel: Fatigue Life Improvement Analysis. J. Manuf. Process. 2017, 28, 266–271. [Google Scholar] [CrossRef]
- Ding, H.T.; Yung, C.S. A Metallo-Thermomechanically Coupled Analysis of Orthogonal Cutting of AISI 1045 Steel. J. Manuf. Sci. Eng. 2012, 134, 051014. [Google Scholar] [CrossRef]
- Gustavo, S.S.; Joaquin, F.B.; Lauralice, C.F.C.; Rosamel, M.M.R.; Rafael, A.M.; George, E.T.; Antonio, C.C. Modeling Quenching Performance by the Kuyucak Method. Mater. Sci. Eng. A 2007, 459, 383–389. [Google Scholar]
- Edwan, A.A.; Marcelo, A.M.; Nelson, B.D.L.; Andre, P.T. Numerical Simulation with Thorough Experimental Validation to Predict the Build-up of Residual Stresses During Quenching of Carbon and Low-Alloy Steels. ISIJ Int. 2014, 54, 1396–1405. [Google Scholar]
- Lostado Lorza, R.; Escribano García, R.; Fernandez Martinez, R.; Martínez Calvo, M.Á. Using Genetic Algorithms with Multi-Objective Optimization to Adjust Finite Element Models of Welded Joints. Metals 2018, 8, 230. [Google Scholar] [CrossRef]
- Lostado Lorza, R.; Corral Bobadilla, M.; Martínez Calvo, M.Á.; Villanueva Roldán, P.M. Residual stresses with time-independent cyclic plasticity in finite element analysis of welded joints. Metals 2017, 7, 136. [Google Scholar] [CrossRef]
- Dawes, C. Laser Welding; Ablington Publishing and Woodhead Publishing in Association with the Welding Institute: Cambridge, UK, 1992; pp. 1–95. [Google Scholar]
- Zacharia, T.; David, S.A.; Vitek, J.M.; Debroy, T. Weld Pool Development During GTA and Laser Beam Welding of Type 304 Stainless Steel Part I. Theoretical Analysis. Weld. J. 1989, 68, 499–509. [Google Scholar]
- Zacharia, T.; David, S.A.; Vitek, J.M.; Debroy, T. Weld Pool Development During GTA and Laser Beam Welding of Type 304 Stainless Steel Part II. Experimental Correlation. Weld. J. 1989, 68, 510–519. [Google Scholar]
- Zacharia, T.; David, S.A.; Vitek, J.M.; Debroy, T. Heat Transfer During Nd:YAG Pulsed Laser Welding and Its Effect on Solidification Structure of Austenitic Stainless Steels. Metall. Trans. A 1989, 20, 957–967. [Google Scholar] [CrossRef]
- DeKock, J. Laser Heat Treating Advances for the Gear Industry. GearSolution 2004, 49–54. [Google Scholar]
- MSC. Software Corporation. Marc Product Documentation Volume A: Theory and User Information, MSC; Software Corporation: Glen Rock, NJ, USA, 2010. [Google Scholar]


| Property | AISI 1045 | AISI 4140 |
|---|---|---|
| Density (Kg/m3) | 7870 | 7850 |
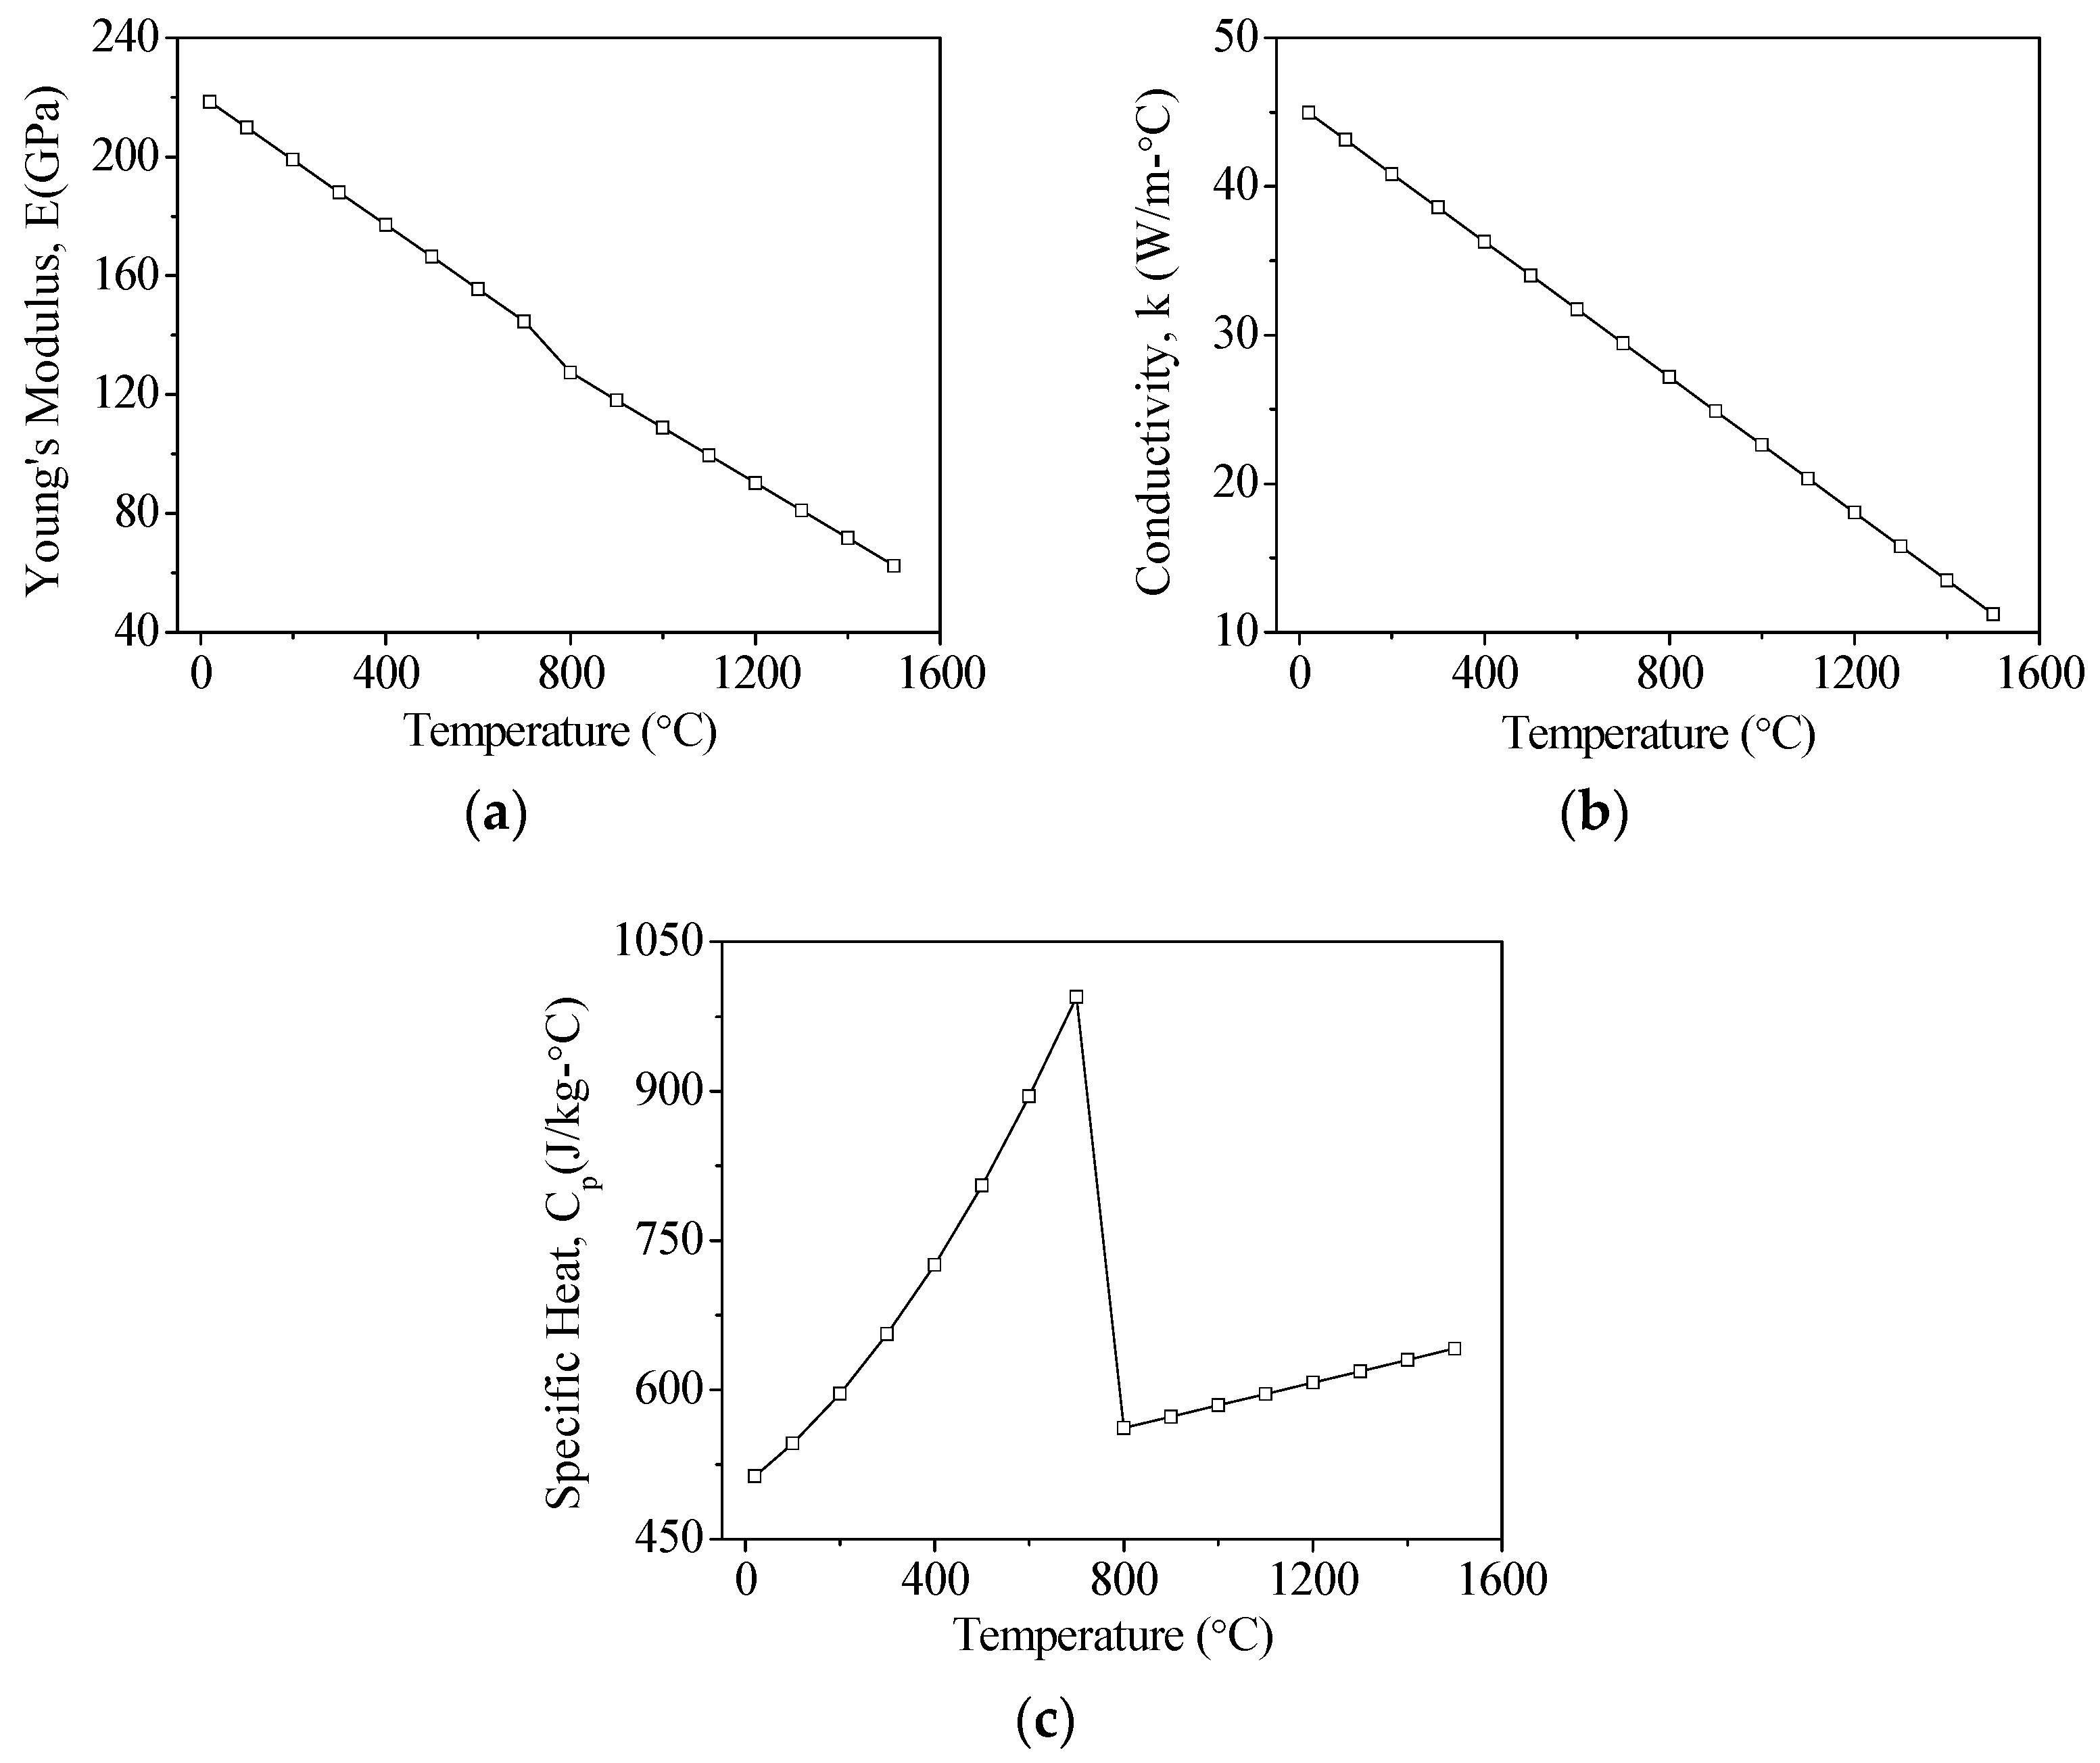
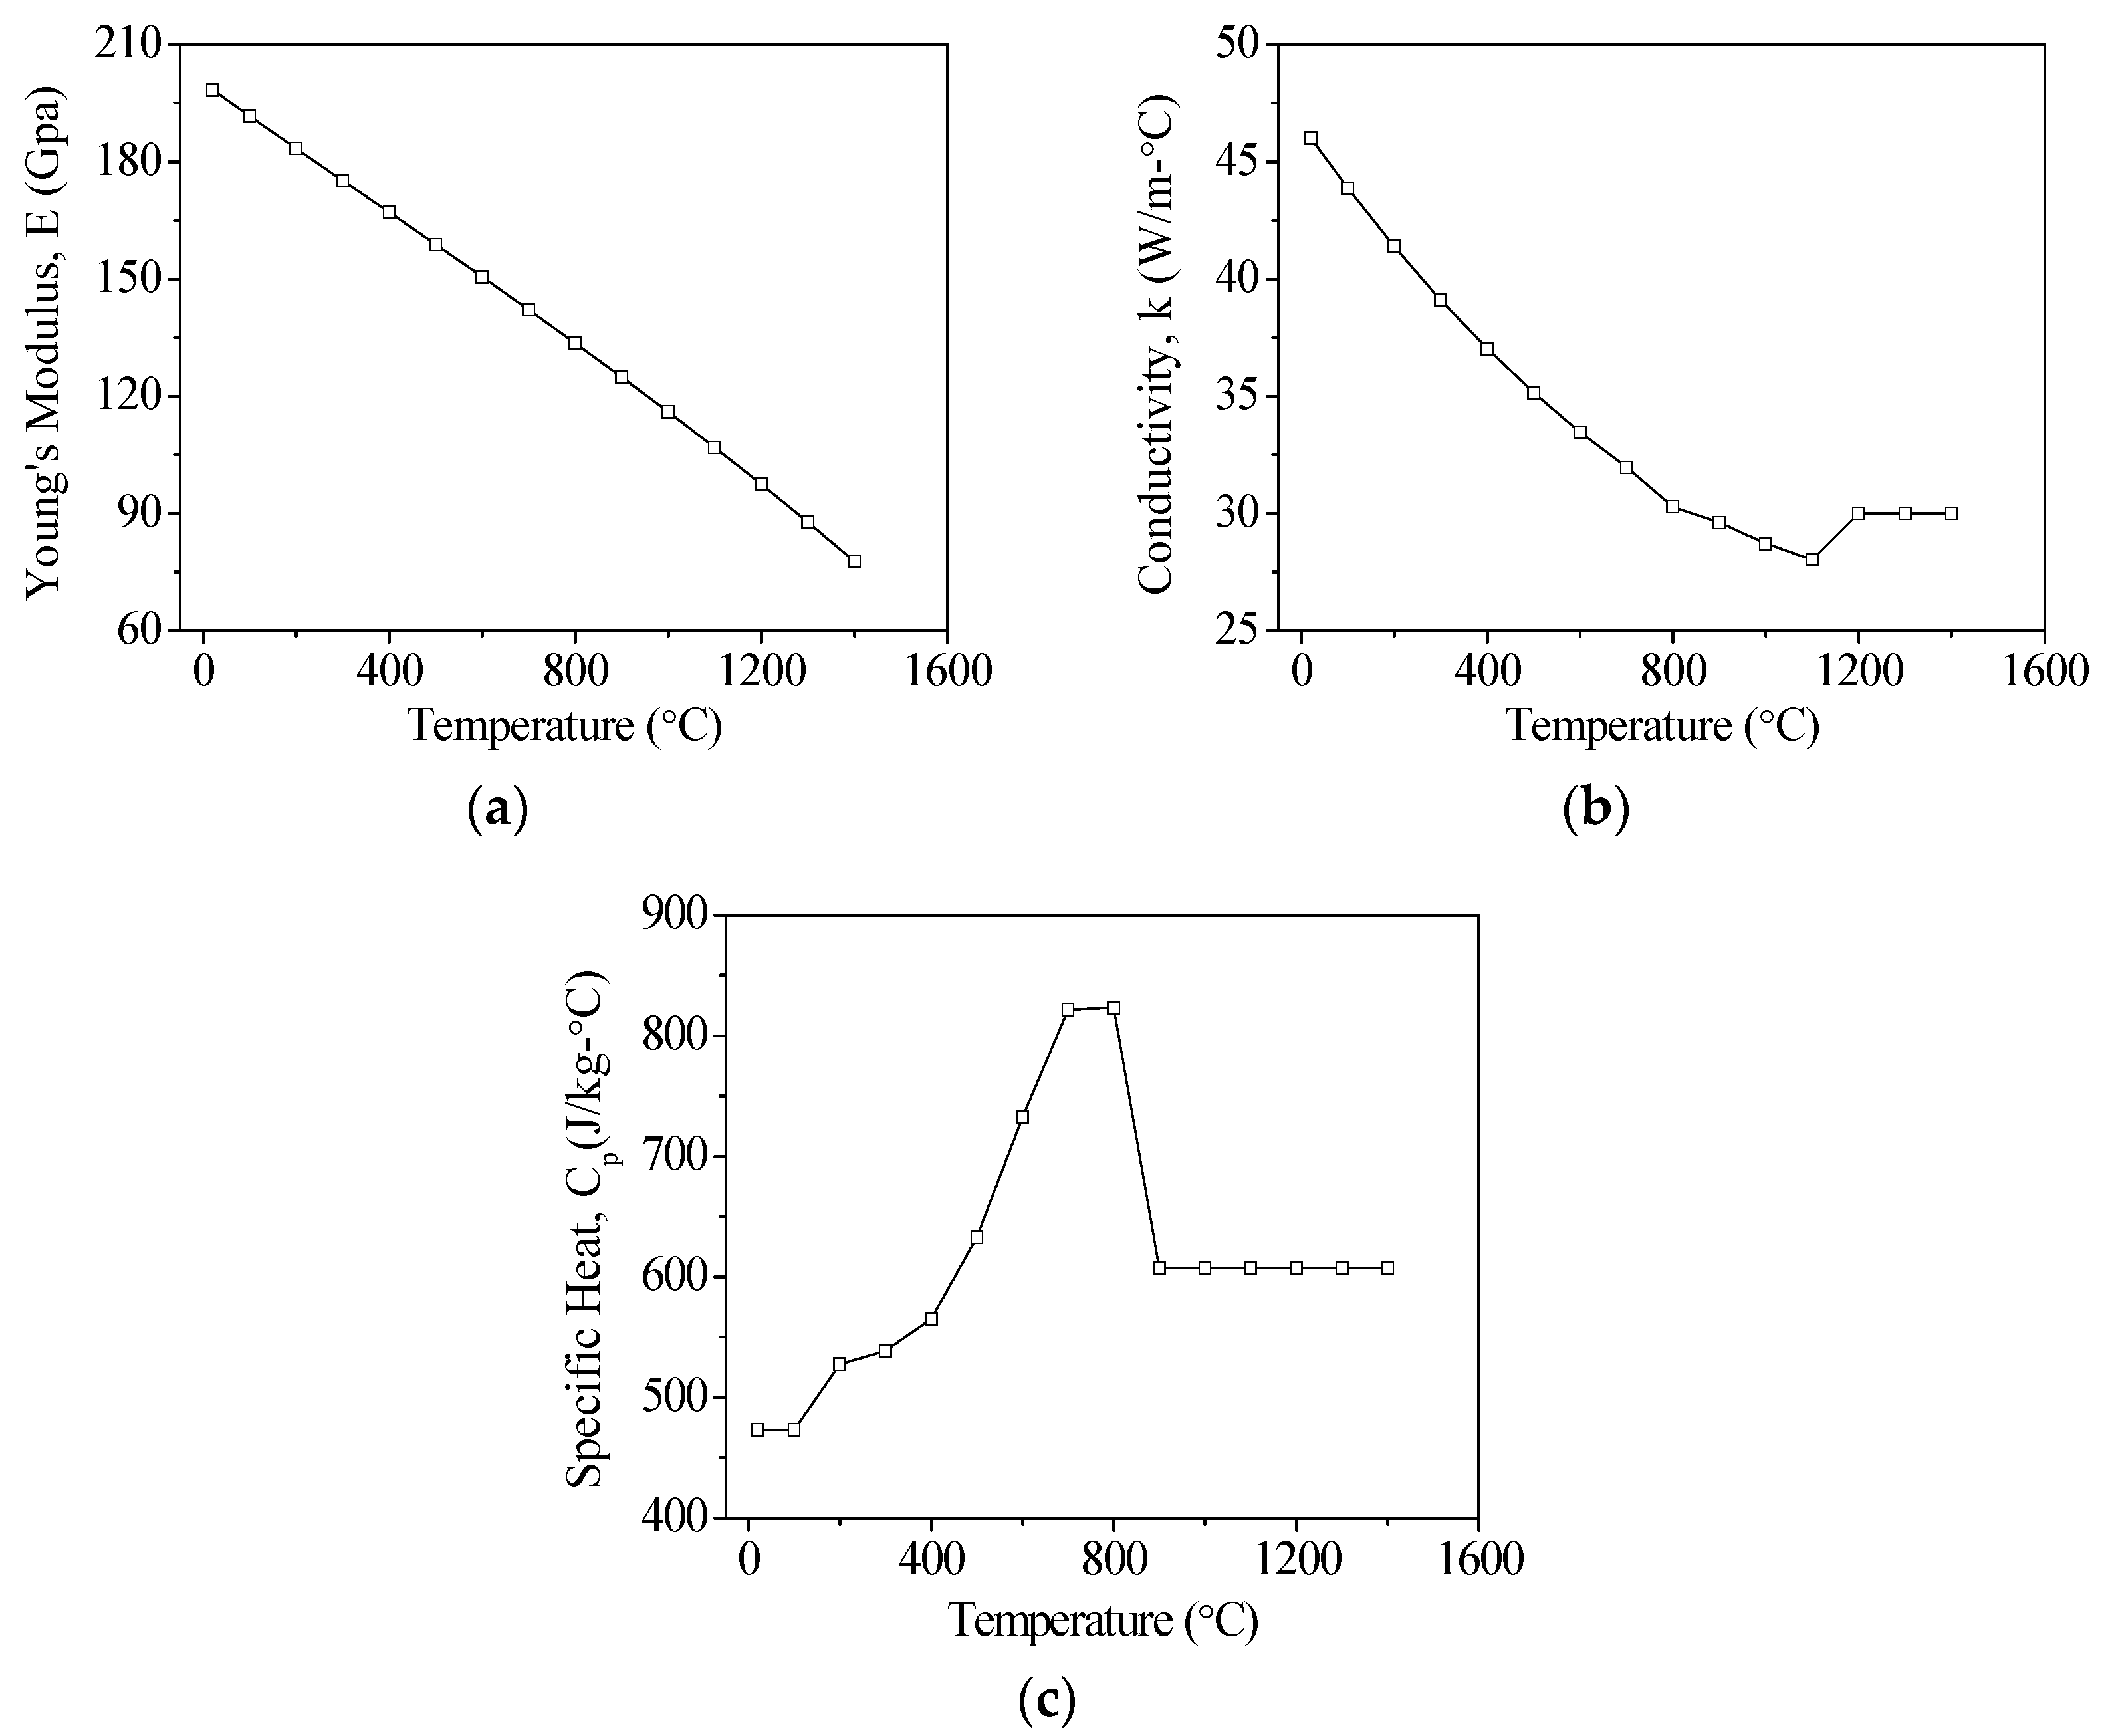
| Thermal Conductivity (W/m·°C) | Figure 2 | Figure 3 |
| Specific Heat (J/Kg·°C) | Figure 2 | Figure 3 |
| Young’s Modulus (GPa) | Figure 2 | Figure 3 |
| Yield Strength (MPa) | 310 | 415 |
| CTE (Coefficient of Thermal Expension) (μm/m·°C) | 15 | 15 |
| Poisson’s Ratio | 0.27 | 0.3 |
| Hardening Temperature (°C) | 760 | 850 |
| Melting Temperature (°C) | 1520 | 1410 |
| Tempering Temperature (°C) | 400 | 400 |
| No. | Laser Power (W) | Laser Scanning Speed (mm/s) | Average Hardness (HV) | Increase in Hardness (%) |
|---|---|---|---|---|
| 1 | 0 | 0 | 213 | 0 |
| 2 | 100 | 10 | 472 | 55 |
| 3 | 100 | 20 | 303 | 30 |
| 4 | 125 | 10 | 390 | 45 |
| 5 | 125 | 30 | 286 | 26 |
| 6 | 200 | 30 | 286 | 26 |
| 7 | 200 | 50 | 385 | 45 |
| 8 | 250 | 30 | 397 | 46 |
| 9 | 250 | 50 | 301 | 29 |
| 10 | 250 | 100 | 298 | 29 |
| 11 | 250 | 200 | 297 | 28 |
| 12 | 250 | 250 | 269 | 21 |
| Processing Parameters | Increasing Laser Spot Diameter by 0.1 mm | Increasing Laser Scanning Speed by 1 mm/s | ||||
|
| |||||
| Materials | Temperature (K) | Wh (mm) | Dh(mm) | Temperature (K) | Wh (mm) | Dh(mm) |
| AISI 1045 | −137.4 | −0.043 | −0.021 | −24.8 | −0.048 | −0.011 |
| AISI 4140 | −63 | −0.081 | −0.023 | −18.1 | −0.058 | −0.008 |
| Processing Parameters | Increasing Laser Power by 1 W | ||
| |||
| Materials | Temperature (K) | Wh (mm) | Dh(mm) |
| AISI 1045 | +5.8 | +0.06 | +0.02 |
| AISI 4140 | +3.91 | +0.083 | +0.017 |
© 2018 by the authors. Licensee MDPI, Basel, Switzerland. This article is an open access article distributed under the terms and conditions of the Creative Commons Attribution (CC BY) license (http://creativecommons.org/licenses/by/4.0/).
Share and Cite
Hung, T.-P.; Shi, H.-E.; Kuang, J.-H. Temperature Modeling of AISI 1045 Steel during Surface Hardening Processes. Materials 2018, 11, 1815. https://doi.org/10.3390/ma11101815
Hung T-P, Shi H-E, Kuang J-H. Temperature Modeling of AISI 1045 Steel during Surface Hardening Processes. Materials. 2018; 11(10):1815. https://doi.org/10.3390/ma11101815
Chicago/Turabian StyleHung, Tsung-Pin, Hao-En Shi, and Jao-Hwa Kuang. 2018. "Temperature Modeling of AISI 1045 Steel during Surface Hardening Processes" Materials 11, no. 10: 1815. https://doi.org/10.3390/ma11101815
APA StyleHung, T.-P., Shi, H.-E., & Kuang, J.-H. (2018). Temperature Modeling of AISI 1045 Steel during Surface Hardening Processes. Materials, 11(10), 1815. https://doi.org/10.3390/ma11101815