2.1. Characterization of AgNPs
The morphology, particle size, and size distribution of Ag nanoparticles vary under different temperatures and reaction times so the effects of the volume ratios, temperatures, and time factors of the PEG-EG compound on reducing AgNPs were investigated.
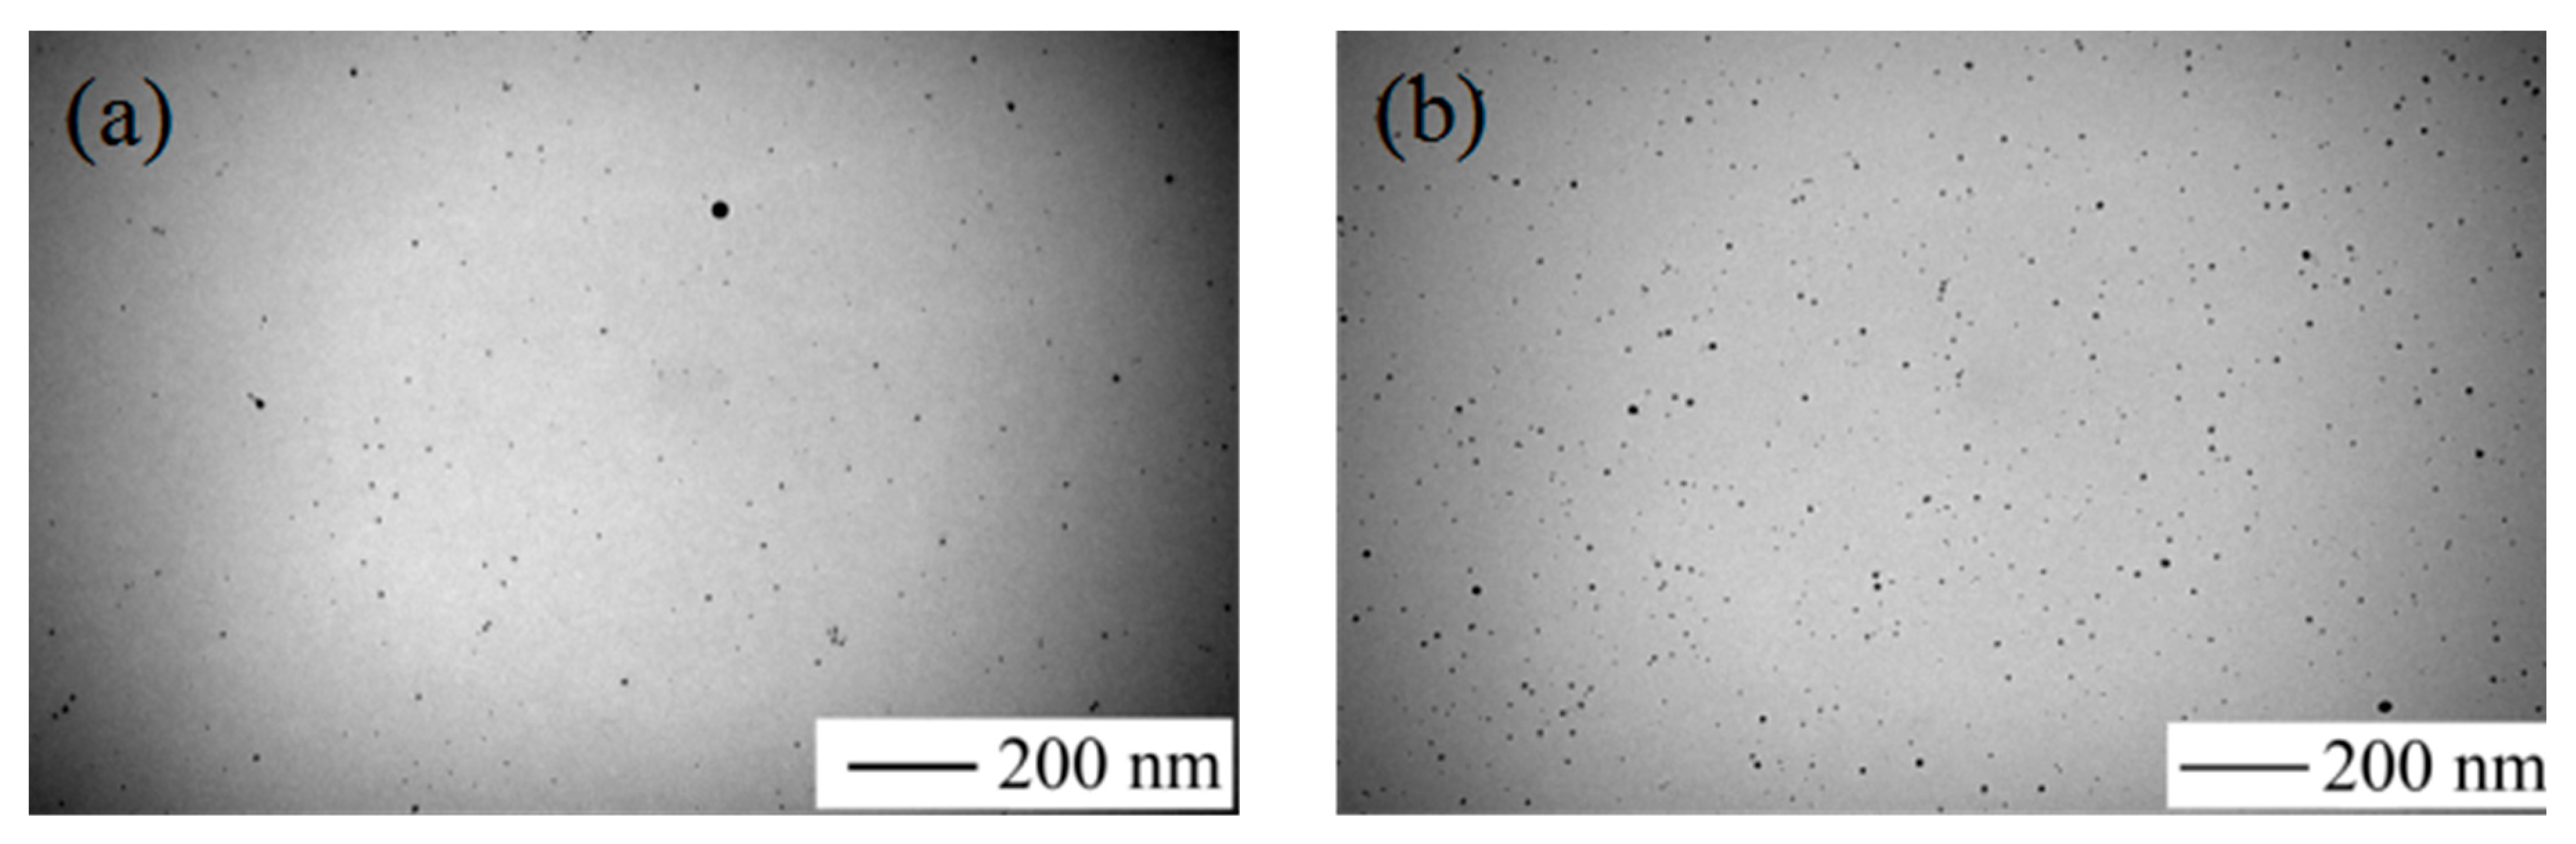
Figure 1a–c show the SEM image of AgNPs prepared under different temperatures. As shown in
Figure 1, the prepared AgNPs were spherical.
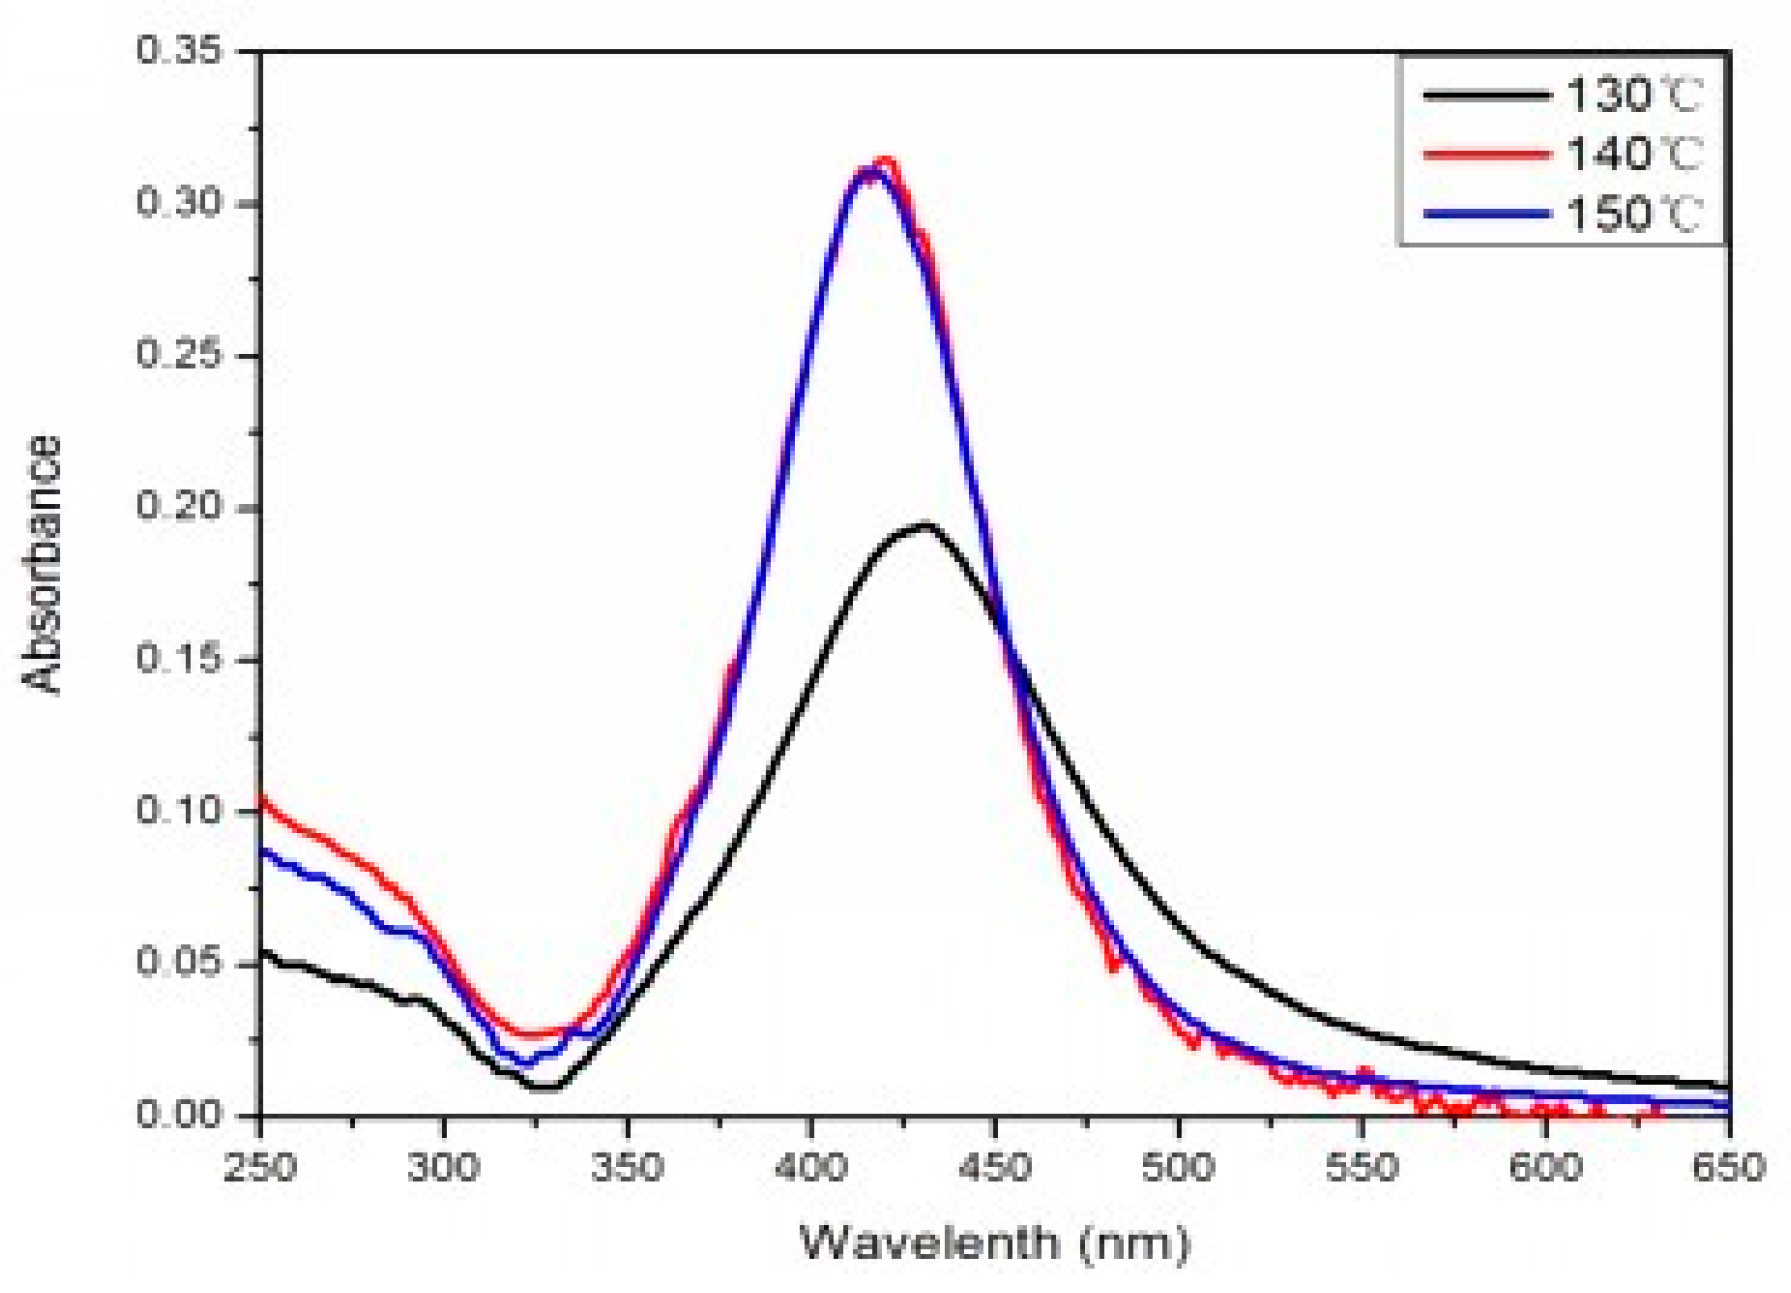
Figure 2 is the UV-vis extinction spectra of the products prepared under different temperatures when the volume ratio of PEG:EG was 1:2. When the reaction temperature was 130 °C, the UV-vis absorption band for AgNPs was around 440 nm. In addition, SEM photographs indicated that the average size was 100 nm. When the temperature was 140–150 °C, the UV-vis absorption band for AgNPs was around 420 nm. UV-vis diffuse reflection spectra results showed that absorb bands shifted to a shorter wavelength (blue shift), which was induced by the smaller particle size of AgNPs reduced in the solution.
Figure 2 shows that the intensity of the peak at 420 nm for the samples aged at 140 and 150 °C was much stronger than that at 130 °C, mainly because a complete reaction is difficult to achieve under an insufficient temperature. Thus, it was difficult to obtain AgNPs with high yield, which was also verified by the SEM image. When the reaction temperature was 140 or 150 °C, the characteristic absorption peak had the same high and the half-peak had the same width on the plot graph. This indicated that 140 °C was a critical temperature of the reaction. When the temperature was higher than 140 °C, the rate of the reaction was almost constant. The morphology and particle size characterized by SEM remained essentially unchanged, and the photographs indicated that the average size of the AgNPs was 40 nm. Therefore, resources could be saved and quality assured under the selected temperature of 140 °C.
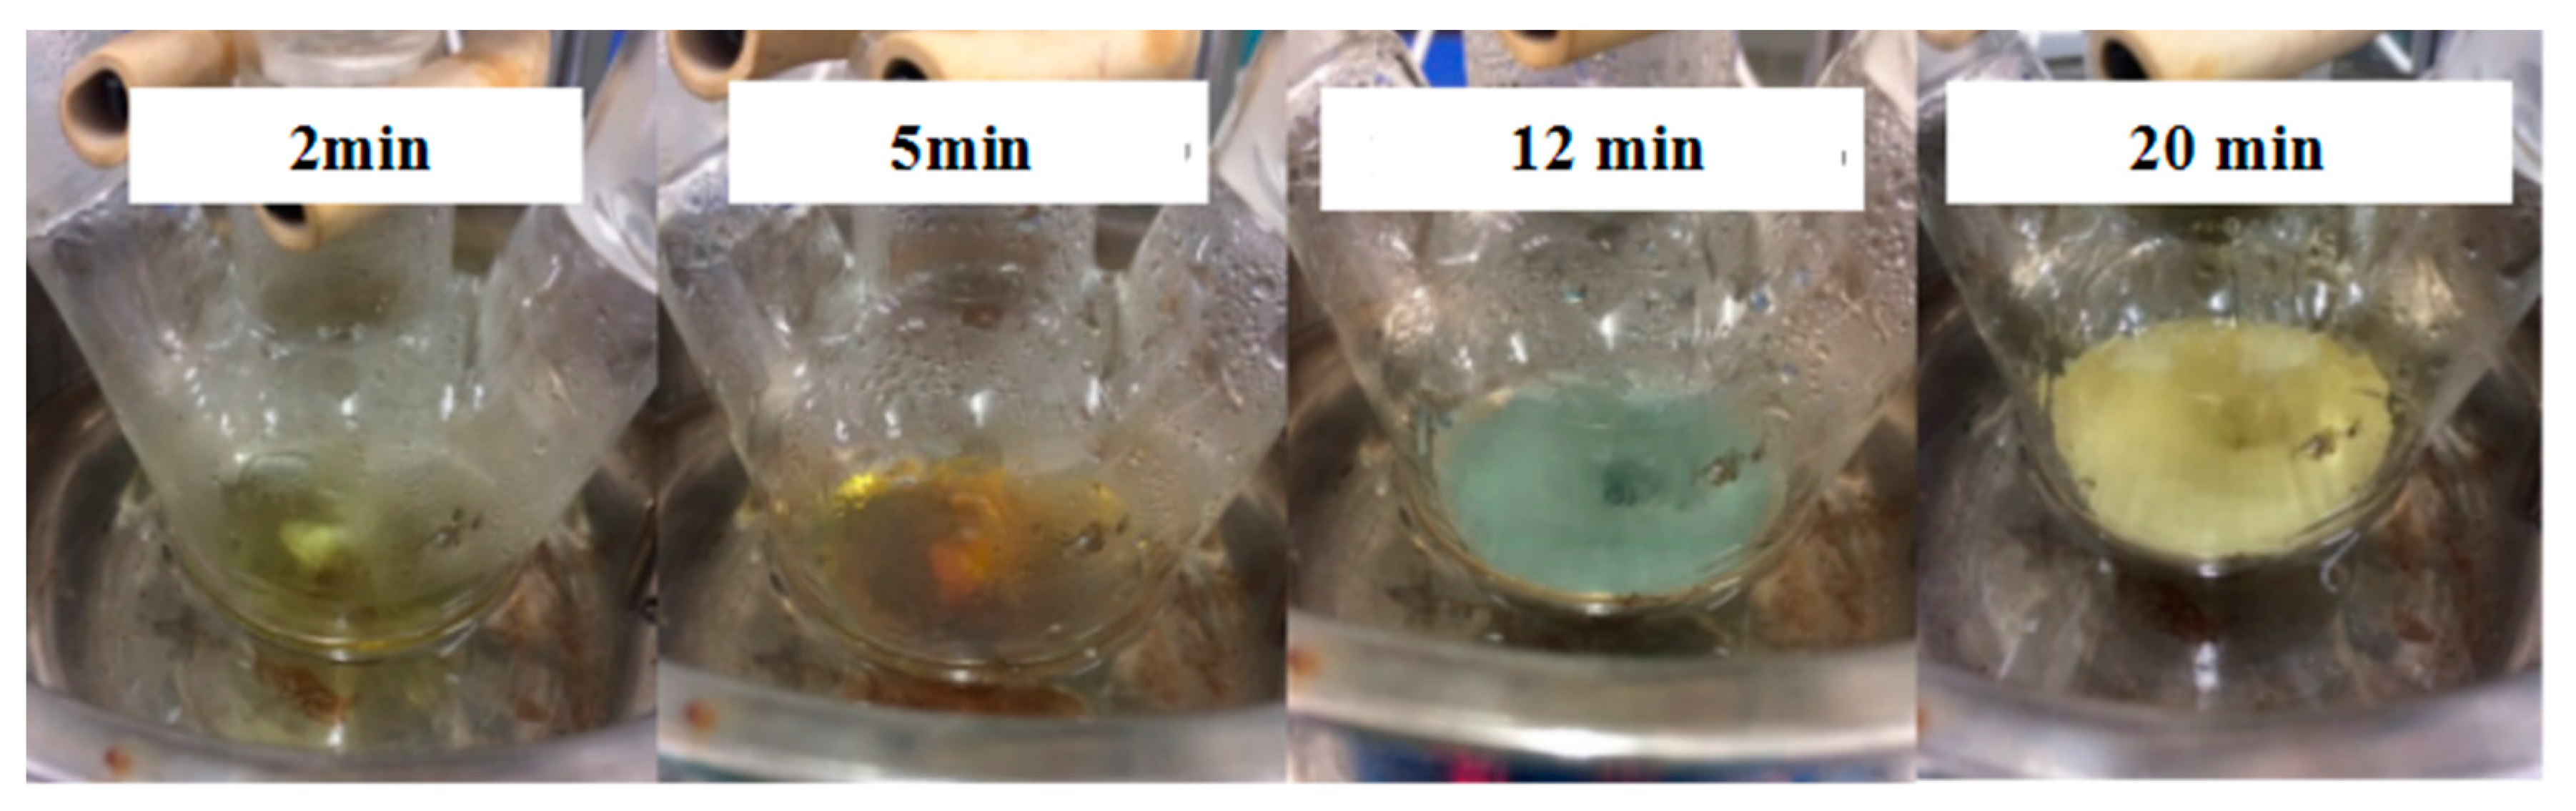
The results shown in
Figure 3 demonstrate that the color of the solution changed obviously. The color of the solution gradually changed from colorless to yellow within 2 min.
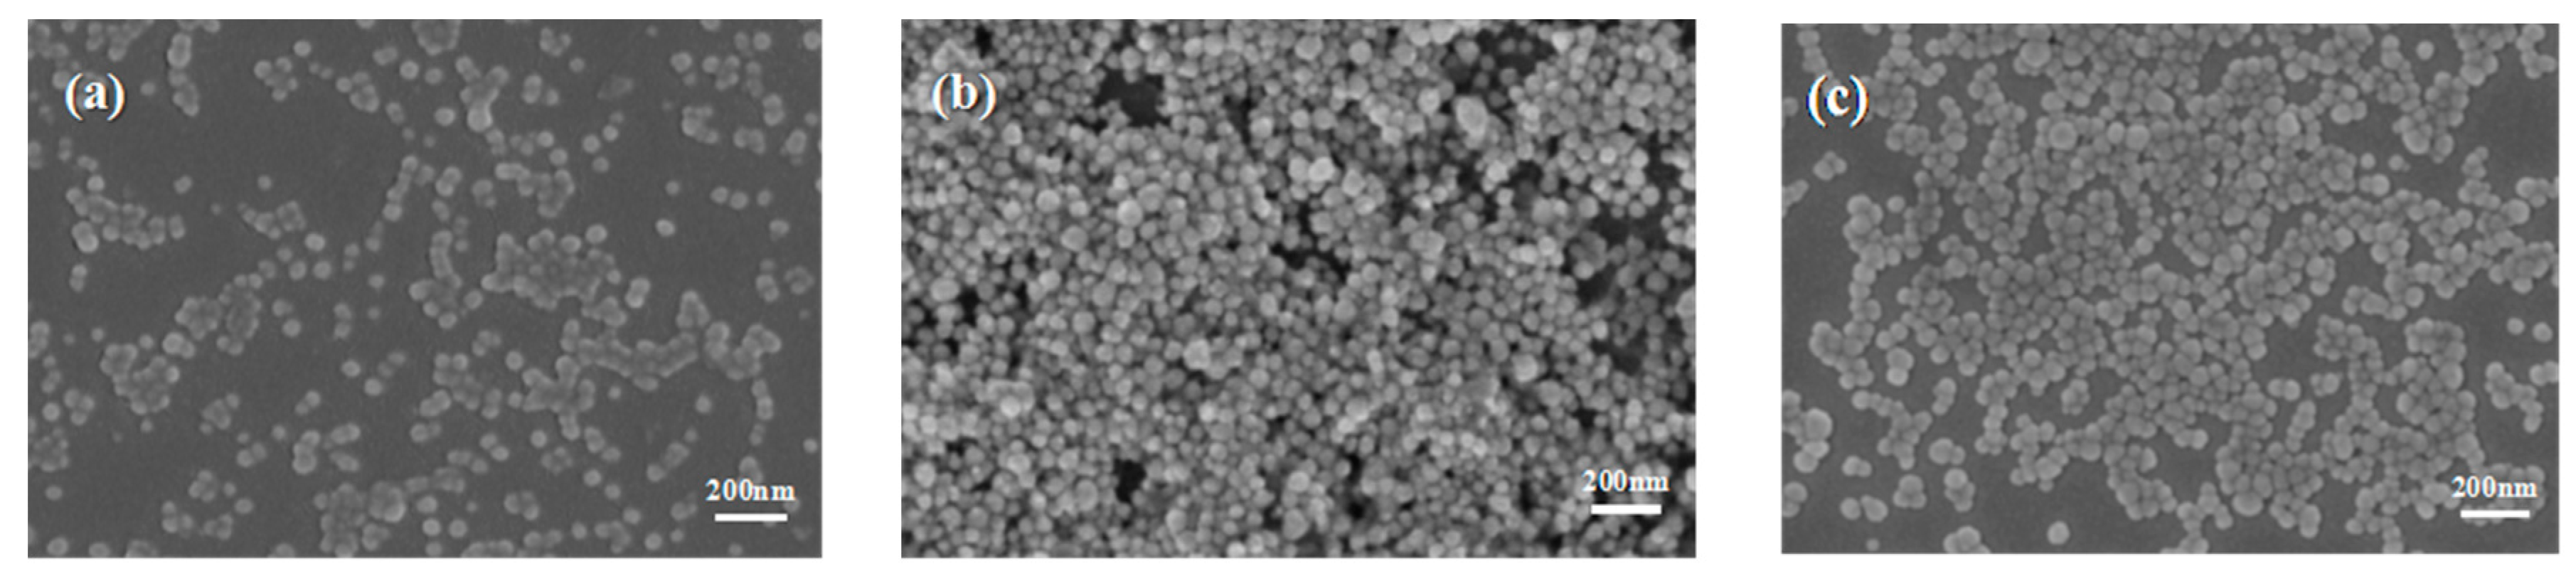
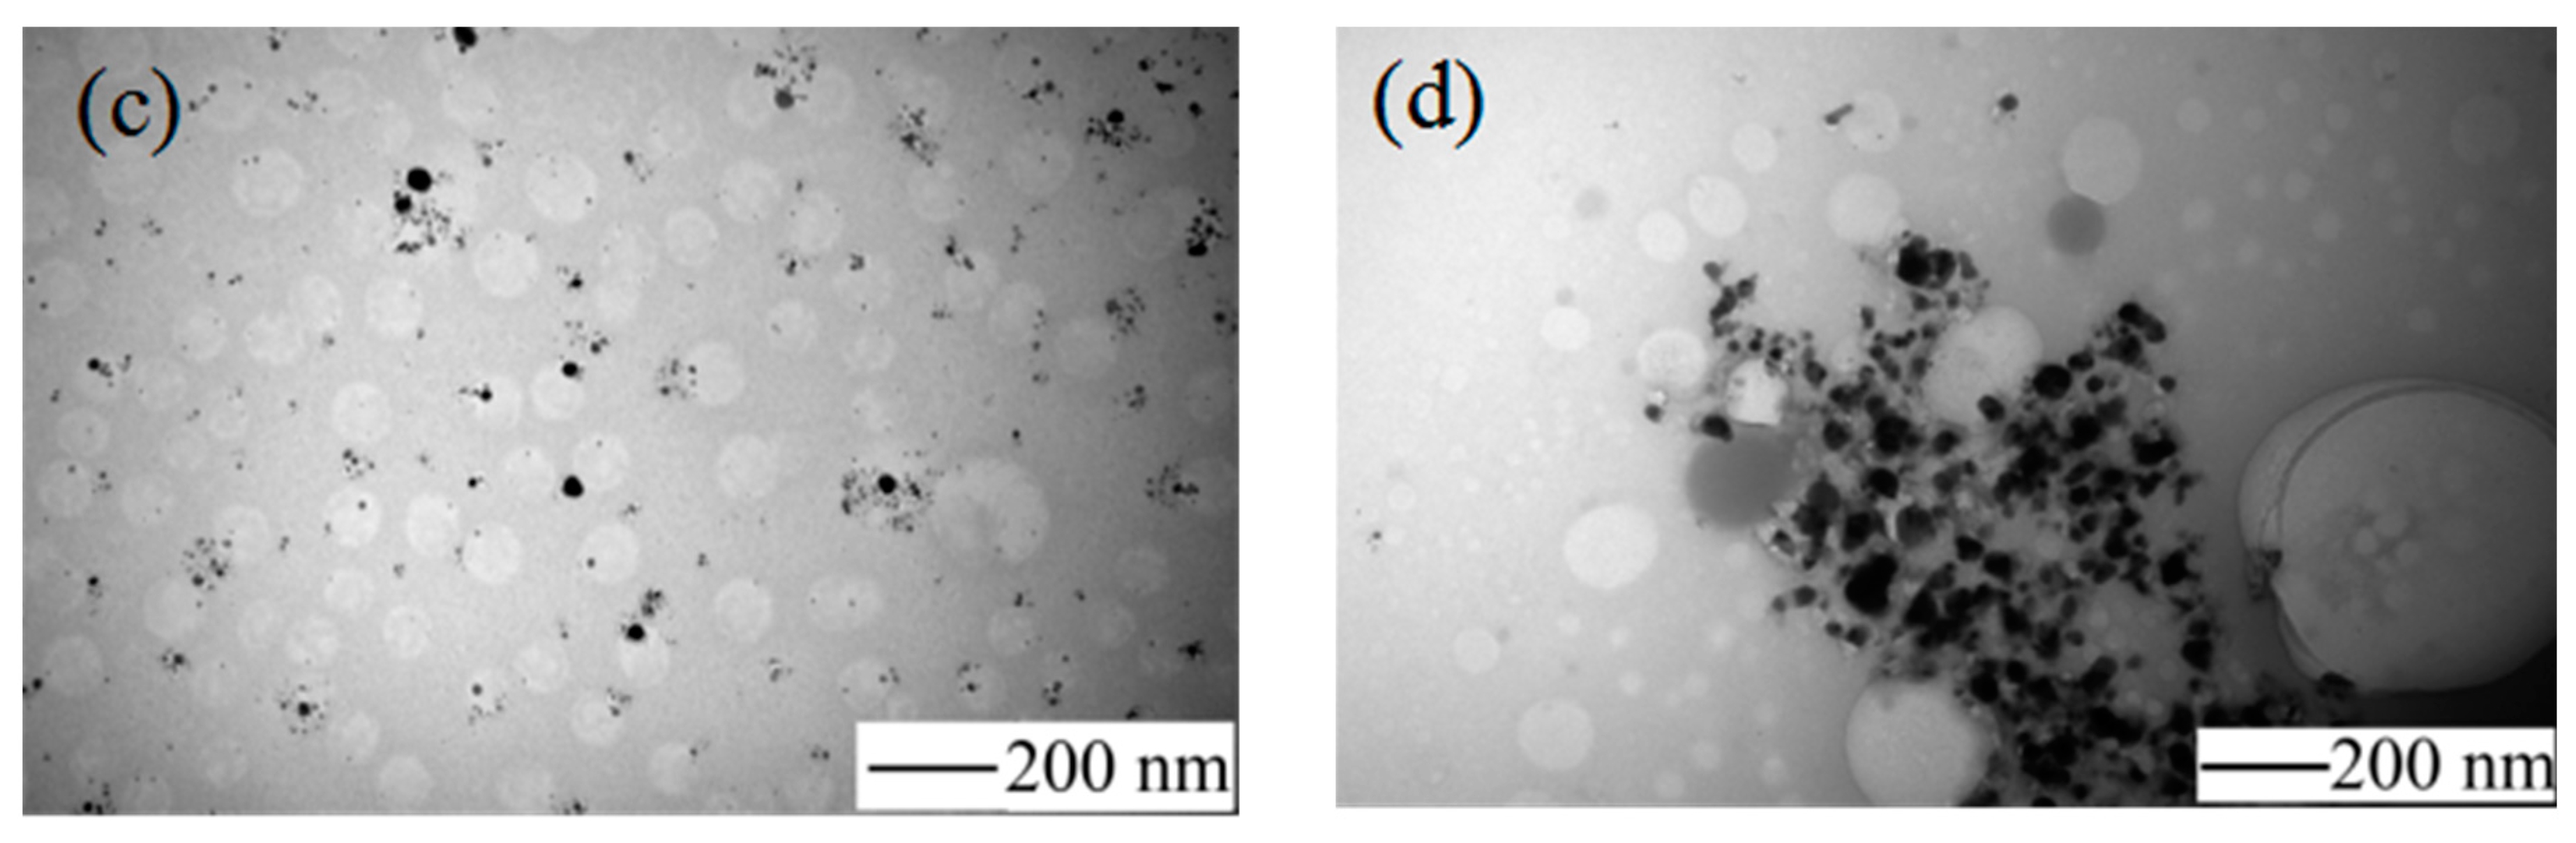
Figure 4 shows the TEM image of AgNPs and
Figure 4a shows the appearance of the condensation nuclei. The solution mixture continued to be stirred after 3 min at the same temperature, and the color of the solution gradually changed to tea red before turning dark and cloudy, due to the increase in scattering degree of the crystal seeds after the growth of the light. After 12 min, the color became dark green, and the Ag nanoparticles grew from the condensation nucleus (
Figure 4b–d). After 20 min, the color remained basically stable as brown green, which indicated that the reaction was complete as the absorption and scattering of light intensity are constant when the grain size is no longer growing.
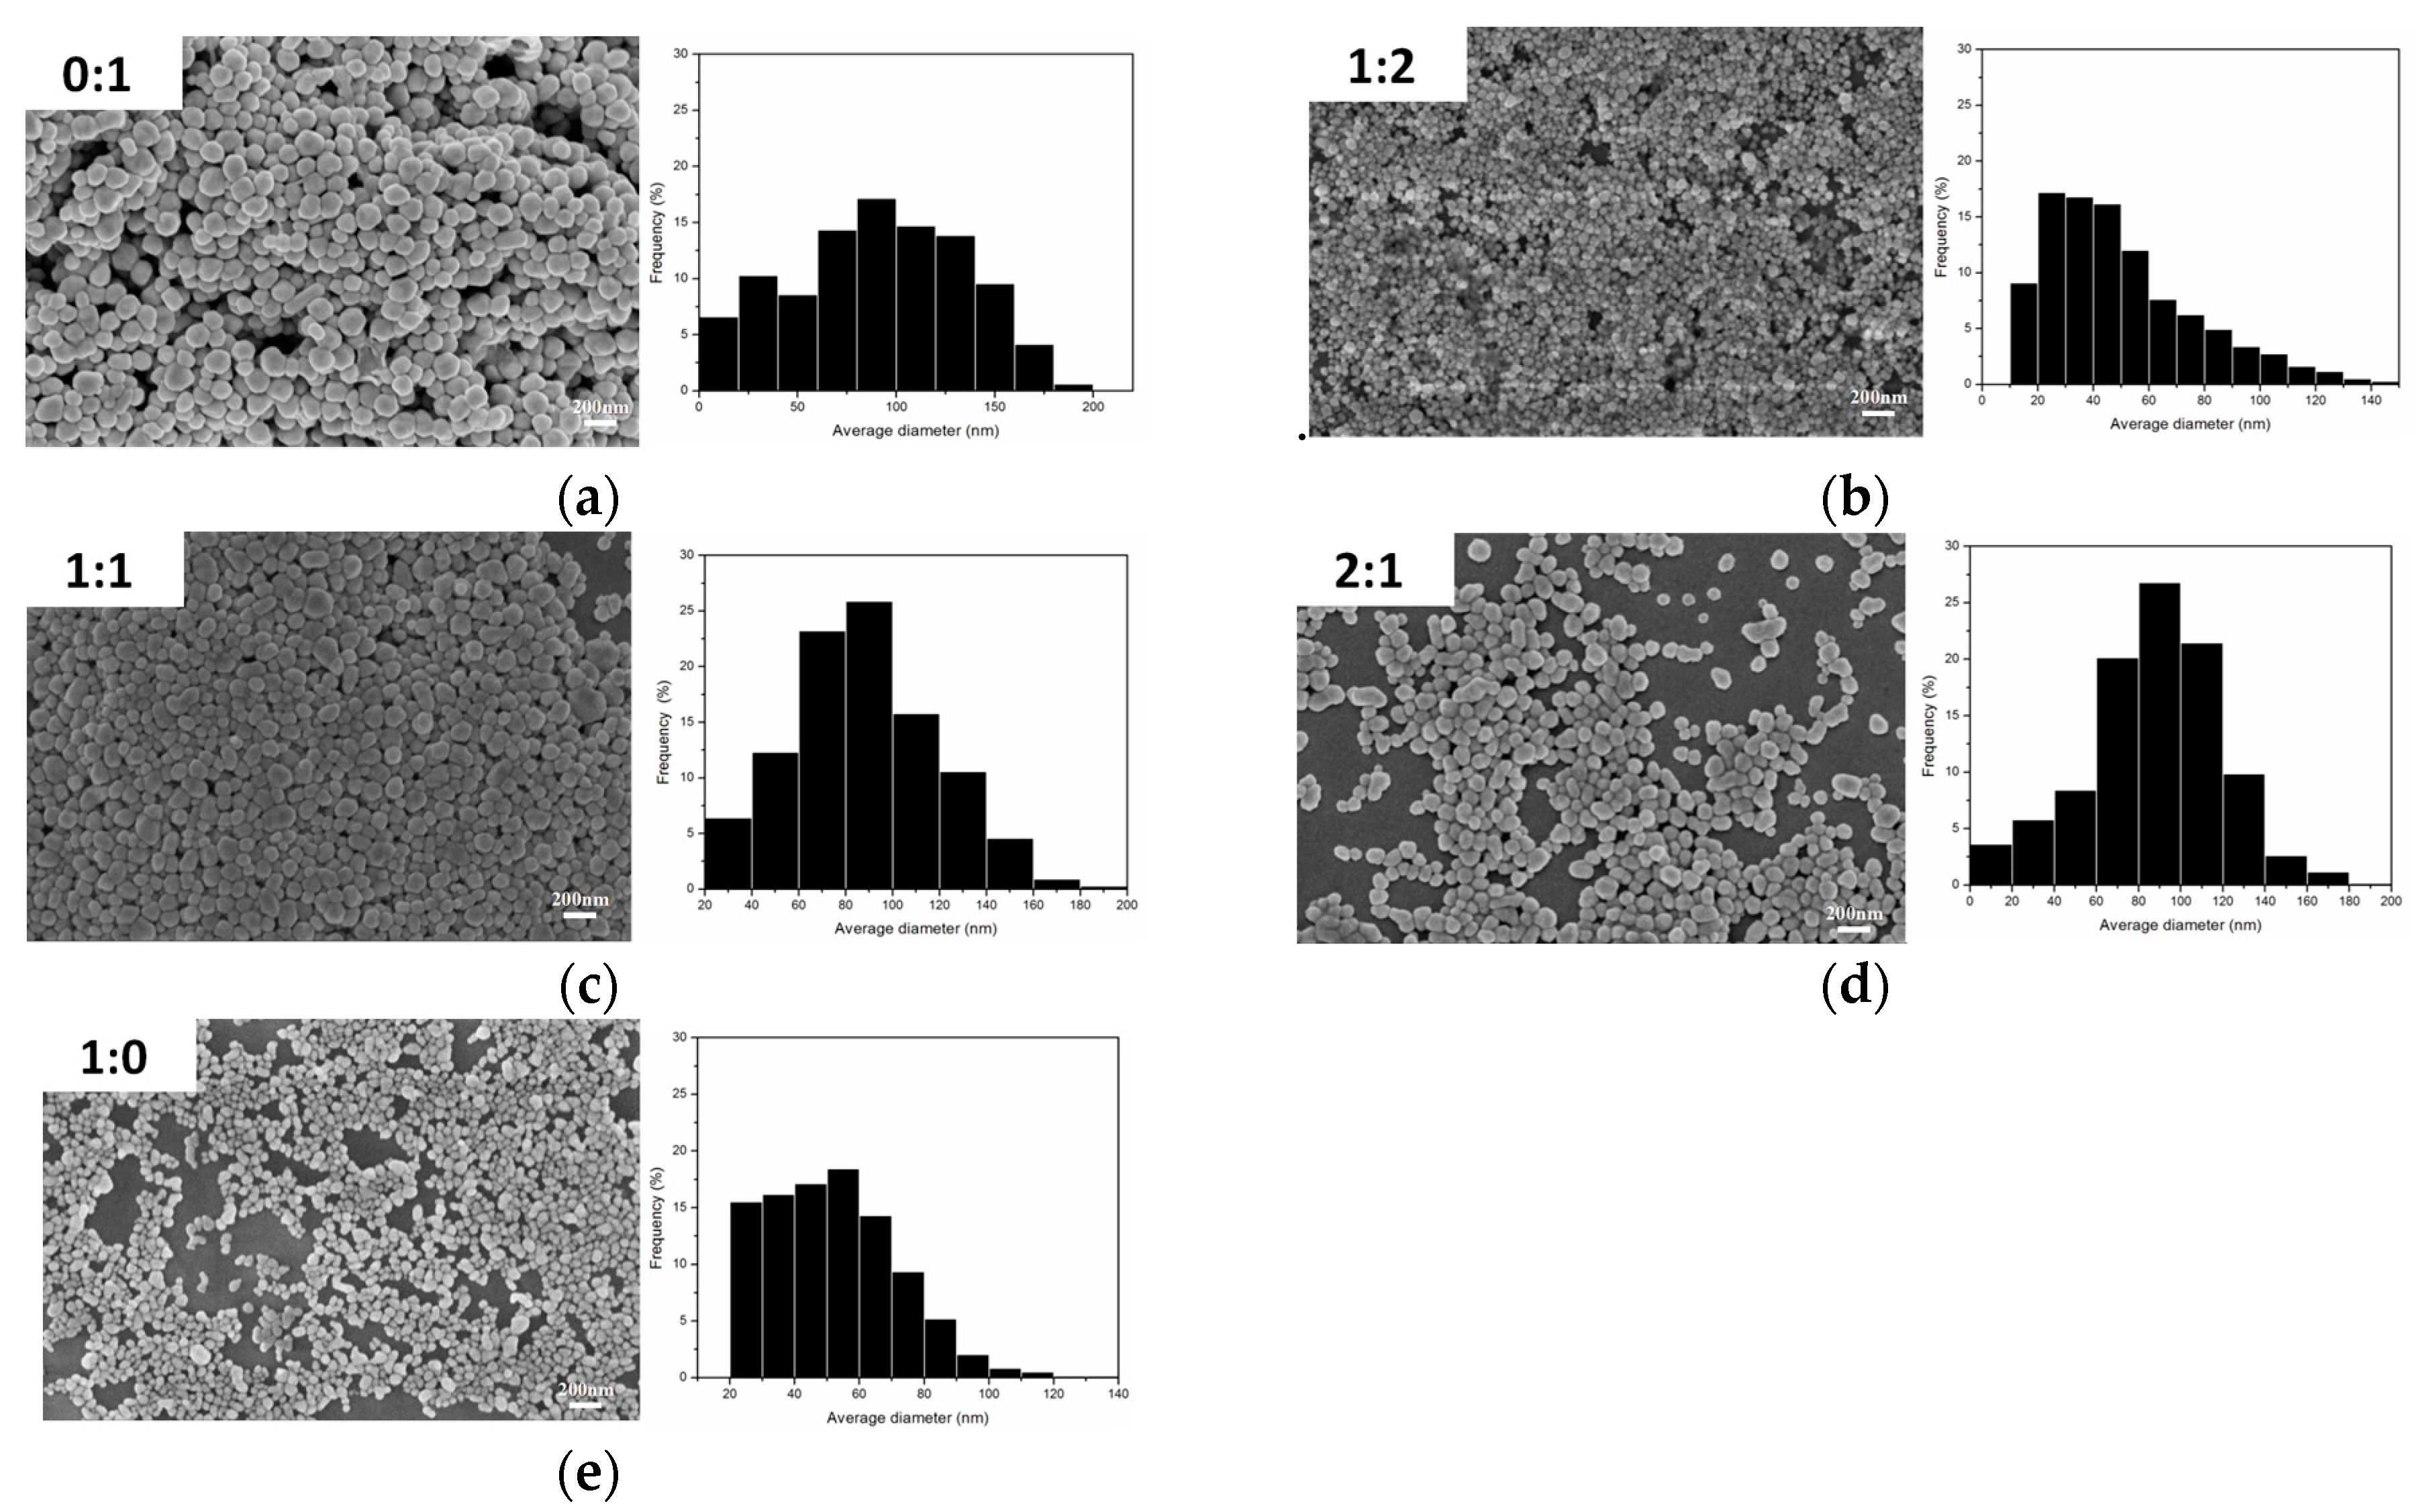
Figure 5 show the SEM images and particle size distribution images of Ag nanoparticles prepared under different volume ratios of PEG to EG where it can be seen that the nano-Ag particles were well spread.
Figure 5a–c show the SEM image of the AgNPs with an average size of about 65–100 nm with a wide size distribution. When the ration of PEG:EG was 1:2 (
Figure 5b), the average nano-Ag size was about 40 nm, and the particle size distribution was concentrated within 30–80 nm, which was an ideal ratio in this series of experiments.
Figure 5e shows the SEM image when the ratio of PEG:EG was 1:0; the corresponding size distribution result is displayed and show a mean diameter of 40 nm. However, this ratio also had some disadvantages, for example, PVP and AgNO
3 were barely soluble in PEG, had a low yield, took a long time for reaction processes, and had incomplete reactions. The results showed that the ratio (1:2) of PEG to EG were more suitable. The addition of PEG effectively inhibited the growth rate of Ag particles and also effectively controlled the size of nano-Ag particles by adjusting the ratio of PEG to EG. PEG also prevented the agglomeration of Ag particles so that the prepared nano-Ag particles had good dispersibility.
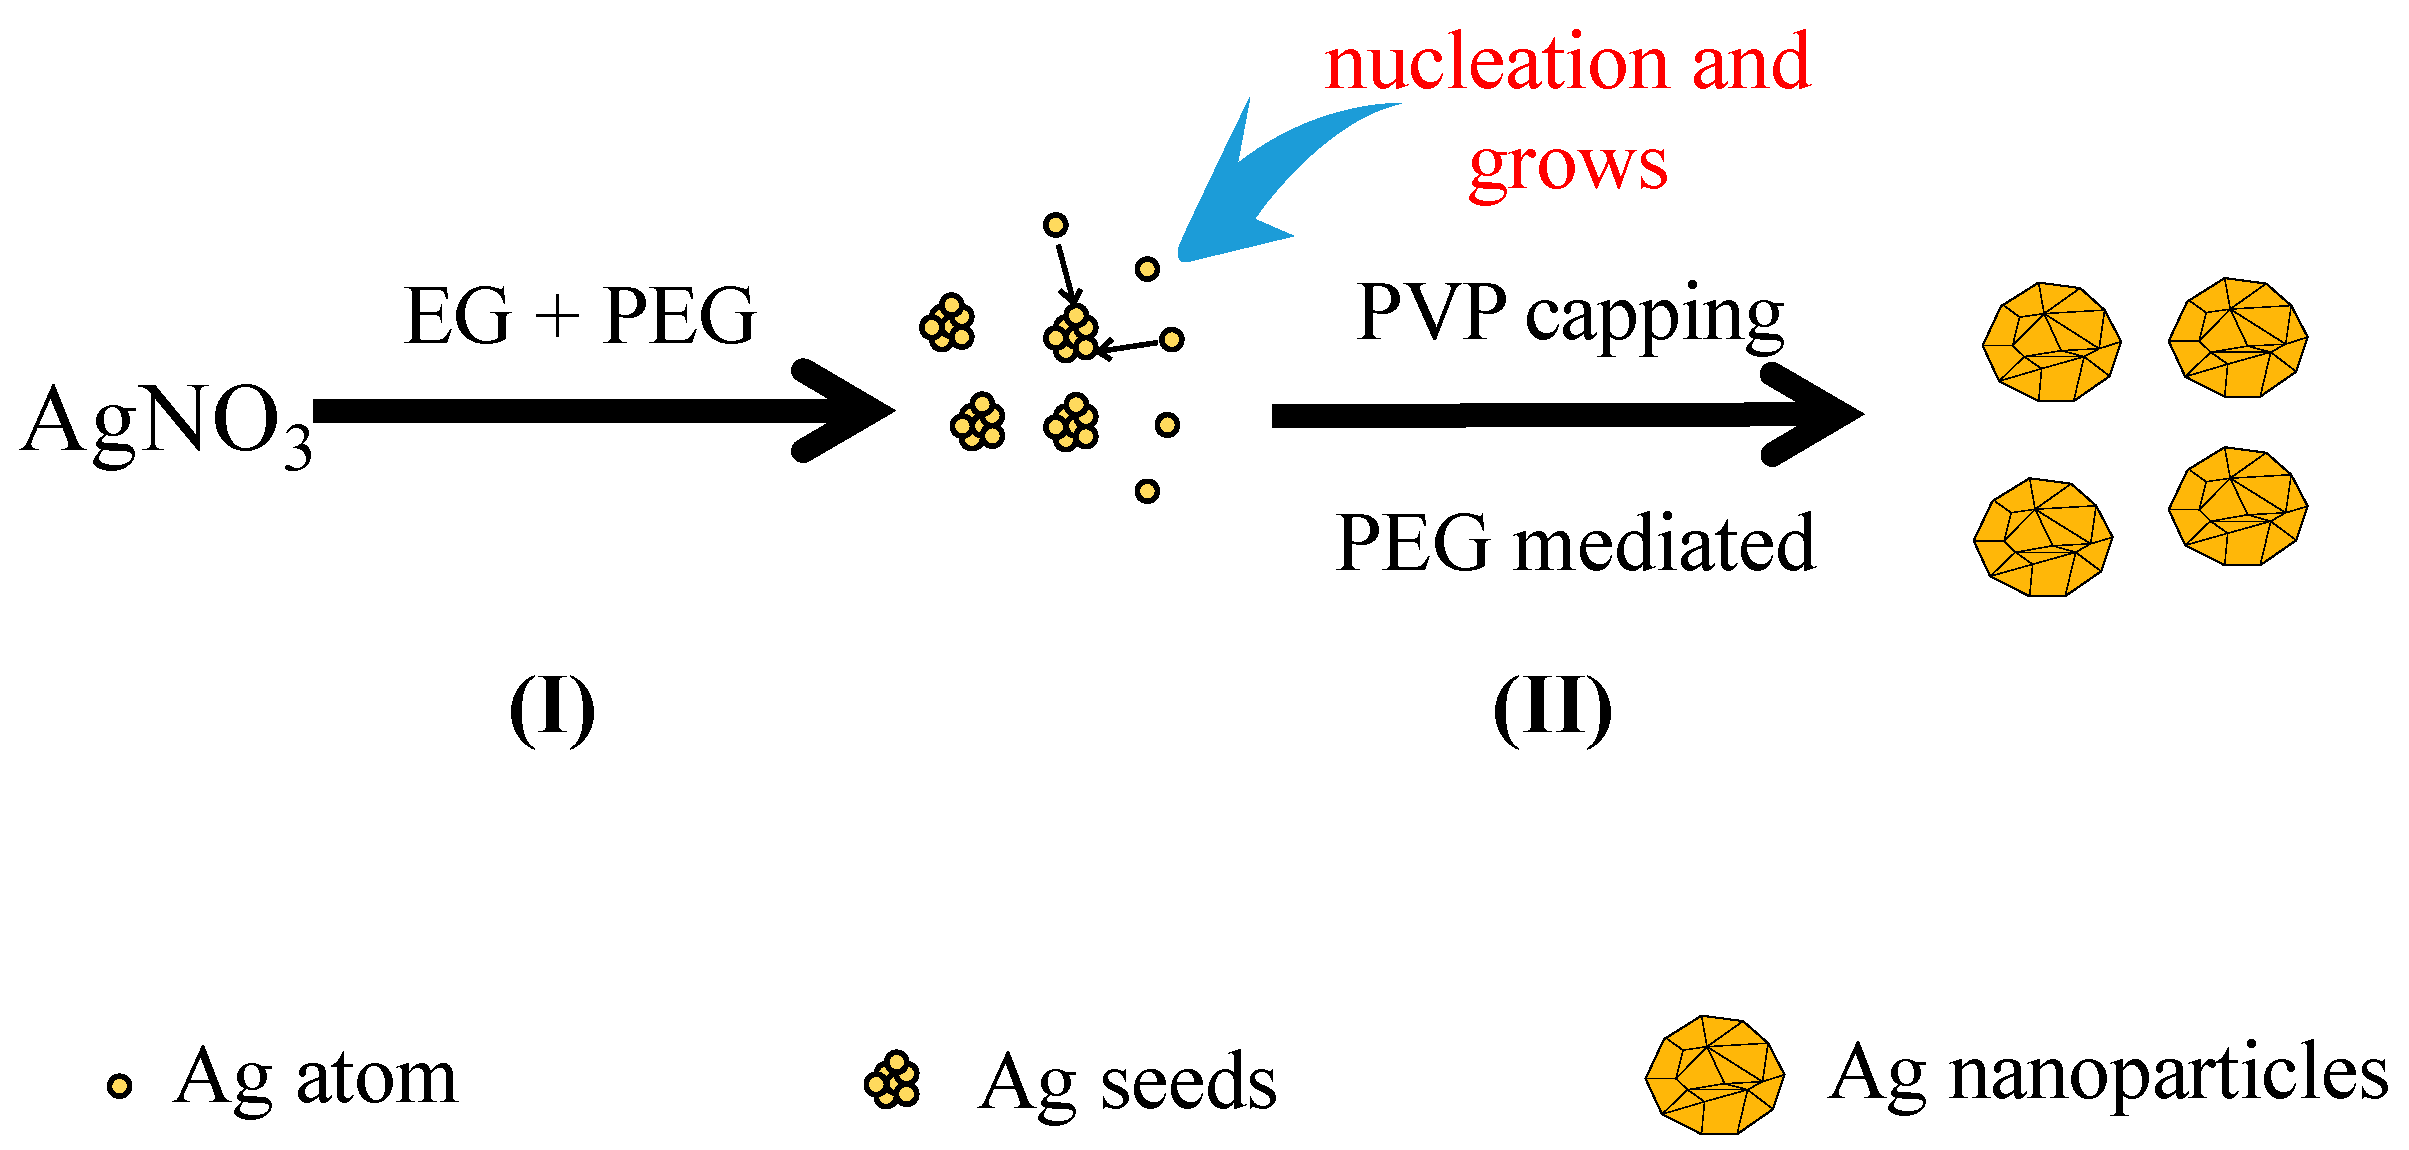
The growth mechanism of the spherical Ag nanoparticles in the mixed solution of PEG and EG was proposed as
Figure 6I. When EG was used alone as the reductant, the nano-Ag formed very slowly due to the weak reducing power of EG. In addition, selective adsorption of PVP onto nano-Ag was improved, which resulted in the formation of various morphologies of nano-Ag in the reaction system such as nanowires and nanocubes. PEG was employed to tune the morphology of nano-Ag as PEG has a different reducing ability and viscosity from that of EG. On one hand, due to the stronger reducing power of PEG than EG, its addition would accelerate the reaction rate, and the concentration of Ag
+ in the solution decrease quickly and reach to a supersaturated status. If the reduction rate was very fast, the newly formed Ag atoms could be quickly deposited onto the nuclei without affecting the formation of new nuclei. According to the conservation of mass, the atomic weight of the whole system was constant. As more Ag atoms were involved in nucleation, less of them would take part in the formation of new nuclei, and consequently the number of nuclei per unit time increased [
11]. On the other hand, as shown in
Figure 6II, the high viscosity of PEG reduced the movement speed of the grains in the solution and the possibility of collision among the grains decreased. Thus, the nucleation and growth rate of Ag increased with the increasing reduction ability of PEG, which facilitated the formation of numerous relatively uniform and large crystals. In contrast, if the reduction ability of the reductant was weak, the nucleation and growth rate were slow. Therefore, employing the reductant mixture of PEG and EG in the reaction led to fast nucleation and slow growth rates to obtain a single morphology of nano-sized particles.
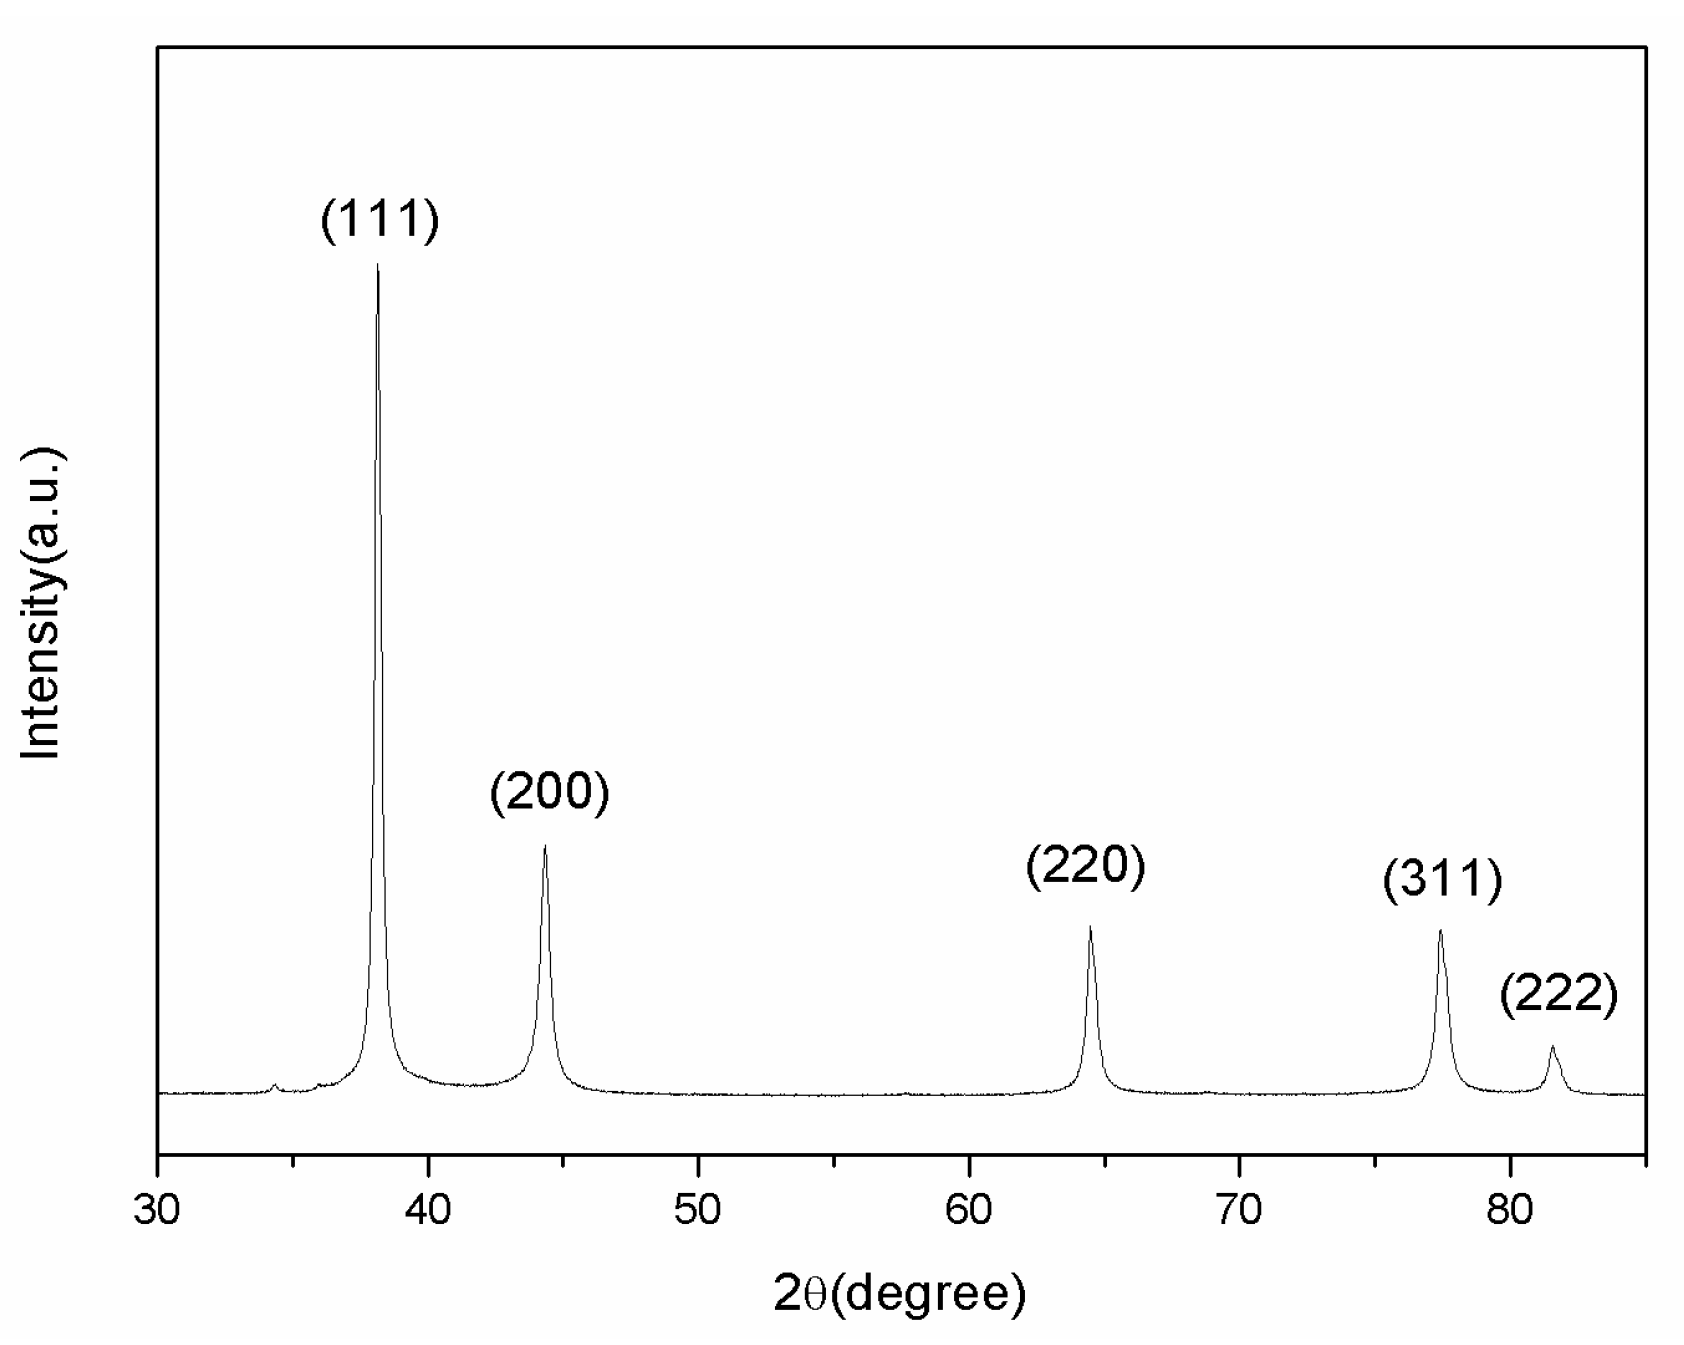
XRD analysis was carried out to verify the component of the prepared AgNPs. As shown in
Figure 7, the significant diffraction peaks at 2-theta angle of 38.12°, 44.3°, 64.5°, and 77.5° were assigned to the (111), (200), (220), and (311) planes of face-centered-cubic (fcc) silver (JCPDS file No. 04-0783), respectively.
2.2. Characterization of Ag Conductive Patterns
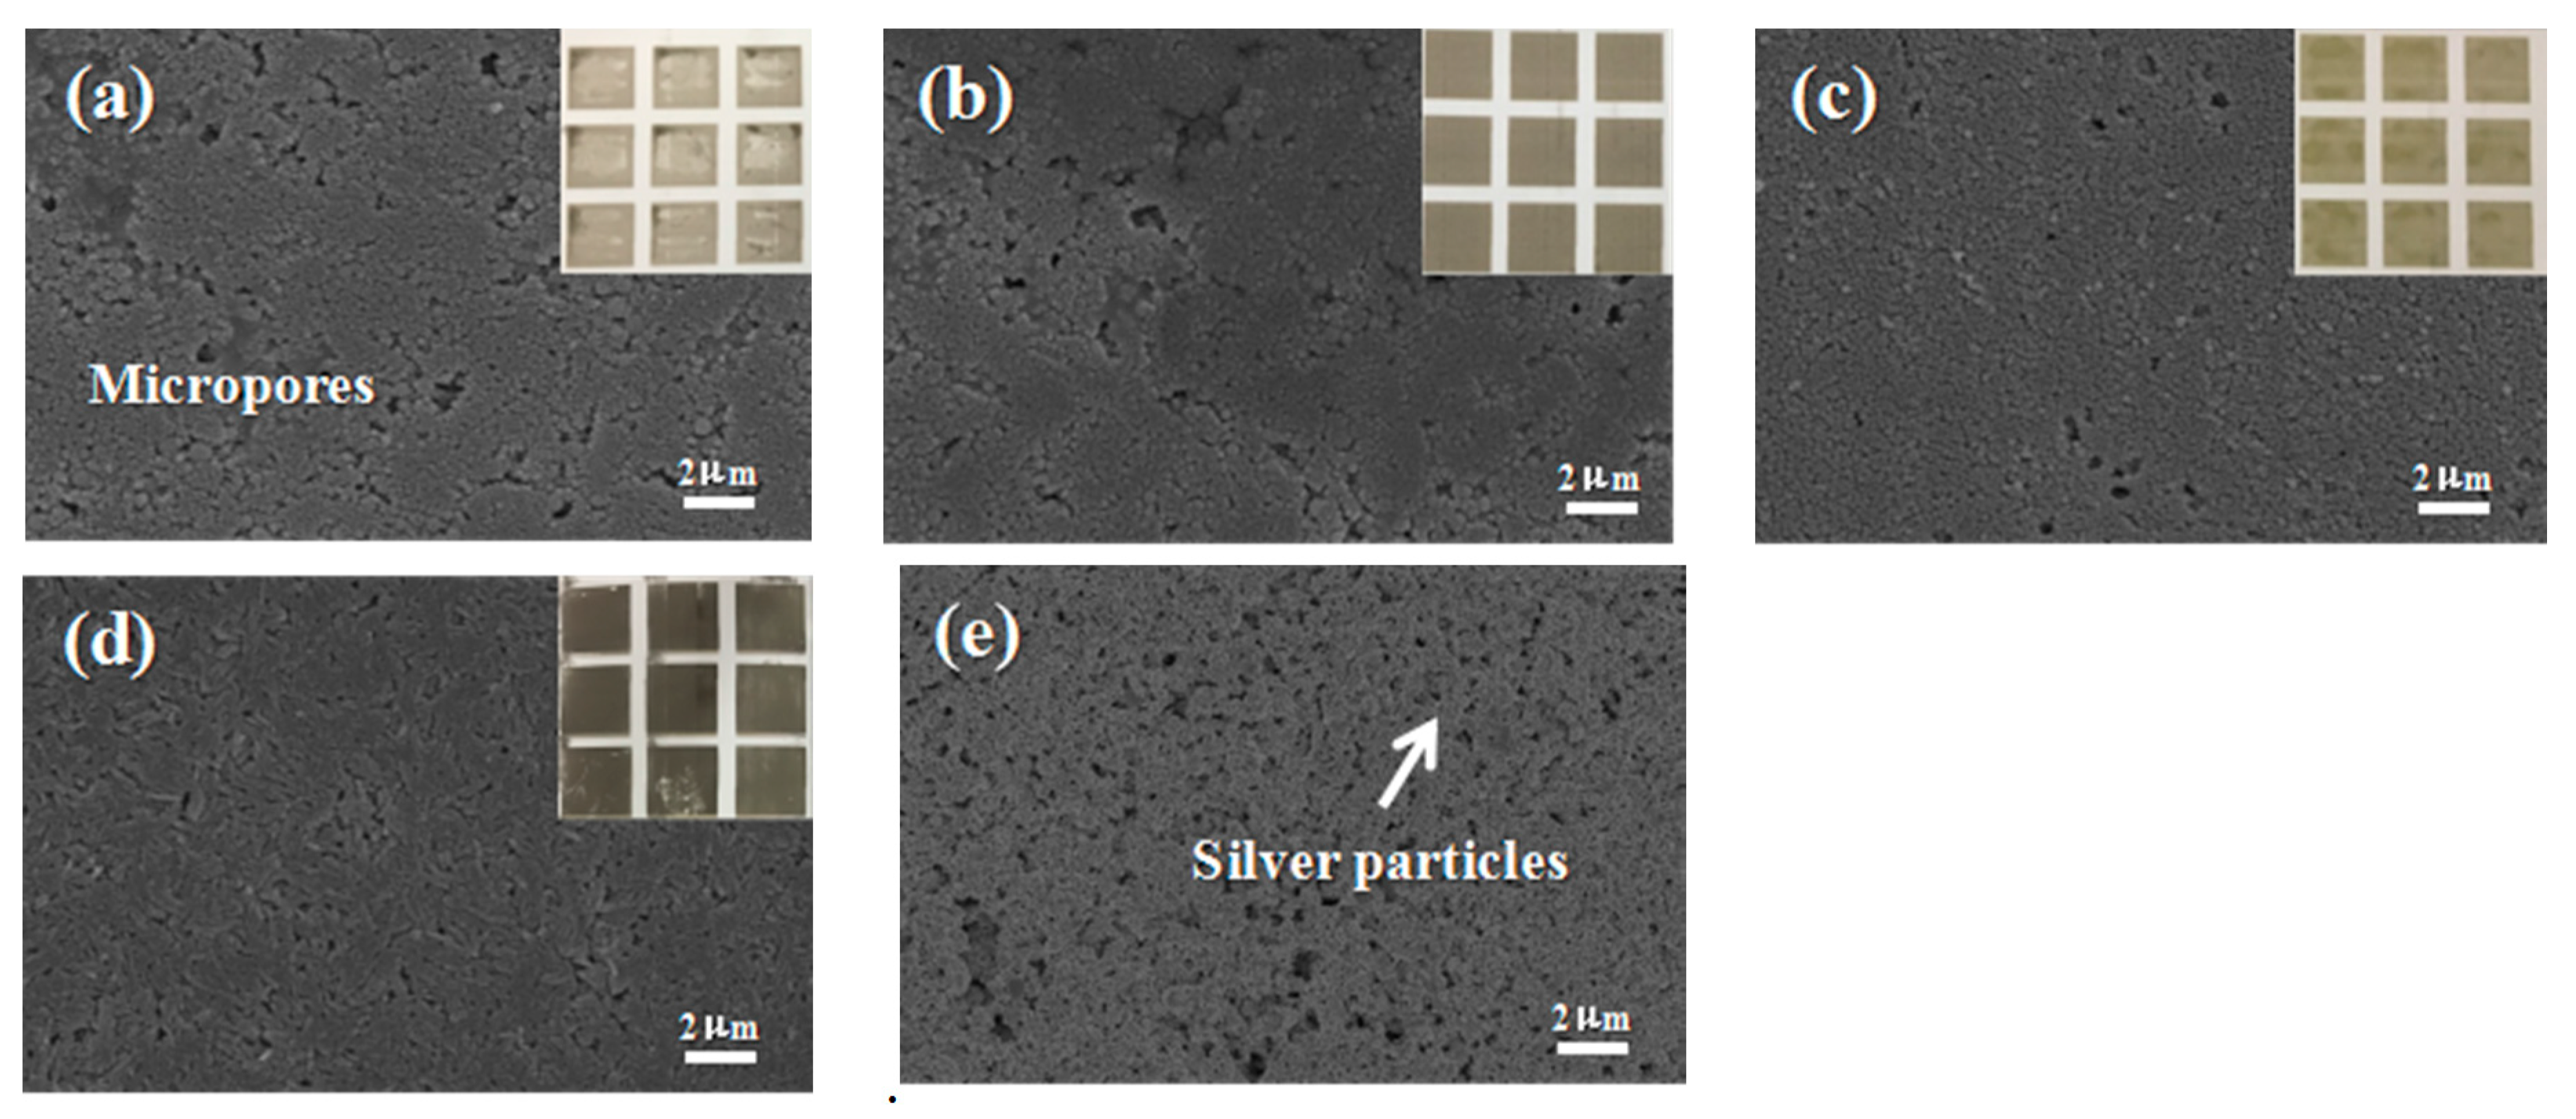
The optimum conductivity of AgNPs on different photo paper substrates such as EPSON, Lucky, FANTAC, and Kodak was investigated. The fabrication of conductive patterns and patterned anodes are illustrated in
Figure 8. A personal computer was used to design conductive patterns which were then inkjet-printed with a home printer (Canon iP1188, Canon, Tokyo Daejeon, Tokyo, Japan). Ink concentration is important for inkjet printing as a much higher concentration can block the nozzles, and much lower concentration may increase the printing times for acquiring appropriate electrodes. Therefore, 15 wt % Ag was chosen for the printed ink.
Figure 8a–d show the photo images of different paper substrates. The optical images of the photo paper showed a homogenous and thin coating of AgNPs on the photo paper. To verify the homogeneity of the AgNPs thin coating on the photo paper, a series of surface morphology SEM images of different photo papers were taken. As shown in
Figure 8a–d. The conductivity of AgNPs on the different paper substrates was tested by measuring their respective resistance, which all showed a high value of conductivity. The Lucky photo paper was chosen for the preparation of the electronic circuit and electrodes due to its flexibility, smooth surface, fine pore size, and moderate absorption of the ink. Other paper substrates were unevenly coated with ink stains as the large sized pores of these paper surfaces led the AgNPs to spread and become trapped among the paper fibers, causing a discontinuity of the conductive track. Therefore, the Lucky photo paper was selected for electrode preparation.
Figure 8e shows the SEM of the Lucky photo paper printed Ag patterns, and the macroscopic picture is provided in
Figure 8d.
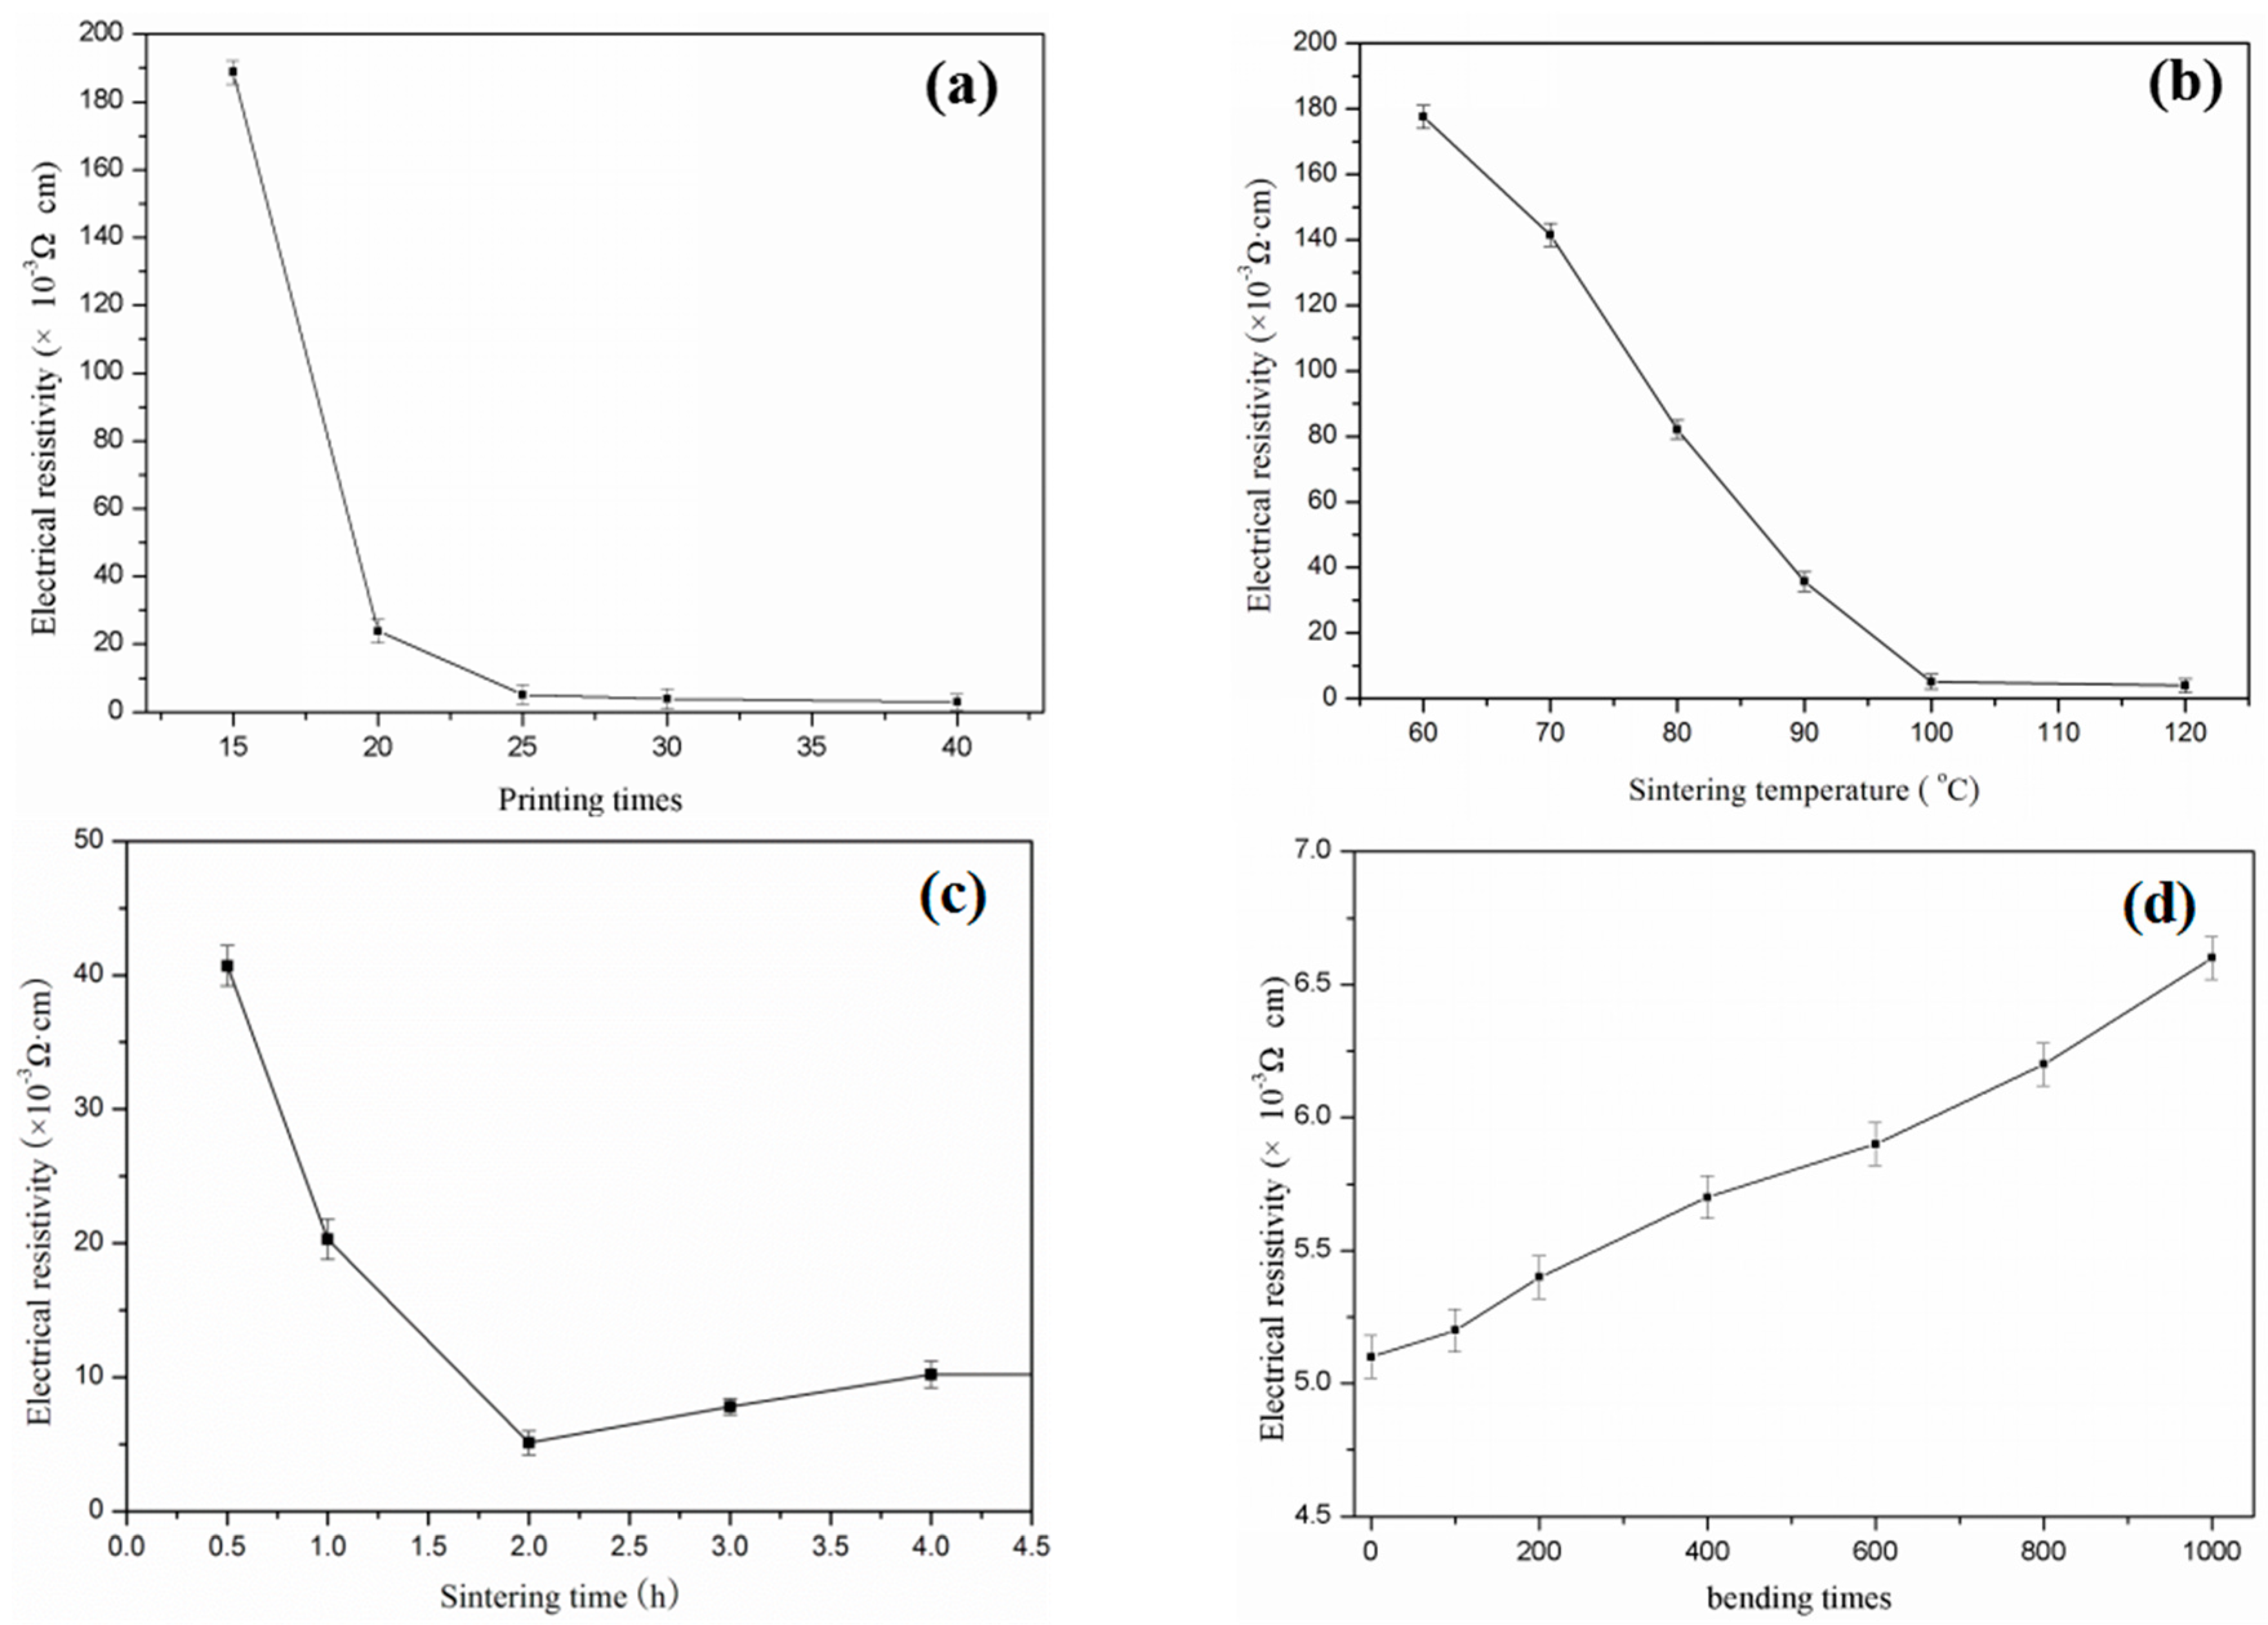
The Ag ink was used to inkjet conductive patterns. The electrical resistance reduced rapidly with the increasing number of overprinting. It was also observed that adding Ag nanoparticles significantly improved conductivity, which was mainly due to the good conductivity of Ag nanoparticles and the good connection between the Ag and photo paper. After being printed 40 times (
Figure 9a), the conductive pattern fabricated by the Ag ink formed a 4 × 10
−3 Ω·cm sheet resistivity. However, the decreasing resistivity was not obvious after being printed 25 times, making 25 the best number of printed times.
Figure 9b,c show the relationship between the resistivity of the printed Ag patterns and the sintering temperature, resistivity, and sintering time, respectively. The variation of sintering temperature and time are the most important parameters that affect the resistivity of AgNPs on the substrate materials. The stability and conductivity of the electronic track was tested by changing the sintering temperatures from 60 to 120 °C. The pattern was printed 25 times and sintered for 120 min. The best conductivity that the thin film AgNPs obtained was when the sintering temperature was 120 °C, as sintering temperatures over this decreased resistivity. The sintering time also impacted on the conductivity of the AgNPs pattern on the photo paper substrate. The effects of sintering time on conductivity were studied by heating the printed track at 120 °C with different interval times of 0.5, 1, 2, 4, and 6 h. The results of the conductivity of AgNPs at different sintering time are given in
Figure 9c. A high conductivity was acquired when the sintering time was 2 h; moreover, there was no damage to the paper substrate after heating. It was best to obtain a maximum conductivity of AgNPs on the paper substrate. After the sample was bended 1000 times, conductivity decreased by 29.4% (
Figure 9d).
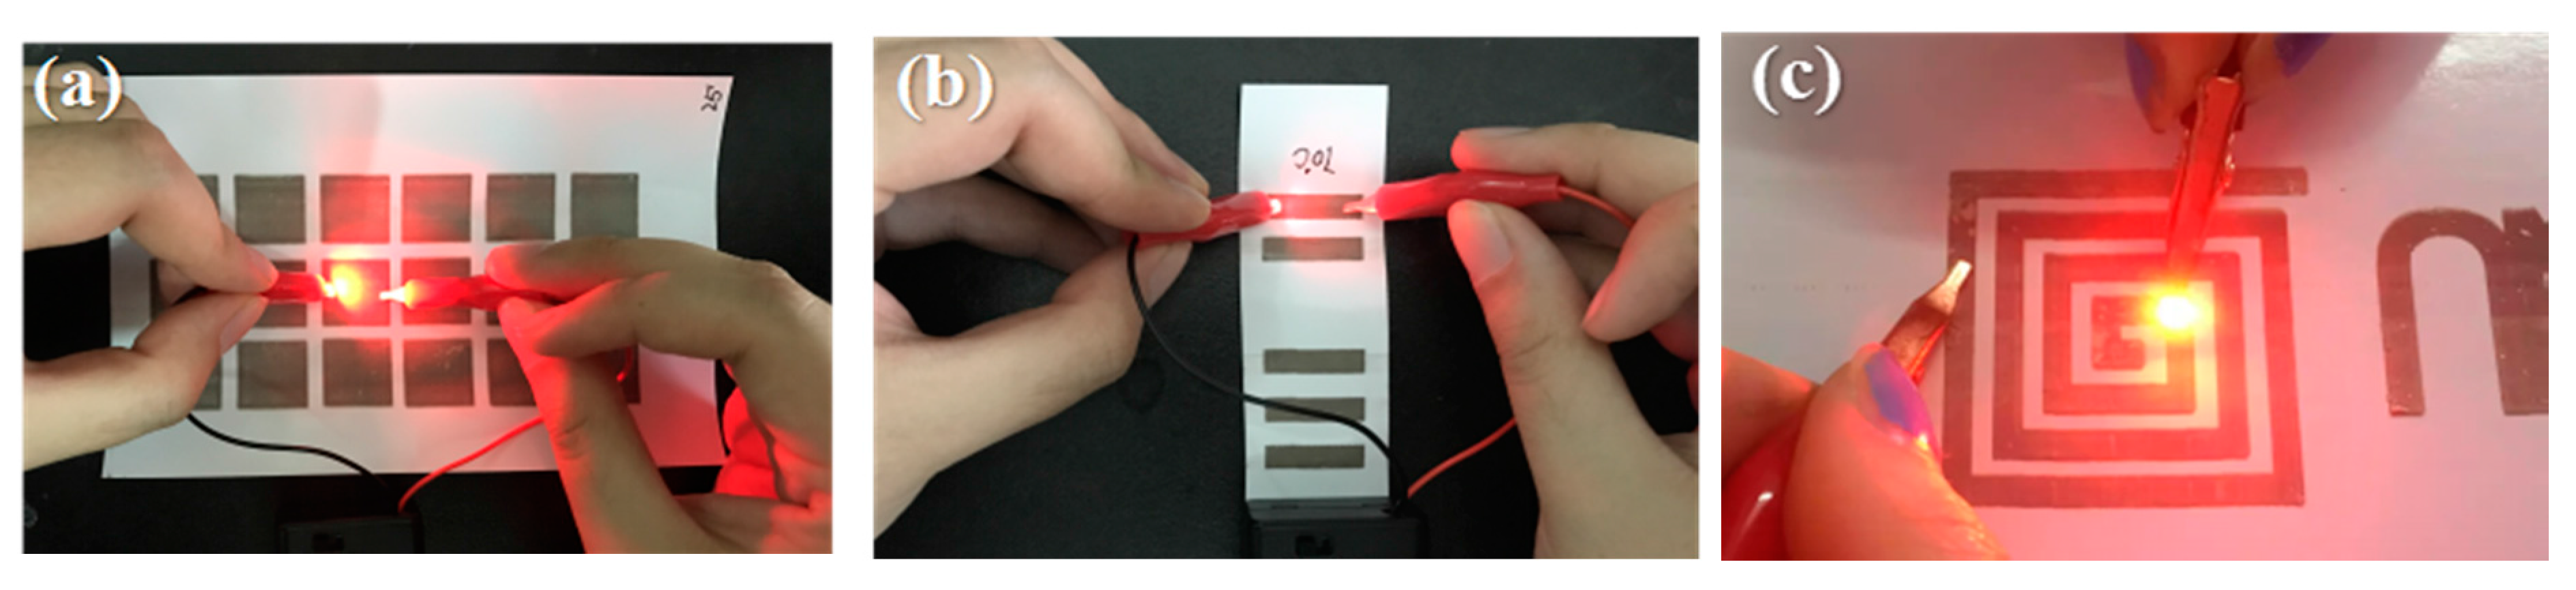
Furthermore, Ag conductive patterns were used to demonstrate the lighting of an LED bulb using a 9 V battery, as shown in
Figure 10. This result demonstrated that the prepared conductive track could be used as an electronic circuit and also applied in other electronic applications.

