
Static and Fatigue Behavior Investigation of Artificial Notched Steel Reinforcement


Abstract
:1. Introduction
2. Experimental Program
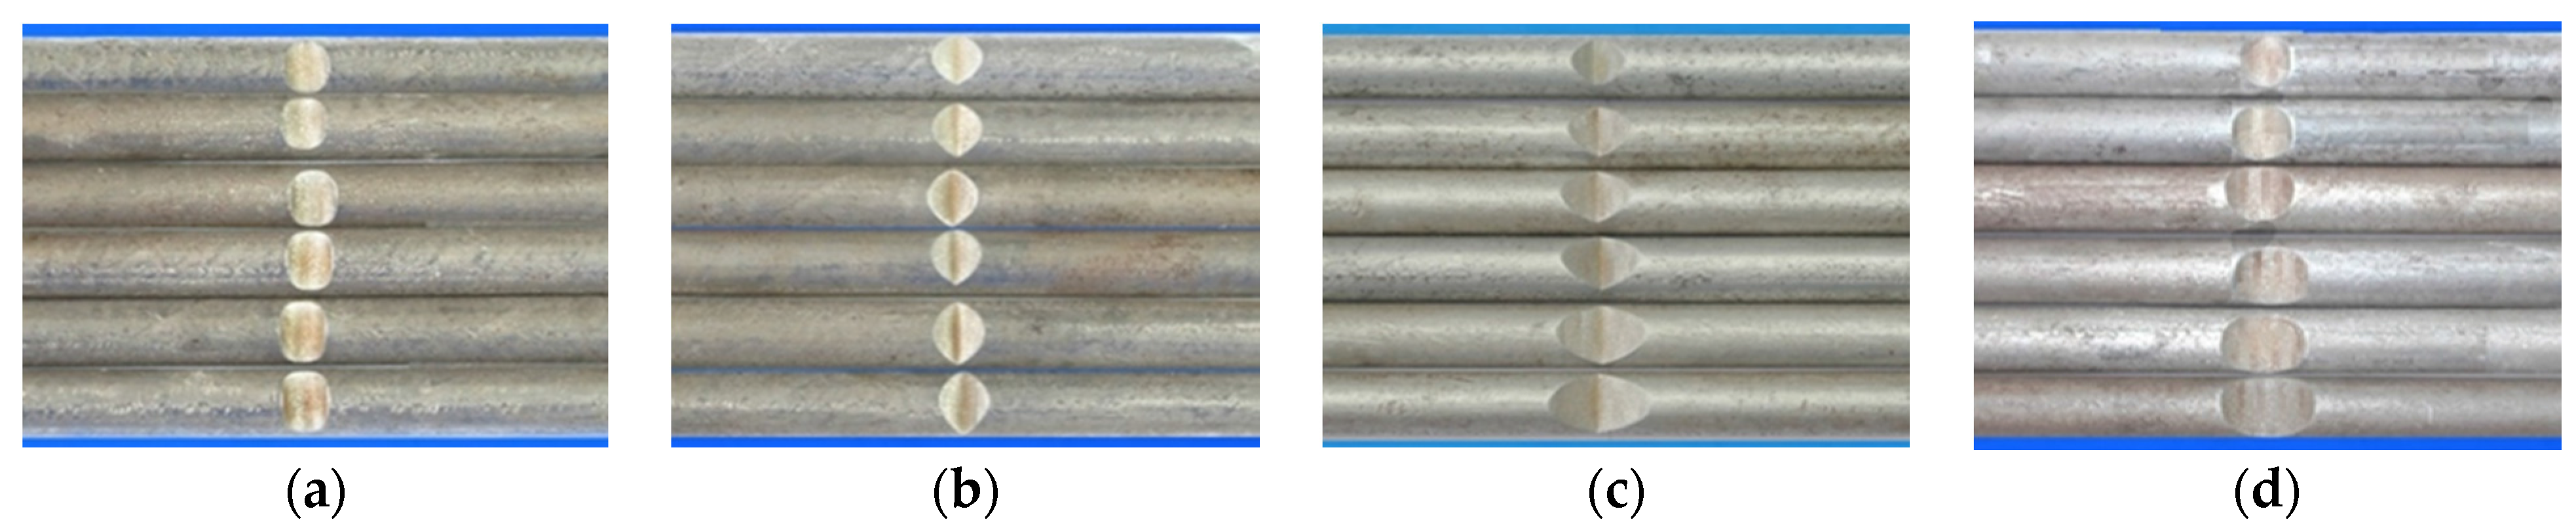
2.1. Specimens Design
2.2. Loading Procedure
3. Results and Discussion
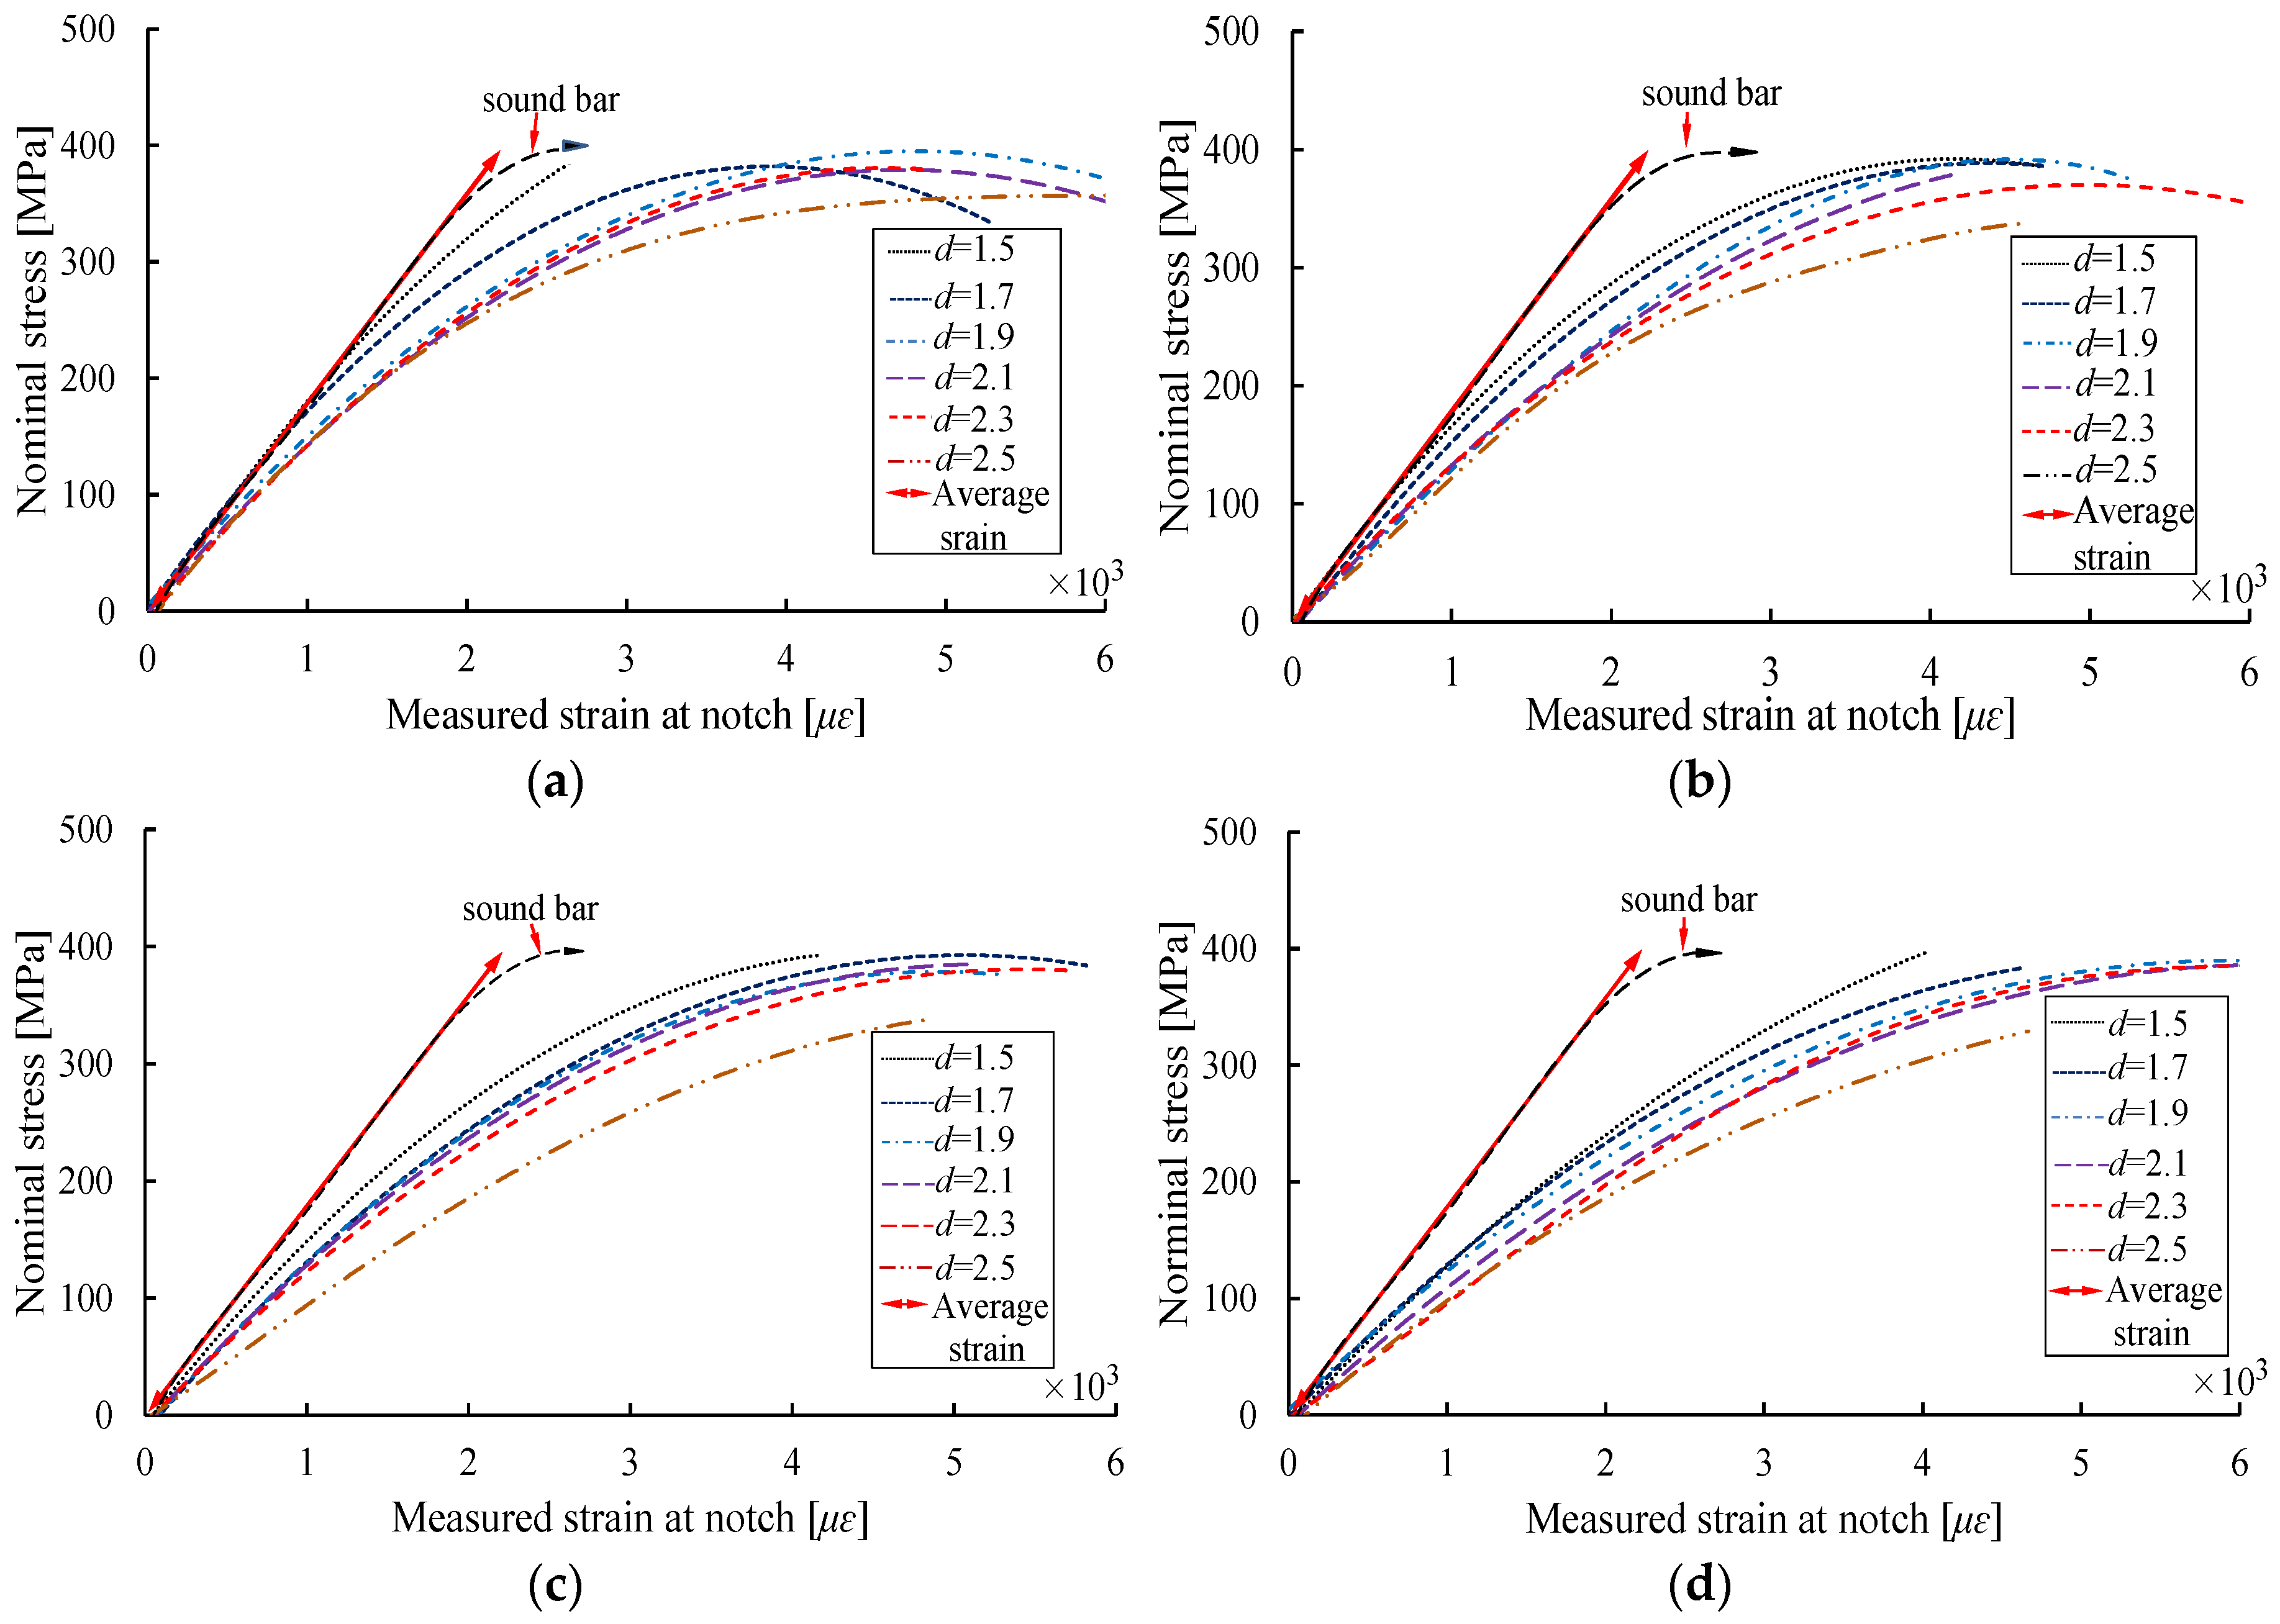
3.1. Static Tensile Testing
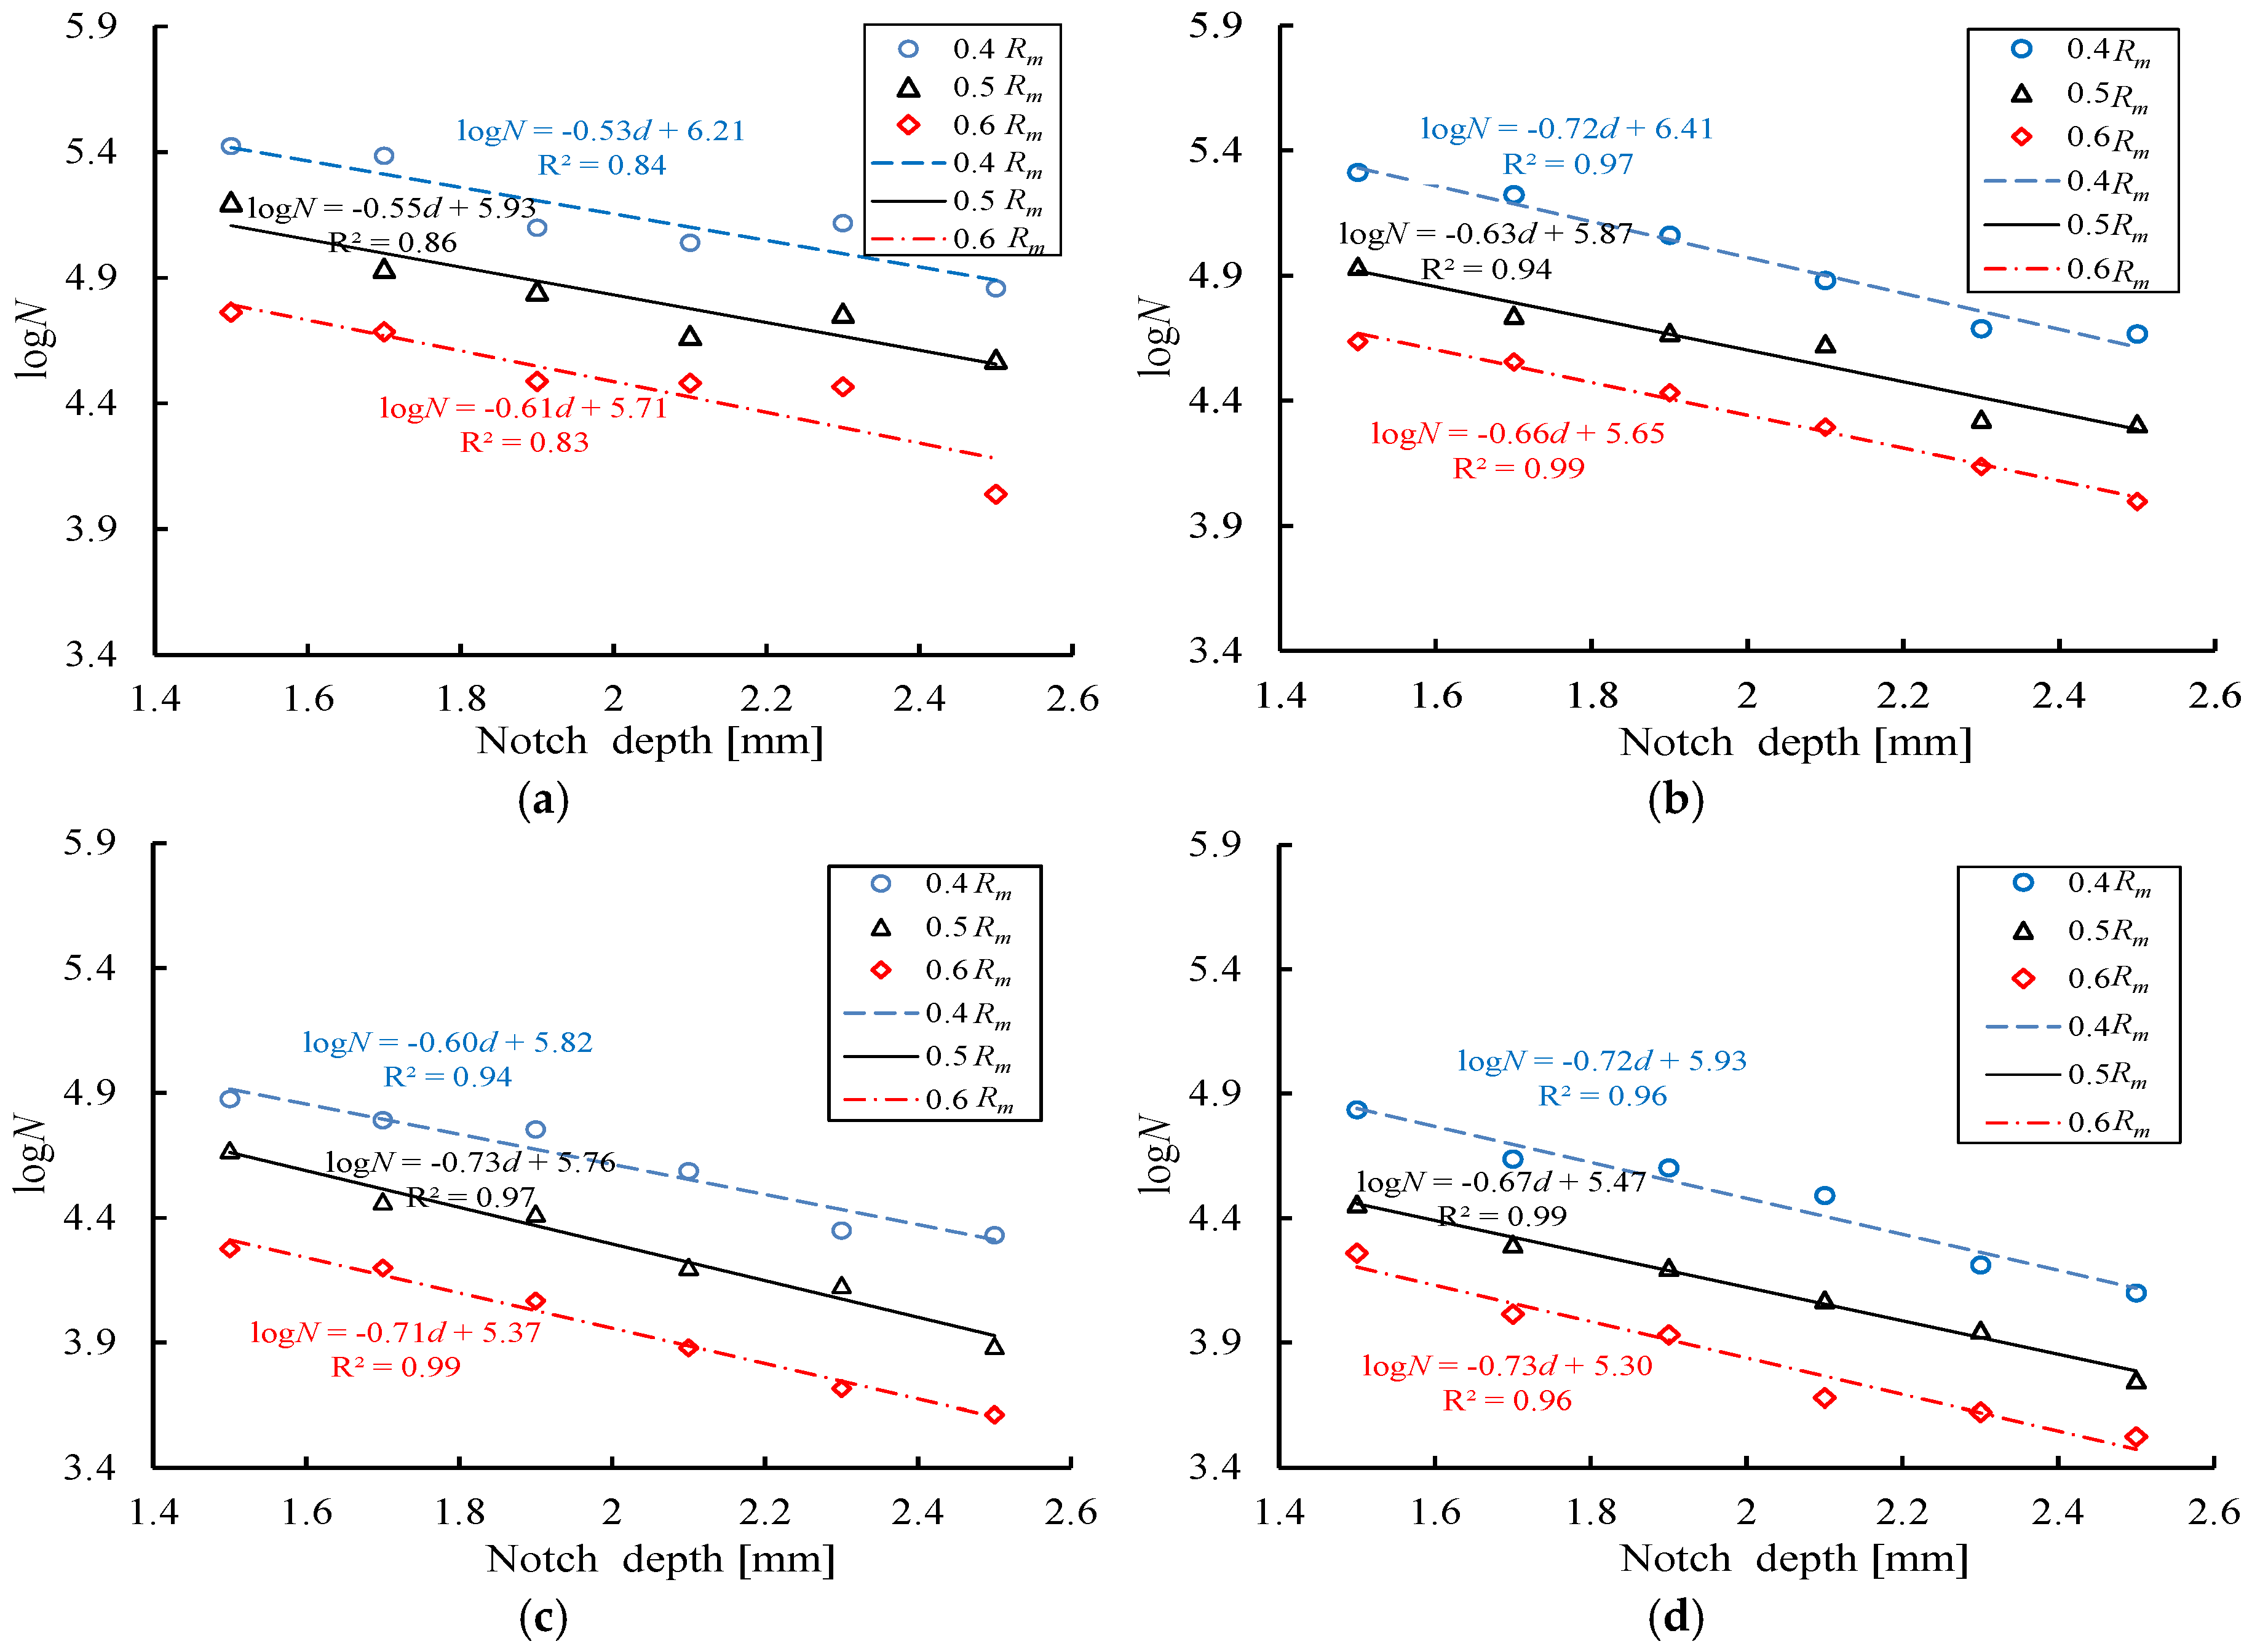
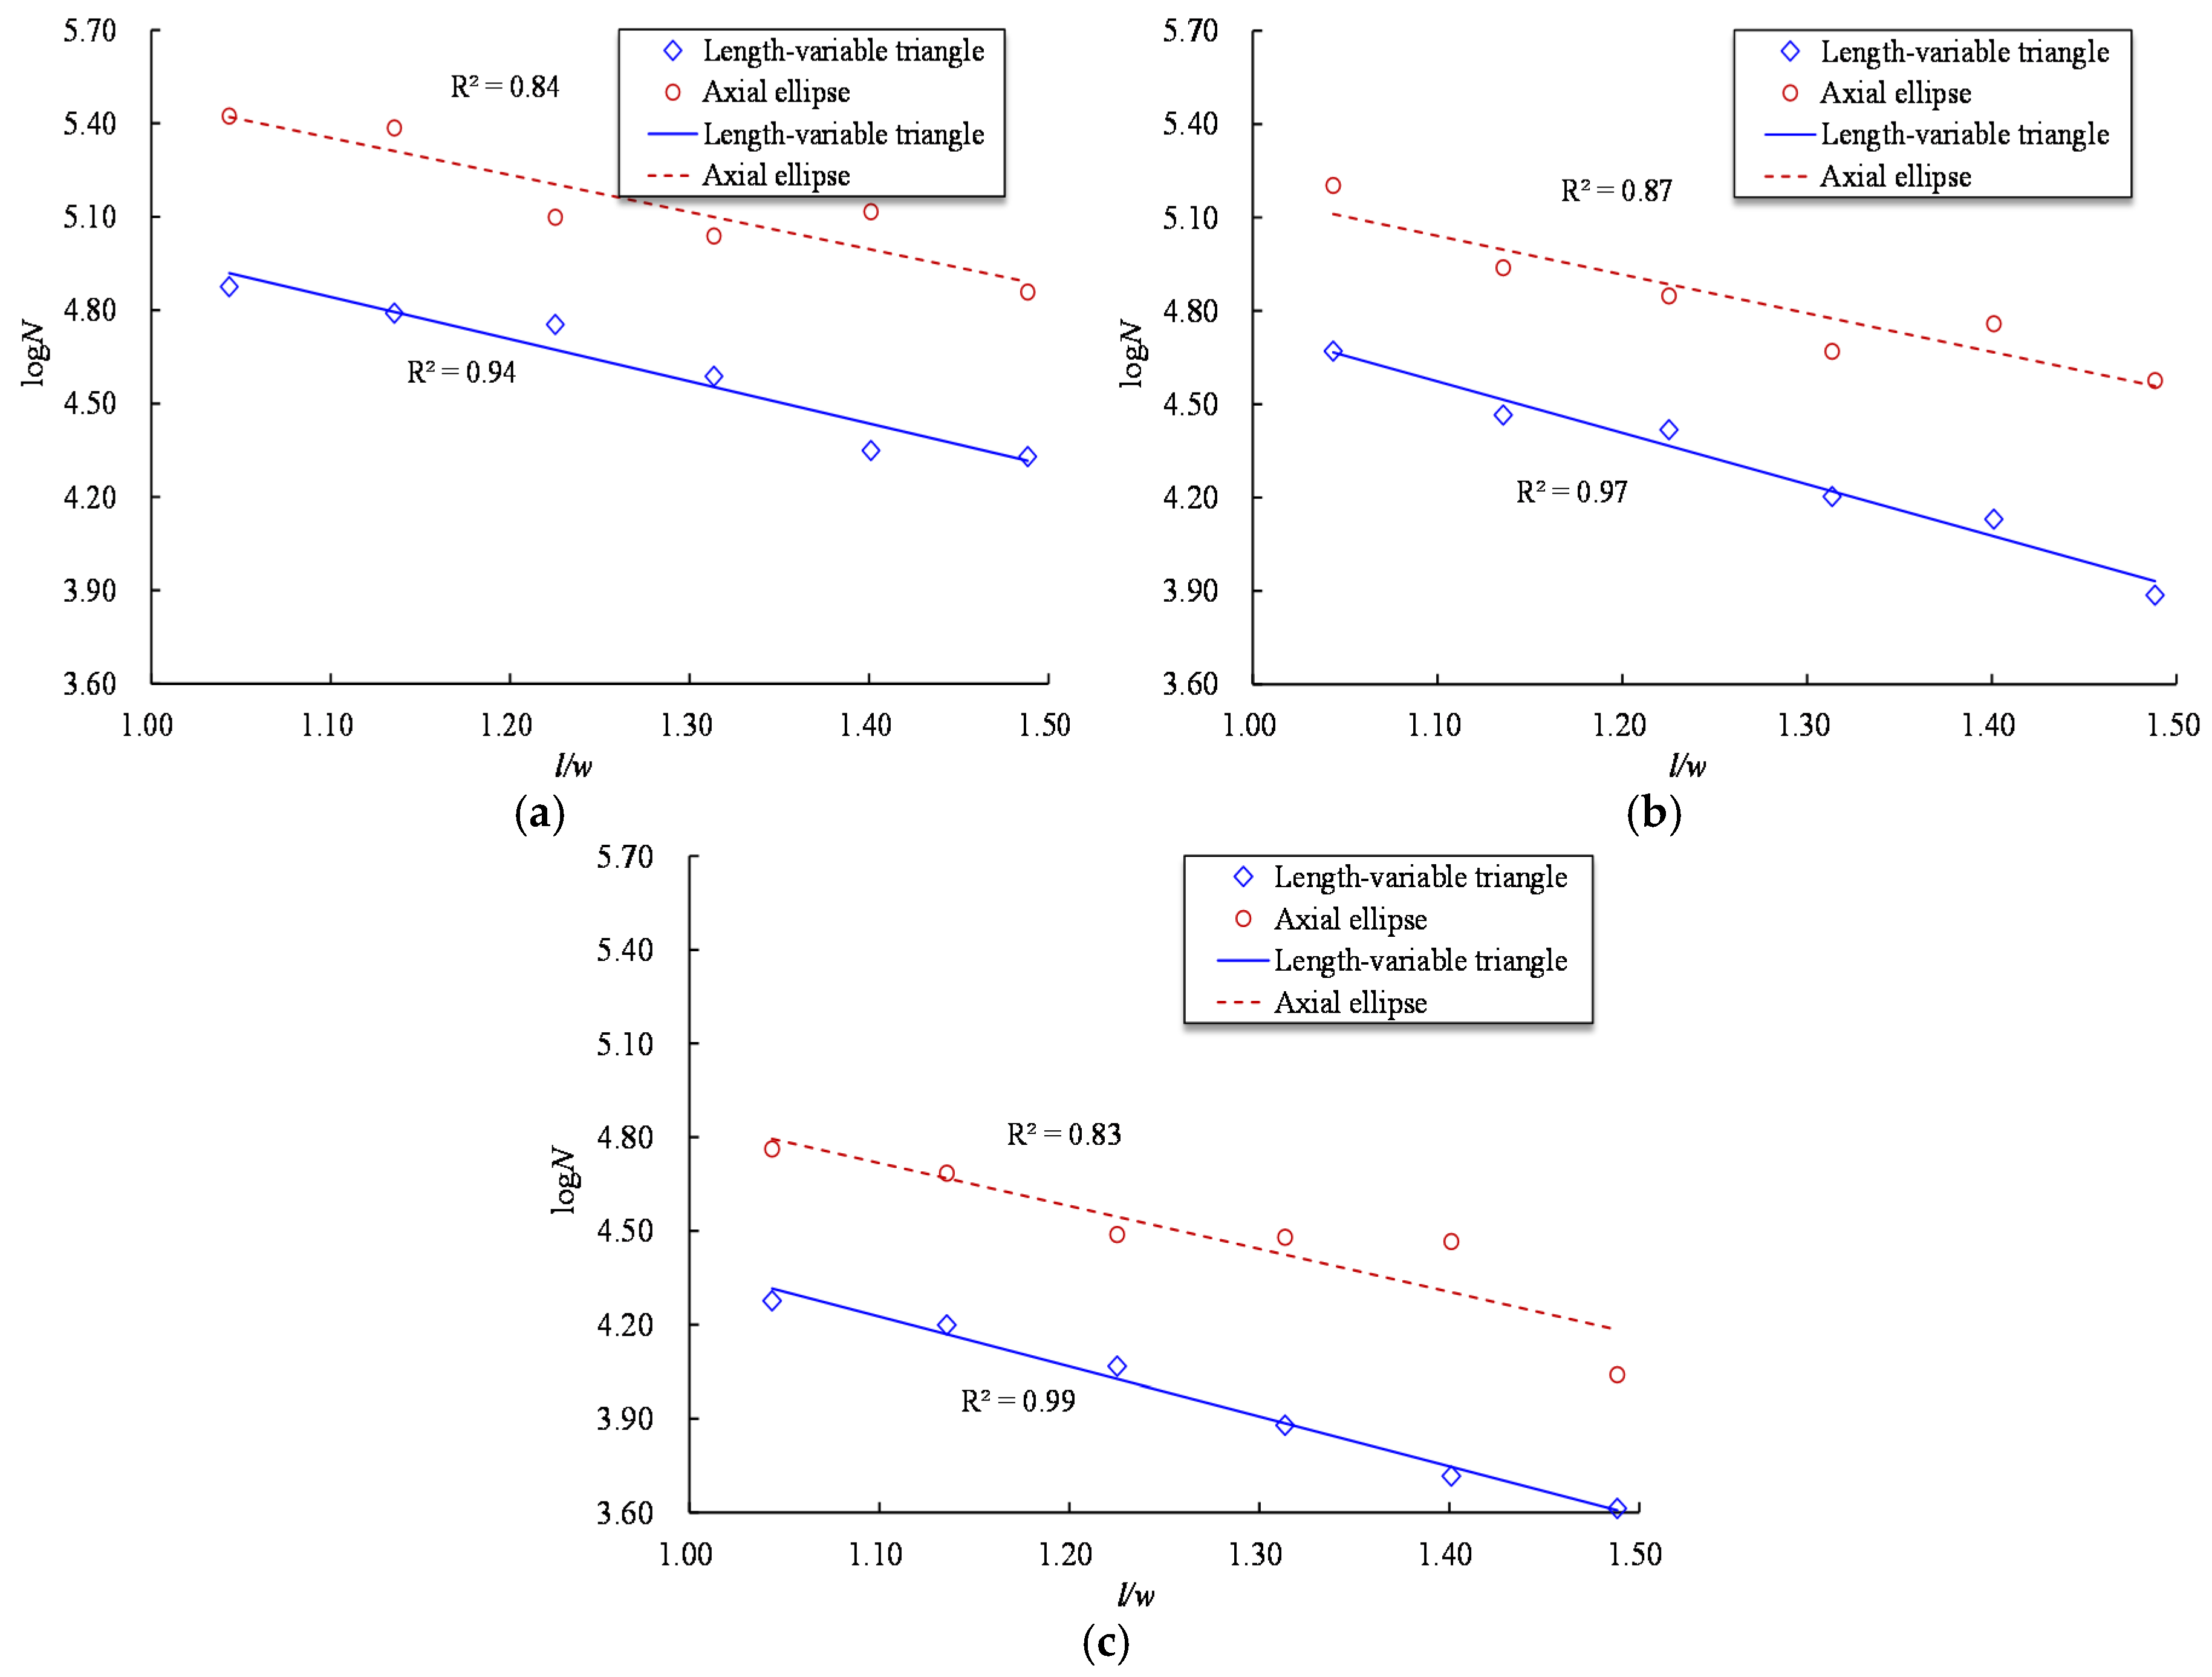
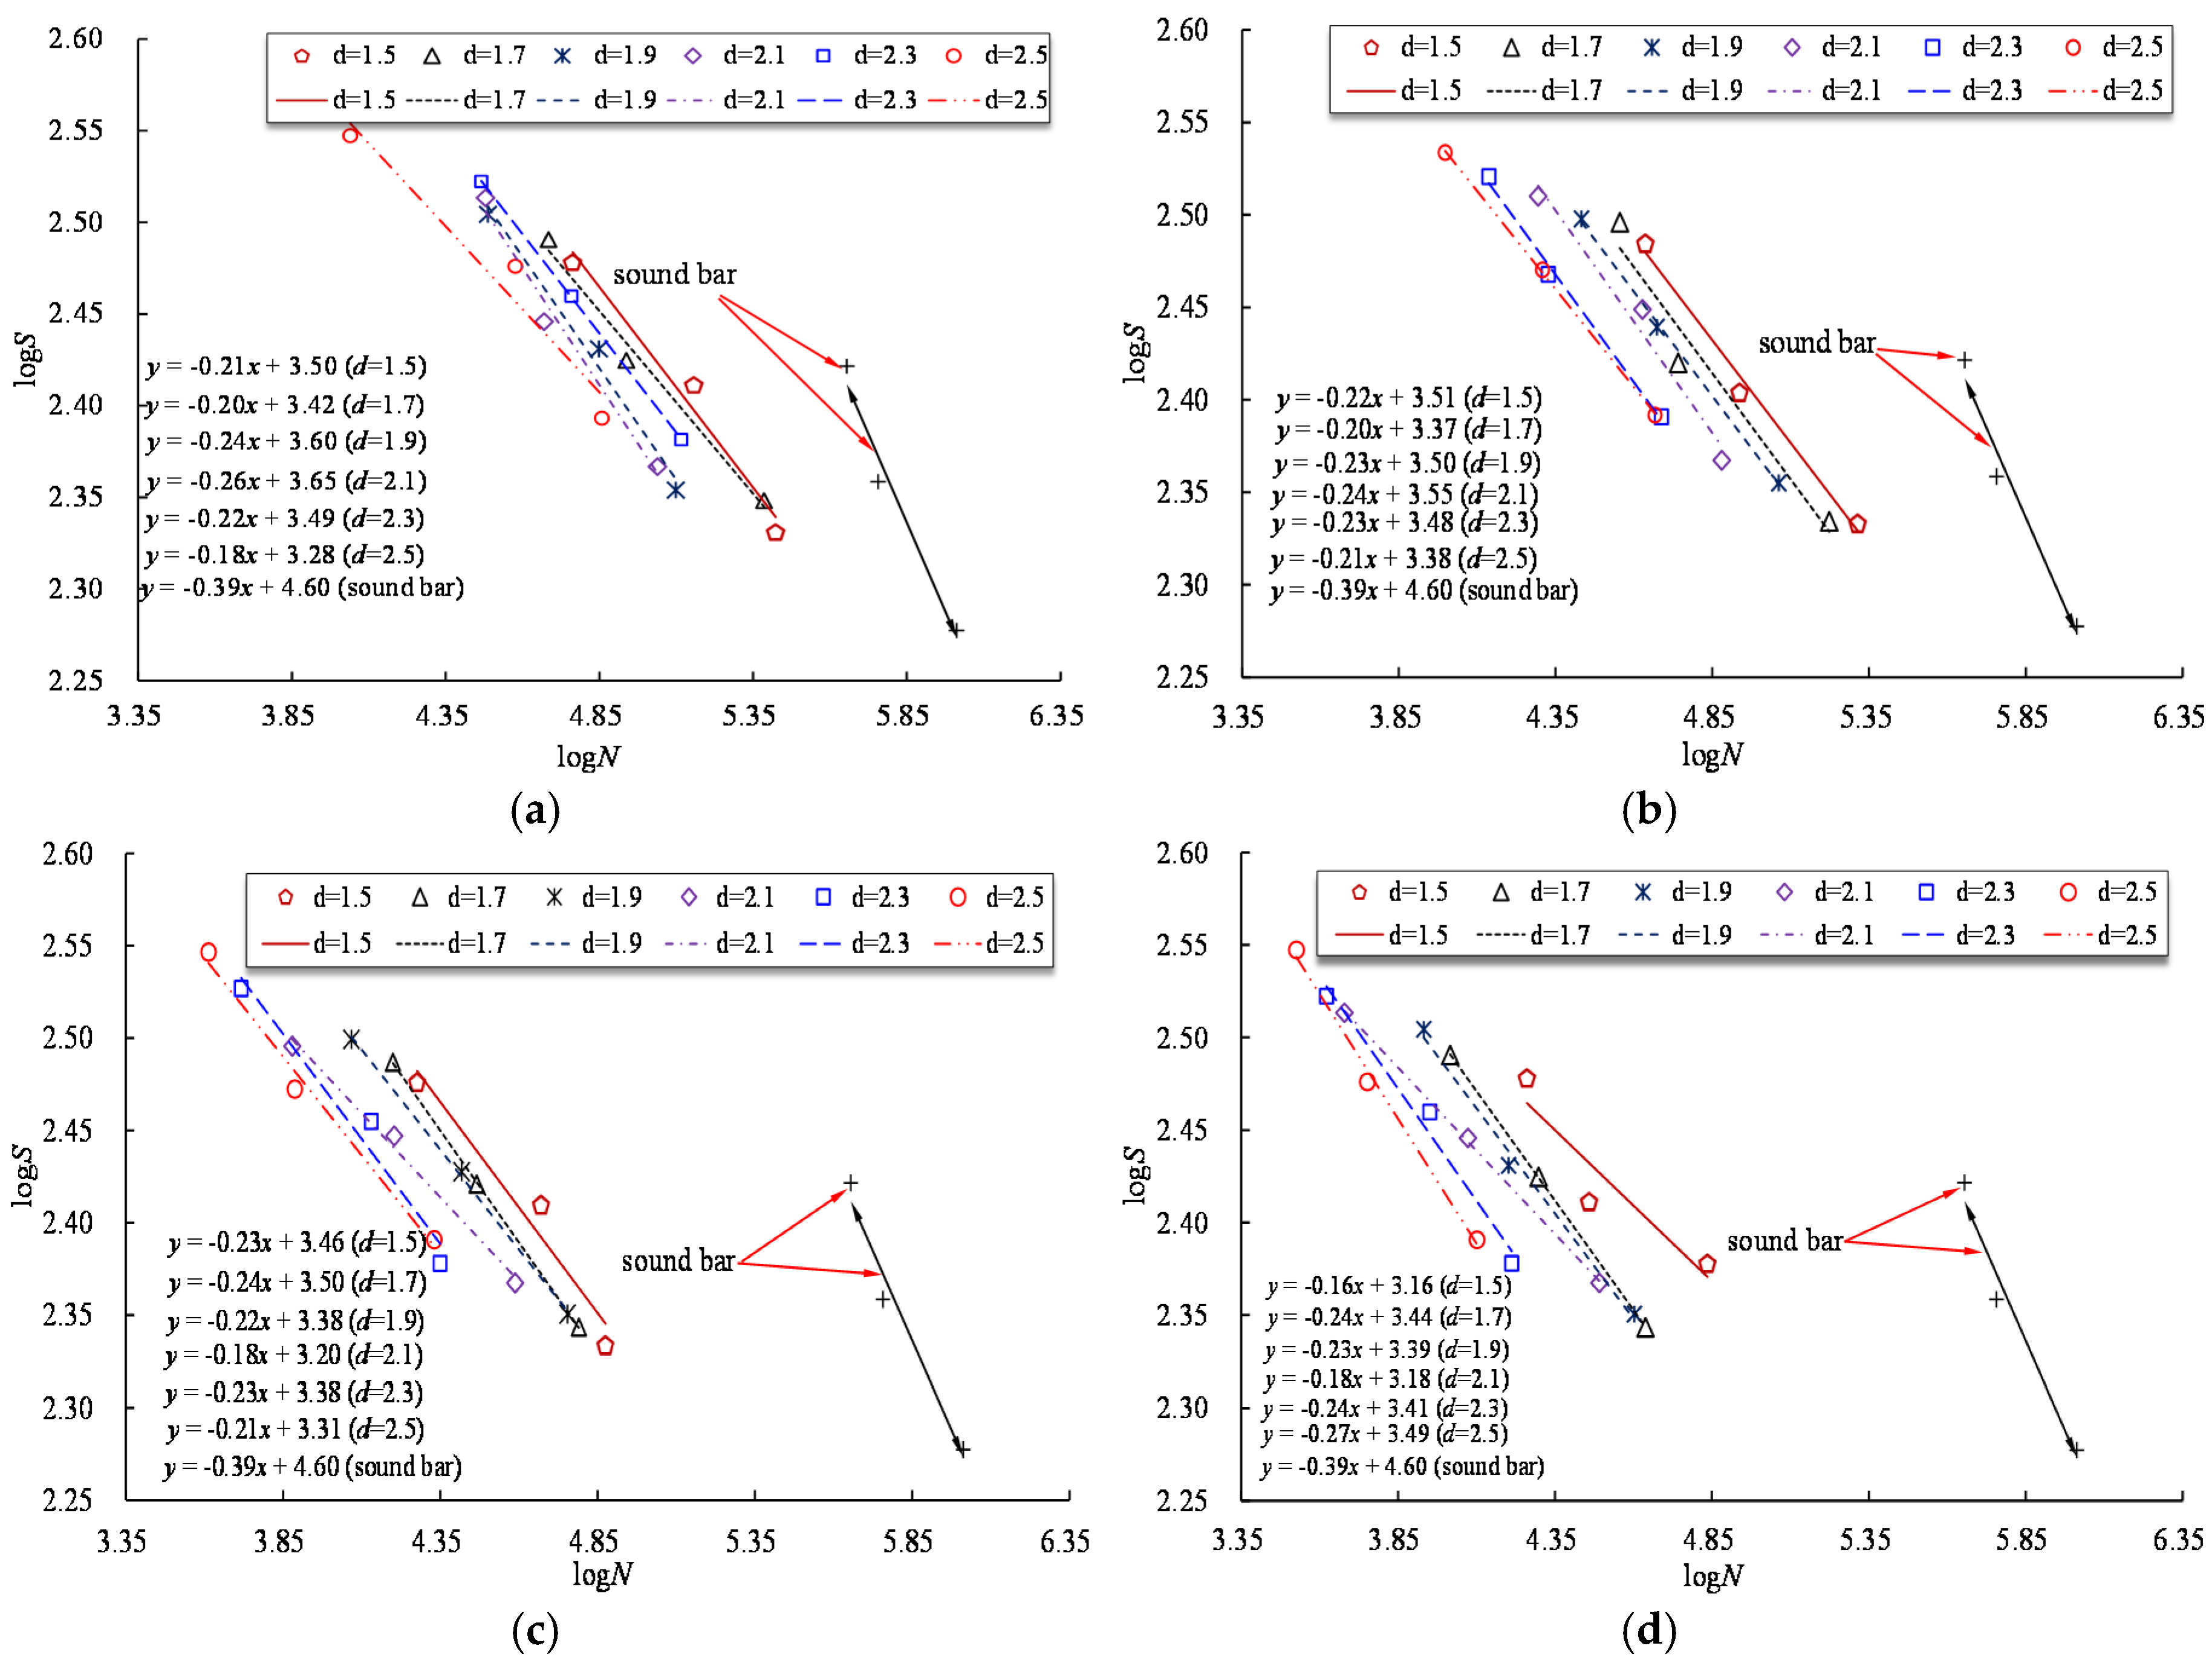
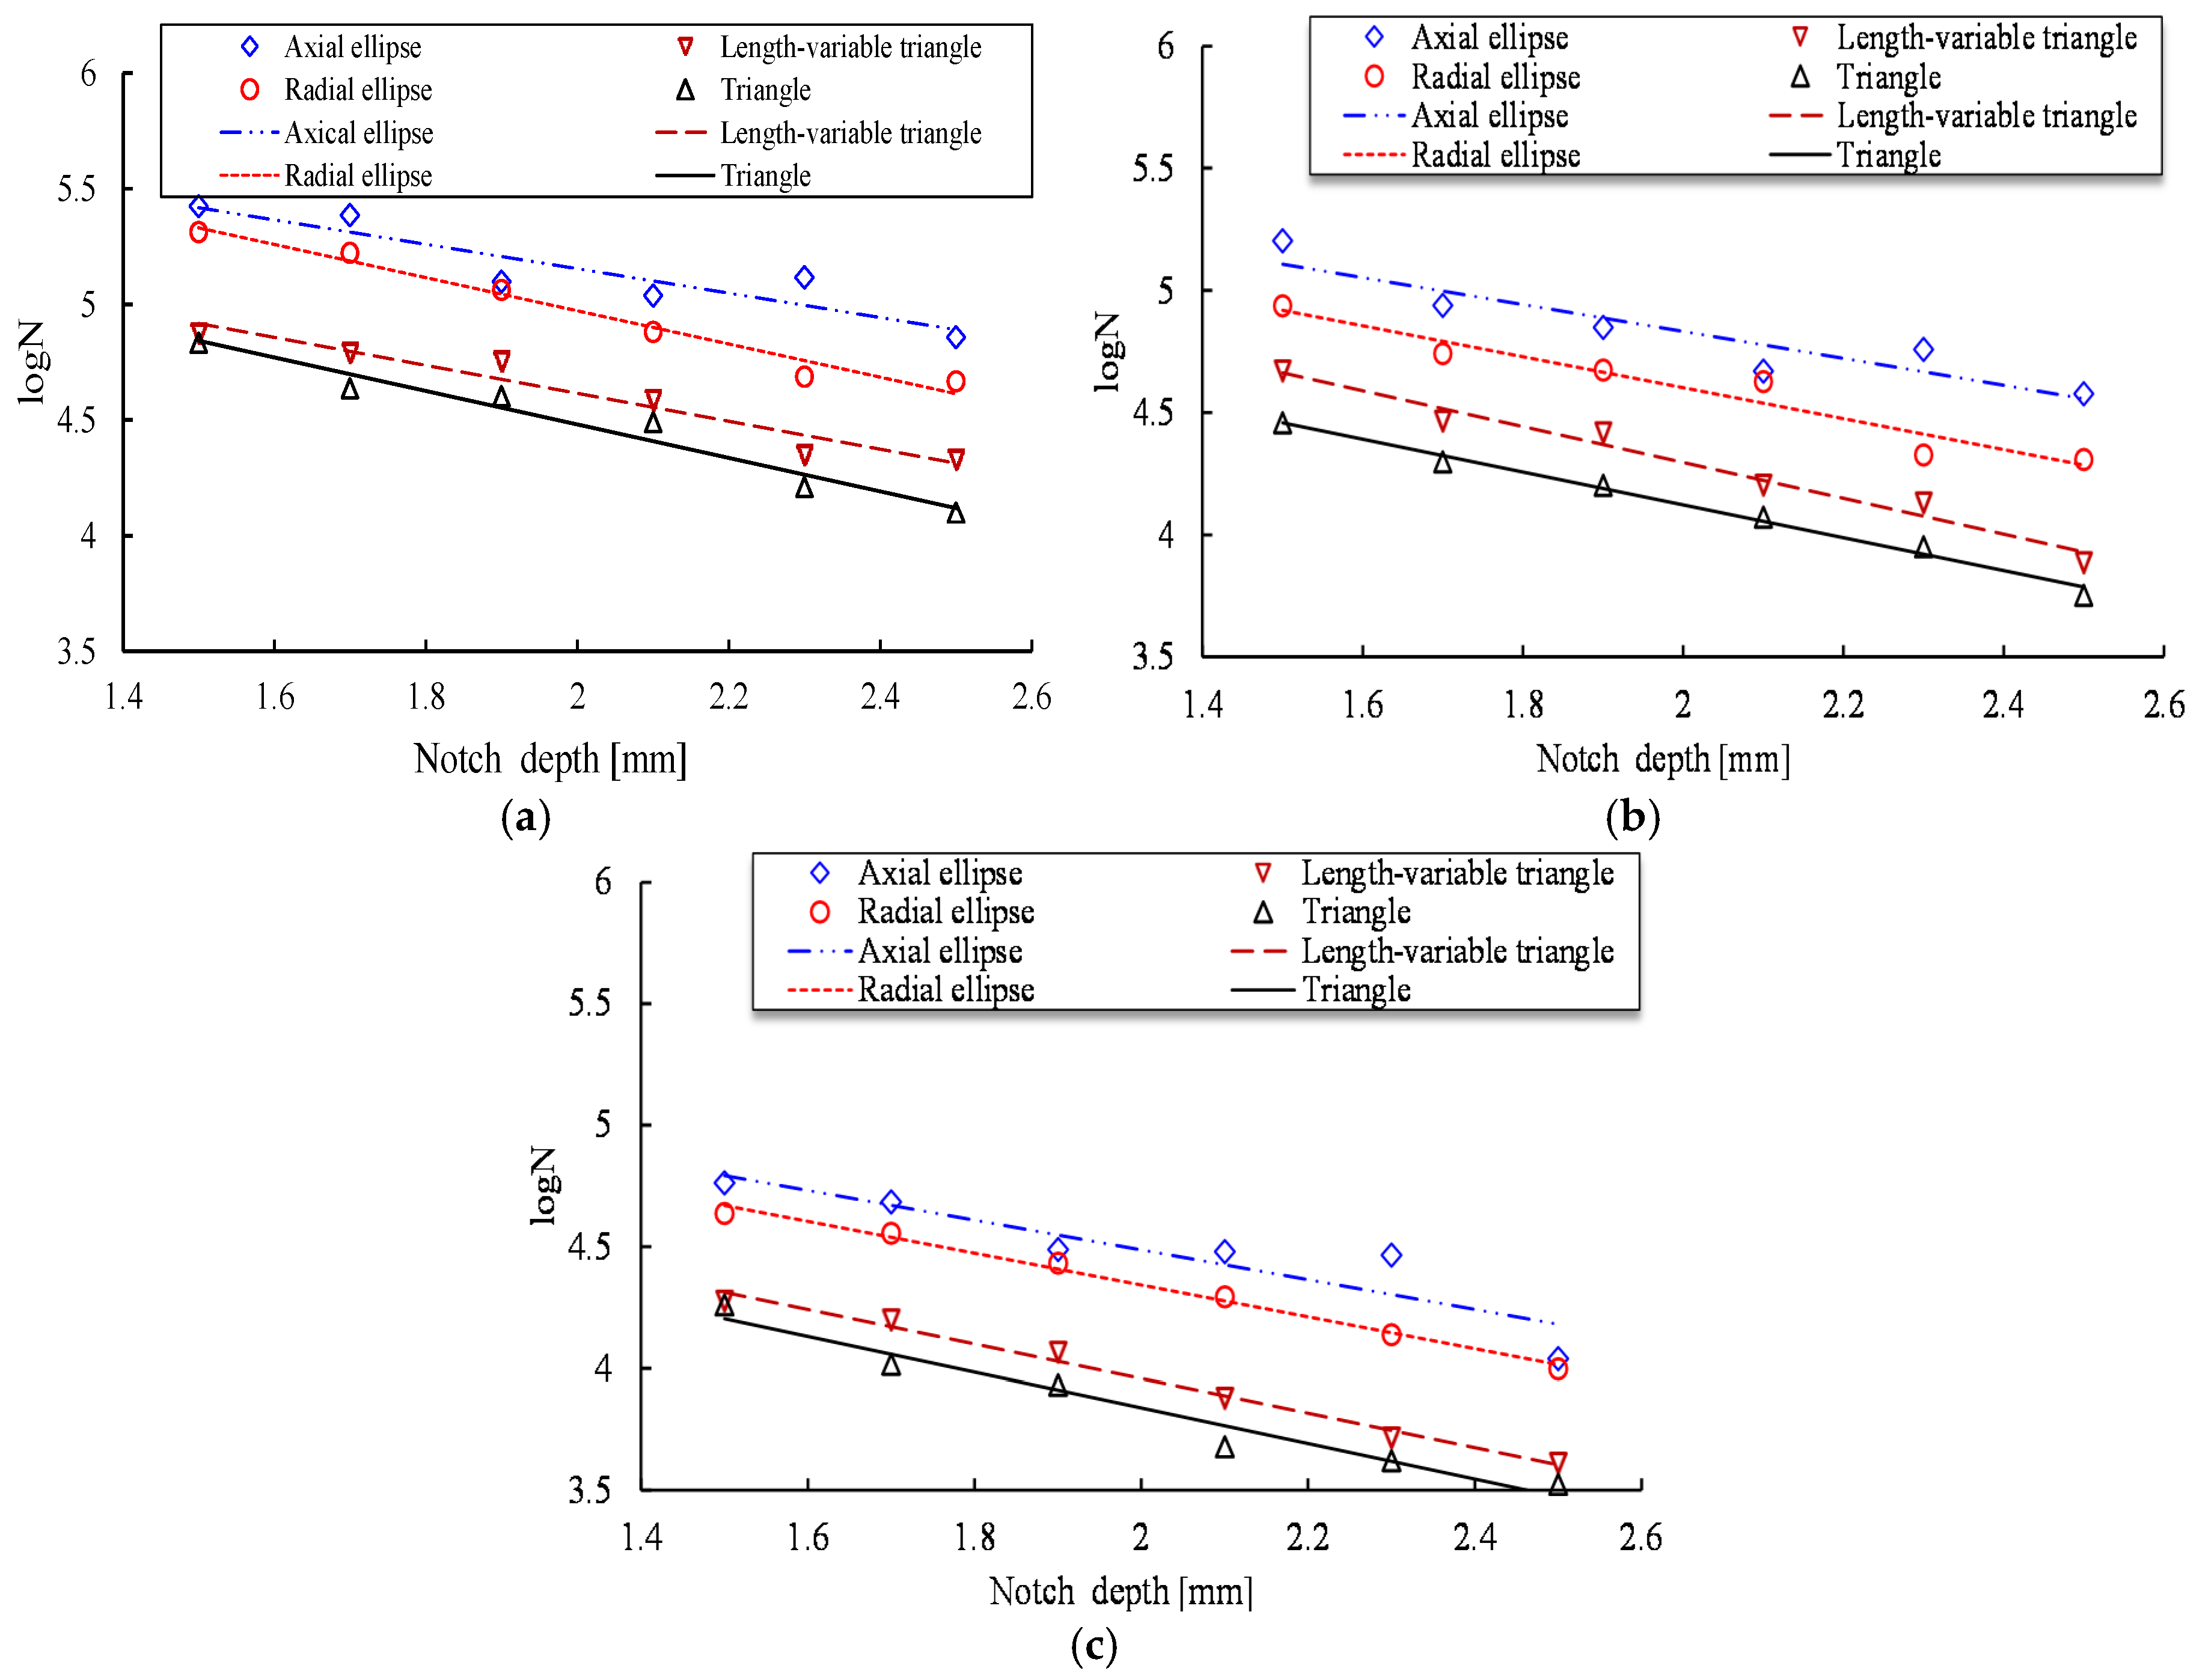
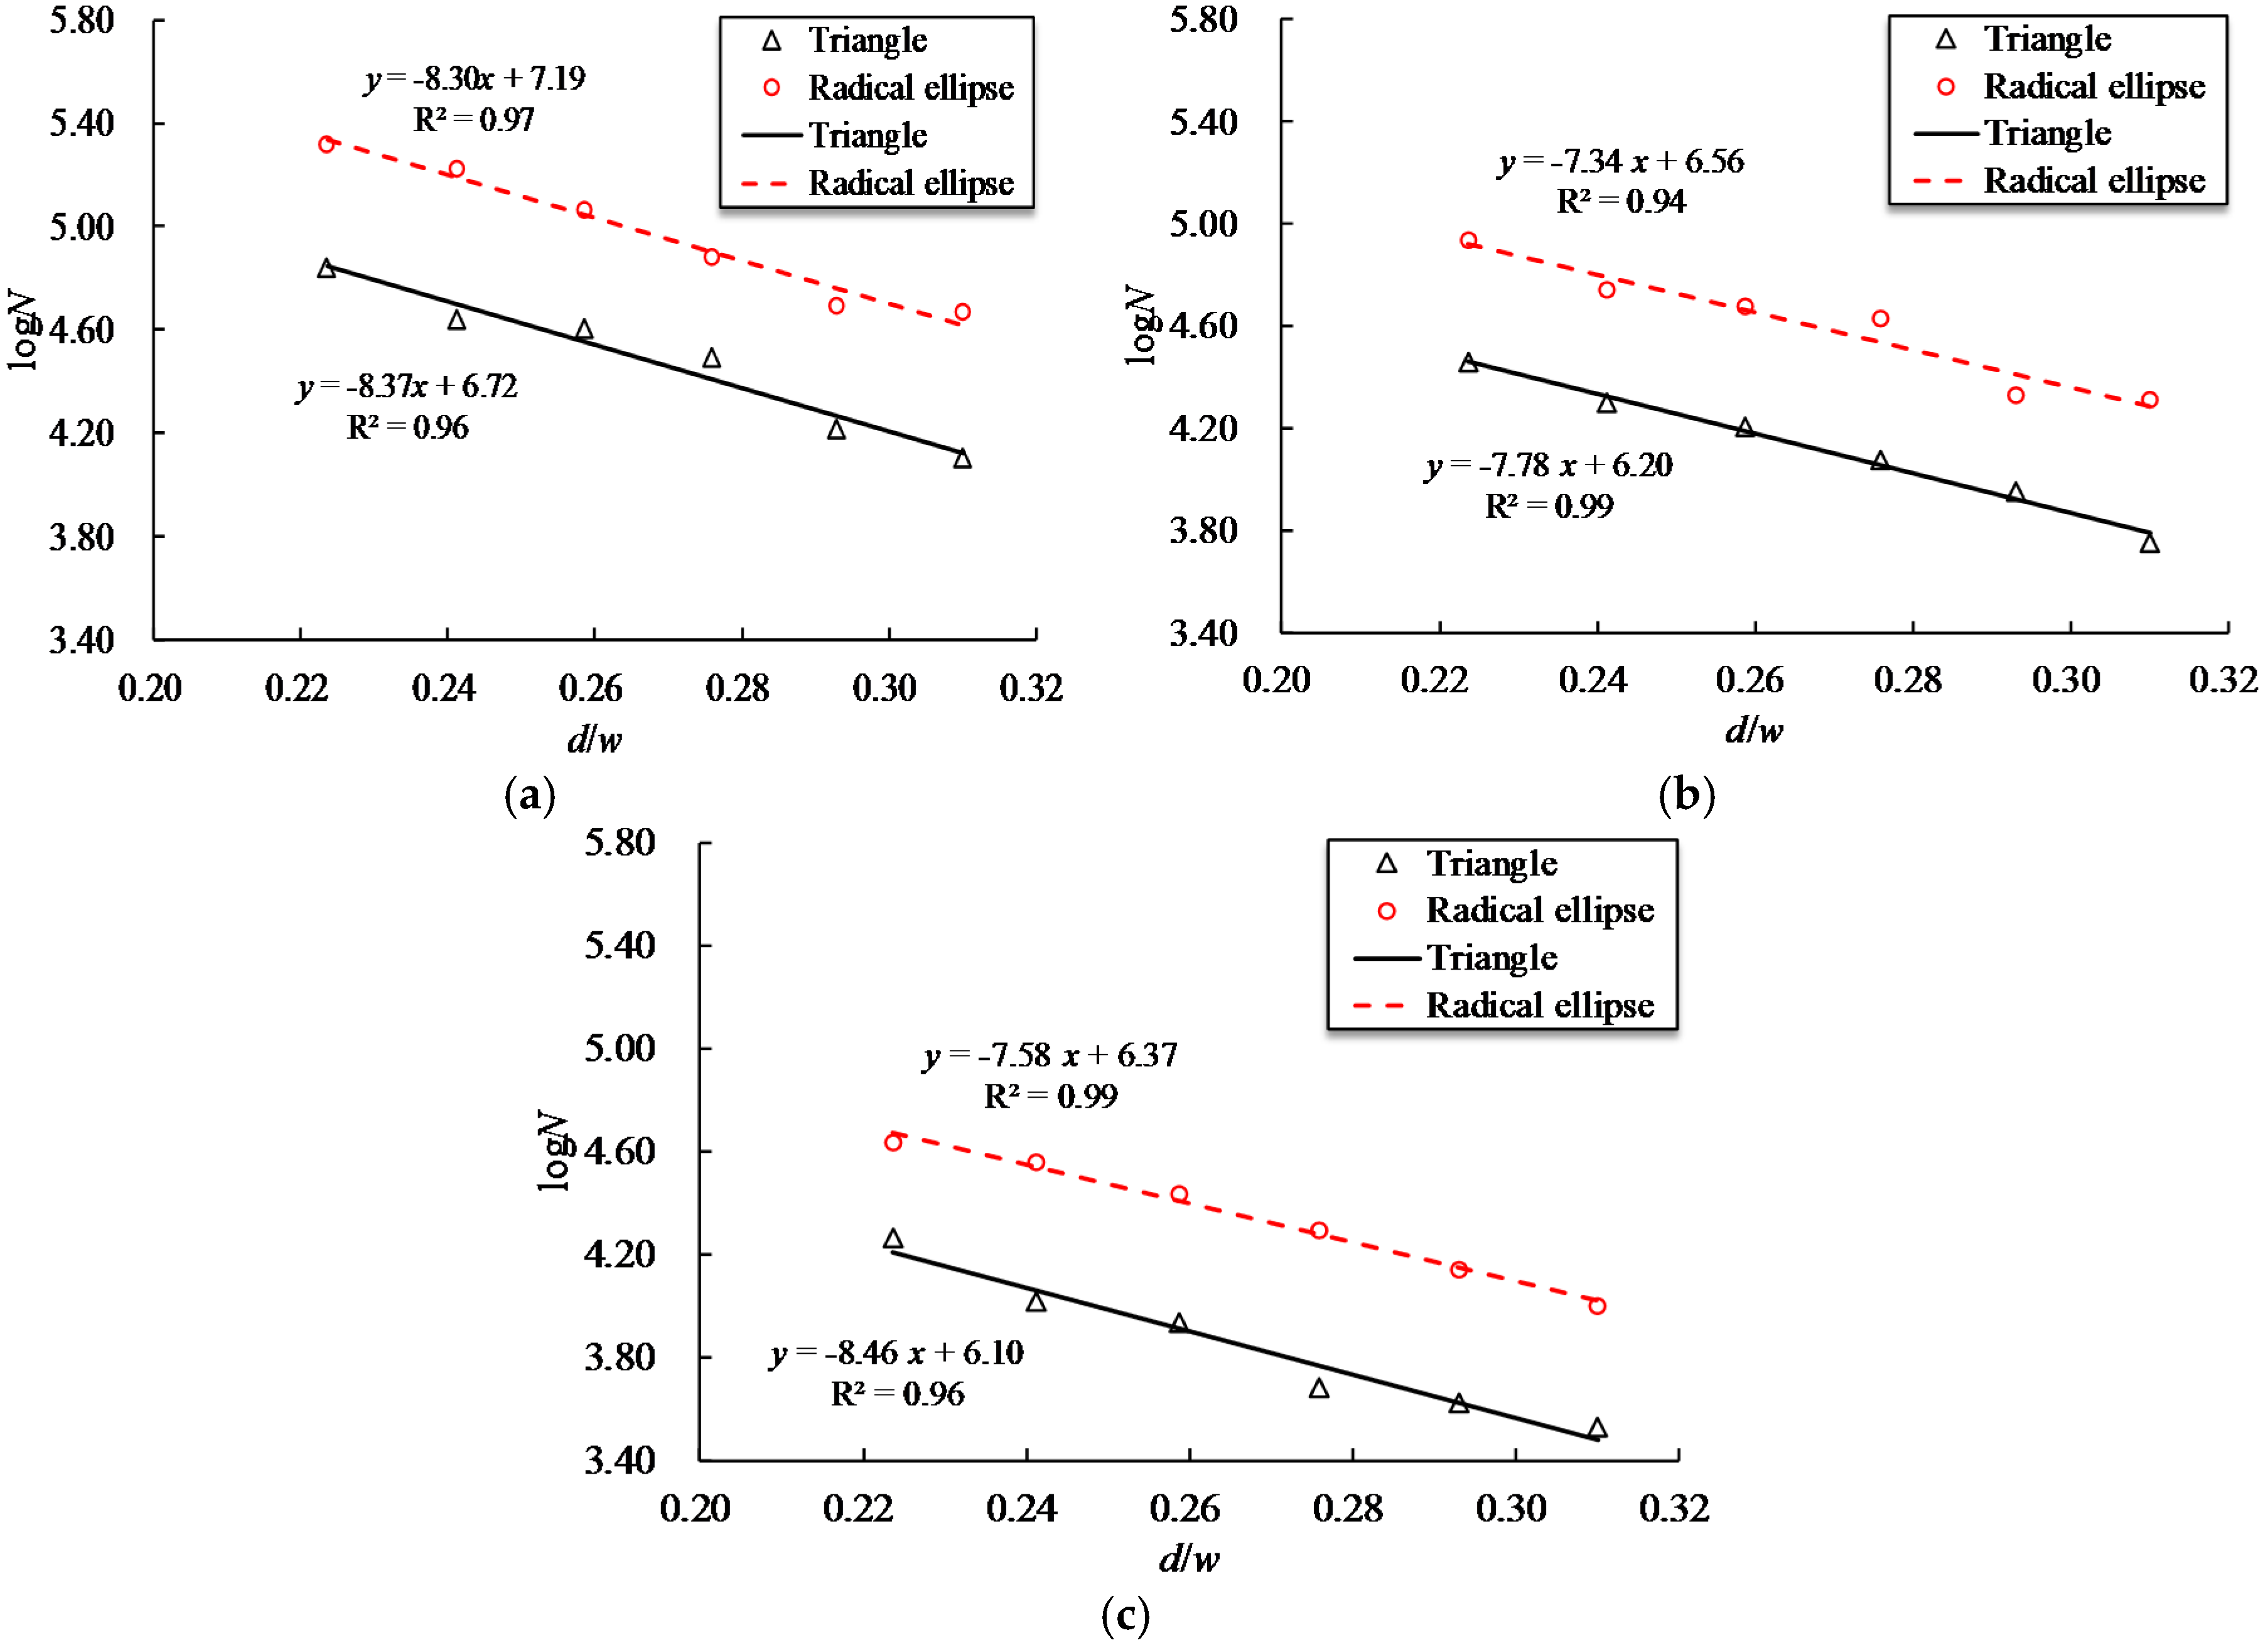
3.2. Fatigue Testing
4. Conclusions
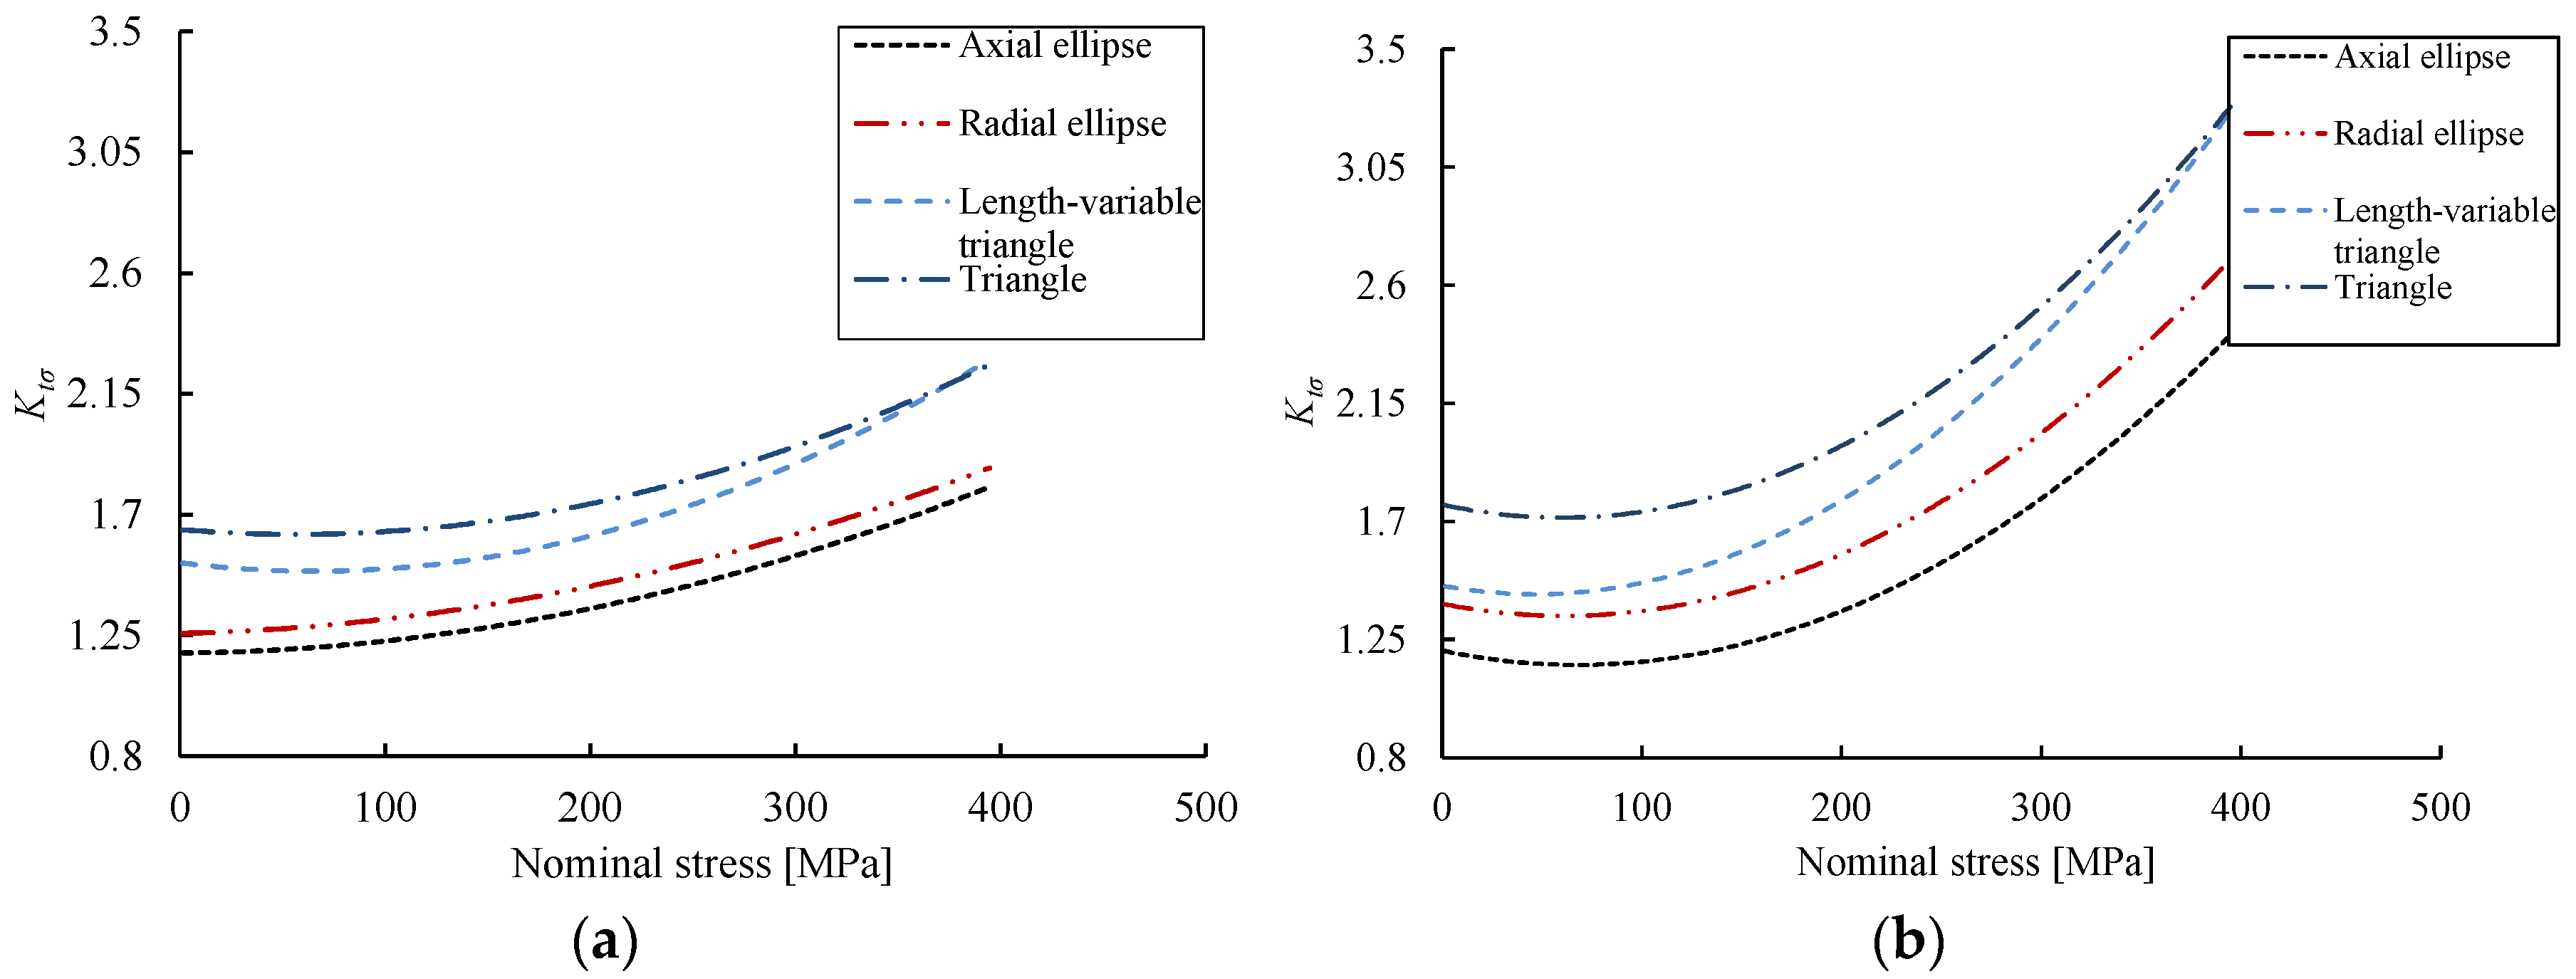
- The experimental static axial tensile testing and fatigue testing results show that the T-shaped notch has the highest stress concentration coefficient, followed by VT, RE, and AE shaped notches. The degree of stress concentration at the notch increases with increasing applied stress and increasing notch depth.
- The fatigue life of reinforcing bars significantly decreases as notch depth increases. Reinforcing bars with T-shaped notches are more sensitive to the aspect ratio d/w than those with RE-shaped notches. The difference in fatigue life for the two types of notches gradually increase with the increase of l/w.
- Fatigue curve equations for stress range-fatigue life-notch depth are established by linear regression, which provides an experimental basis for the fatigue life assessment of aging concrete bridges.
- The stress concentration coefficient exhibits an overall increasing trend with the increase of notch depth, while different uncertainty behavior is observed for this trend (due to intrinsic properties of the material and processing technique) and probabilistic inference may be a rational way to describe these uncertainties.
Acknowledgments
Author Contributions
Conflicts of Interest
References
- Stewart, M.G.; Mullard, J.A. Spatial time-dependent reliability analysis of corrosion damage and the timing of first repair for RC structures. Eng. Struct. 2007, 29, 1457–1464. [Google Scholar] [CrossRef]
- Ma, Y.; Zhang, J.; Wang, L.; Liu, Y. Probabilistic prediction with Bayesian updating for strength degradation of RC bridge beams. Struct. Saf. 2013, 44, 102–109. [Google Scholar] [CrossRef]
- Ma, Y.; Xu, F.; Wang, L.; Zhang, J.; Zhang, X. Influence of corrosion-induced cracking on structural behavior of reinforced concrete arch ribs. Eng. Struct. 2016, 117, 184–194. [Google Scholar] [CrossRef]
- Huang, Y.; Wei, C.; Chen, L.; Li, P. Quantitative correlation between geometric parameters and stress concentration of corrosion pits. Eng. Fail. Anal. 2014, 44, 168–178. [Google Scholar] [CrossRef]
- Jones, K.; Hoeppner, D.W. Prior corrosion and fatigue of 2024-T3 aluminum alloy. Corros. Sci. 2006, 48, 3109–3122. [Google Scholar] [CrossRef]
- Ahn, S.H.; Lawrence, F.V.; Metzger, M.M. Corrosion fatigue of an HSLA steel. Fatigue Fract. Eng. Mater. Struct. 1992, 15, 625–642. [Google Scholar] [CrossRef]
- Xiang, Y.; Liu, Y. EIFS-based crack growth fatigue life prediction of pitting-corroded test specimens. Eng. Fract. Mech. 2010, 77, 1314–1324. [Google Scholar] [CrossRef]
- Stewart, M.G. Mechanical behaviour of pitting corrosion of flexural and shear reinforcement and its effect on structural reliability of corroding RC beams. Struct. Saf. 2009, 31, 19–30. [Google Scholar] [CrossRef]
- Ma, Y.; Wang, L.; Zhang, J.; Xiang, Y.; Peng, T.; Liu, Y. Hybrid uncertainty quantification for probabilistic corrosion damage prediction for aging RC bridges. J. Mater. Civ. Eng. 2014, 27, 04014152. [Google Scholar] [CrossRef]
- Dang, V.H.; François, R. Influence of long-term corrosion in chloride environment on mechanical behaviour of RC beam. Eng. Struct. 2013, 48, 558–568. [Google Scholar] [CrossRef]
- Ma, Y.; Wang, L.; Zhang, J.; Xiang, Y.; Liu, Y. Bridge remaining strength prediction integrated with bayesian network and in situ load testing. J. Bridge Eng. 2014, 19, 04014037. [Google Scholar] [CrossRef]
- Wang, L.; Ma, Y.; Ding, W.; Zhang, J.; Liu, Y. Comparative study of flexural behavior of corroded beams with different types of steel bars. J. Perform. Constr. Facil. 2014, 29, 04014163. [Google Scholar] [CrossRef]
- Cairns, J.; Plizzari, G.A.; Du, Y.; Law, D.W.; Franzoni, C. Mechanical properties of corrosion-damaged reinforcement. ACI Mater. J. 2005, 102, 256–264. [Google Scholar]
- Du, Y.G.; Clark, L.A.; Chan, A.H.C. Residual capacity of corroded reinforcing bars. Mag. Concr. Res. 2005, 57, 135–147. [Google Scholar] [CrossRef]
- Ou, Y.C.; Susanto, Y.T.T.; Roh, H. Tensile behavior of naturally and artificially corroded steel bars. Constr. Build. Mater. 2016, 103, 93–104. [Google Scholar] [CrossRef]
- Sheng, J.; Xia, J. Effect of simulated pitting corrosion on the tensile properties of steel. Constr. Build. Mater. 2017, 131, 90–100. [Google Scholar] [CrossRef]
- Fernandez, I.; Bairán, J.M.; Marí, A.R. Mechanical model to evaluate steel reinforcement corrosion effects on σ – ε and fatigue curves. Experimental calibration and validation. Eng. Struct. 2016, 118, 320–333. [Google Scholar] [CrossRef]
- Apostolopoulos, C.; Papadopoulos, M. Tensile and low cycle fatigue behavior of corroded reinforcing steel bars S400. Constr. Build. Mater. 2007, 21, 855–864. [Google Scholar] [CrossRef]
- Li, H.; Lan, C.; Ju, Y.; Li, D. Experimental and numerical study of the fatigue properties of corroded parallel wire cables. J. Bridge Eng. 2011, 17, 211–220. [Google Scholar] [CrossRef]
- Sun, J.; Huang, Q.; Ren, Y. Performance deterioration of corroded RC beams and reinforcing bars under repeated loading. Constr. Build. Mater. 2015, 96, 404–415. [Google Scholar] [CrossRef]
- Fernandez, I.; Bairán, J.M.; Marí, A.R. Corrosion effects on the mechanical properties of reinforcing steel bars. Fatigue and σ–ε behavior. Constr. Build. Mater. 2015, 101, 772–783. [Google Scholar] [CrossRef]
- Nakamura, S.; Suzumura, K. Experimental study on fatigue strength of corroded bridge wires. J. Bridge Eng. 2012, 18, 200–209. [Google Scholar] [CrossRef]
- Cerit, M.; Genel, K.; Eksi, S. Numerical investigation on stress concentration of corrosion pit. Eng. Fail. Anal. 2009, 16, 2467–2472. [Google Scholar] [CrossRef]
- Ma, Y.; Xiang, Y.; Wang, L.; Zhang, J.; Liu, Y. Fatigue life prediction for aging RC beams considering corrosive environments. Eng. Struct. 2014, 79, 211–221. [Google Scholar] [CrossRef]
- Metallic Materials–Tensile Testing–Part 1: Method of Test at Room Temperature; GB/T228.1–2010; General Administration of Quality Supervision, Inspection and Quarantine of the People’s Republic of China: Beijing, China, 2010.
- Steel for the Reinforcement Of Concrete—Weldable Reinforcing Steel-Bar, Coil and Decoiled Product–Specification; BS 4449-2005 +A2; British Standards Institution: London, UK, 2009.
- Apostolopoulos, C.A.; Papadopoulos, M.P.; Pantelakis, S.G. Tensile behavior of corroded reinforcing steel bars BSt 500 s. Constr. Build. Mater. 2006, 20, 782–789. [Google Scholar] [CrossRef]
- Almusallam, A.A. Effect of degree of corrosion on the properties of reinforcing steel bars. Constr. Build. Mater. 2001, 15, 361–368. [Google Scholar] [CrossRef]


| Specimen No. | Notch Shape and Size (Unit: mm) | Specimen No. | Notch Shape and Size (Unit: mm) | ||||
|---|---|---|---|---|---|---|---|
| Side View | Top View | Photos of Notch | Side View | Top View | Photos of Notch | ||
| RE5−6.7−1.5 |  | 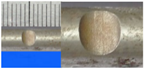 | AE7−6.7−1.5 | 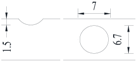 | 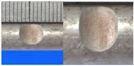 | ||
| RE5−7.0−1.7 | 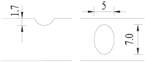 | 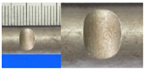 | AE8−7.0−1.7 | 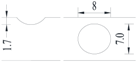 | 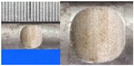 | ||
| RE5−7.3−1.9 | 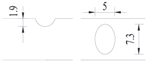 | 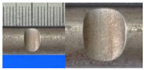 | AE9−7.3−1.9 |  | 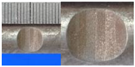 | ||
| RE5−7.6−2.1 |  | 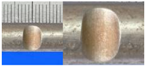 | AE10−7.6−2.1 | 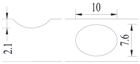 | 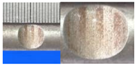 | ||
| RE5−7.9−2.3 | 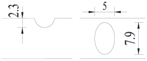 |  | AE11−7.9−2.3 | 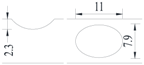 | 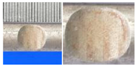 | ||
| RE5−8.0−2.5 | 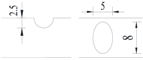 | 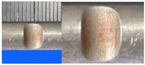 | AE12−8.0−2.5 | 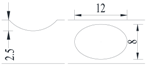 | 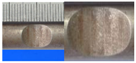 | ||
| T5−6.7−1.5 | 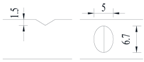 | 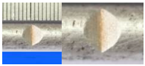 | VT7−6.7−1.5 | 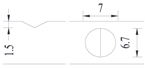 | 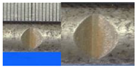 | ||
| T5−7.0−1.7 | 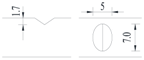 | 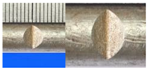 | VT8−7.0−1.7 | 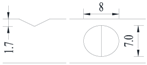 | 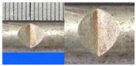 | ||
| T5−7.3−1.9 | 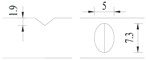 | 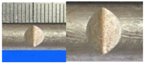 | VT9−7.3−1.9 | 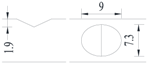 | 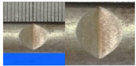 | ||
| T5−7.6−2.1 | 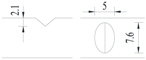 |  | VT10−7.6−2.1 |  | 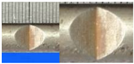 | ||
| T5−7.9−2.3 | 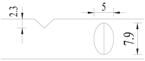 | 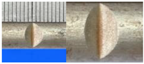 | VT11−7.9−2.3 | 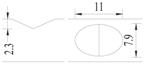 | 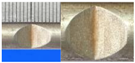 | ||
| T5−8.0−2.5 |  | 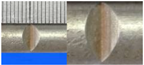 | VT12−8.0−2.5 | 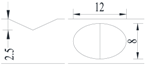 | 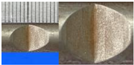 | ||
| Notch Depth (mm) | Nominal Stress (MPa) | Measured Strain at the Notch (με) | Average Strain (με) | Stress Concentration Coefficient | ||||||
|---|---|---|---|---|---|---|---|---|---|---|
| AE | RE | VT | T | AE | RE | VT | T | |||
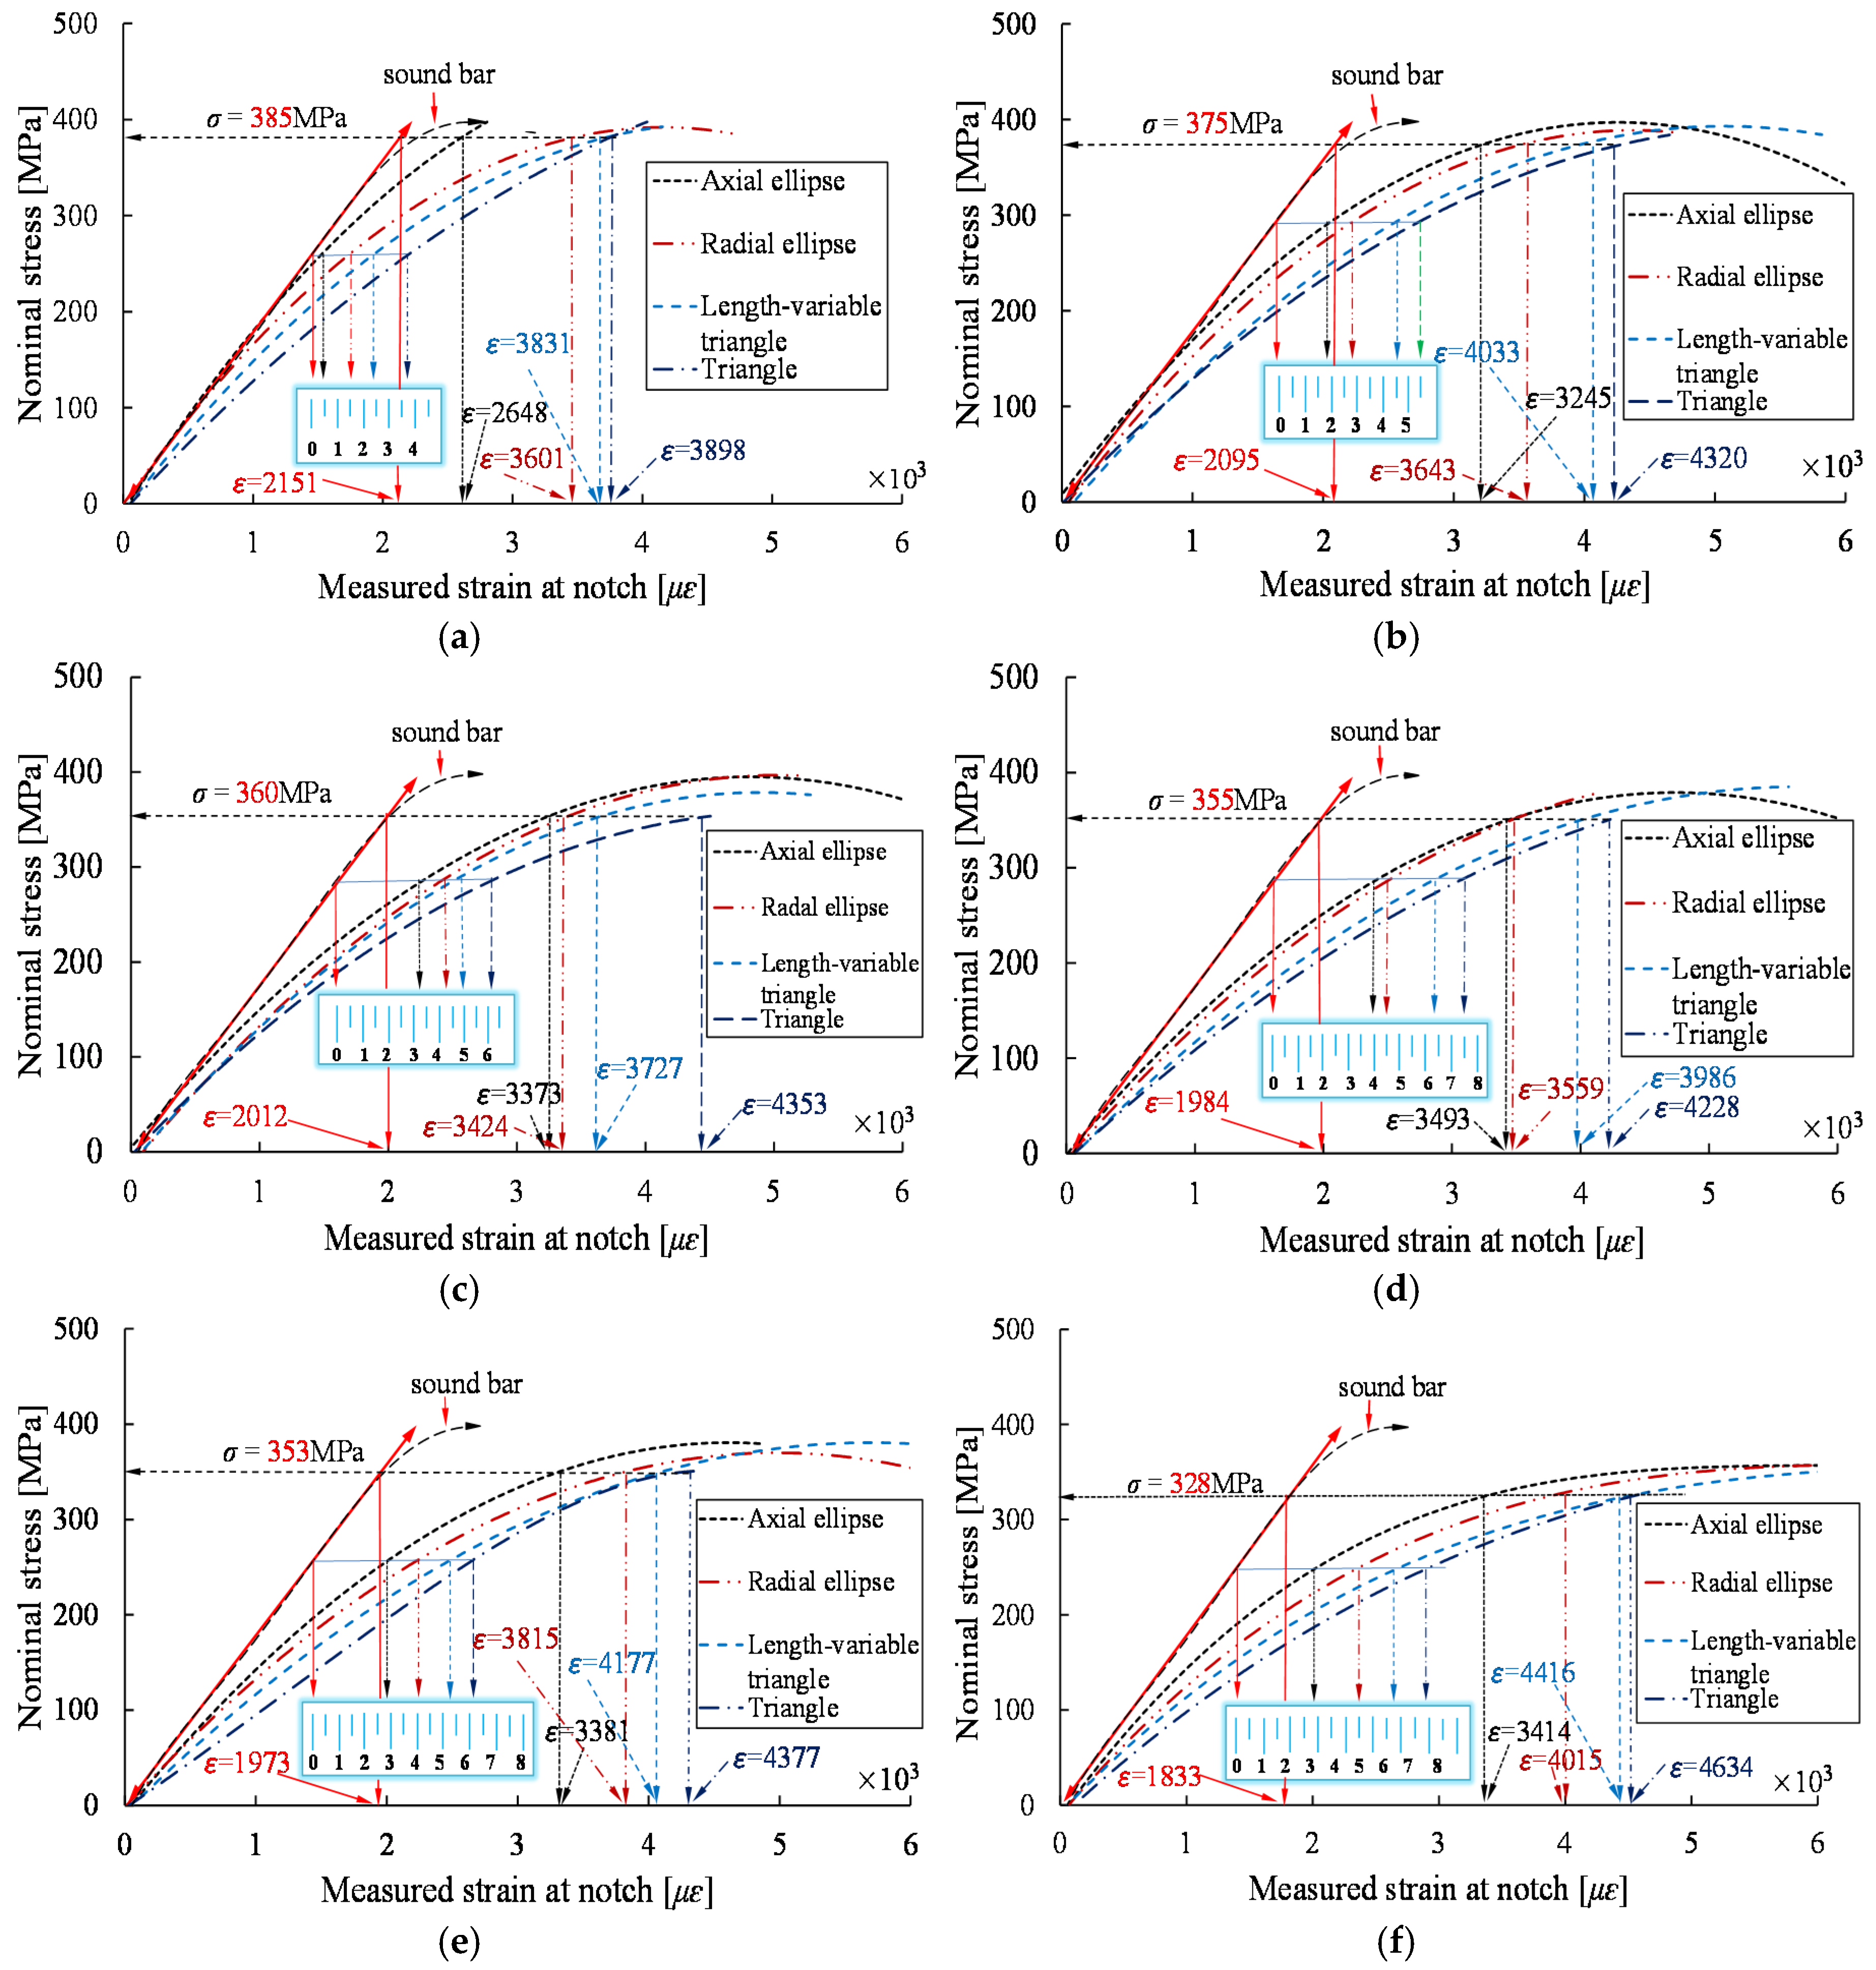
| 1.5 | 385 | 2648 | 3601 | 3831 | 3898 | 2151 | 1.231 | 1.674 | 1.781 | 1.812 |
| 1.7 | 375 | 3245 | 3643 | 4033 | 4320 | 2095 | 1.549 | 1.739 | 1.925 | 2.062 |
| 1.9 | 360 | 3373 | 3424 | 3727 | 4353 | 2012 | 1.676 | 1.702 | 1.852 | 2.164 |
| 2.1 | 355 | 3493 | 3559 | 3986 | 4228 | 1984 | 1.761 | 1.794 | 2.009 | 2.131 |
| 2.3 | 353 | 3381 | 3815 | 4177 | 4377 | 1973 | 1.714 | 1.934 | 2.117 | 2.218 |
| 2.5 | 328 | 3414 | 4015 | 4416 | 4634 | 1833 | 1.863 | 2.190 | 2.409 | 2.528 |
| Specimen No. | Stress Levels | Minimum Area/mm2 | Stress Range/MPa | Fatigue Life/Cycle | Specimen No. | Stress Levels | Minimum Area/mm2 | Stress Range/MPa | Fatigue Life/Cycle |
|---|---|---|---|---|---|---|---|---|---|
| 0−0−0 | 0.4Rm | 63.5 | 189.4 | 1,028,469 | VT12−8.0−2.5 | 0.6Rm | 47.8 | 352.1 | 4100 |
| 0−0−0 | 0.5Rm | 63.2 | 228.3 | 571,120 | RE5−6.7−1.5 | 0.4Rm | 55.8 | 217.7 | 205,791 |
| 0−0−0 | 0.6Rm | 63.8 | 264.0 | 451,763 | RE5−6.7−1.5 | 0.5Rm | 56.9 | 253.5 | 86,571 |
| T5−6.7−1.5 | 0.4Rm | 56.2 | 213.8 | 68,466 | RE5−6.7−1.5 | 0.6Rm | 55.2 | 305.2 | 43,342 |
| T5−6.7−1.5 | 0.5Rm | 56.4 | 255.6 | 28,745 | RE5−7.0−1.7 | 0.4Rm | 55.7 | 215.4 | 167,112 |
| T5−6.7−1.5 | 0.6Rm | 55.3 | 304.1 | 18,225 | RE5−7.0−1.7 | 0.5Rm | 54.9 | 263.6 | 55,132 |
| T5−7.0−1.7 | 0.4Rm | 55.0 | 218.6 | 43,459 | RE5−7.0−1.7 | 0.6Rm | 53.7 | 313.8 | 35,904 |
| T5−7.0−1.7 | 0.5Rm | 55.3 | 260.7 | 19,848 | RE5−7.3−1.9 | 0.4Rm | 53.1 | 228.0 | 115,350 |
| T5−7.0−1.7 | 0.6Rm | 54.4 | 309.4 | 10,380 | RE5−7.3−1.9 | 0.5Rm | 52.5 | 275.0 | 47,168 |
| T5−7.3−1.9 | 0.4Rm | 53.4 | 225.0 | 40,055 | RE5−7.3−1.9 | 0.6Rm | 53.5 | 313.5 | 27,079 |
| T5−7.3−1.9 | 0.5Rm | 53.4 | 270.4 | 15,928 | RE5−7.6−2.1 | 0.4Rm | 51.6 | 233.0 | 75,904 |
| T5−7.3−1.9 | 0.6Rm | 53.4 | 315.4 | 8,545 | RE5−7.6−2.1 | 0.5Rm | 51.3 | 283.7 | 42,406 |
| T5−7.6−2.1 | 0.4Rm | 51.9 | 231.9 | 30,998 | RE5−7.6−2.1 | 0.6Rm | 52.0 | 322.9 | 19,701 |
| T5−7.6−2.1 | 0.5Rm | 51.5 | 280.0 | 11,813 | RE5−7.9−2.3 | 0.4Rm | 48.9 | 246.0 | 48,764 |
| T5−7.6−2.1 | 0.6Rm | 51.4 | 327.2 | 4,775 | RE5−7.9−2.3 | 0.5Rm | 49.1 | 295.3 | 21,215 |
| T5−7.9−2.3 | 0.4Rm | 48.7 | 246.7 | 16,282 | RE5−7.9−2.3 | 0.6Rm | 50.8 | 333.7 | 13,725 |
| T5−7.9−2.3 | 0.5Rm | 49.7 | 290.3 | 8928 | RE 5−8.0−2.5 | 0.4Rm | 48.8 | 246.5 | 46,466 |
| T5−7.9−2.3 | 0.6Rm | 50.1 | 323.1 | 4188 | RE 5−8.0−2.5 | 0.5Rm | 48.9 | 296.9 | 20,343 |
| T5−8.0−2.5 | 0.4Rm | 49.0 | 245.6 | 12,606 | RE 5−8.0−2.5 | 0.6Rm | 49.3 | 341.7 | 9951 |
| T5−8.0−2.5 | 0.5Rm | 49.2 | 293.1 | 5643 | AE7−6.7−1.5 | 0.4Rm | 56.1 | 214.3 | 265,329 |
| T5−8.0−2.5 | 0.6Rm | 49.4 | 341.1 | 3354 | AE7−6.7−1.5 | 0.5Rm | 56.0 | 257.8 | 159,663 |
| T5−6.7−1.5 | 0.4Rm | 55.8 | 215.6 | 75,066 | AE7−6.7−1.5 | 0.6Rm | 56.0 | 300.8 | 57,889 |
| VT7−6.7−1.5 | 0.5Rm | 56.2 | 256.9 | 46,853 | AE8−7.0−1.7 | 0.4Rm | 53. | 223.0 | 243,127 |
| VT7−6.7−1.5 | 0.6Rm | 54.2 | 299.3 | 18,886 | AE8−7.0−1.7 | 0.5Rm | 54.3 | 268.9 | 86,707 |
| VT8−7.0−1.7 | 0.4Rm | 54.5 | 220.5 | 61,772 | AE8−7.0−1.7 | 0.6Rm | 54.4 | 311.0 | 48,373 |
| VT8−7.0−1.7 | 0.5Rm | 54.7 | 263.6 | 29,207 | AE9−7.3−1.9 | 0.4Rm | 53.2 | 225.9 | 125,429 |
| VT8−7.0−1.7 | 0.6Rm | 54.9 | 306.8 | 15,816 | AE9−7.3−1.9 | 0.5Rm | 53.5 | 275.3 | 70,545 |
| VT9−7.3−1.9 | 0.4Rm | 53.6 | 224.2 | 56,824 | AE9−7.3−1.9 | 0.6Rm | 52.7 | 323.4 | 30,753 |
| VT9−7.3−1.9 | 0.5Rm | 53.9 | 267.7 | 26,166 | AE10−7.6-2.1 | 0.4Rm | 51.7 | 232.7 | 109,326 |
| VT9−7.3−1.9 | 0.6Rm | 53.3 | 315.7 | 11,676 | AE10−7.6−2.1 | 0.5Rm | 51.7 | 279.2 | 46,792 |
| VT10−7.6-2.1 | 0.4Rm | 51.6 | 233.1 | 38,688 | AE10−7.6−2.1 | 0.6Rm | 51.6 | 316.7 | 30,201 |
| VT10−7.6−2.1 | 0.5Rm | 51.6 | 279.9 | 15,985 | AE11−7.9−2.3 | 0.4Rm | 49.9 | 240.8 | 130,749 |
| VT10−7.6−2.1 | 0.6Rm | 53.8 | 313.1 | 7572 | AE11−7.9−2.3 | 0.5Rm | 50.0 | 290.0 | 57,385 |
| VT11−7.9−2.3 | 0.4Rm | 50.4 | 238.8 | 22,353 | AE11−7.9−2.3 | 0.6Rm | 50.6 | 332.9 | 29,229 |
| VT11−7.9−2.3 | 0.5Rm | 50.6 | 285.0 | 13,508 | AE12−8.0−2.5 | 0.4Rm | 48.6 | 250.1 | 72,154 |
| VT11−7.9−2.3 | 0.6Rm | 50.0 | 336.4 | 5209 | AE12−8.0−2.5 | 0.5Rm | 48.2 | 300.3 | 37,698 |
| VT12−8.0−2.5 | 0.4Rm | 48.9 | 246.0 | 21,388 | AE12−8.0−2.5 | 0.6Rm | 47.7 | 352.7 | 10,946 |
| VT12−8.0−2.5 | 0.5Rm | 48.6 | 296.8 | 7706 |
© 2017 by the authors. Licensee MDPI, Basel, Switzerland. This article is an open access article distributed under the terms and conditions of the Creative Commons Attribution (CC BY) license (http://creativecommons.org/licenses/by/4.0/).
Share and Cite
Ma, Y.; Wang, Q.; Guo, Z.; Wang, G.; Wang, L.; Zhang, J. Static and Fatigue Behavior Investigation of Artificial Notched Steel Reinforcement. Materials 2017, 10, 532. https://doi.org/10.3390/ma10050532
Ma Y, Wang Q, Guo Z, Wang G, Wang L, Zhang J. Static and Fatigue Behavior Investigation of Artificial Notched Steel Reinforcement. Materials. 2017; 10(5):532. https://doi.org/10.3390/ma10050532
Chicago/Turabian StyleMa, Yafei, Qiang Wang, Zhongzhao Guo, Guodong Wang, Lei Wang, and Jianren Zhang. 2017. "Static and Fatigue Behavior Investigation of Artificial Notched Steel Reinforcement" Materials 10, no. 5: 532. https://doi.org/10.3390/ma10050532
APA StyleMa, Y., Wang, Q., Guo, Z., Wang, G., Wang, L., & Zhang, J. (2017). Static and Fatigue Behavior Investigation of Artificial Notched Steel Reinforcement. Materials, 10(5), 532. https://doi.org/10.3390/ma10050532