
Towards Highly Performing and Stable PtNi Catalysts in Polymer Electrolyte Fuel Cells for Automotive Application


 ,
,  ,
, 


Abstract
:1. Introduction
2. Results and Discussion
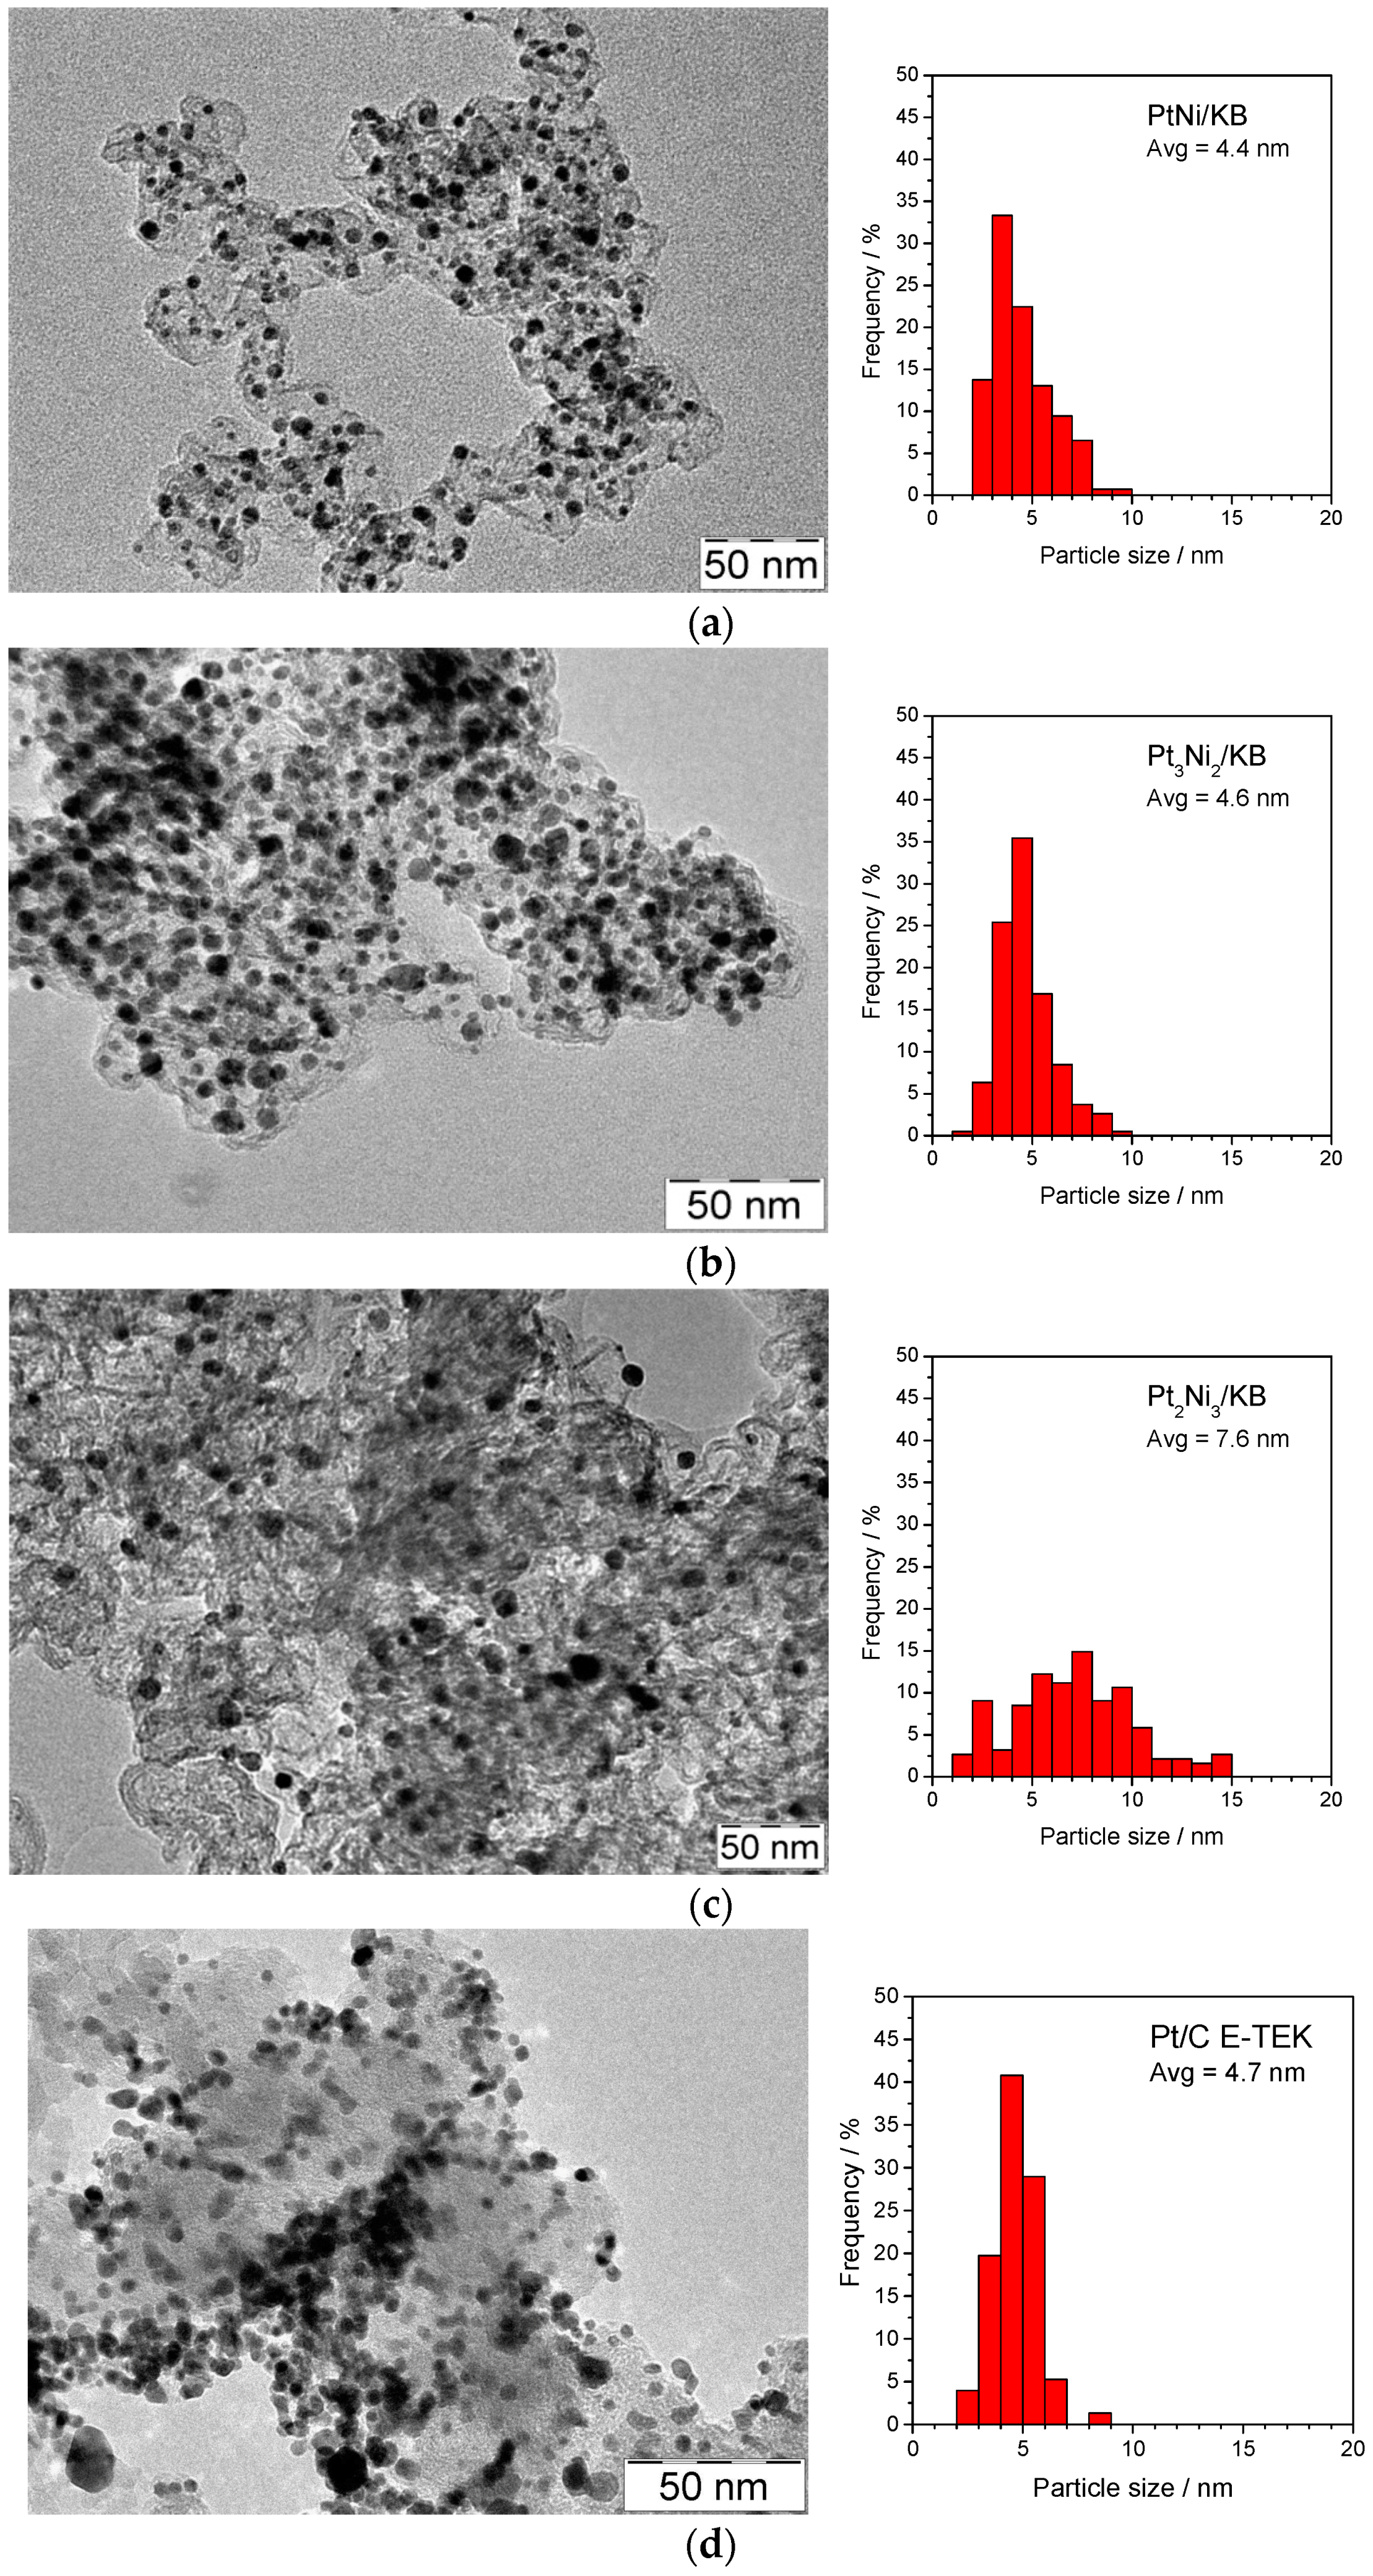
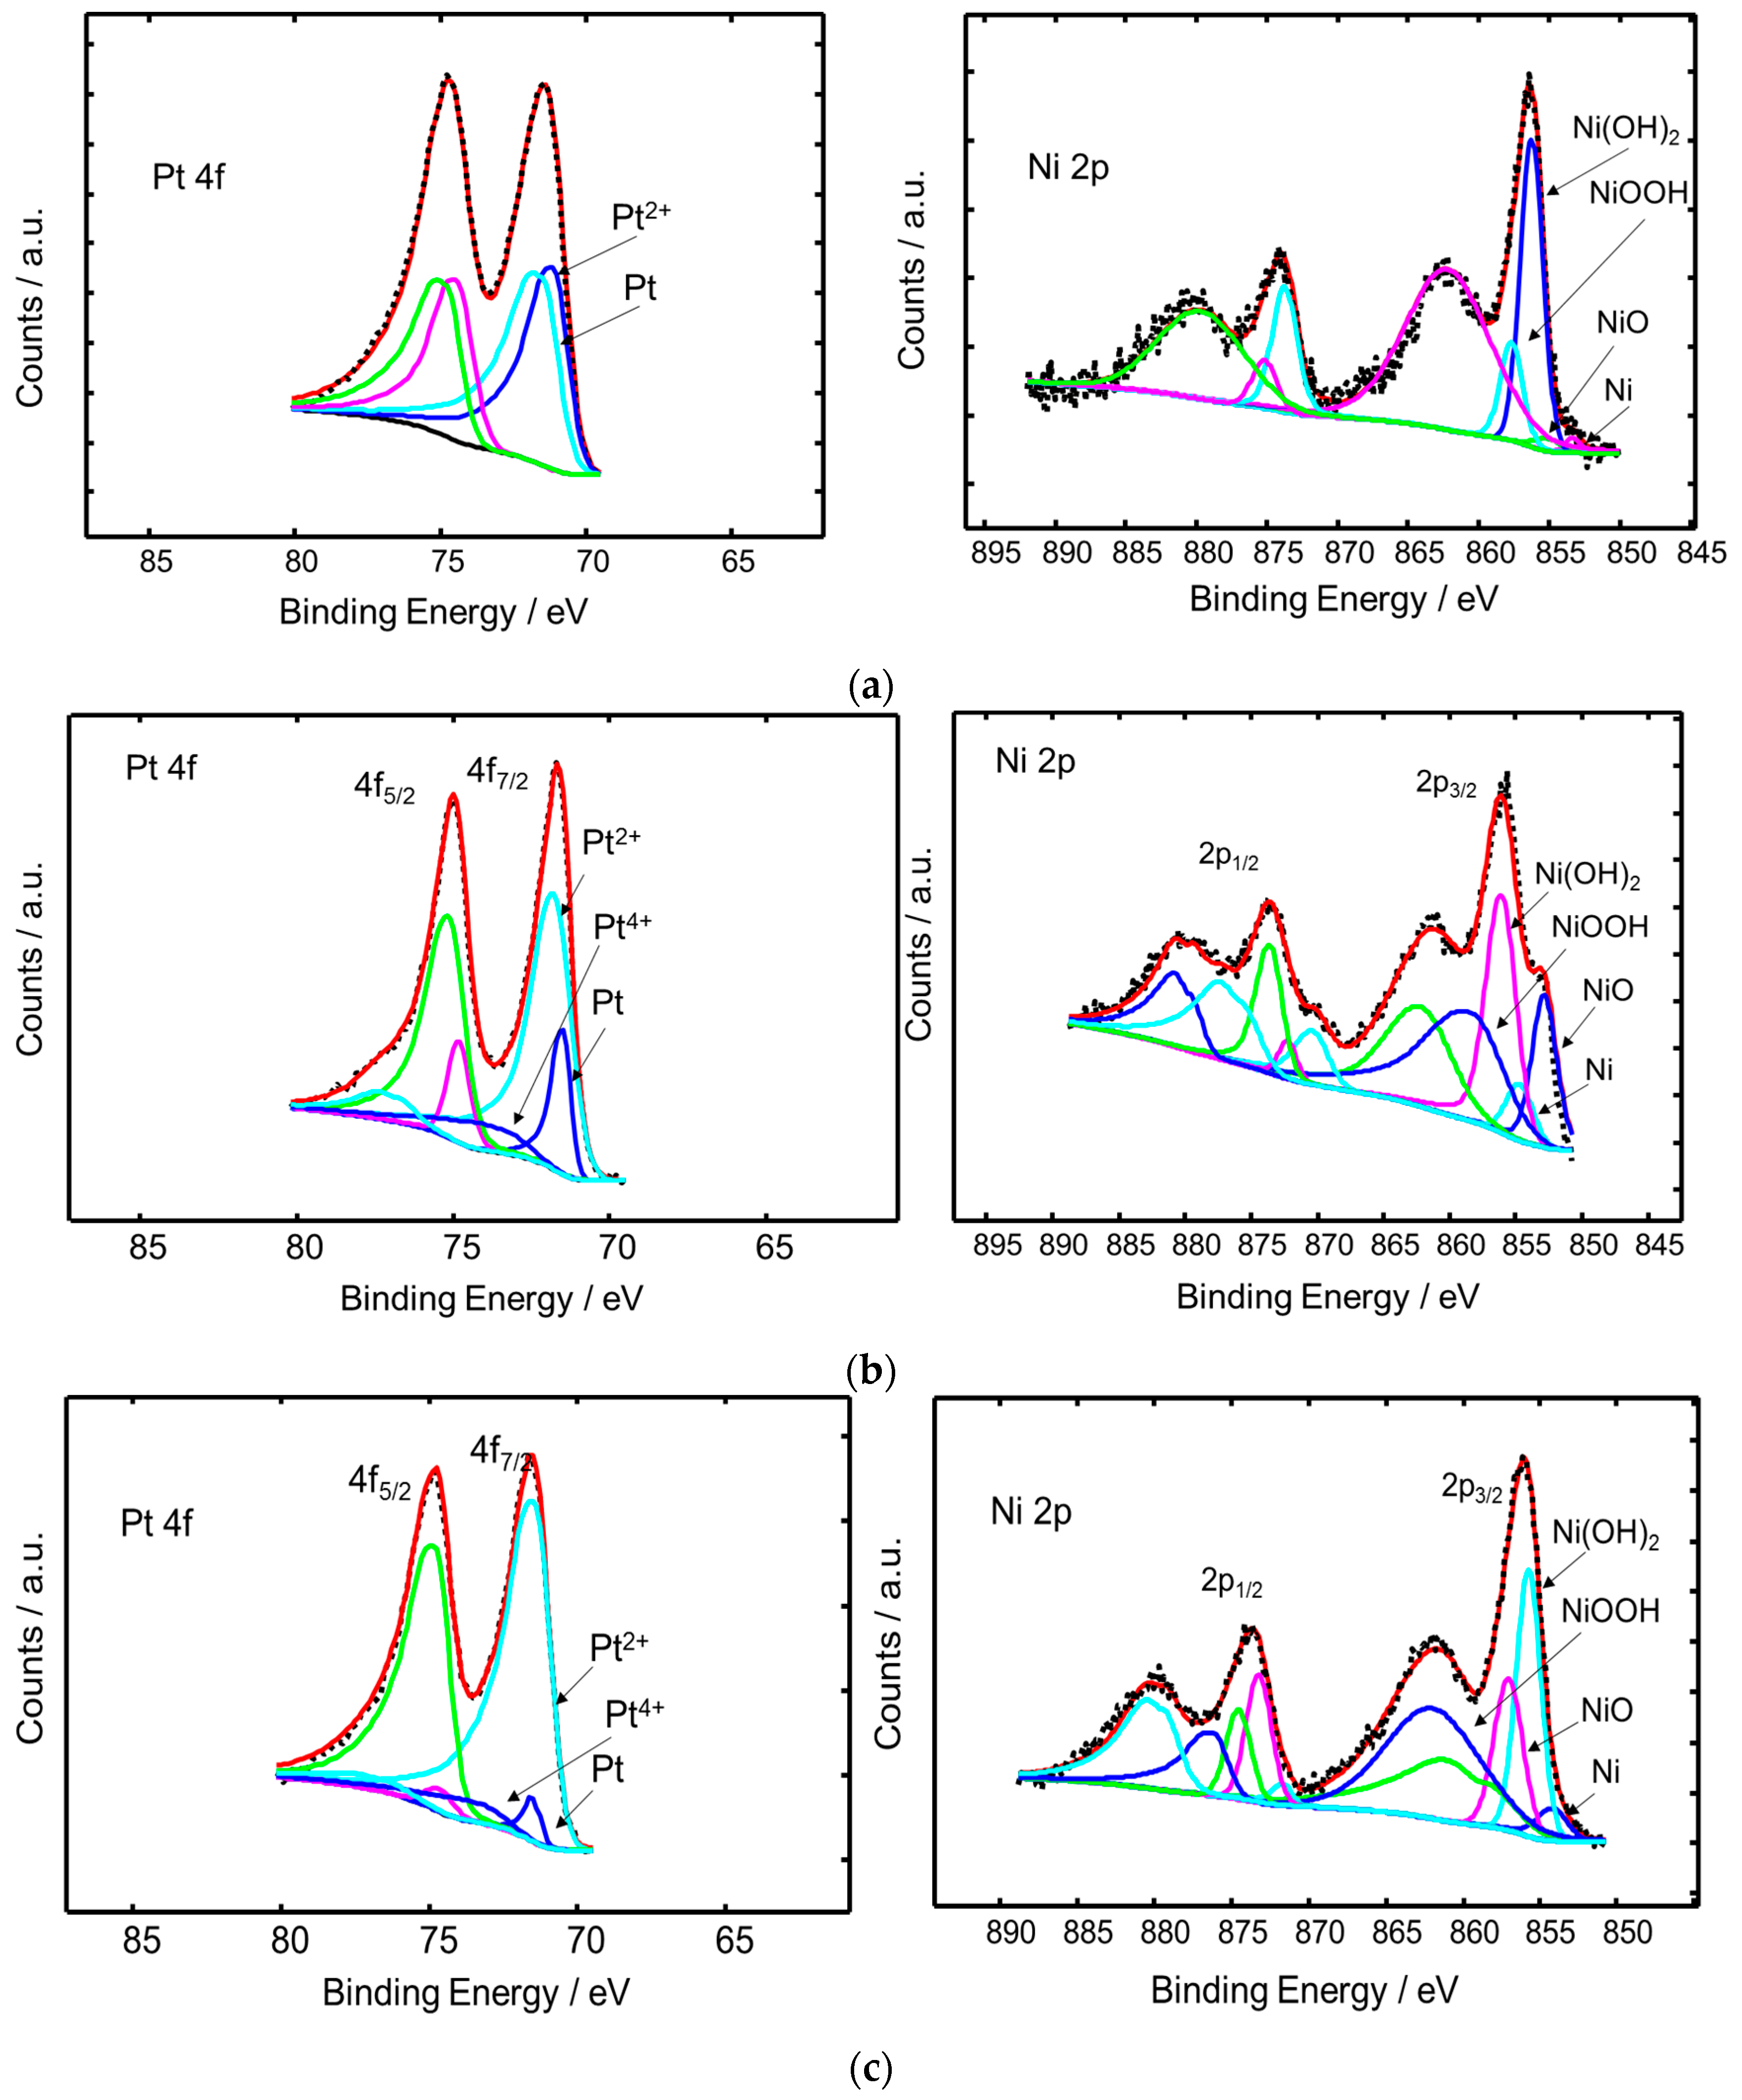
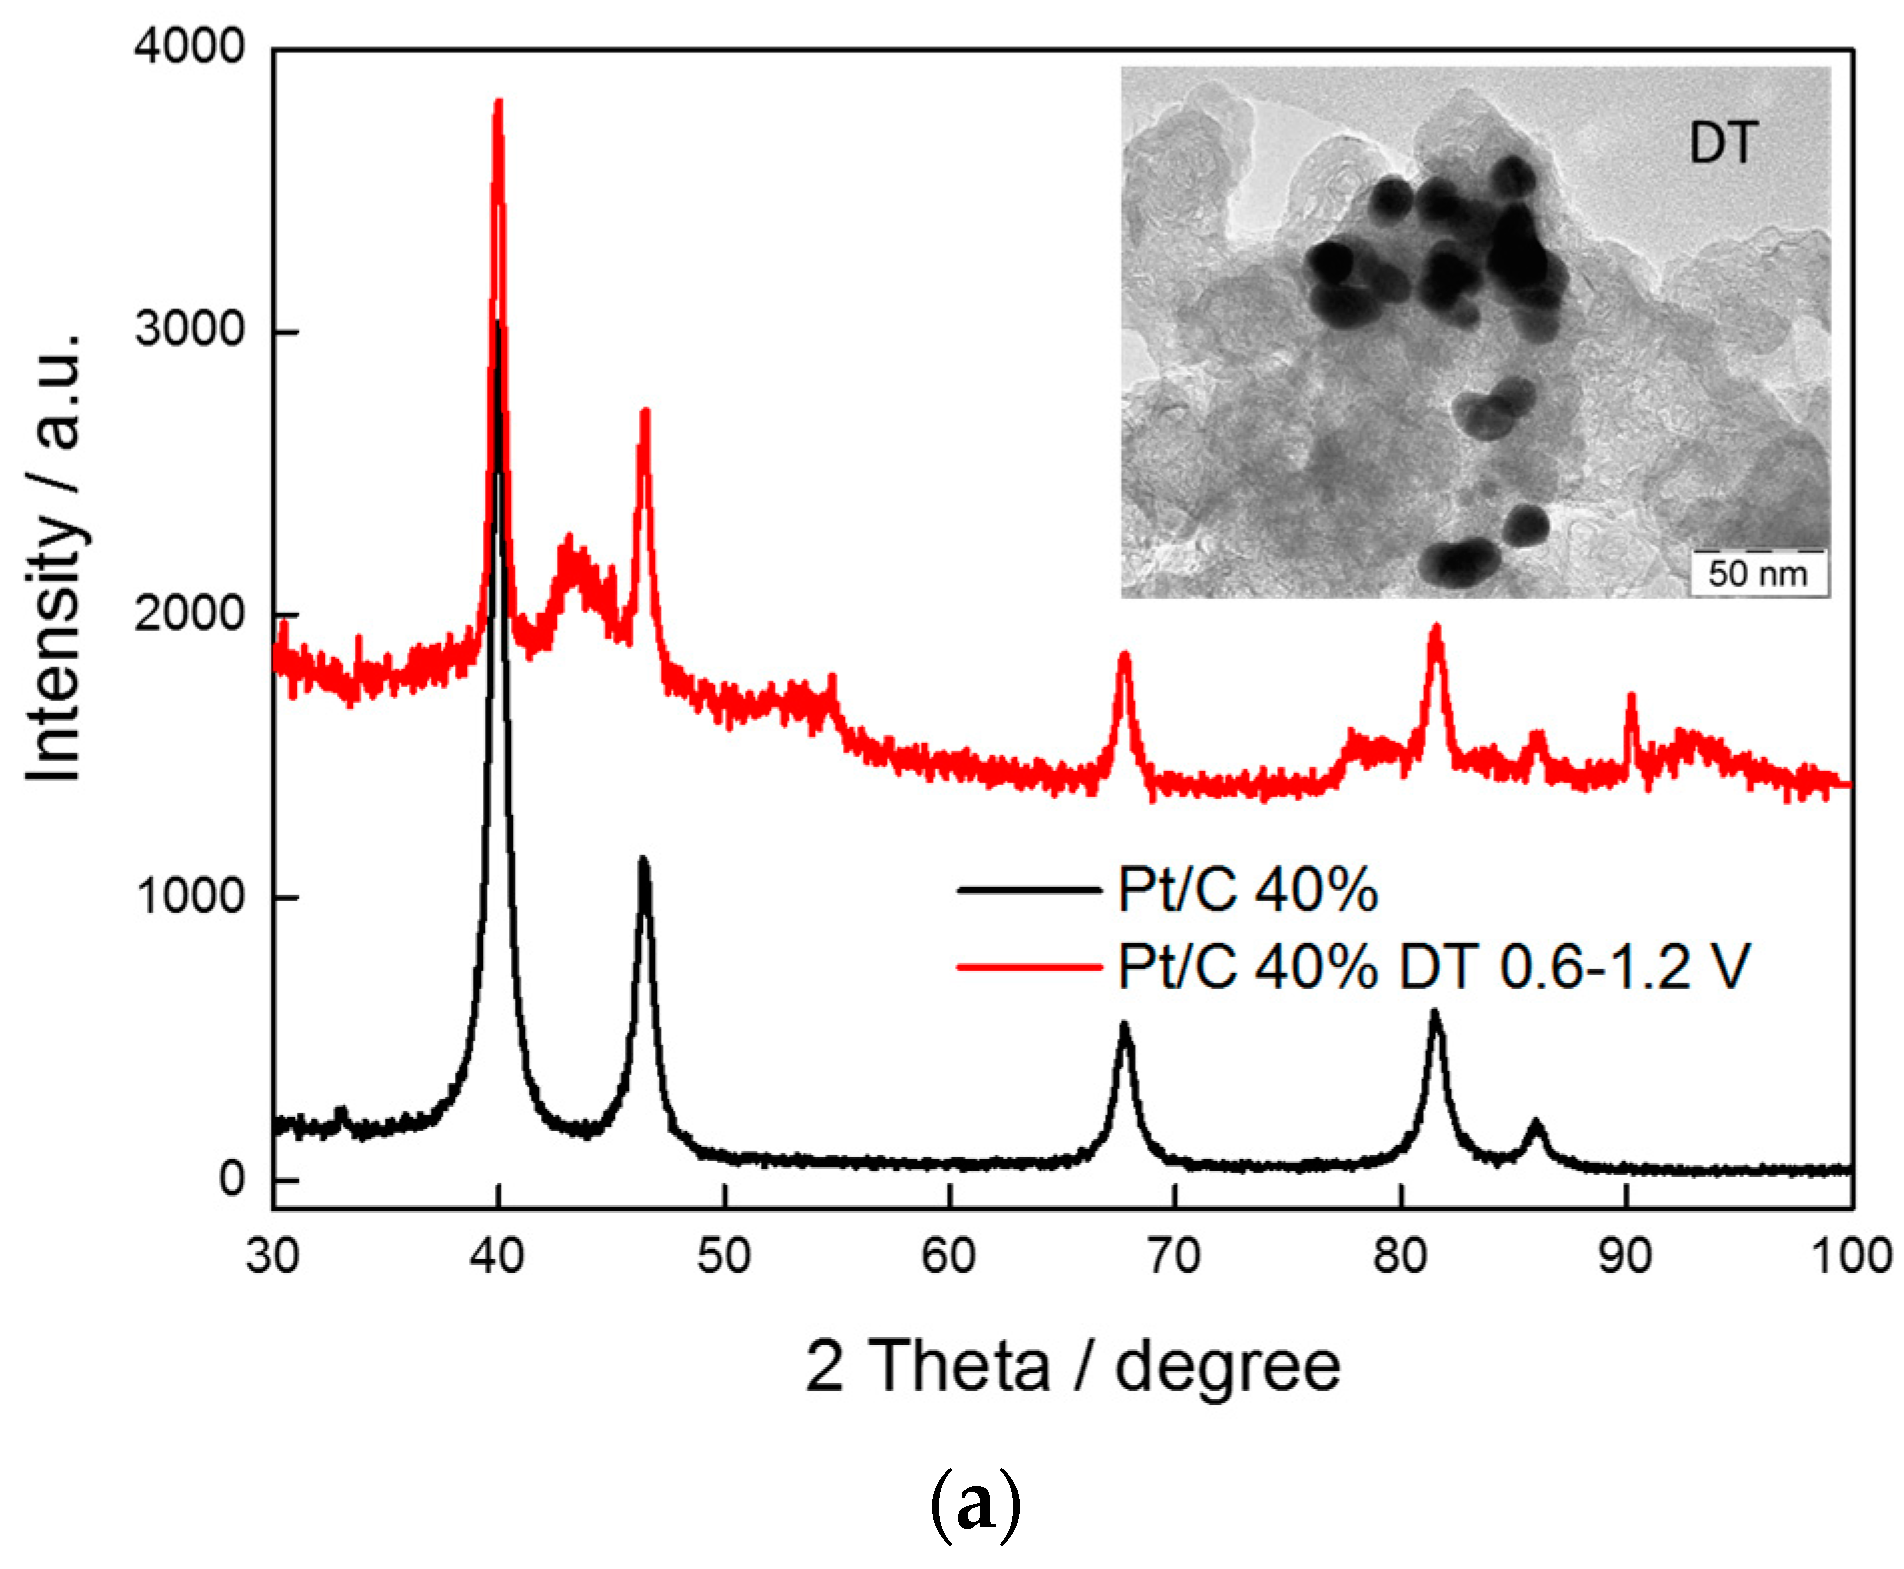
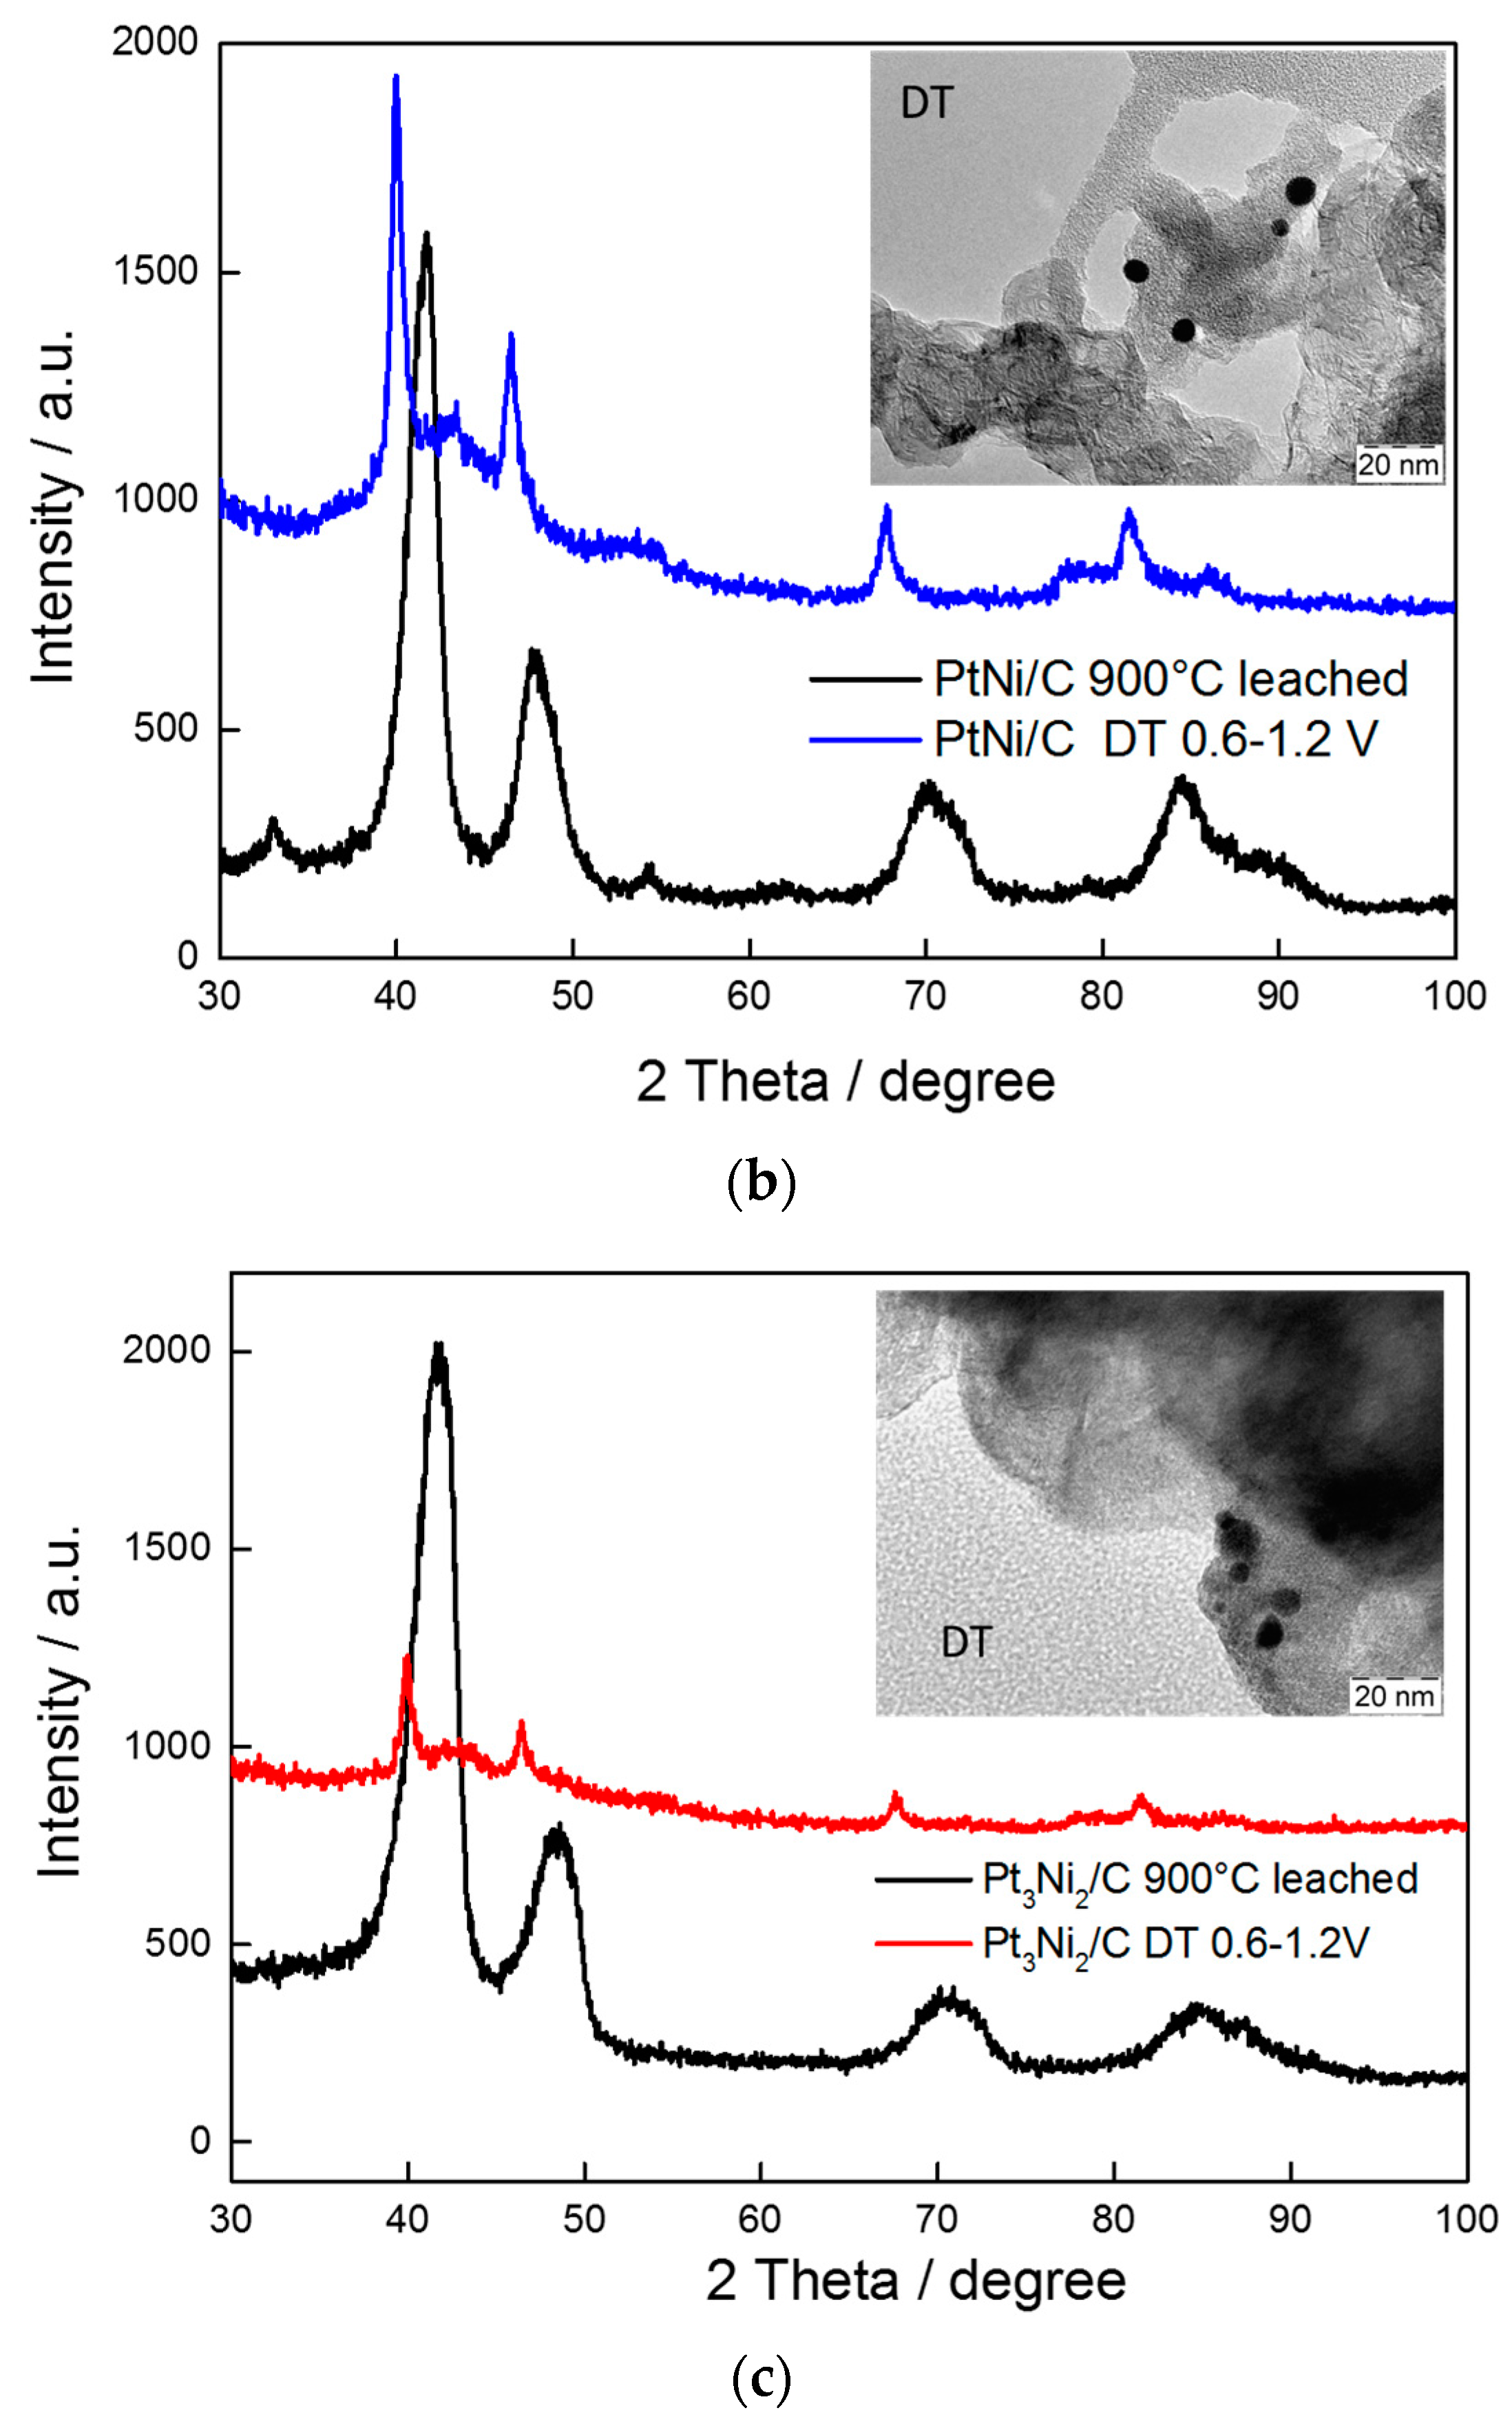
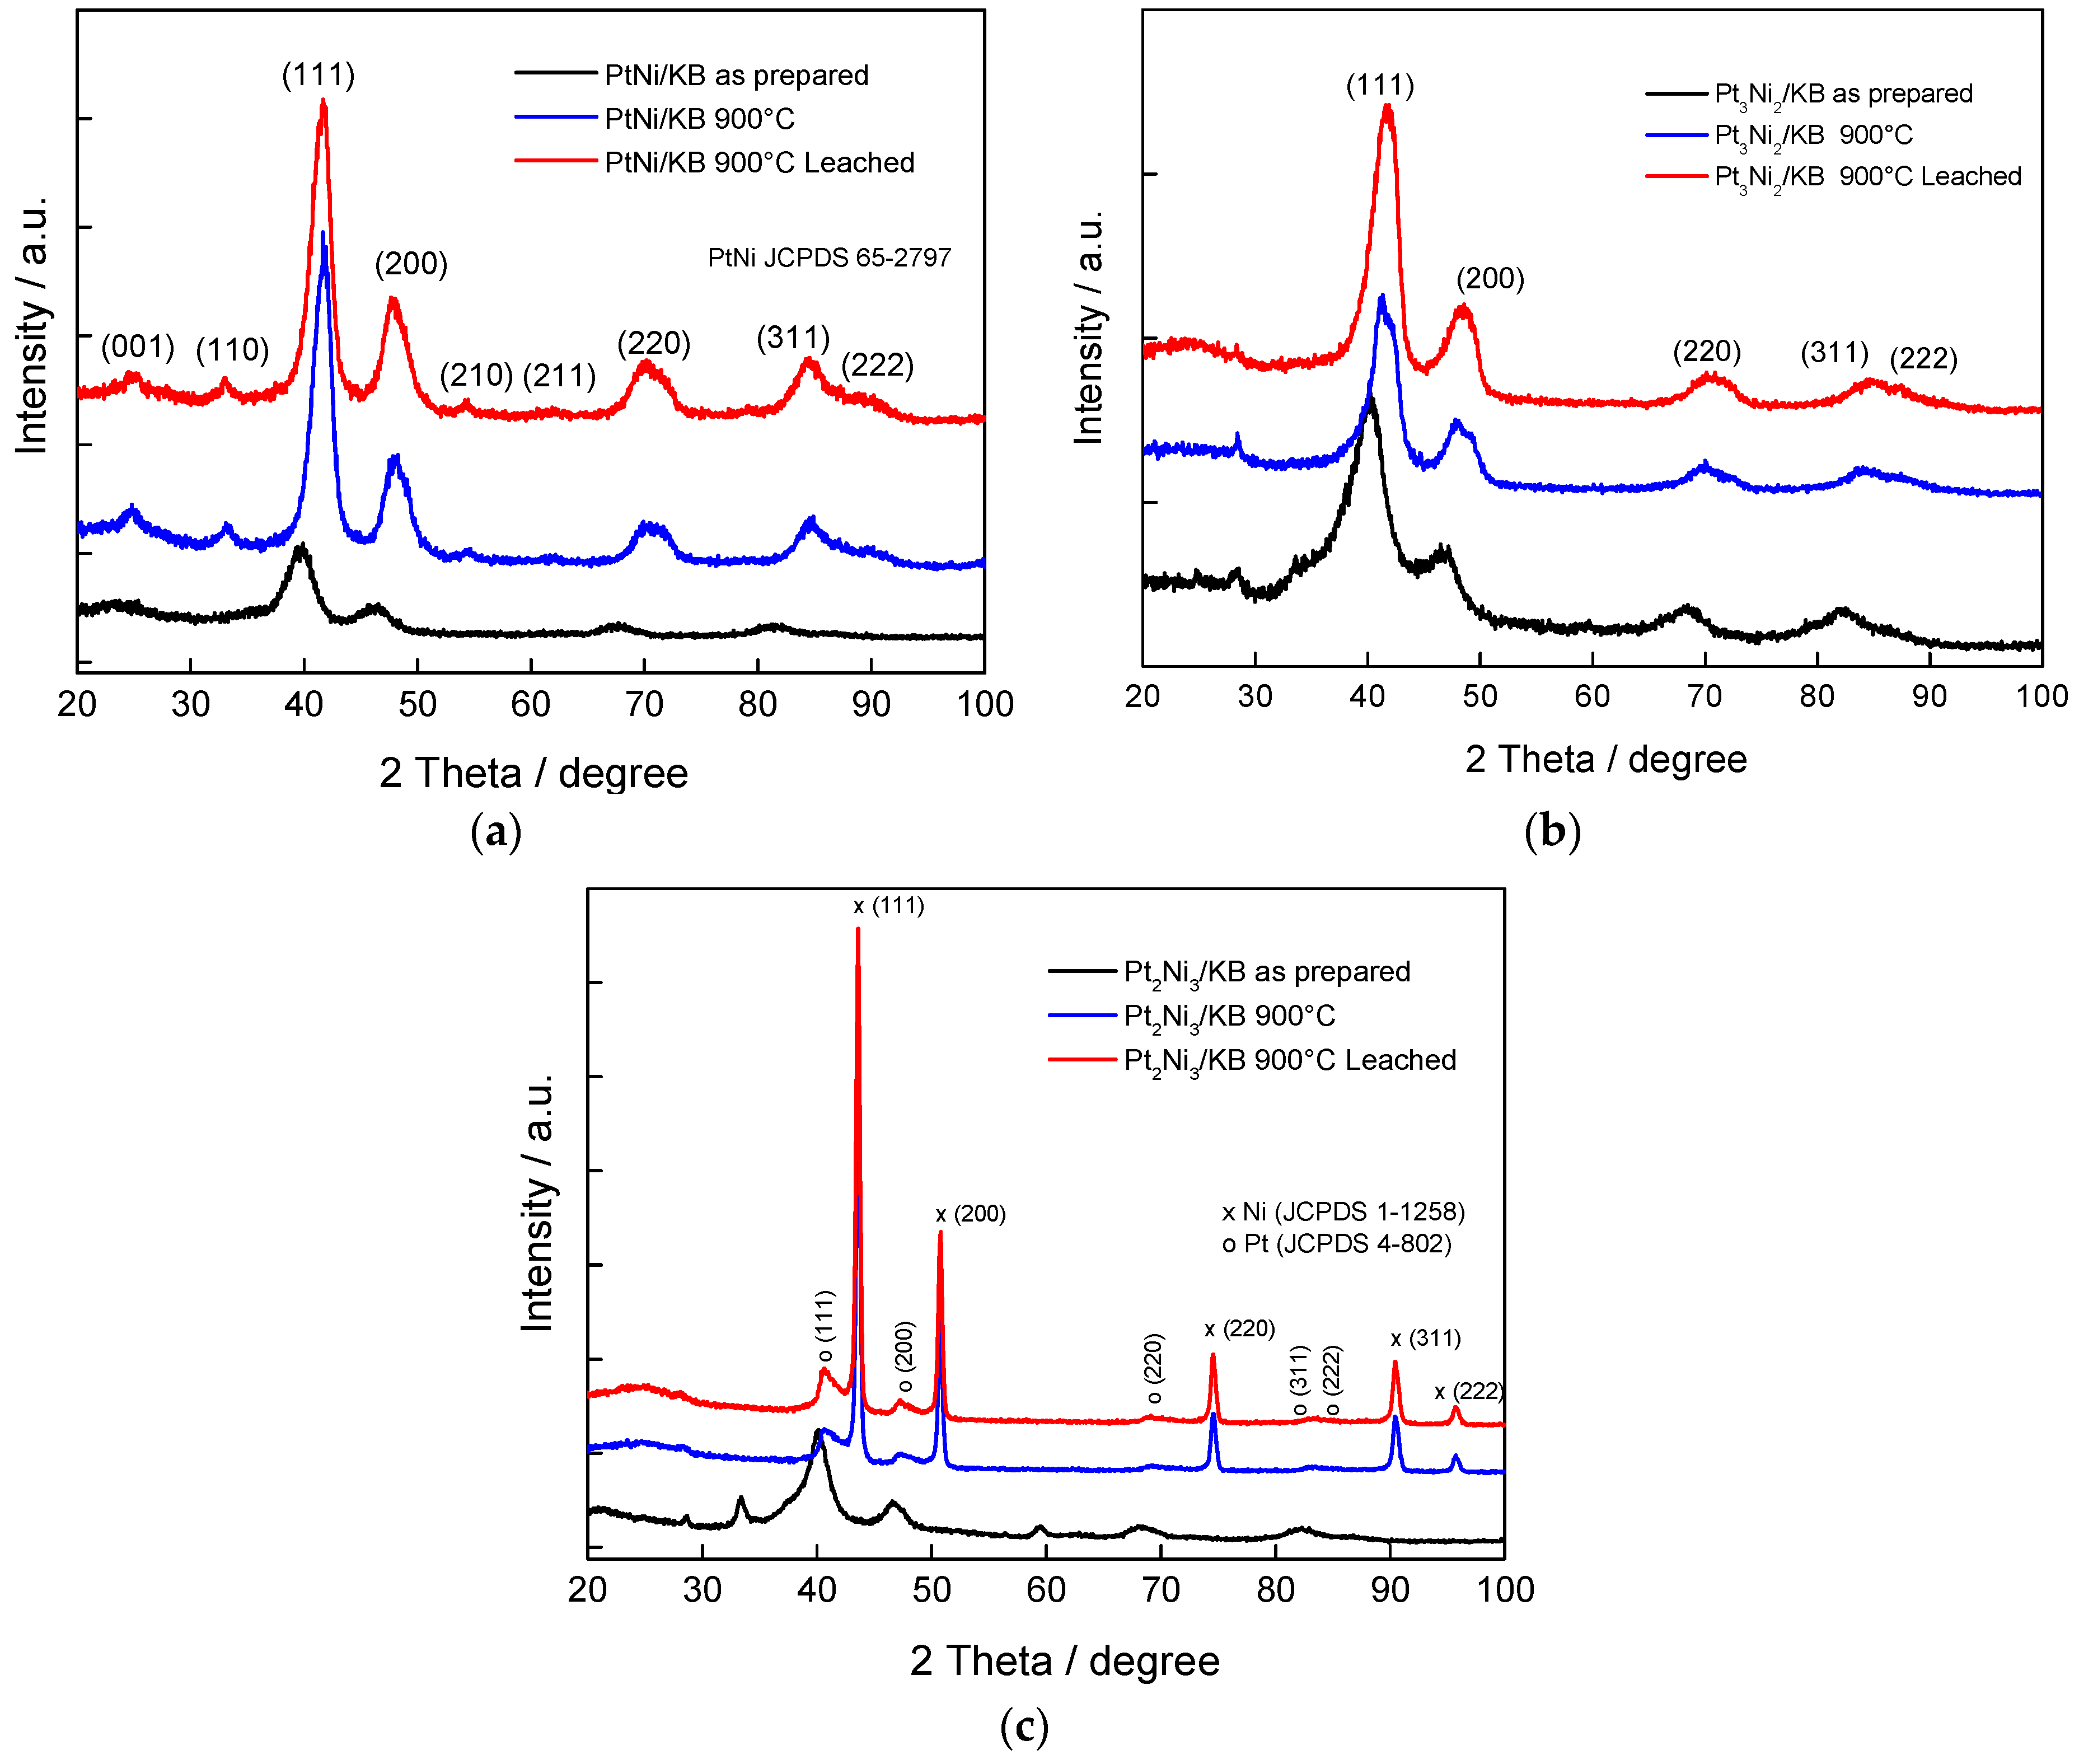
2.1. Physico-Chemical Characterization
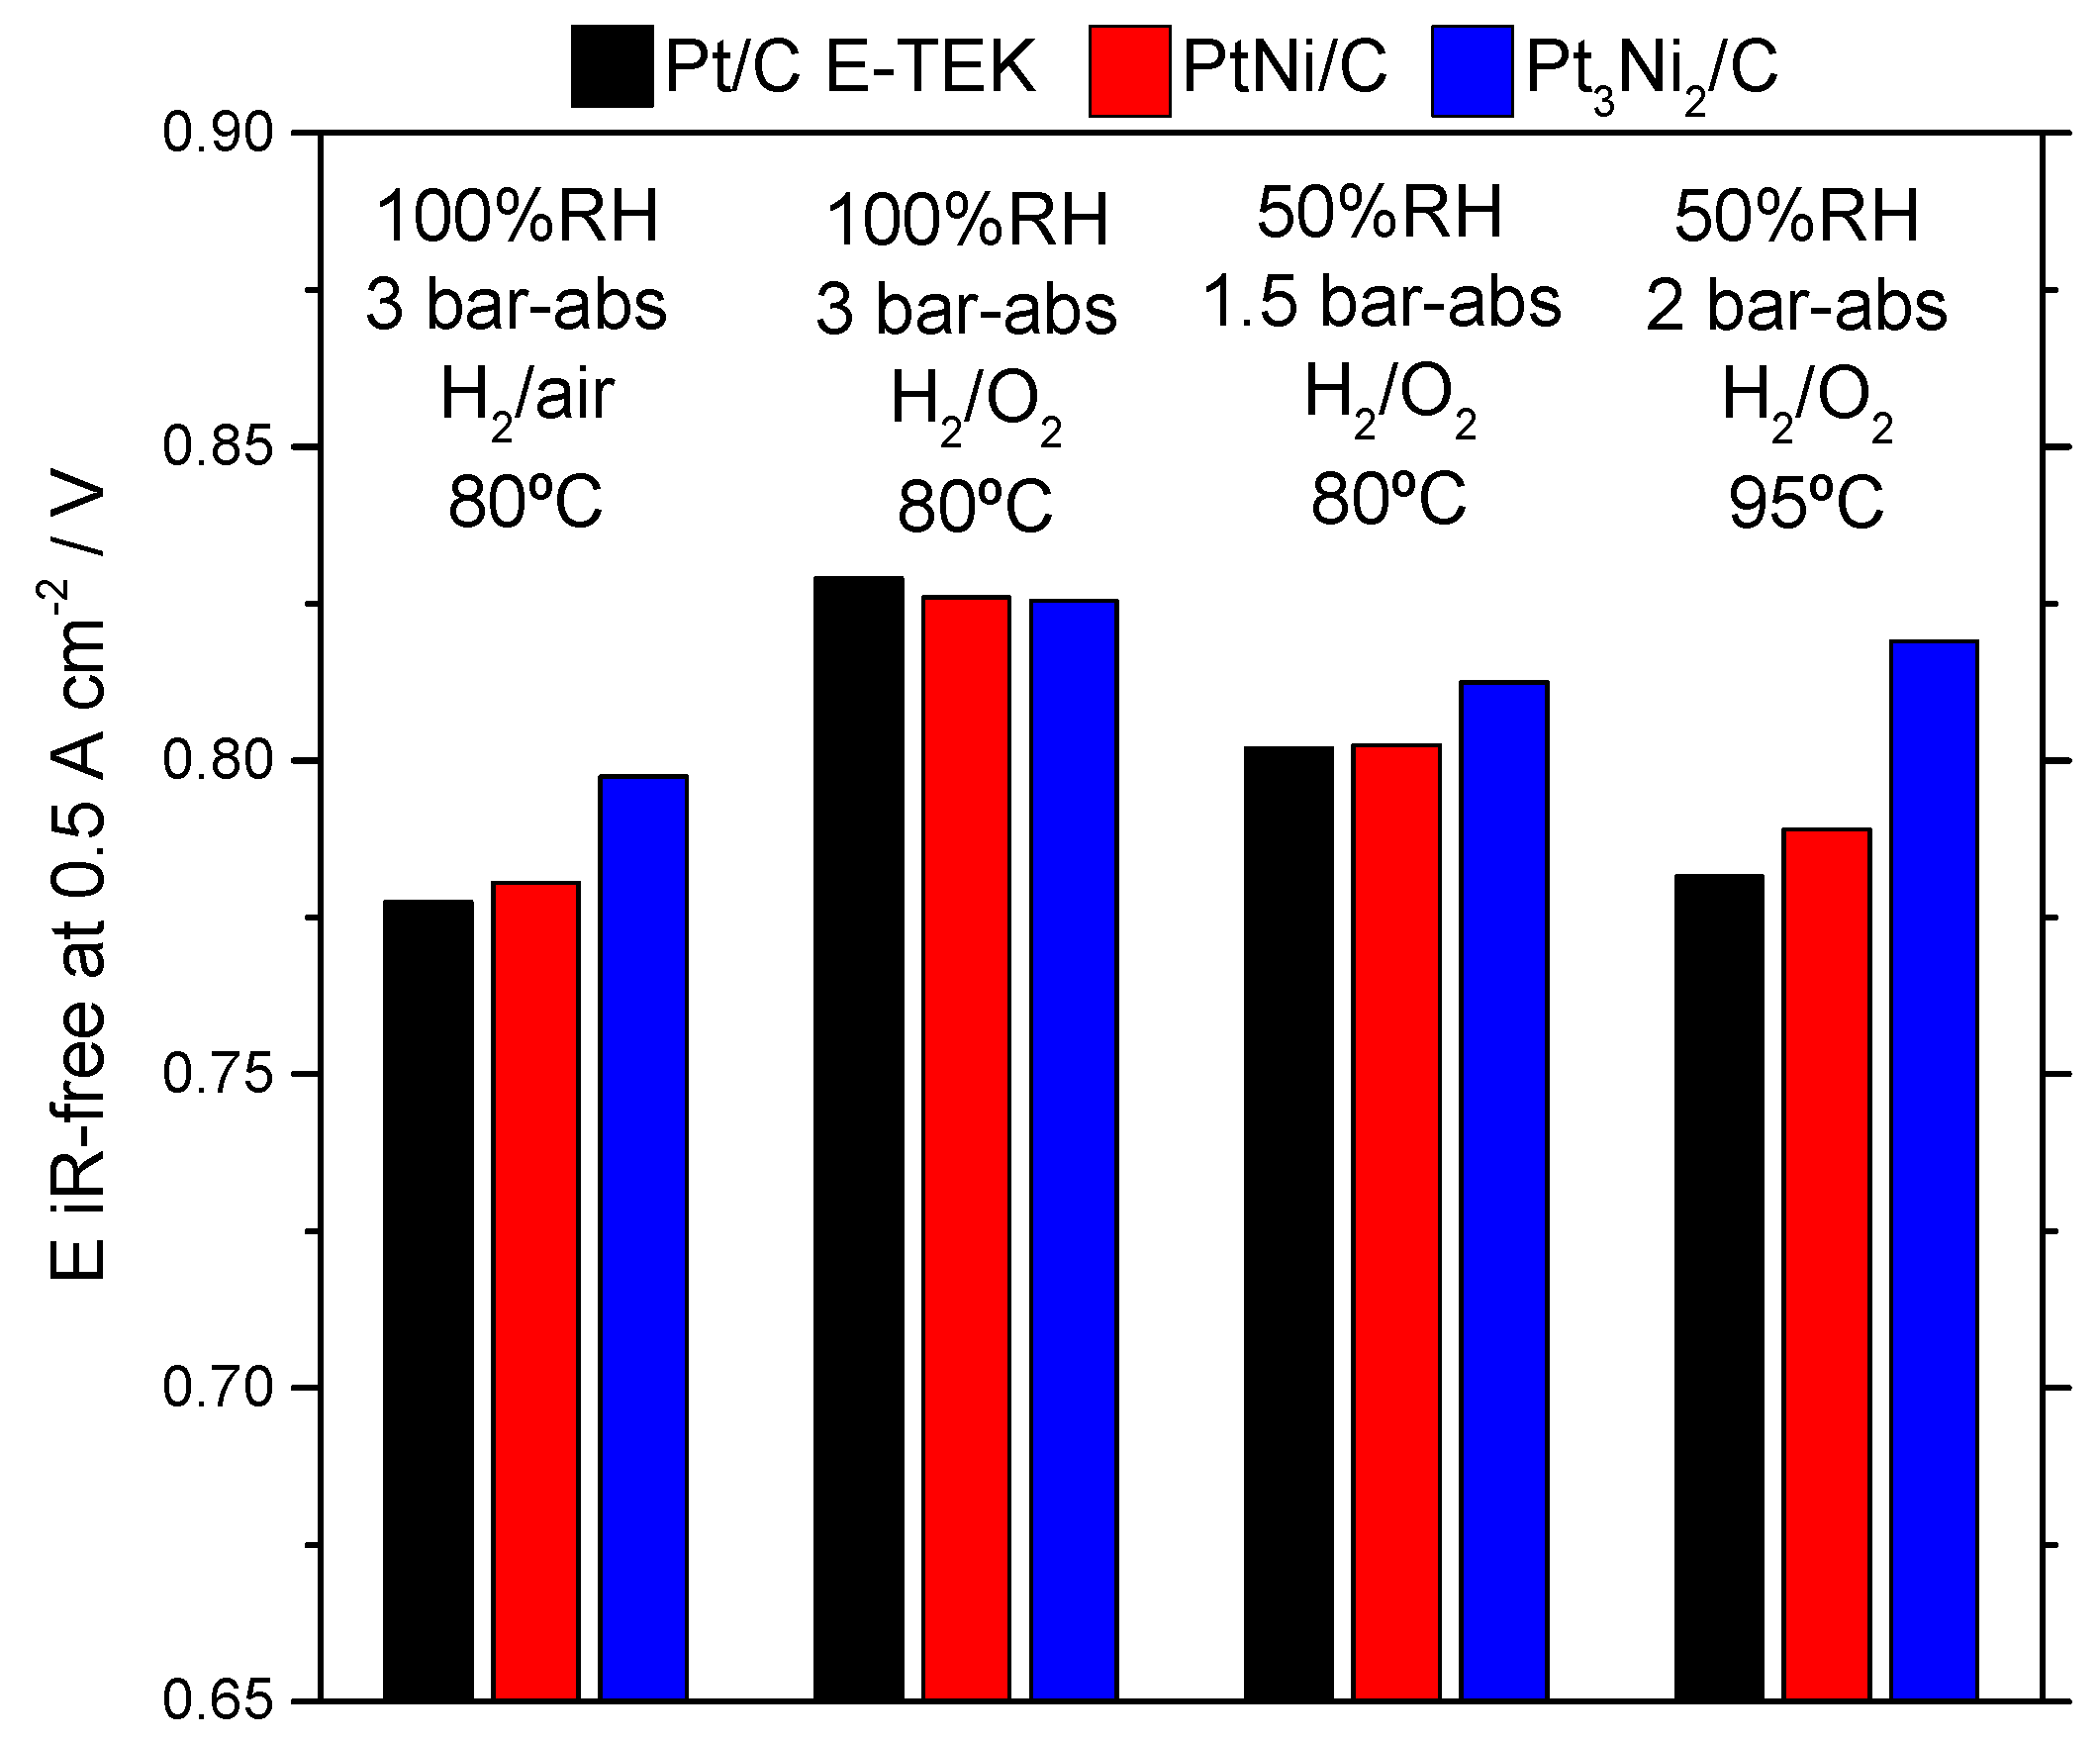
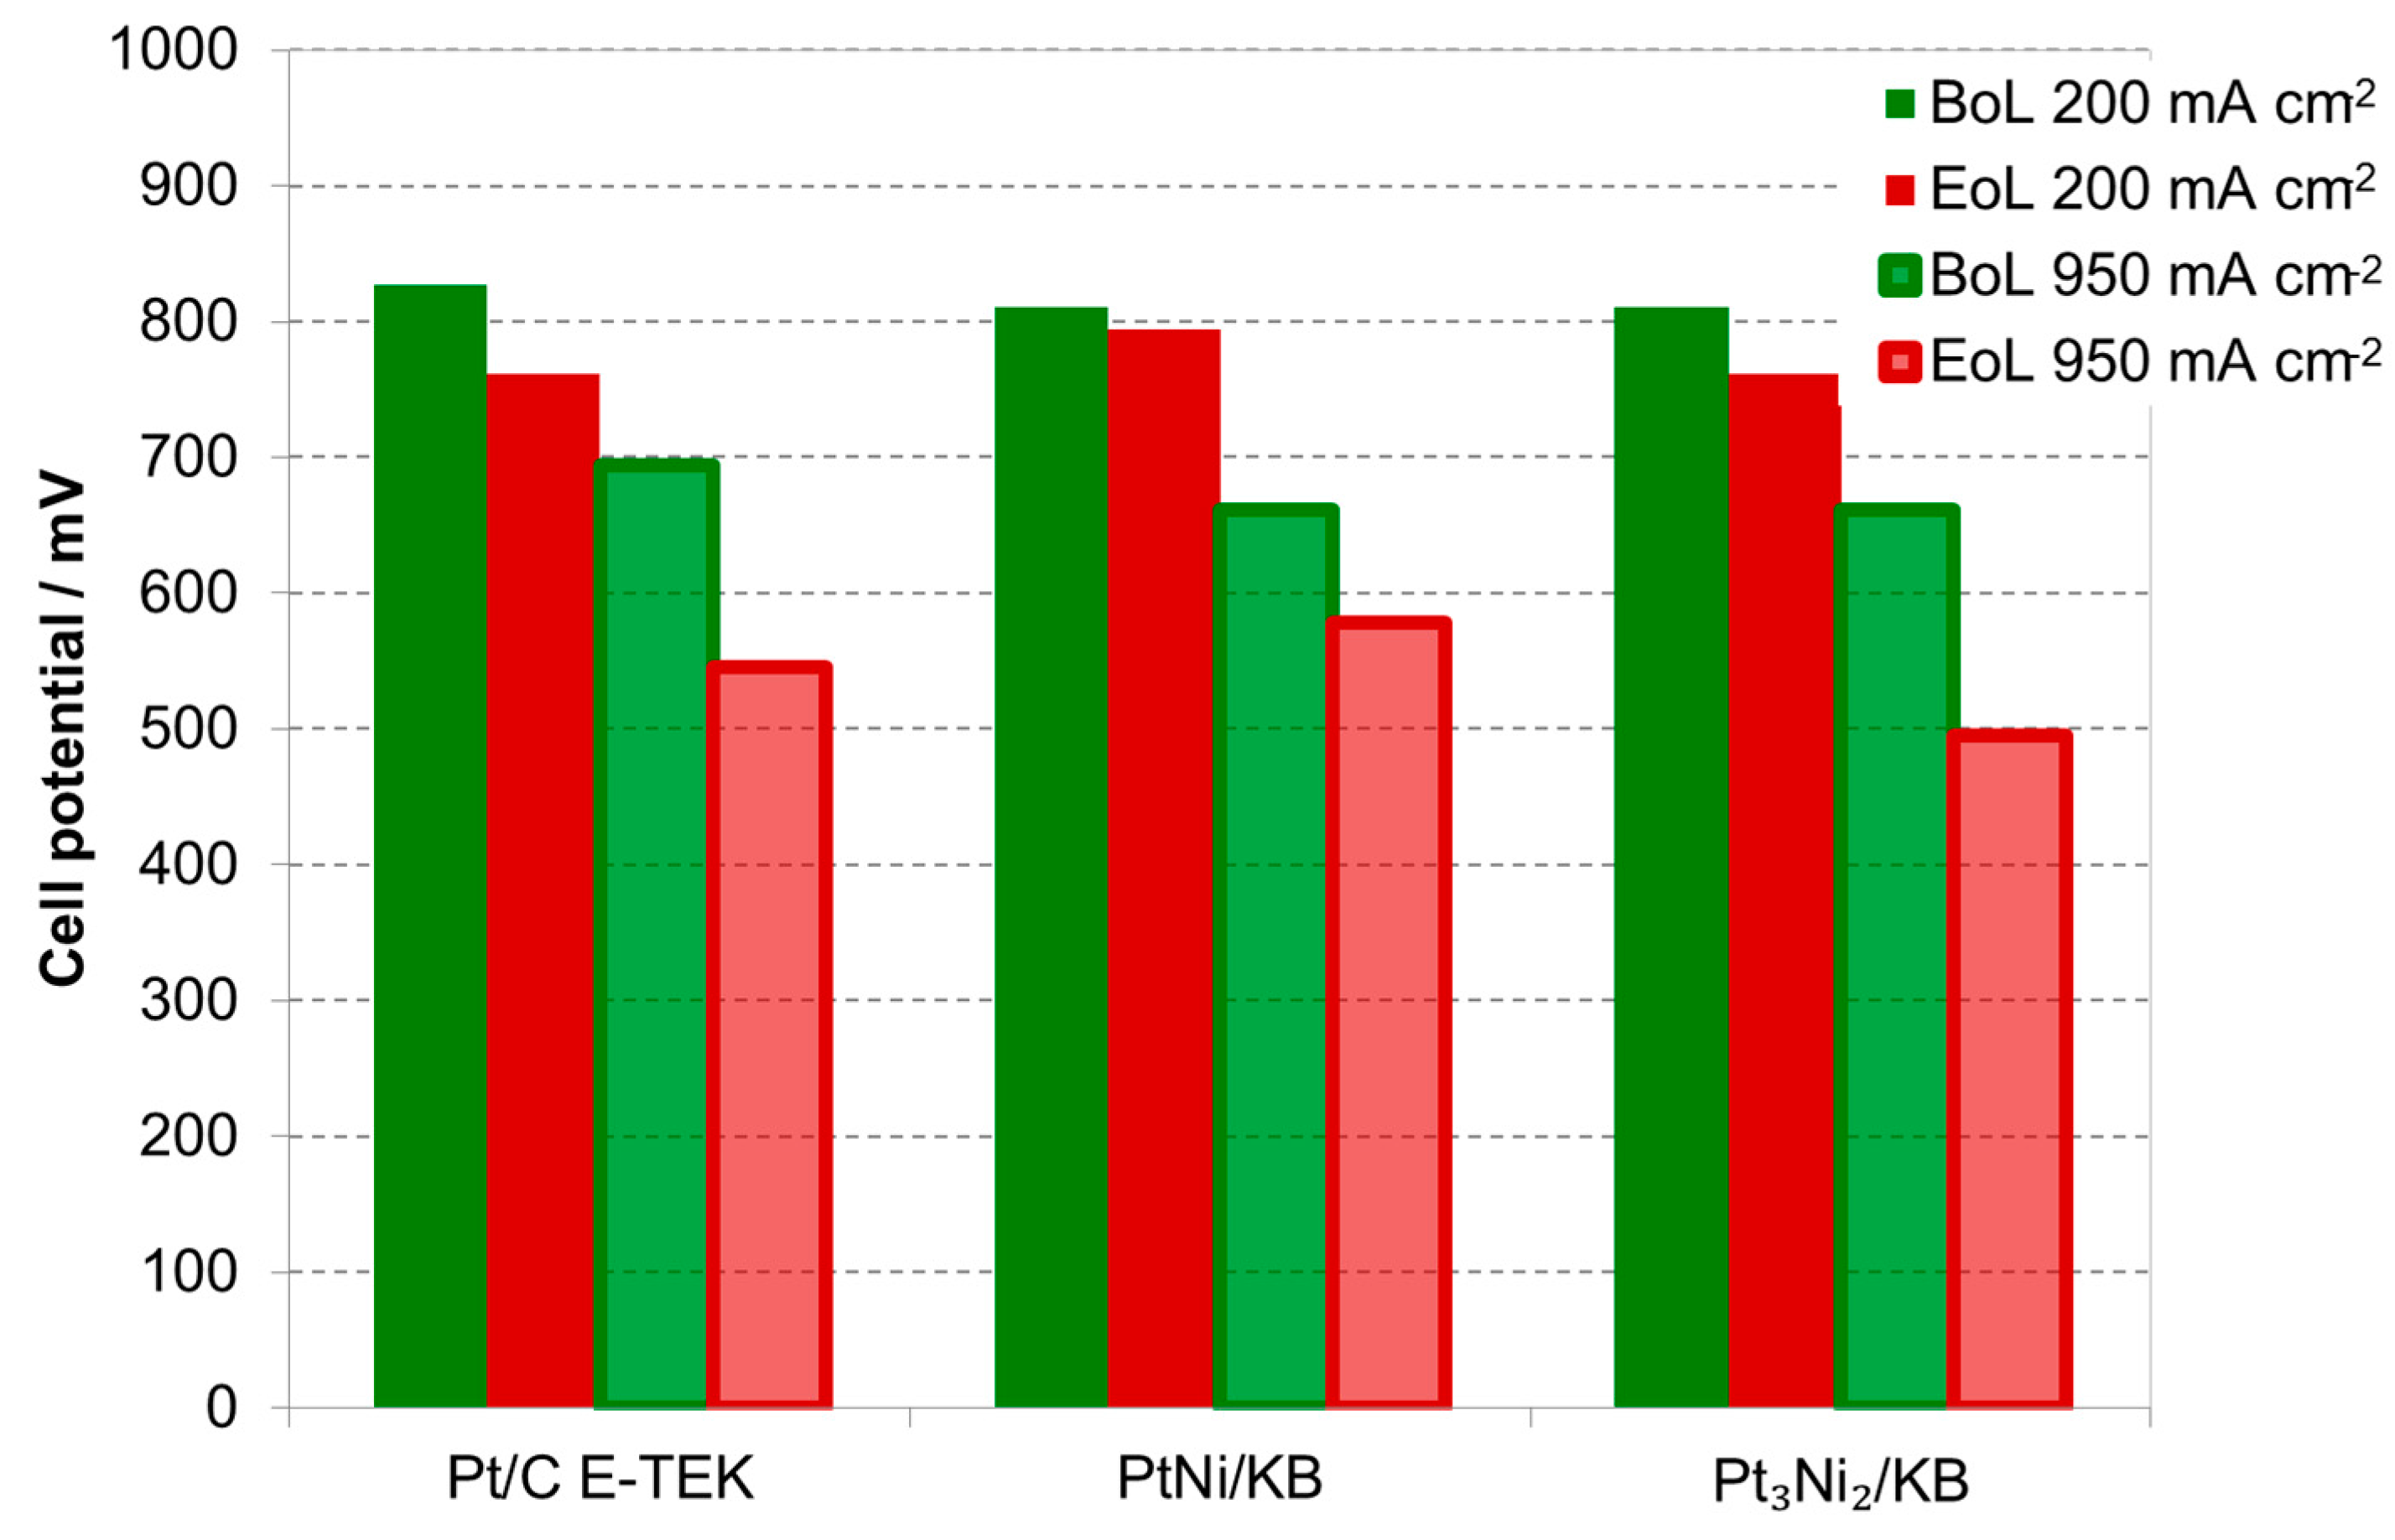
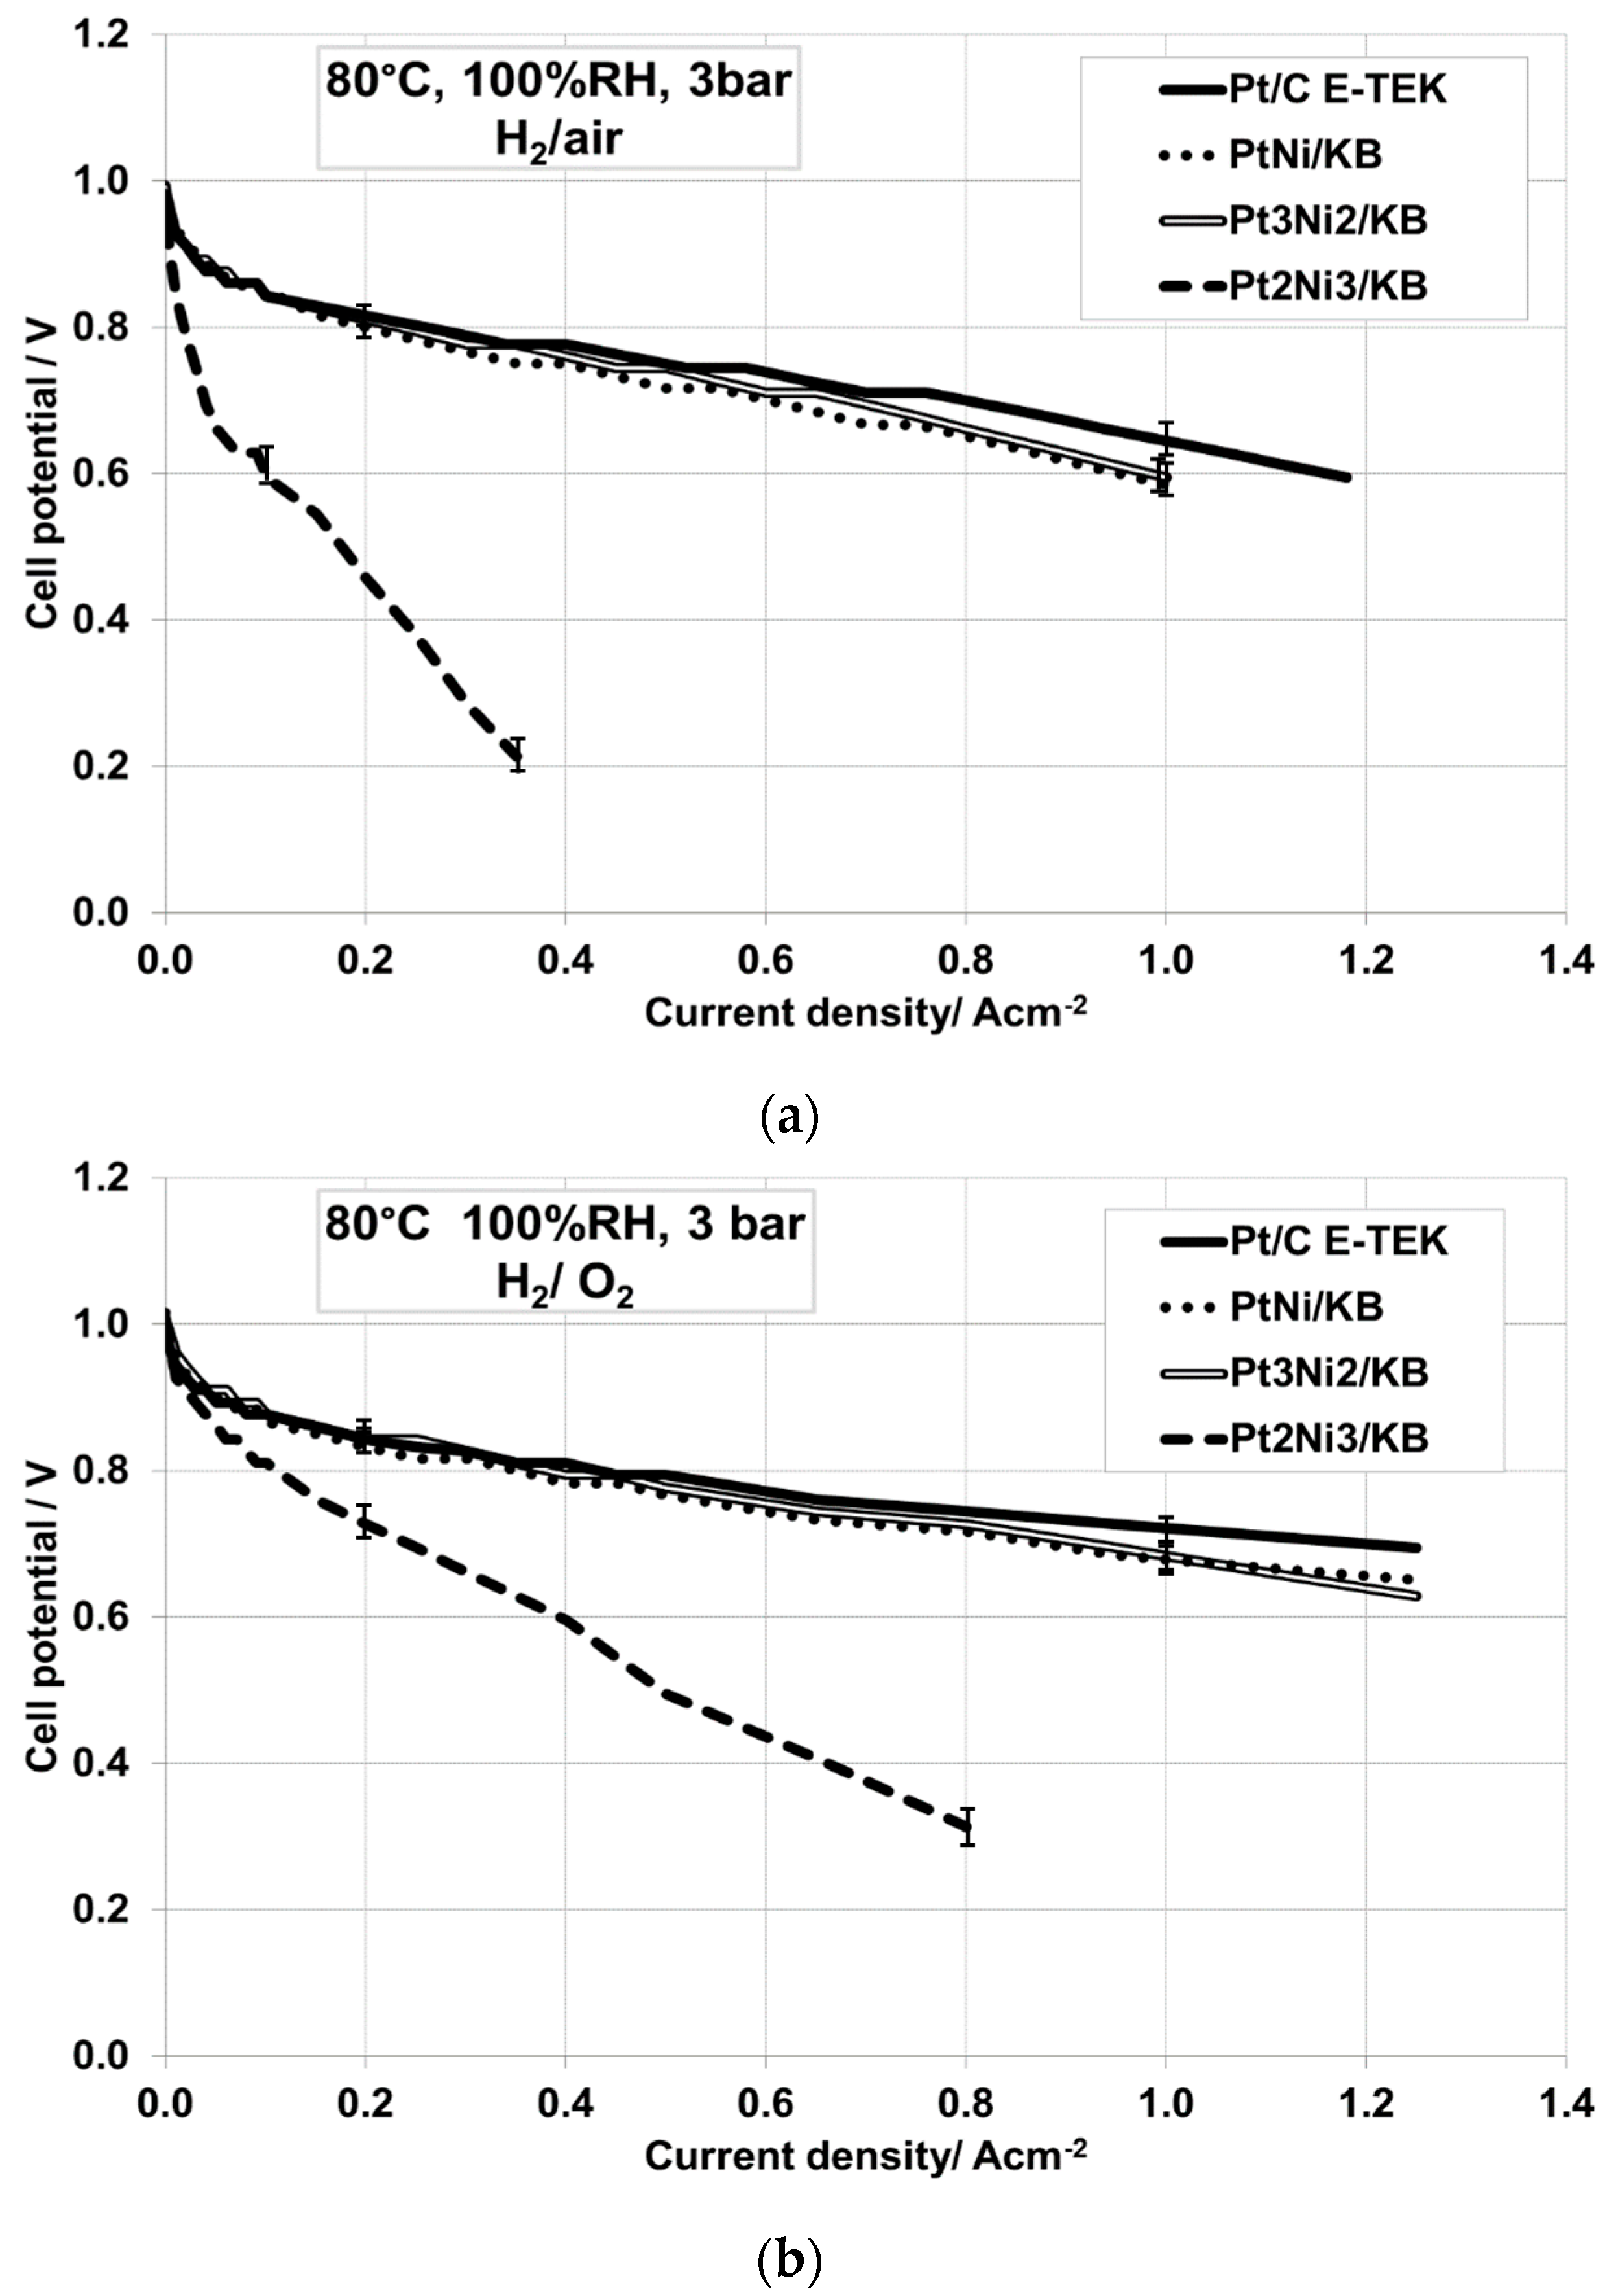
2.2. Electrochemical Characterization
3. Materials and Methods
3.1. Catalyst Preparation and Physico-Chemical Characterization
3.2. Electrodes and MEA Preparation
3.3. Electrochemical Studies
4. Conclusions
Supplementary Materials
Acknowledgments
Author Contributions
Conflicts of Interest
References
- Liu, Y.; Lehnert, W.; Janßen, H.; Samsun, R.C.; Stolten, D. A review of high-temperature polymer electrolyte membrane fuel-cell (HT-PEMFC)-based auxiliary power units for diesel-powered road vehicles. J. Power Source 2016, 311, 91–102. [Google Scholar] [CrossRef]
- Gasteiger, H.A.; Kocha, S.S.; Sompalli, B.; Wagner, F.T. Activity benchmarks and requirements for Pt, Pt-alloy, and non-Pt oxygen reduction catalysts for PEMFCs. Appl. Catal. B Environ. 2005, 56, 9–35. [Google Scholar] [CrossRef]
- Stassi, A.; Gatto, I.; Monforte, G.; Baglio, V.; Passalacqua, E.; Antonucci, V.; Aricò, A.S. The effect of thermal treatment on structure and surface composition of PtCo electro-catalysts for application in PEMFCs operating under automotive conditions. J. Power Source 2012, 208, 35–45. [Google Scholar] [CrossRef]
- Wu, H.; Wexler, D.; Wang, G. PtxNi alloy nanoparticles as cathode catalyst for PEM fuel cells with enhanced catalytic activity. J. Alloys Compd. 2009, 488, 195–198. [Google Scholar] [CrossRef]
- Hyun, K.; Lee, J.H.; Yoon, C.W.; Kwon, Y. The effect of platinum based bimetallic electrocatalysts on oxygen reduction reaction of proton exchange membrane fuel cells. Int. J. Electrochem. Sci. 2013, 8, 11752–11767. [Google Scholar]
- Zignani, S.C.; Antolini, E.; Gonzalez, E.R. Stability of Pt–Ni/C (1:1) and Pt/C electrocatalysts as cathode materials for polymer electrolyte fuel cells: Effect of ageing tests. J. Power Source 2009, 191, 344–350. [Google Scholar] [CrossRef]
- Stassi, A.; Gatto, I.; Baglio, V.; Passalacqua, E.; Aricò, A.S. Investigation of Pd-based electrocatalysts for oxygen reduction in PEMFCs operating under automotive conditions. J. Power Source 2013, 222, 390–399. [Google Scholar] [CrossRef]
- Mani, P.; Srivastava, R.; Strasser, P. Dealloyed binary PtM3 (M = Cu, Co, Ni) and ternary PtNi3M (M = Cu, Co, Fe, Cr) electrocatalysts for the oxygen reduction reaction: Performance in polymer electrolyte membrane fuel cells. J. Power Source 2011, 196, 666–673. [Google Scholar] [CrossRef]
- Jayasayee, K.; Van Veen, J.A.R.; Manivasagam, T.G.; Celebi, S.; Hensen, E.J.M.; de Bruijn, F.A. Oxygen reduction reaction (ORR) activity and durability of carbon supported PtM (Co, Ni, Cu) alloys: Influence of particle size and non-noble metals. Appl. Catal. B Environ. 2012, 111–112, 515–526. [Google Scholar] [CrossRef]
- Jeon, M.K.; Zhang, Y.; McGinn, P.J. A comparative study of PtCo, PtCr, and PtCoCr catalysts for oxygen electro-reduction reaction. Electrochim. Acta 2010, 55, 5318–5325. [Google Scholar] [CrossRef]
- Ishida, M.; Matsutani, K. Development of Pt-Co-Mn Ternary Alloy Catalyst for PEFCs. ECS Trans. 2014, 64, 107–112. [Google Scholar] [CrossRef]
- Negro, E.; Monteverde Videla, A.H.A.; Baglio, V.; Aricò, A.S.; Specchia, S.; Koper, G.J.M. Fe–N supported on graphitic carbon nano-networks grown from cobalt as oxygen reduction catalysts for low-temperature fuel cells. Appl. Catal. B Environ. 2015, 166–167, 75–83. [Google Scholar] [CrossRef]
- Monteverde Videla, A.H.A.; Osmieri, L.; Specchia, S. Non-noble Metal (NNM) Catalysts for Fuel Cells: Tuning the Activity by a Rational Step-by-Step Single Variable Evolution. In Electrochemistry of N4 Macrocyclic Metal Complexes; Zagal, J.H., Bedioui, F., Eds.; Springer International Publishing Switzerland: Cham, Switzerland, 2016; Volume 1, pp. 69–102. [Google Scholar]
- Serov, A.; Artyushkova, K.; Niangar, E.; Wang, C.; Dale, N.; Jaouen, F.; Sougrati, M.-T.; Jia, Q.; Mukerjee, S.; Atanassov, P. Nano-structured non-platinum catalysts for automotive fuel cell application. Nano Energy 2015, 16, 293–300. [Google Scholar] [CrossRef]
- Baldizzone, C.; Mezzavilla, S.; Carvalho, H.W.P.; Meier, J.C.; Schuppert, A.K.; Heggen, M.; Galeano, C.; Grunwaldt, J.-D.; Schuth, F.; Mayrhofer, K.J.J. Confined-Space Alloying of Nanoparticles for the Synthesis of Efficient PtNi Fuel-Cell Catalysts. Angew. Chem. Int. Ed. 2014, 53, 14250–14254. [Google Scholar] [CrossRef] [PubMed]
- Du, S.; Lu, Y.; Malladi, S.K.; Xu, Q.; Steinberger-Wilckens, R. A simple approach for PtNi-MWCNT hybrid nanostructures as high performance electrocatalysts for the oxygen reduction reaction. J. Mater. Chem. A 2014, 2, 692–698. [Google Scholar] [CrossRef]
- Choi, J.; Lee, Y.; Kim, J.; Lee, H. Enhancing stability of octahedral PtNi nanoparticles for oxygen reduction reaction by halide treatment. J. Power Source 2016, 307, 883–890. [Google Scholar] [CrossRef]
- Tuaev, X.; Rudi, S.; Petkov, V.; Hoell, A.; Strasser, P. In situ study of atomic structure transformations of Pt–Ni nanoparticle catalysts during electrochemical potential cycling. ACS Nano 2013, 7, 5666–5674. [Google Scholar] [CrossRef] [PubMed]
- Wu, J.B.; Yang, H. Synthesis and electrocatalytic oxygen reduction properties of truncated octahedral Pt3Ni nanoparticles. Nano Res. 2011, 4, 72–82. [Google Scholar] [CrossRef]
- Li, W.Z.; Haldar, P. Highly active carbon supported core-shell PtNi@Pt nanoparticles for oxygen reduction reaction. Electrochem. Solid State Lett. 2010, 13, B47–B49. [Google Scholar] [CrossRef]
- Huang, X.Q.; Zhu, E.B.; Chen, Y.; Li, Y.J.; Chiu, C.Y.; Xu, Y.X.; Lin, Z.Y.; Duan, X.F.; Huang, Y. A facile strategy to Pt3Ni nanocrystals with highly porous features as an enhanced oxygen reduction reaction catalyst. Adv. Mater. 2013, 25, 2974–2979. [Google Scholar] [CrossRef] [PubMed]
- Gan, L.; Heggen, M.; Rudi, S.; Strasser, P. Core-shell compositional fine structures of dealloyed PtxNi1−x nanoparticles and their impact on oxygen reduction catalysis. Nano Lett. 2012, 12, 5423–5430. [Google Scholar] [CrossRef] [PubMed]
- van der Vliet, D.; Wang, C.; Debeb, M.; Atanasoski, R.; Markovic, N.M.; Stamenkovic, V.R. Platinum-alloy nanostructured thin film catalysts for the oxygen reduction reaction. Electrochim. Acta 2011, 56, 8695–8699. [Google Scholar] [CrossRef]
- Stamenkovic, V.R.; Fowler, B.; Mun, B.S.; Wang, G.F.; Ross, P.N.; Lucas, C.A.; Markovic, N.M. Improved oxygen reduction activity on Pt3Ni (111) via increased surface site availability. Science 2007, 315, 493–497. [Google Scholar] [CrossRef] [PubMed]
- Oezaslan, M.; Hasché, F.; Strasser, P. Pt-Based Core–Shell Catalyst Architectures for Oxygen Fuel Cell Electrodes. J. Phys. Chem. Lett. 2013, 4, 3273–3291. [Google Scholar] [CrossRef]
- Gan, L.; Cui, C.H.; Rudi, S.; Strasser, P. Core-shell and nanoporous particle architectures and their effect on the activity and stability of Pt ORR electrocatalysts. Top. Catal. 2014, 57, 236–244. [Google Scholar] [CrossRef]
- Chen, S.; Sheng, W.; Yabuuchi, N.; Ferreira, P.J.; Allard, L.F.; Shao-Horn, Y. Origin of oxygen reduction reaction activity on “Pt3Co” nanoparticles: Atomically resolved chemical compositions and structures. J. Phys. Chem. C 2009, 113, 1109–1125. [Google Scholar] [CrossRef]
- Stassi, A.; Modica, E.; Antonucci, V.; Aricò, A.S. A Half Cell Study of Performance and Degradation of Oxygen Reduction Catalysts for Application in Low Temperature Fuel Cells. Fuel Cells 2009, 9, 201–208. [Google Scholar] [CrossRef]
- Han, B.H.; Carlton, C.E.; Kongkanand, A.; Kukreja, R.S.; Theobald, B.R.; Gan, L.; O’Malley, R.; Strasser, P.; Wagner, F.T.; Shao-Horn, Y. Record activity and stability of dealloyed bimetallic catalysts for proton exchange membrane fuel cells. Energy Environ. Sci. 2015, 8, 258–266. [Google Scholar] [CrossRef]
- Peng, X.; Zhao, S.; Omasta, T.J.; Roller, J.M.; Mustain, W.E. Activity and durability of Pt-Ni nanocage electocatalysts in proton exchange membrane fuel cells. Appl. Catal. B Environ. 2017, 203, 927–935. [Google Scholar] [CrossRef]
- Da Silva, F.T.; Dalmazzo, V.A.; Becker, M.R.; de Souza, M.O.; de Souza, R.F.; Martini, E.M.A. Effect of Ni proportion on the performance of proton exchange membrane fuel cells using PtNi/C electrocatalysts. Ionics 2014, 20, 381–388. [Google Scholar] [CrossRef]
- Kuhl, S.; Strasser, P. Oxygen Electrocatalysis on Dealloyed Pt Nanocatalysts. Top. Catal. 2016, 59, 1628–1637. [Google Scholar] [CrossRef]
- Zou, L.; Fan, J.; Zhou, Y.; Wang, C.; Li, J.; Zou, Z.; Yang, H. Conversion of PtNi alloy from disordered to ordered for enhanced activity and durability in methanol-tolerant oxygen reduction reactions. Nano Res. 2015, 8, 2777–2788. [Google Scholar] [CrossRef]
- Gonzalez, E.R.; Ticianelli, E.A.; Pinheiro, A.I.N.; Perez, J. Processo de obtenção de catalisador de platina dispersa ancorada em substrato através da redução por ácido. Brazilian Patent INPI-SP No. 00321, 2 September 1997. [Google Scholar]
- Moulder, J.F.; Stickle, W.F.; Sobol, P.E.; Bomben, K.D. Handbook of X-ray Photoelectron Spectroscopy; Physical Electronics, Inc.: Eden Prairie, MN, USA, 1995. [Google Scholar]
- Arico, A.S.; Stassi, A.; Modica, E.; Ornelas, R.; Gatto, I.; Passalacqua, E.; Antonucci, V. Performance and degradation of high temperature polymer electrolyte fuel cell catalysts. J. Power Source 2008, 178, 525–536. [Google Scholar] [CrossRef]
- Gatto, I.; Stassi, A.; Baglio, V.; Carbone, A.; Passalacqua, E.; Aricò, A.S.; Schuster, M.; Bauer, B. Optimization of perfluorosulphonic ionomer amount in gas diffusion electrodes for PEMFC operation under automotive conditions. Electrochim. Acta 2015, 165, 450–455. [Google Scholar] [CrossRef]
- Gatto, I.; Saccà, A.; Carbone, A.; Pedicini, R.; Urbani, F.; Passalacqua, E. CO-tolerant electrodes developed with PhosphoMolybdic Acid for Polymer Electrolyte Fuel Cell (PEFCs) application. J. Power Sources 2007, 171, 540–545. [Google Scholar] [CrossRef]


| Sample Catalyst | Position (200), ° 2θ | Crystallite Size, nm | Lattice Parameter (200), nm | XNi Alloy, % |
|---|---|---|---|---|
| PtNi/KB | 70.348 | 2.7 | 0.378 | 35 |
| Pt3Ni2/KB | 70.608 | 2.3 | 0.377 | 38 |
| Pt2Ni3/KB | 69.617 | 6.5 | 0.382 | 26 |
| Sample | Chemical States | Relative Peak Area (%) | BE (eV) |
|---|---|---|---|
| PtNi/KB | 4f7/2 | ||
| Metallic Pt | 48.19 | 71.11 | |
| Pt2+ | 51.81 | 71.49 | |
| 2p3/2 | |||
| Metallic Ni | 2.53 | 853.38 | |
| NiO | 3.29 | 855.18 | |
| NiOOH | 70.95 | 856.28 | |
| Ni(OH)2 | 23.23 | 857.71 | |
| Pt3Ni2/KB | 4f7/2 | ||
| Metallic Pt | 16.88 | 71.51 | |
| Pt2+ | 70.88 | 71.80 | |
| Pt4+ | 12.24 | 73.46 | |
| 2p3/2 | |||
| Metallic Ni | 19.74 | 852.86 | |
| NiO | 7.19 | 854.74 | |
| NiOOH | 36.64 | 856.12 | |
| Ni(OH)2 | 36.43 | 862.16 | |
| Pt2Ni3/KB | 4f7/2 | ||
| Metallic Pt | 3.96 | 71.34 | |
| Pt2+ | 88.38 | 71.43 | |
| Pt4+ | 7.66 | 73.27 | |
| 2p3/2 | |||
| Metallic Ni | 5.67 | 854.18 | |
| NiO | 34.84 | 855.75 | |
| NiOOH | 23.35 | 857.06 | |
| Ni(OH)2 | 36.14 | 858.71 |
| Operating Conditions | Sample Catalyst | OCV, V | R Cell, Ω·cm2 | E @ 500 mA·cm−2, V |
|---|---|---|---|---|
| 80 °C, 100% RH, 3 barabs, H2/air | Pt/C E-TEK | 0.976 | 0.067 | 0.744 |
| PtNi/KB | 0.982 | 0.127 | 0.717 | |
| Pt3Ni2/KB | 0.993 | 0.107 | 0.744 | |
| Pt2Ni3/KB | 0.943 | 0.250 | - | |
| 80 °C, 100% RH, 3 barabs, H2/O2 | Pt/C E-TEK | 0.993 | 0.070 | 0.794 |
| PtNi/KB | 1.015 | 0.118 | 0.767 | |
| Pt3Ni2/KB | 1.009 | 0.097 | 0.777 | |
| Pt2Ni3/KB | 1.009 | 0.199 | 0.495 | |
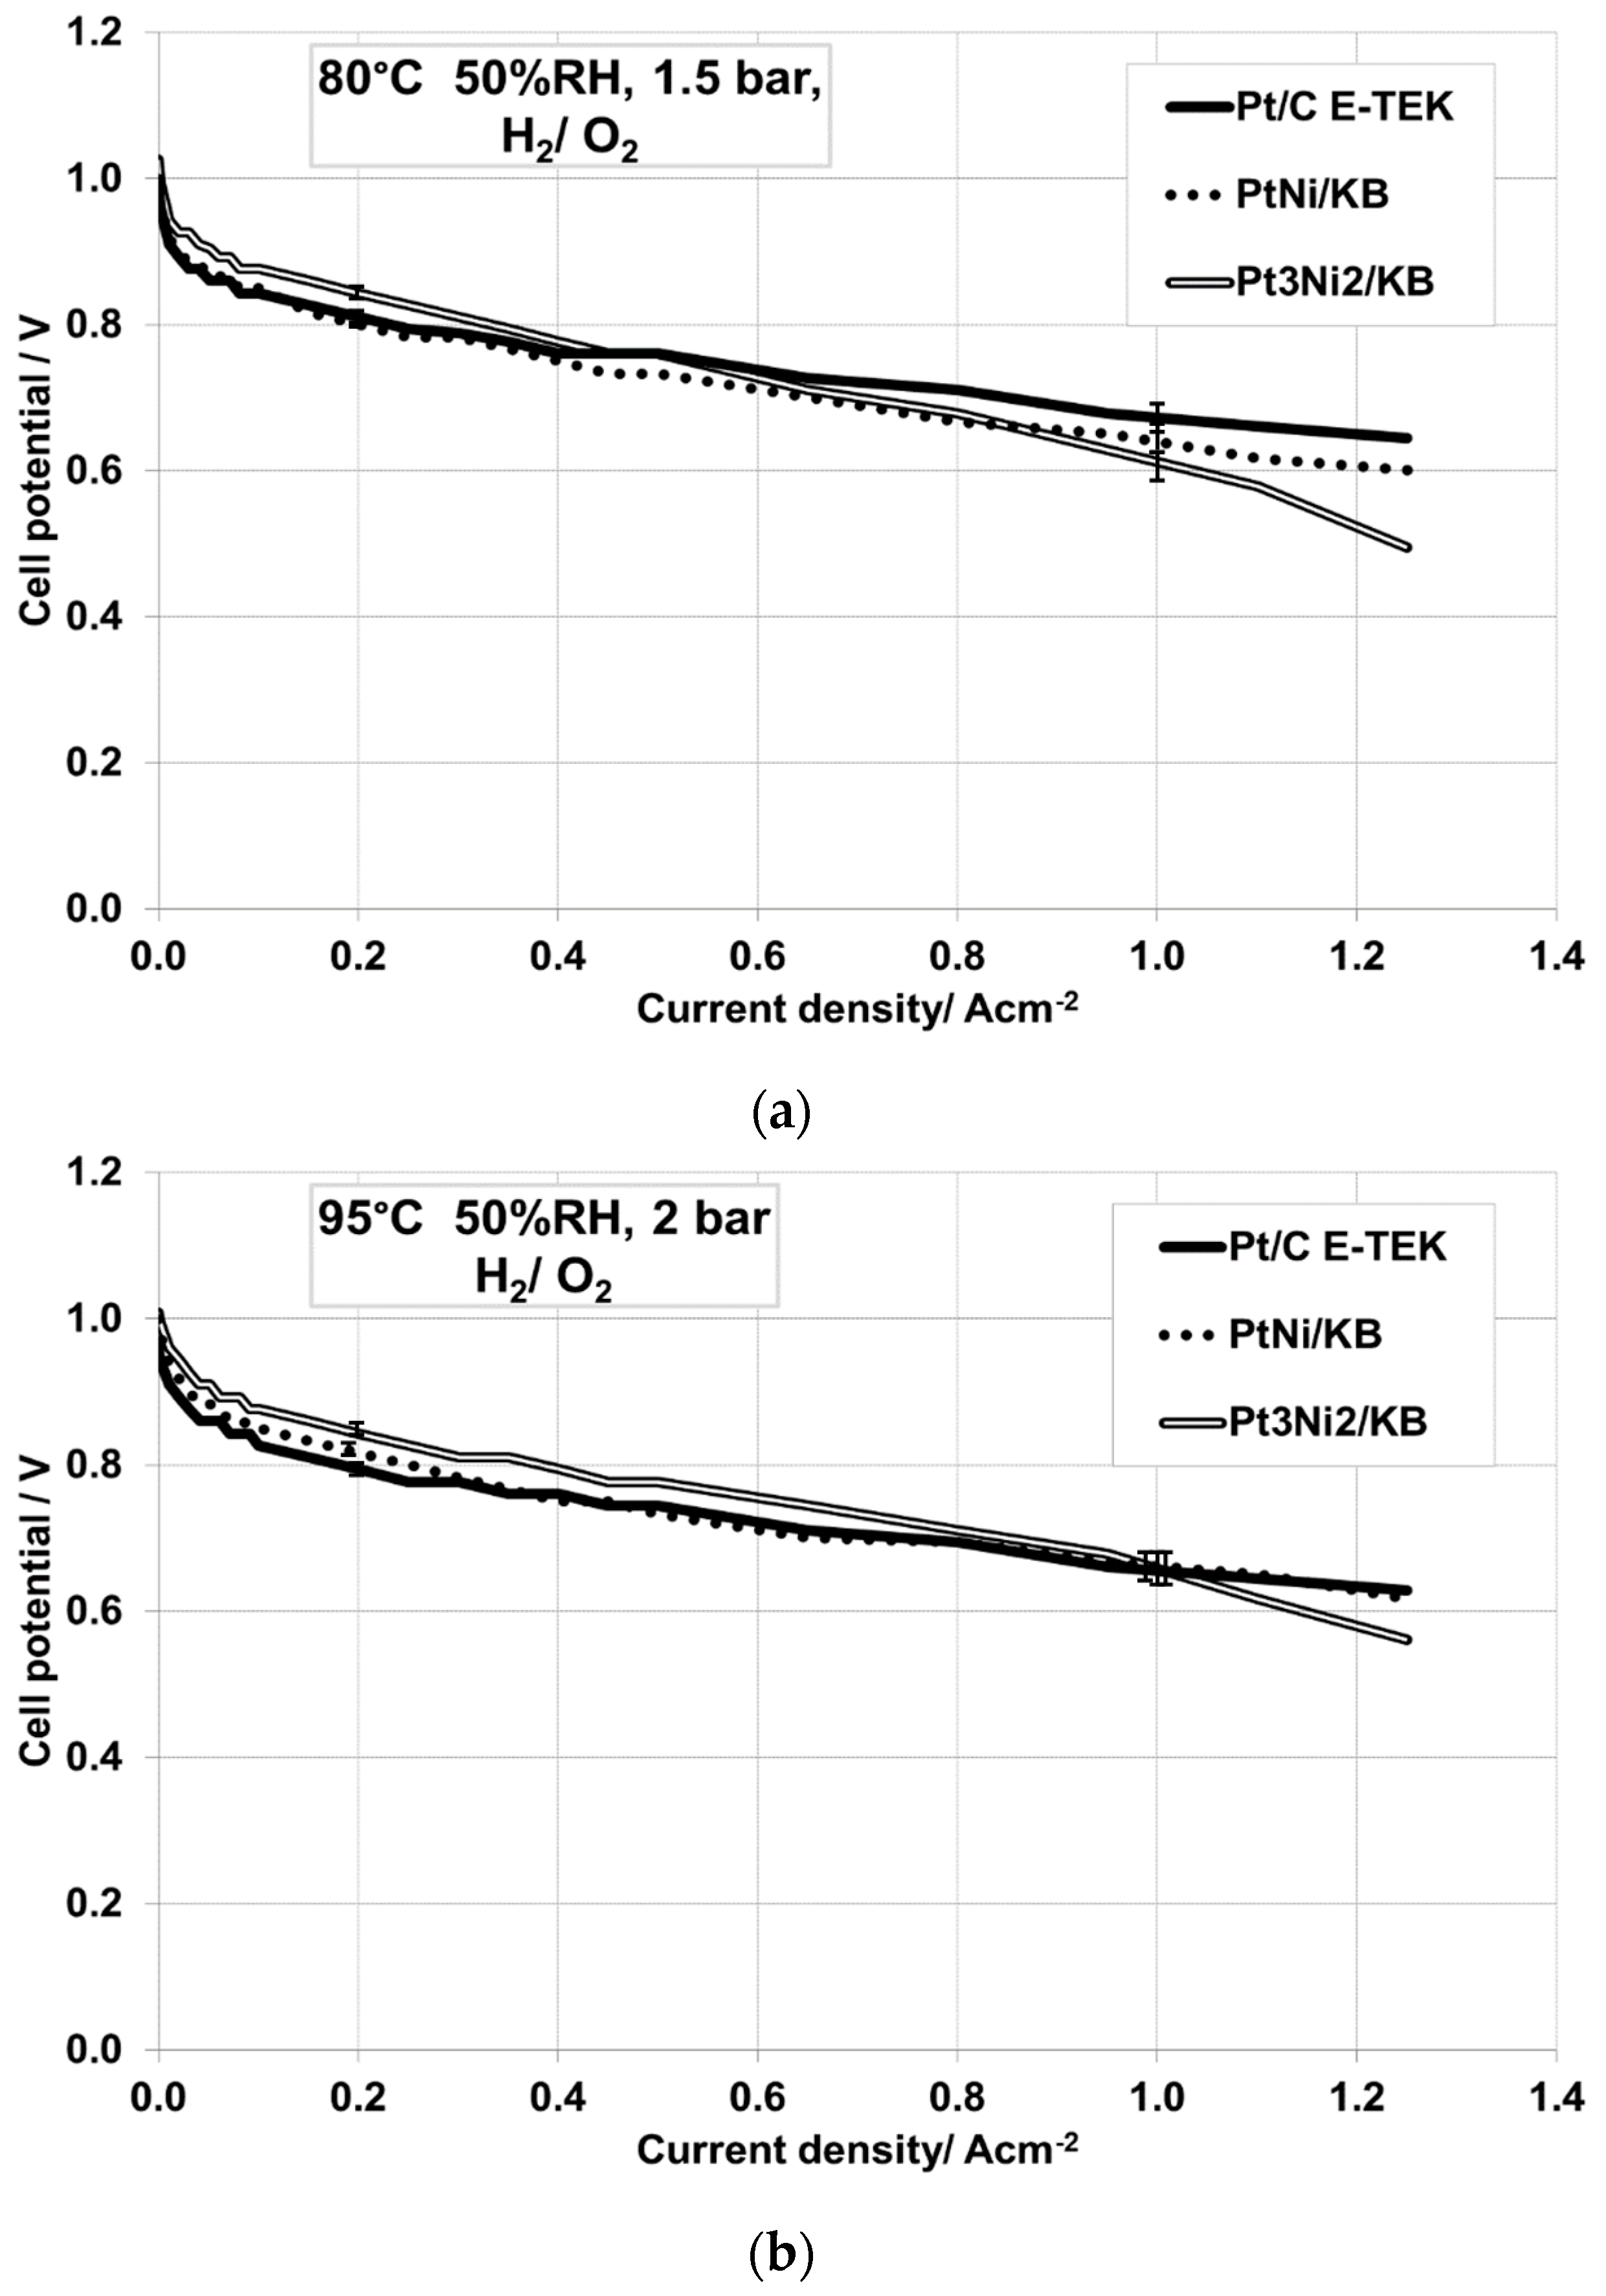
| 80 °C, 50% RH, 1.5 barabs, H2/O2 | Pt/C E-TEK | 0.993 | 0.082 | 0.761 |
| PtNi/KB | 0.999 | 0.139 | 0.733 | |
| Pt3Ni2/KB | 1.026 | 0.103 | 0.761 | |
| 95 °C, 50% RH, 2 barabs, H2/O2 | Pt/C E-TEK | 0.960 | 0.075 | 0.744 |
| PtNi/KB | 1.000 | 0.112 | 0.733 | |
| Pt3Ni2/KB | 1.000 | 0.084 | 0.777 |
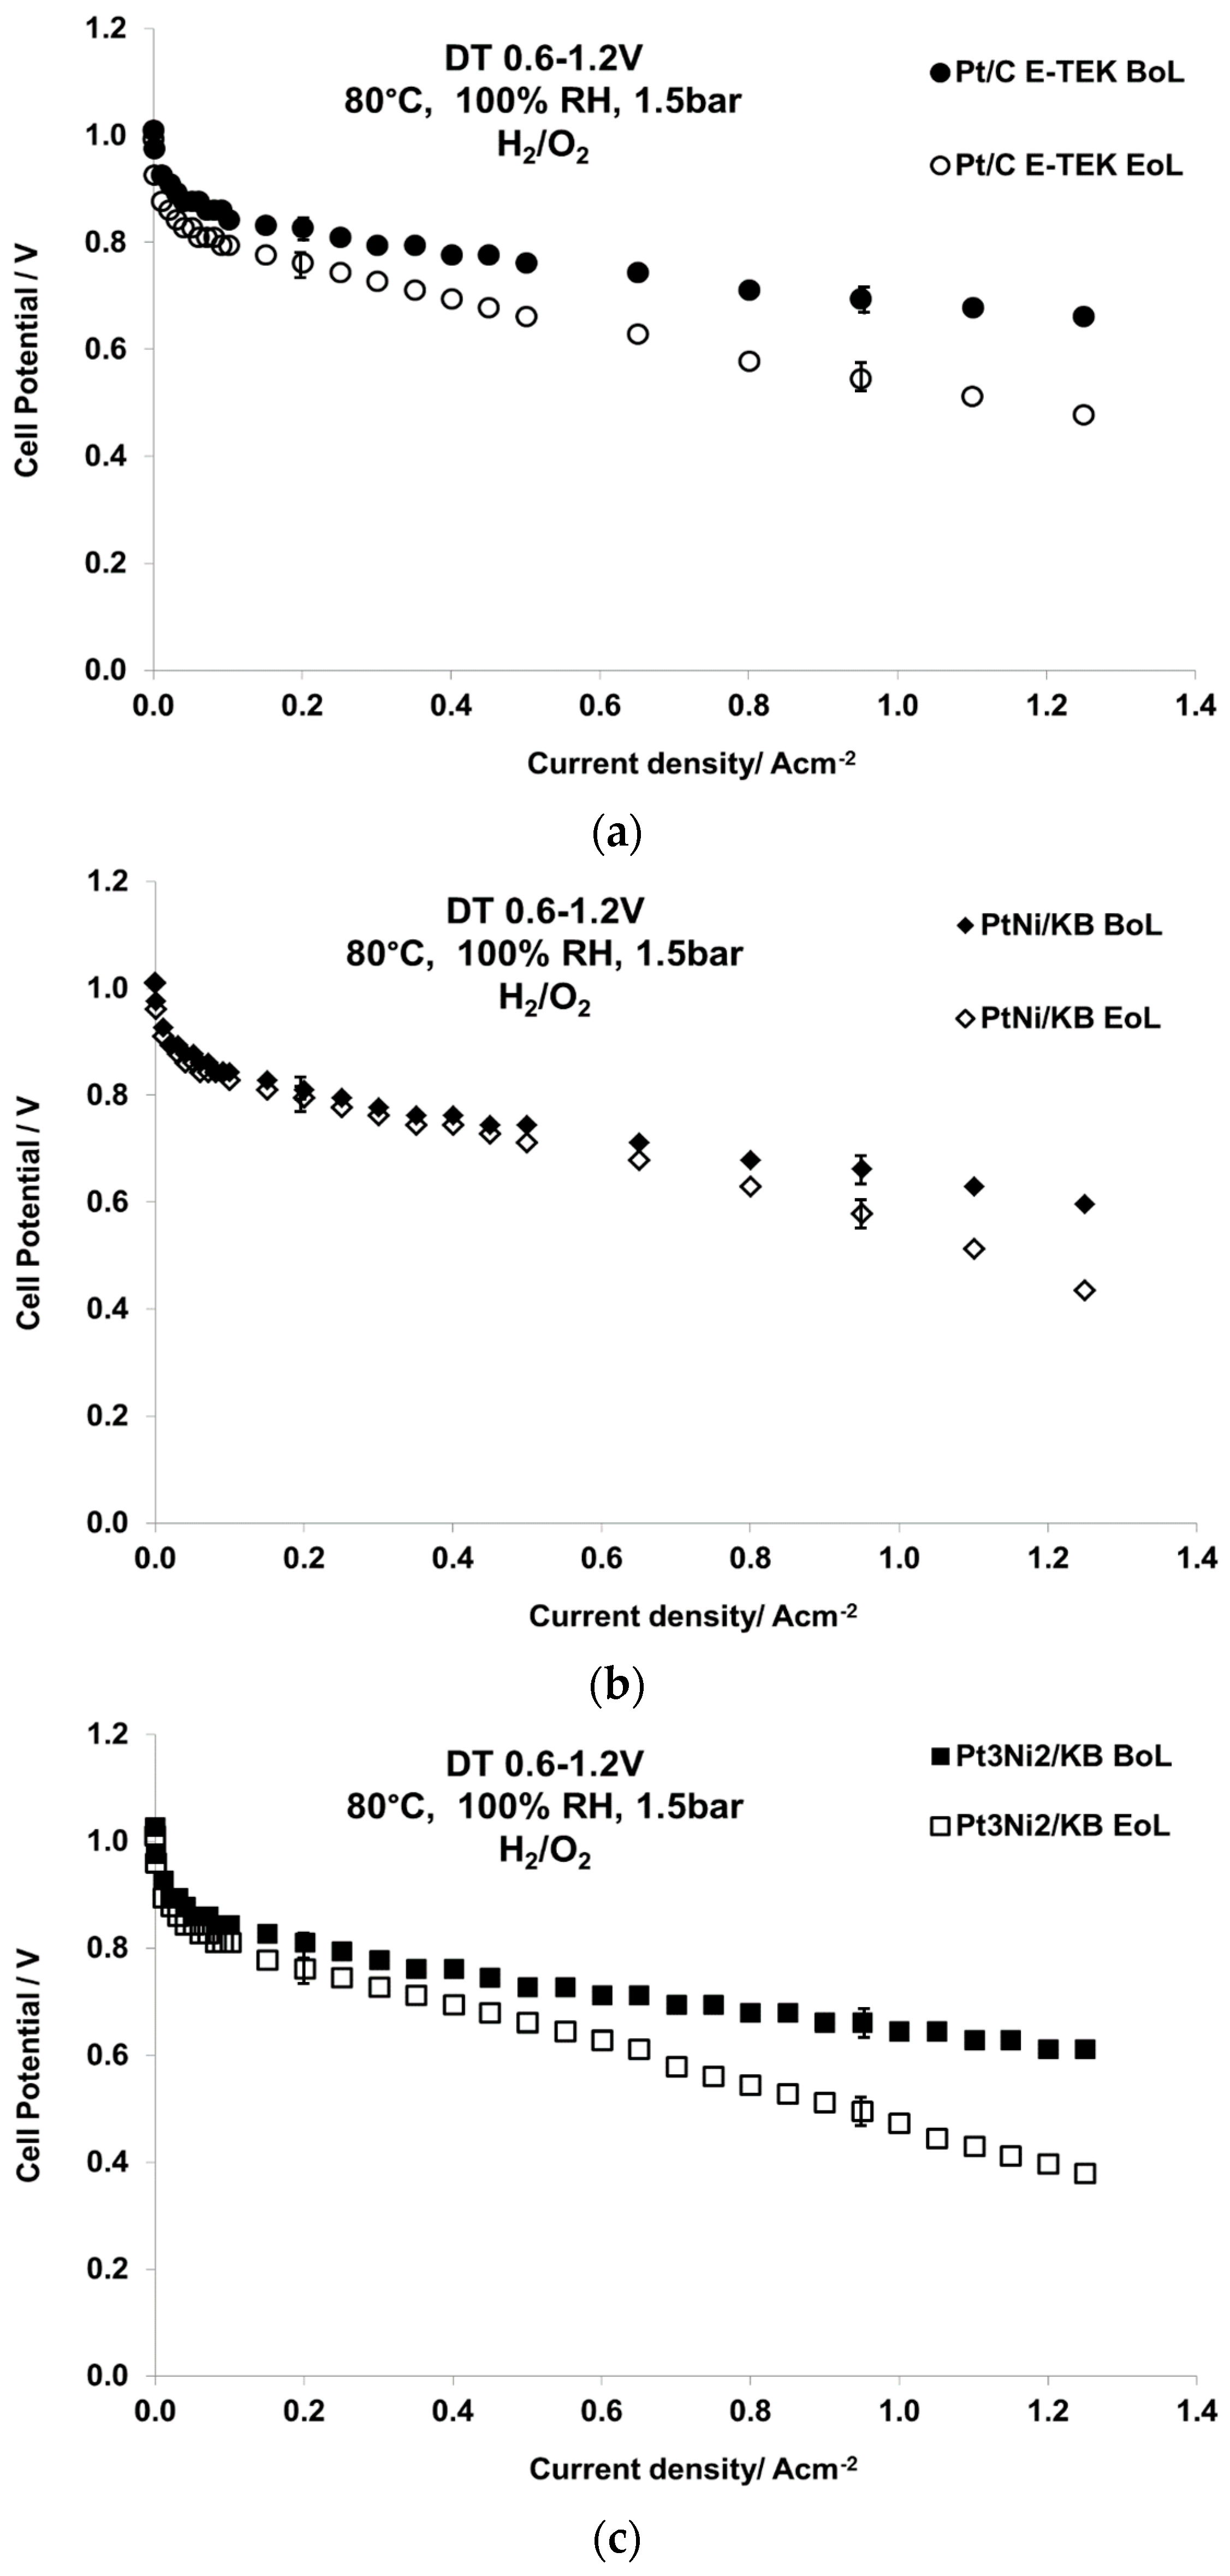
| Sample Catalyst | Status | ECSA, m2·g−1 | Crystallite Size, nm |
|---|---|---|---|
| Pt/C E-TEK | BoL | 22 | 5 |
| EoL | 9 | 16 | |
| PtNi/KB | BoL | 44 | 2.7 |
| EoL | 18 | 12 | |
| Pt3Ni2/KB | BoL | 42 | 2.3 |
| EoL | 12 | 15 |
© 2017 by the authors. Licensee MDPI, Basel, Switzerland. This article is an open access article distributed under the terms and conditions of the Creative Commons Attribution (CC BY) license ( http://creativecommons.org/licenses/by/4.0/).
Share and Cite
Zignani, S.C.; Baglio, V.; Sebastián, D.; Saccà, A.; Gatto, I.; Aricò, A.S. Towards Highly Performing and Stable PtNi Catalysts in Polymer Electrolyte Fuel Cells for Automotive Application. Materials 2017, 10, 317. https://doi.org/10.3390/ma10030317
Zignani SC, Baglio V, Sebastián D, Saccà A, Gatto I, Aricò AS. Towards Highly Performing and Stable PtNi Catalysts in Polymer Electrolyte Fuel Cells for Automotive Application. Materials. 2017; 10(3):317. https://doi.org/10.3390/ma10030317
Chicago/Turabian StyleZignani, Sabrina C., Vincenzo Baglio, David Sebastián, Ada Saccà, Irene Gatto, and Antonino S. Aricò. 2017. "Towards Highly Performing and Stable PtNi Catalysts in Polymer Electrolyte Fuel Cells for Automotive Application" Materials 10, no. 3: 317. https://doi.org/10.3390/ma10030317
APA StyleZignani, S. C., Baglio, V., Sebastián, D., Saccà, A., Gatto, I., & Aricò, A. S. (2017). Towards Highly Performing and Stable PtNi Catalysts in Polymer Electrolyte Fuel Cells for Automotive Application. Materials, 10(3), 317. https://doi.org/10.3390/ma10030317