
ZT Optimization: An Application Focus

Abstract
:1. Introduction
2. Modelling Approach
3. Bismuth Telluride Based Material
4. Silicide Based Material
5. Conclusions
Supplementary Materials
Acknowledgments
Author Contributions
Conflicts of Interest
References
- Rowe, D.M. Thermoelectric Handbook Macro to Nano, 1st ed.; CRC Press: Boca Raton, FL, USA, 2006; pp. 27-1–42-11. [Google Scholar]
- Snyder, G.J.; Toberer, E.S. Complex thermoelectric materials. Nat. Mater. 2008, 7, 106–114. [Google Scholar] [CrossRef] [PubMed]
- Bartholomé, K.; Heuer, J.; Horzella, J.; Jägle, M.; König, J.; Tarantik, K. Thermoelectric modules built with new high-temperature materials. In Proceedings of the 4th IAV Thermoelectrics Conference, Berlin, Germany, 10–12 December 2014.
- Yazawa, K.; Shakouri, A. Cost-Efficiency Trade-off and the Design of Thermoelectric Power Generators. Environ. Sci. Technol. 2011, 45, 7548–7553. [Google Scholar] [CrossRef] [PubMed]
- Baranowski, L.L.; Snyder, G.J.; Toberer, E.S. Effective thermal conductivity in thermoelectric materials. J. Appl. Phys. 2014, 113, 204904. [Google Scholar] [CrossRef]
- Apertet, Y.; Ouerdane, H.; Glavatskaya, O.; Goupil, C.; Lecoeur, P. Optimal working conditions for thermoelectric generators with realistic thermal coupling. EPL 2012, 97, 28001. [Google Scholar] [CrossRef]
- Mayer, P.M.; Ram, R.J. Optimization of Heat Sink-Limited Thermoelectric Generators. Nanoscale Microscale Thermophys. Eng. 2006, 10, 143–155. [Google Scholar] [CrossRef]
- Yang, J.; Stabler, F.R. Automotive Applications of Thermoelectric Materials. J. Electron. Mater. 2009, 38, 1245. [Google Scholar] [CrossRef]
- Rowe, D.M. CRC Handbook of Thermoelectrics, 1st ed.; CRC press: Boca Raton, FL, USA, 1995; pp. 43–54. [Google Scholar]
- Zhang, L.; Xiao, P.; Shi, L.; Henkelman, G.; Goodenough, J.B.; Zhou, J. Suppressing the bipolar contribution to the thermoelectric properties of Mg2Si0.4Sn0.6 by Ge substitution. J. Appl. Phys. 2015, 117, 155103. [Google Scholar] [CrossRef]
- Goldsmith, H.J. Bismuth Telluride and Its Alloys as Materials for Thermoelectric Generation. Materials 2014, 7, 2577–2592. [Google Scholar] [CrossRef]
- Kutorasinski, K.; Tobola, J.; Kaprzyk, S.; Khan, A.U.; Kyratsi, T.H. Electronic Structure and Thermoelectric Properties of Pseudoquaternary Mg2Si1-x-ySnxGey-Based Materials. J. Electron. Mater. 2014, 43, 3831. [Google Scholar] [CrossRef]
- Schierning, G.; Chavez, R.; Schmechel, R.; Balke, B.; Rogl, G.; Rogl, P. Concepts for medium-high to high temperature thermoelectric heat-to-electricity conversion: A review of selected materials and basic considerations of module design. Transl. Mater. Res. 2015, 2, 025001. [Google Scholar] [CrossRef]
- Rowe, D.M. Thermoelectric Handbook Macro to Nano, 1st ed.; CRC press: Boca Raton, FL, USA, 2012; Chapter 27. [Google Scholar]
- Mishrayz, S.K.; Satpathyyz, S.; Jepsen, O. Electronic structure and thermoelectric properties of bismuth telluride and bismuth selenide. J. Phys. Condens. Matter 1997, 9, 461–470. [Google Scholar] [CrossRef]
- Rowe, D.M. Thermoelectrics and its Energy Harvesting: Modules, Systems and Applications in Thermoelectrics, 1st ed.; CRC press: Boca Raton, FL, USA, 2006; Chapter 7. [Google Scholar]
- Rowe, D.M. Thermoelectric Handbook Macro to Nano, 1st ed.; CRC press: Boca Raton, FL, USA, 2006; Chapter 37. [Google Scholar]
- Kima, H.S.; Liua, W.; Chenb, G.; Chua, C.; Rena, Z. Relationship between thermoelectric figure of merit and energy conversion efficiency. Proc. Natl. Acad. Sci. USA 2015, 112, 8205–8210. [Google Scholar] [CrossRef] [PubMed]
- Lin, Y.; Norman, C.; Srivastava, D.; Azough, F.; Wang, L.; Robbins, M.; Simpson, K.; Freer, R.; Kinloch, I.A. Thermoelectric Power Generation from Lanthanum Strontium Titanium Oxide at Room Temperature through the Addition of Graphene. Appl. Mater. Interfaces 2015, 7, 15898–15908. [Google Scholar] [CrossRef] [PubMed]


| Property | Used in Model | Literature Reported Values | Ref. |
|---|---|---|---|
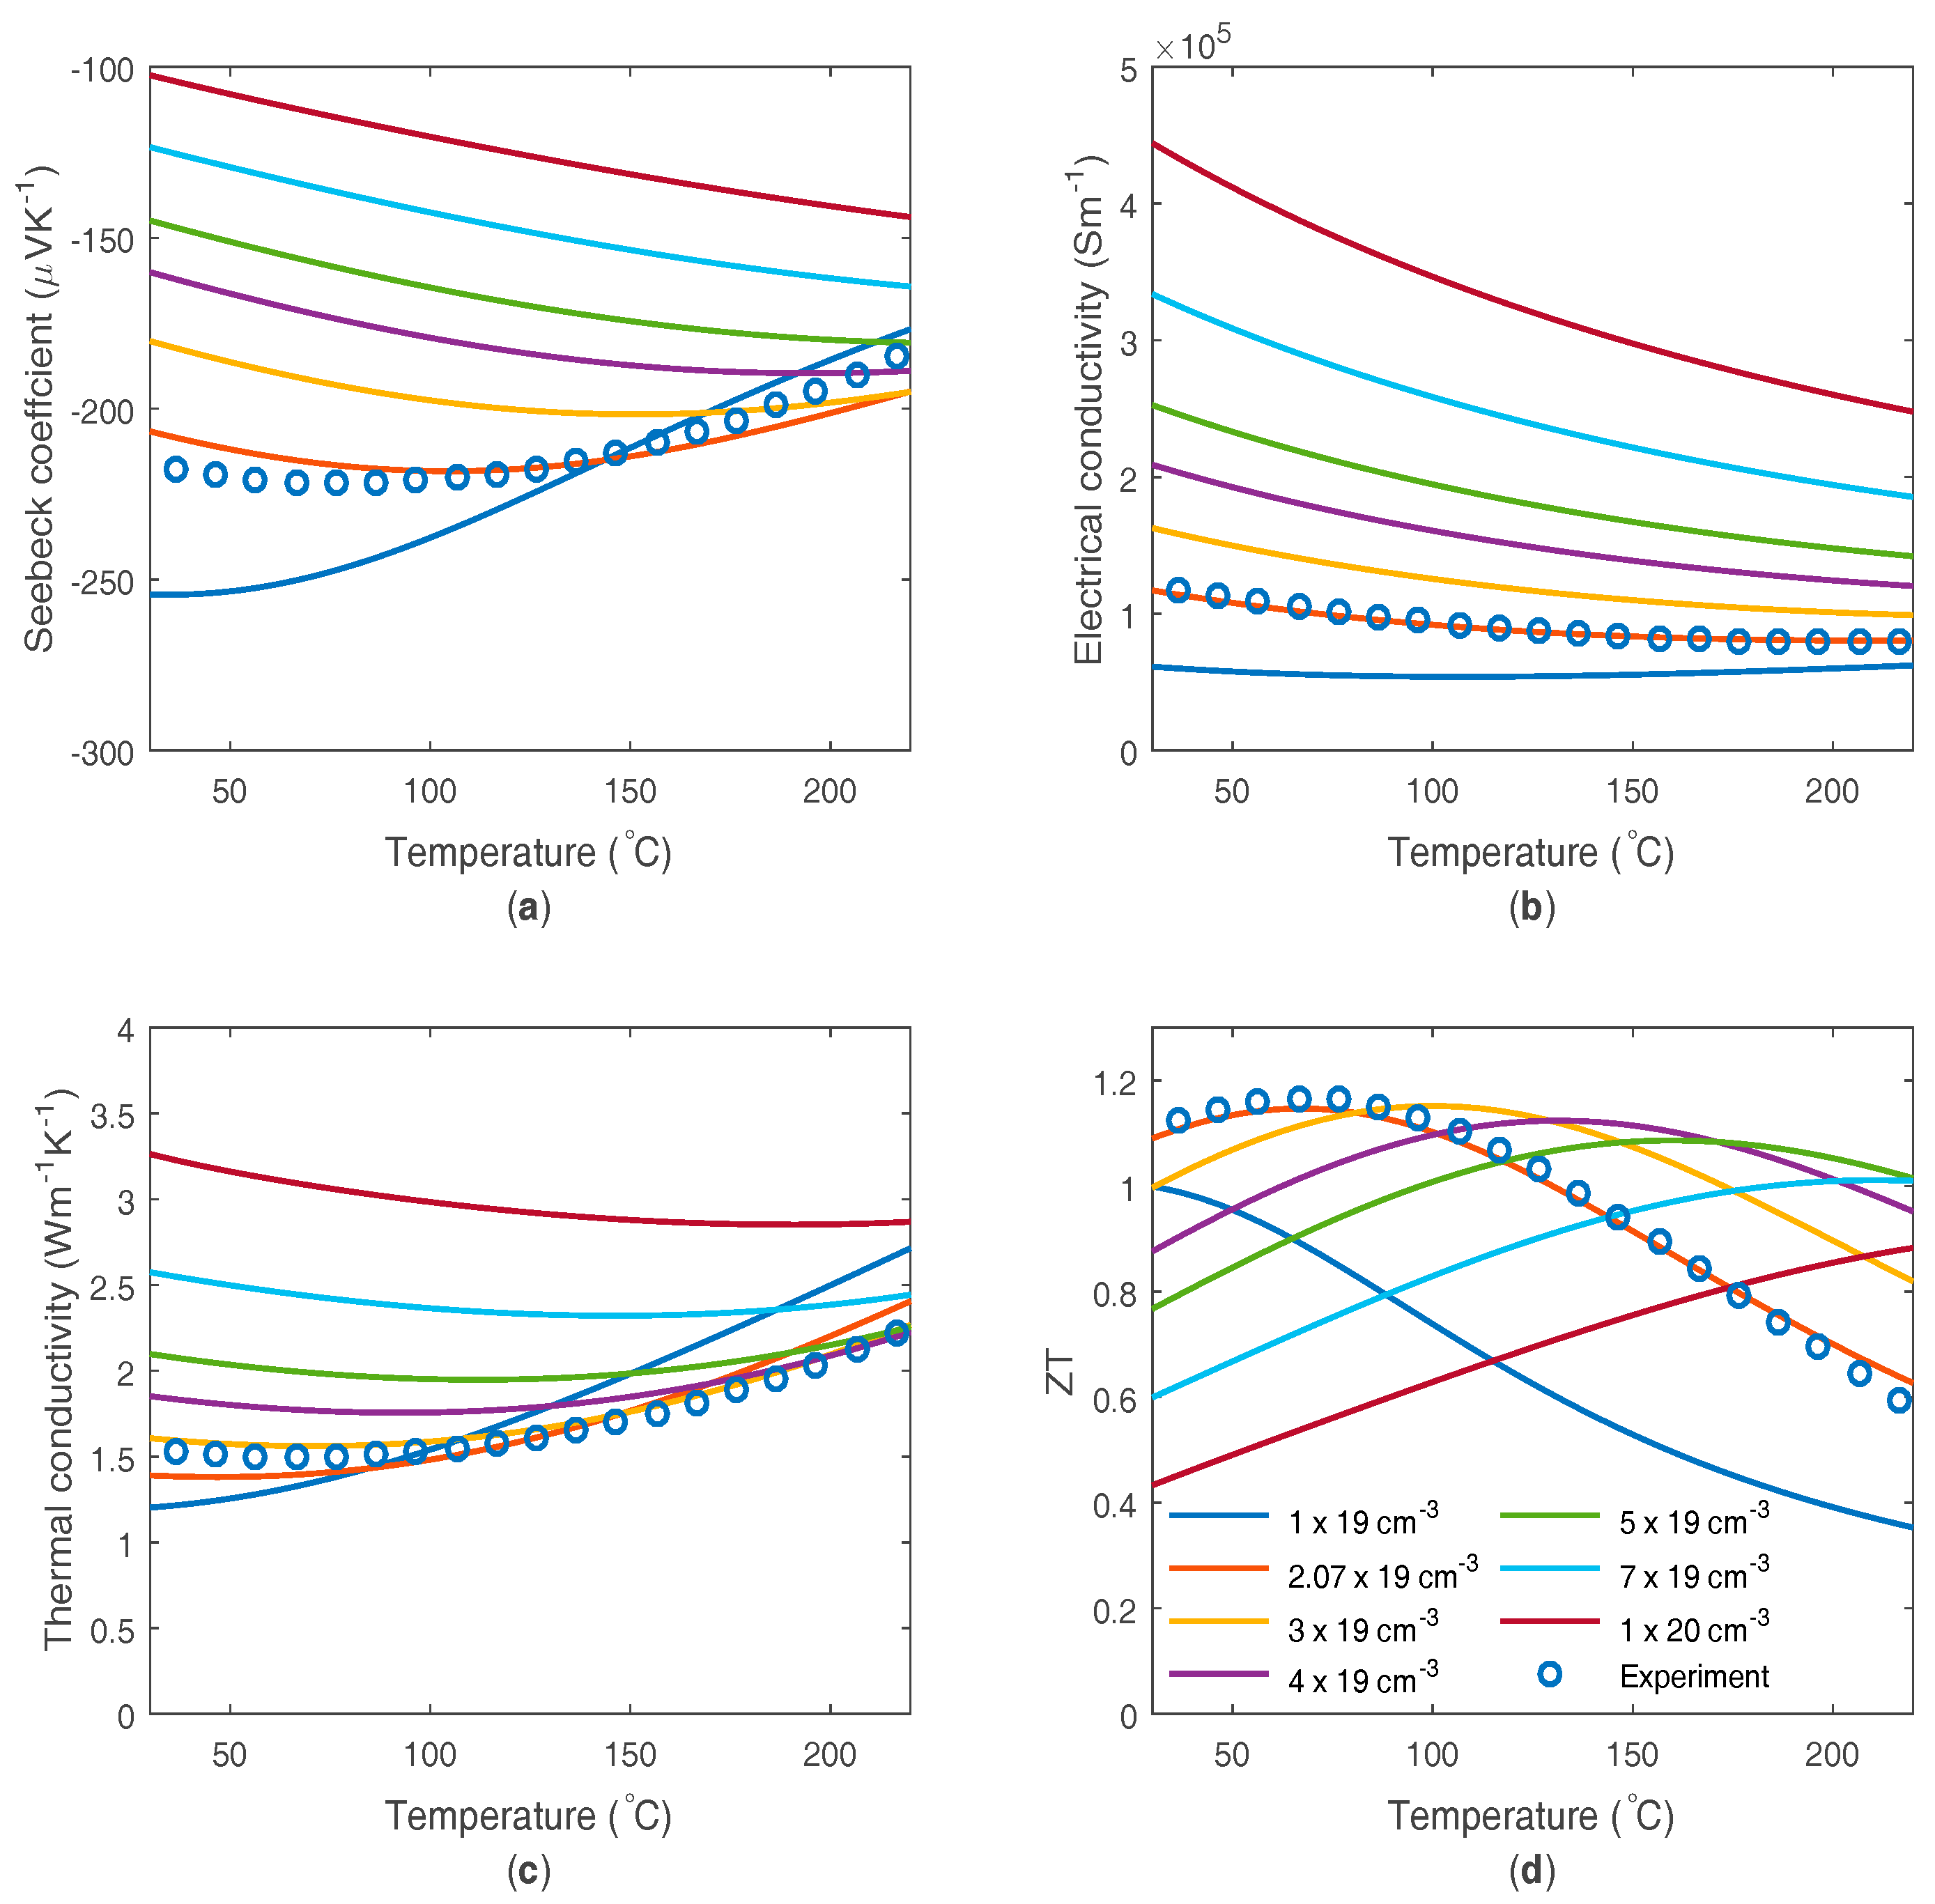
| Doping level (cm−3) | 2.07 × 10¹⁹ | 1–5 × 10¹⁹ | [14] |
| Band gap (eV) | 0.16 | 0.11–0.2 | [15,16] |
| CB DOS effective mass (me) | 1.09 | 0.95–1.9 | [16,17] |
| VB DOS effective mass (me) | 1.85 | 1.5–2.1 | [16,17] |
| Electron mobility at low carrier concentration at 300 K (cm2·V−1·s−1) | 389 | 200–350 1 | [16] |
| Hole mobility at low carrier concentration at 300 K (cm2·V−1·s−1) | 138 | 200–300 1 | [16] |
| Lattic thermal conductivity at 300 K (Wm−1·K−1) | 0.742 | 0.9–1.6 | [15] |
| Property | Value |
|---|---|
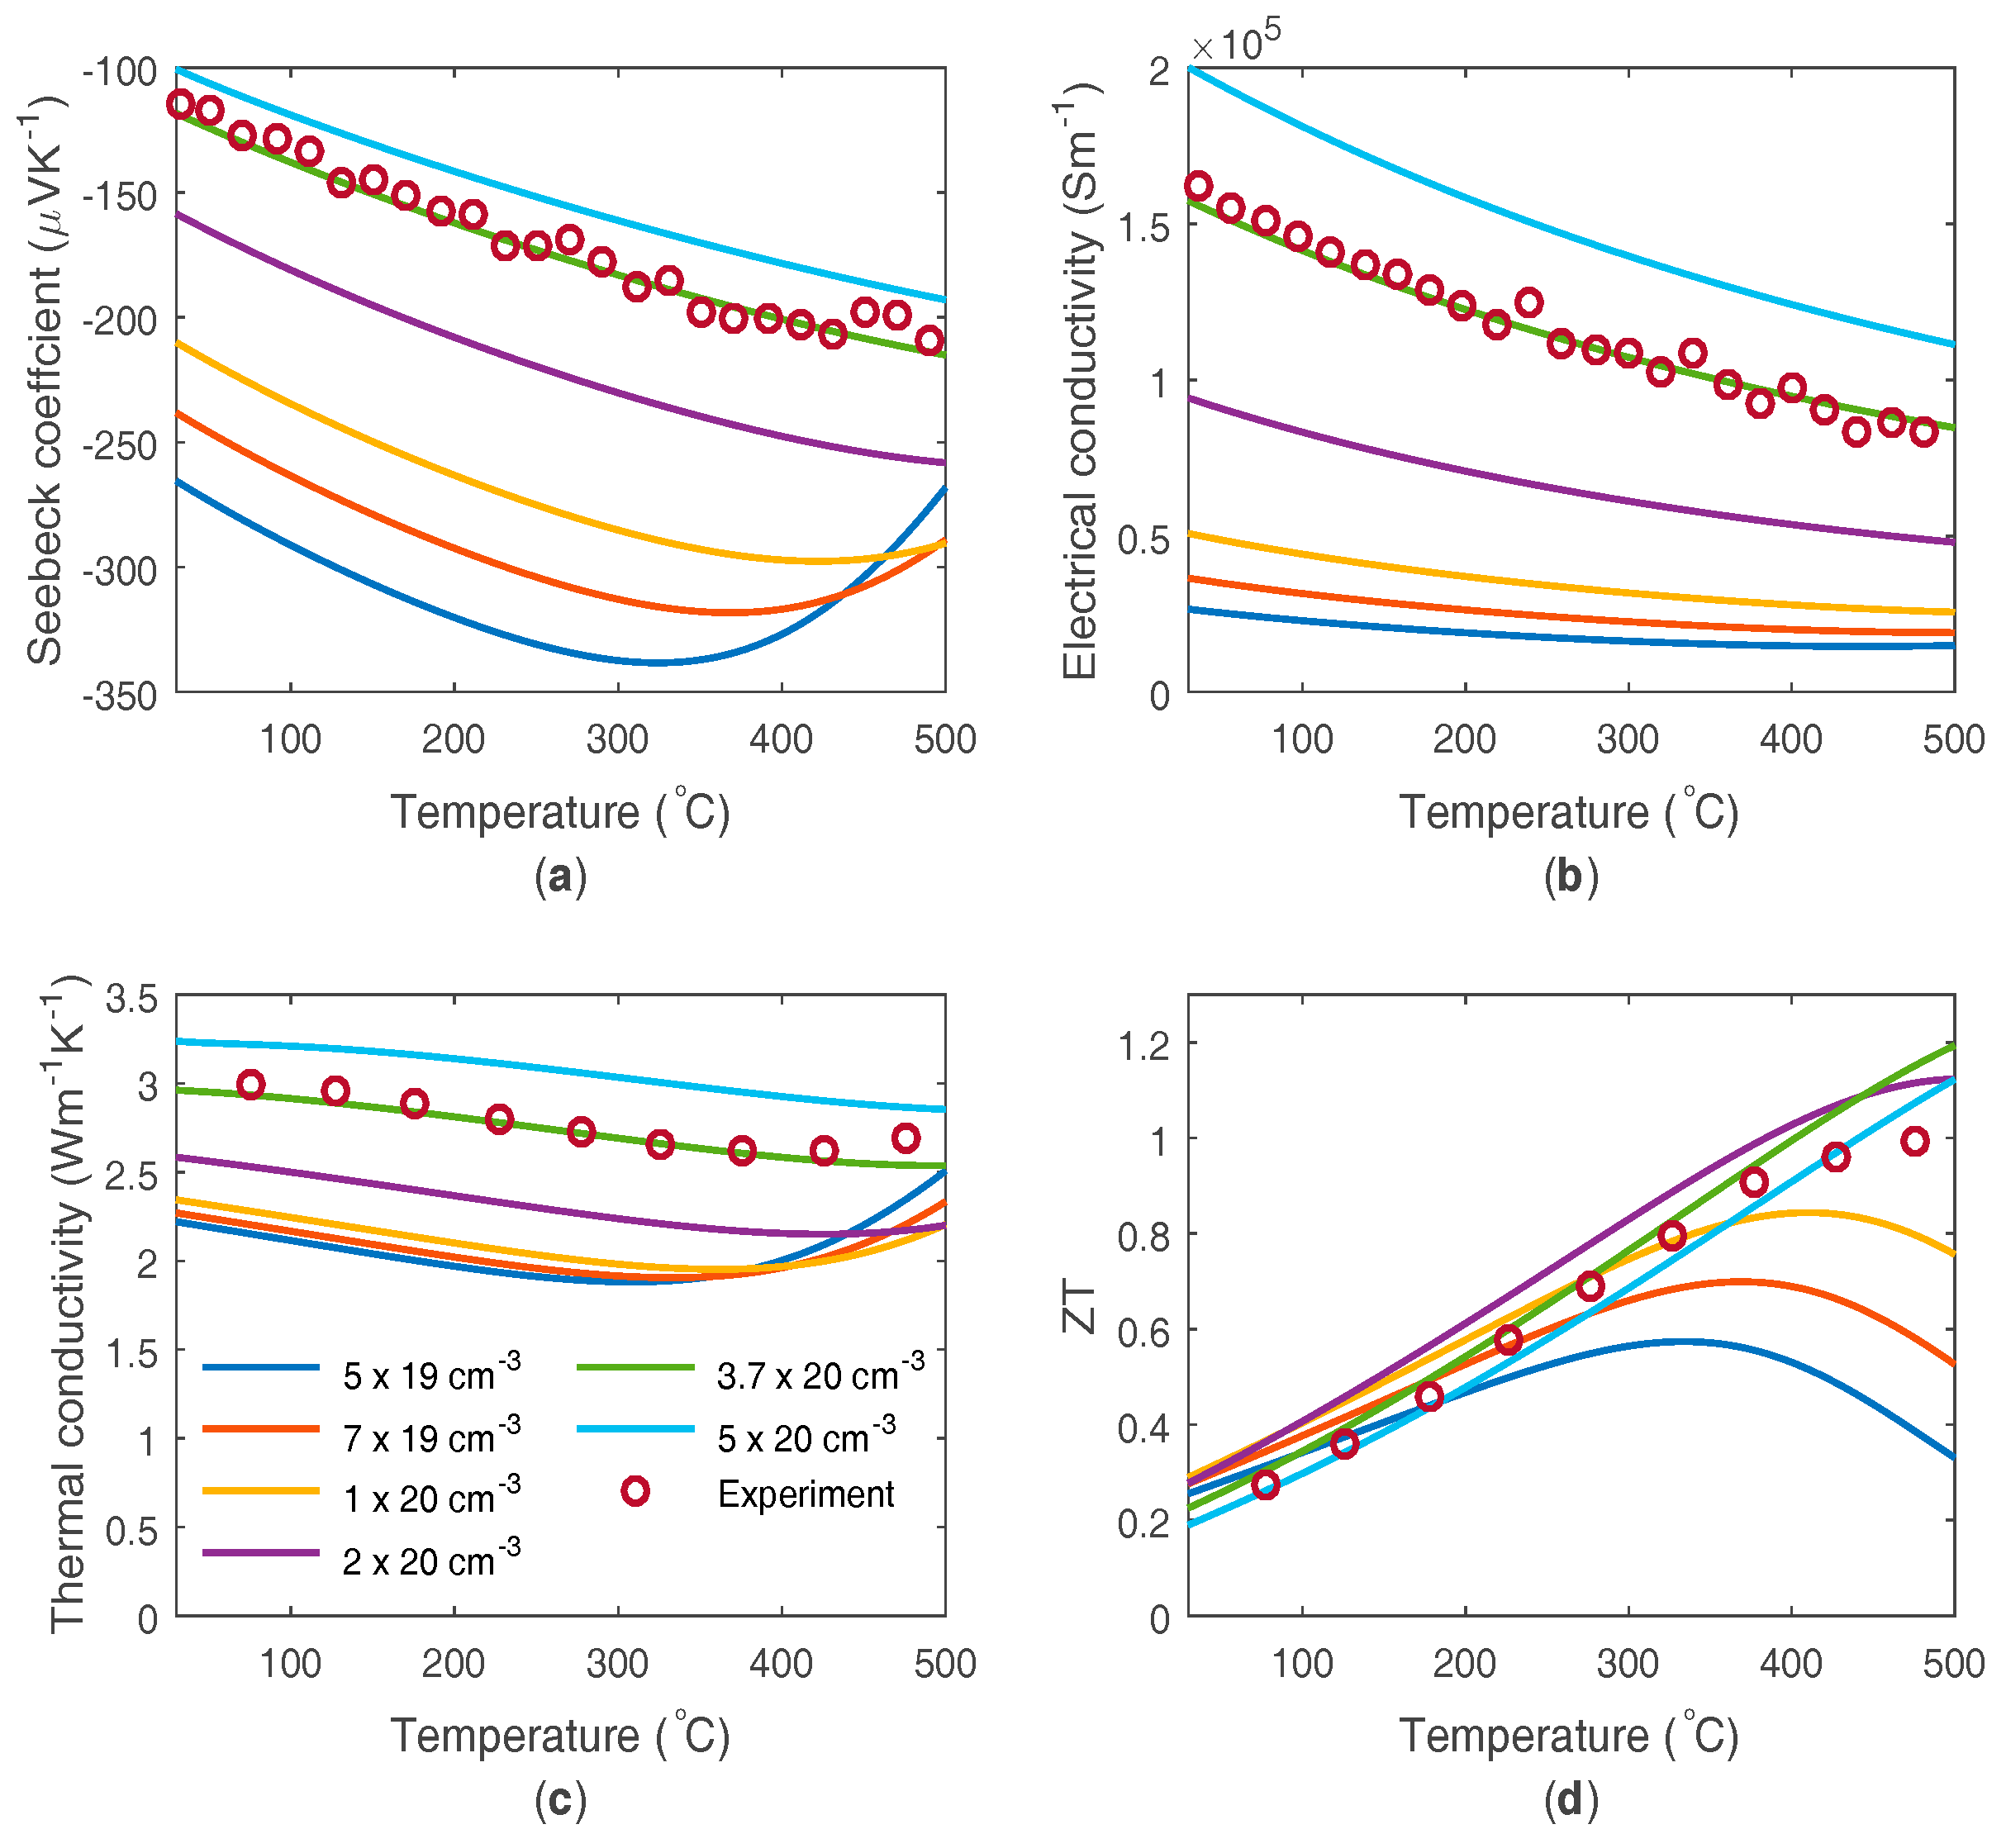
| Doping level | 3.7 × 1020 cm−3 |
| Band gap | 0.42 eV |
| CB DOS effective mass | 3.13 me |
| VB DOS effective mass | 1.45 me |
| Acoustic phonon scattering electron mobility at low carrier concentration at 300 K | 135 cm2·V−1·s−1 |
| Alloy scattering electron mobility at low carrier concentration at 300 K | 47.3 cm2·V−1·s−1 |
| Acoustic phonon scattering hole mobility at low carrier concentration at 300 K | 291 cm2·V−1·s−1 |
| Alloy scattering hole mobility at low carrier concentration at 300 K | 102 cm2·V−1·s−1 |
| Lattic thermal conductivity at 300 K | 2.1 W·m−1·K−1 |
| Lattice thermal conductivity gradient | −0.0016 W·m−1·K−2 |
© 2017 by the authors. Licensee MDPI, Basel, Switzerland. This article is an open access article distributed under the terms and conditions of the Creative Commons Attribution (CC BY) license ( http://creativecommons.org/licenses/by/4.0/).
Share and Cite
Tuley, R.; Simpson, K. ZT Optimization: An Application Focus. Materials 2017, 10, 309. https://doi.org/10.3390/ma10030309
Tuley R, Simpson K. ZT Optimization: An Application Focus. Materials. 2017; 10(3):309. https://doi.org/10.3390/ma10030309
Chicago/Turabian StyleTuley, Richard, and Kevin Simpson. 2017. "ZT Optimization: An Application Focus" Materials 10, no. 3: 309. https://doi.org/10.3390/ma10030309
APA StyleTuley, R., & Simpson, K. (2017). ZT Optimization: An Application Focus. Materials, 10(3), 309. https://doi.org/10.3390/ma10030309