
Determination of Maximum Wind Power Penetration in an Isolated Island System by Considering Spinning Reserve


Abstract
:
1. Introduction
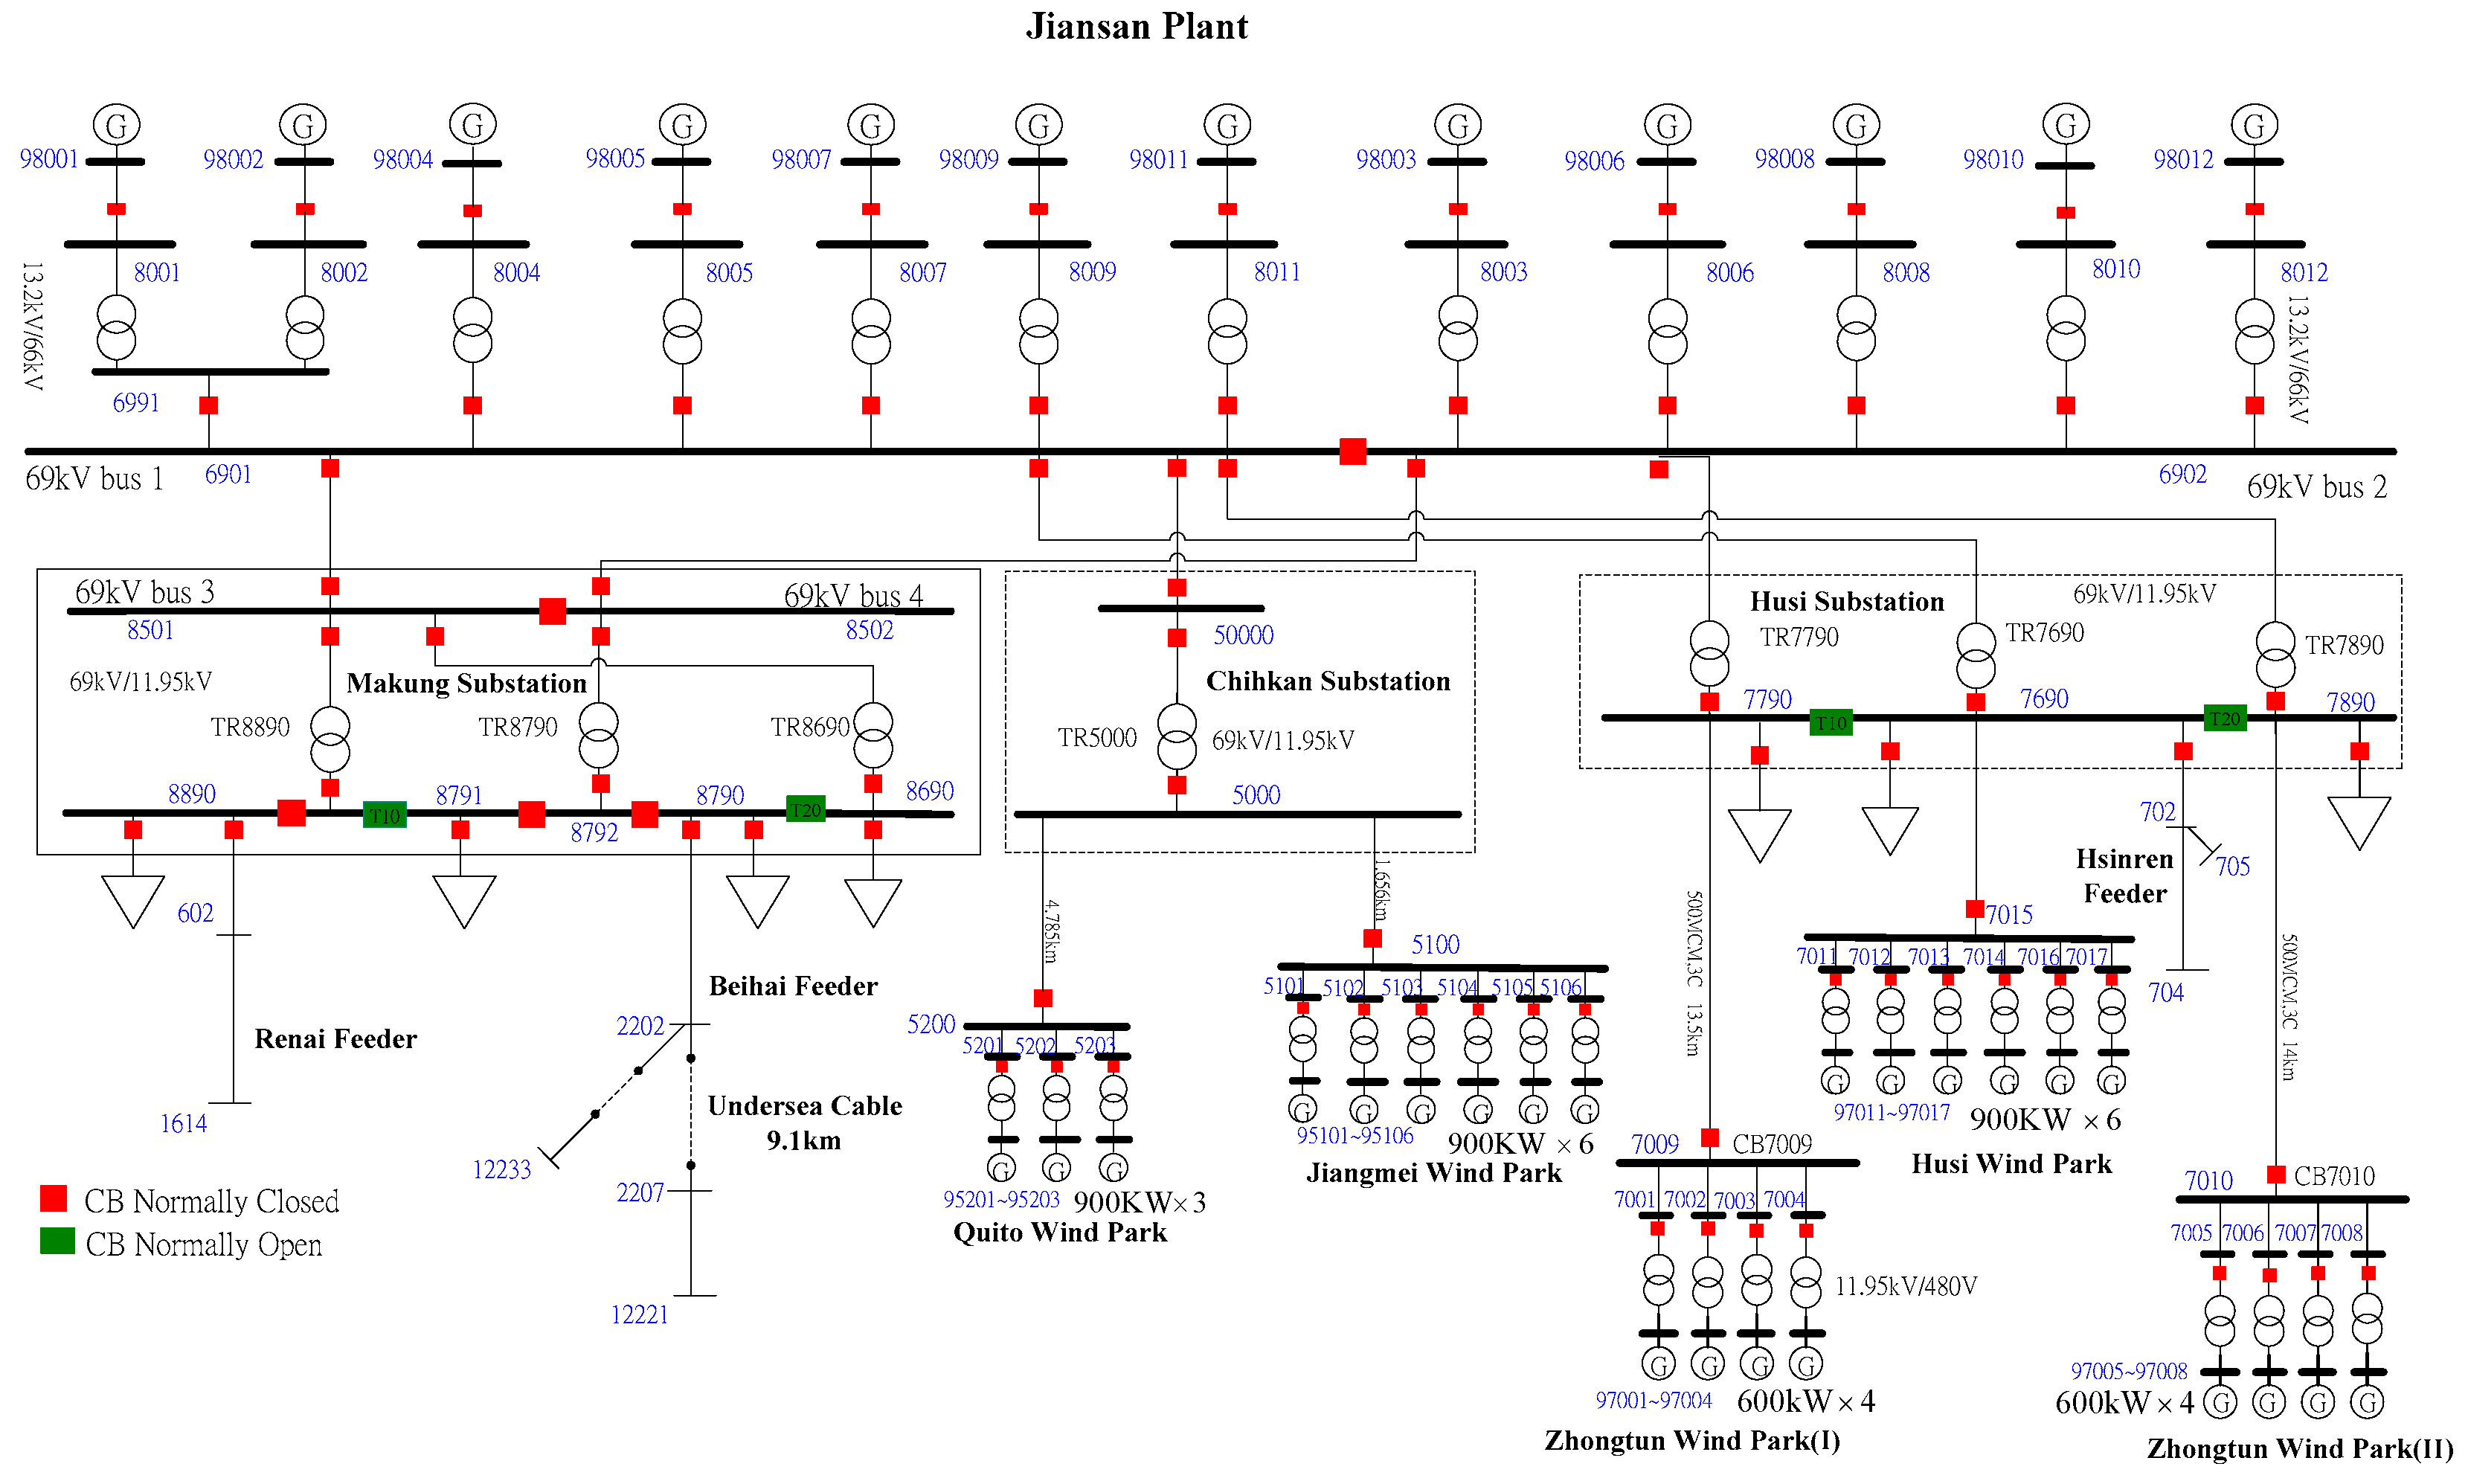
2. Sample Power System
3. Factors Considered for Determination of Maximum Wind Power Penetration
- (1)
- Thermal capacity of transmission lines: problems of overload or voltage violations are not permissible because of the integration of wind turbines with the power system.
- (2)
- Criteria for steady-state voltage: according to Taipower’s operation standard, for normal operation, all voltages of buses should be maintained between 0.95 and 1.03 pu. Specifically, steady-state voltage deviations should be within this tolerance range.
- (3)
- Criteria for frequency: the recommended protection values against high or low frequencies should not be violated in any incident when wind turbines are integrated for operation.
- (4)
- Reliability of power supply: no incident should cause load shedding. This implies that the first-stage frequency of under frequency shedding should not be reached when wind turbines are integrated for operation.
- (5)
- Interrupting capacity of circuit breakers: the integration of wind turbines should not induce short-circuit currents to exceed the ratings of the existing circuit breakers.
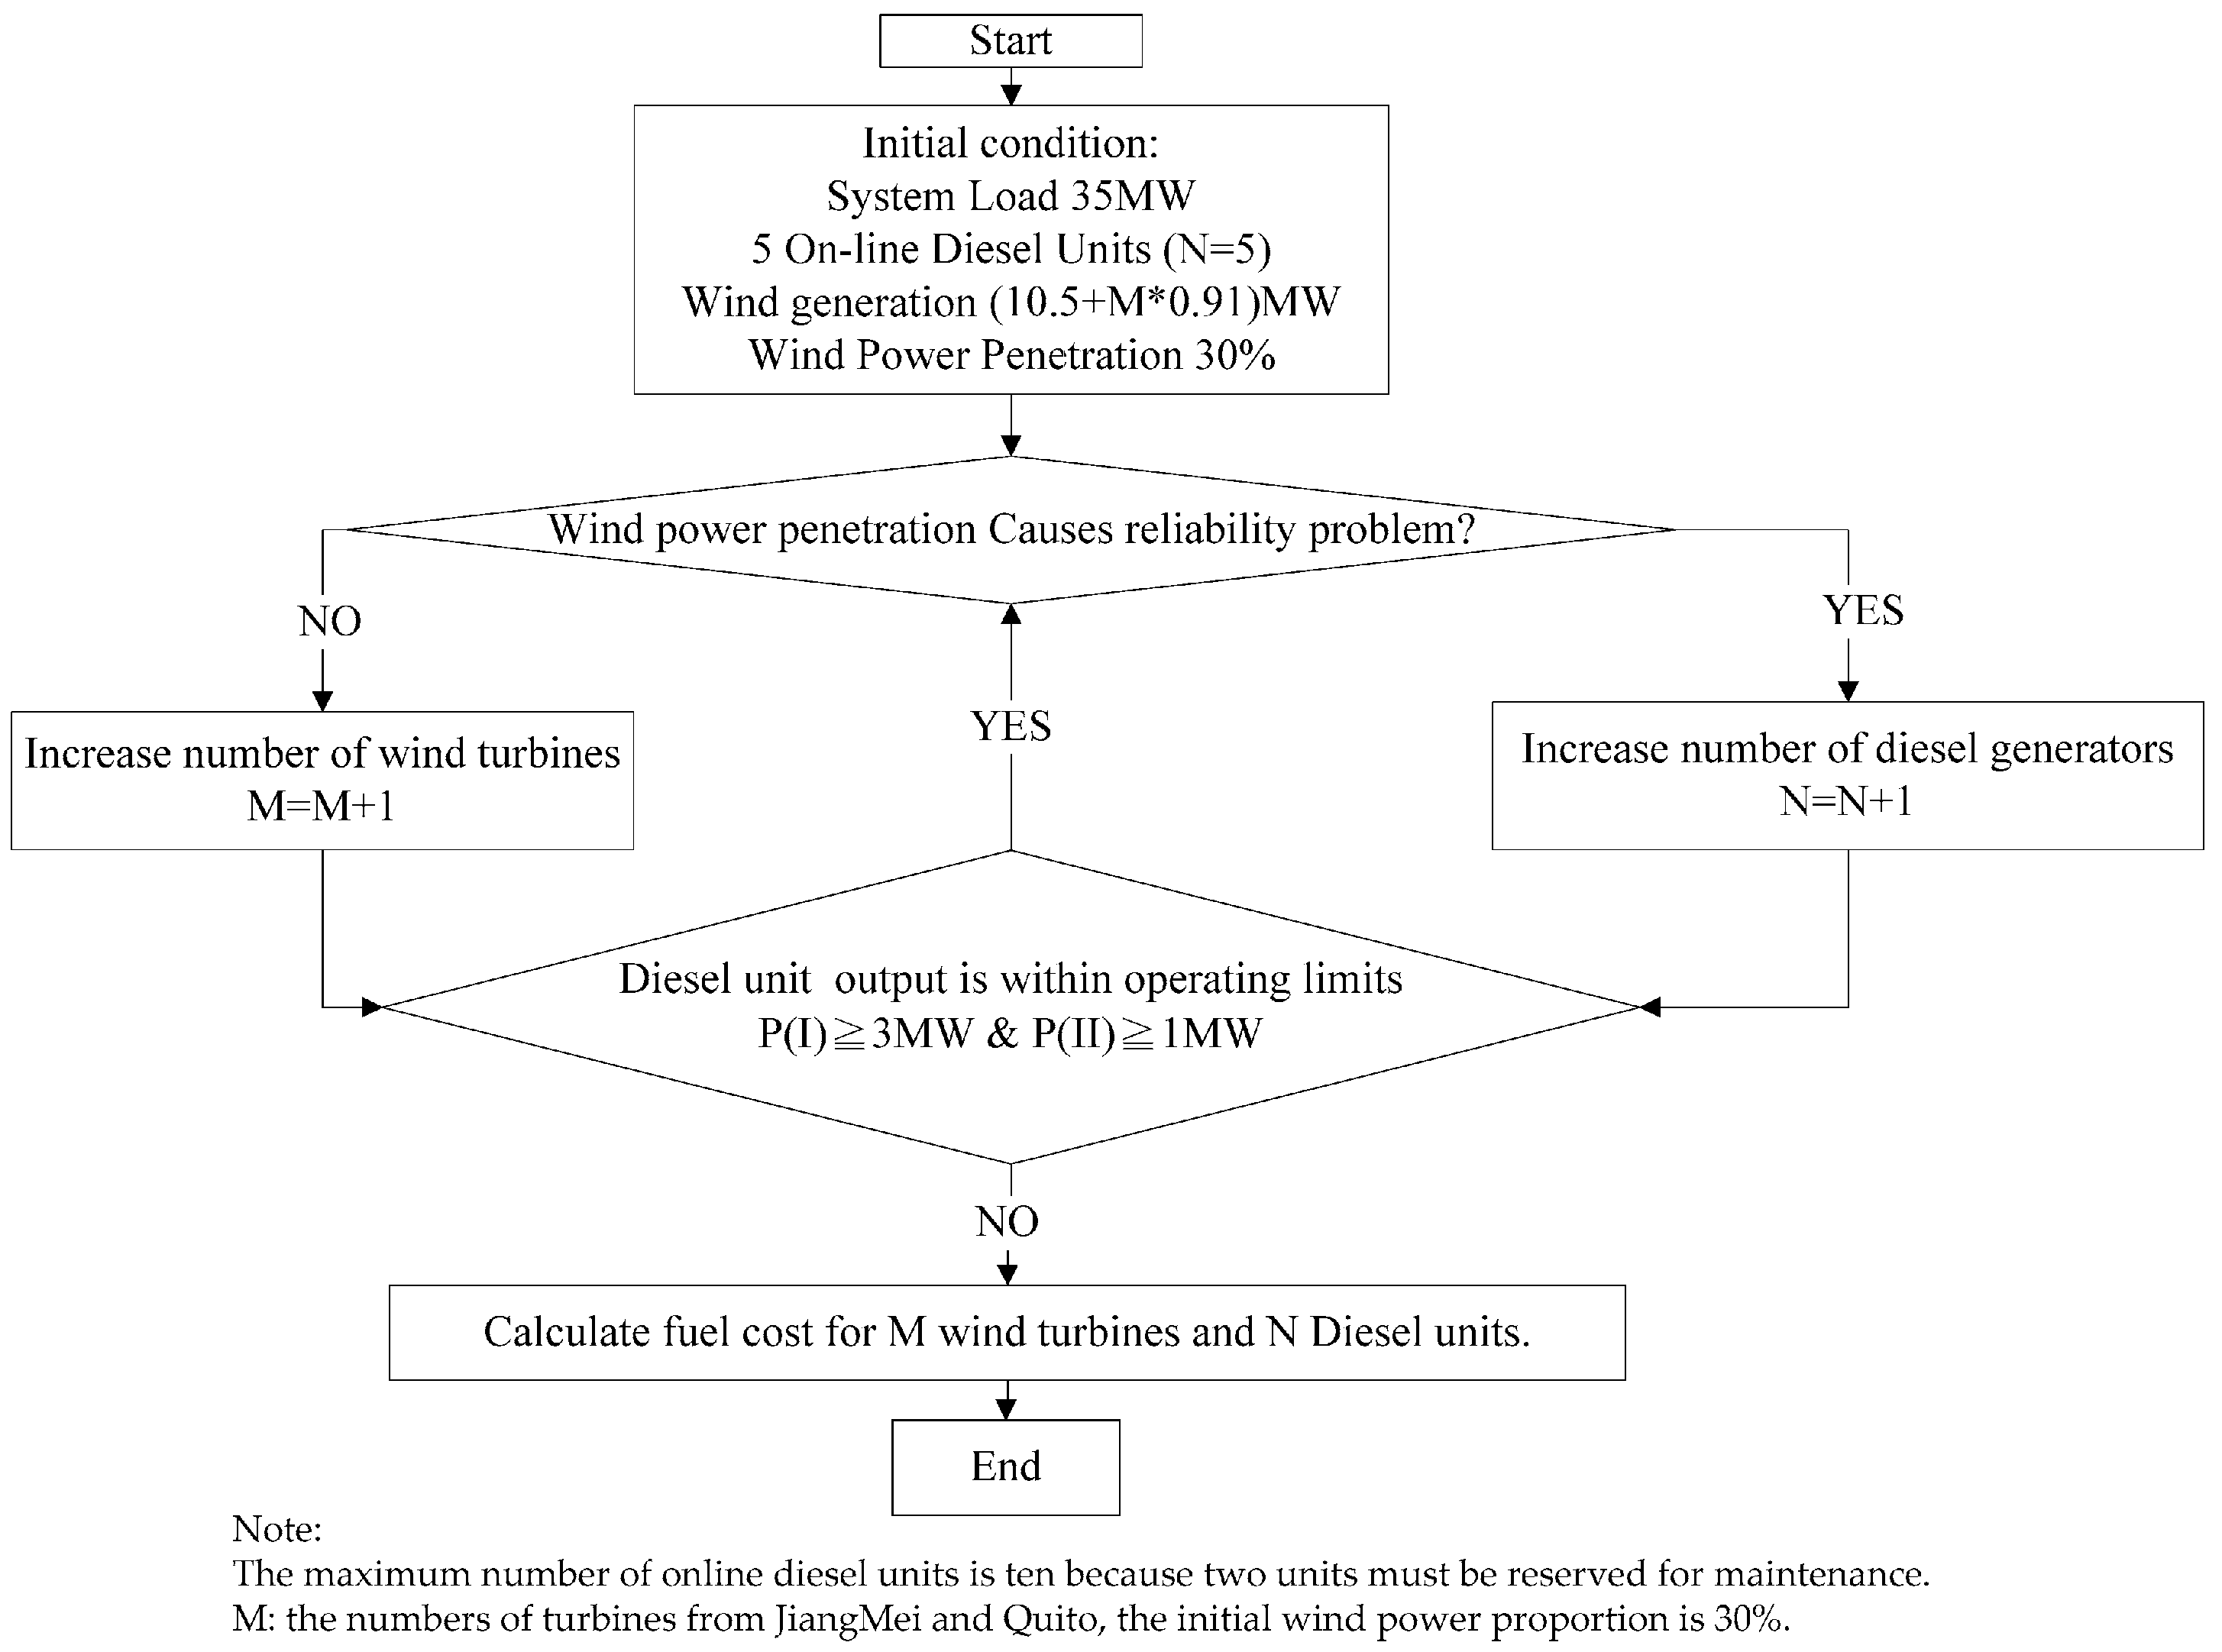
4. Wind Power Penetration Analyses
- Step 1) Set initial conditions
- system load L = 35 MW;
- number of online diesel units N = 5;
- number of online wind turbines M = 0;
- Step 2) Calculate wind power penetration
- wind power generation Pwind = 10.5 + M × 0.91 (MW);
- wind power penetration Dwind = Pwind/L;
- Step 3) Inspect whether the wind power penetration retains the frequency/voltage in the permissible range and whether the wind power penetration causes a reliability problem
- perform load flow and transient stability analyses to obtain frequency/voltage deviations
- if Dwind causes a reliability problem, N = N + 1;
- else M = M + 1;
- Step 4) Check the operational limits of the online diesel units
- The outputs of the Phase-I and Phase-II units, P(I) and P(II), should be above their lower limits.
- If P(I) > 3 MW or P(II) > 1 MW, then go to step 3;
- else go to step 5;
- Step 5) Output the maximum wind power penetration and calculate the system fuel cost
5. Results of Analysis for Determination of Maximum Wind Power Penetration
6. Novel Strategy for Modifying Existing Unit Scheduling Criteria
6.1. Effective Load-Carrying Capacity
6.2. New Unit Scheduling Criteria Based on Spinning Reserve
7. Economic Benefit Obtained by Using Novel Unit Scheduling Strategy
8. Conclusions
Appendix A
References
- Global Wind Energy Council (GWEC). Global Wind Statistics 2014; Global Wind Energy Council (GWEC): Brussels, Belgium, 2015. [Google Scholar]
- Wu, Y.K.; Lee, C.Y.; Shu, G.H. Taiwan’s first large-scale offshore wind farm connection—A real project case study with a comparison of wind turbine. IEEE Trans. Ind. Appl. 2011, 47, 1461–1469. [Google Scholar]
- Etxegarai, A.; Eguia, P.; Torres, E.; Fernandez, E. Impact of wind power in isolated power systems. In Proceedings of the 16th IEEE Mediterranean Electrotechnical Conference, Yasmine Hammamet, Tunisia, 25–28 March 2012; pp. 63–66.
- Zhang, Y.; Teixeira, L.; Kang, Y. Stability analysis of power system in cape Verde with high penetration level of wind power under short circuit fault. In Proceedings of the 2012 Asia-Pacific Power and Energy Engineering Conference, Shanghai, China, 27–29 March 2012.
- Meibom, P.; Barth, R.; Hasche, B.; Brand, H.; Weber, C.; O’Malley, M. Stochastic optimization model to study the operational impacts of high wind penetrations in Ireland. IEEE Trans. Power Syst. 2011, 26, 1367–1379. [Google Scholar] [CrossRef]
- Margaris, I.D.; Papathanassiou, S.A.; Hatziargyriou, N.D.; Hansen, A.D.; Sorensen, P. Frequency control in autonomous power systems with high wind power penetration. IEEE Trans. Sustain. Energy 2012, 3, 189–199. [Google Scholar] [CrossRef]
- Kemsley, R.H.; McGarley, P.; Wade, S.; Thim, F. Making small high-penetration renewable energy systems work—Scottish Island experience. In Proceedings of the IET Conference on Renewable Power Generation, Edinburgh, UK, 6–8 September 2011.
- Papathanassiou, S.A.; Santjer, F. Power-quality measurements in an autonomous island grid with high wind penetration. IEEE Trans. Power Deliv. 2006, 21, 218–224. [Google Scholar] [CrossRef]
- Chen, B.K.; Chan, C.A.; Chen, W.T.; Huang, H.H. Study of Wind Power Penetration Limitation and Related Power Defense Projects in Penghu; Final Report of National Science Council Project; National Science Council: Taipei, Taiwan, 2008.
- Lin, S.H. Maximal Parallel Capacity of Wind Power Generation in Penghu; Taiwan Power Research Institute: Taipei, Taiwan, 2004. [Google Scholar]
- Chen, B.K.; Chan, C.A.; Peng, C.K. Wind Power Penetration Limitation and Related Cost Analysis of the Offshore Island of Penghu, (I) and (II); Final Report of National Science Council Project; National Science Council: Taipei, Taiwan, 2012.
- DeMeo, E.A.; Grant, W.; Milligan, M.R.; Schuerger, M.J. Wind plant integration. IEEE Power Energy Mag. 2005, 3, 38–46. [Google Scholar] [CrossRef]
- Eriksen, P.B.; Ackermann, T.; Abildgaard, H.; Smith, P.; Winter, W.; Garcia, J.M.R. System operation with high wind penetration. IEEE Power Energy Mag. 2005, 3, 65–74. [Google Scholar] [CrossRef]
- Chanchien, L.R. Comprehensive Report on Control Efficacy Criteria Development in Taiwan’s Power System and Analysis on AGC Control Strategies; Taiwan Power Co., Ltd.: Taipei, Taiwan, 2011. [Google Scholar]
- Kabouris, J.; Kanellos, F.D. Impacts of large-scale wind penetration on designing and operation of electric power systems. IEEE Trans. Sustain. Energy 2010, 1, 107–144. [Google Scholar] [CrossRef]
- Far, C.H.; Banakar, H.; Keung, P.-K.; Ooi, B.-T. Estimation of wind penetration as limited by frequency deviation. IEEE Trans. Energy Convers. 2007, 22, 783–791. [Google Scholar]
- Doherty, R.; O’Malley, M. A new approach to quantify reserve demand in systems with significant installed wind capacity. IEEE Trans. Power Syst. 2005, 20, 587–595. [Google Scholar] [CrossRef]
- Morales, J.M.; Conejo, A.J.; Perez-Ruiz, J. Economic valuation of reserves in power systems with high penetration of wind power. IEEE Trans. Power Syst. 2009, 24, 900–910. [Google Scholar] [CrossRef]
- Ortega-Vazquez, M.A.; Kirschen, D.S. Estimating the spinning reserve requirements in systems with significant wind power generation penetration. IEEE Trans. Power Syst. 2009, 24, 114–124. [Google Scholar] [CrossRef]
- Ummels, B.C.; Gibescu, M.; Pelgrum, E.; Kling, W.L.; Brand, A.J. Impacts of wind power on thermal generation unit commitment and dispatch. IEEE Trans. Energy Convers. 2007, 22, 44–51. [Google Scholar] [CrossRef]
- Papathanassiou, S.; Boulaxis, N. Power limitations and energy yield calculation for wind farms operating in island systems. Renew. Energy 2006, 31, 457–479. [Google Scholar] [CrossRef]
- Hatziargyriou, N.D.; Karapidakis, E.S.; Hatzifotis, D. Dynamic behavior of power systems in large islands with high wind power penetration. In Proceedings of the Bulk Power Systems Dynamics and Control Symposium—IV Restructuring, Santorini, Greece, 23–28 August 1998.
- Hatziargyriou, N.D.; Karapidakis, E.S. Online preventive dynamic security of isolated power systems using decision trees. IEEE Trans. Power Syst. 2002, 17, 297–304. [Google Scholar]
- Ellis, J. Energy storage—Why policymakers should proceed carefully. 2012. Available online: http://www.energycentral.com/enduse/energyefficiency/articles/2510/Energy-Storage-Why-Policymakers-Should-Proceed-Carefully (accessed on 26 August 2016).
- Djokić, S.Ž.; Desmet, J.; Vanalme, G.; Milanović, J.V.; Stockman, K. Sensitivity of personal computers to voltage sags and short interruptions. IEEE Trans. Power Deliv. 2005, 20, 375–383. [Google Scholar] [CrossRef]
- Chang, C.A.; Wu, Y.K.; Chen, W.T.; Chen, B.K. A novel power system defense plan to cope with 30% wind power penetration in the island Penghu system. IEEE Trans. Ind. Appl. 2013, 49, 1669–1677. [Google Scholar] [CrossRef]
- Piwko, R.; Osborn, D.; Gramlich, R.; Jordan, G.; Hawkins, D.; Porter, K. Wind energy delivery issues. IEEE Power Energy Mag. 2005, 3, 47–56. [Google Scholar] [CrossRef]
- Wu, Y.K.; Han, G.Y.; Lee, C.Y. Planning ten onshore wind farms with corresponding interconnection network and power system analysis for low-carbon-island development on Penghu island, Taiwan. Renew. Sustain. Energy Rev. 2013, 19, 531–540. [Google Scholar] [CrossRef]
- International Electrotechnical Commission. IEC 61400-21 Wind Turbine Generator Systems—Part 21: Measurement and Assessment of Power Quality Characteristics of Grid Connected Wind Turbines; International Electrotechnical Commission: Geneva, Switzerland, 2008. [Google Scholar]
- Siddiq, S. Resource adequacy in the “Energy-Only” ERCOT market. In Proceedings of the 2007 IEEE on Power Engineering Society General Meeting, Tampa, FL, USA, 24–28 June 2007.
- Resource and Transmission Adequacy Task Force; North American Electric Reliability Corporation (NERC): Planning Committee: Atlanta, GA, USA, 2004.
- NERC. NERC Planning Standards; North American Electric Reliability Corporation (NERC): Atlanta, GA, USA, 2006. [Google Scholar]
- NERC. NERC Operating Manual; North American Electric Reliability Corporation (NERC): Atlanta, GA, USA, 2012. [Google Scholar]


| Net System Load 1 (kW) | On-Line DGs | Phase-I Units | Phase-II Units | ||||
|---|---|---|---|---|---|---|---|
| Installed Capacity | Generation (kW) | No. | Installed Capacity | Generation (kW) | No. | ||
| ≤35,000 | 5 | 10,443 | 7000 | 2 | 11,000 | 7000 | 3 |
| 35,001–50,200 | 6 | 7500 | 2 | 8800 | 4 | ||
| 50,201–61,500 | 7 | 7500 | 2 | 9300 | 5 | ||
| 61,501–72,000 | 8 | 7500 | 2 | 9500 | 6 | ||
| 72,001–81,500 | 9 | 7500 | 2 | 9500 | 7 | ||
| 81,501–89,000 | 10 | 7500 | 3 | 9500 | 7 | ||
| 89,001–98,500 | 11 | 7500 | 3 | 9500 | 8 | ||
| 98,501–106,000 | 12 | 7500 | 4 | 9500 | 8 | ||
| Load Shedding Scheme | Load Shedding Capacity (MW) | Total Load Shedding Capacity (MW) | |||
|---|---|---|---|---|---|
| Operation Pattern | Stage I (57.4 Hz) | Stage II (57.2 Hz) | Stage III (57 Hz) | ||
| Summer Peak Load | 14.44 | 11.92 | 11.4 | 37.76 | |
| Summer Off-Peak Load | 7.22 | 5.95 | 5.57 | 18.74 | |
| Winter Peak Load | 8.61 | 7.20 | 7.60 | 23.41 | |
| Winter Off-Peak Load | 5.17 | 4.32 | 4.56 | 14.05 | |
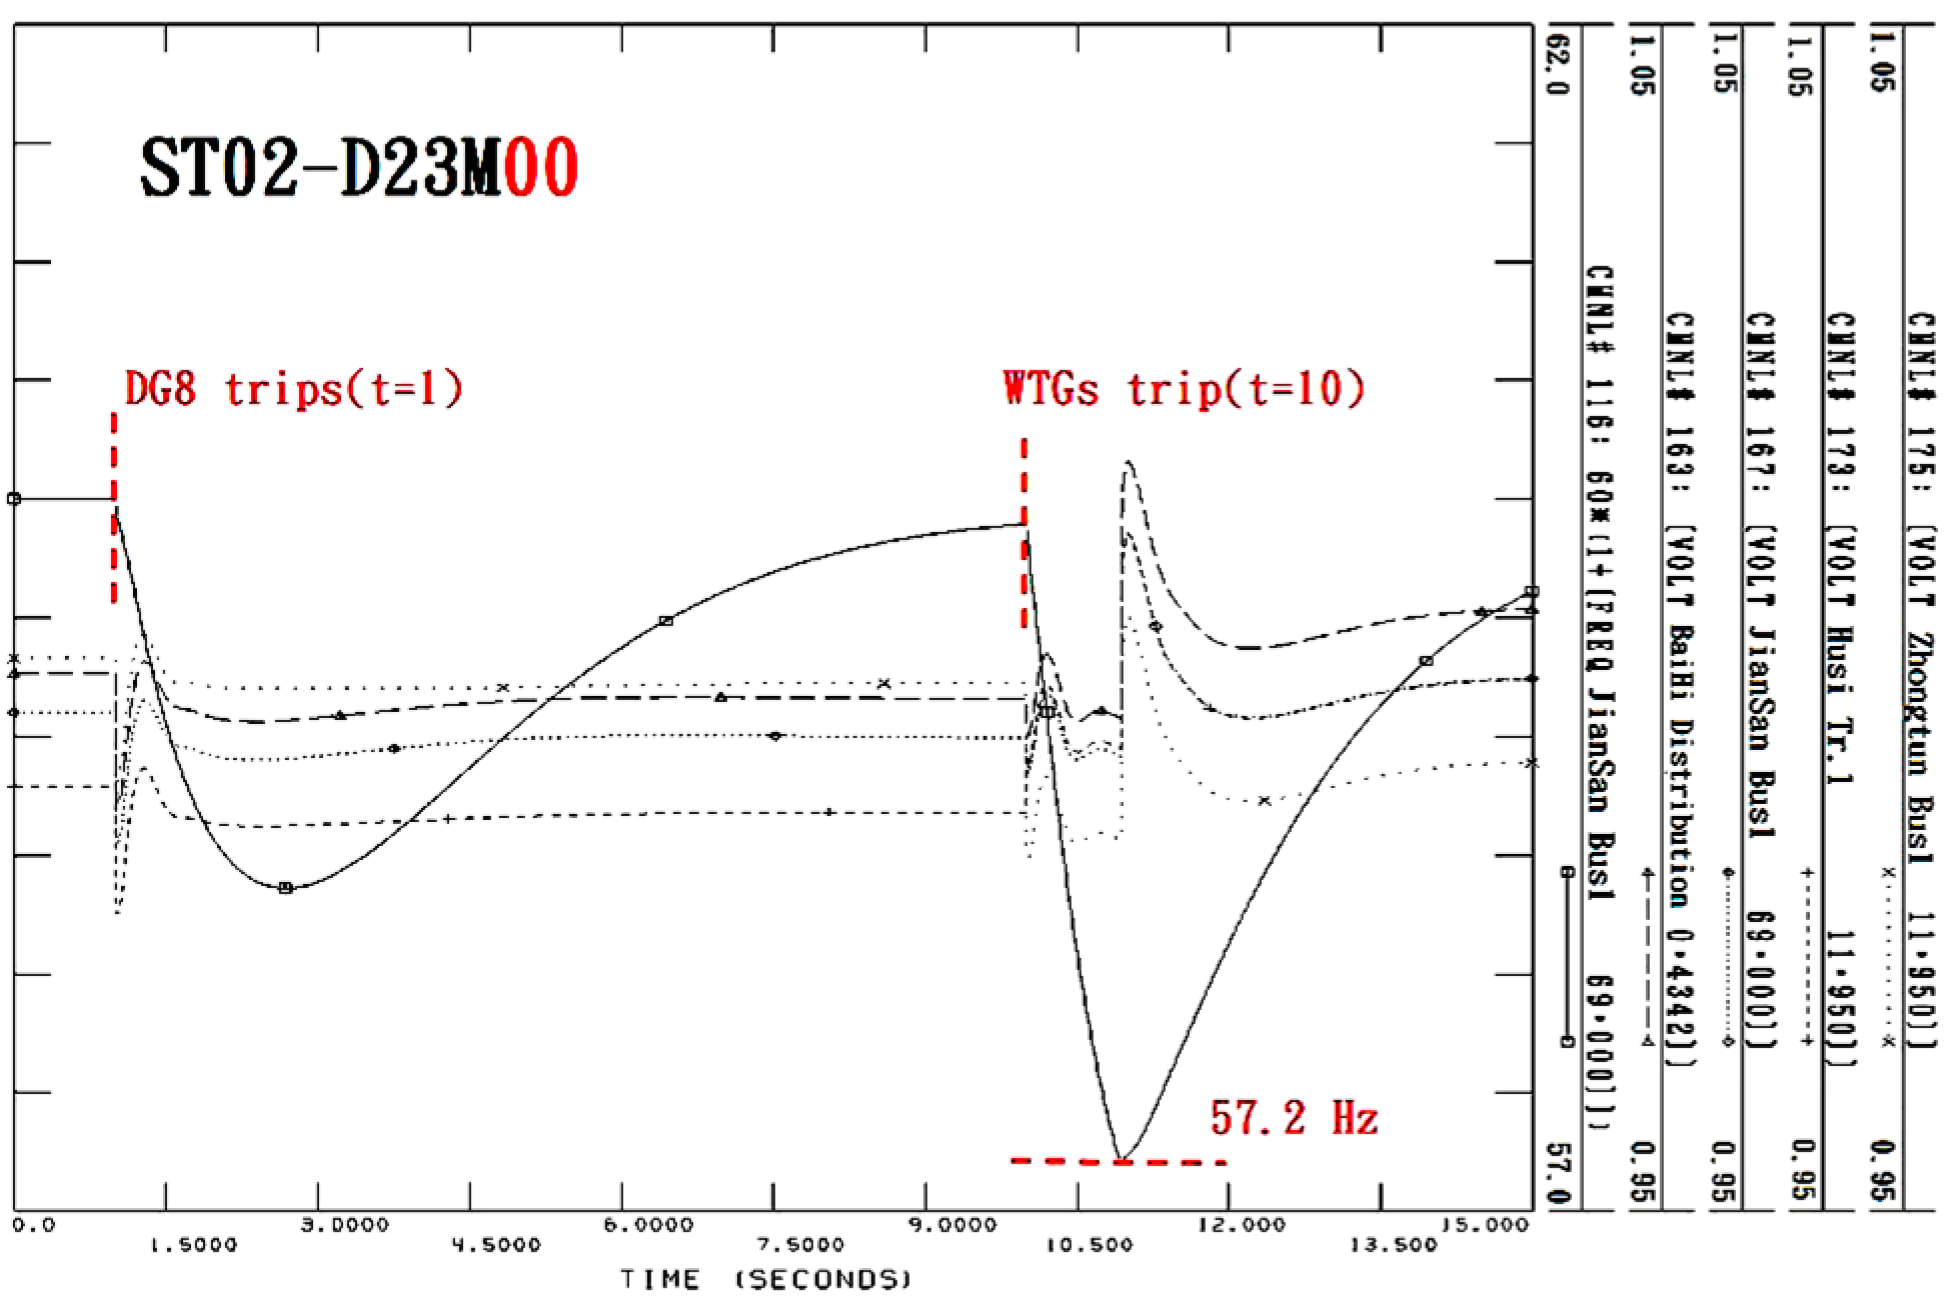
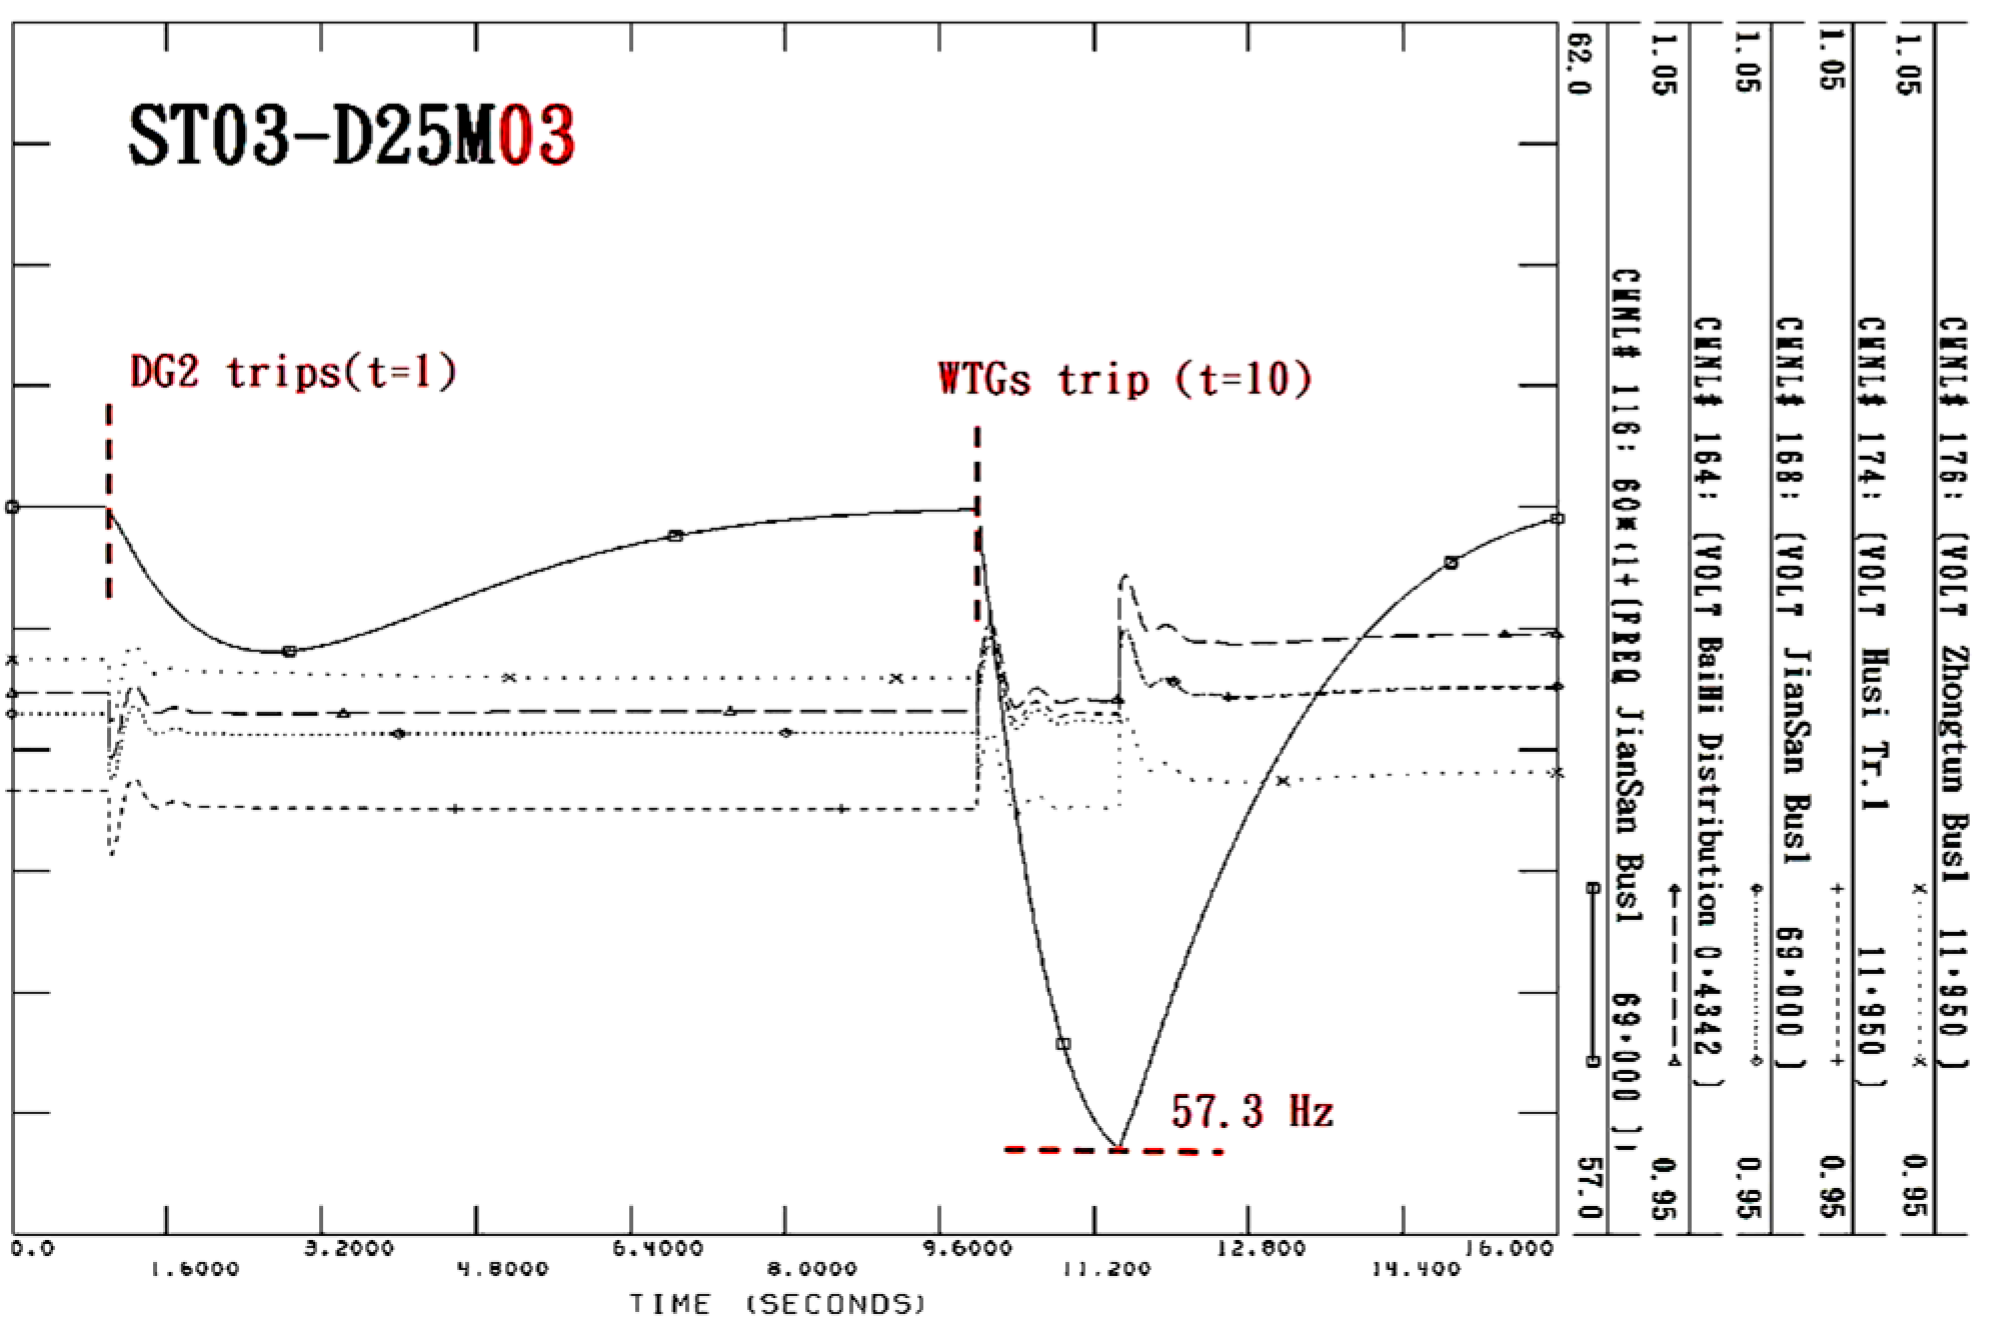
| Case | Case Study | Clearing Time |
|---|---|---|
| ST01 | All the wind turbines trip offline | - |
| ST02 | All WTs trip 10 s after DG8 trips offline | - |
| ST03 | All WTs trip 10 s after DG2 trips offline | - |
| ST04 | Wind gust (over 25 m/s) for 5 s | - |
| ST05 | DG2 trips offline | - |
| ST06 | DG2 trips 6 s after a wind gust | - |
| ST07 | DG8 trips offline | - |
| ST08 | DG8 trips 6 s after a wind gust | - |
| ST09 | DG2 (13.8 kV bus) has a ground fault | 0.1 s |
| ST10 | DG2 (Bus 13.8 kV) has a ground fault 6 s after a wind gust | 0.1 s |
| ST11 | DG8 (13.8 kV bus) has a ground fault | 0.1 s |
| ST12 | DG2 (Bus 13.8 kV) has a ground fault 6 s after a wind gust | 0.1 s |
| Operation Pattern | Total Wind Generation (MW) | Wind Power Penetration (%) | Allowed | SR (MW) |
|---|---|---|---|---|
| 23M00 | 10.5 | 30.0 | NO | 23.6 |
| D24M00 | 10.5 | 30.0 | NO | 33.8 |
| D25M00 | 10.5 | 30.0 | YES | 43.8 |
| D25M01 | 11.41 | 32.6 | YES | 44.6 |
| D25M02 | 12.32 | 35.2 | YES | 45.3 |
| D25M03 | 13.23 | 37.8 | NO | 46.0 |
| D26M03 | 13.23 | 37.8 | YES | 56.5 |
| D26M04 | 14.14 | 40.4 | YES | 57.2 |
| D26M05 | 15.05 | 43.0 | NO | 58.0 |
| D27M05 | 15.05 | 43.0 | YES | 68.6 |
| D27M06 | 15.96 | 45.6 | YES | 69.4 |
| D27M07 | 16.87 | 48.2 | YES | 70.2 |
| D27M08 | 17.78 | 50.8 | NO | 71.0 |
| D37M08 | 17.78 | 50.8 | YES | 81.0 |
| D37M09 | 18.69 | 53.4 | YES | 81.8 |
| Diesel Generator | Wind Turbine Generator | ST | |||||||||||
|---|---|---|---|---|---|---|---|---|---|---|---|---|---|
| 01 | 02 | 03 | 04 | 05 | 06 | 07 | 08 | 09 | 10 | 11 | 12 | ||
| D23 | M00 | N | L2 | L1 | N | N | N | N | N | N | N | N | N |
| D24 | M00 | N | L1 | N | N | N | N | N | N | N | N | N | N |
| D25 | M00 | N | N | N | N | N | N | N | N | N | N | N | N |
| D25 | M01 | N | N | N | N | N | N | N | N | N | N | N | N |
| D25 | M02 | N | N | N | N | N | N | N | N | N | N | N | N |
| D25 | M03 | N | L1 | L1 | N | N | N | N | N | N | N | N | N |
| D26 | M03 | N | N | N | N | N | N | N | N | N | N | N | N |
| D26 | M04 | N | N | N | N | N | N | N | N | N | N | N | N |
| D26 | M05 | N | L1 | L1 | N | N | N | N | N | N | N | N | N |
| D27 | M05 | N | N | N | N | N | N | N | N | N | N | N | N |
| D27 | M06 | N | N | N | N | N | N | N | N | N | N | N | N |
| D27 | M07 | N | N | N | N | N | N | N | N | N | N | N | N |
| D27 | M08 | N | L1 | L1 | N | N | N | N | N | N | N | N | N |
| D37 | M08 | N | N | N | N | N | N | N | N | N | N | N | N |
| D37 | M09 | N | N | N | N | N | N | N | N | N | N | N | N |
| Operating Pattern | Lost Generation (MW) | Load Shedding Stage (MW) | Lowest Frequency (Hz) | |
|---|---|---|---|---|
| Diesel Units | Wind Turbines | |||
| D23M00 | 5.50 | 10.5 | Stage 1 (5.15 MW) | 57.20 |
| Stage 2 (tripped, but no load shedding) | ||||
| D24M00 | 4.63 | 10.5 | Stage 1 (5.13 MW) | 57.39 |
| D25M03 | 3.21 | 13.23 | Stage 1 (5.15 MW) | 57.34 |
| D26M05 | 2.38 | 15.05 | Stage 1 (5.15 MW) | 57.37 |
| D27M08 | 1.65 | 17.78 | Stage 1 (5.15 MW) | 57.34 |
| Operating Pattern | Lost Generation (MW) | Load Shedding Stage (MW) | Lowest Frequency (Hz) | |
|---|---|---|---|---|
| Diesel Units | Wind Turbines | |||
| D23M00 | 4.15 | 10.5 | Stage 1 (5.15 MW) | 57.24 |
| D25M03 | 3.0 | 13.23 | Stage 1 (5.15 MW) | 57.37 |
| D26M05 | 3.0 | 15.05 | Stage 1 (5.15 MW) | 57.39 |
| D27M08 | 3.0 | 17.78 | Stage 1 (5.15 MW) | 57.36 |
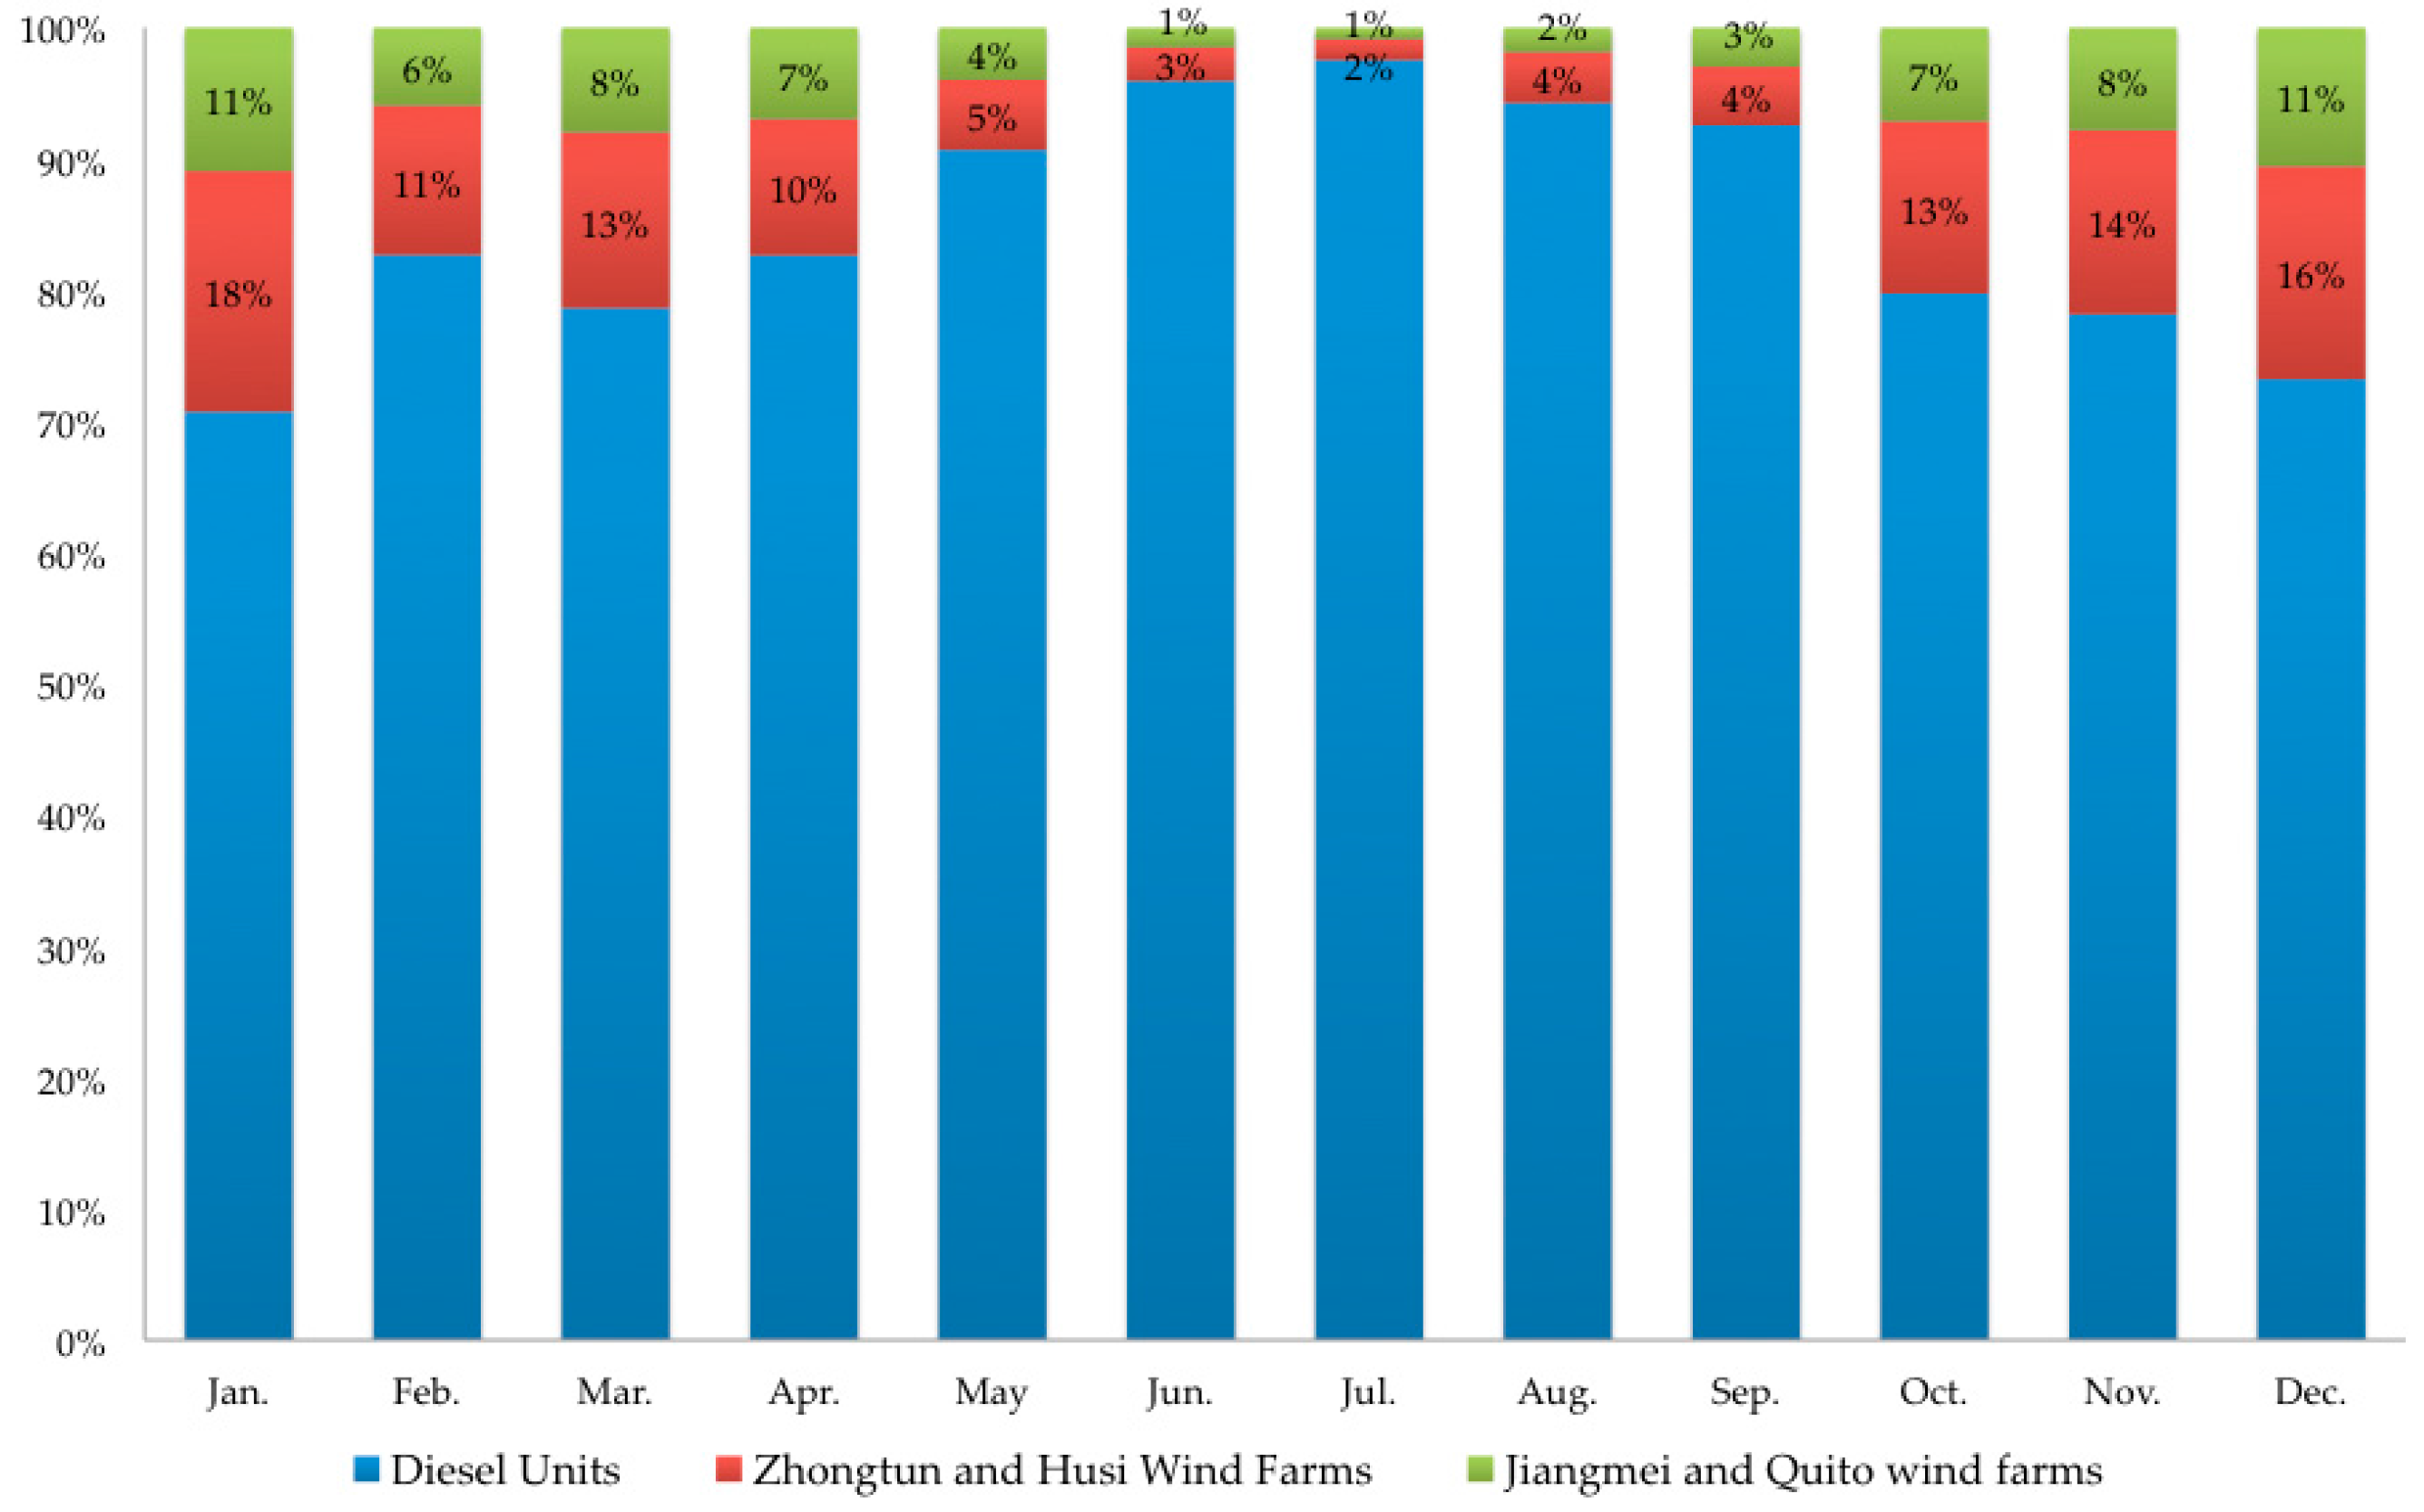
| Month | Monthly Total Generation from Diesel Units (kWh) | Monthly Total Generation from Wind Turbines (kWh) |
|---|---|---|
| Jan. | 29,797,227 | 2,834,156 |
| Feb. | 28,094,001 | 1,590,760 |
| Mar. | 30,288,281 | 2,039,128 |
| Apr. | 31,020,188 | 1,606,039 |
| May | 37,529,565 | 975,520 |
| Jun. | 41,289,457 | 504,872 |
| Jul. | 47,414,545 | 355,979 |
| Aug. | 44,773,049 | 833,183 |
| Sep. | 44,580,617 | 961,998 |
| Oct. | 33,853,882 | 2,228,634 |
| Nov. | 30,378,402 | 2,148,784 |
| Dec. | 29,803,820 | 2,464,157 |
| Annual | 428,823,034 | 18,543,210 |
| Month | Monthly Total Generation from Diesel Units (kWh) | Monthly Total Generation from Wind Turbines (kWh) |
|---|---|---|
| Jan. | 23,244,080 | 9,387,309 |
| Feb. | 24,546,147 | 5,138,615 |
| Mar. | 25,421,976 | 6,905,435 |
| Apr. | 27,150,251 | 5,475,976 |
| May | 35,219,599 | 3,285,487 |
| Jun. | 40,096,953 | 1,697,377 |
| Jul. | 46,601,508 | 1,169,016 |
| Aug. | 42,993,271 | 2,612,962 |
| Sep. | 42,405,141 | 3,137,474 |
| Oct. | 28,774,180 | 7,308,338 |
| Nov. | 25,424,069 | 7,103,118 |
| Dec. | 23,625,555 | 8,642,422 |
| Annual | 385,502,730 | 61,863,527 |
© 2016 by the authors; licensee MDPI, Basel, Switzerland. This article is an open access article distributed under the terms and conditions of the Creative Commons Attribution (CC-BY) license (http://creativecommons.org/licenses/by/4.0/).
Share and Cite
Chang, C.-A.; Wu, Y.-K.; Chen, B.-K. Determination of Maximum Wind Power Penetration in an Isolated Island System by Considering Spinning Reserve. Energies 2016, 9, 688. https://doi.org/10.3390/en9090688
Chang C-A, Wu Y-K, Chen B-K. Determination of Maximum Wind Power Penetration in an Isolated Island System by Considering Spinning Reserve. Energies. 2016; 9(9):688. https://doi.org/10.3390/en9090688
Chicago/Turabian StyleChang, Chia-An, Yuan-Kang Wu, and Bin-Kwie Chen. 2016. "Determination of Maximum Wind Power Penetration in an Isolated Island System by Considering Spinning Reserve" Energies 9, no. 9: 688. https://doi.org/10.3390/en9090688
APA StyleChang, C.-A., Wu, Y.-K., & Chen, B.-K. (2016). Determination of Maximum Wind Power Penetration in an Isolated Island System by Considering Spinning Reserve. Energies, 9(9), 688. https://doi.org/10.3390/en9090688