1. Introduction
Power system oscillation is a common problem in interconnected power grids that limits the inter-area electric power transfer capability and threatens the security of power grid operations. The generation mechanisms of oscillations have long been a vital concern [
1,
2,
3,
4,
5,
6]. The occurrence of oscillations in weakly connected systems has been well explained by the negative damp mechanism [
7], based on which, the power system stabilizer (PSS) is designed as an effective measure to enhance the system damping. However, oscillations still occur on occasions when power grids don’t demonstrate poor damping characteristics [
8]. These oscillations have features like fast start-up and oscillation of constant amplitude. Through the analysis of actual accidents and simulations, it was found that this type of oscillation is usually induced by an existing periodic disturbance source [
9,
10,
11]. Under the periodic disturbance, the power system is forced to oscillate with the same frequency as the disturbance, and the amplitude of the oscillation reaches its maximum value when the oscillating frequency equals one of the system’s natural oscillation frequencies. This is the well-known forced oscillation mechanism. In previous studies, various power system disturbances have been found to be the sources of forced oscillations, such as cyclic loads [
12,
13,
14], cyclical mechanical power fluctuations of the prime mover [
10], turbo-pressure pulsations [
15], and pressure fluctuations in hydraulic turbine draft tubes [
16]. The effective way to restrain forced oscillations is to detect and remove the disturbance source [
17,
18].
In the past decade, renewable power generations and new loads such as wind power and electrical vehicles have developed very quickly. With their features of intermittence and randomness, the integration of these renewable power generations and new loads has brought more random components into the power grid [
19]. Researchers have proposed that random power fluctuations generated by renewable power generations or new loads can also be regarded as an forced oscillations excitation source [
20,
21,
22], such as the power variations effected by the tower shadow and wind shear in wind farms [
23,
24]. In [
25], the inter-area oscillations were monitored on the interconnector between the Northern Ireland and Republic of Ireland systems. It was found by simulations that there is a correlation between the inter-area oscillation and the wind power output in the Irish electricity system. However, the mechanism of the inter-area oscillations is not investigated.
Meanwhile, according to recent observations, similar inter-area oscillations have occurred frequently in an interconnected power grid of China. They are hard to suppress due to their unknown mechanism. All these oscillations happened when the power grid didn’t demonstrate poor damping characteristics, which are close to the property of forced oscillations. However, the observed oscillations usually oscillate with random amplitude and a narrow frequency band. Using the conventional forced oscillation mechanism, such oscillations only can be caused by multiple excitations with different single frequencies and these frequencies should constitute a narrow frequency band. This condition is rarely satisfied in real power grids. Thus, the conventional forced oscillation mechanism doesn’t satisfactorily explain such types of oscillations.
In order to address this issue, the general forced oscillation (GFO) mechanism is applied to study the above-mentioned oscillations observed in the real power grid of China. Different from the conventional mechanism that deals with single-frequency excitations and oscillations, the GFO mechanism reveals the relationship between the narrow-band random oscillations and random excitations. This mechanism is described based on the power spectral density (PSD) analysis and applied in the New England 10-generator, 39-bus system in our previous work [
26]. The PSD analysis has been successfully applied to the Korea Electric Power Corporation System, by which the oscillation mode parameters were accurately estimated from a measured low-frequency oscillation [
27]. In this paper, the GFO mechanism is applied for the first time to a real power grid. The properties of the inter-area oscillations measured by the wide area measurement system (WAMS) are analyzed at first. Based on the mechanism analysis, it can be speculated that the observed oscillation is the GFO caused by some narrow-band random excitation. It is found that the fluctuations of wind power in this real power grid may lead to the observed GFO phenomenon. Simulations are carried out, and the observed inter-area oscillation is indeed proved to be induced by the wind power fluctuations, because of the similarity of features between the simulated and measured oscillations.
2. Observation of the Oscillations in a Real Power Grid
The studied real power grid is a large-scale power system consisting of two interconnected regional grids, namely, the North China Power Grid (NCPG) and the Central China Power Grid (CCPG). The total grid covers an area of about 3,000,000 km2. A large amount of electricity is transferred between NCPG and CCPG via a 1000 kV ultra-high voltage (UHV) tie line. The system model used for off-line analysis is conducted in the power system analysis software package (PSASP), which is a commercial software package developed by the China Electric Power Research Institute and widely used in the real power grid analysis in China. The system model contains 883 generators and 8587 buses and all generators are modeled using fifth-order models. The modal analysis results indicate that there is an inter-area oscillation mode between these two regional grids, and its natural oscillation frequency and damping ratio are equal to 0.176 Hz and 8.039%, respectively.
The oscillation monitoring module has been implemented in WAMS to detect and record the inter-area oscillations. The parameters of oscillations, namely amplitude, dominant frequency and oscillation times, are estimated based on the WAMS data. According to the records, destructive oscillations have not been observed in real power grids recently because of the improvement of power grid structures and the installation of the PSSs. However, some oscillations with small and medium-sized amplitude have occurred frequently on the UHV tie line since June 2014.
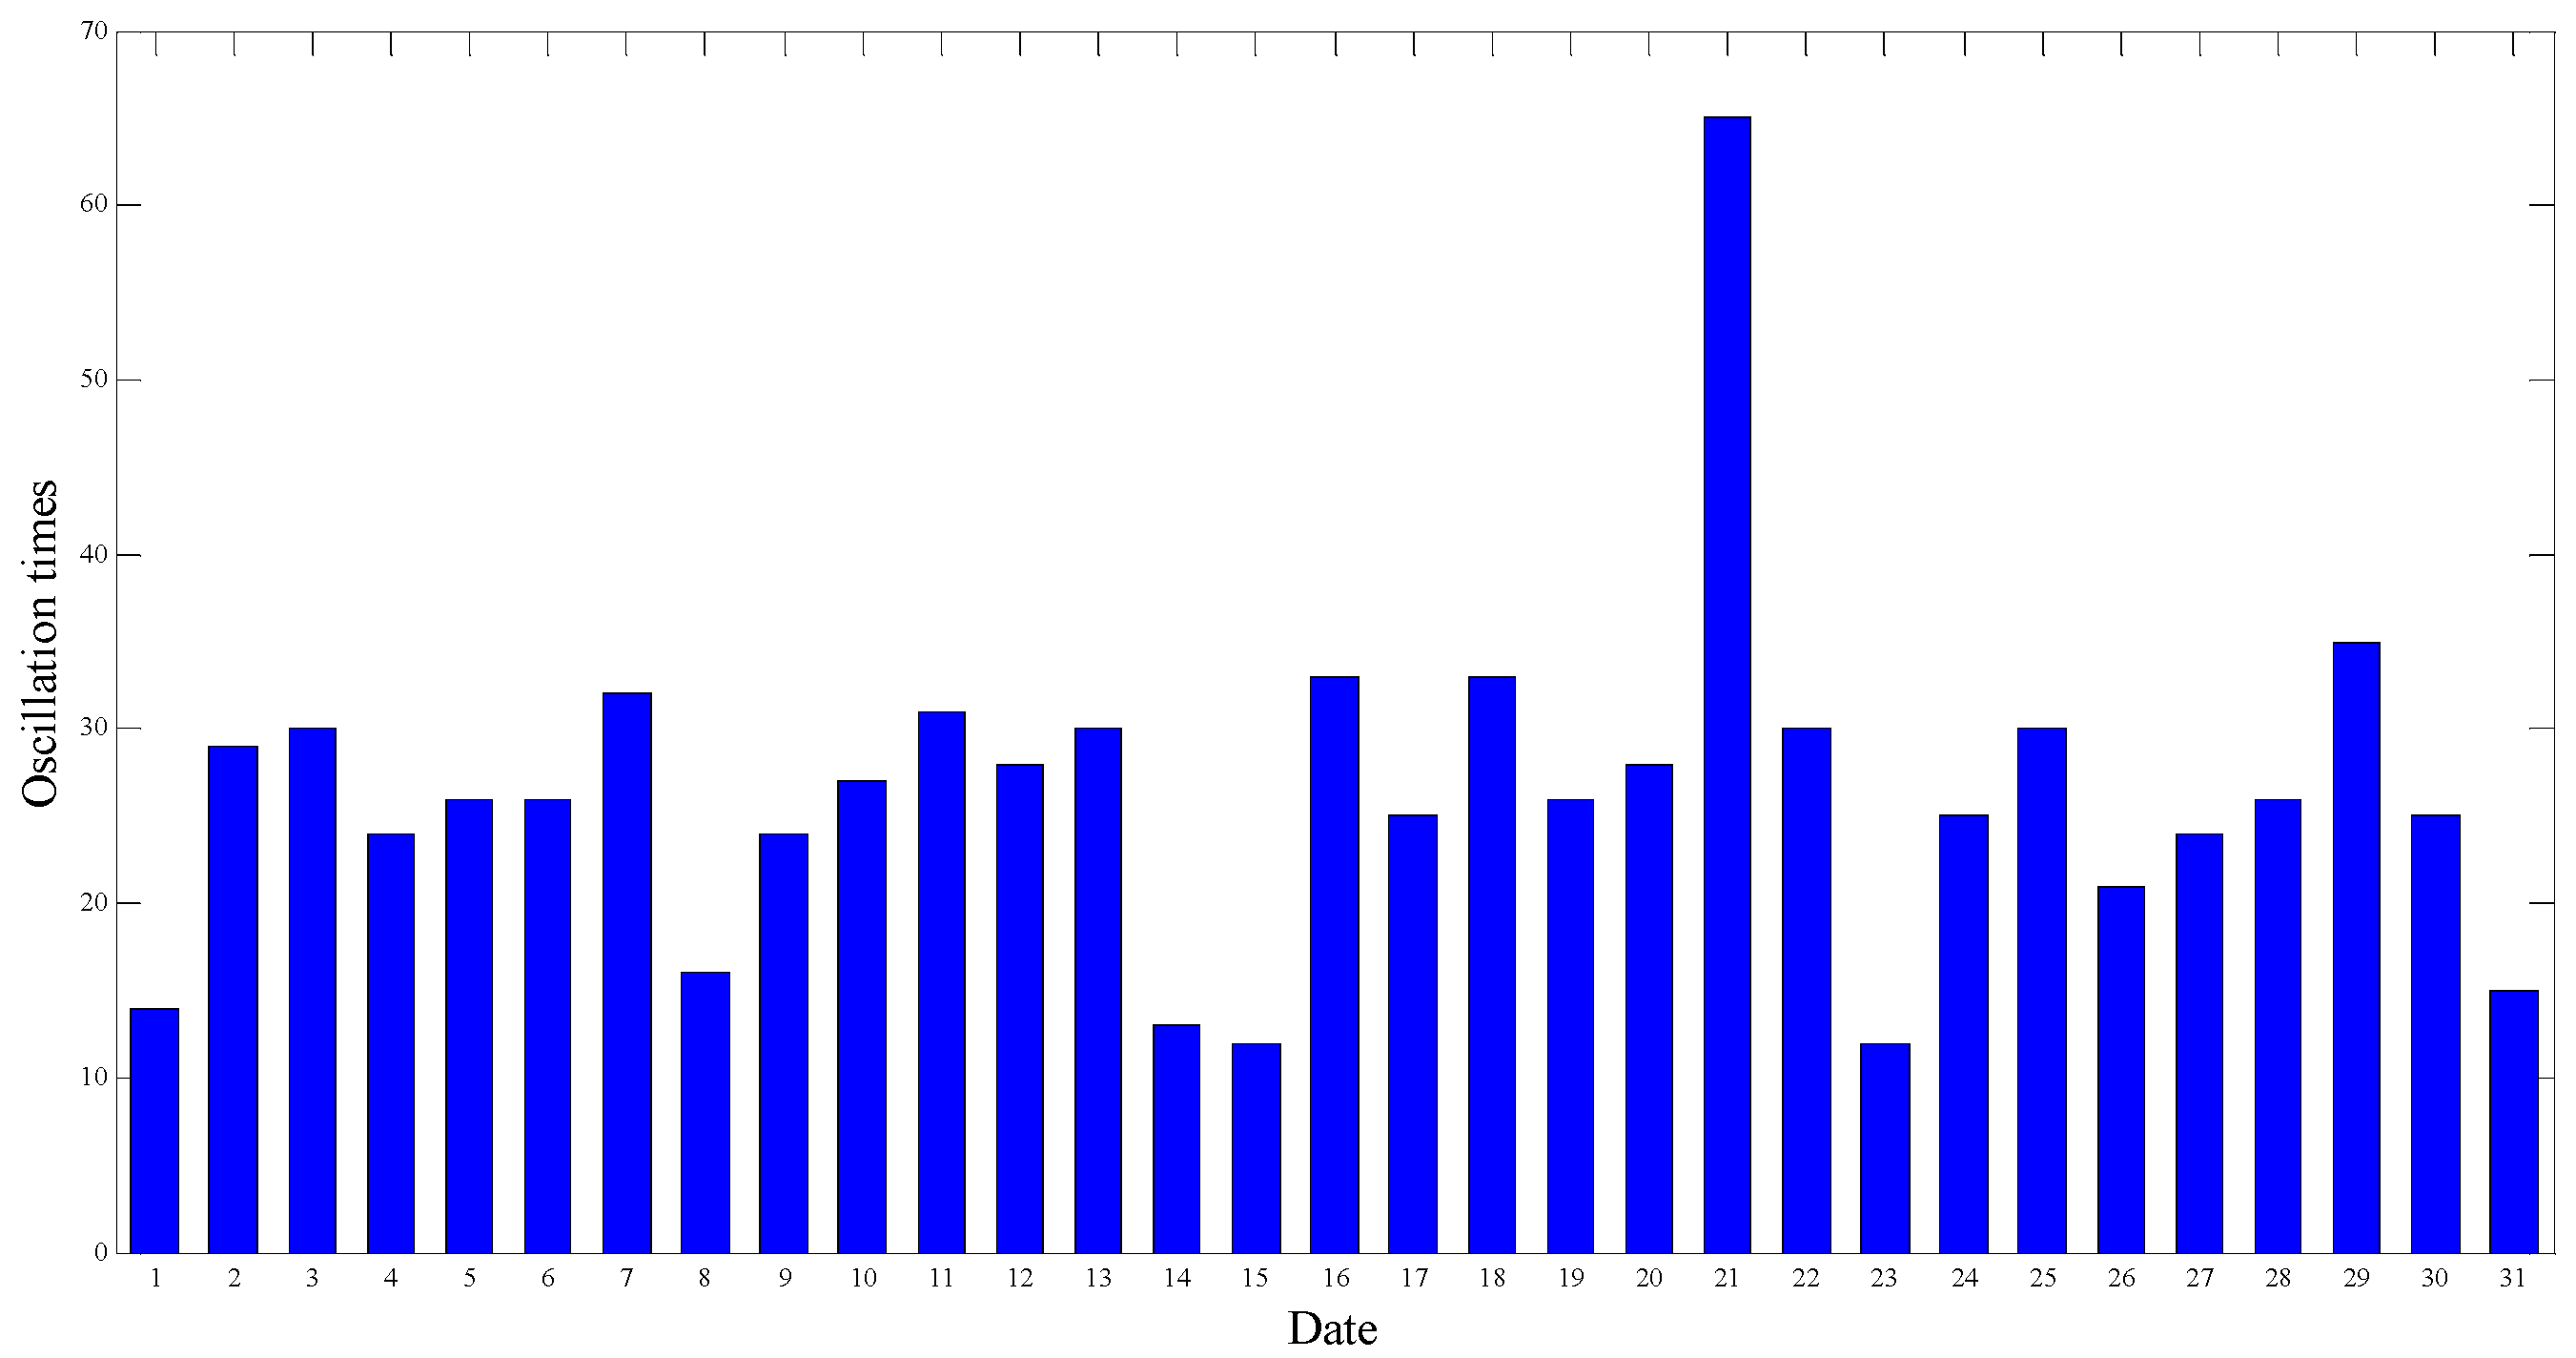
In January 2015, oscillations occurred 815 times on the UHV tie line. The maximum amplitude of the oscillations is about 330 MW, while the transmission power of the UHV tie line is about 1600 MW. The distribution of daily oscillation times during this period is shown in
Figure 1. It can be seen that the oscillation times are approximately uniformly distributed during one month, and the oscillation happened from 12 to 65 times every day, which indicates that the UHV tie line oscillations happened very frequently every day.
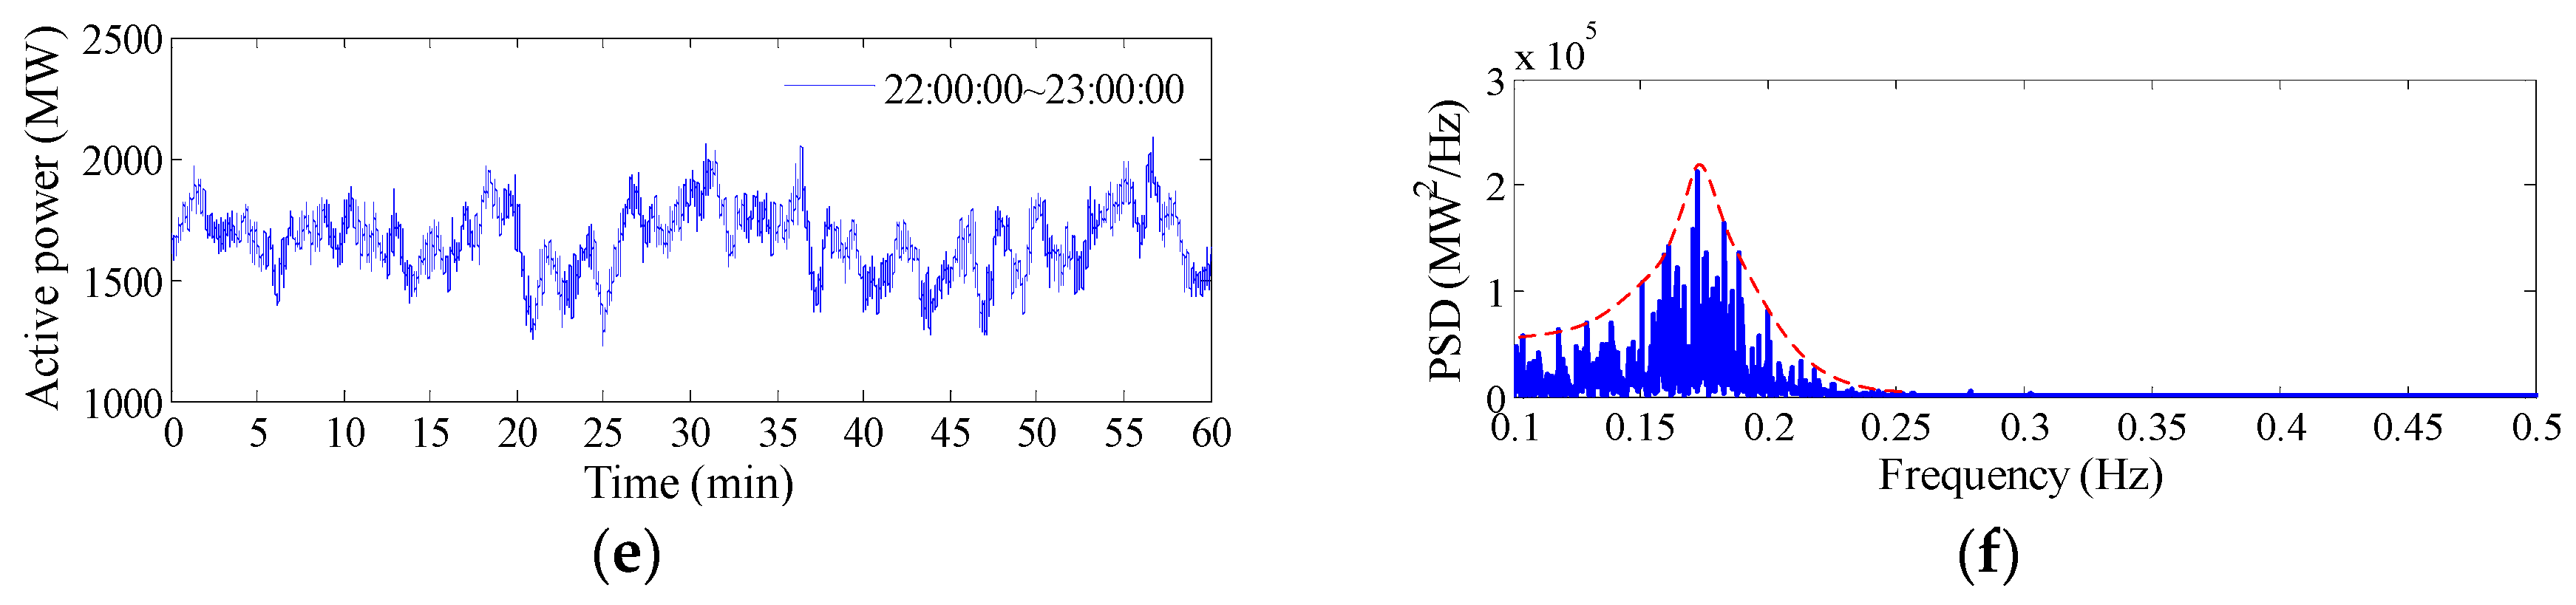
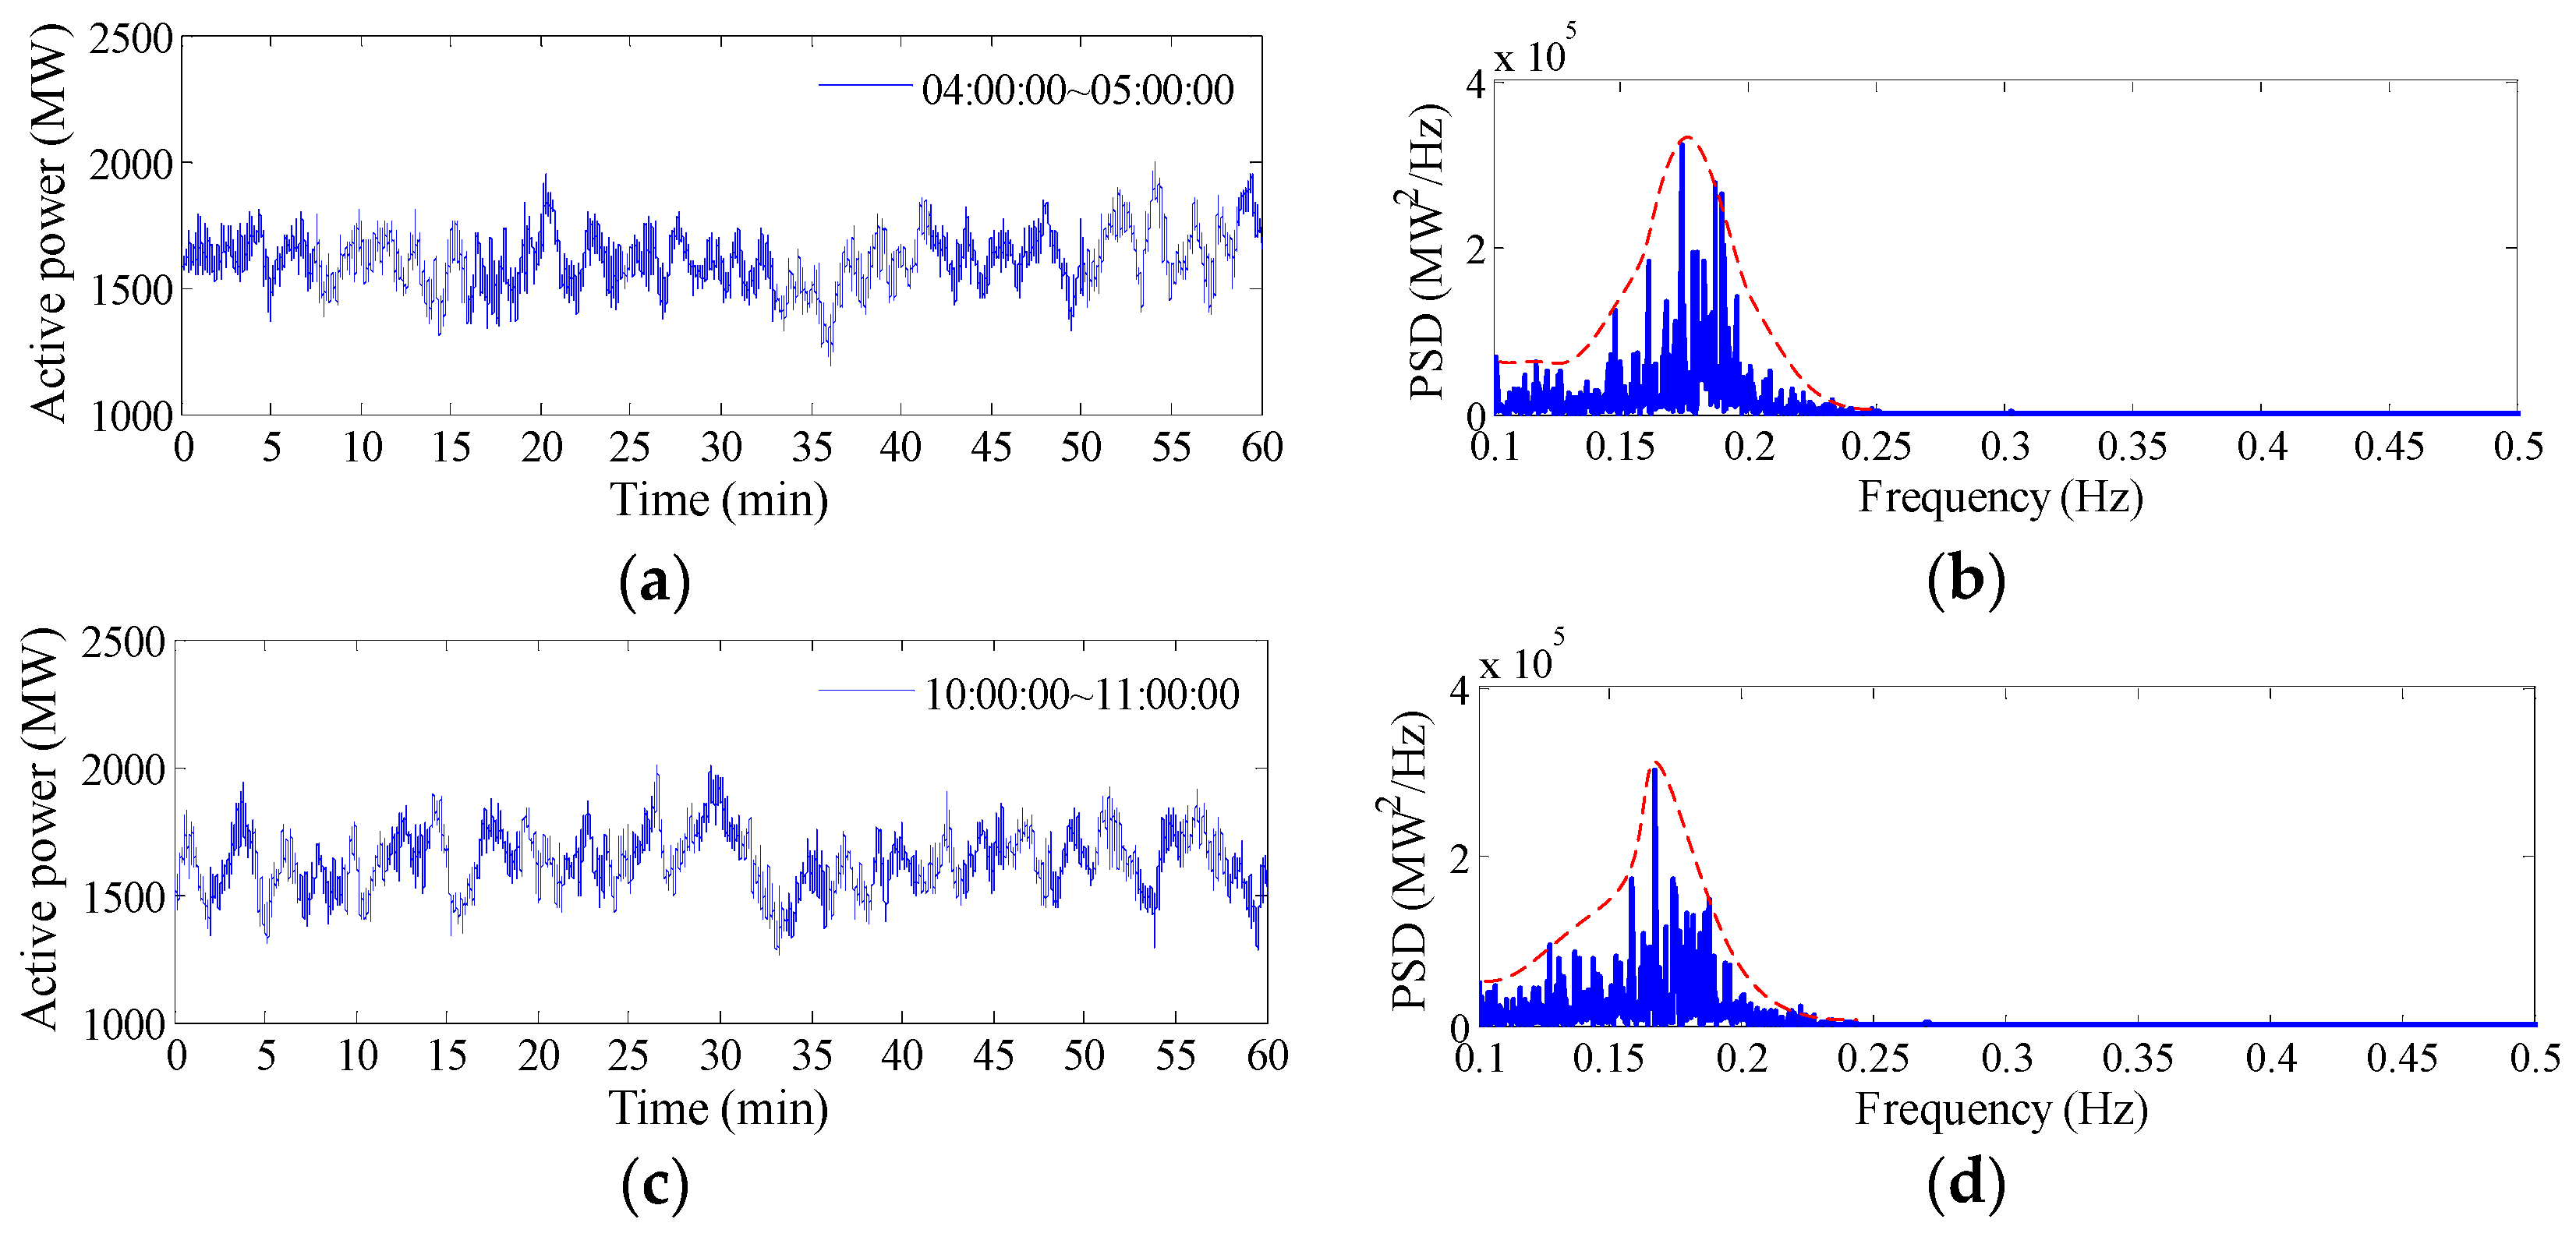
Then, several measured oscillation data of one hour on 1 January 2015 are analyzed. The dynamics of oscillations, respectively, from 04:00:00 to 05:00:00, from 10:00:00 to 11:00:00 and from 22:00:00 to 23:00:00, are chosen as examples and shown in
Figure 2a,c,e. It can be seen that all the time-domain curves exhibit strong randomness and no uniform properties can be observed. In order to obtain a common oscillating property of these oscillations, the PSD is used to analyze the frequency-domain properties of these oscillations. The corresponding PSDs of these oscillations are shown in
Figure 2b,d,f, respectively. It can be seen that their PSDs have similar shape. The oscillation energy distributes on a frequency band of 0.10–0.25 Hz. The PSD shape can be depicted as a sharp wave and its maximum value is located at a frequency of 0.175 Hz, which is very close to the frequency of the inter-area oscillation mode, i.e., 0.176 Hz.
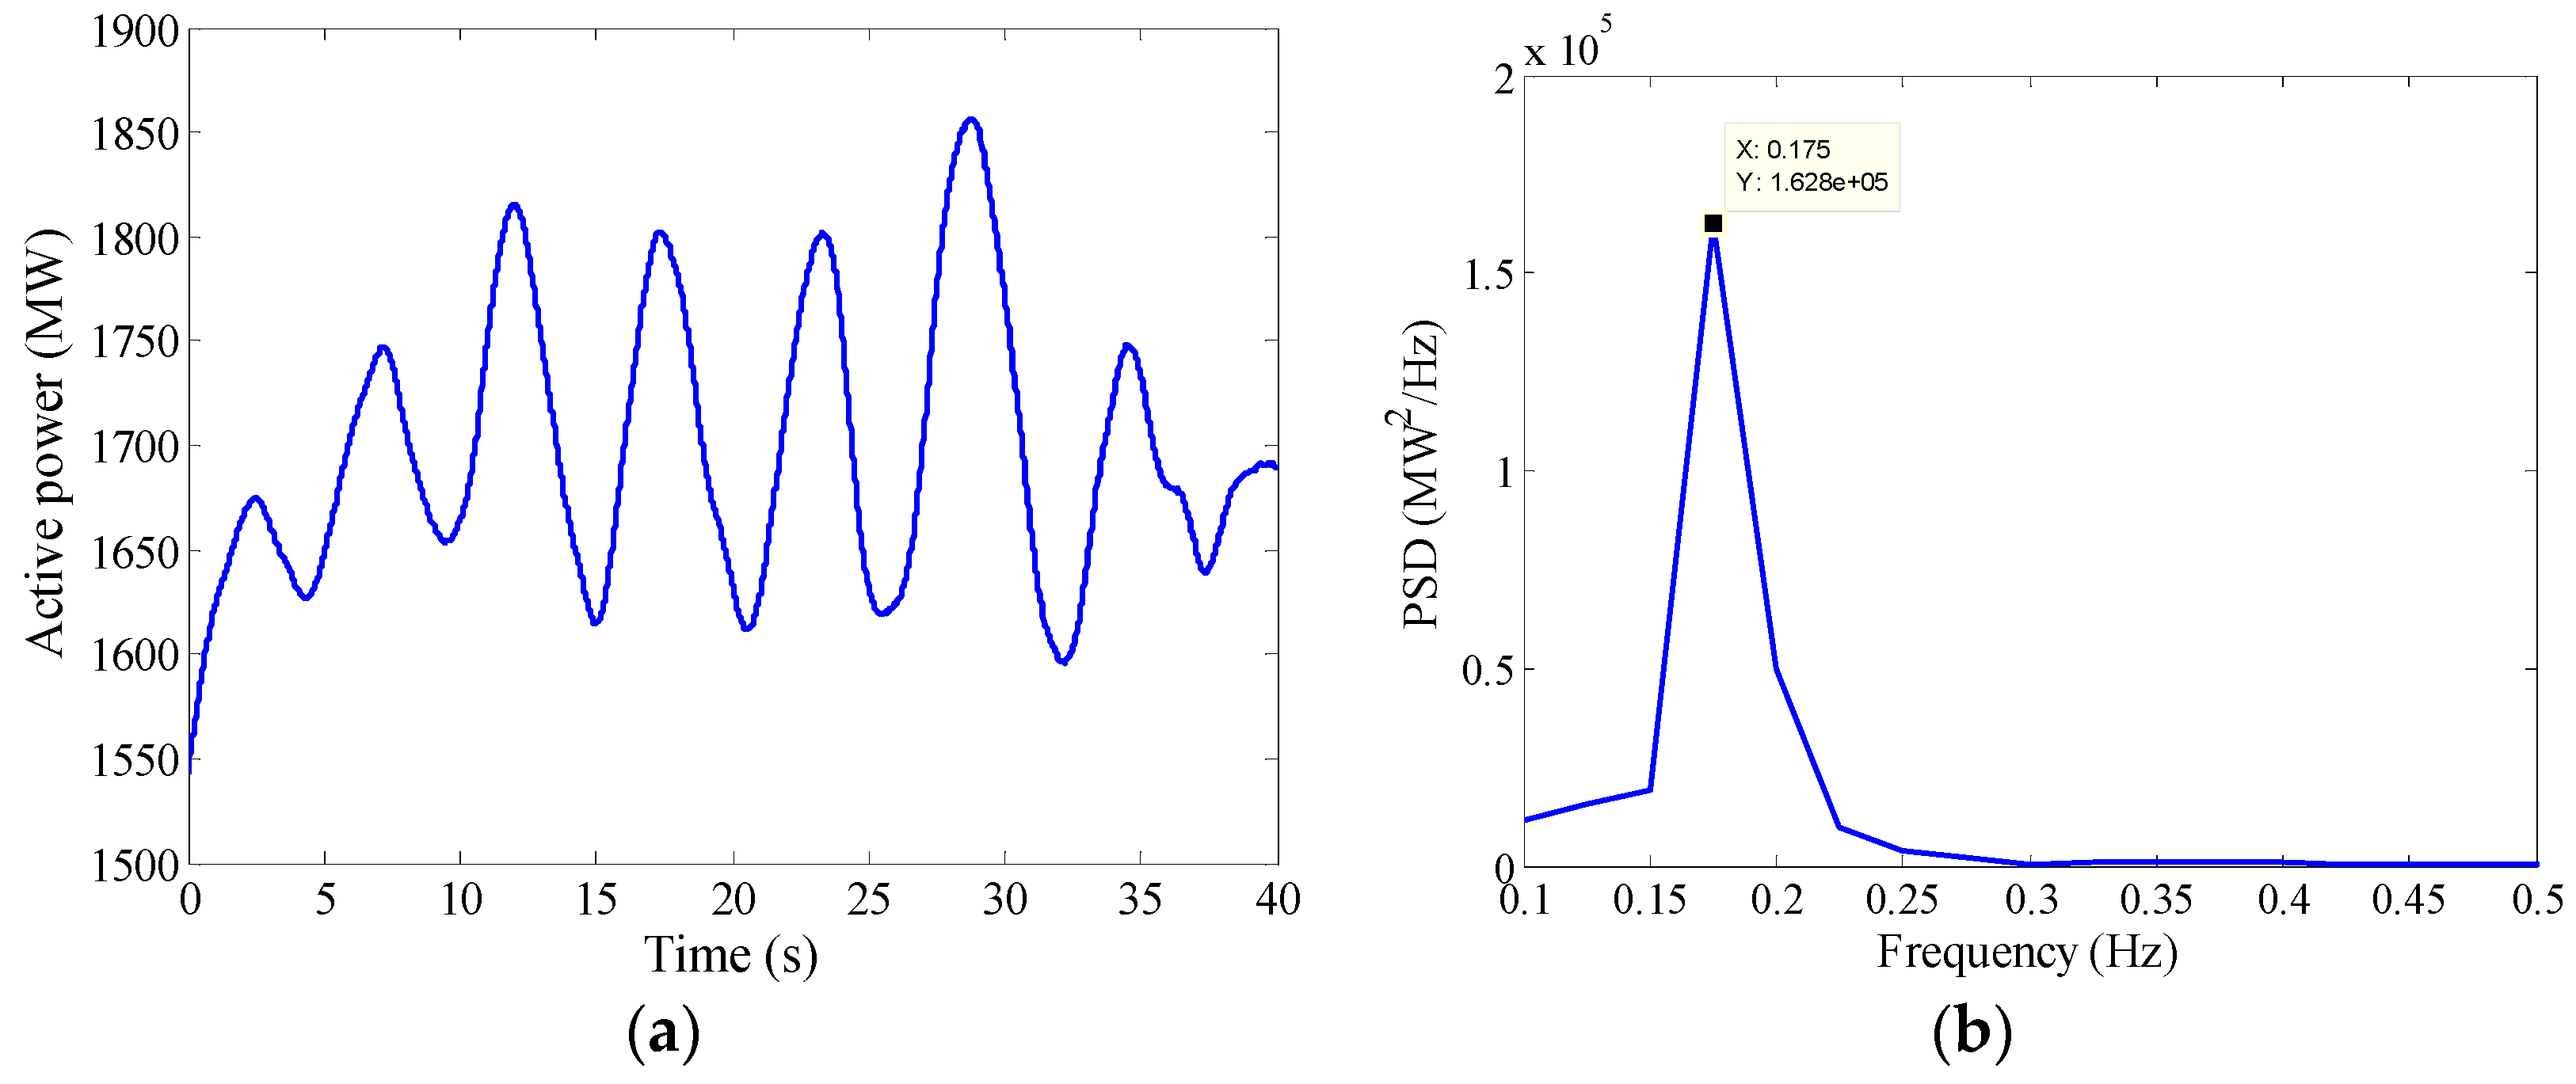
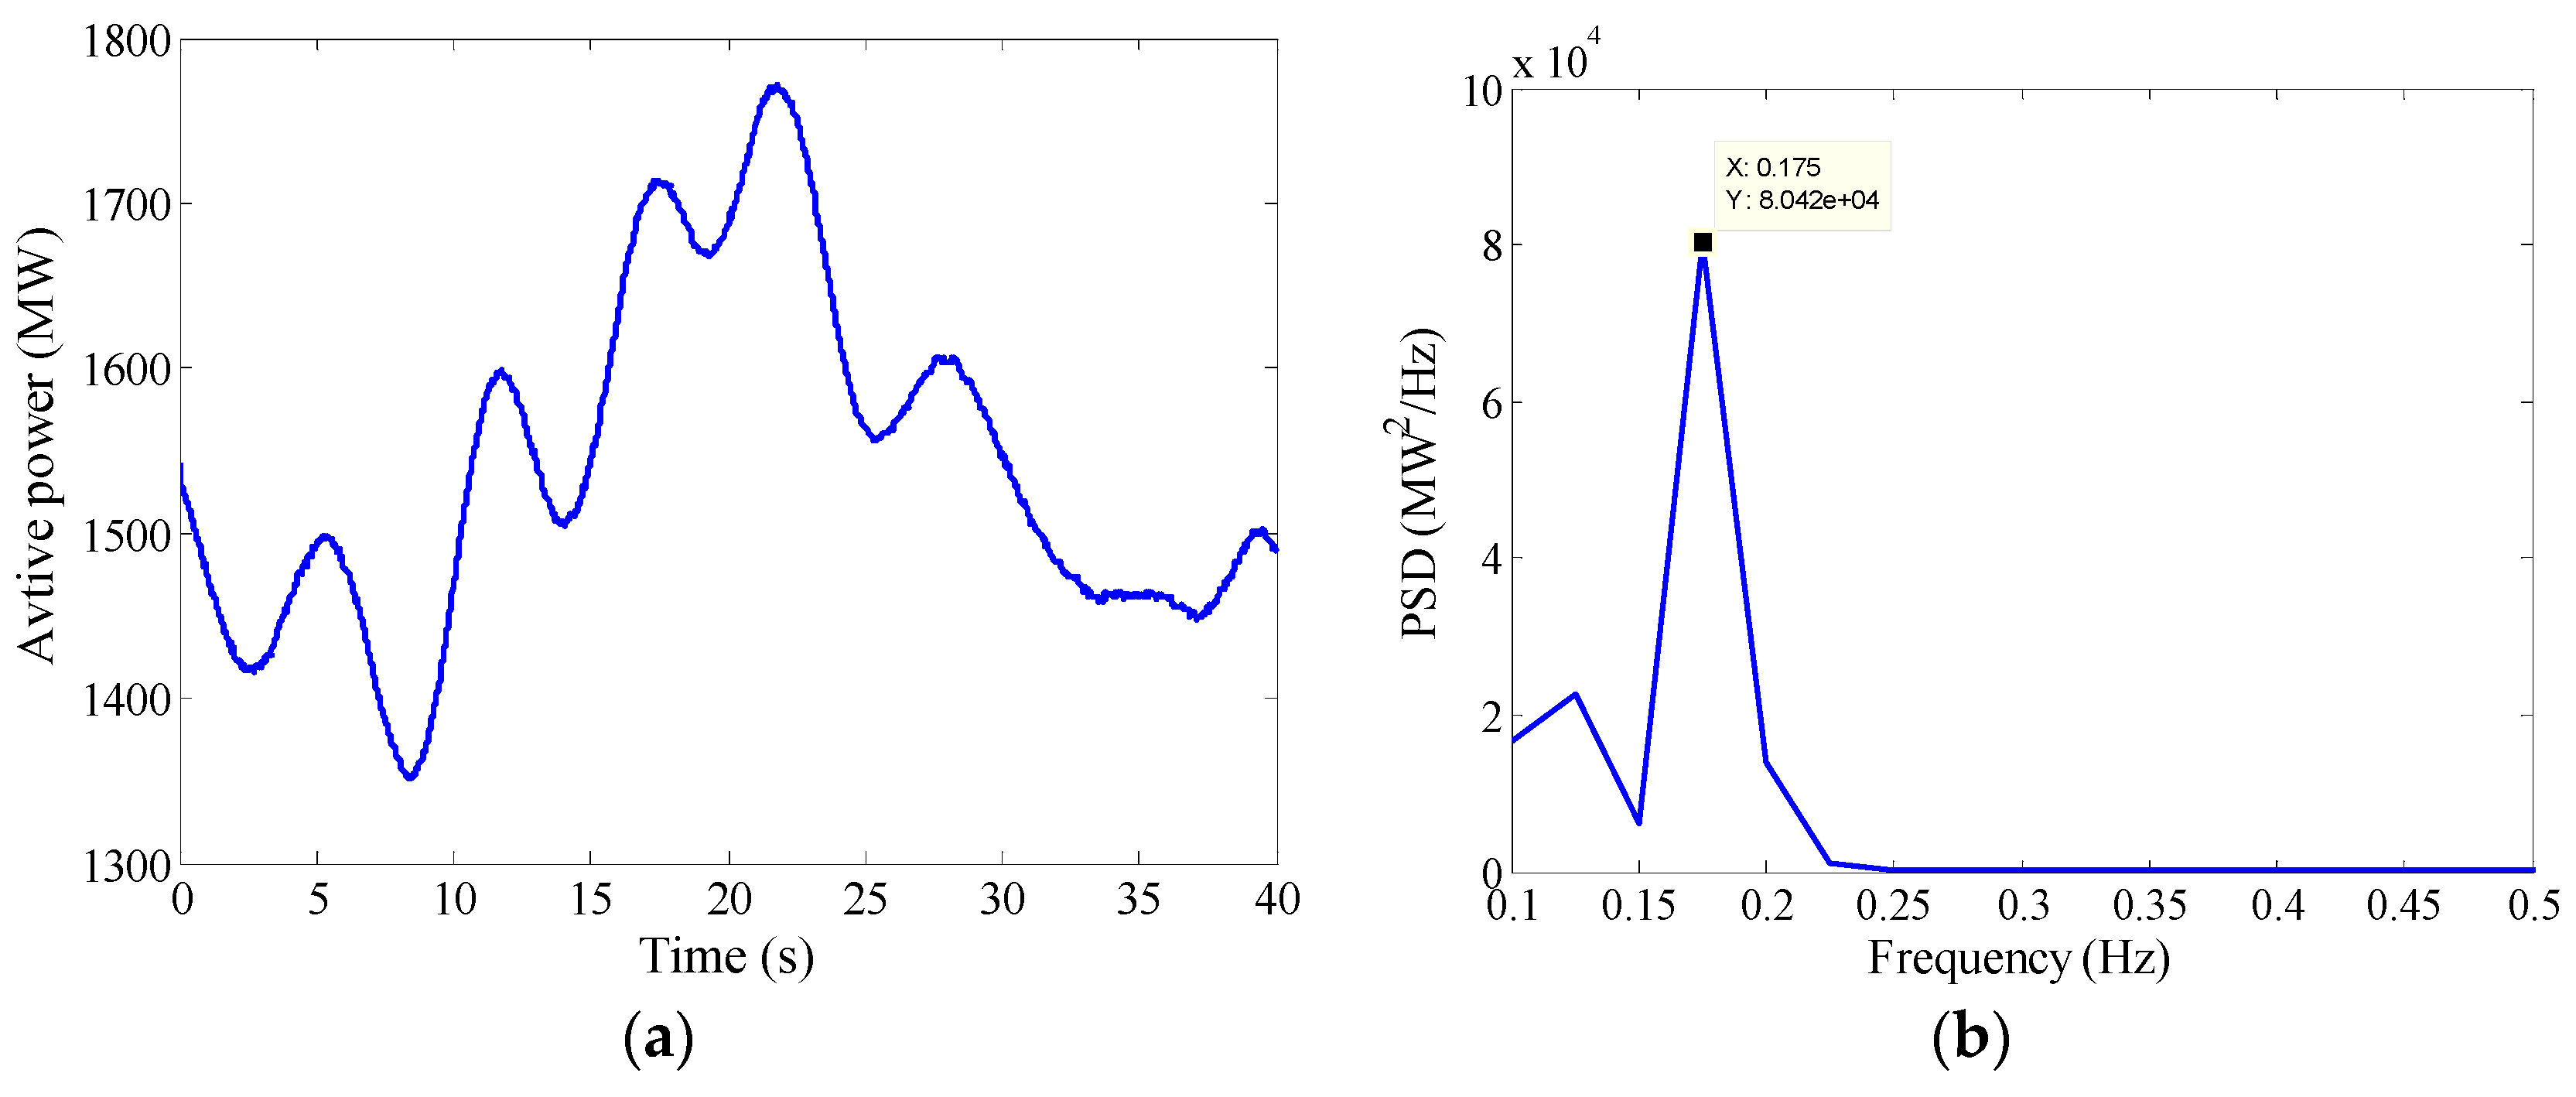
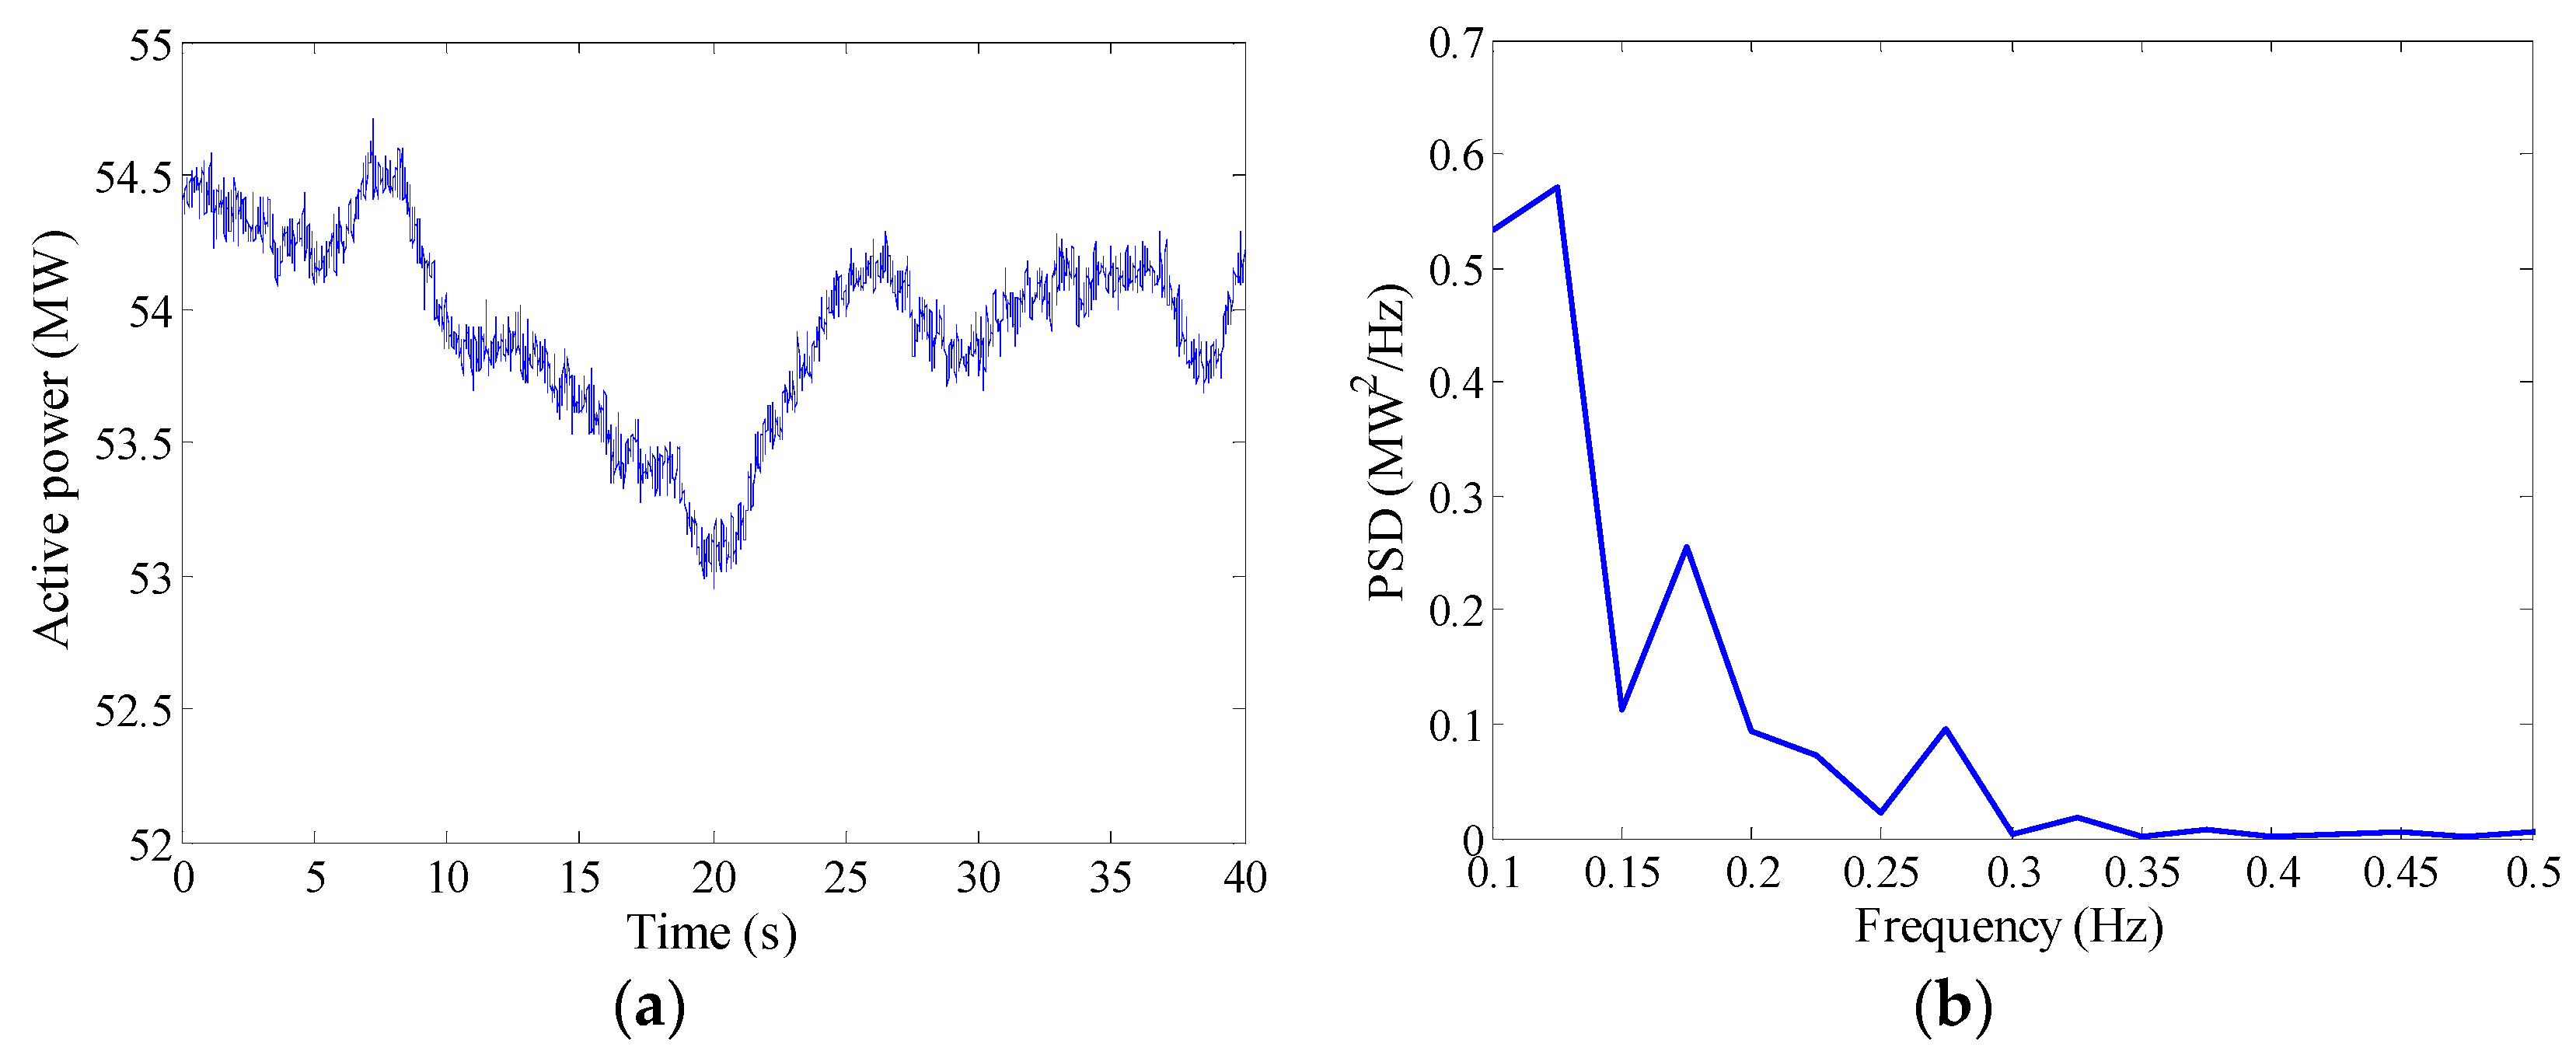
According to the analysis above, the UHV tie line oscillations mainly have four features, i.e., medium-sized amplitude, frequent occurrence, strong randomness in time domain and sharp wave shape in frequency domain. To explain the mechanism of the observed inter-area oscillations better, the UHV tie line oscillation observed from 22:45:00 to 22:45:40 on 1 January 2015 is chosen as the example for further study. The dynamics and the PSD of the oscillation are shown in
Figure 3a,b, respectively.
3. Basic Concepts of the Forced Oscillations
According to the damping ratio of the inter-area oscillation mode, the observed oscillations do not belong to the poorly damped oscillations type, while they are very close to the forced oscillations. A mechanism for forced oscillations, which is similar to the concept of resonance in physics, has been proposed and widely used in previous studies. The basic concepts of forced oscillations are briefly reviewed as follows.
3.1. Conventional Forced Oscillation Mechanism
Assuming that a sinusoidal disturbance
is applied on a single machine infinite bus system, the linearized rotor motion equation in per-unit system can be written as:
where
,
and
are the inertia constant, damping coefficient and torque coefficient of the synchronous generator, respectively;
is the rotor angle.
Then, the forced oscillation of the rotor angle can be expressed by:
where
is the frequency ratio, and is given by
;
is the damping ratio, and is given by
;
is the phase difference.
According to Equation (2), the amplitude of the forced oscillation is maximized when the forced frequency is equal to natural oscillation frequency (i.e., ). In this case, for a weak damping system with small , even a small cyclic disturbance may induce a forced oscillation with high amplitude, which threatens the safety of power systems.
The conventional forced oscillation mechanism above shows the relationship between the single-frequency excitations and forced oscillations. It is quite different to the observed inter-area oscillations in the real power grid of China. From the dynamics of the recorded oscillations, the active power varies with random amplitude and a narrow frequency band, and it seems that these oscillations are induced by some random excitation, such as the random power fluctuation of wind power. However, the conventional mechanism is based on deterministic time-domain analysis of power system dynamics. The influence of random excitations on the power system oscillations is lack of deep research. Hence, the conventional forced oscillation mechanism has limitations to study the observed inter-area oscillations.
3.2. General Forced Oscillation Mechanism
In [
26], the GFO mechanism of the forced oscillation caused by the random excitation is investigated in frequency domain, because the time-domain properties of both random excitations and forced oscillations are usually very complex. The effectiveness of this mechanism is validated by simulations in the 10-generator, 39-bus power system. Thus the GFO mechanism is considered to be applied to study the oscillations observed in the real power grids.
Based on the linear system theory, the linearized power system can be modeled as [
28]:
where
is the frequency-domain transfer function of the linear system;
is the PSD of the input stationary random process;
is the PSD of the output stationary random process. The PSD describes how the power of a signal is distributed over the different frequencies [
29]. For a high-order power system, it’s difficult to obtain an accurate value of
. To solve this issue, we use Equation (3) to make a qualitative analysis instead of a quantitative analysis. According to Equation (3), the frequency-domain property of the system response depends on the frequency-domain property of the input random excitation and the squared amplitude-frequency property of the transfer function.
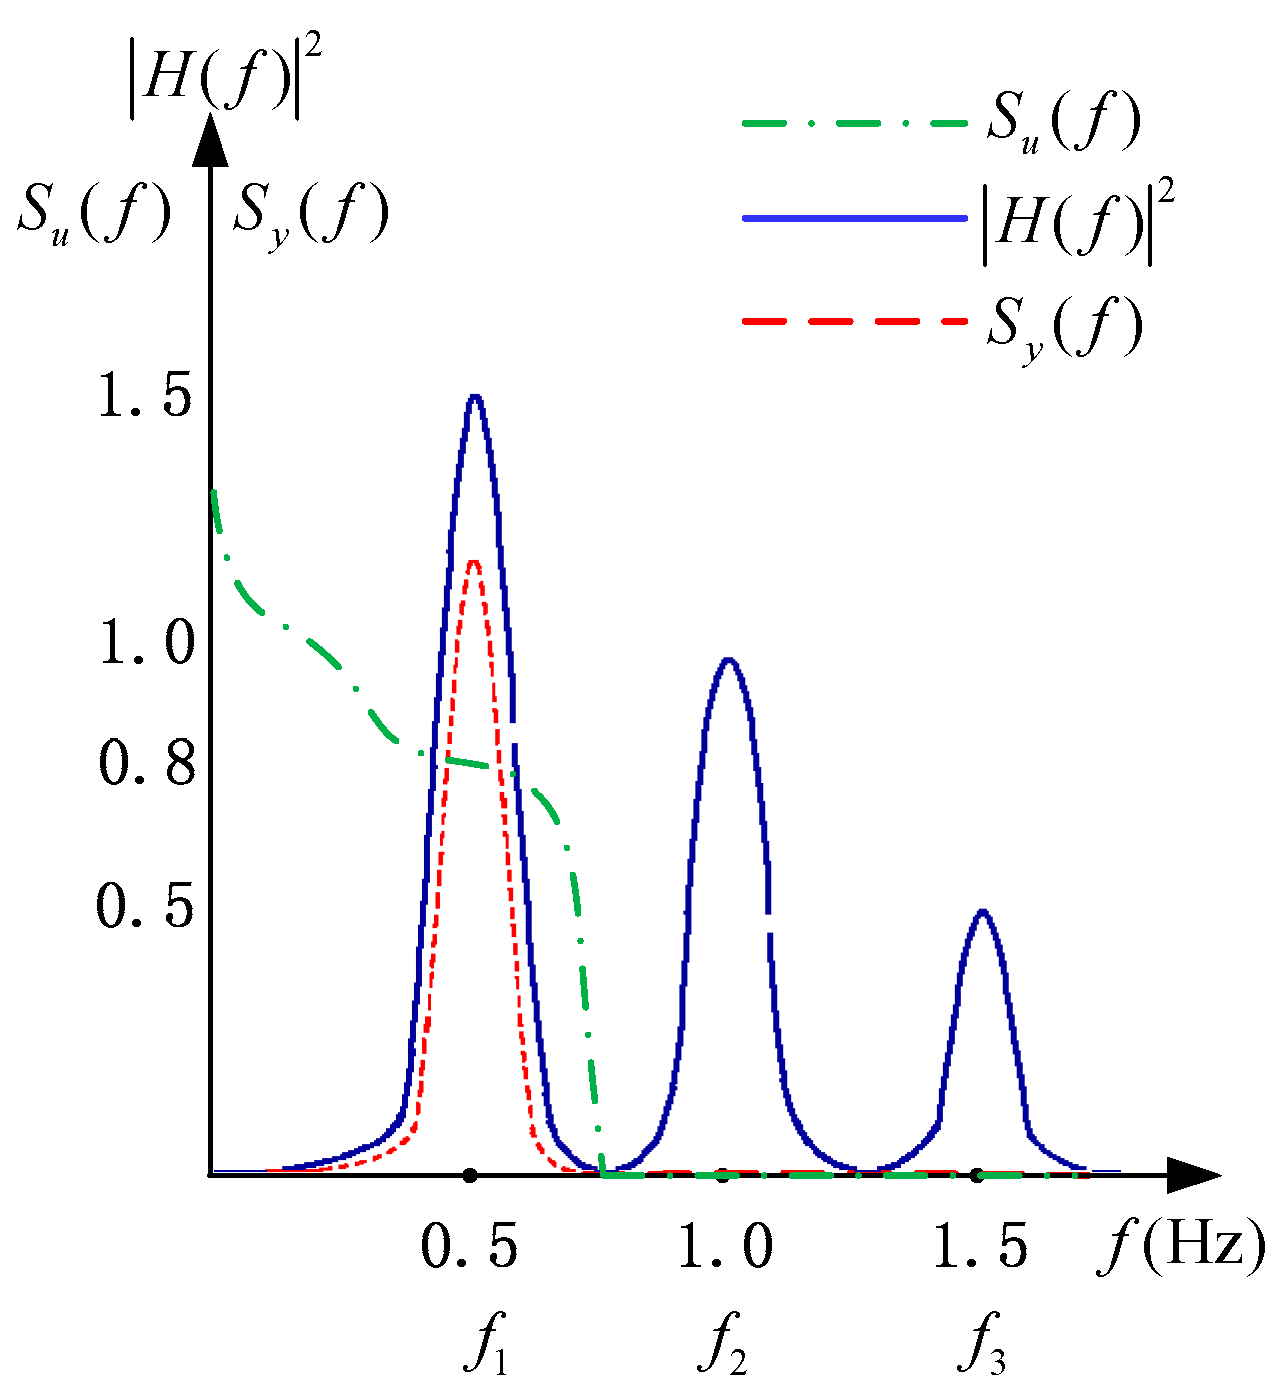
As an example, the power system has three weaker damping modes with the natural oscillation frequencies
,
and
. If the PSD of the input random excitation covers one mode frequency
, as shown by chain dotted lines in
Figure 4, the PSD of the output
as shown by dotted lines in
Figure 4 is very large at
, and small at
and
where the PSD of the input excitation is small. The forced oscillation with a frequency band around
is excited by the random excitation.
The GFO mechanism indicates that if the frequency bands of the input random excitations cover the inherent frequencies of some weaker damping modes in power systems, a forced oscillation with frequency bands around the covered mode frequencies is excited.
The dotted line in
Figure 4 illustrates the property of the system oscillation in frequency domain, where its shape is similar to the PSD of the observed inter-area oscillation in
Figure 3b. Based on the GFO mechanism, it can be speculated that if there exists some random excitation in the real power girds and its PSD covers the frequency of the inter-area oscillation mode, the observed oscillation is the GFO caused by this random excitation. Besides, the observed oscillation happened very frequently every day, which means that the excitation to the power grid has been long in existence every day.
4. Analysis of the Oscillations in the Real Power Grid
4.1. Dynamic Properties of the Measured Wind Power
To reproduce the observed oscillation on the UHV tie line, the appropriate random excitation should be identified first. As the most common type of renewable energy, wind power represents the largest proportion in the total renewable energy generation integrated into real power grids. The fluctuation of the wind power is currently regarded as a typical random excitation in real power grids.
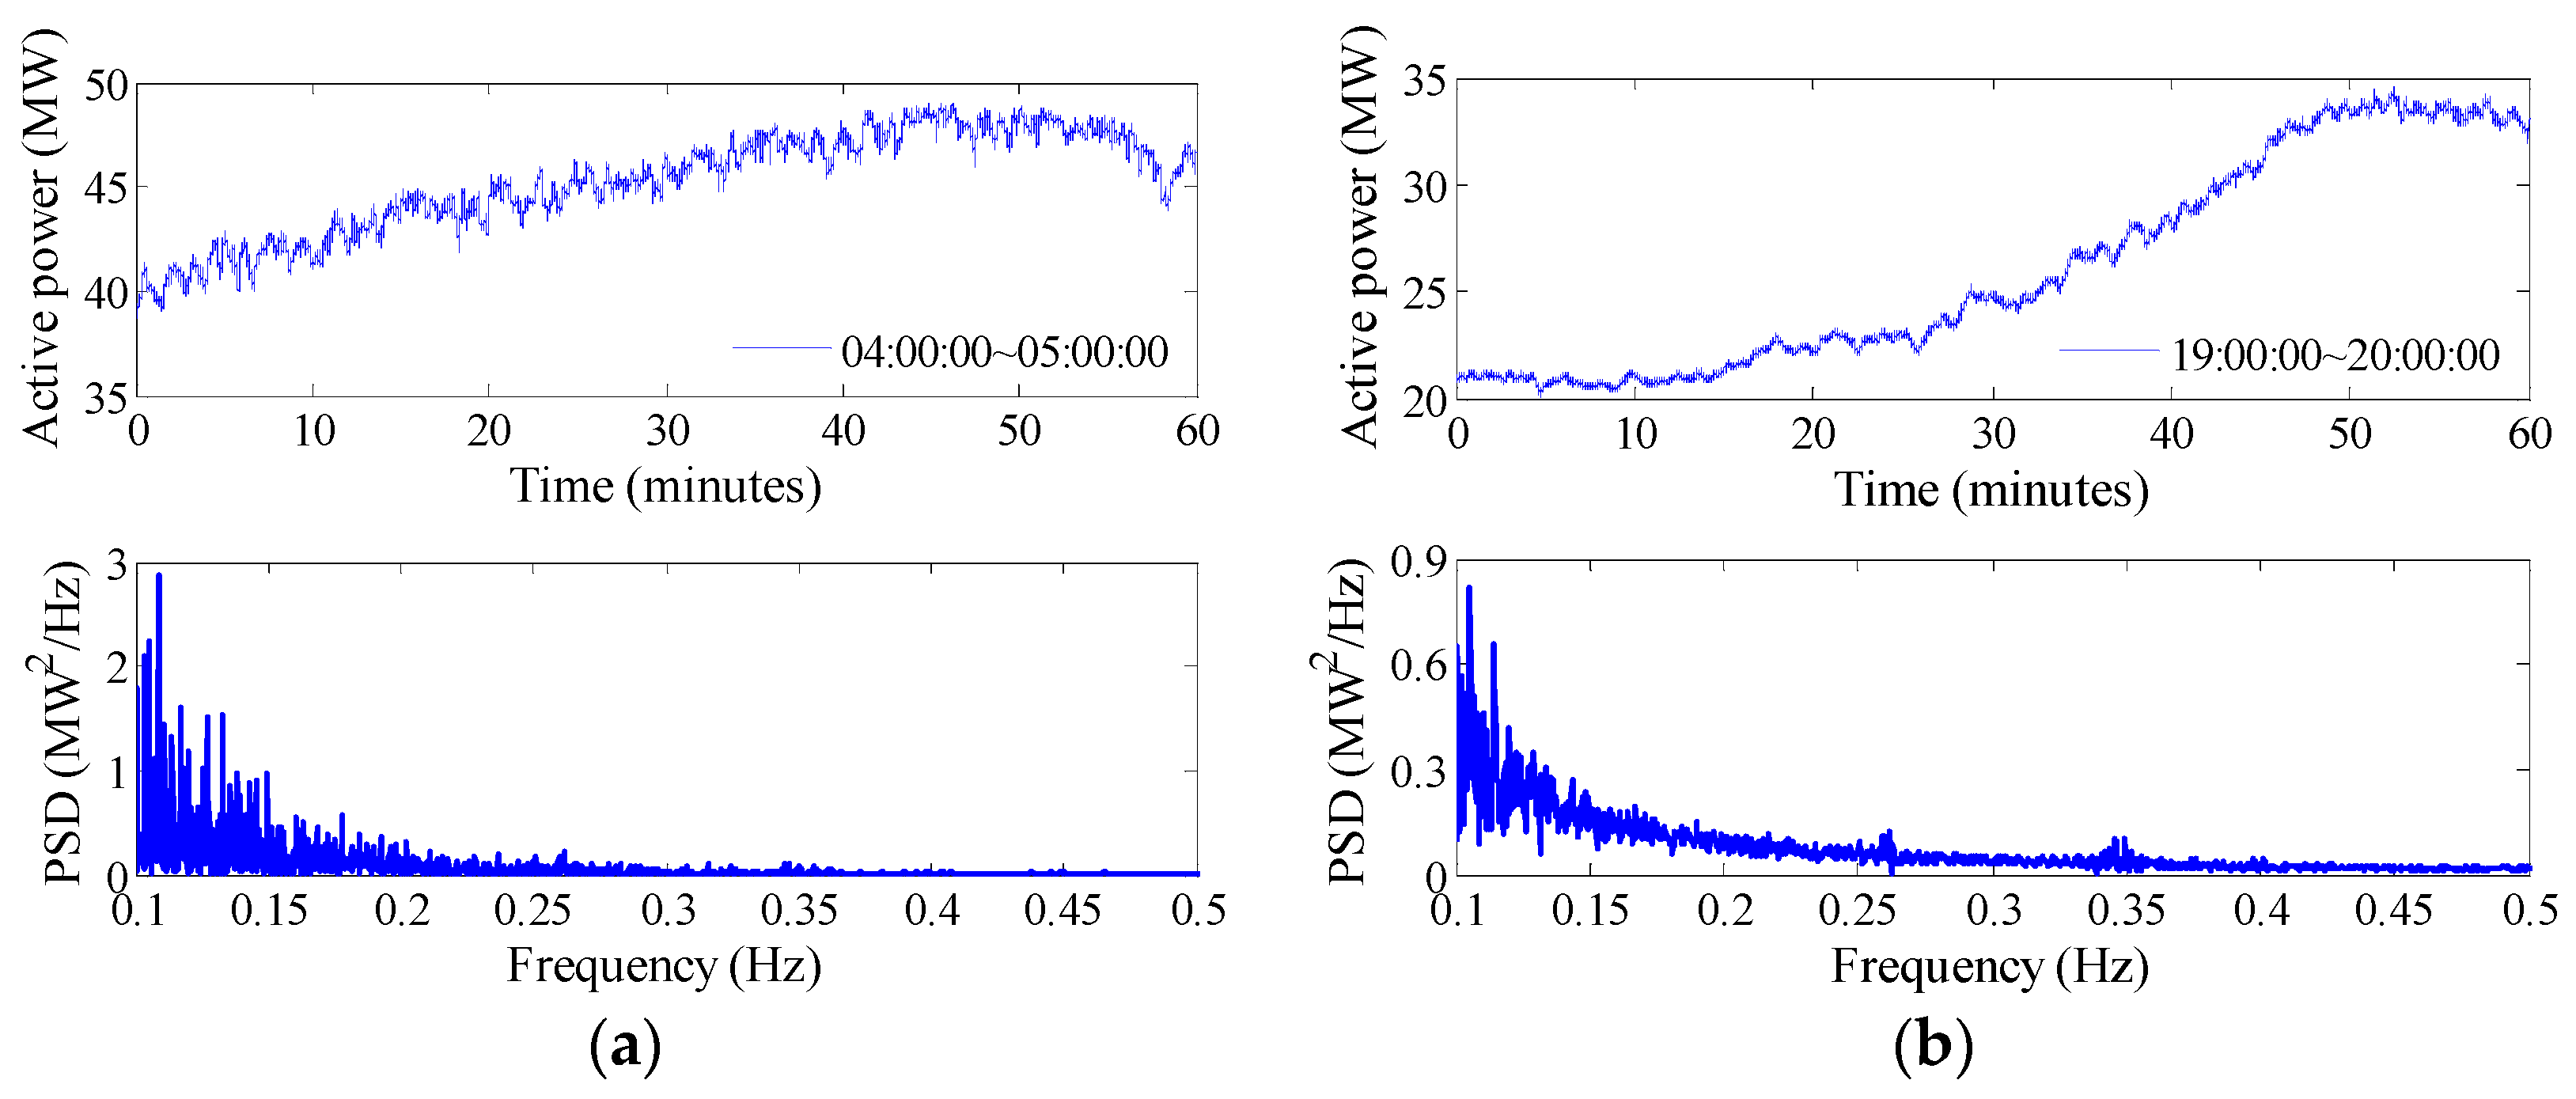
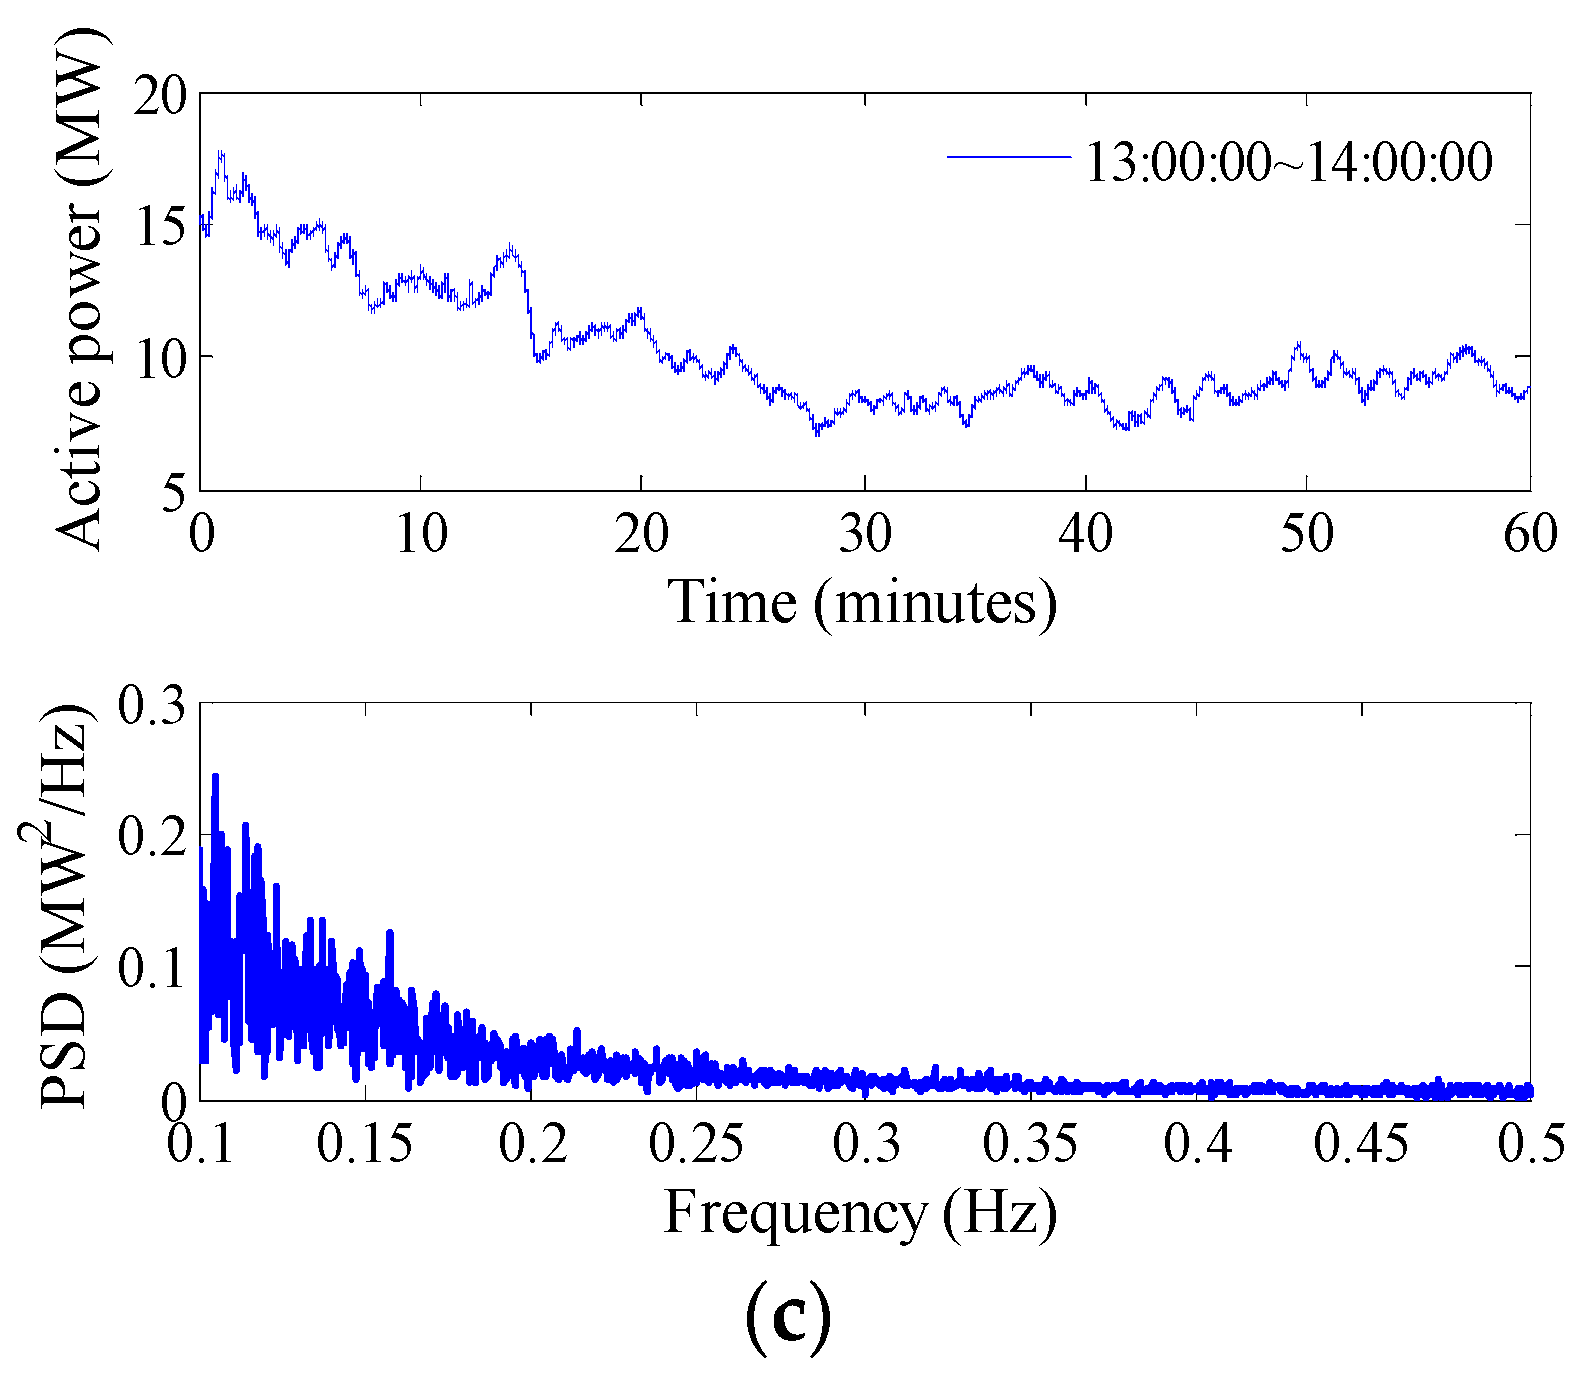
A wind farm is located near the UHV tie line and its installed capacity is 80 MW. The active power output data of this wind farm on 1 January 2015 are collected from WAMS. The high wind power usually appears in the morning and evening following the variation rule of wind speeds. The maximum output power during this day is about 55 MW, while the minimum output power is about 6 MW. The dynamics and the PSD of the output active power during the peak, trough and medium periods are shown in
Figure 5a–c, respectively. It can be seen that although the wind power shows different time-domain characteristics in different time periods, the properties in the frequency domain are similar. The power fluctuation energy decreases gradually with an increase in frequency. The majority of this energy distributes on a narrow frequency band that ranges from 0.1 to 0.3 Hz, and energy level are very low at other frequencies.
From the comparison of PSDs of wind power fluctuations in different periods during the day, the following properties can be found:
- (1)
The wind power fluctuation can be regarded as a narrow-band random excitation to the power grids, and its PSD covers the frequency of the inter-area oscillation mode, i.e., 0.176 Hz. Based on the GFO mechanism, the wind power fluctuation has a considerable probability to induce the forced oscillation of the power grids.
- (2)
The PSDs of the wind power fluctuation have similar shape in different time periods. It means that the excitation of the wind power to the power grids lasts for a long time every day. In this condition, if the power grids oscillate under the disturbance of the wind power fluctuations, the forced oscillation will be frequently observed by the oscillation monitoring module in WAMS.
- (3)
Although the PSD of the wind power fluctuation covers the oscillation mode frequency, it can be seen that the power fluctuation energy is small around the frequency of 0.176 Hz. The fluctuation generated by the wind power may not lead to a serious system oscillation, only the oscillation with small or medium-sized amplitude can be caused.
According to the features of the observed oscillations, i.e., medium-sized amplitude, frequent occurrence, strong randomness in time domain and sharp wave shape in frequency domain, it seems that the wind power fluctuations in this power grid may contribute to the observed oscillations.
4.2. Simulation Studies Using the Measured Data
Simulations were carried out to study the dynamic response of the real power grid under the measured wind power. The features of the measured oscillation in both time and frequency domains in
Figure 3 are regarded as a sample for comparison and contrast. This oscillation is measured from 22:45:00 to 22:45:40 on 1 January 2015. The measured system power flow at 22:45:00 is chosen as the original state of power grid operation. The measured fluctuation of wind power from 22:45:00 to 22:45:40 is taken as the random excitation, and its characteristics in both time and frequency domains are shown in
Figure 6. The maximum fluctuation of the wind power is close to 1.5 MW, and the energy mainly distributes on the frequency band of 0.1–0.3 Hz, which is the same as those displayed in
Figure 5. The PSD of the measured wind power covers the inter-area oscillation mode frequency 0.176 Hz.
It has to be mentioned that in such a large-scale power grid, there are tens of wind farms operating within the power grid, so this wind farm is just one of those which contribute to the oscillations on the UHV tie line. By the end of 2014, the installed capacity of wind turbines in NCPG and CCPG had already surpassed 30,000 MW, and the maximum output power was about 20,000 MW. However, it is difficult for the simulation software to integrate all these wind farms into the simulation system. To deal with this issue, two aggregated wind farms are connected to two buses, respectively, located near the UHV tie line. Their output active power is then enlarged to 380 times the measured wind power to represent the contributions of all wind farms in the power grid.
Simulations are carried out, and the dynamics of the active power on the UHV tie line and its PSD are shown in
Figure 7. From
Figure 7a, a forced oscillation is generated because the system natural oscillation frequency is covered by the frequency band of wind power fluctuation. The shape of the PSD of the simulated oscillation is sharp, and has the peak value at 0.175 Hz, as shown in
Figure 7b. These features coincide well with the GFO properties which have been illustrated by dotted lines in
Figure 4. Subsequently, the measured UHV tie line oscillation (shown in
Figure 3) is compared with the simulated dynamics. It can be seen that frequency-domain properties of the two oscillations are similar with each other, in terms of the shape of the PSD and the frequency where the PSD reaches the peak value.
It can be concluded from the simulations that oscillations observed on the UHV tie line could be regarded as GFO, which are induced by narrow-band excitations, such as wind power fluctuations. Meanwhile, the measured oscillations also provide a practical validation of the GFO mechanism. The GFO phenomenon is observed in real power grids and explained well using the GFO mechanism.
5. Conclusions
In this paper, the GFO mechanism has been applied to study the inter-area oscillations observed in a real power gird of China. The principle of the GFO indicated that if the frequency bands of the random excitation cover the natural oscillations frequencies of the power grid, a random oscillation with frequency bands around the covered frequencies would be excited. The inter-area oscillations observed in this real power grids have features like medium-sized amplitude, frequent occurrence, strong randomness in time domain and sharp wave shape in frequency domain. It has been proved that the observed inter-area oscillation is the GFO caused by the wind power fluctuations, where the PSD of the wind power covers the frequency of the inter-area oscillation mode. The properties of wind power such as its small intensity and the long-term excitation to the power grids also provide further evidence in support of this conclusion. The inter-area oscillations are well explained by the GFO mechanism and the GFO phenomenon has been observed for the first time in the real power grids of China.
Acknowledgments
This work was supported by the National Key Basic Research Program of China (973 Program) (2013CB228204) and the 2015 Ordinary University Graduate Student Scientific Research Innovation Project of Jiangsu Province (KYZZ15_0150).
Author Contributions
The authors contributed equally to the work.
Conflicts of Interest
The authors declare no conflict of interest.
References
- Hauer, J.F. Application of Prony analysis to the determination of modal content and equivalent models for measured power system response. IEEE Trans. Power Syst. 1991, 6, 1062–1068. [Google Scholar] [CrossRef]
- Rogers, G.J. Power System Oscillations; Kluwer Academic Publishers: Dordrecht, The Netherlands, 2000. [Google Scholar]
- Kundur, P.; Paserba, J.; Ajjarapu, V.; Andersson, G.; Bose, A.; Canizares, C.; Hatziargyriou, N.; Hill, D.; Stankovic, A.; Taylor, C.; et al. Definition and classification of power system stability IEEE/CIGRE joint task force on stability terms and definitions. IEEE Trans. Power Syst. 2004, 19, 1387–1401. [Google Scholar]
- Rueda, J.L.; Juarez, C.A.; Erlich, I. Wavelet-Based analysis of power system low-frequency electromechanical oscillations. IEEE Trans. Power Syst. 2011, 26, 1733–1743. [Google Scholar] [CrossRef]
- Chen, L.; Min, Y.; Chen, Y.P.; Hu, W. Evaluation of generator damping using oscillation energy dissipation and the connection with modal analysis. IEEE Trans. Power Syst. 2014, 29, 1393–1402. [Google Scholar] [CrossRef]
- Yu, Y.; Grijalva, S.; Thomas, J.J.; Xiong, L.; Ju, P.; Min, Y. Oscillation energy analysis of inter-area low-frequency oscillations in power systems. IEEE Trans. Power Syst. 2016, 31, 1195–1203. [Google Scholar] [CrossRef]
- Demello, F.P.; Concordia, C. Concepts of synchronous machine stability as affected by excitation control. IEEE Trans. Power Syst. 1969, 88, 316–329. [Google Scholar] [CrossRef]
- Kim, K.; Schattler, H.; Zaborszky, J.; Venkatasubramanian, V.; Hirsch, P. Methods for calculating oscillations in large scale power systems. IEEE Trans. Power Syst. 1997, 12, 1639–1648. [Google Scholar] [CrossRef]
- Magdy, M.A.; Coowar, F. Frequency domain analysis of power system forced oscillations. IEE Proc. Gener. Transm. Distrib. 1990, 137, 261–268. [Google Scholar] [CrossRef]
- Vournas, C.D.; Krassas, N.; Papadias, B.C. Analysis of forced oscillations in a multi-machine power system. In Proceedings of the IET International Conference on Control, Edinburgh, UK, 25–28 March 1991; pp. 443–448.
- Sarmadi, S.A.N.; Venkatasubramanian, V. Inter-area resonance in power systems from forced oscillations. IEEE Trans. Power Syst. 2016, 31, 378–386. [Google Scholar] [CrossRef]
- Rao, K.R.; Jenkins, L. Studies on power systems that are subjected to cyclic loads. IEEE Trans. Power Syst. 1988, 3, 31–37. [Google Scholar] [CrossRef]
- Rostamkolai, N.; Piwko, R.J.; Matusik, A.S. Evaluation of the impact of a large cyclic load on the LILCO power system using time simulation and frequency domain techniques. IEEE Trans. Power Syst. 1994, 9, 1411–1416. [Google Scholar] [CrossRef]
- Yu, Y.; Min, Y.; Chen, L.; Ju, P. The disturbance source identification of forced power oscillation caused by continuous cyclical load. In Proceedings of the International Conference on Electric Utility Deregulation and Restructuring and Power Technologies (DRPT), Weihai, China, 6–9 July 2011; pp. 308–313.
- Han, Z.X.; Zhu, Z.L.; Tian, X.S.; Li, F. Analysis and simulation research on power system low frequency oscillation. In Proceedings of the International Conference on Computer Modeling and Simulation (ICCMS), Sanya, China, 22–24 January 2010; pp. 223–228.
- Souza, O.H., Jr.; Barbieri, N.; Santos, A.H.M. Study of hydraulic transients in hydropower plants through simulation of nonlinear model of penstock and hydraulic turbine model. IEEE Trans. Power Syst. 1999, 14, 1269–1272. [Google Scholar] [CrossRef]
- Ma, J.; Zhang, P.; Fu, H.J.; Bo, B.; Dong, Z.Y. Application of phasor measurement unit on locating disturbance source for low-frequency oscillation. IEEE Trans. Smart Grid 2010, 1, 340–346. [Google Scholar] [CrossRef]
- Follum, J.; Pierre, J.W. Detection of periodic forced oscillations in power systems. IEEE Trans. Power Syst. 2016, 31, 2423–2433. [Google Scholar] [CrossRef]
- Liu, Y.L.; Yu, Y.X. Transient stability probability of a power system incorporating a wind farm. Sci. China Tech. Sci. 2016, 59, 973–979. [Google Scholar] [CrossRef]
- Liu, Y.F.; Ju, P.; Wu, F.; Yu, Y.P.; Zhang, J.Y. Computation comparisons of power system dynamics under random excitation. In Proceedings of the IEEE PowerCon, Chengdu, China, 20–22 October 2014; pp. 752–758.
- Battista, H.D.; Puleston, P.F.; Mantz, R.J.; Christiansen, C.F. Sliding mode control of wind energy systems with DOIG-power efficiency and torsional dynamics optimization. IEEE Trans. Power Syst. 2000, 15, 728–734. [Google Scholar] [CrossRef]
- Jafarian, M.; Ranjbar, A.M. Interaction of the dynamics of doubly fed wind generators with power system electromechanical oscillations. IET Renew. Power Gener. 2013, 7, 88–97. [Google Scholar] [CrossRef]
- Tan, J.; Hu, W.; Wang, X.; Chen, Z. Effect of tower shadow and wind shear in a wind farm on ac tie-line power oscillations of interconnected power systems. Energies 2013, 6, 6352–6372. [Google Scholar] [CrossRef]
- Su, C.; Hu, W.; Chen, Z.; Hu, Y. Mitigation of power system oscillation caused by wind power fluctuation. IET Renew. Power Gener. 2013, 7, 639–651. [Google Scholar] [CrossRef]
- Brownlees, S.; Flynn, D.; Fox, B.; Littler, T. The impact of wind farm power oscillations on the Irish power system. In Proceedings of the IEEE PowerTech, Lausanne, Switzerland, 1–5 July 2007; pp. 195–200.
- Liu, Y.; Ju, P.; Chen, J.; Zhang, Y.; Yu, Y. Contrastive analysis of general and special forced oscillations of power systems. CSEE J. Power Energy Syst. 2015, 1, 61–68. [Google Scholar] [CrossRef]
- Shim, K.S.; Kim, S.T.; Lee, J.H.; Choi, E.J.; Choi, J.H. Detection of low-frequency oscillation using synchrophasor in wide-area rolling blackouts. Int. J. Electr. Power Energy Syst. 2014, 63, 1015–1022. [Google Scholar] [CrossRef]
- Newland, D.E. An Introduction to Random Vibrations: Spectral & Wavelet Analysis, 3rd ed.; Longman Inc.: New York, NY, USA, 1993. [Google Scholar]
- Zhu, W.Q. Hamiltonian Theoretical Framework of Nonlinear Stochastic Dynamics and Control; Science Press: Beijing, China, 2003. [Google Scholar]
© 2016 by the authors; licensee MDPI, Basel, Switzerland. This article is an open access article distributed under the terms and conditions of the Creative Commons Attribution (CC-BY) license (http://creativecommons.org/licenses/by/4.0/).


