1. Introduction
Energy efficiency assessment is an evaluation process to promote the improvement of building energy performance starting from the information gathered during specific surveys or provided by owners and users about energy consumption required to maintain a specified indoor climate in terms of temperature and relative humidity [
1]. Improving energy efficiency is considered one of the main strategies nationally and internationally for reducing greenhouse gas (GHG) emissions with acceptable economic costs [
1]. Energy consumption in the building sector and the subsequent impacts mainly in terms of GHG and other pollutant emissions on the atmosphere are widely discussed [
2]. Moreover, the need to provide simple and clear methods to people and business operators about strategies and methods for improving energy efficiency is pointed out in many studies [
1]. In order to decrease building energy consumption, almost all governments have released for their countries specific regulations aimed at improving building energy efficiency. In Europe, many national rules come from the European Union (EU) Directive about 2020 targets, the so-called climate package, for reducing GHG emissions, that include the 20% of renewable energy sources (RES) in energy consumption and the 20% increase in energy efficiency (Directive 2009/29/EC) [
2]; moreover energy efficiency is one of the main pillars of smart cities [
3,
4]. At the local level, an important role is played by single municipalities that in Italy deal with the implementation of the Building Energy Regulation Codes (BERC) [
2]. These codes help to reduce the environmental impacts of new or refurbished buildings; their use directly affects the work of all the actors involved in this sector (mainly engineers, architects, local planners and building companies) [
5]. In particular, measures and data for assessing building energy efficiency should be determined by using environmental measurements and building simulation tools [
6]. The evaluation of a building global energy performance index (
EPgl expressed in kWh/m
2·year) is the first step to identify more effective strategies, interventions and criteria to improve its energy performance [
7].
EPgl is displayed in the Energy Performance Certificate (EPC) considering the rules contained in the norms UNI TS 11300 and it is the sum of the
EPH, energy performance index in the heating seasons, and EP
W Energy performance index for domestic hot water production [
8]. Indeed, EPC in Italy integrate the energy consumption assessment [
9] with information about the environmental impact derived both from the buildings themselves and the type of materials contained in the buildings. This approach foresees the use of a Life Cycle Assessment (LCA) method for assessing the environmental impact of materials and plants over their life cycles [
10].
Considering energy efficiency economic costs, as stated by the European Parliament in 2010, with the Energy Performance of Buildings Directive (EPBD), assessing economic costs of interventions is essential for the choice of optimal solutions to decrease building energy consumption [
11]. Cost-benefit analysis is used in many fields as a methodology for comparing economic sustainability of possible strategies and interventions that could be adopted, in order to highlight the best feasible alternative [
12]. Additionally, cost-benefit analysis is not to be confused with the life cycle cost (LCC), identified as the sum of the total costs of design, construction, installation, operation, management and disposal; conversely cost-benefit analysis is typically used as a decision making tool for the comparison of different solutions for improving energy performance based on cost of investment [
13].
Based on the above considerations, this paper investigates the cost-benefit analysis of energy efficiency retrofitting interventions on public buildings, highlighting more effective interventions according to building characteristics and features, by the estimation and comparison of the economic cost and the energy efficiency improvement for each considered retrofitting intervention.
Energy-demand retrofitting is considered as an effective way to accelerate the low-energy transformation of building stock in accordance with adopted EU Directives. Indeed, existing Buildings cover about 75%–85% of the building stock today and in the next fifty years [
14].
In accordance with Wang and Holmberg [
15], very little methodology is currently being implemented out to efficiently select and evaluate the retrofitting techniques. In any case, Paiho et al. [
16] designed for Russian residential buildings some cost analysis-based retrofitting strategies to implement building installation system renovations, while Sahin et al. [
17] showed how the energy retrofits in historical buildings should be managed in a transdisciplinary approach.
Within the energy efficiency retrofitting of existing buildings Camprubí et al. [
18] highlighted three main types of interventions: passive structures (insulating the passive components of the building), active elements (upgrading heating systems) and management/information skills (to improve energy habits of residents).
Different typologies of interventions for improving energy efficiency in new and existing buildings have been considered by the authors in different previous studies, which considered both renewable energy systems [
19,
20,
21] and the planning of strategies for the minimization of energy consumption [
22,
23,
24,
25]. Cost-benefit analysis allows public administrations to highlight which retrofitting intervention could be most financially feasible for each considered public building, subject to available budgets.
2. Materials and Methods
In order to analyze cost and benefits of all the main intervention typologies, four public buildings have been selected as case studies. The four building typologies include different territorial contexts and ages of construction. The considered territorial contexts take account of suburban areas, urban zones and old towns while the building age of construction varies from 16th century to the present day. The application of the methods in these different contexts allows for the consideration of most Italian building stock circumstances.
Many feasible interventions have been considered for each building, analyzing their economic costs and benefits in terms of energy efficiency improvement, and trying to obtain general indications that could be useful for comparing different interventions on other buildings that need an energy requalification. Indeed, for buildings under landscaping or historical constraints not all the energy efficiency interventions or thermal systems could be installed [
26].
All four of the analyzed buildings have been selected from the same geographical area within the same climate zone in order to remove
EPgl variability caused by climate parameters [
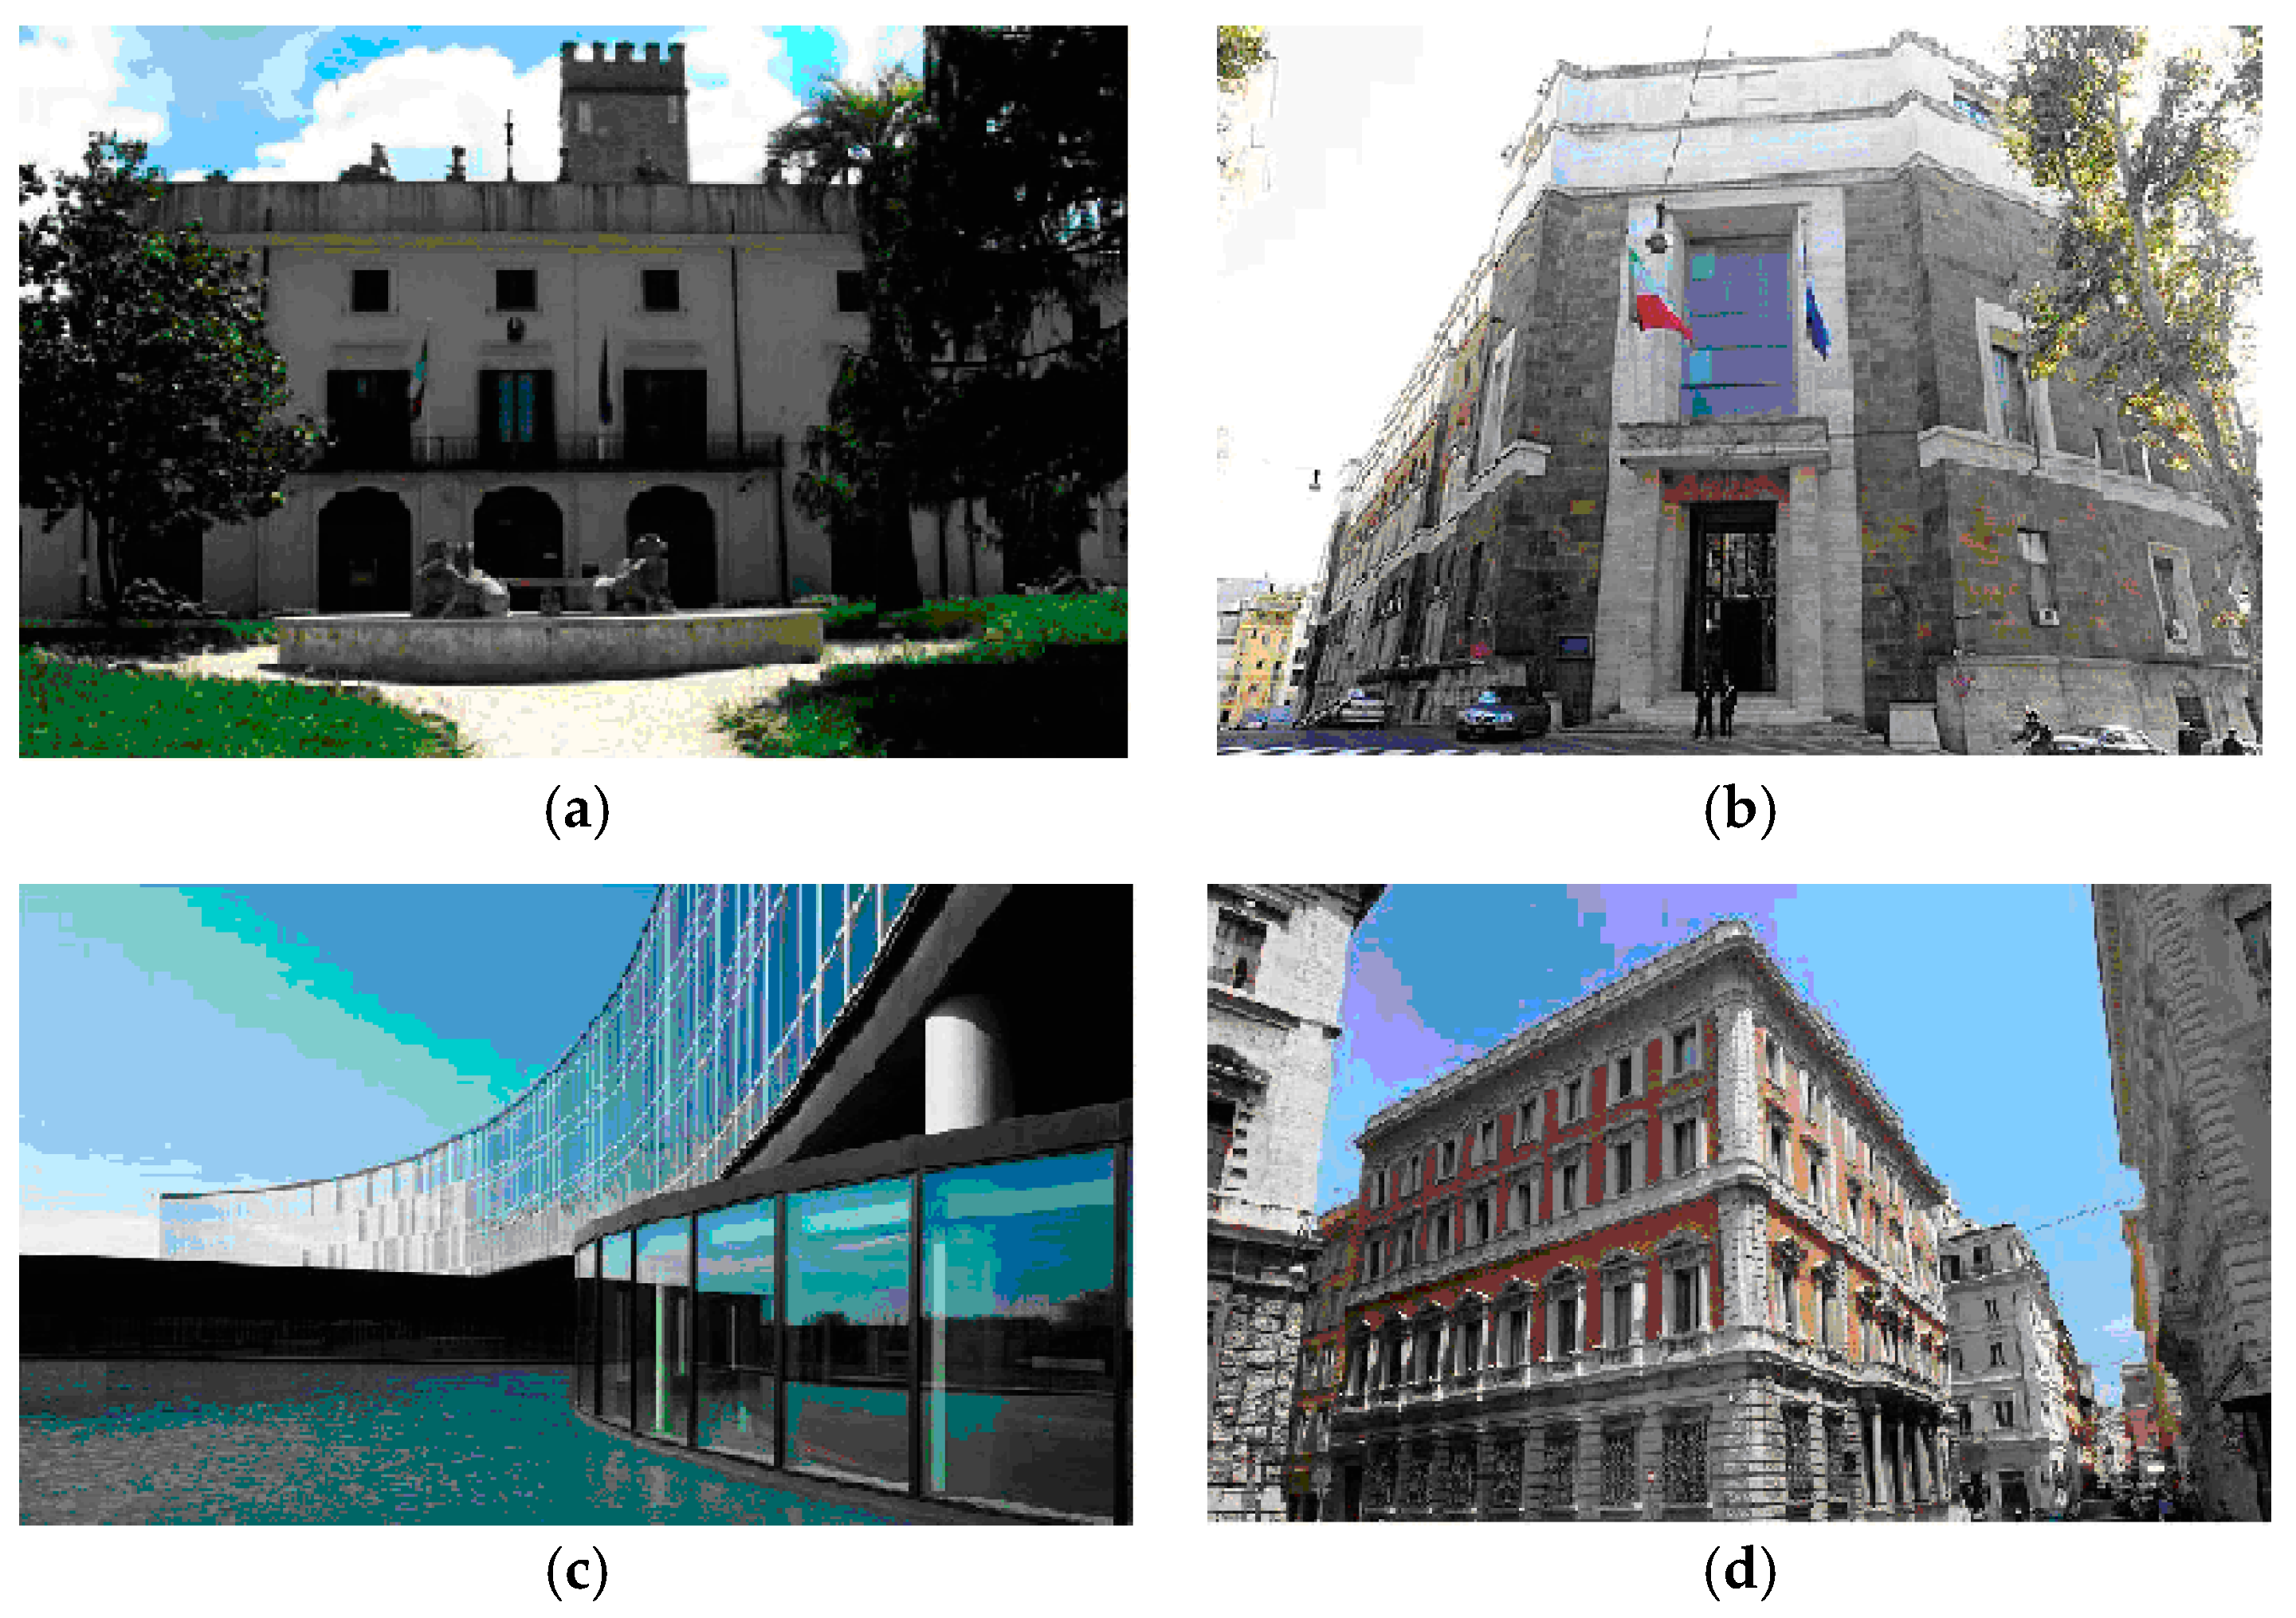
27]. The buildings analyzed are Villa Sciarra, a historic 16th century building located in a suburban area and subjected to external constraints by the local Superintendence; the Italian Ministry of Economic Development (MiSE), a historic 20th century building located in the centre of an urban area; the Italian Space Agency (ASI), a modern building of recent construction; and the Ex Banco Napoli Building, a historic 17th century building located in the historic centre of an urban area and then subjected to local constraints (
Figure 1). Villa Sciarra is one of the historic villas of Rome realized in 1549 and it is the Italian site of the Germanic Studies Institute. It is located on the slopes of the Janiculum hill between the neighborhoods of Trastevere and Monteverde. The building is currently dedicated to archives, offices and libraries. The second building, MiSE, is an administrative apparatus of the Italian government dealing with production activities, international trade, communication and energy. The building was created between 1928 and 1932, and is under architectural constraints. The ASI building was recently built (2012), its envelope is mainly composed of glass and includes some water pools under the building, which provide both an aesthetic and functional role. The Ex Banco Napoli building is the administrative offices from the Chamber of Deputies and was realized in 1600; it is located on the historic center of Rome and subjected to planning and architectural restrictions. Local constraints and territorial contexts of each building were analyzed using geographic information system (GIS) software that allows one to superimpose satellite images with different information layers [
28,
29,
30,
31]. The literature also shows that the comparison between buildings is a useful method to improve their level of energy efficiency, highlighting energy consumptions and possible interventions in different context [
13].
For each pilot building feasible interventions for improving energy efficiency have been considered. The selected interventions include scenarios that are applicable to the urban context in which the buildings are located and which can be integrated with the existing building. Then, energy efficiency improvement and economic costs have been assessed for each intervention, in order to estimate the options with the best cost-benefit ratio. The energy efficiency improvement for each proposed intervention has been simulated through a double analysis of the building
EPgl, before and after the intervention, in order to quantify the changes [
27]. All existing public buildings are compulsorily required to provide an energy certificate to States Members by the EPBD [
13].
EPgl values have been assessed using STIMA 10, a software able to calculate
EPH,
EPW and the final
EPgl starting from climate/geographical parameters and technical data describing the investigated buildings [
32].
Moreover, a cost-benefit analysis was carried out based on the average cost, which was established by obtaining quotes from five suitable companies, for each proposed intervention. A cost-benefit analysis converts the performance achieved by the building in monetary figures and is more useful than a simple economic framework [
33].
2.1. Actual Situation of Plant-System Building
Villa Sciarra is a two storey masonry load bearing building, with a basement and a flat roof; the building is equipped with a traditional heating system plant with radiators. MiSE is also a load bearing masonry building and has eight floors where most of the spaces are offices. The building includes a photovoltaic (PV) system and fixtures with insulated glass. The ASI building is located within the university campus of Tor Vergata, was built with mixed masonry and does not have any renewable energy system. Ex Banco Napoli is a load bearing masonry structure and has five floors of offices and a basement designed for technical rooms.
3D building models have been established by inserting the survey data in STIMA 10 software including the characteristics of the horizontal and vertical facades and pinpointing opaque and transparent surfaces in order to define the degree of insulation provided by each component of each building envelope. To complete the base virtual models, current building operating system features were added, so as to simulate the conditions ante operam and post operam of each proposed intervention.
Table 1 lists the main data about the actual situation of the four analyzed buildings that influence their energy performances.
The assessed current energy performance data are reported in
Figure 2 and has been calculated by inserting the data gathered during specific surveys on STIMA 10 Software (Idronica Line—Watts Industries Italia S.r.l., Biassono, Italy).
2.2. Proposed Interventions: Villa Sciarra
Since Villa Sciarra is located within one of the public gardens of Rome, the chosen interventions were guided by the constraints imposed by the Superintendent that denied the possibility to intervene outside the building. The first identified intervention is the ceiling indoor insulation as detailed in
Figure 3, that entails a ceiling trasmittance (
U) decrease from 0.416 W/m
2·K to 0.229 W/m
2·K (
Table 2,
Table 3 and
Table 4). Moreover, the replacement of single glazed windows with insulated glass unit, as shown in
Table 5, has been considered as second feasible intervention, estimating a
U decrease from 5.1 W/m
2·K to 2.842 W/m
2·K. Vapor permeability of each considered layer has been calculated for relative humidity ranges up to 50%.
For improving a building
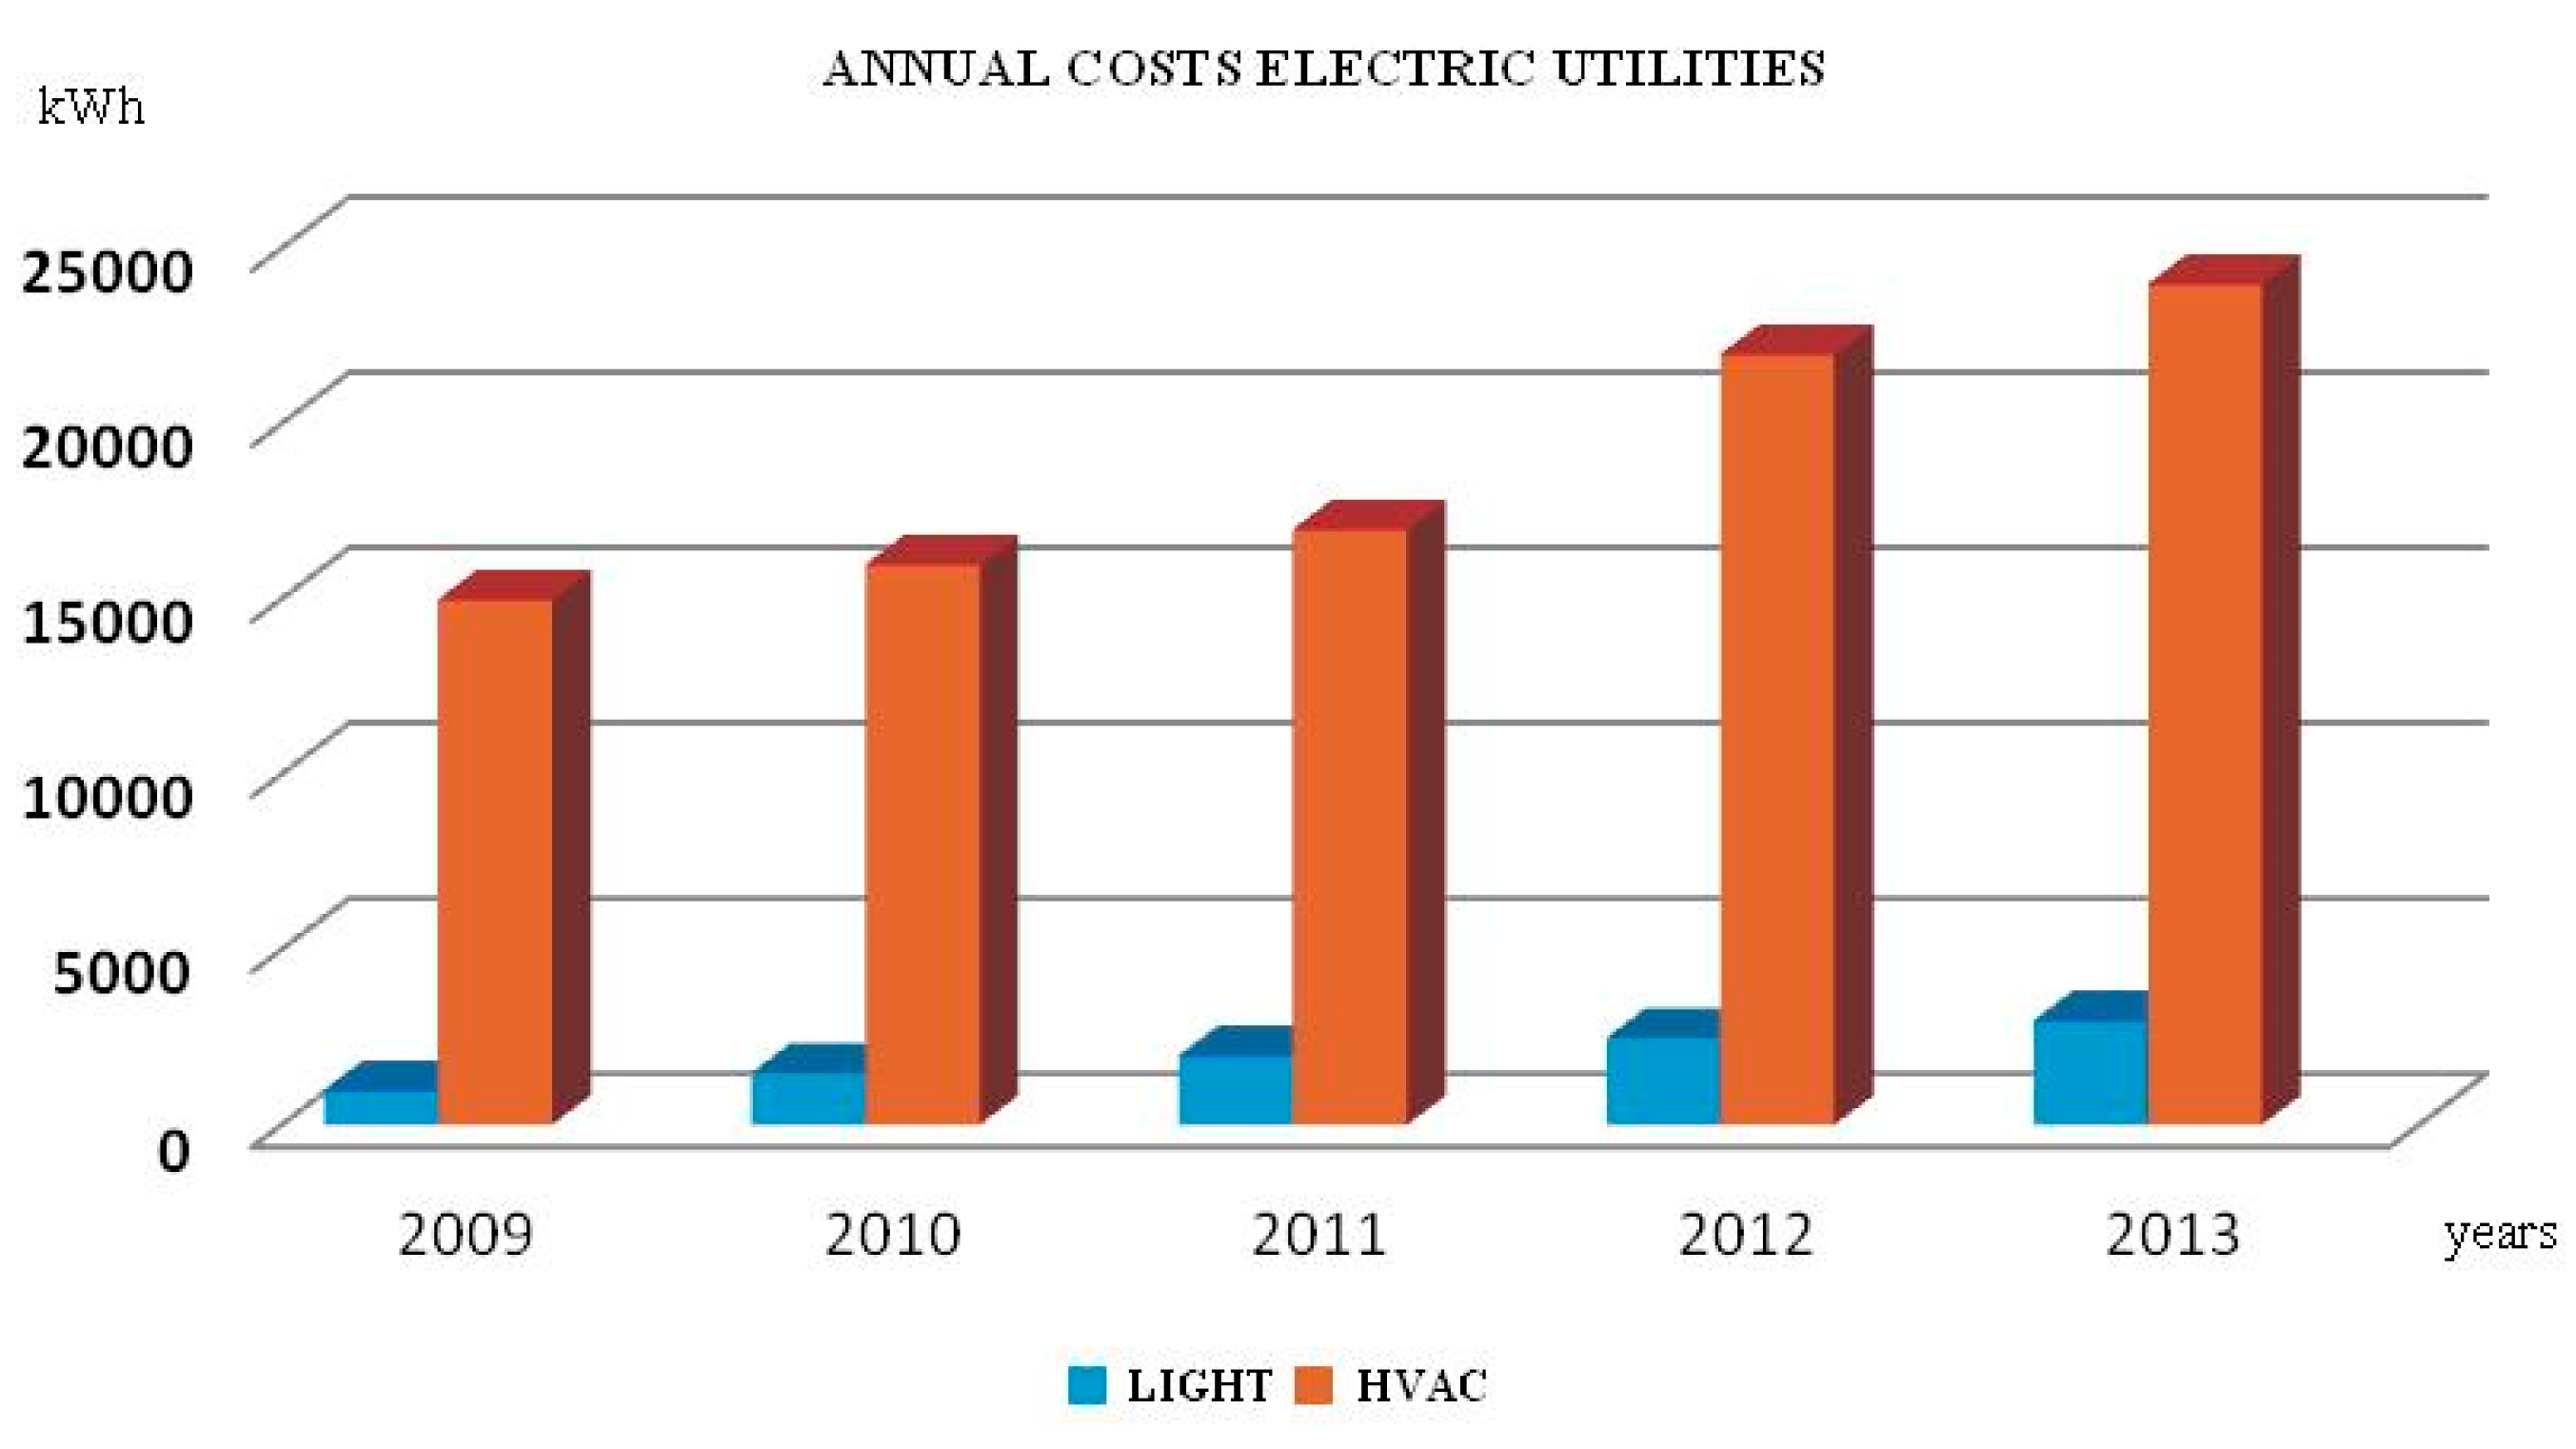
EPgl value and consequentially its energy efficiency, it is necessary to evaluate the energy used for winter heating and summer cooling and its related management system costs. The existing heating and cooling plant of Villa Sciarra uses fan coils to distribute thermal energy from a water based system. The reverse-cycle air/water based air-conditioning system which heats fluid in winter and cools fluid in summer, is powered by electricity from the grid. To evaluate the exact consumption of this heating, ventilating and air conditioning (HVAC) system, an analysis of the building electricity consumption was completed using data provided from four consecutive years (from 2009 to 2012). From this analysis, the energy consumption was quantified, which is shown in
Table 6.
An analysis of electricity consumption for lighting and HVAC was defined by reference costs reported in the data provided by the building owners. The results highlight a consumption for HVAC system of about 20–25 MWh/year (
Figure 4).
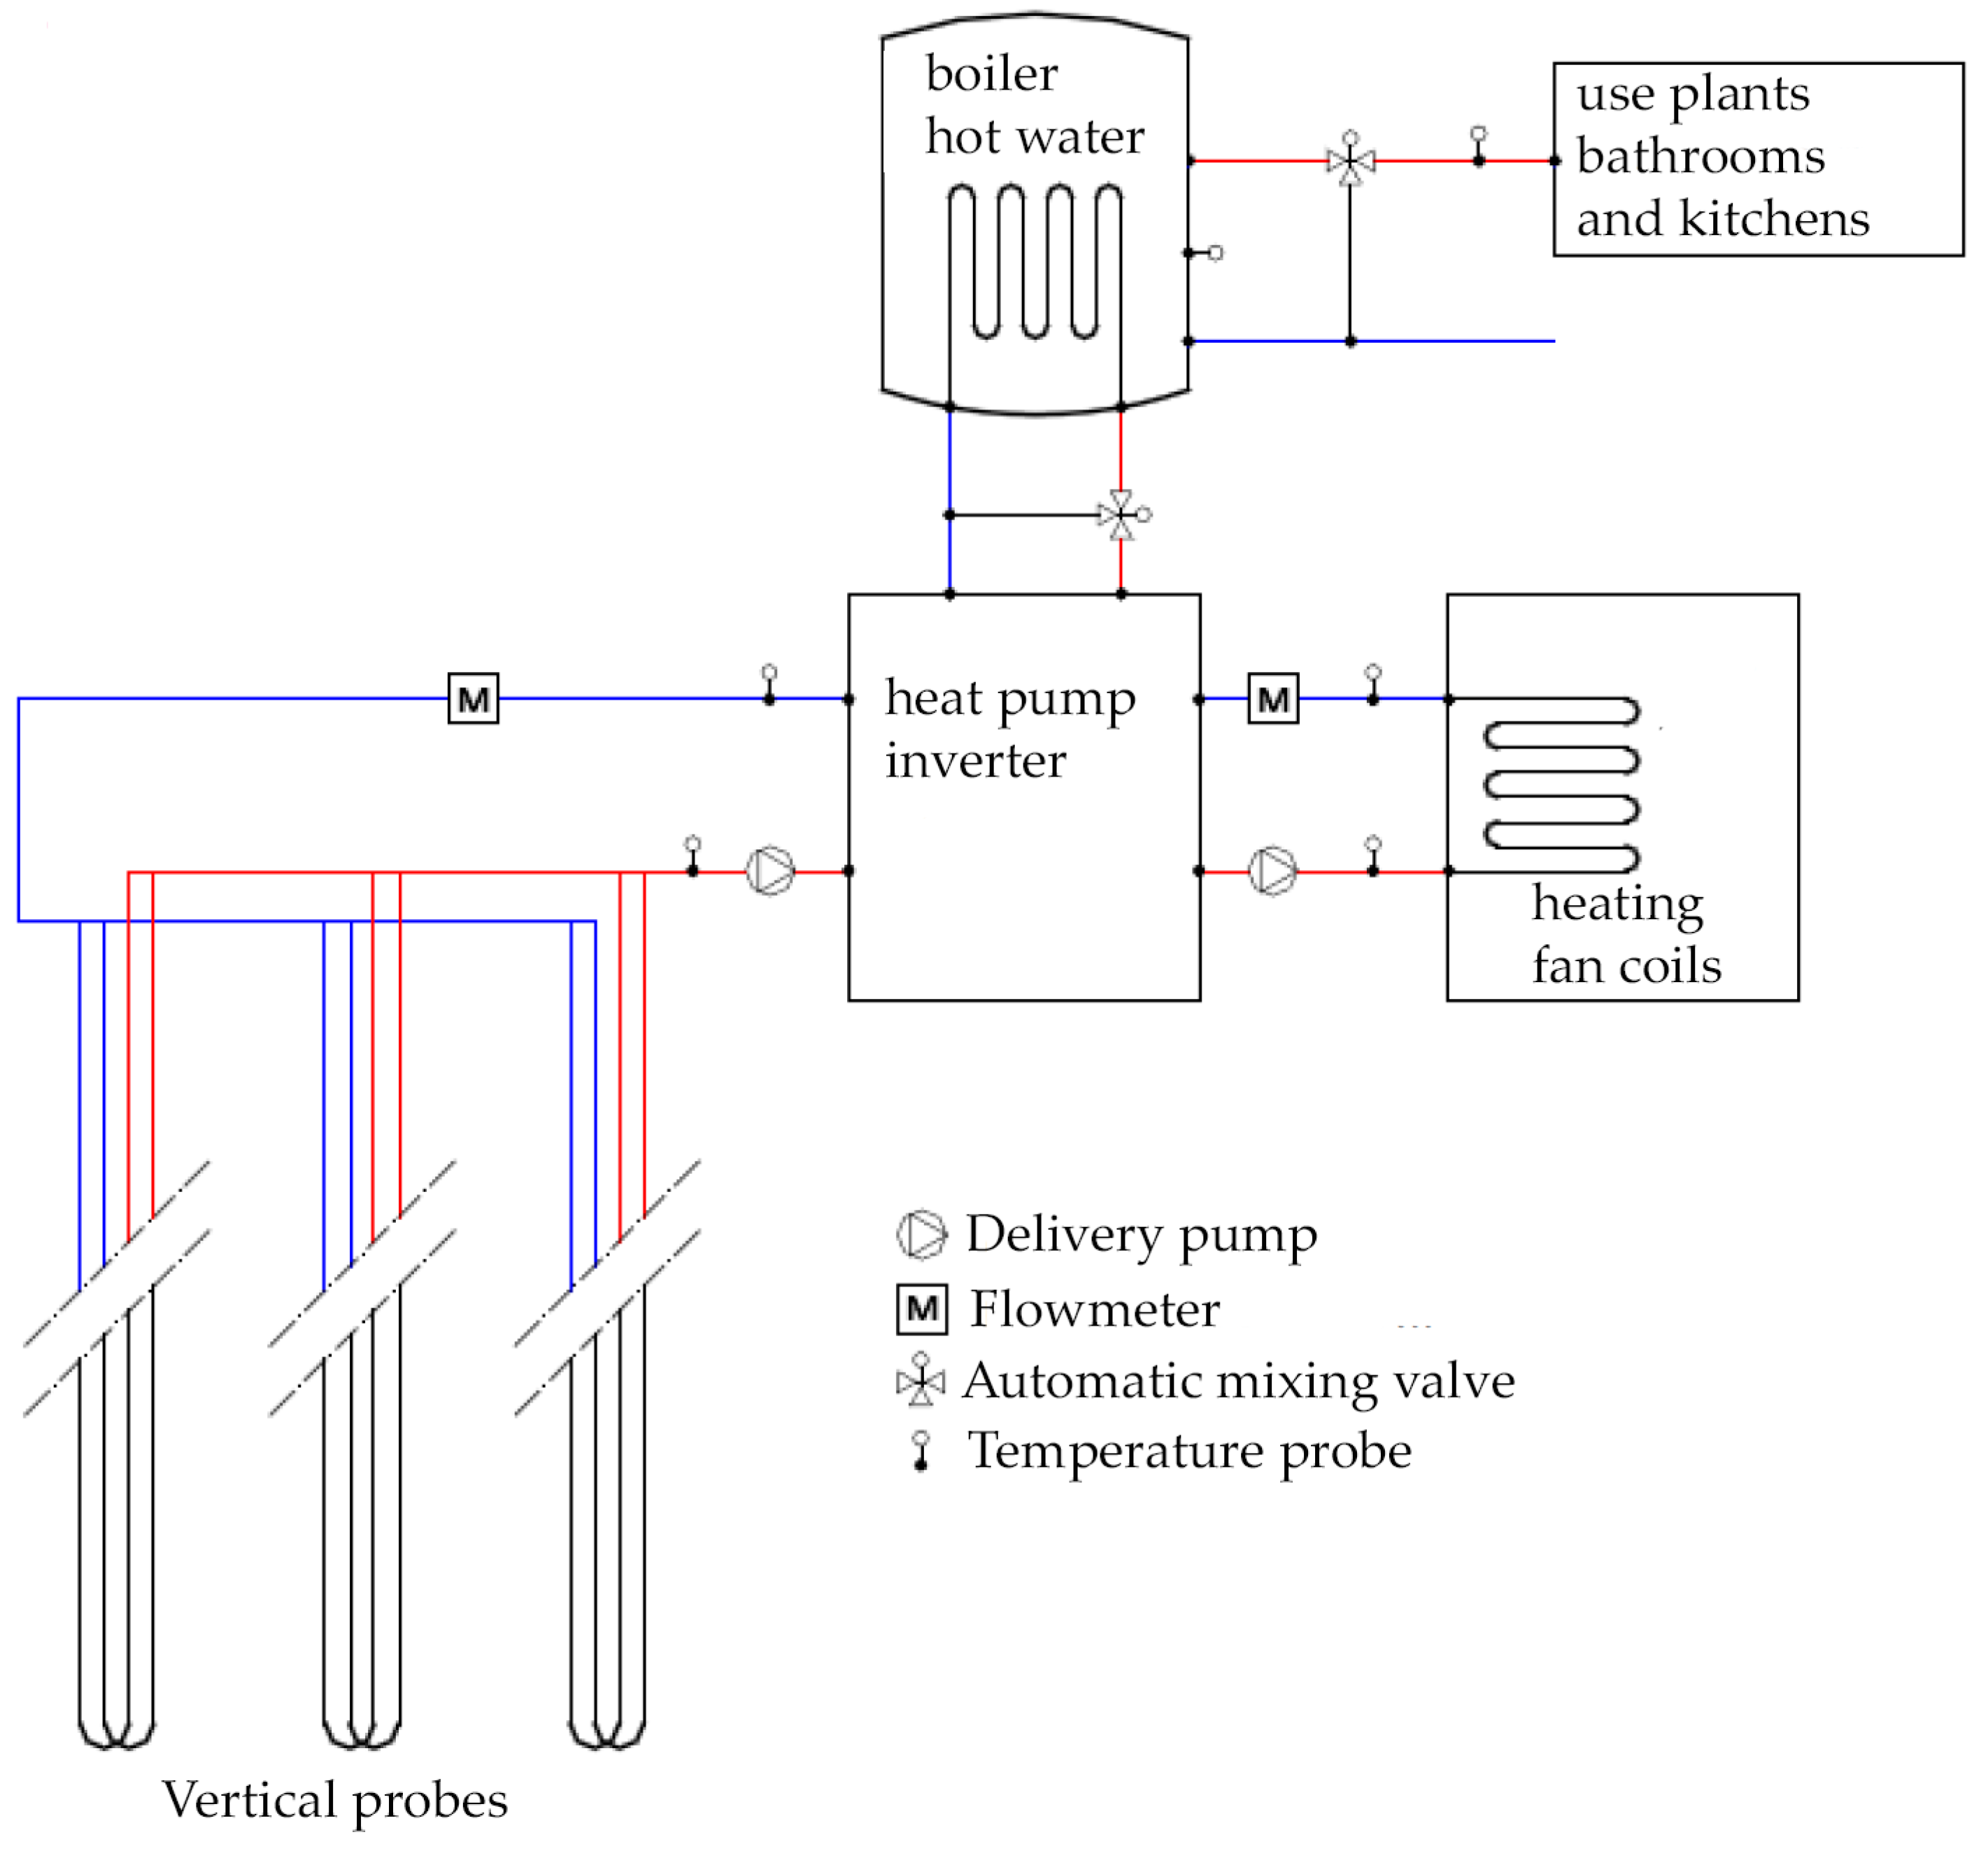
Consequentially, to optimize energy efficiency of the existing HVAC system, interventions which explored adaptation and replacement were evaluated. Considering that the territorial context of Villa Sciarra is a public garden, the proposal is to install a vertical ground loop geothermal system, with a heat pump inverter, to provide a more energy efficient air-conditioning system (
Figure 5). Indeed, vertical probes are not invasive and do not involve external works that could compromise the building and the surrounding park. Additionally, this system does not require a substitution of the existing heating and cooling energy distribution systems.
The adoption of a system with vertical geothermal probes could be chosen in public or private garden contexts since it involves vertical boreholes that will not harm the surrounding park; moreover, vertical boreholes will ensure the reduction of the building energy consumption due to its higher energy efficiency according with the results obtained by the EPgl assessments before and after its installation.
2.3. Proposed Interventions: Italian Ministry of Economic Development
The building is currently equipped with a PV system, installed in 2010, which produces about 48 MWh/year. Moreover, in 2009 single glazed windows on the sixth, seventh and eighth floors were replaced with low emission double-glazed units.
An analysis of the historical constraints of the urban area where the building is located pinpoints two feasible interventions to achieve the limit of
EPgl values established by law: the introduction of thermostatic valves and the replacement of single pane windows with low emissivity (low-e) glazing with aluminium frames in the floors not included in the 2009 interventions. The first intervention consists of the installation of thermostatic valves in the fan coils of each zone as devices for heating control giving the possibility to regulate the temperature of each room according with its real use. The use of thermostatic valves brings an average energy saving from 10% to 50% [
34] and allows a reduction of hot water use.
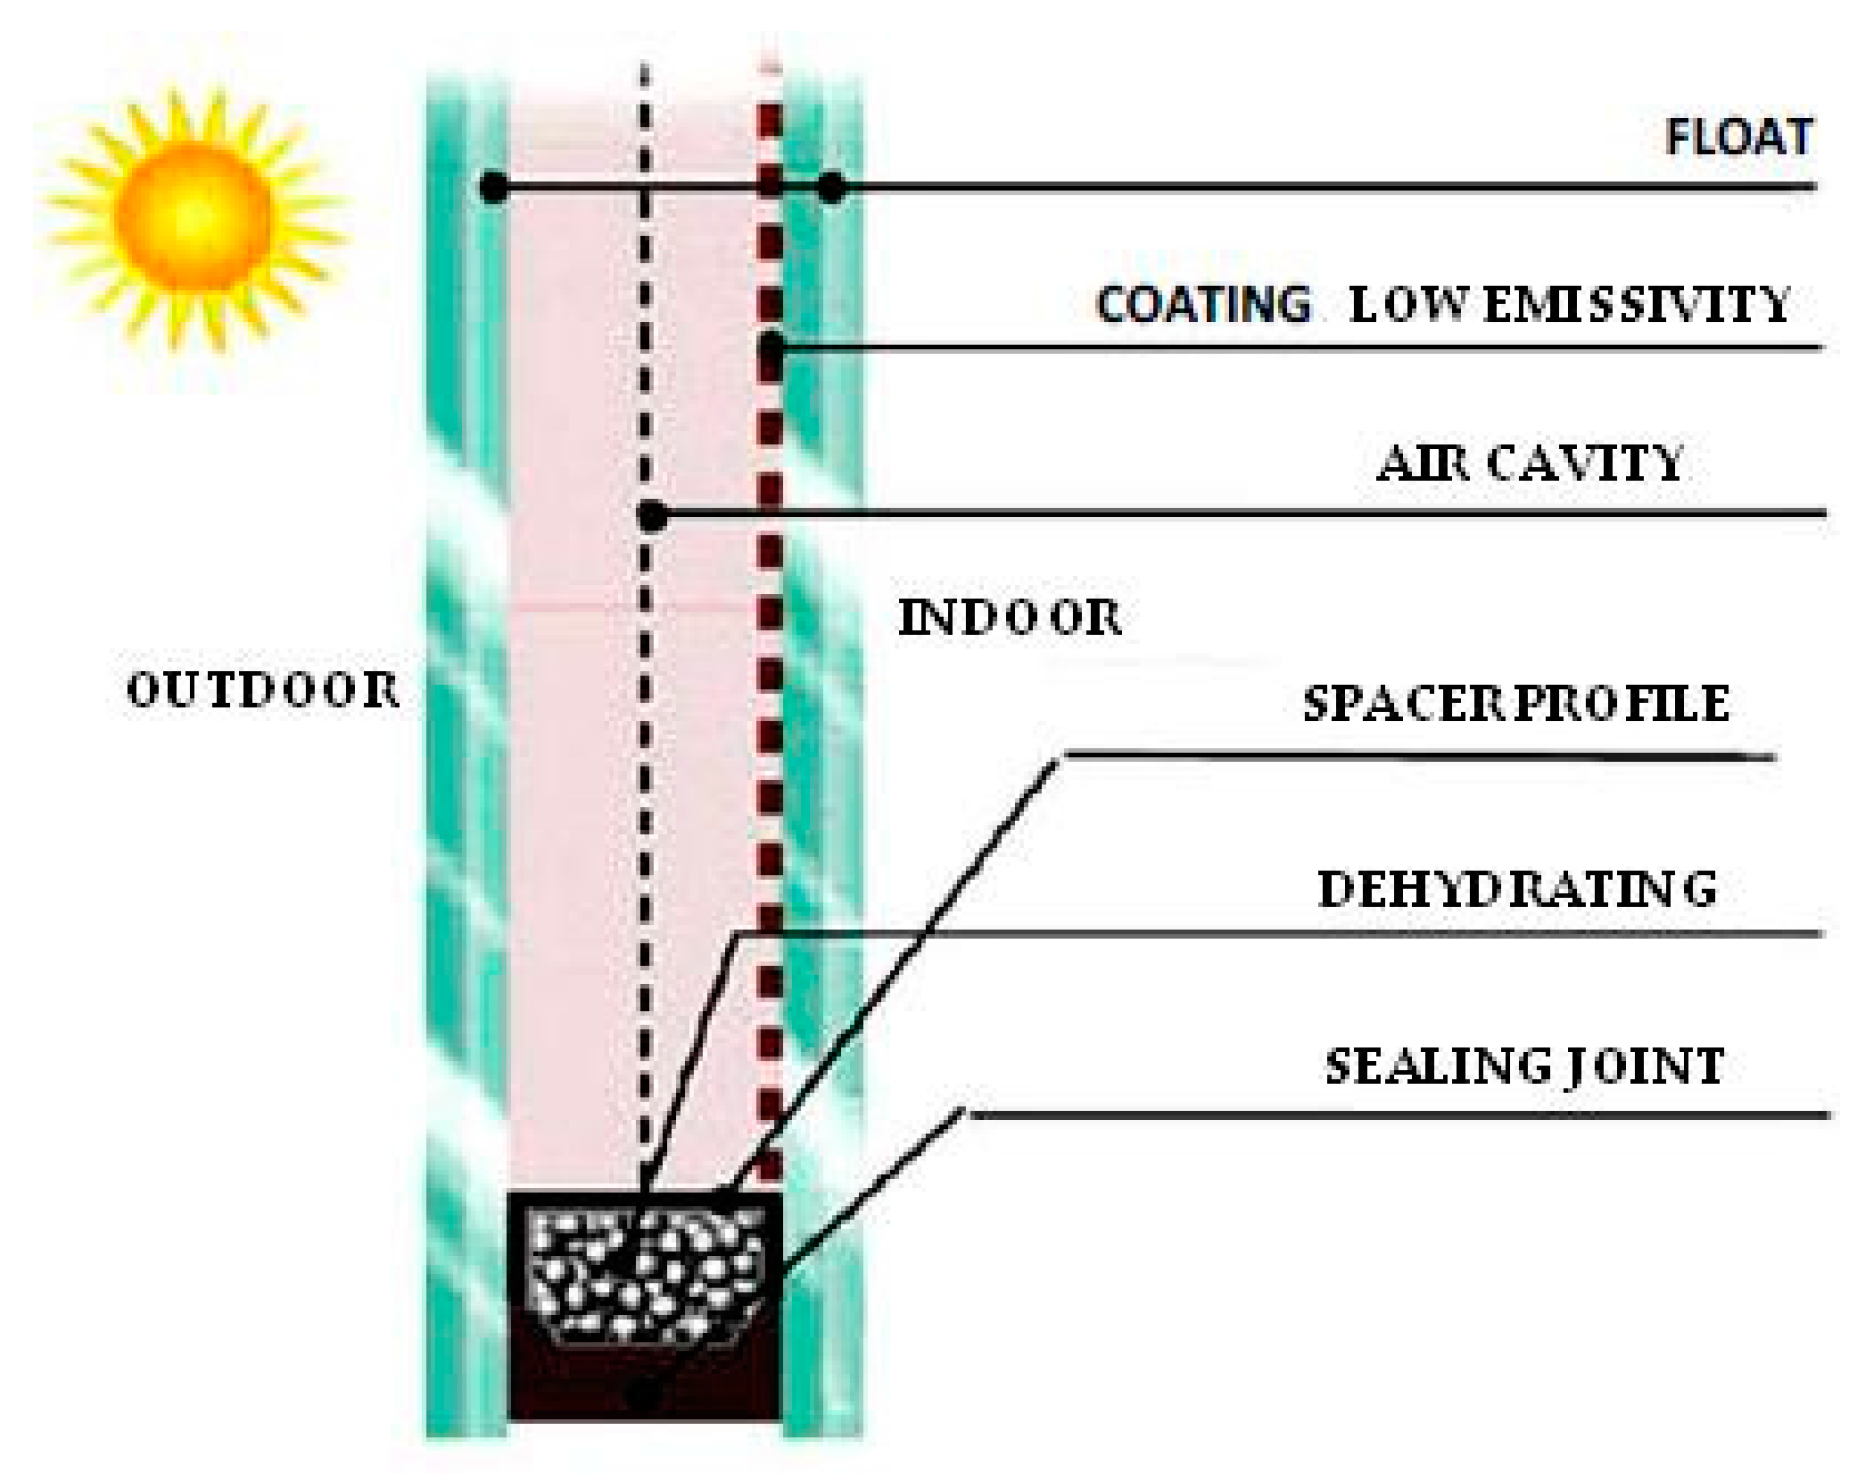
Considering the second intervention, low-e glazing significantly reduces heat loss but does not significantly reduce visible light transmittance, promoting the use of natural daylight within the building. Their inclusion (
Table 7 and
Table 8 and
Figure 6) allows an improvement of the environmental comfort and sustainability because it reduces the risk of condensation on the internal pane, as well as the heat transmission from outdoor to indoor during summer months. In addition, this intervention brings light and solar heat in the winter, improving energy efficiency in the existing building considered as one of the main challenges for obtaining GHG emissions reduction [
35].
The chosen low-e glass typology meets the requirement imposed by Italian normative for existing buildings, requiring that U values for glazing should not be higher than 2 W/m2·K in climatic zone D.
2.4. Proposed Interventions: Italian Space Agency
The energy used for ASI building winter heating and summer cooling and its related economic costs have been assessed for improving energy efficiency of the building.
The installed heating system includes a burner powered by methane and three pressurized boilers with a thermal output of 1200 kW/t each. The generators have been dimensioned on the basis of thermal needs of the users providing a minimum reserve of about the 25% of the maximum demand. The boilers supply the domestic hot water system, heat exchangers of retrieval system, heating and air conditioning systems. An analysis of electricity consumption data provided by the building owners was completed to evaluate the exact consumption of the HVAC system. The obtained results, reported in
Table 9, pinpointed an average monthly consumption of 158.08 MWh and an average monthly cost of €44,385.
Starting from these findings, the identification of the intervention was based on the integration of RES in order to significantly reduce the annual electric bill, which was approximately €40,000/month. In particular, two feasible interventions have been considered: the installation of a 210 kW PV system and a trigeneration plant aimed at ensuring simultaneously electric and thermal energy for heating in winter and cooling during the summer.
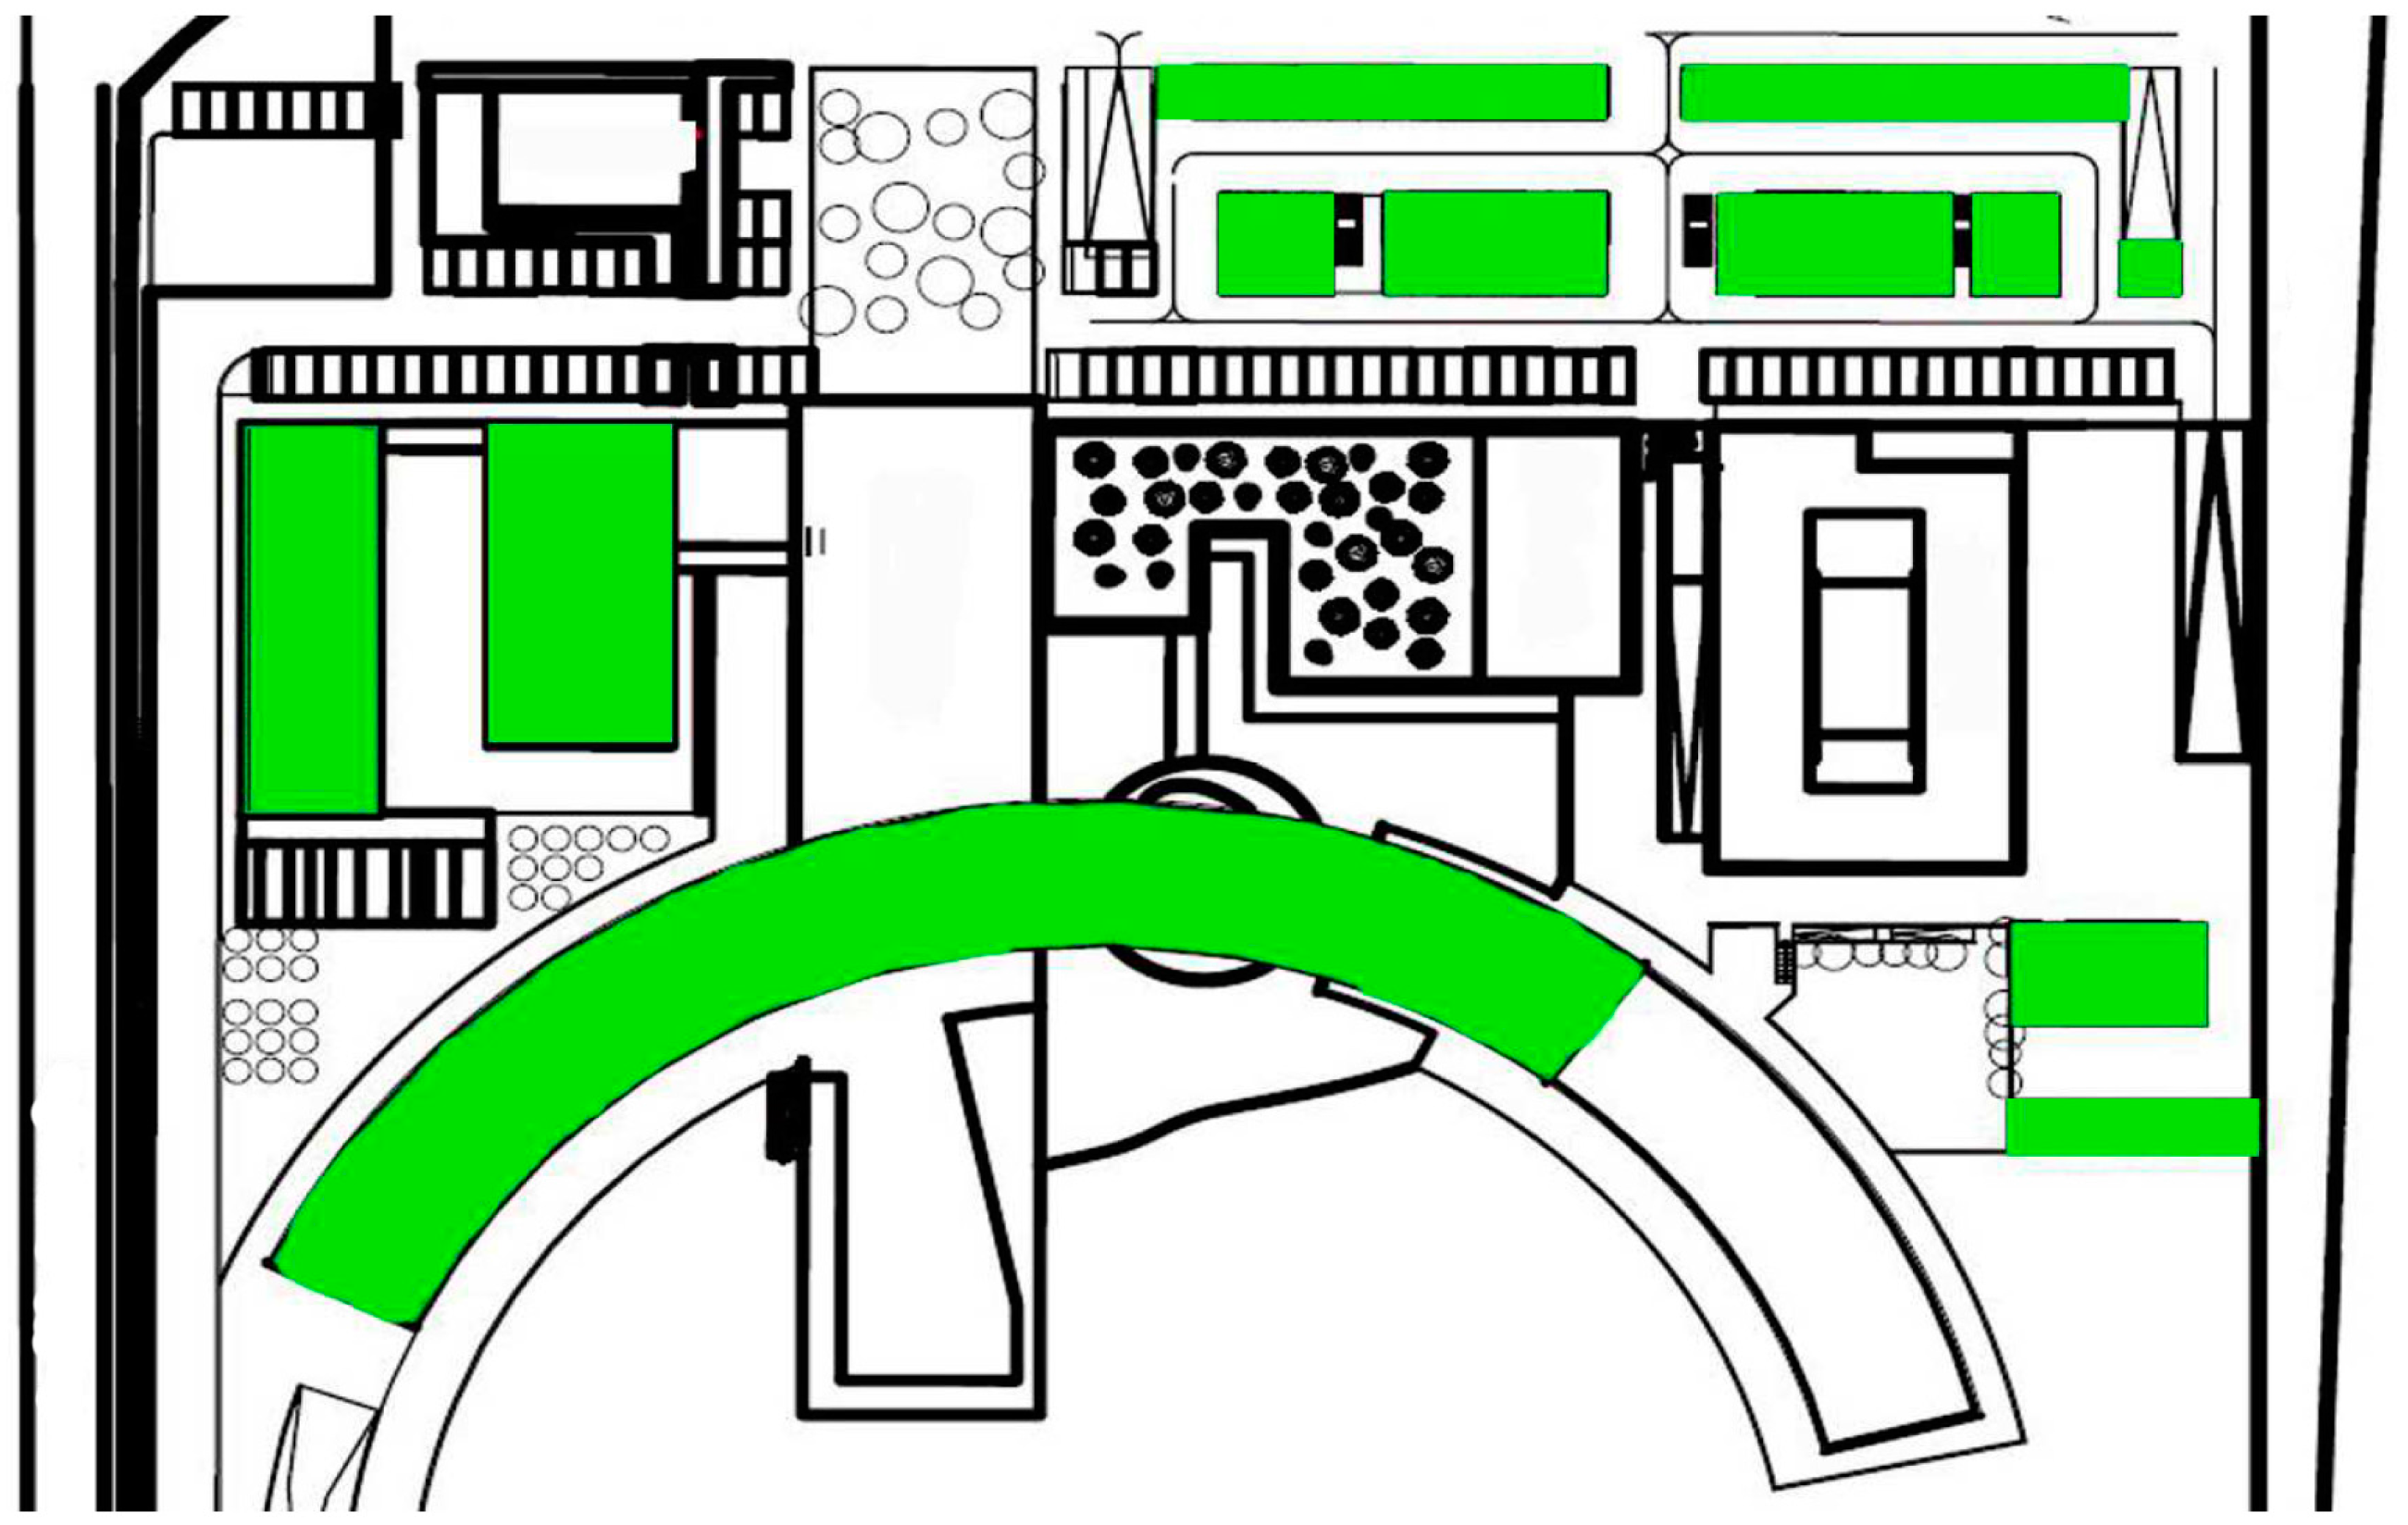
The total available surface for the installation of PV panels is 4000 m
2:1500 m
2 on the parking roofs and 2500 m
2 on the flat roof of some buildings as specified in
Figure 7.
The annual energy production of this PV plant was estimated as to 280 MWh/year, considering the latitude and the average annual insolation of the area as well and the overall efficiency of the system. All the PV panels have been oriented to the south, but according to architectural integration patterns, only 35% of them has been installed with a tilt of 30°, while the remaining 65% has been placed on the horizontal plane with a tilt of 0°.
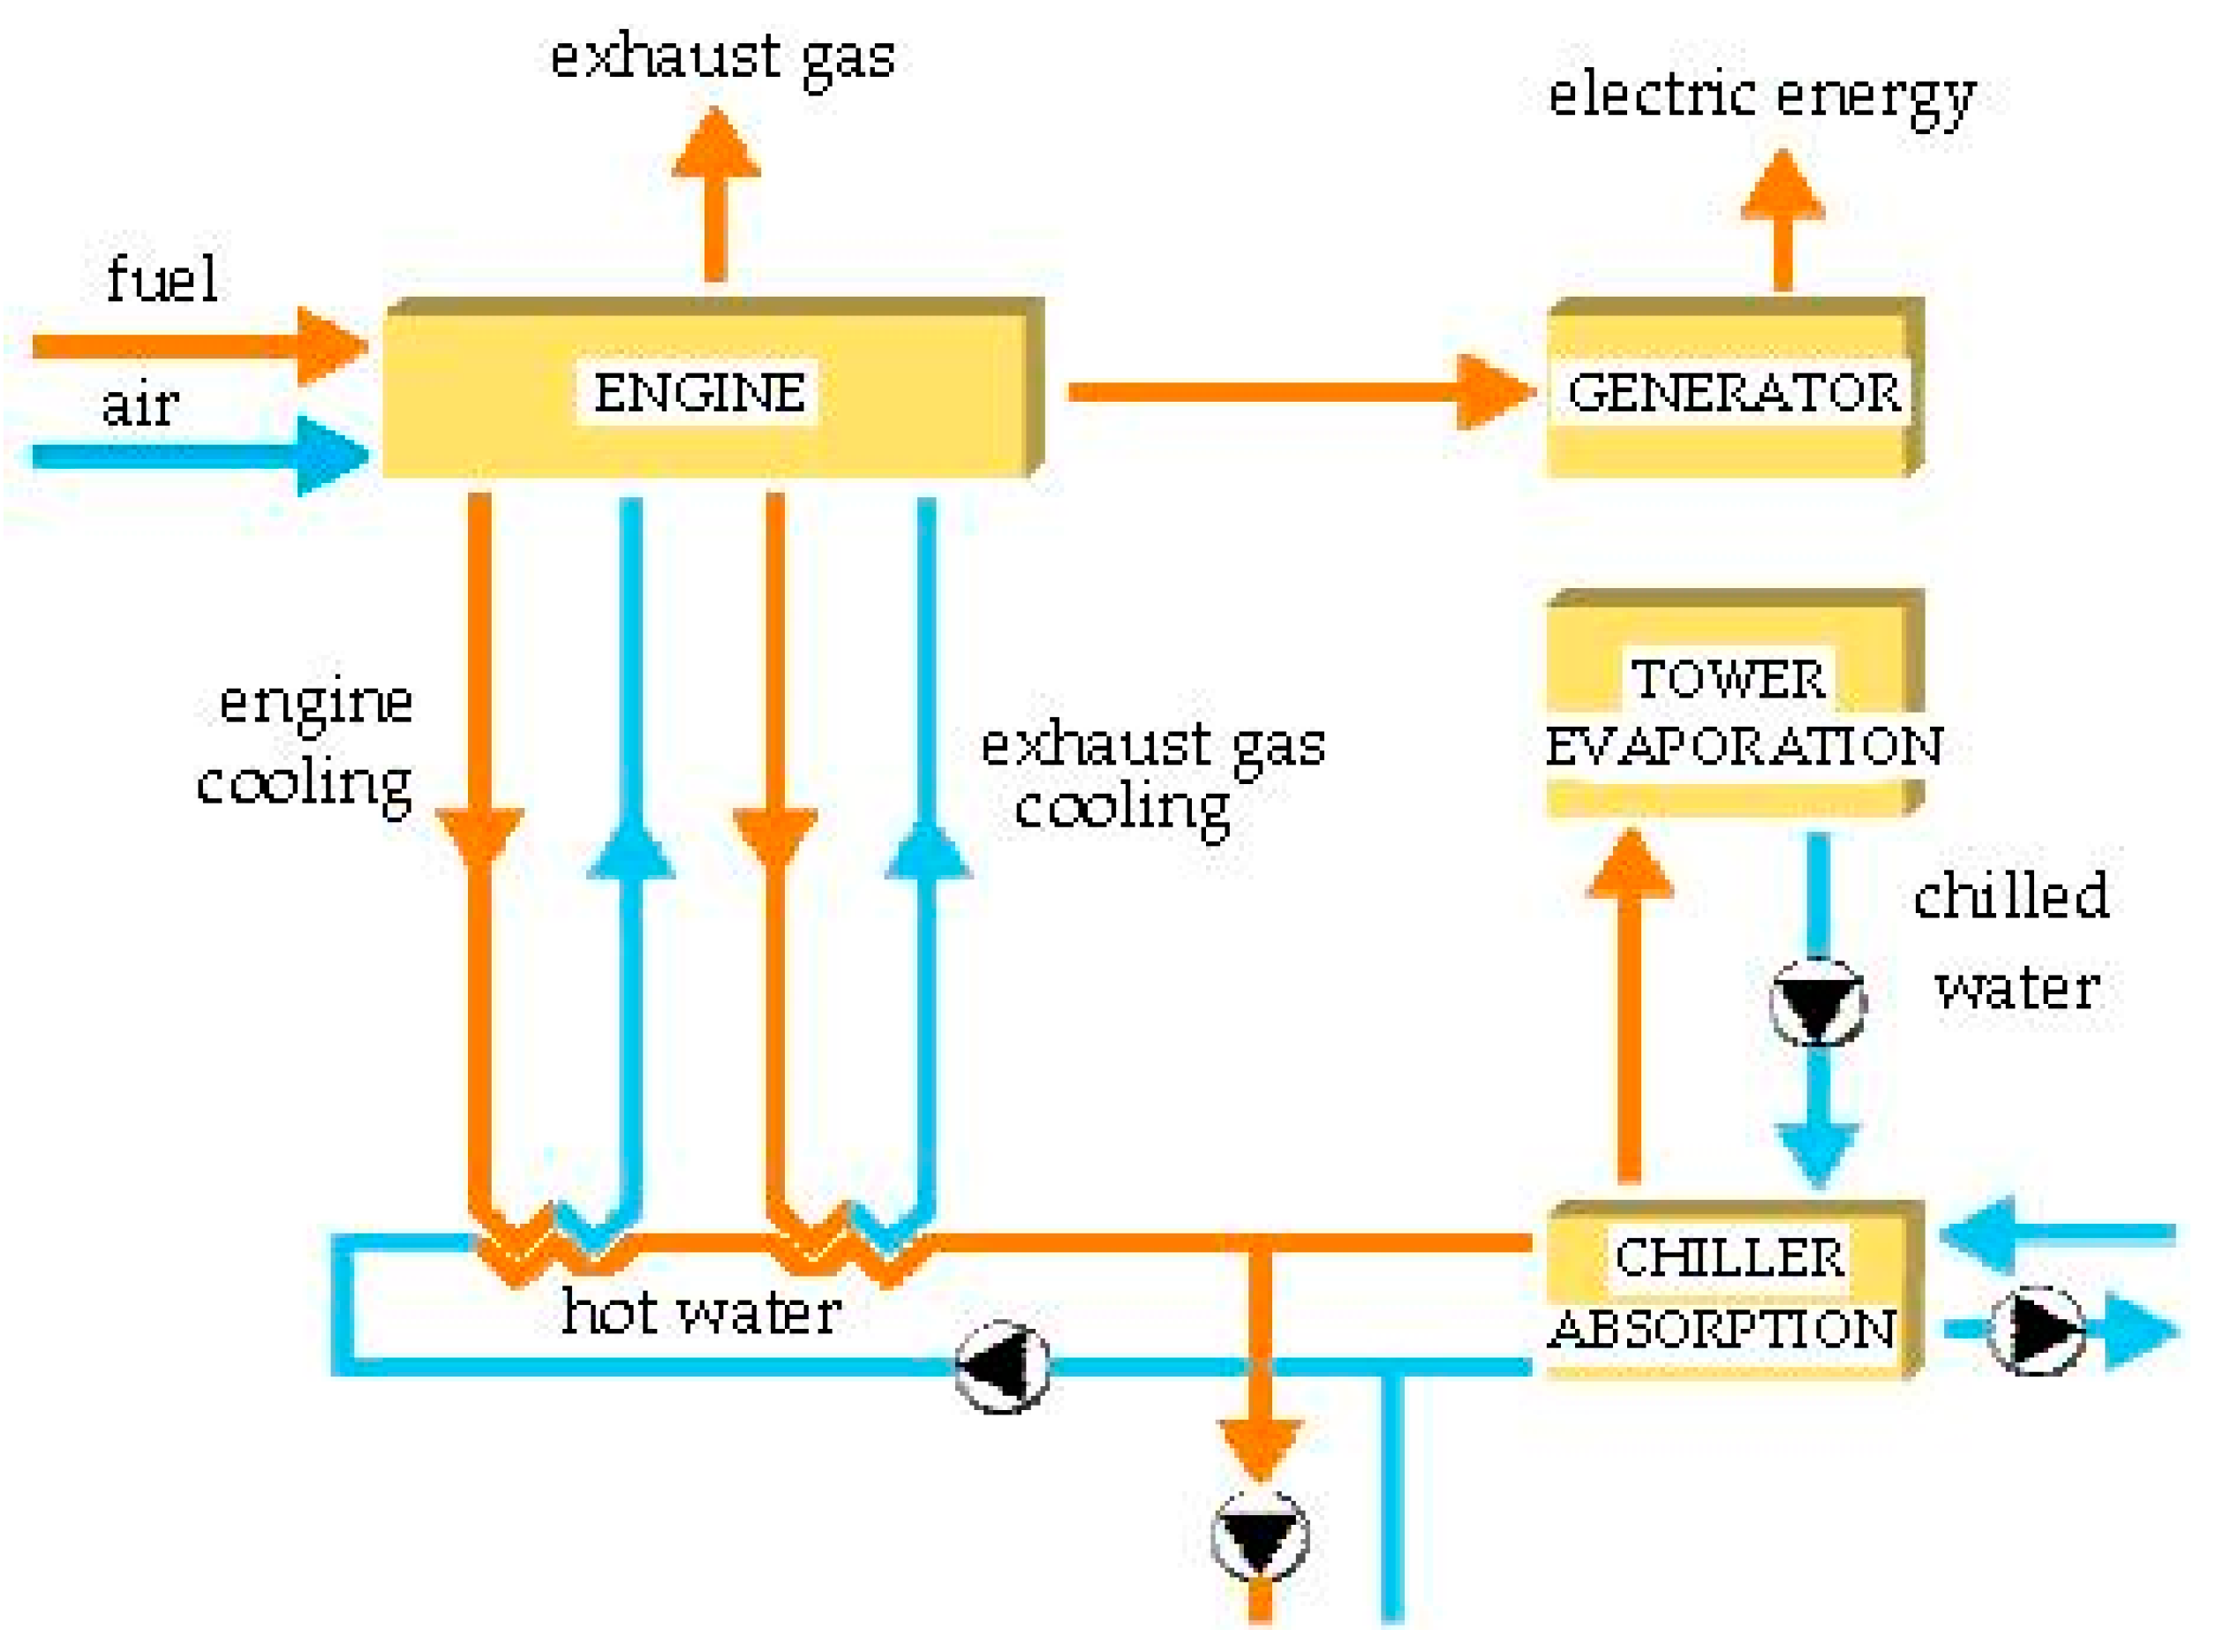
The trigeneration system, located in front of the building in a special sound-proof containers, uses a combined heat and power (CHP) system with a natural gas combustion engine and a group of lithium bromide absorbers. Indeed, CHP technology can be adopted largely for industrial and civil sectors as an efficient alternative to traditional generation systems [
36,
37].
The considered trigeneration system produce 30% of electricity and 55% of thermal energy, with 15% of energy losses; in any case electrical energy produced by these two systems is less than the building energy needs. During the winter, heat recovered from the trigeneration system contributes jointly with the boilers to heat the building, while in the summer months the heat recovered from the exhaust gases is used to power the absorber able to deliver cooling energy to integrate the existing refrigeration system (
Figure 8).
2.5. Proposed Interventions: Ex Banco Napoli
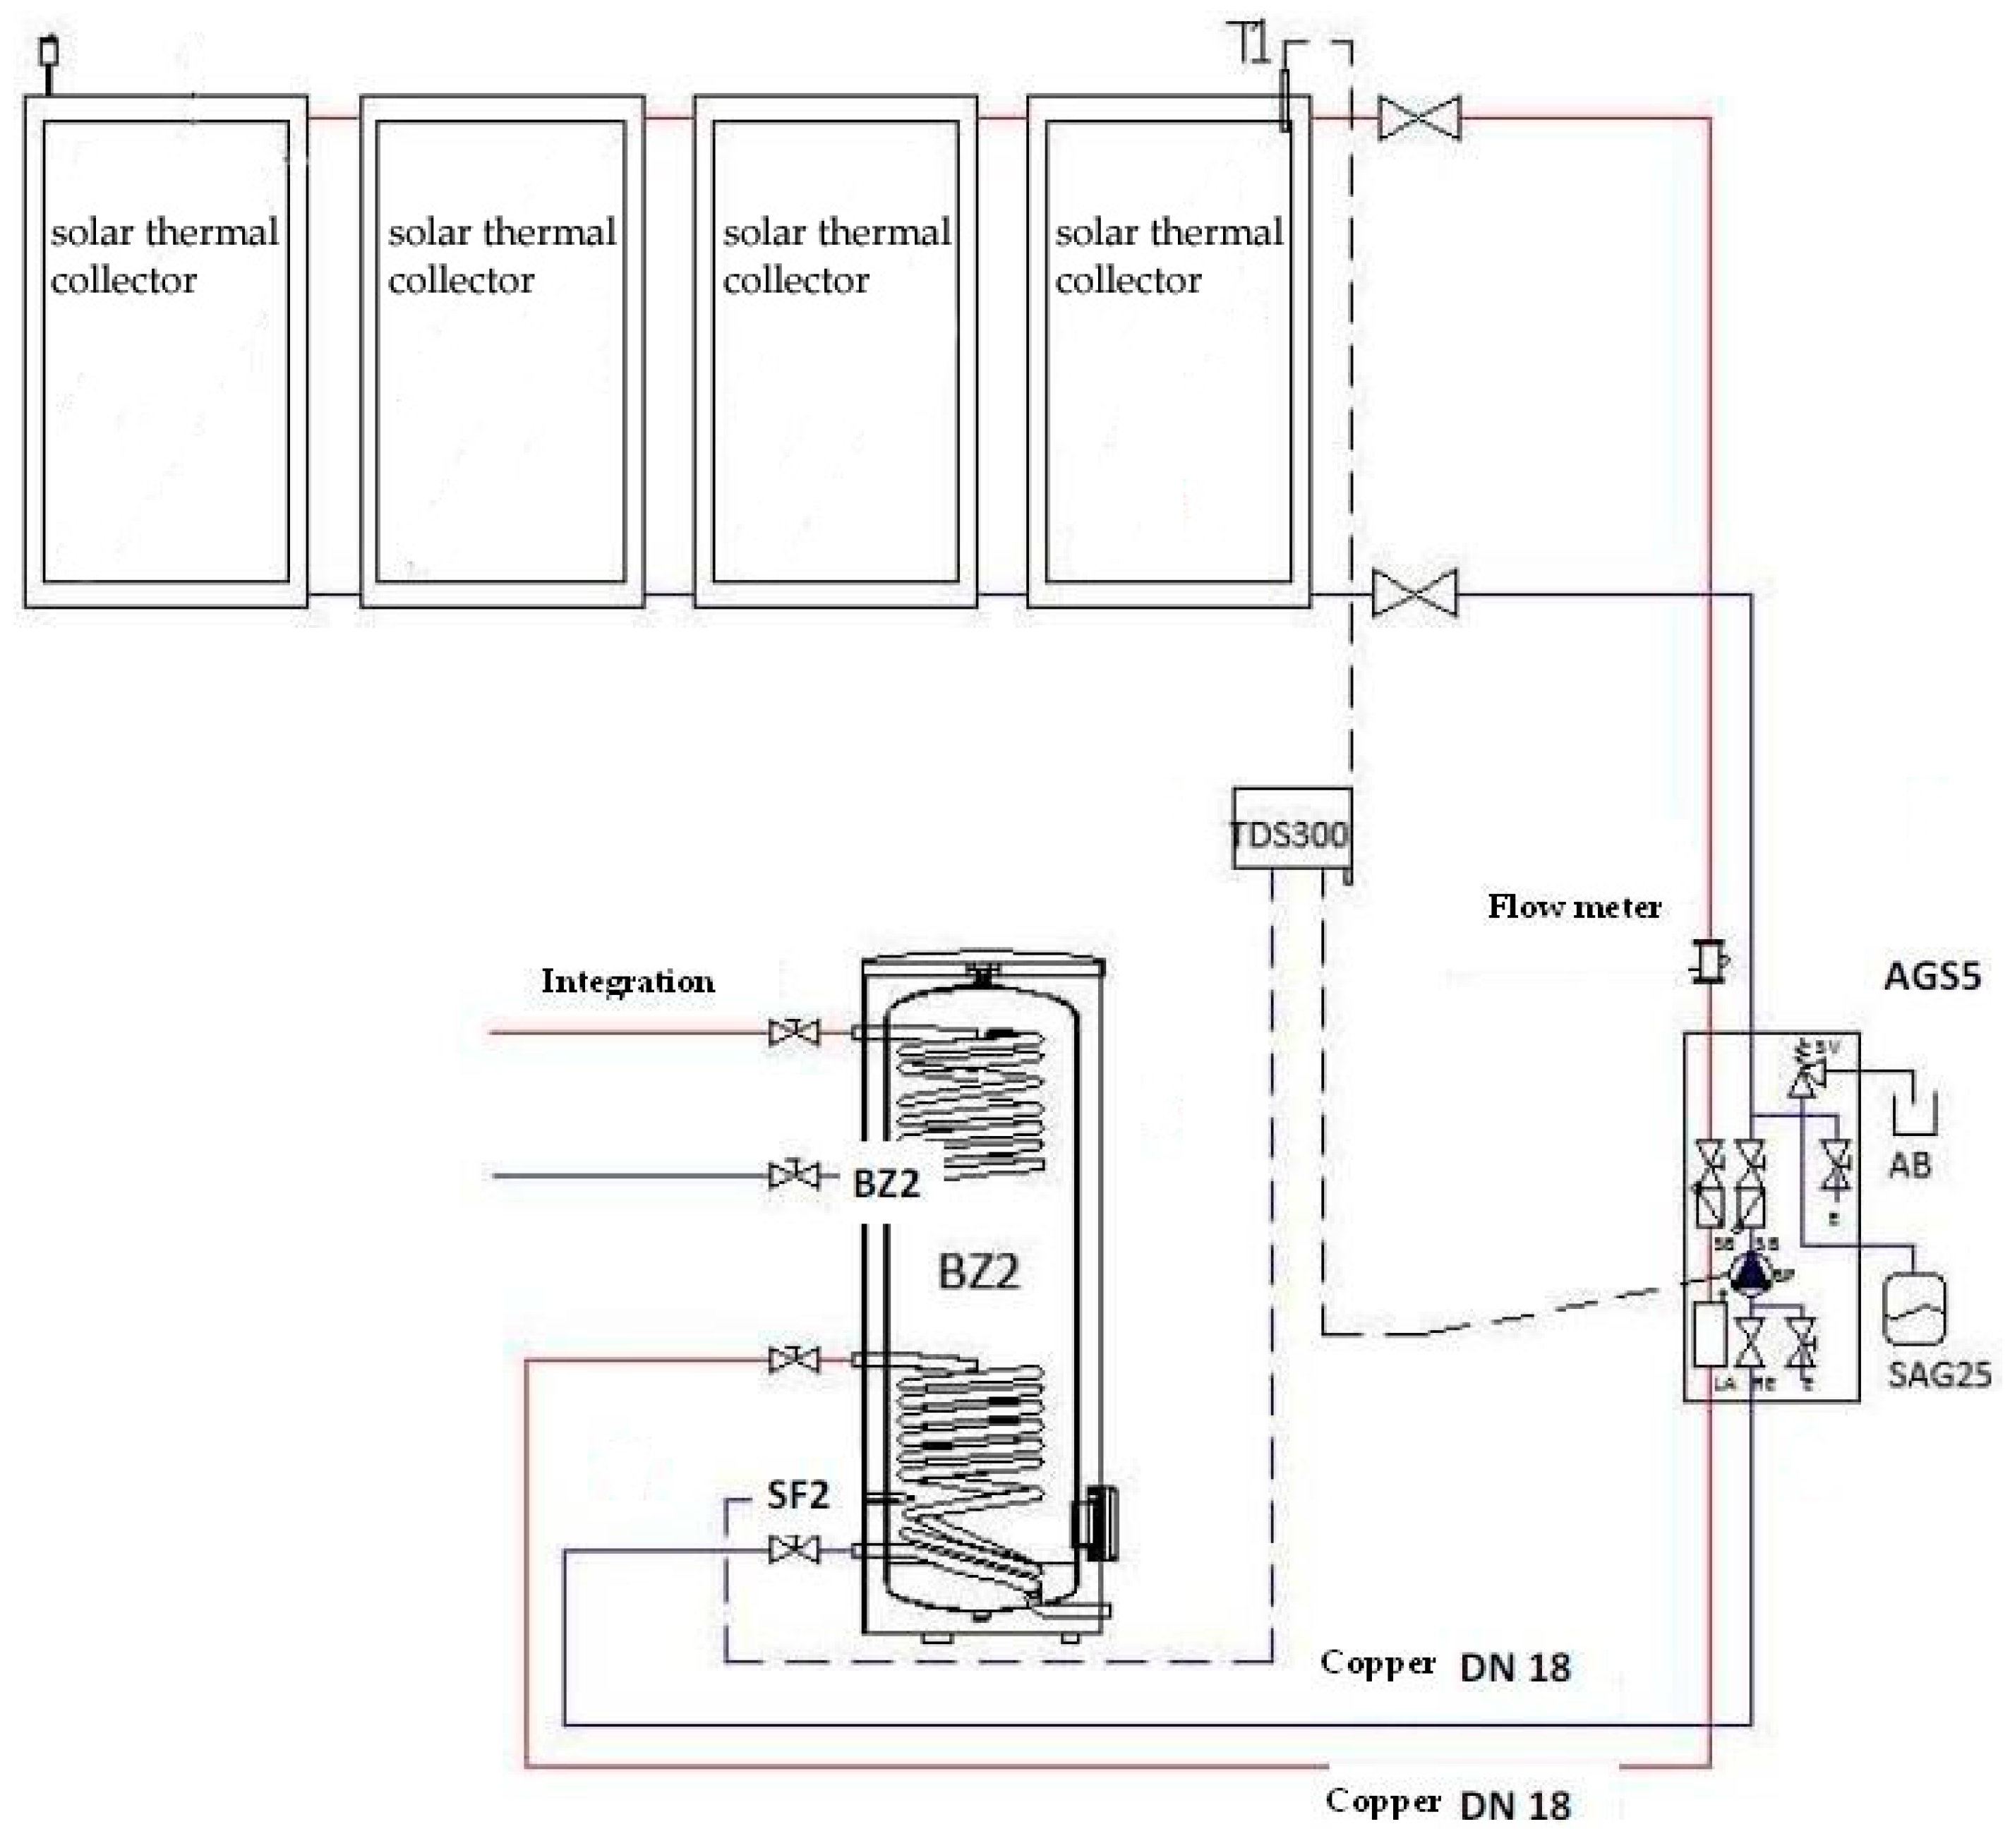
Due to the regulatory constraints of the building and its urban context, the only feasible intervention proposed for the reduction of energy consumption in the Ex Banco Napoli building concerns the installation of solar collectors on the roof, to reduce energy consumption for heating water. The system is schematized in
Figure 9 and includes 12 solar thermal collectors of 2.070 m × 1.145 m with the following characteristics: antireflective treated glasses with high light transmission; a physical vapor deposition (PVD) highly selective and coated absorber for ensuring high energy absorption and low emissions; a hydraulic circuit with high heat transmission efficiency; a heat transfer fluid for heat absorption and transport; hydraulic connections to connect in series up to five thermal collectors (
Table 10).
The solar thermal collectors have been arranged avoiding the shading coming from existing plants in the building terrace and minimising the visual impact of the new system.
3. Results and Discussion
To make a preliminary cost-benefits analysis of the selected interventions in each considered public building in given weather conditions (Rome urban context), economic costs and energy efficiency improvement, have been compared. Energy efficiency improvement has been estimated as the difference of energy performance of each building before and after the proposed interventions.
Table 11 summarizes economic costs and
EPgl improvement estimated for each feasible intervention in Villa Sciarra. In addition, the cost for improving
EPgl of 1 kWh/m
2 has been assessed in order to allow a comparison of the effective energy efficiency improvement among all the interventions.
Considering expenses estimated by the five different companies, economic costs incurred for both considered interventions in MiSE are reported in
Table 12 and
Table 13 show the economic cost estimated for the two plants in ASI and Ex Banco Napoli buildings.
As for the systems installed in ASI, also in Ex Banco Napoli building the economic costs of installation involve a high initial investment which will then be recovered in few years (
Table 13).
3.1. Energy Efficiency Improvements
Considering the overall energy efficiency improvement obtained by all the proposed interventions proposed in Villa Sciarra, a 4.62 kWh/m3·year EPgl was obtained (A energy class) starting from a 10.04 value of EPgl before the interventions. After replacing fixtures and installing thermostatic valves in MiSE, a B energy class was achieved getting an EPgl value of 3 kWh/m3·year starting from an EPgl of 9.09 kWh/m3·year (E energy class).
Due to the recent construction of ASI public building, the only proposed interventions were the installation of PV panels and a trigeneration system. From a starting EPgl value of 9.9 kWh/m3·year (energy class B) in which ASI building was classified before these interventions, with the installation of PV panels and a trigeneration system, an EPgl value of 7 kWh/m3·year (energy class A) was reached.
Finally, considering the obtained results in Ex Banco Napoli building, the installation of solar thermal collectors for hot water production allows to improve energy efficiency from an
EPgl of 140.8 kWh/m
3·year ( energy class G) to an
EPgl of 83.1 kWh/m
3·year (class E). Energy efficiency in buildings could also be assessed by estimating the reduction of GHG emissions [
7,
38]. As example, the installation of solar thermal collectors in Ex Banco Napoli building allows a reduction of CO
2 emissions of 65 tons/year.
3.2. Economic Cost Assessment
Economic costs are summarized in
Table 14, estimating for each the euro amounts per building square meters.
Among the considered interventions, the results highlight that a trigeneration plant installation is the most expensive per m2 of building; replacing fixtures with low-e glasses an PV panels installation have a similar cost per square meter of the analysed buildings; the same could be said for geothermal plant and thermal solar collectors; Comparing costs for floor and roof insulation, the euro amount per square meter needed for the first one is almost twice the amount required for roof insulation; Replacing fixtures using insulated glasses costs much less than using low-e glasses and has a similar price per building square meter to thermostatic valves installation.
3.3. Cost-Benefit Analysis
Table 15 illustrates economic cost and
EPgl improvement for each feasible intervention, assessing the costs for improving
EPgl of 1% in order to allow a cost-benefit analysis comparing economic costs an established percentage of energy efficiency improvement (1%).
Cost-benefit results highlight that a trigeneration plant installation is the intervention with higher cost for improving EPgl of 1%; replacing fixtures with insulated glasses an PV panels installation have a similar cost-benefit ratio; the same could be said for geothermal plant and thermal solar collectors, that are the intervention characterized by lower economic costs for improving EPgl of 1%.
4. Conclusions
The research analysed energy efficiency improvements and economic costs for some retrofitting interventions comparing results obtained in four public buildings located in the same geographical area. Only feasible interventions have been considered, according with each building’s characteristics and local constraints. For example, it was not possible to analyse data coming from insulation of building facades, since it was not allowed in any of the considered buildings.
The obtained results do not claim to objectively demonstrate that a single intervention could have a better cost-benefit ratio in every building or every context, but only to give some indications about cost-benefit data obtained in four case studies that could be used by public administrations for preliminary analysis aimed to select specific interventions for reduction energy consumptions in public buildings trying to optimize cost- benefit ratio.
Indeed, the research gives useful inputs for decision makers and public administrations which have to select retrofitting interventions for improving energy performance of a specific public building, starting often with a limited budget. In particular, after selecting retrofitting interventions that could be made in compliance with the regulatory framework and the territorial context of the considered building, a further selection could be done comparing energy efficiency improvement and economic costs of each intervention.
Finally, since all the results have been obtained considering Italian parameters for economic costs of each intervention, the next steps of the research could include a comparison with data coming from other EU countries; in addition, an assessment of the actual reduction of energy consumptions after the interventions could be completed, allowing for an assessment of economic savings and payback time of each intervention.


 ,
, 


