
Online Power Management with Embedded Offline-Optimized Parameters for a Three-Source Hybrid Powertrain with an Experimental Emulation Application


Abstract
:1. Introduction
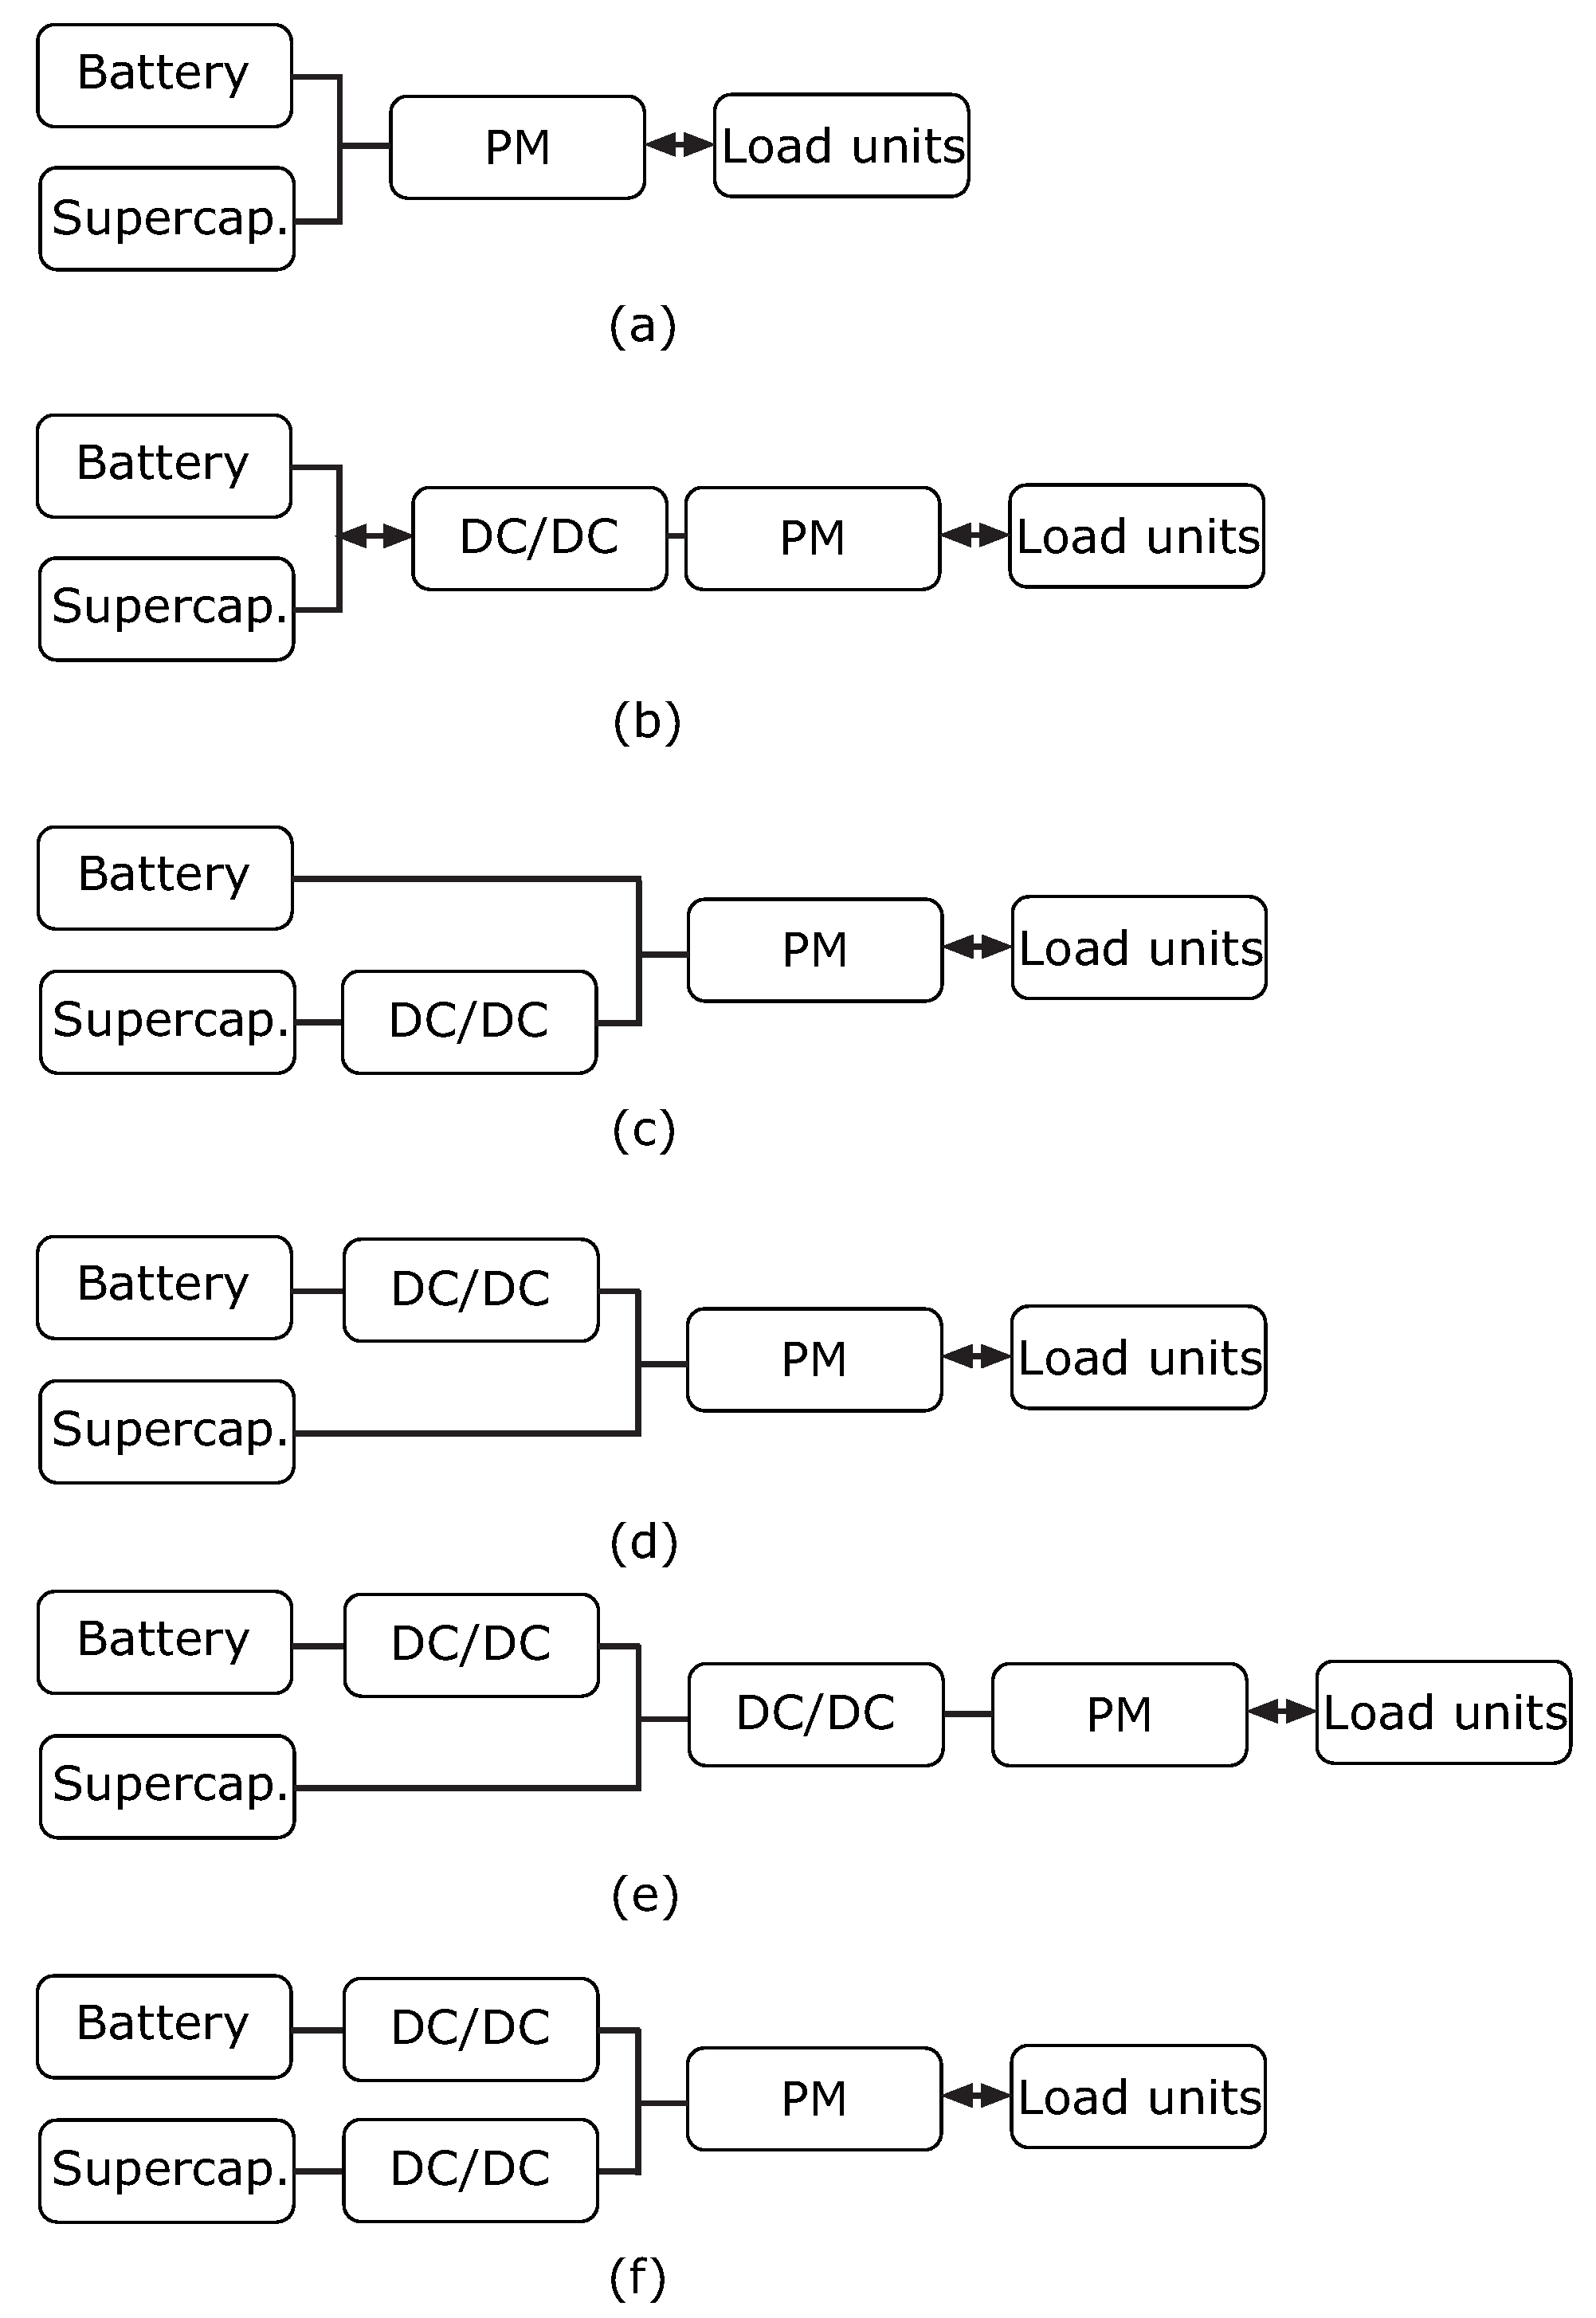
2. Possible Topologies and Considered Configuration
3. Modeling and Sizing of Components
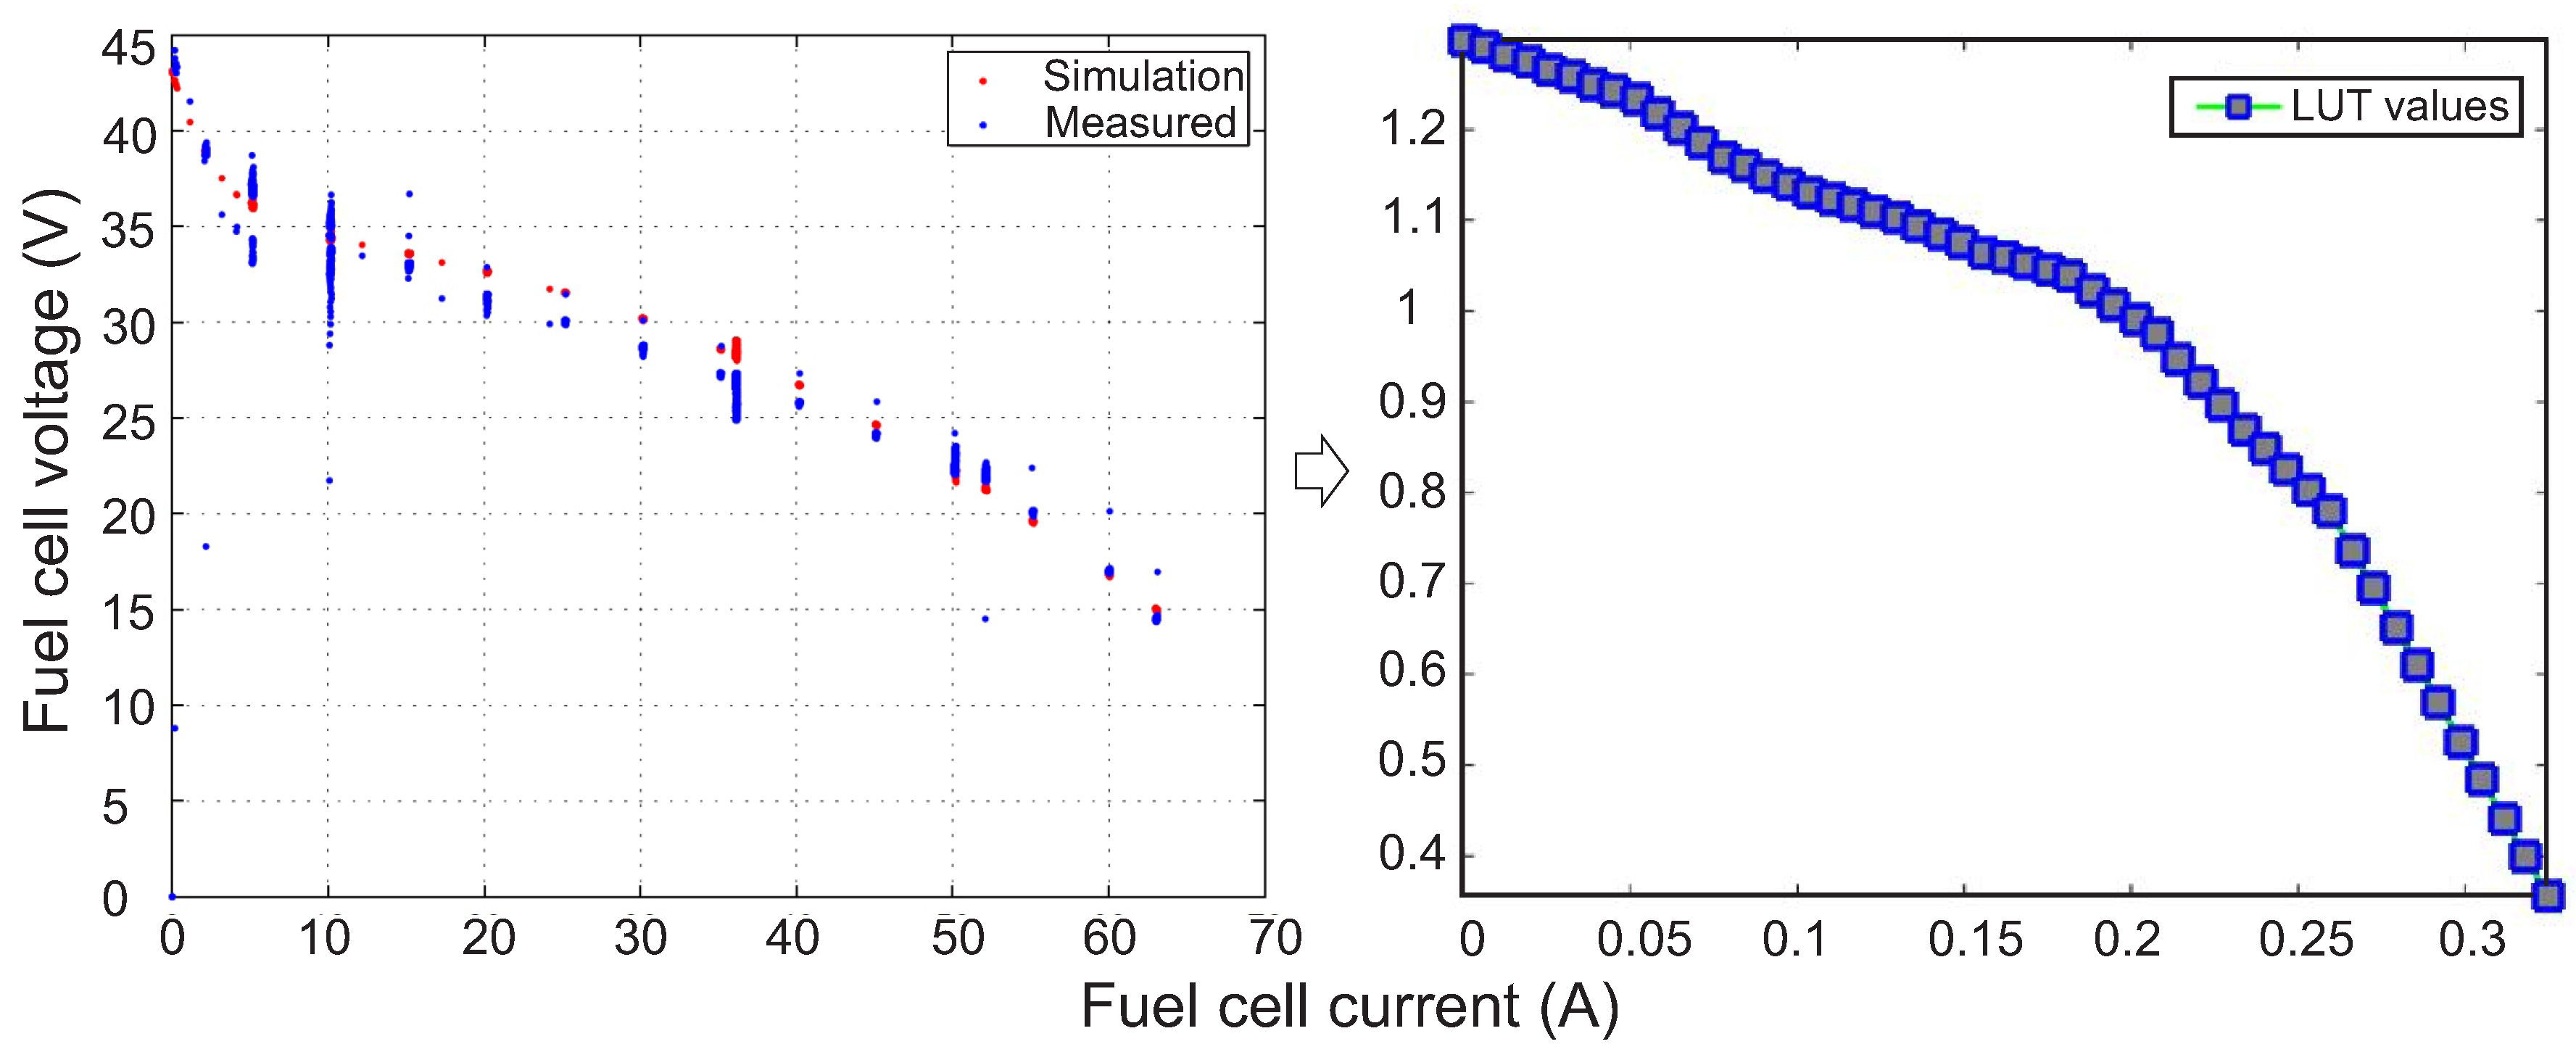
3.1. Fuel Cell
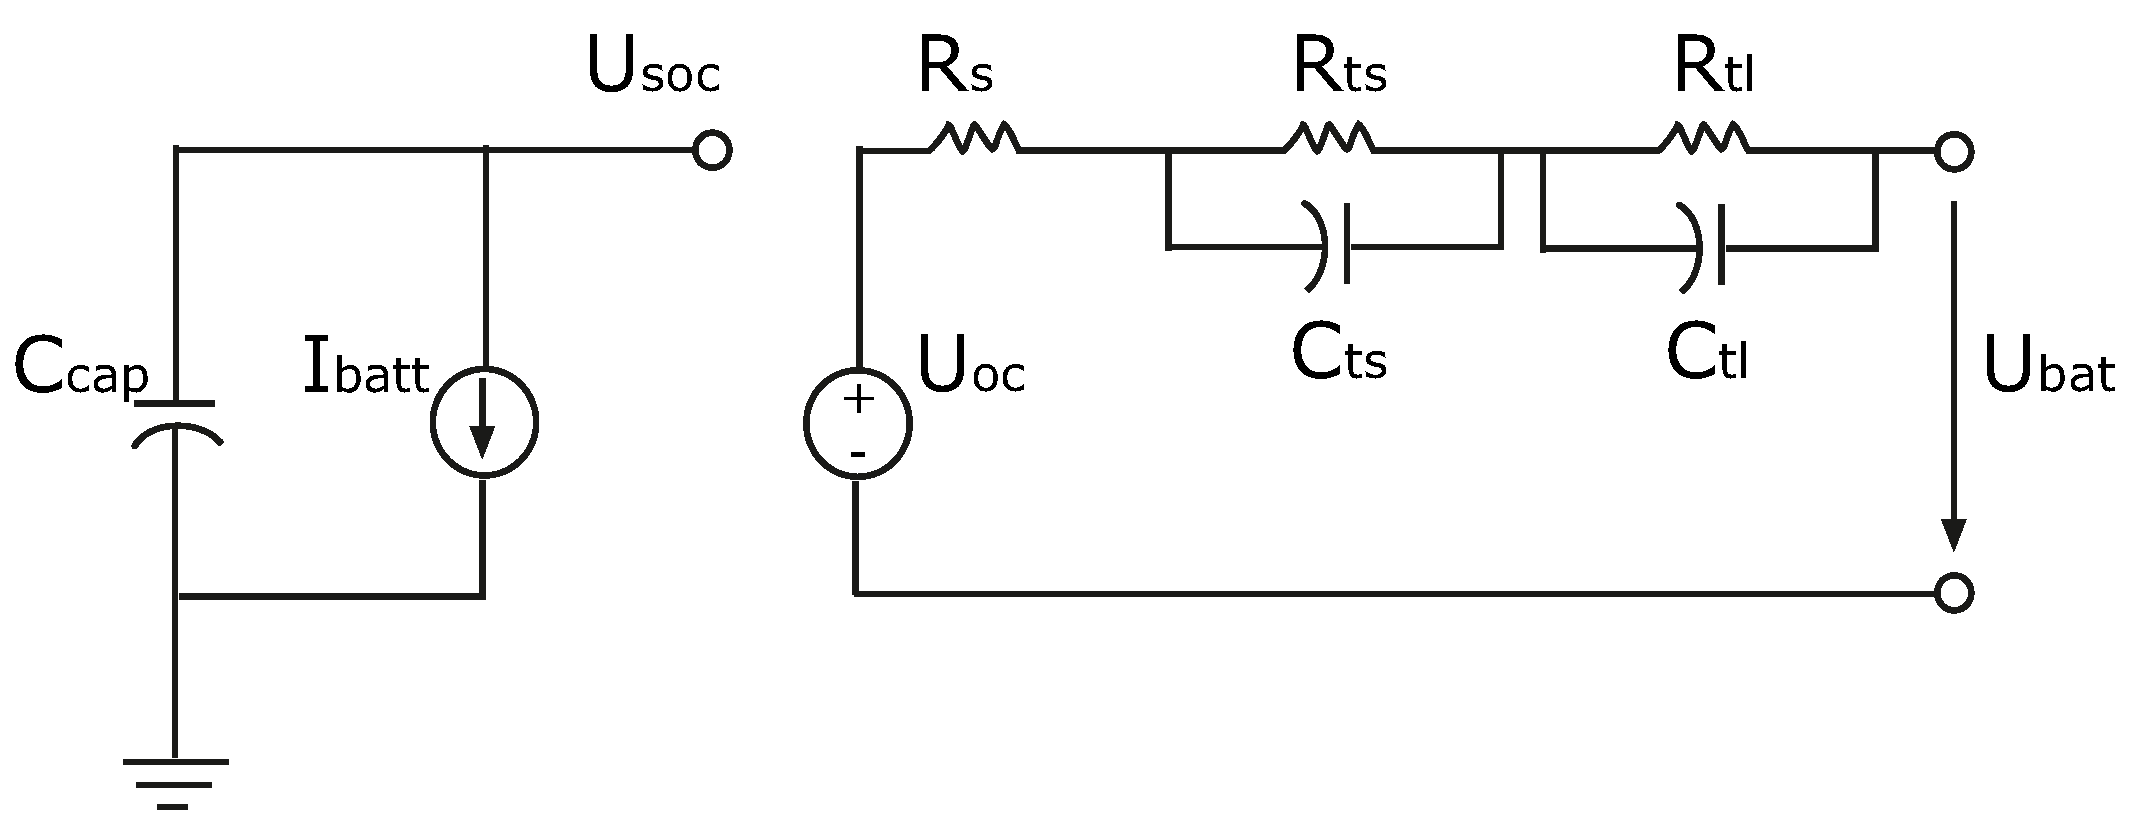
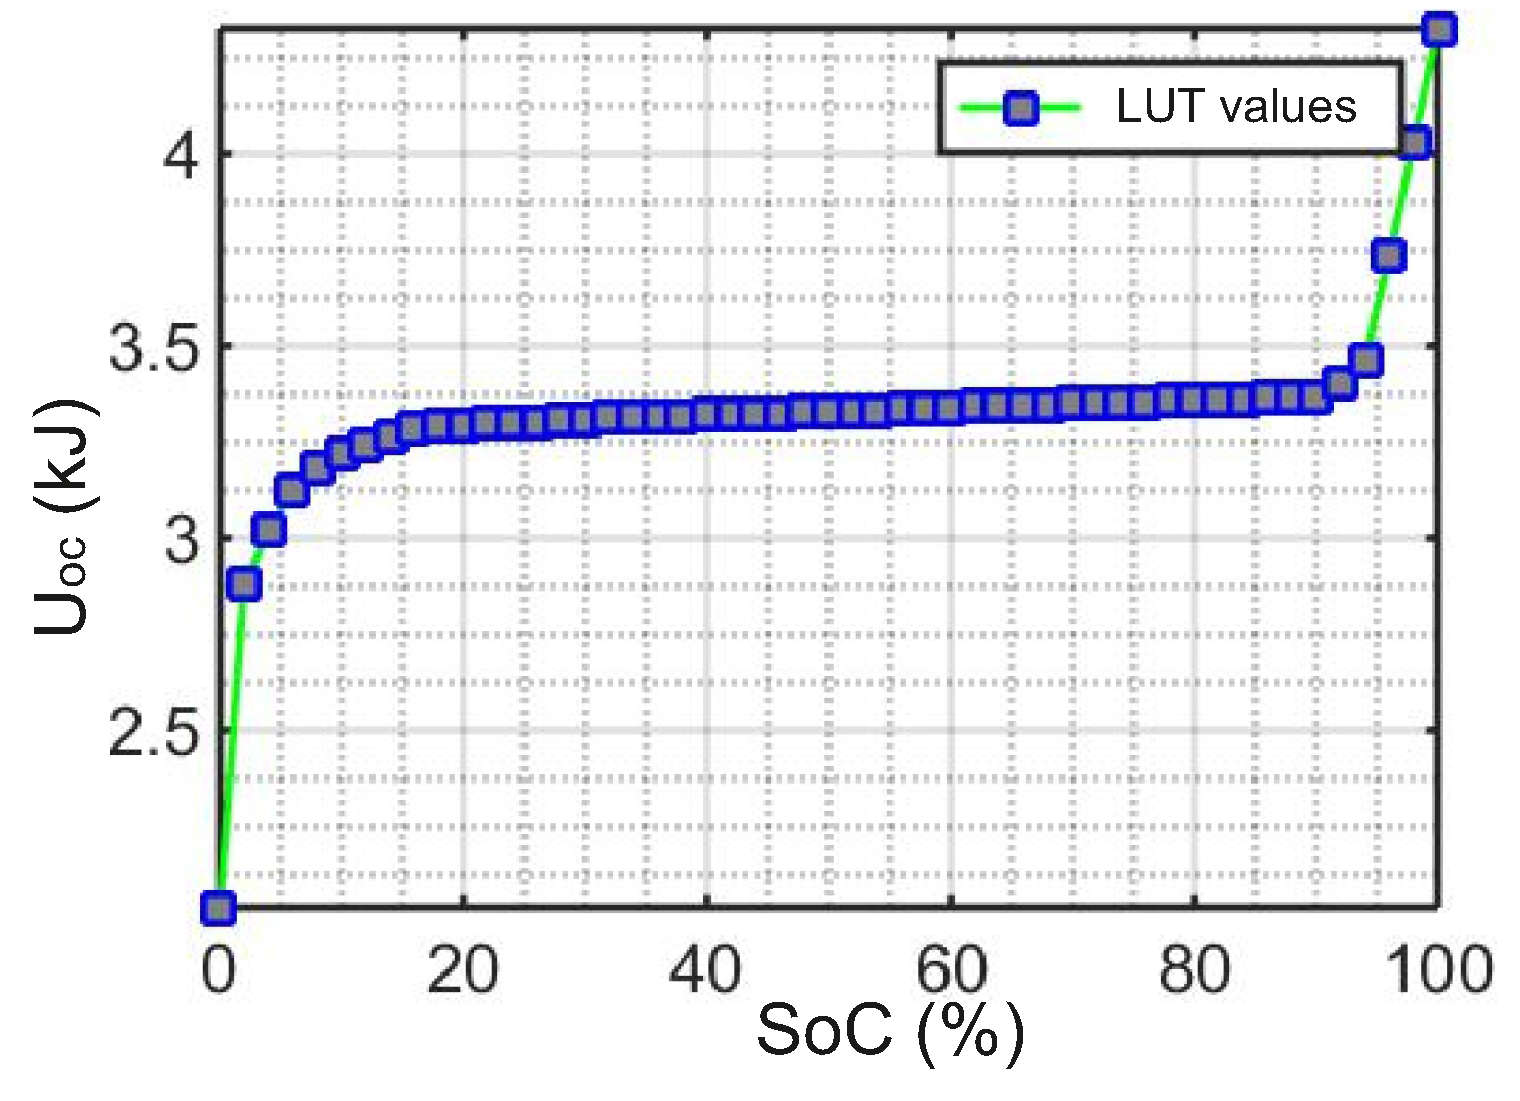
3.2. Battery
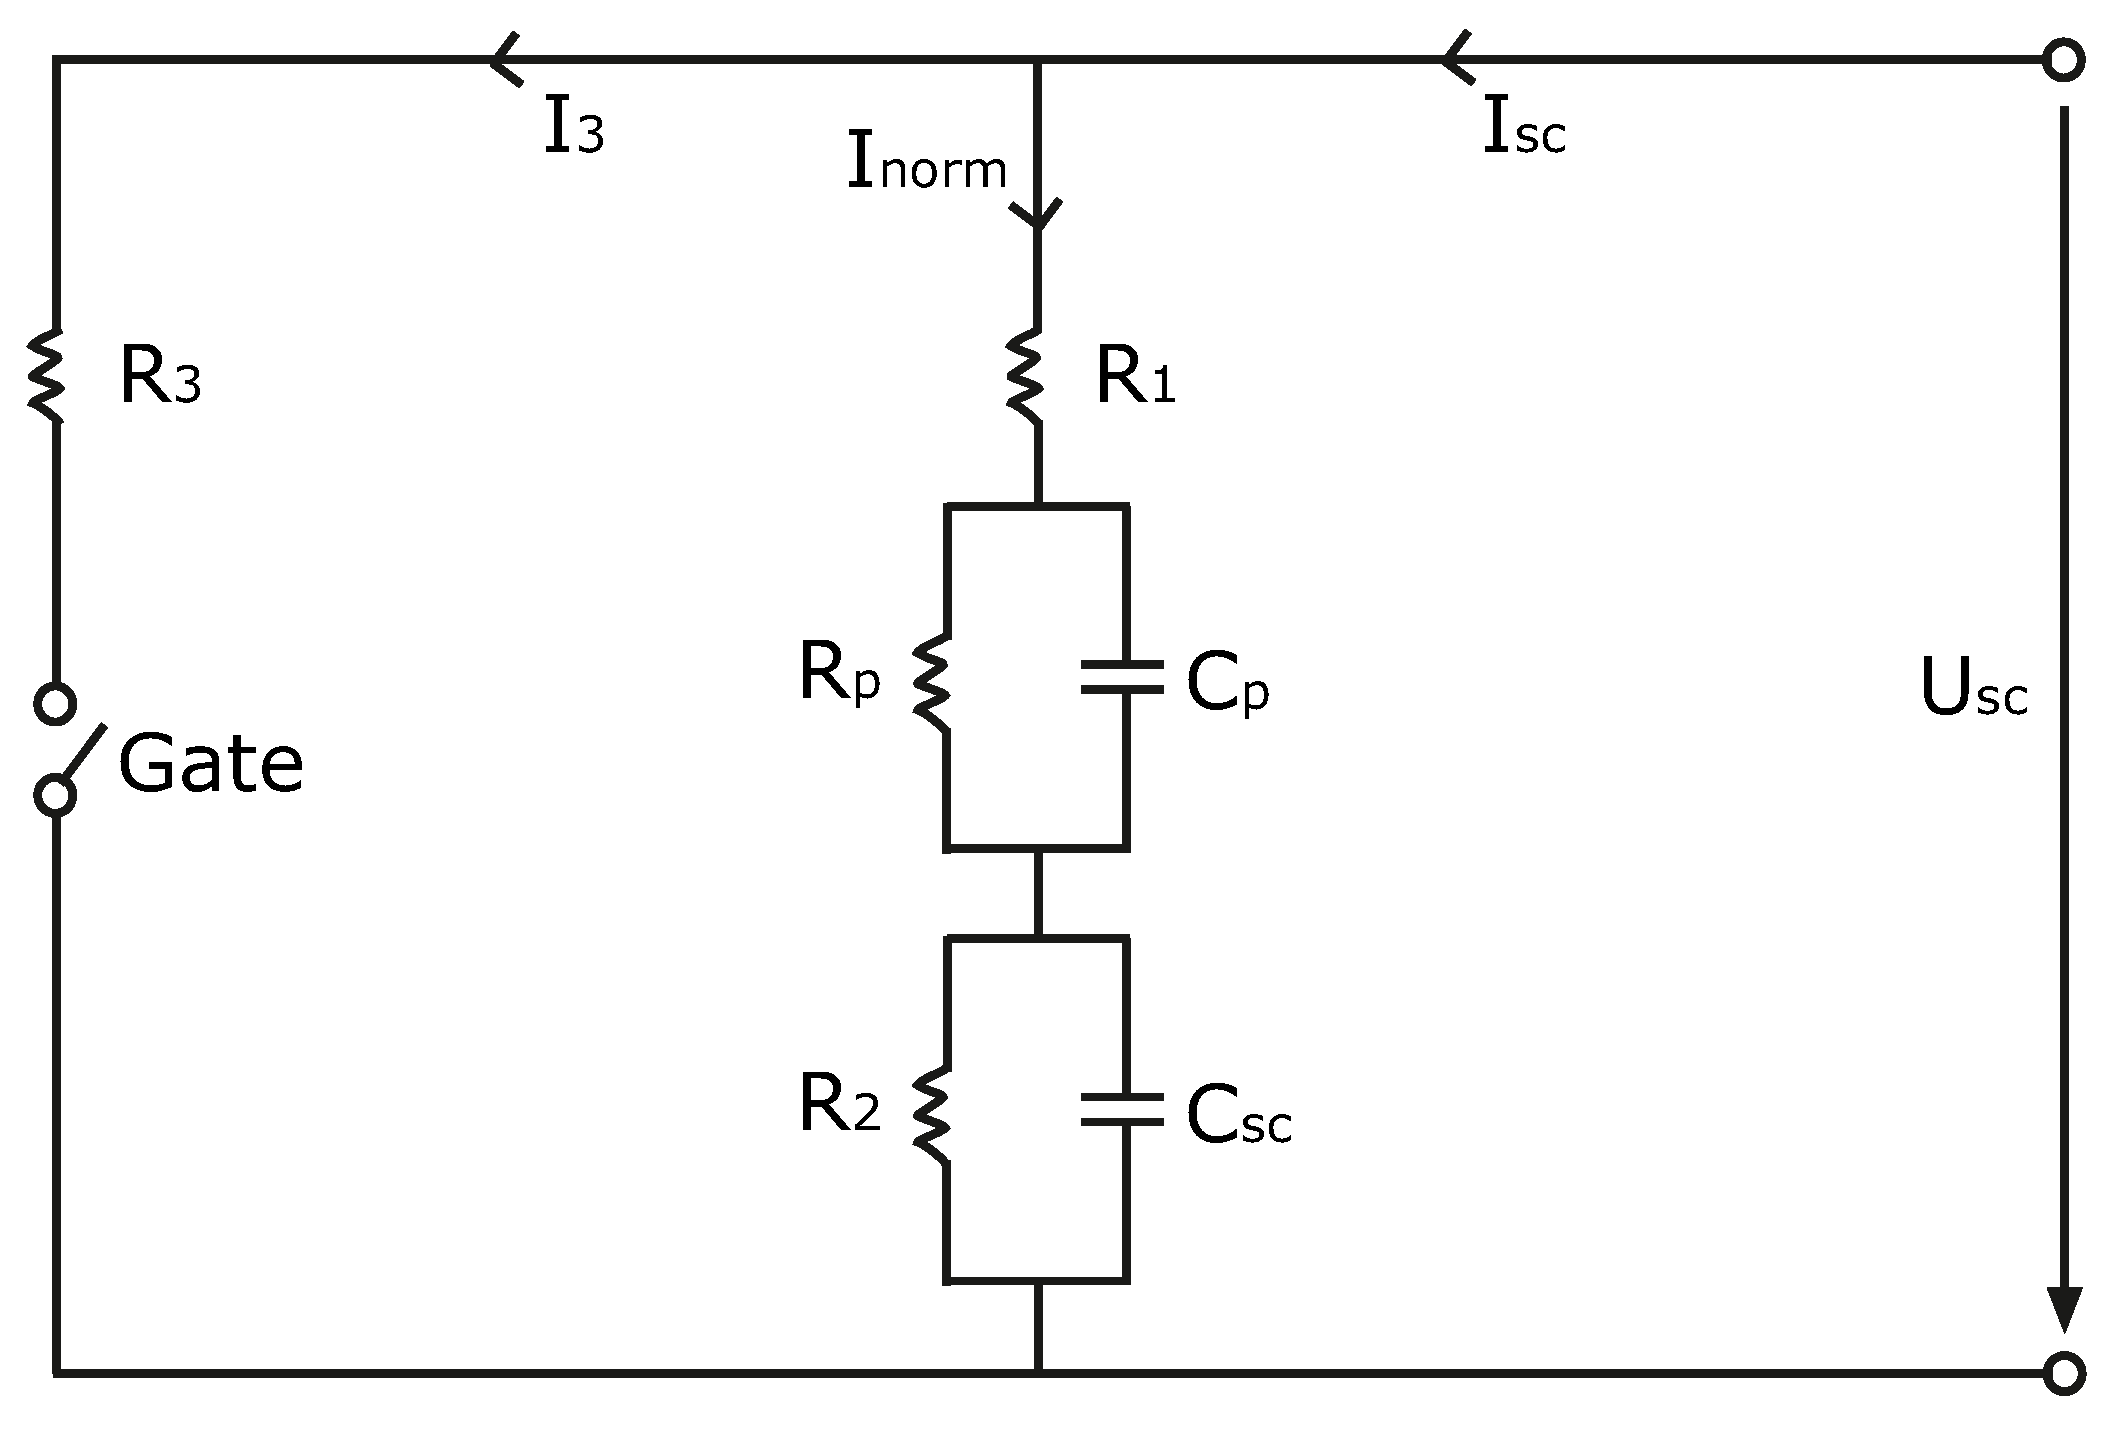
3.3. Supercapacitor
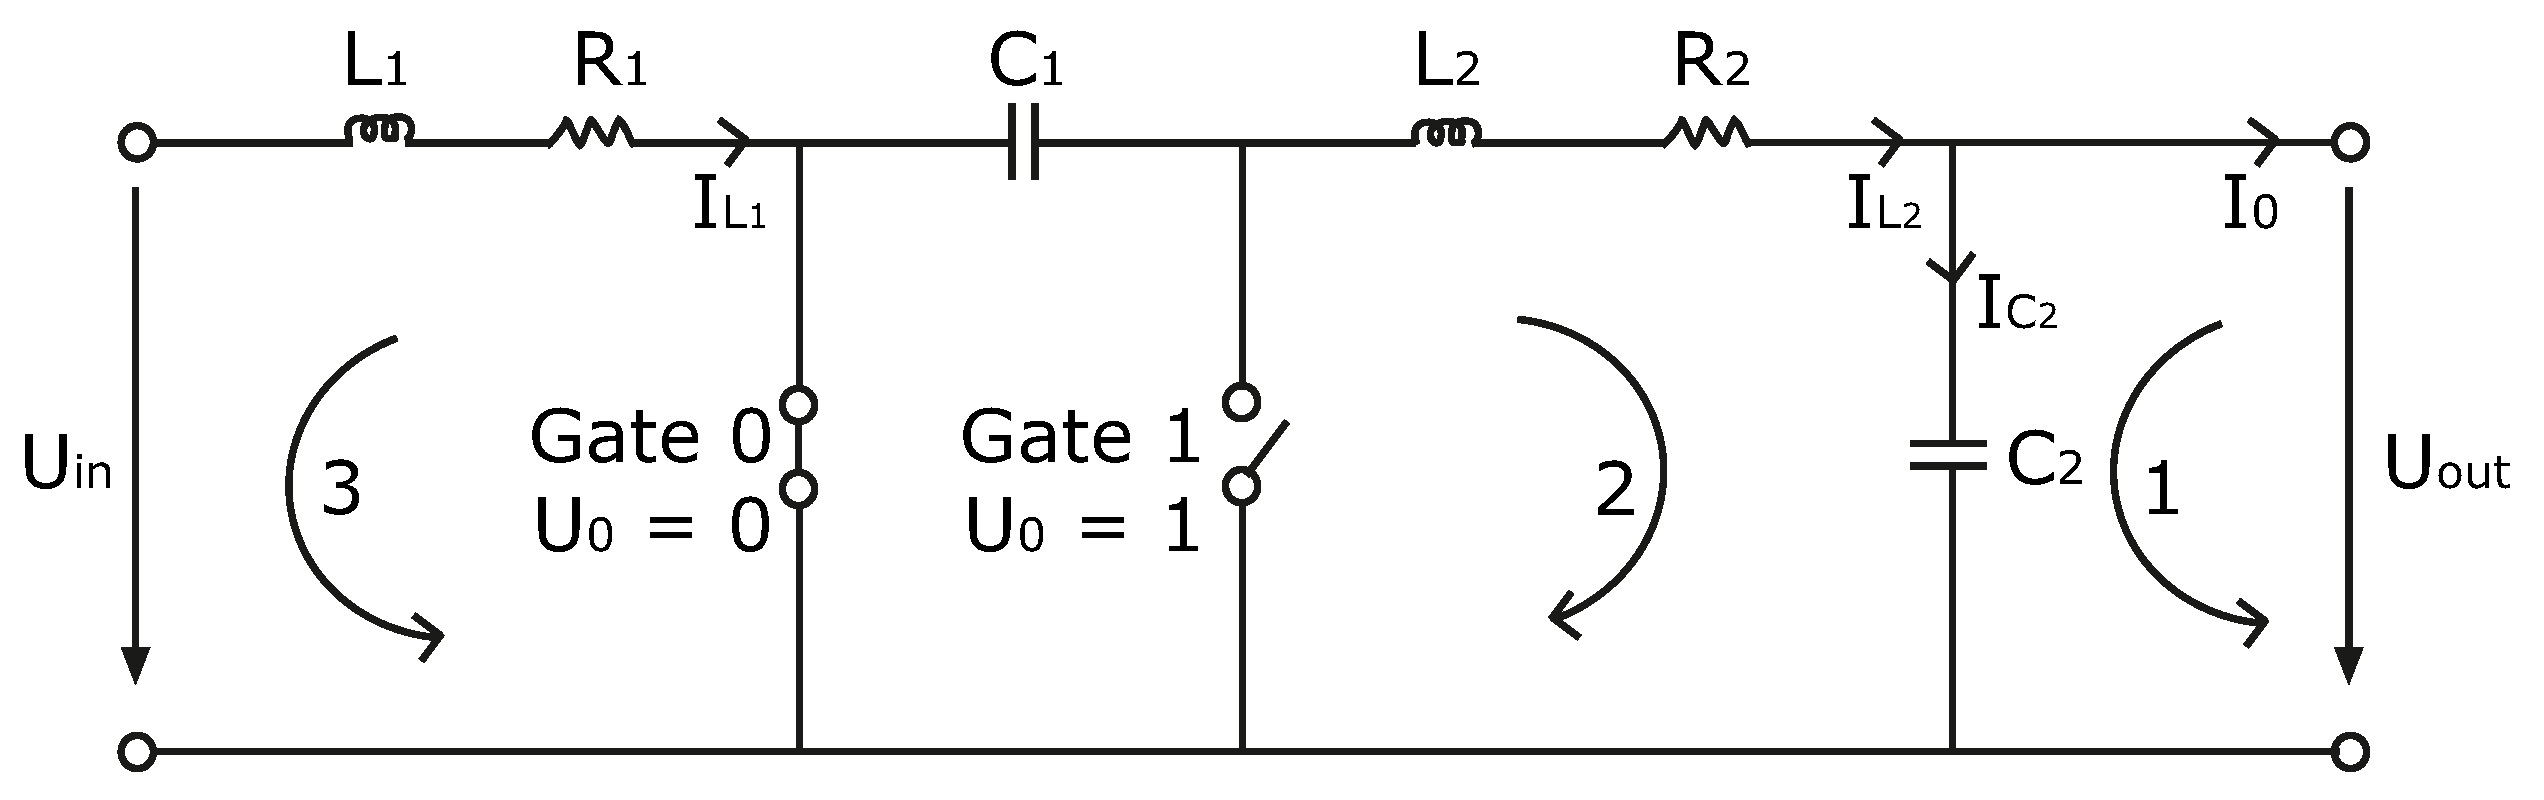
3.4. DC/DC Converter
- Gate 0 is closed and Gate 1 open ,
- Gate 0 is open and Gate 1 closed .
4. Model Verification Based on Literature Results
4.1. Verification of the Battery Model
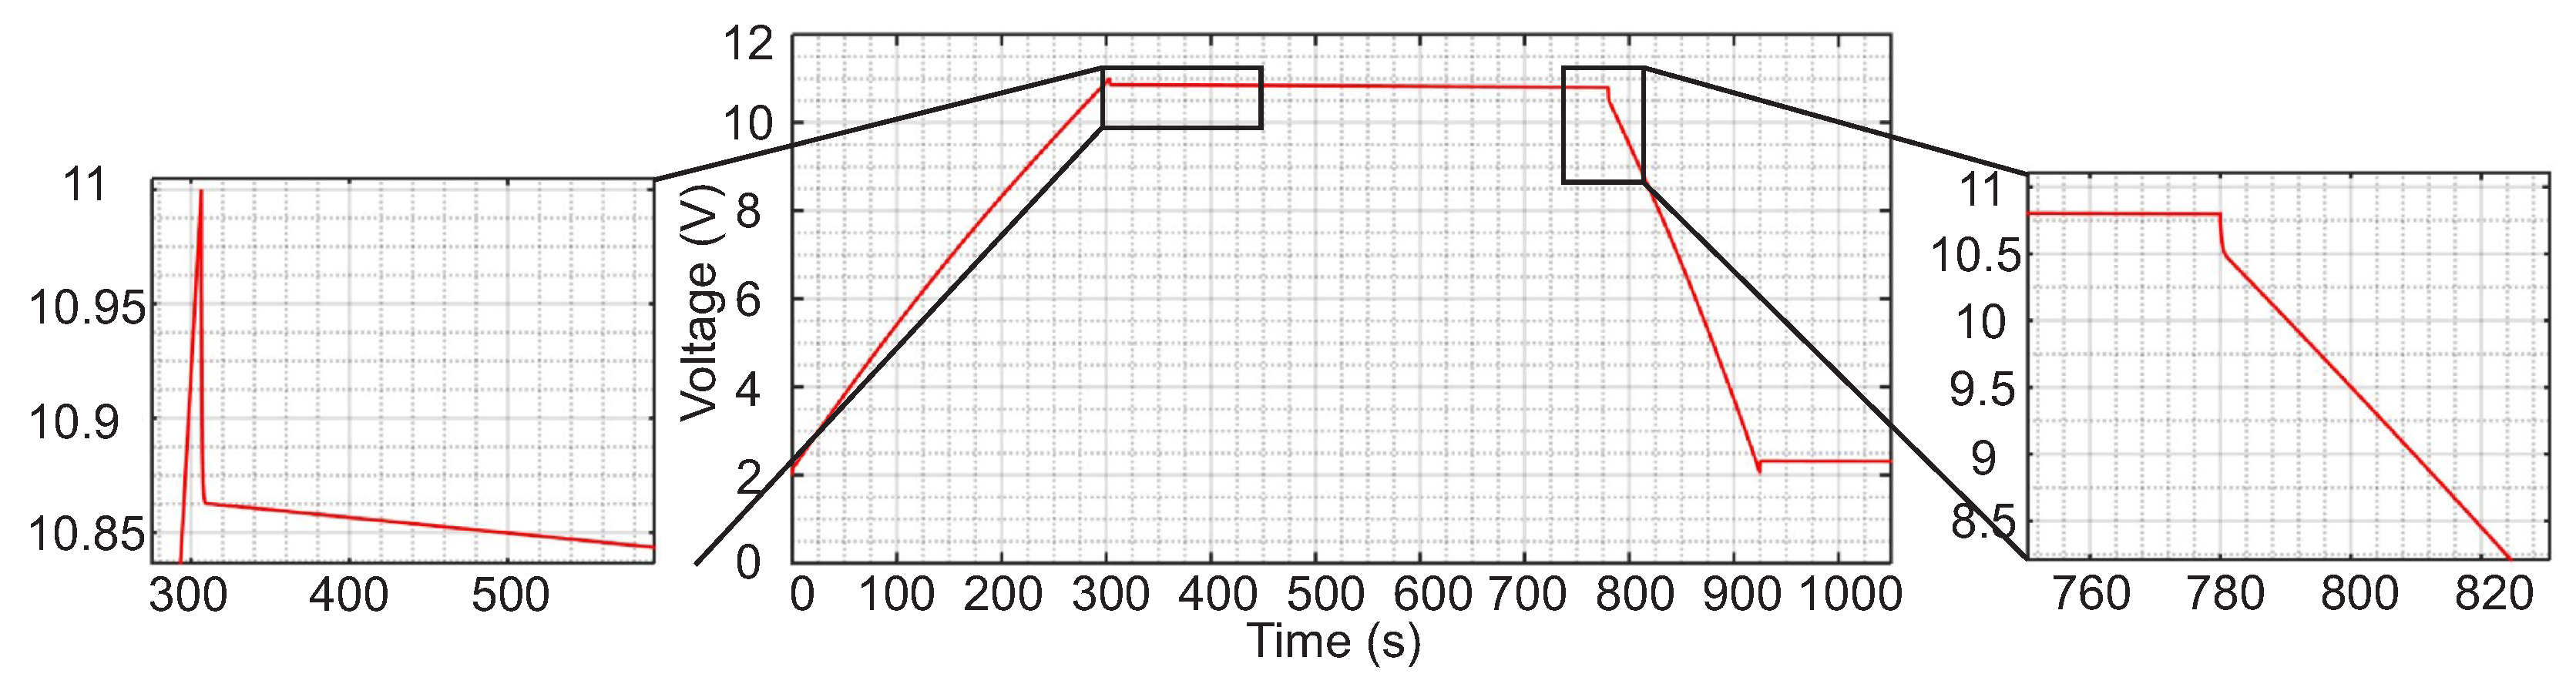
4.2. Verification of the Supercapacitor Model
4.3. Verification of the DC/DC Converter Model
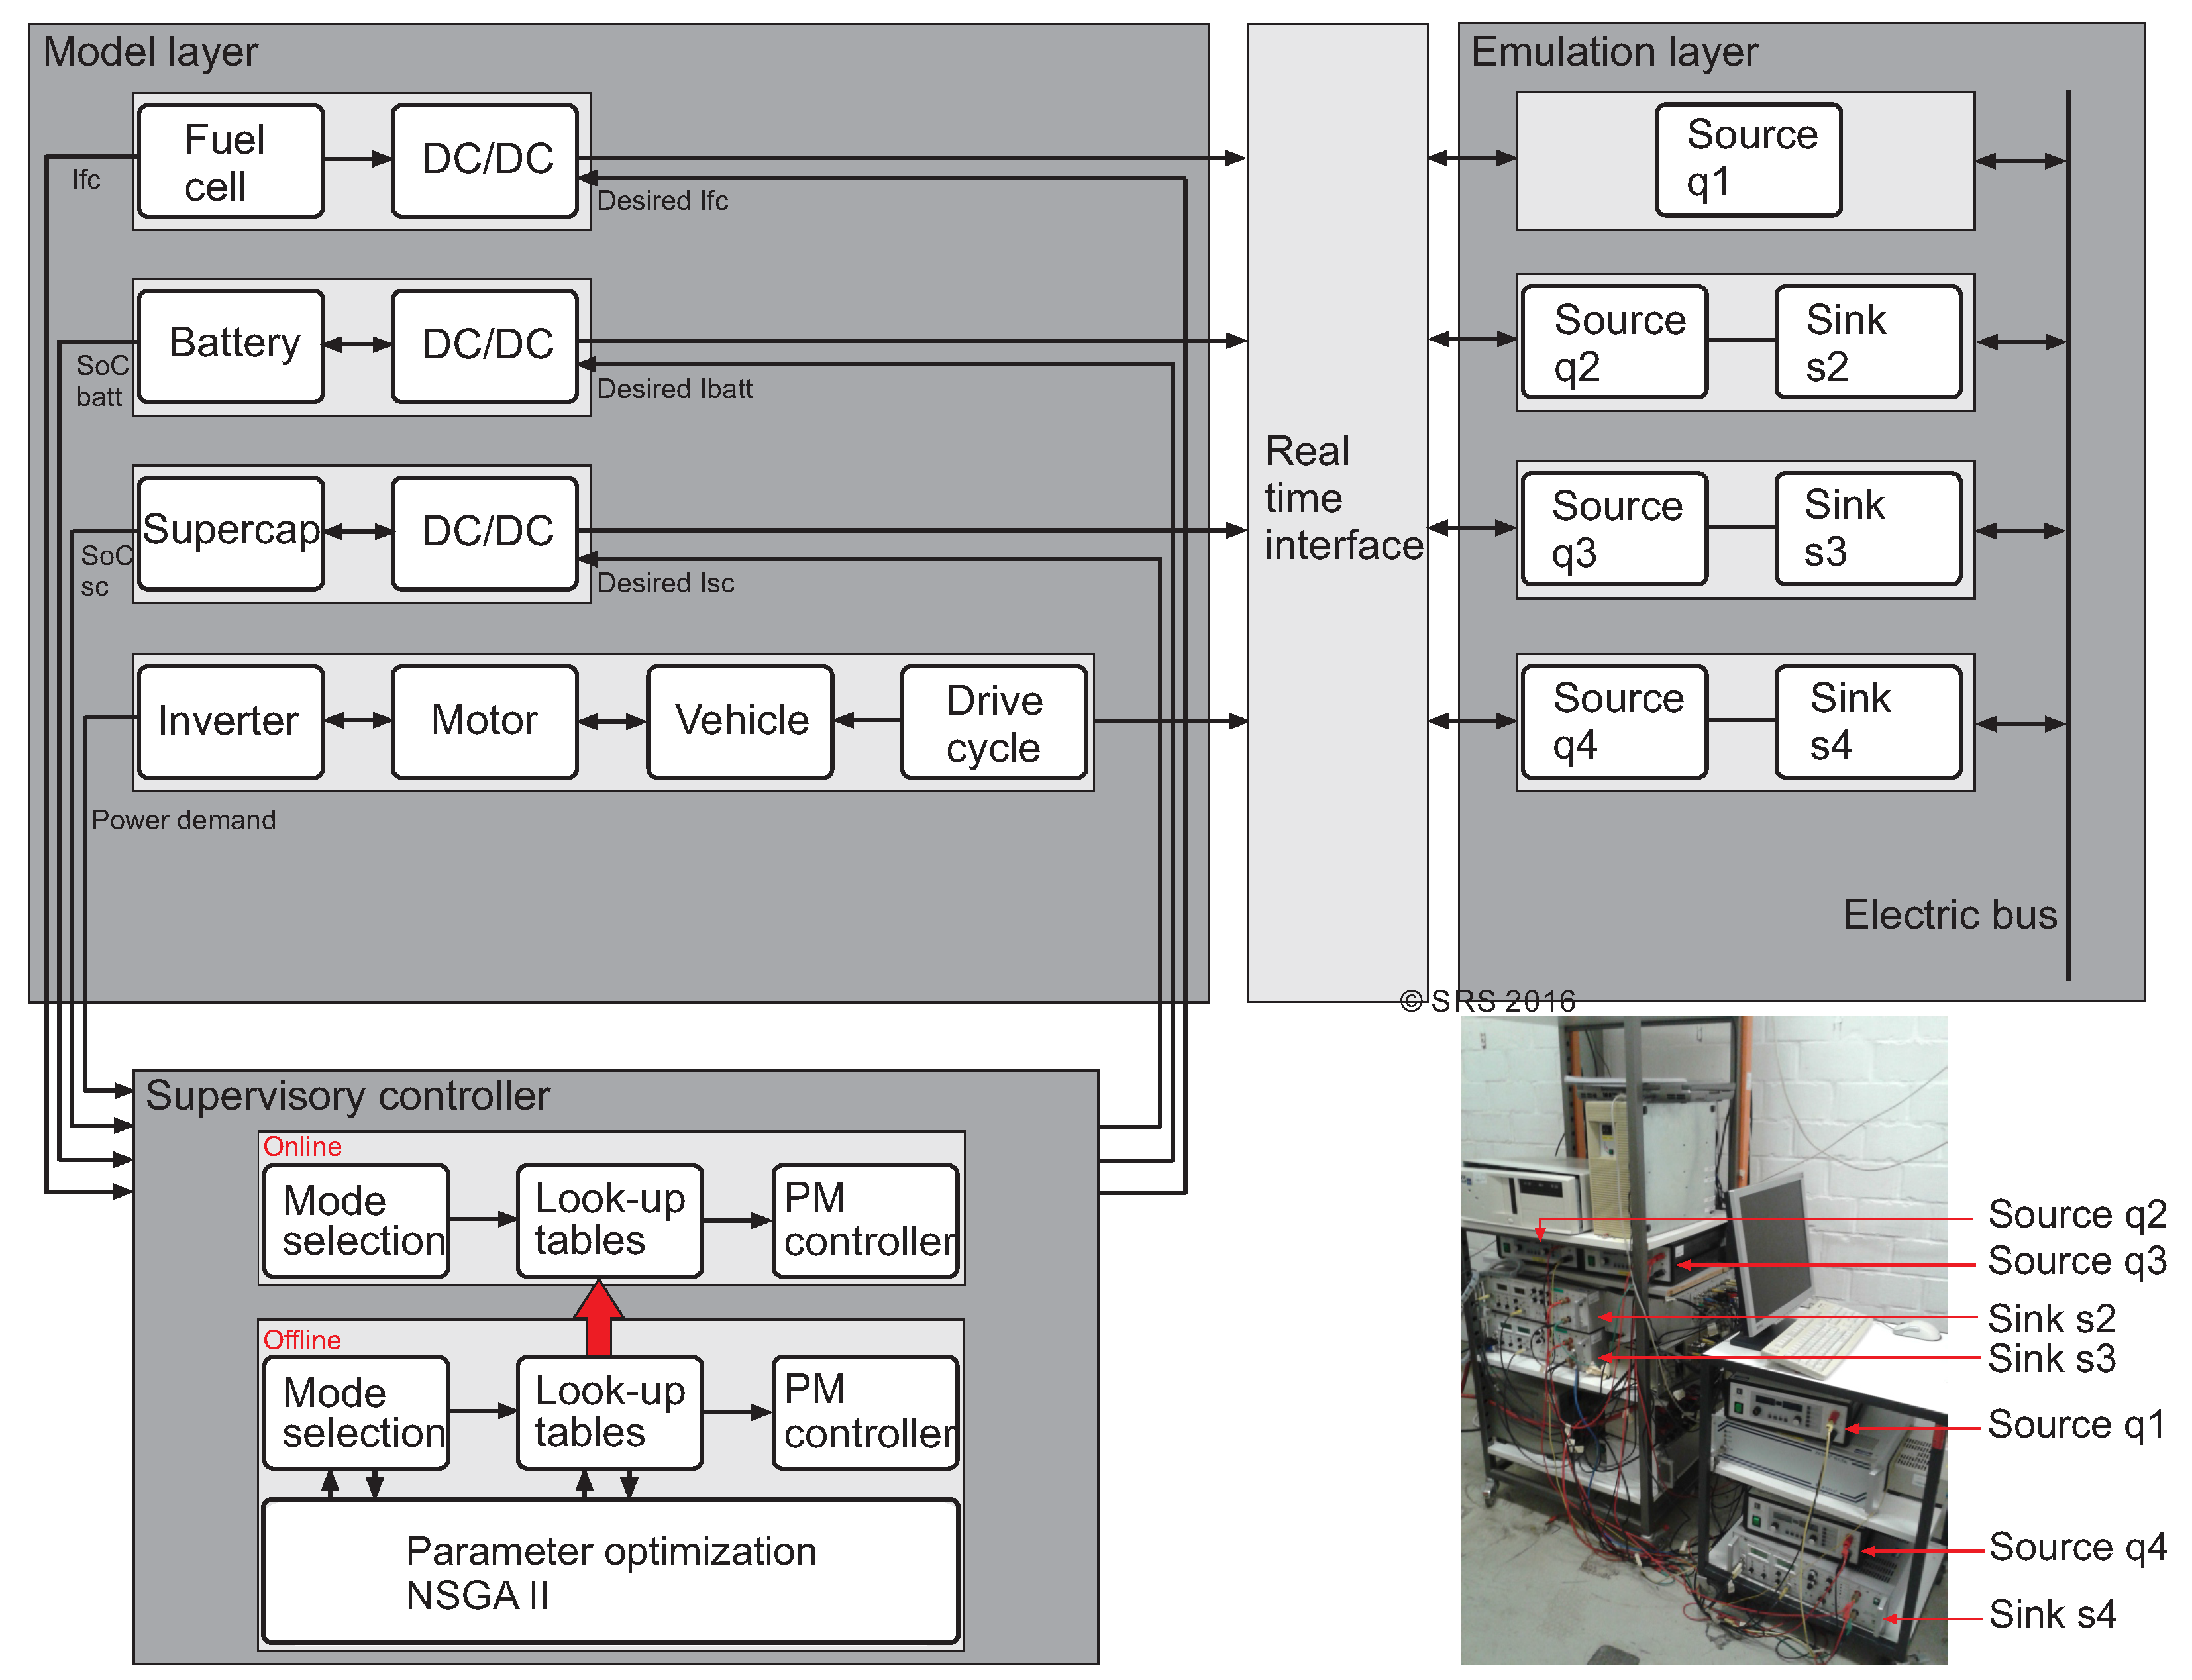
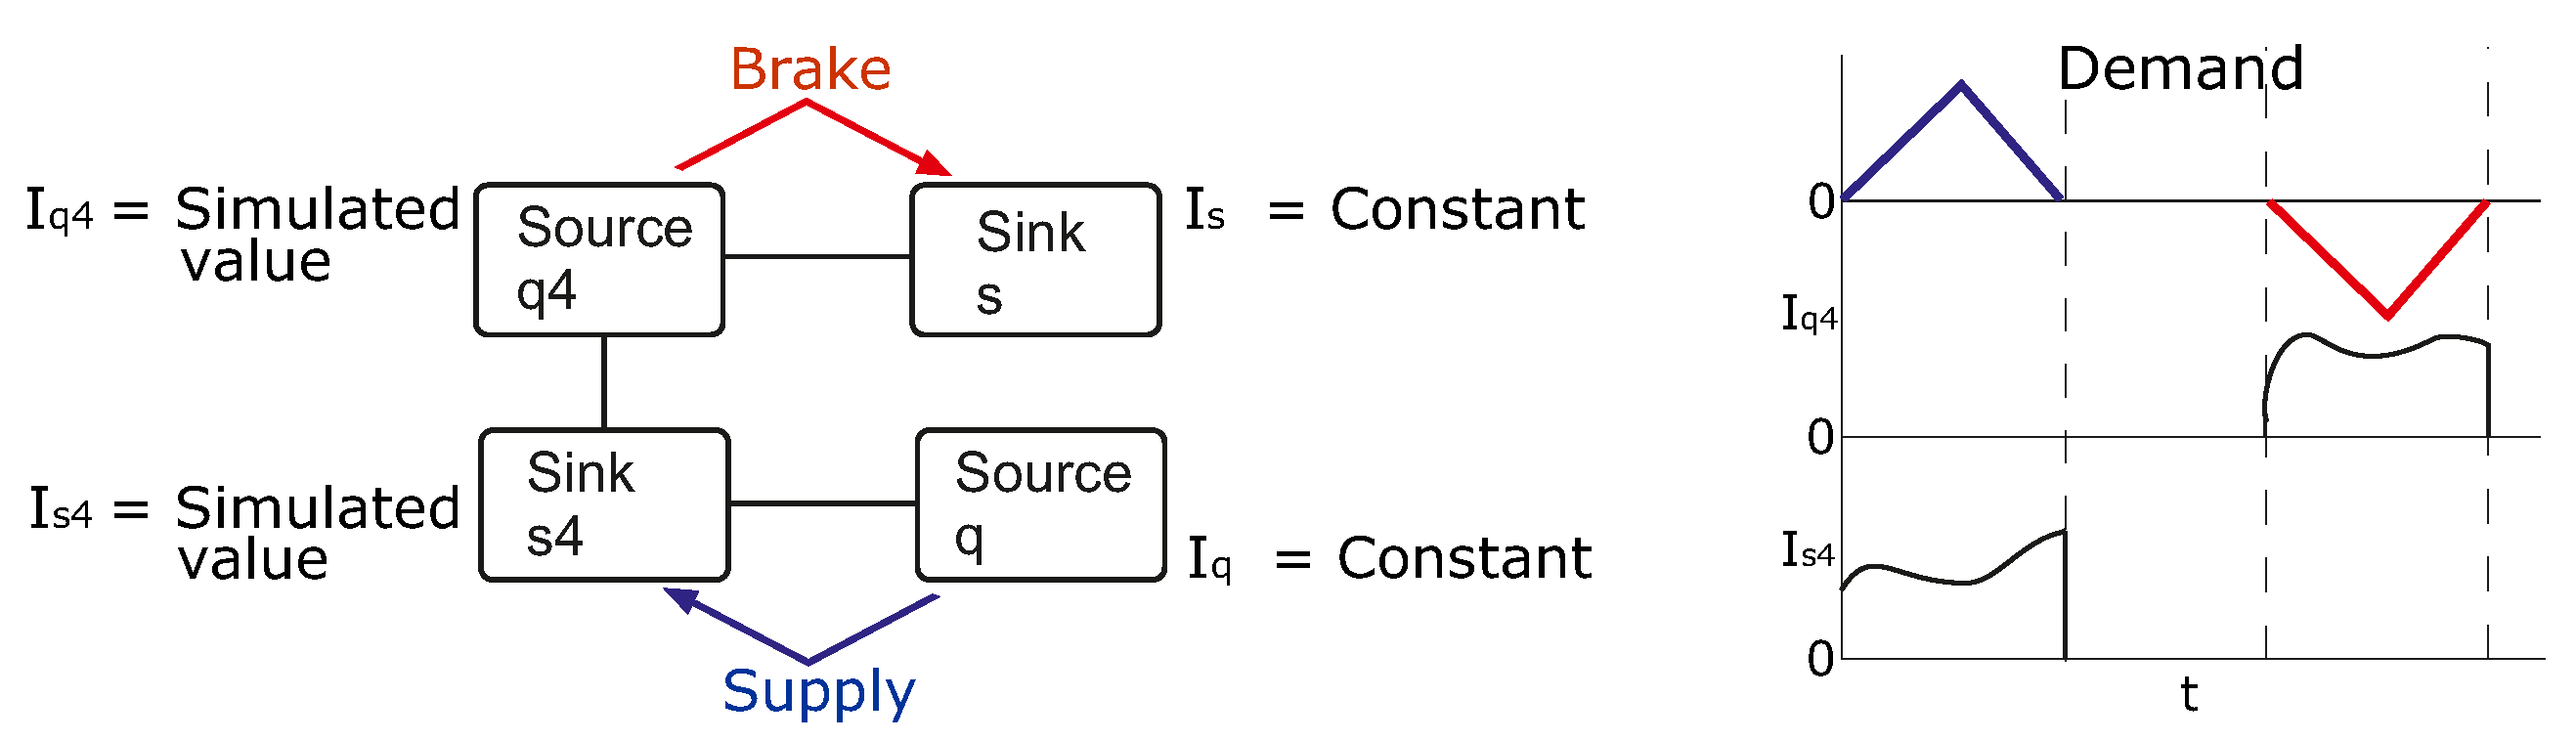
5. Powertrain Configuration with Emulated Components
6. Power Management and Optimization
- the required load demand is satisfied at all times,
- the rate of change of the battery and fuel cell current are limited to minimize aging effects,
- the battery current is bound, and the remaining, more dynamic peaks are taken over by the supercapacitor,
- the fuel cell is operated near its optimal range,
- the battery and supercapacitor are never fully charged nor fully discharged,
- the fuel cell delivers maximum power when the SoCs of both the battery and supercapacitor are too low, and
- the bus voltage is held constant to a reference value.
6.1. Details of the Supervisory Controller
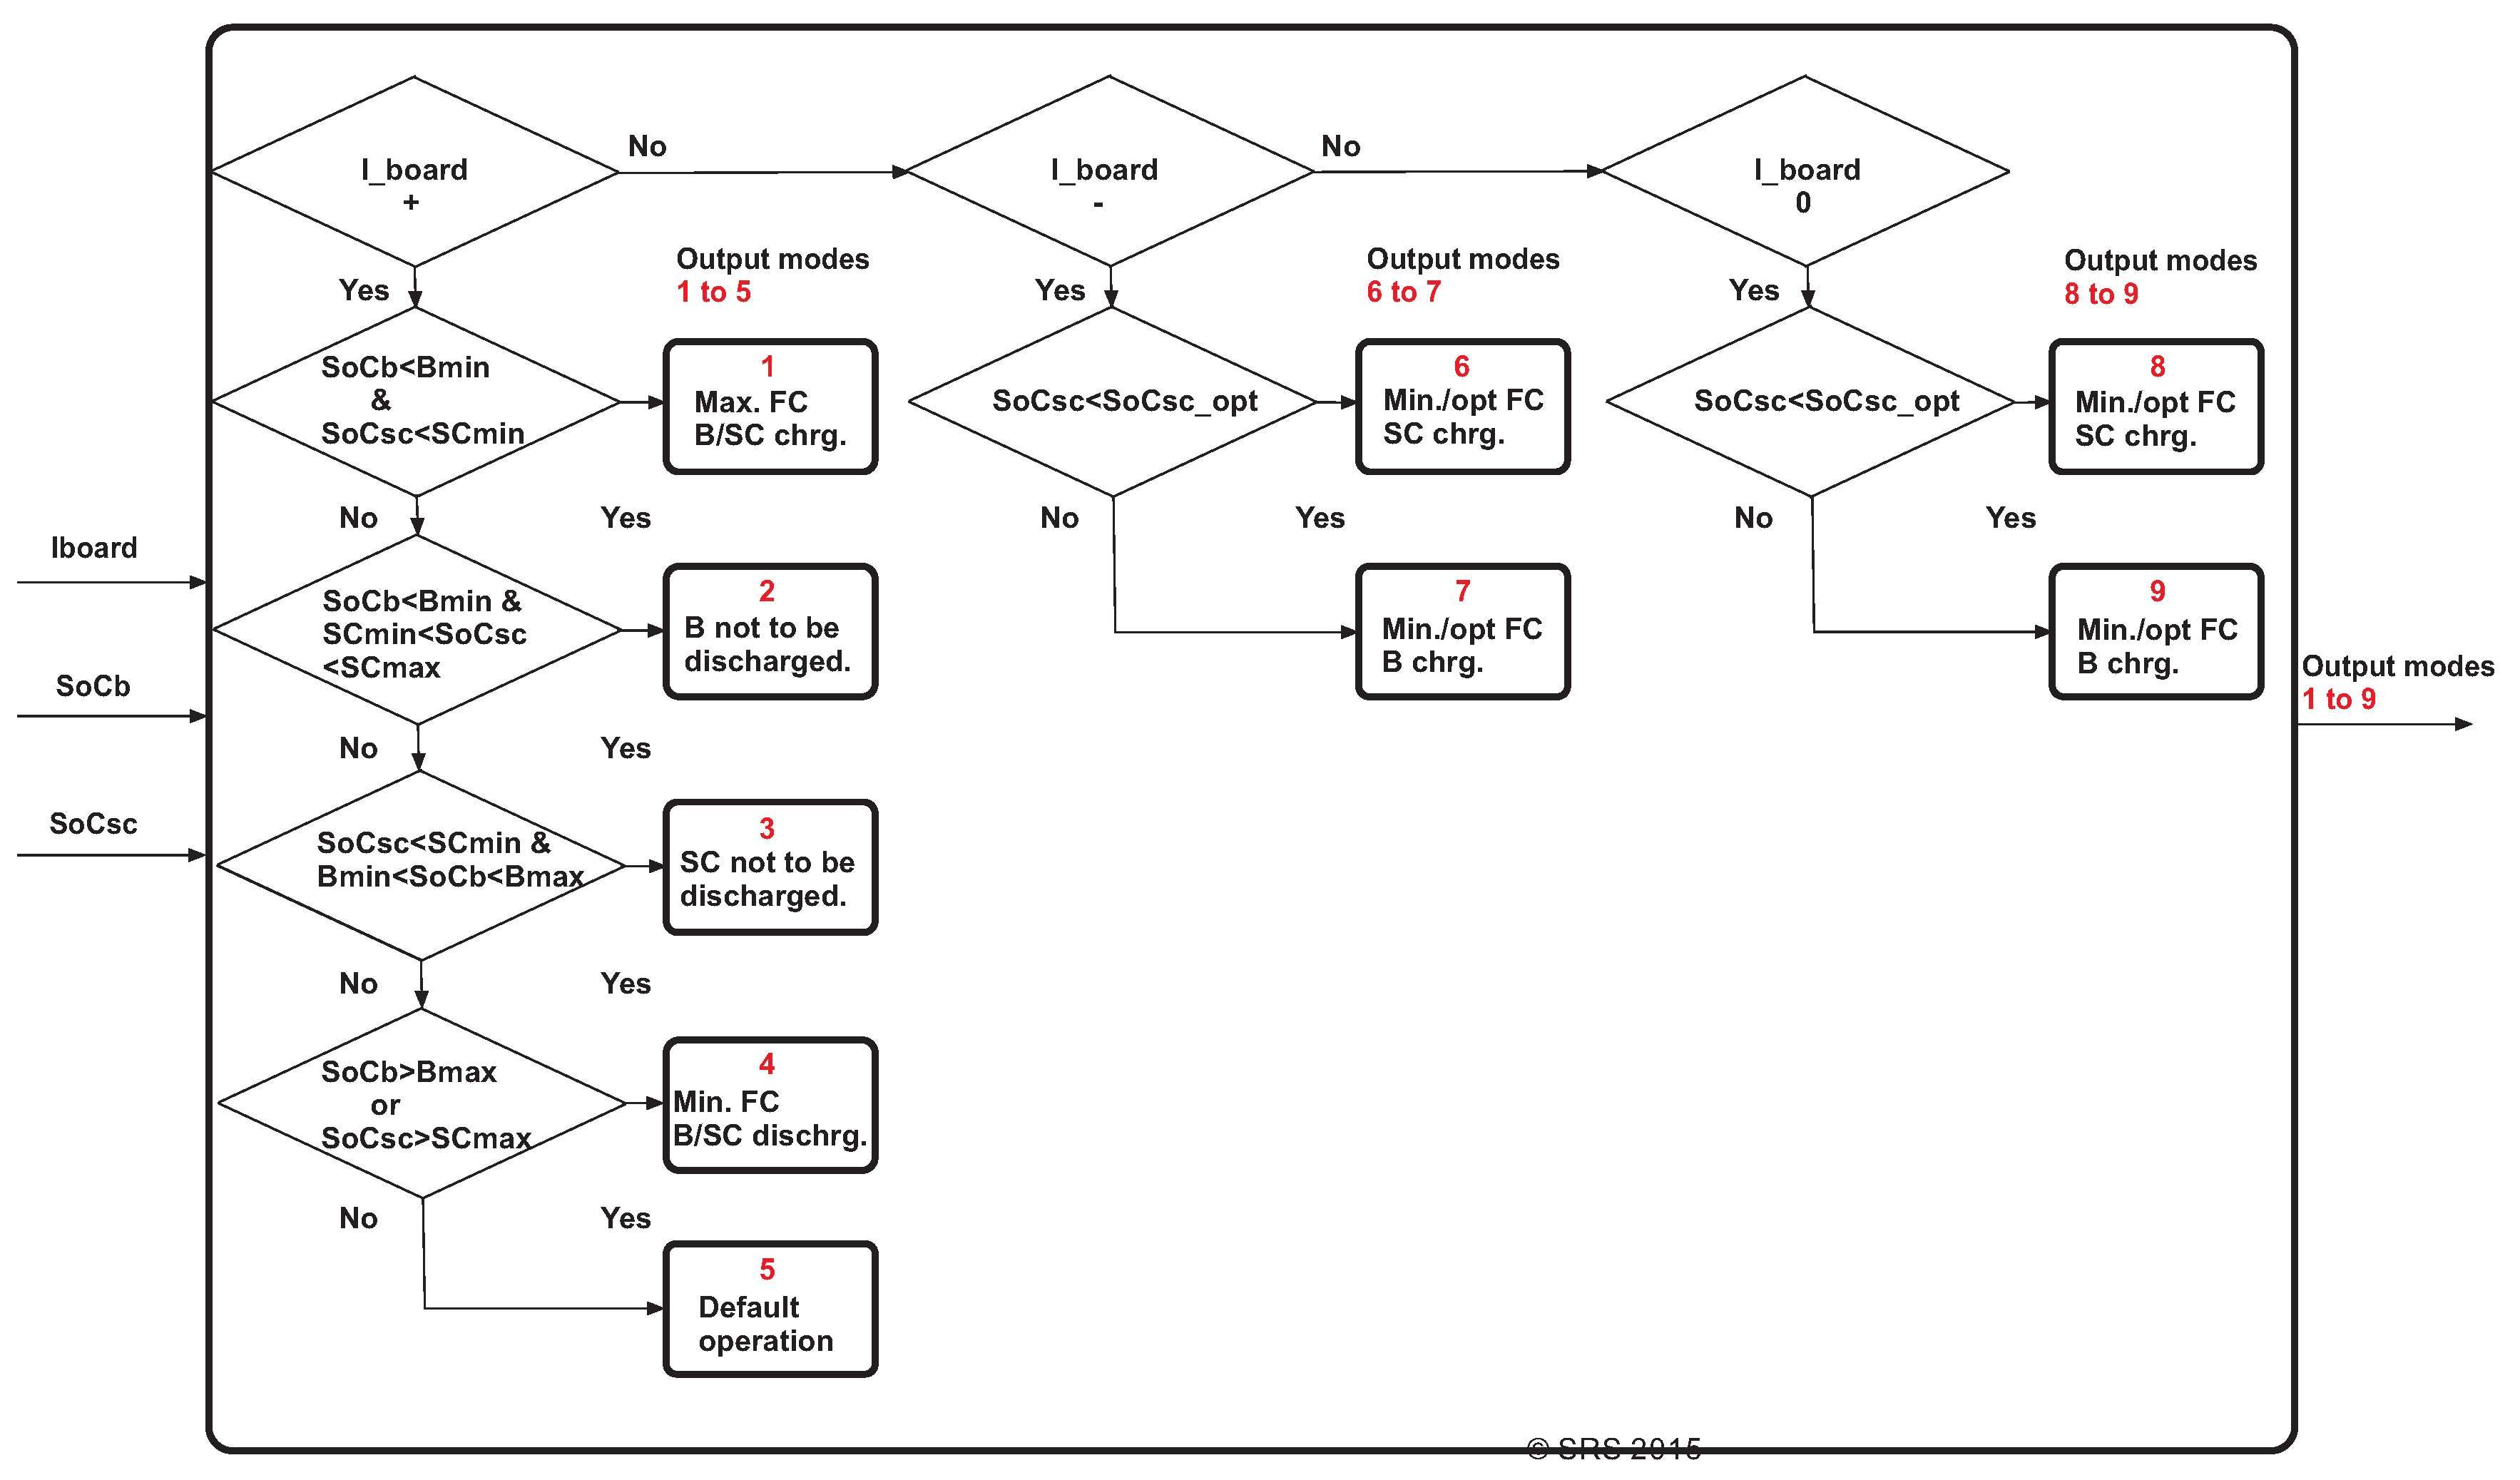
6.1.1. Mode Selection Block
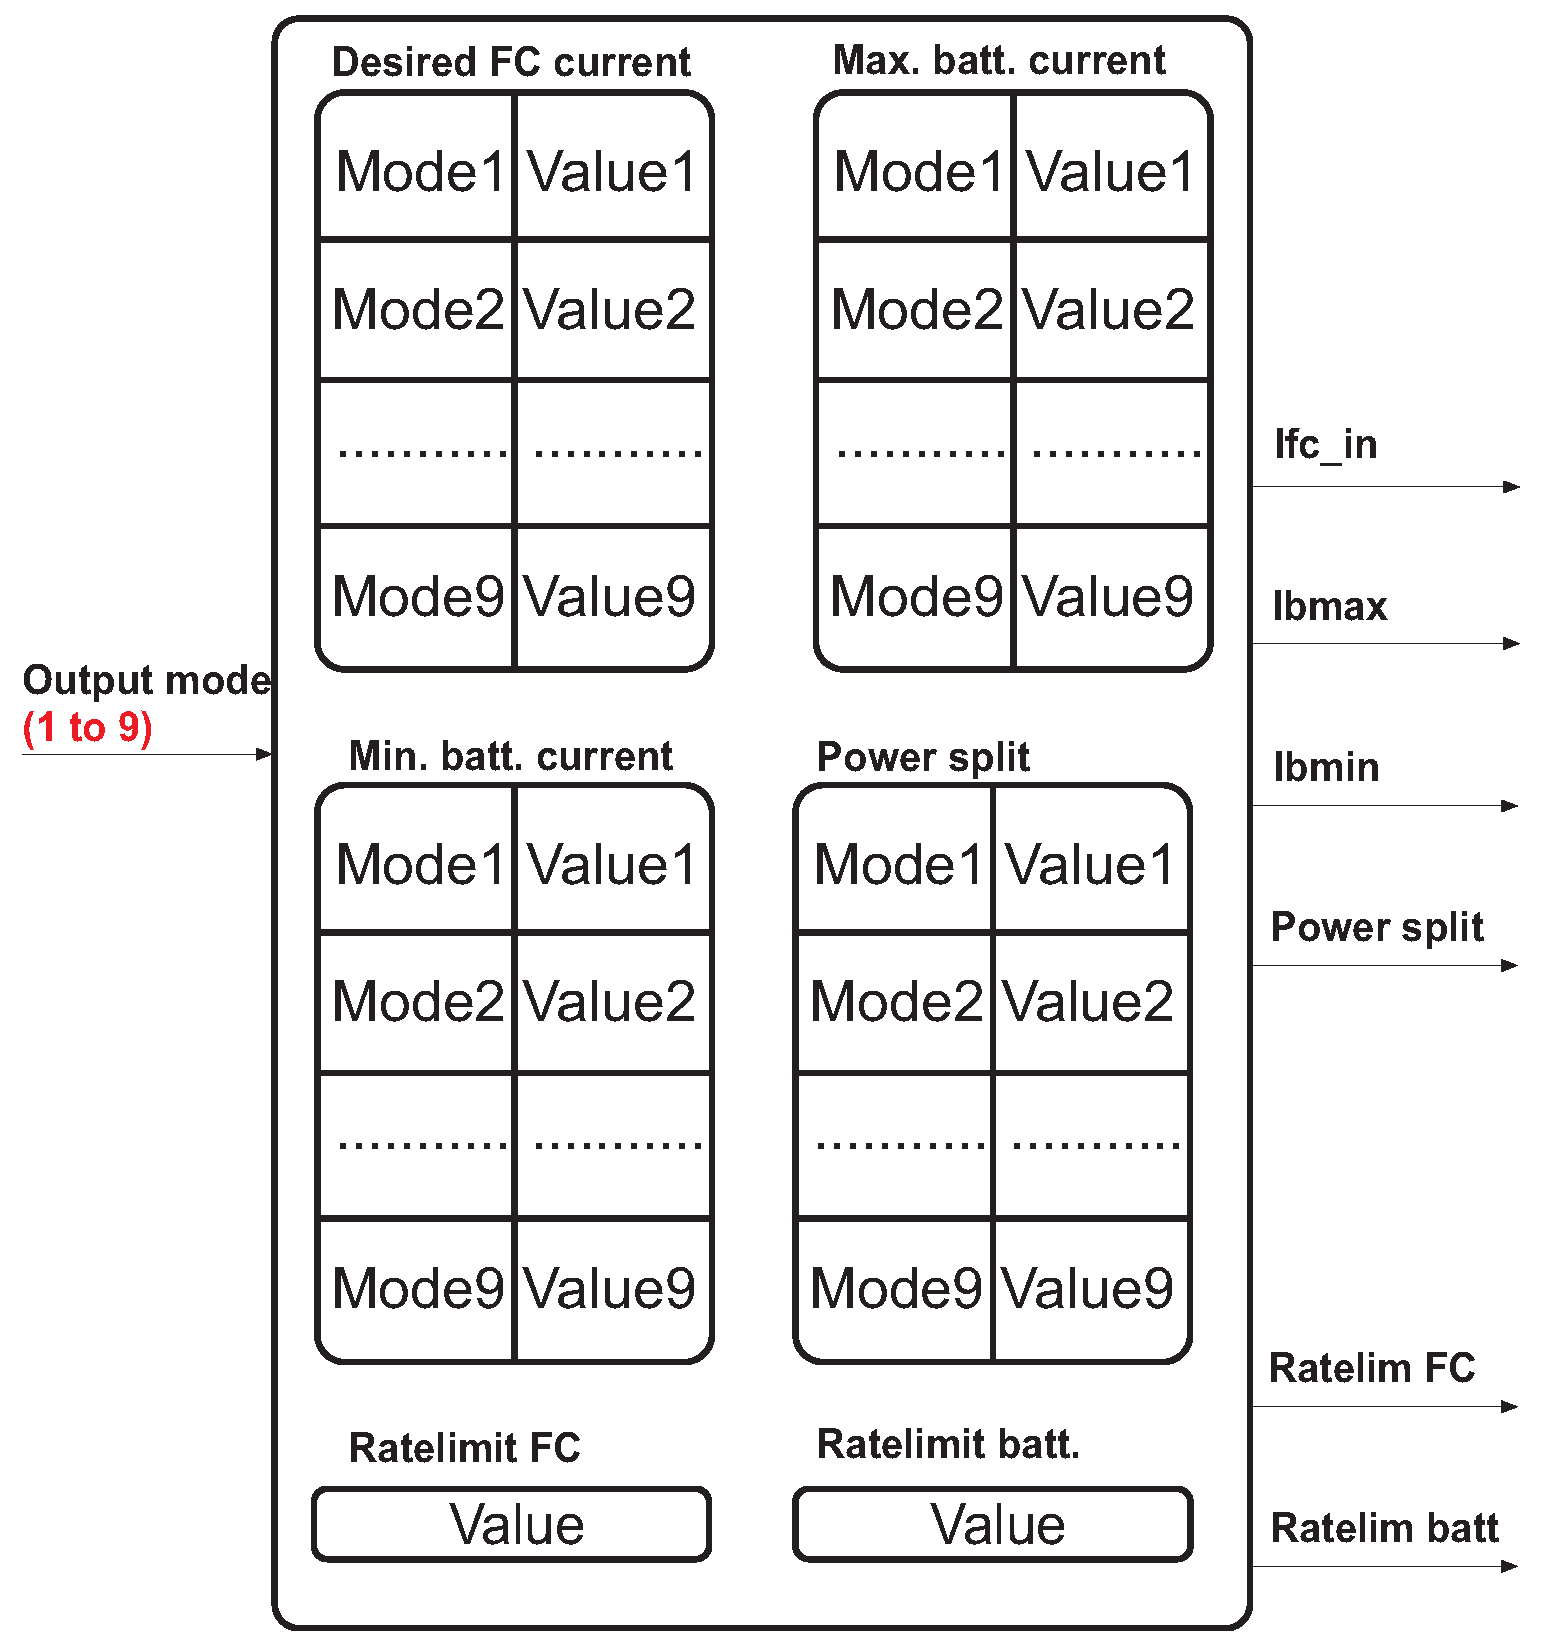
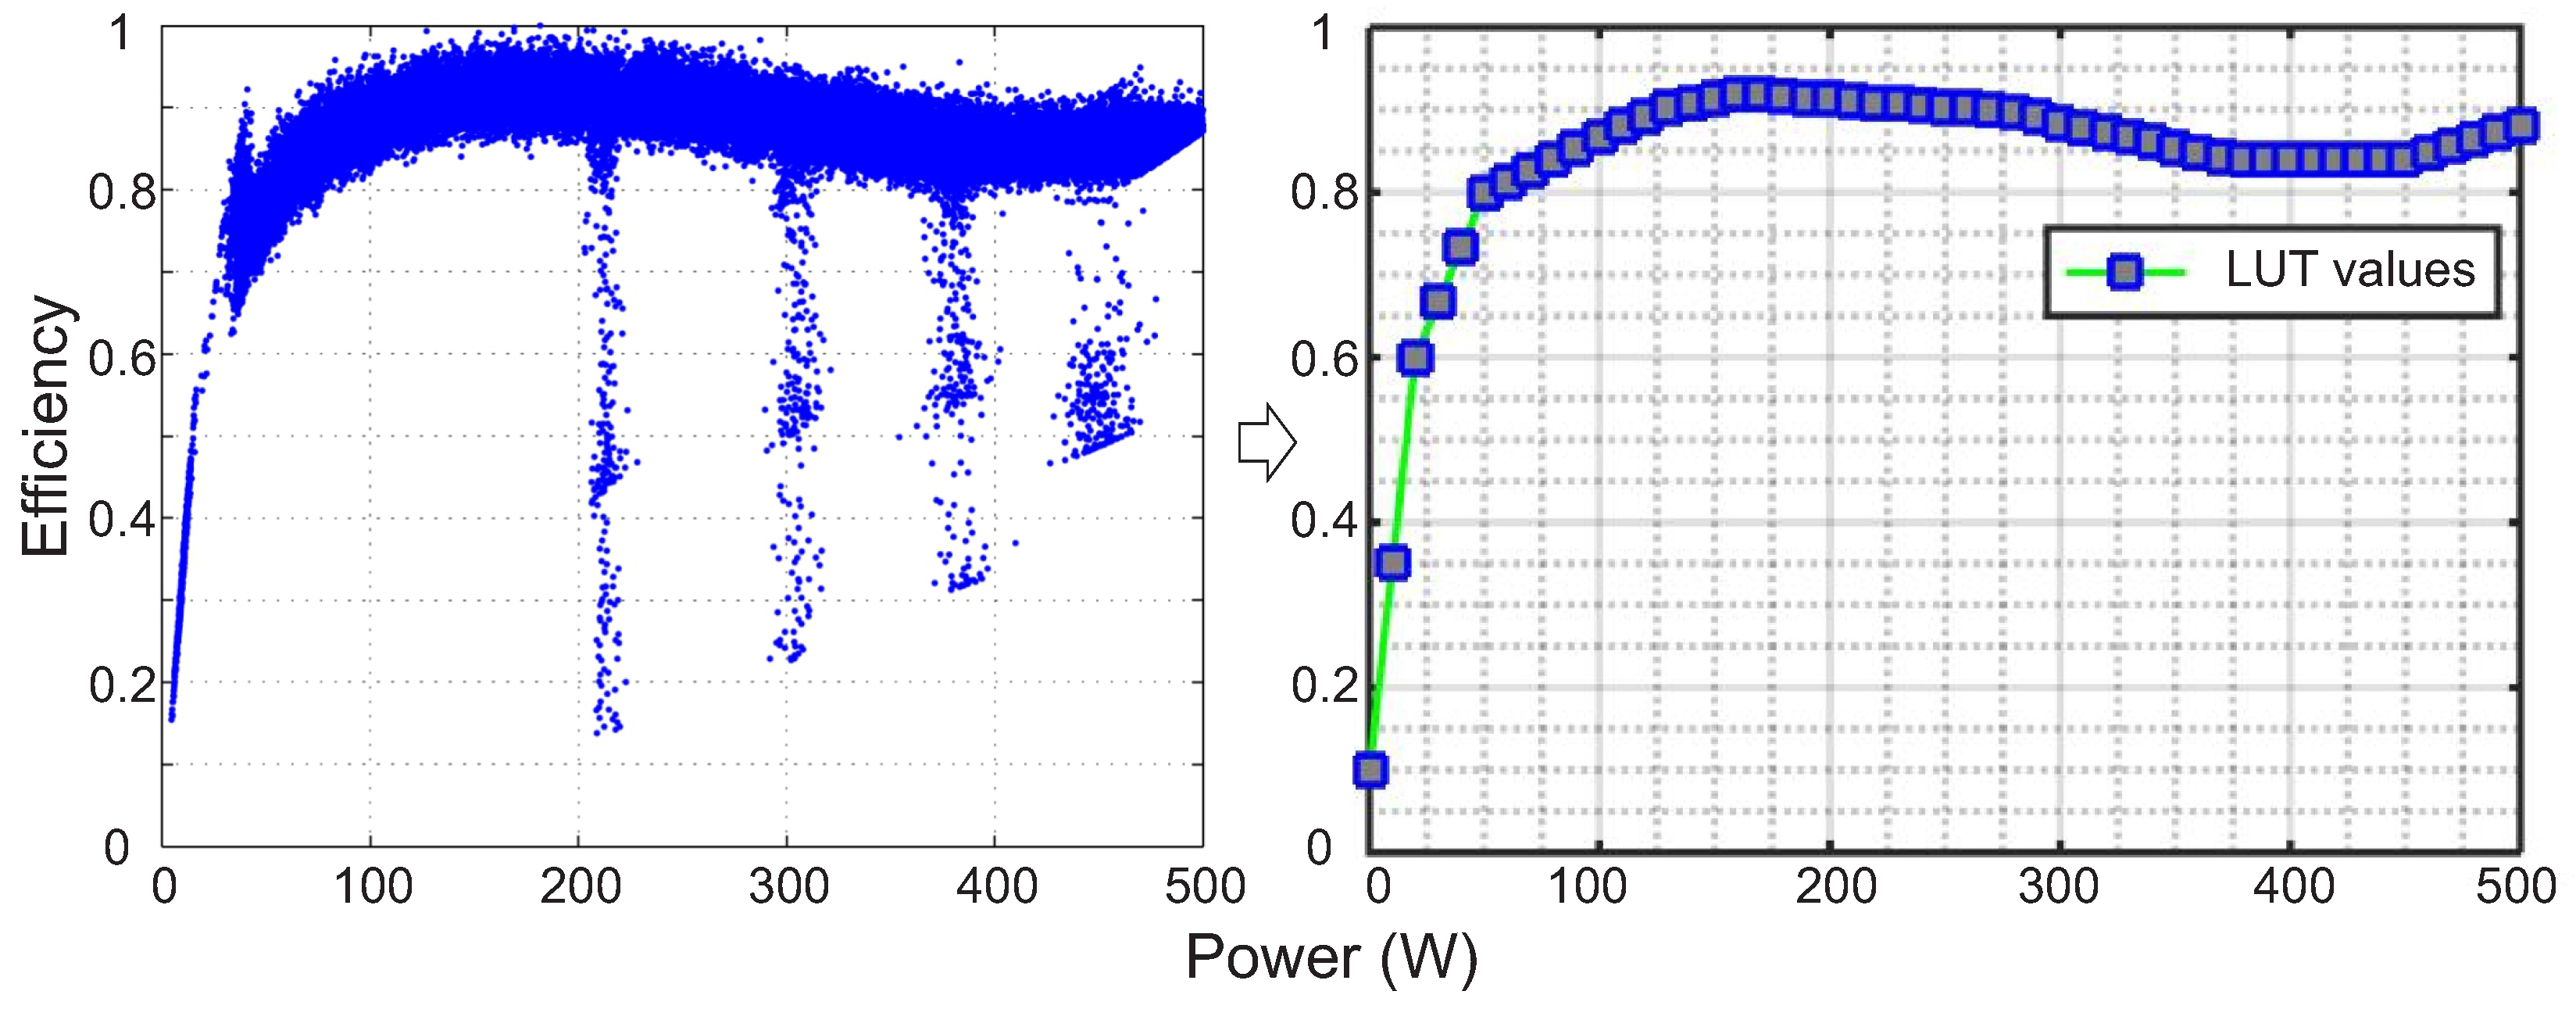
6.1.2. Look-Up Table Block
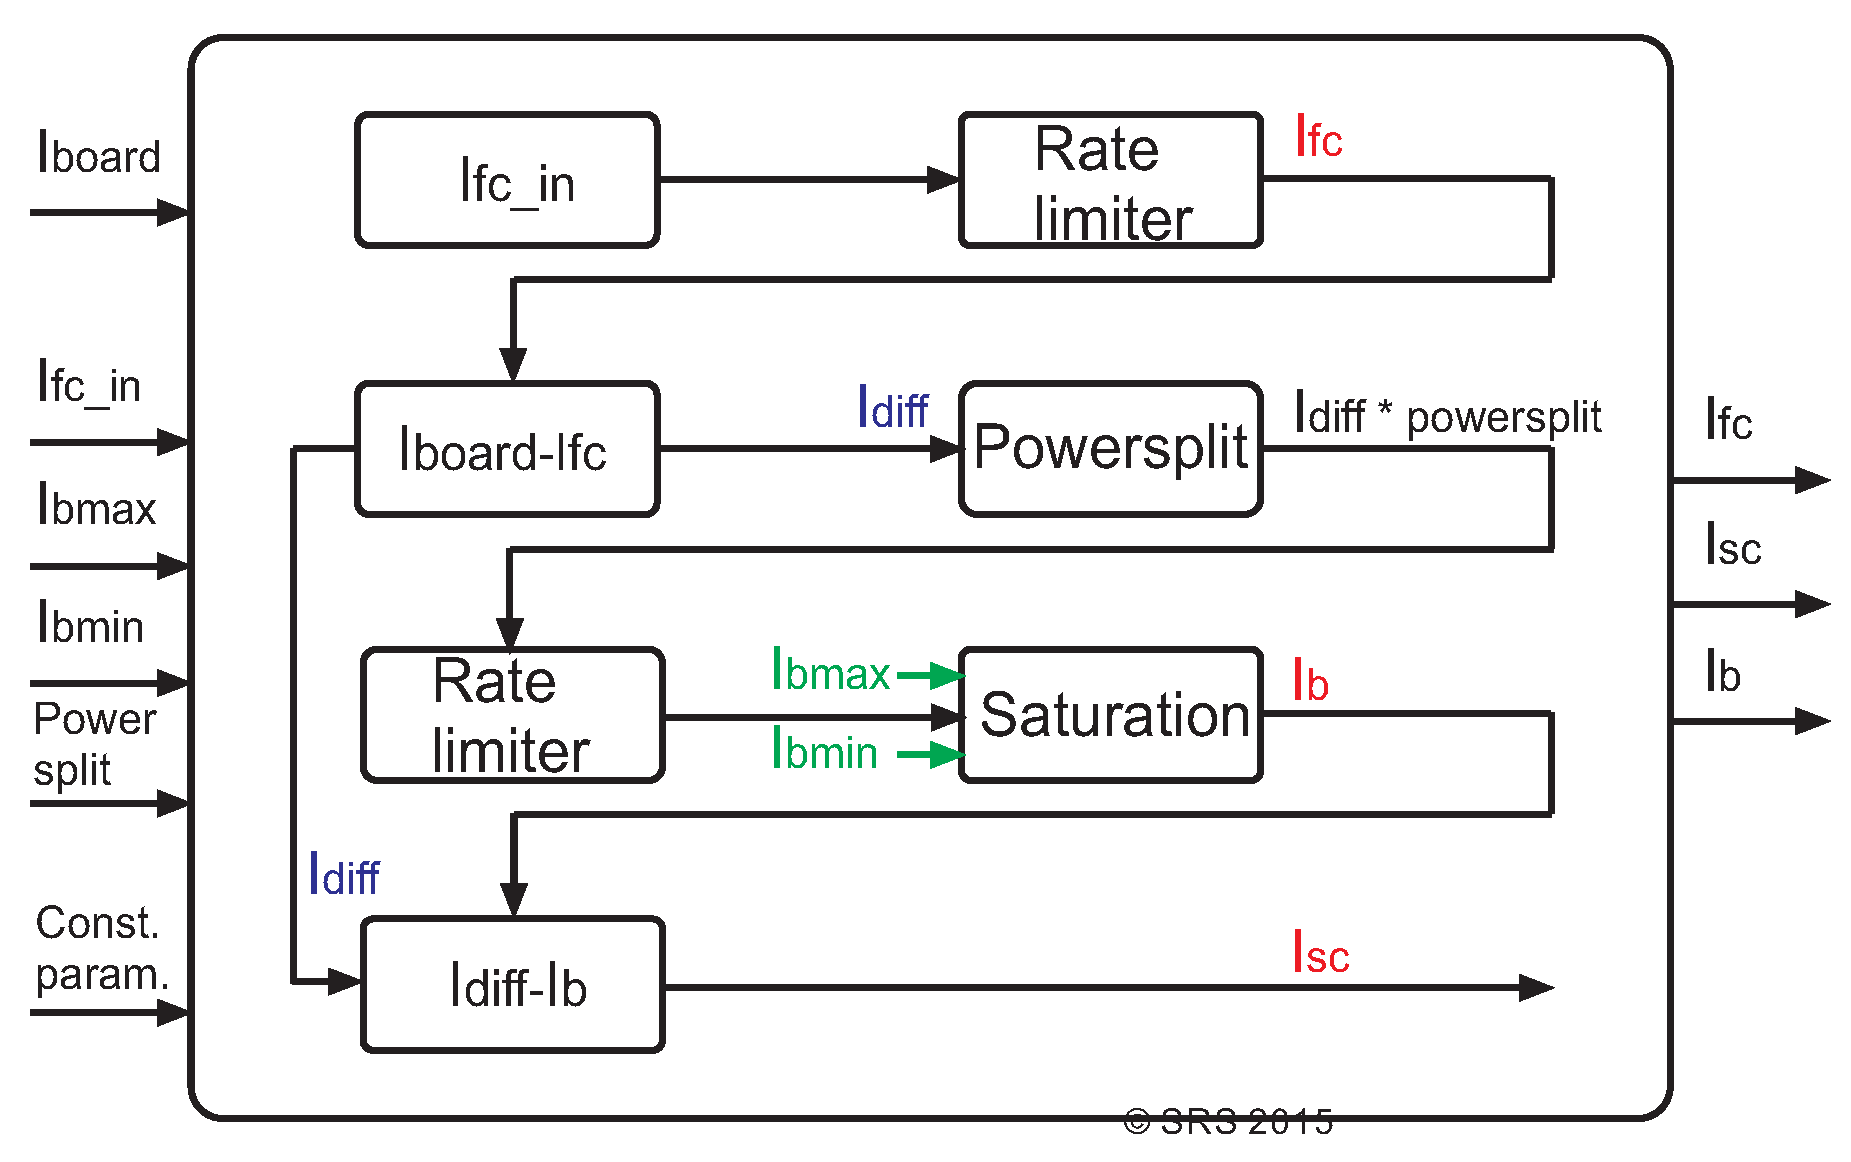
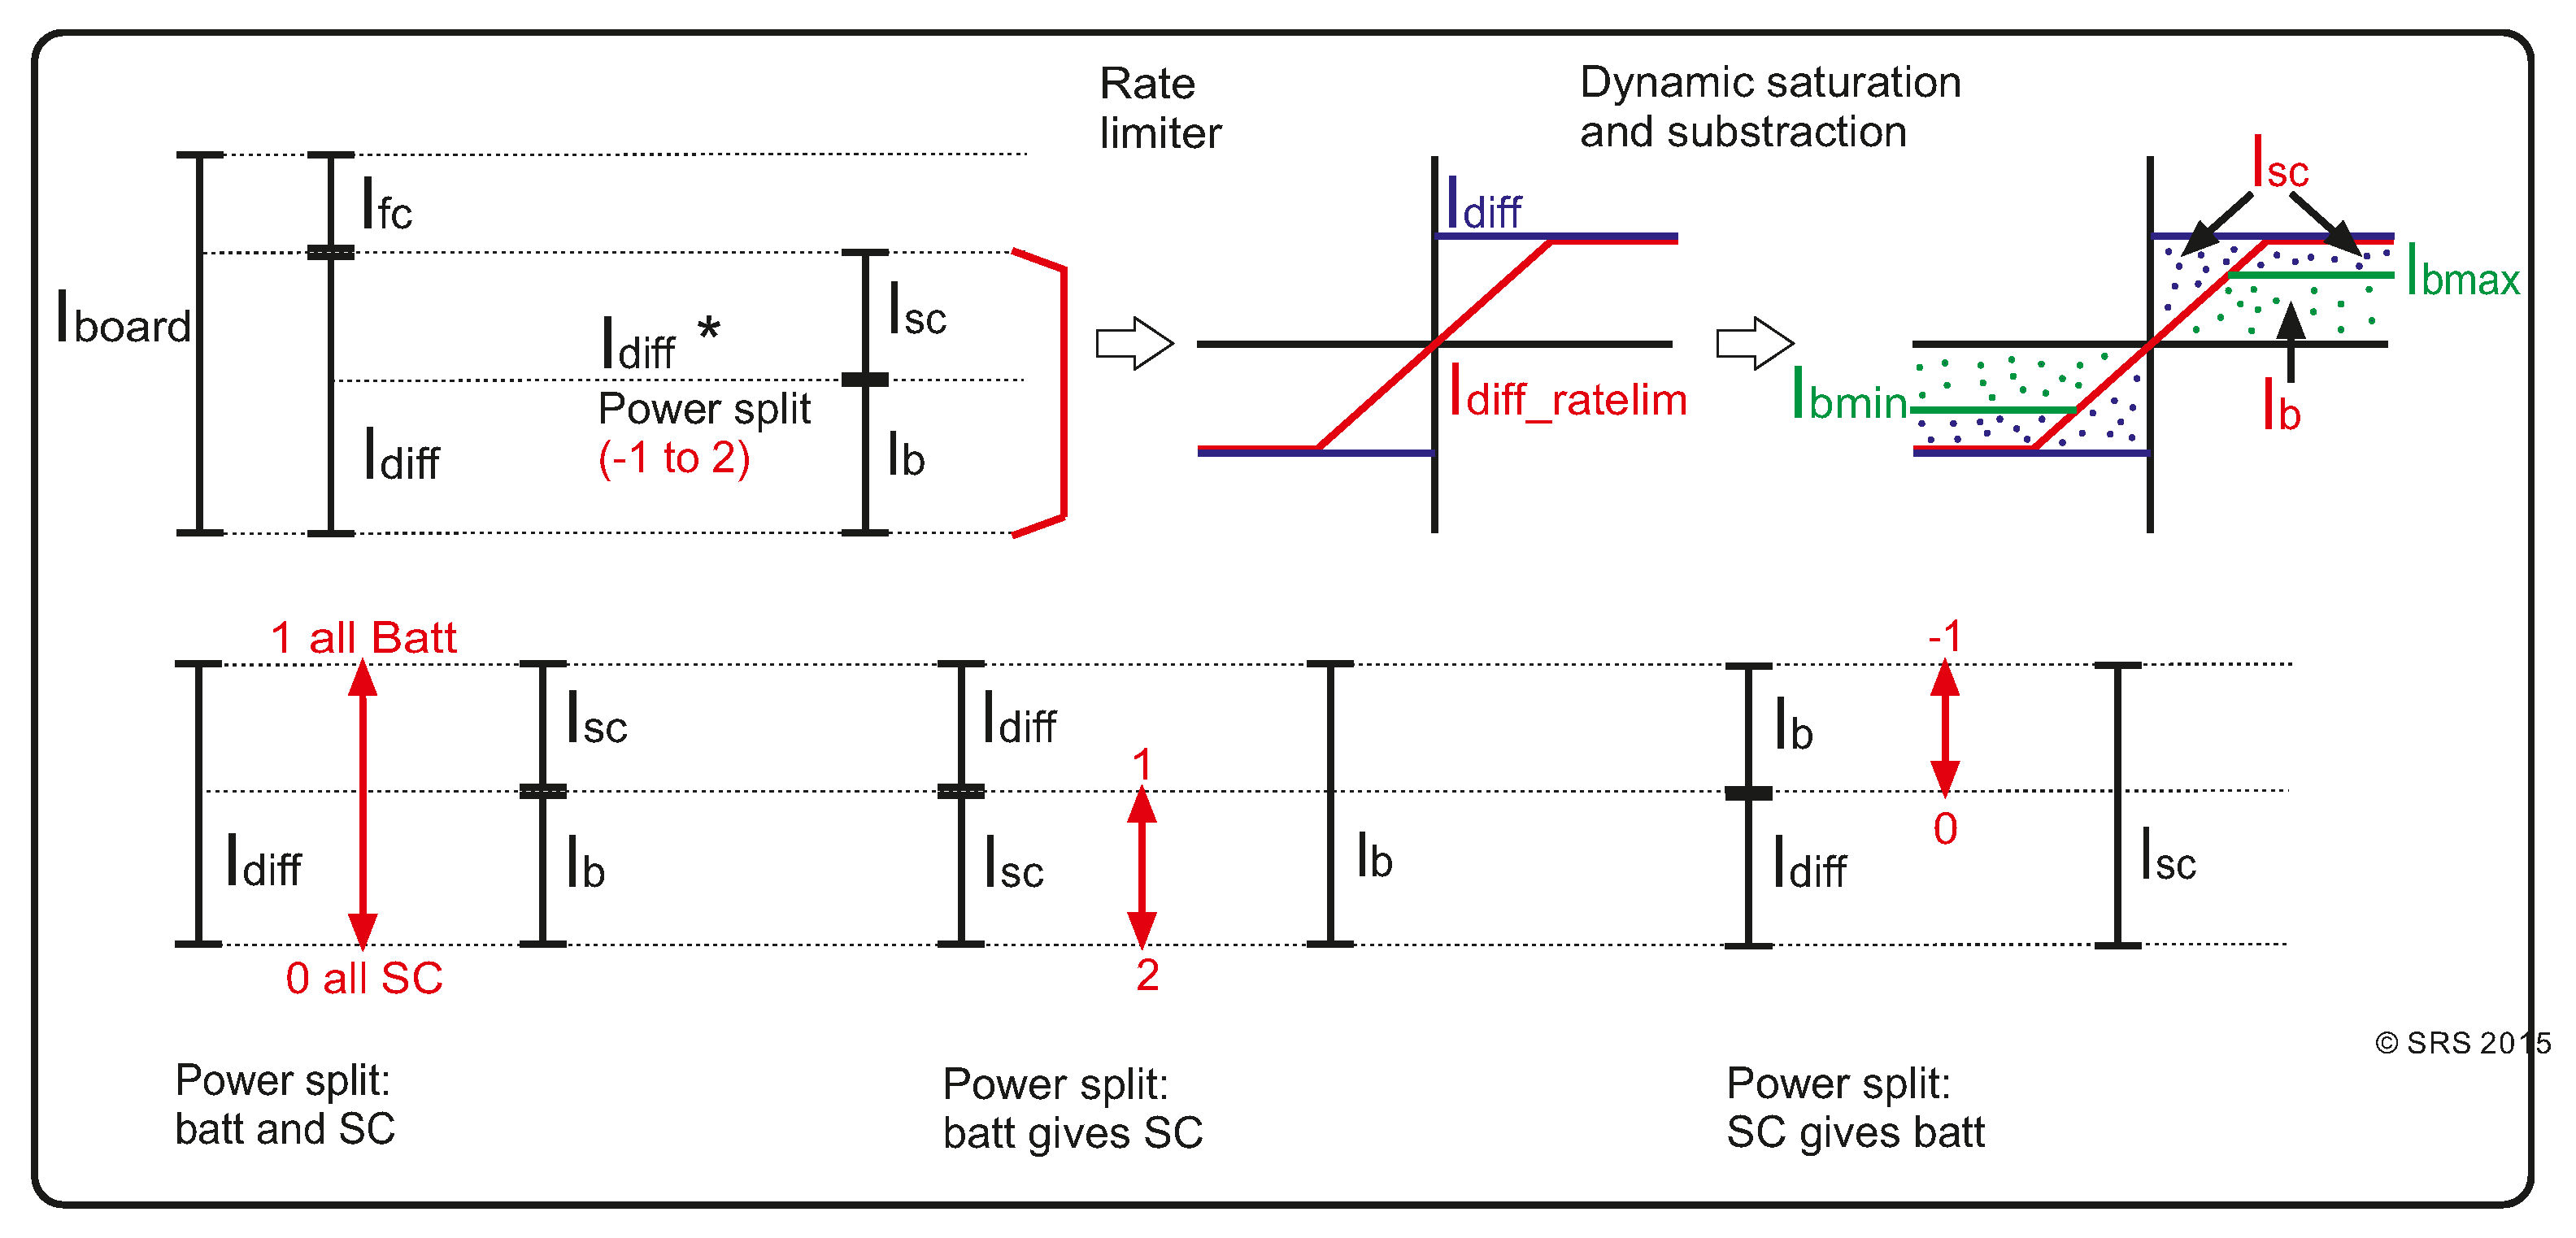
6.1.3. PM Controller Block
6.2. Optimization as a Decoupled Process
Optimization Goals and Constraints
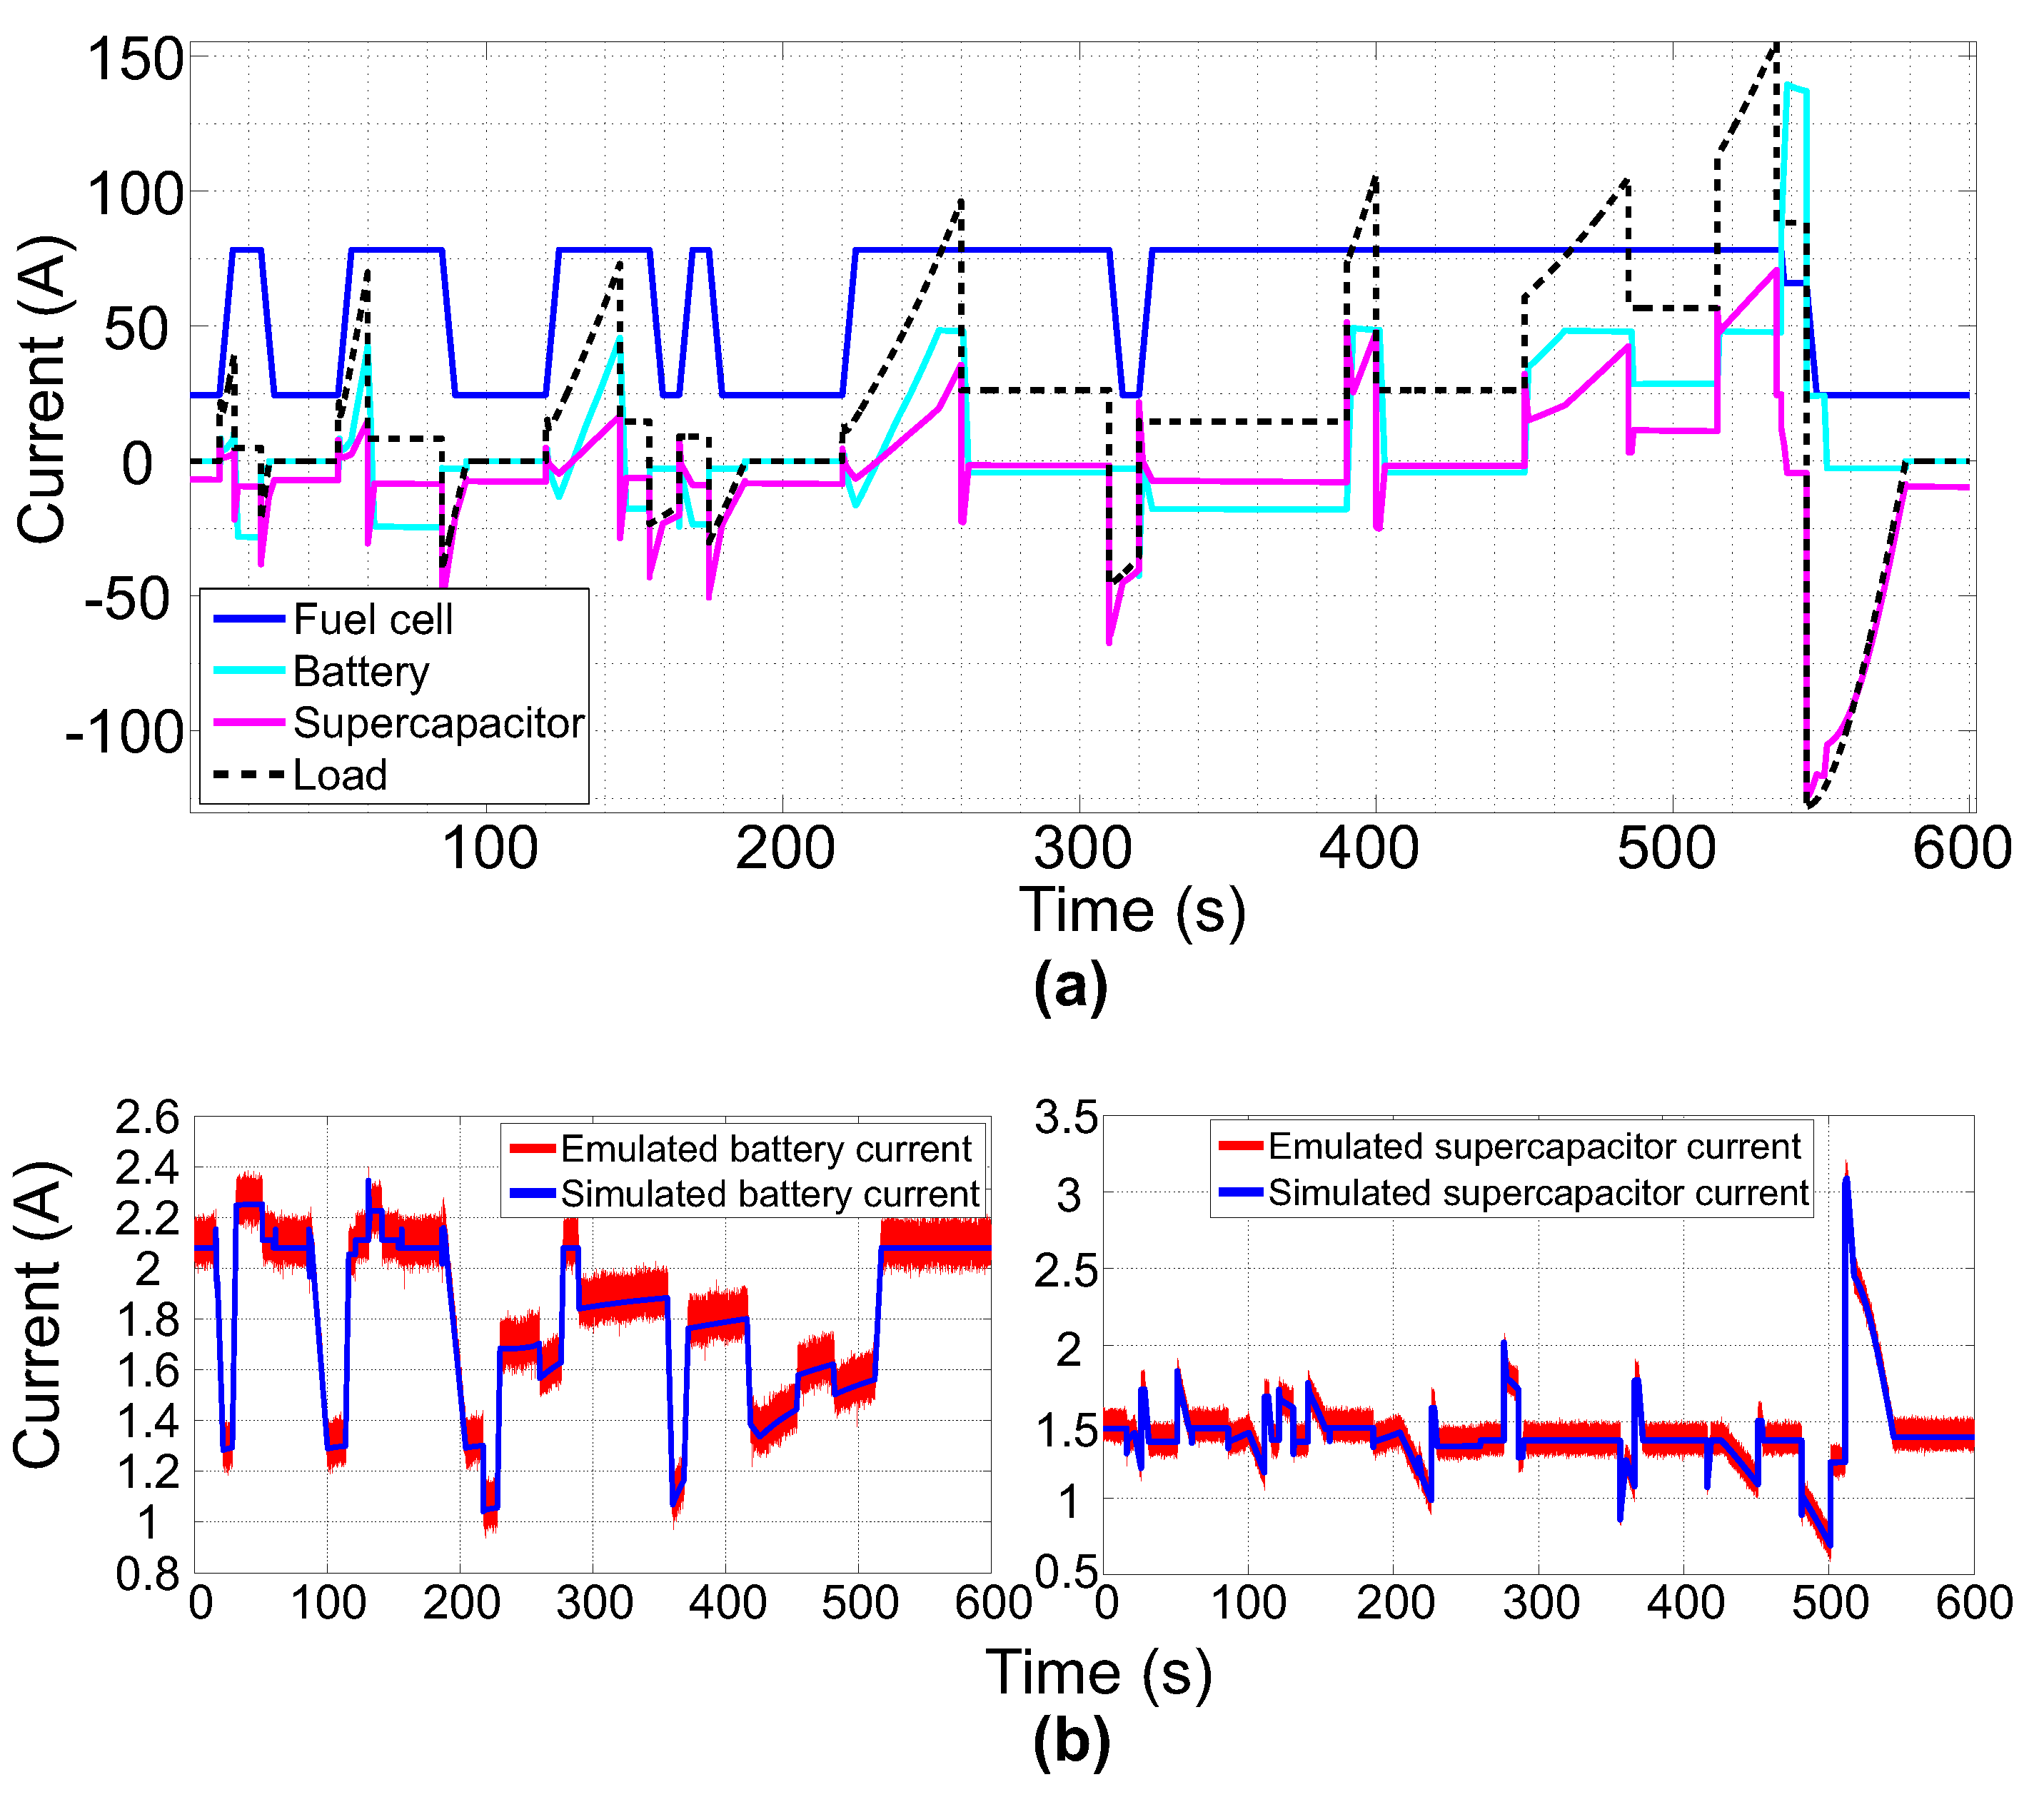
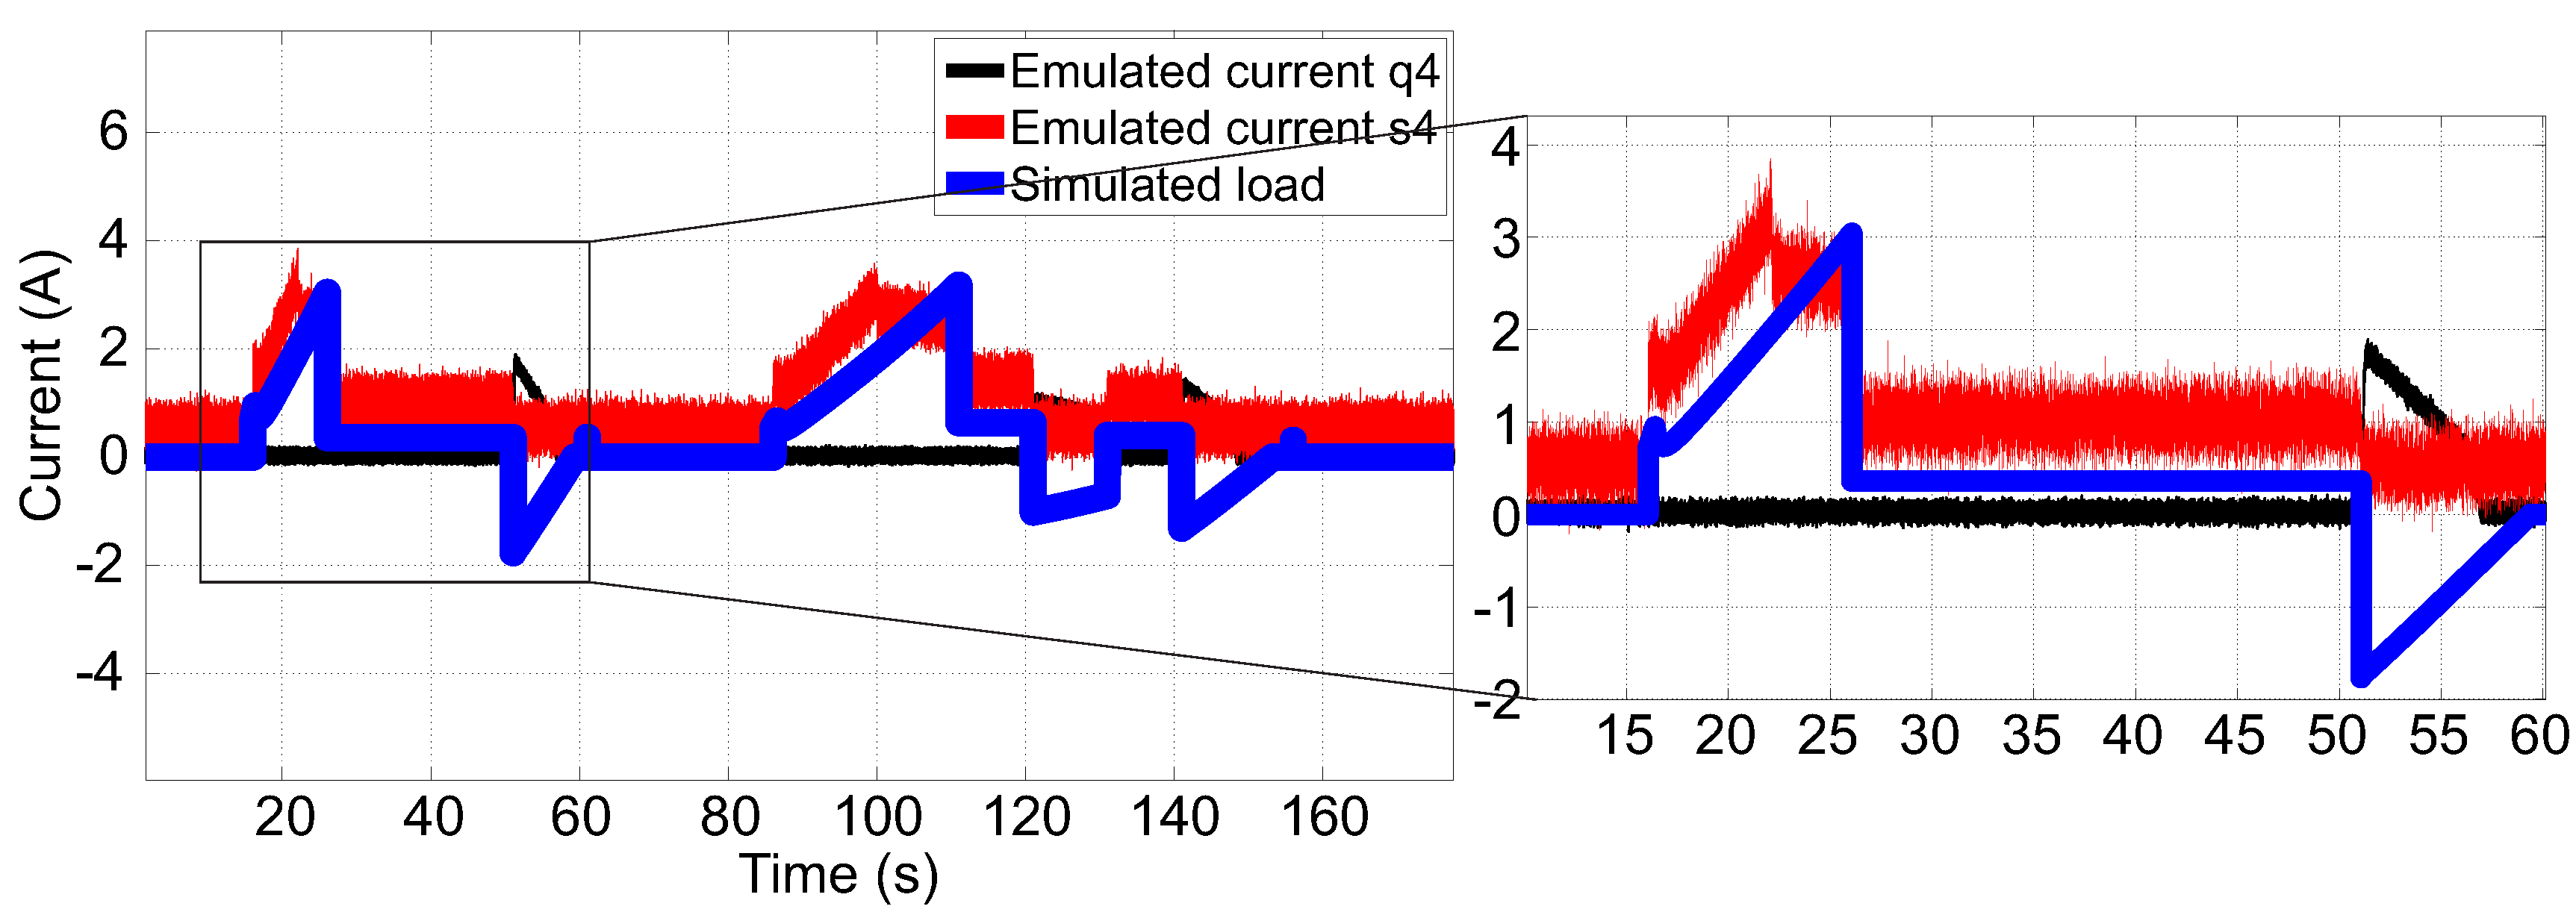
7. Simulated and Emulated Results
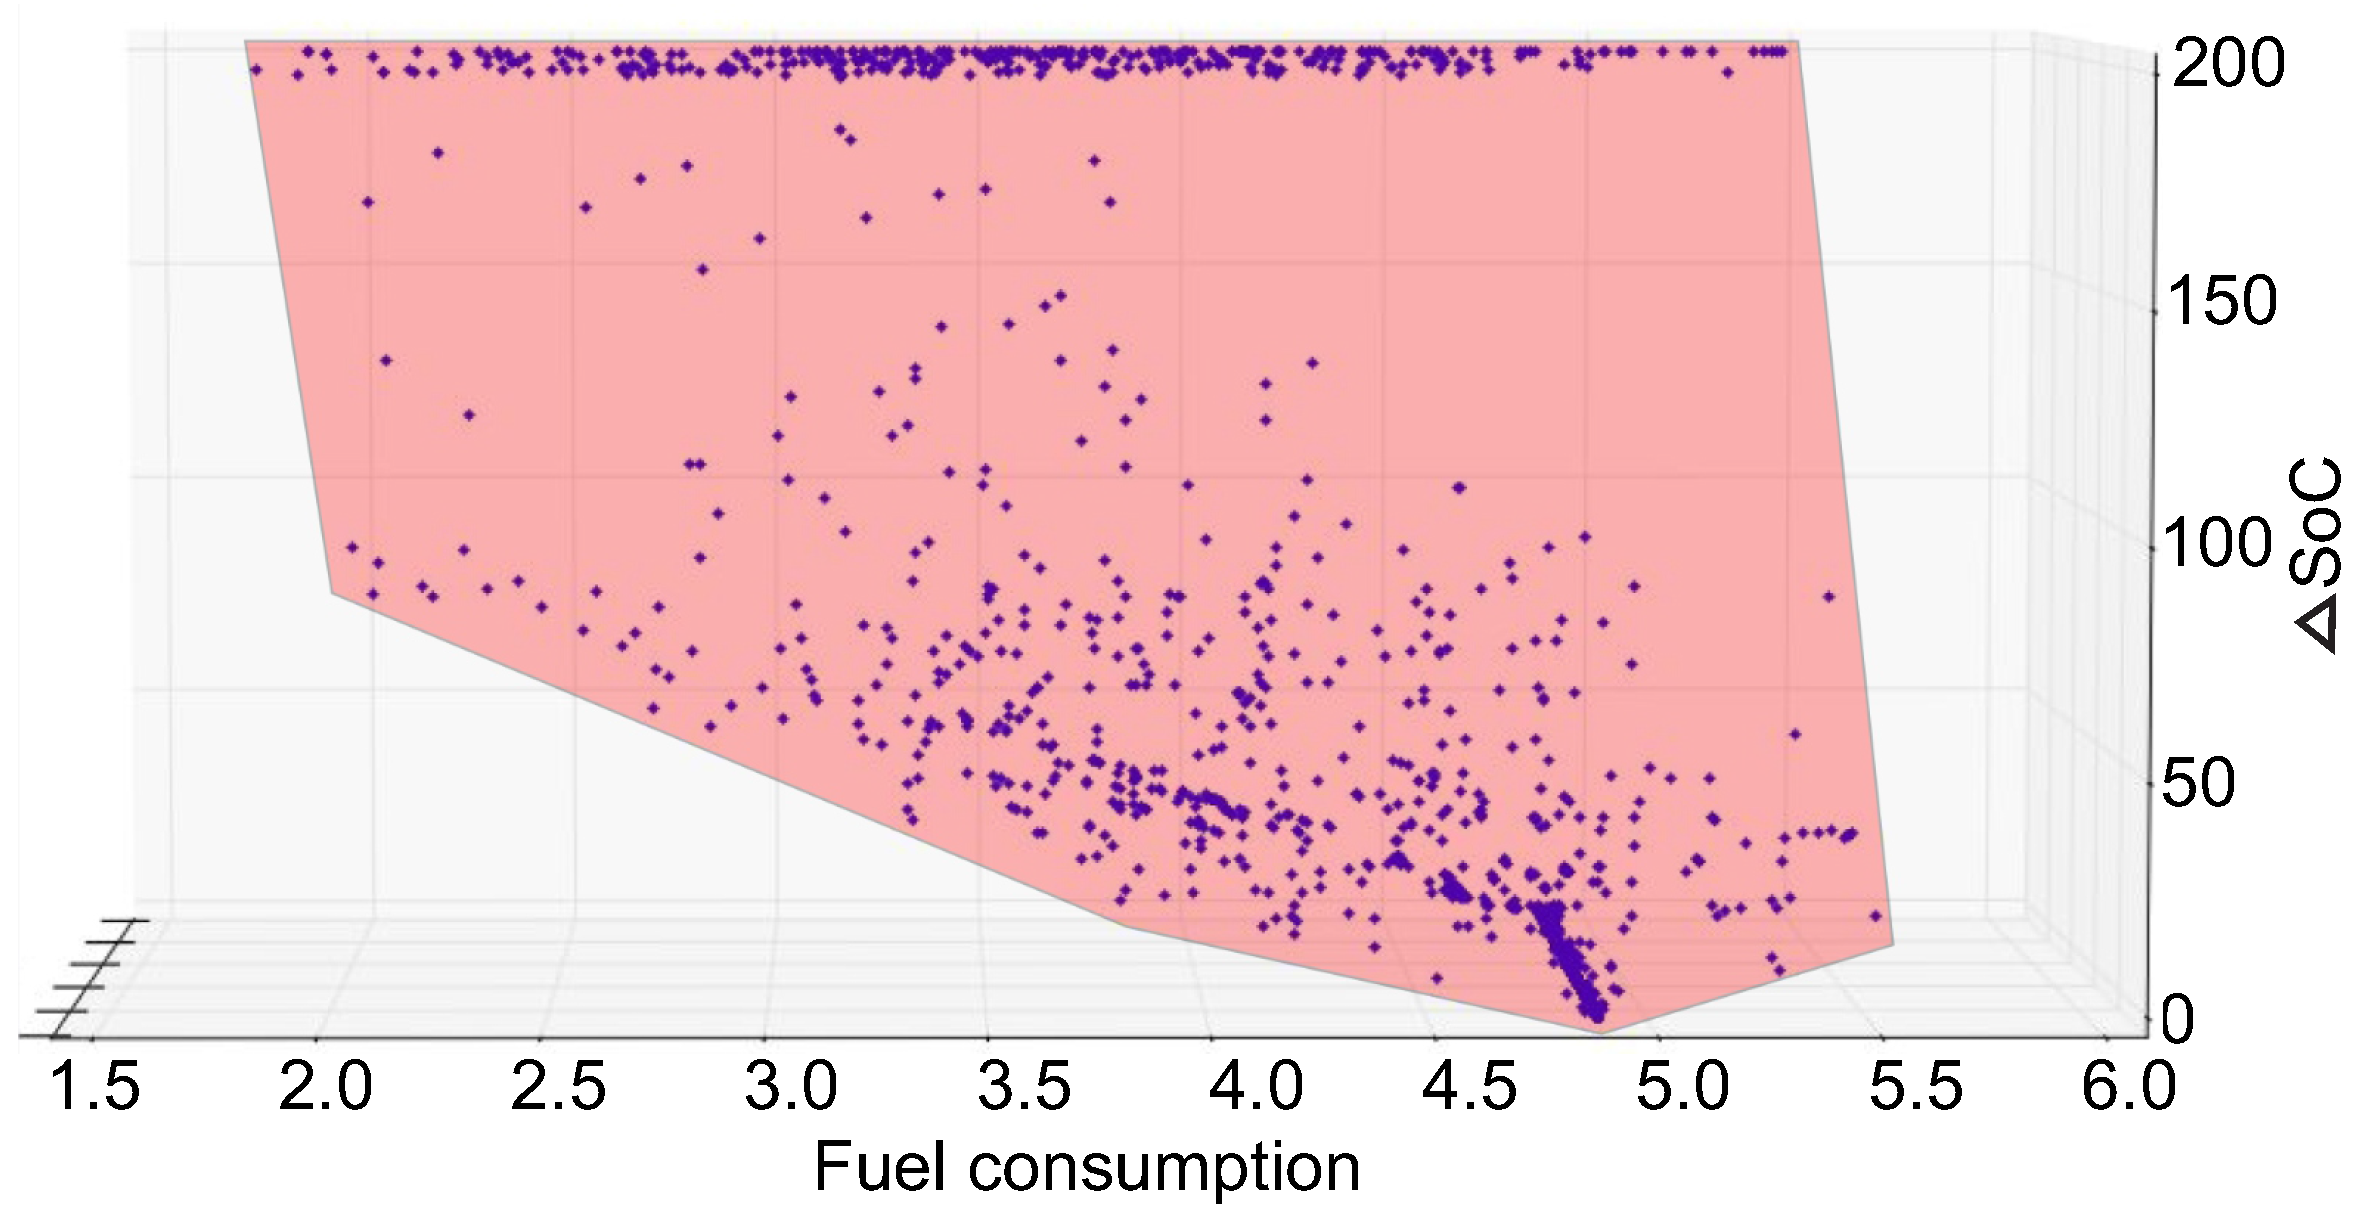
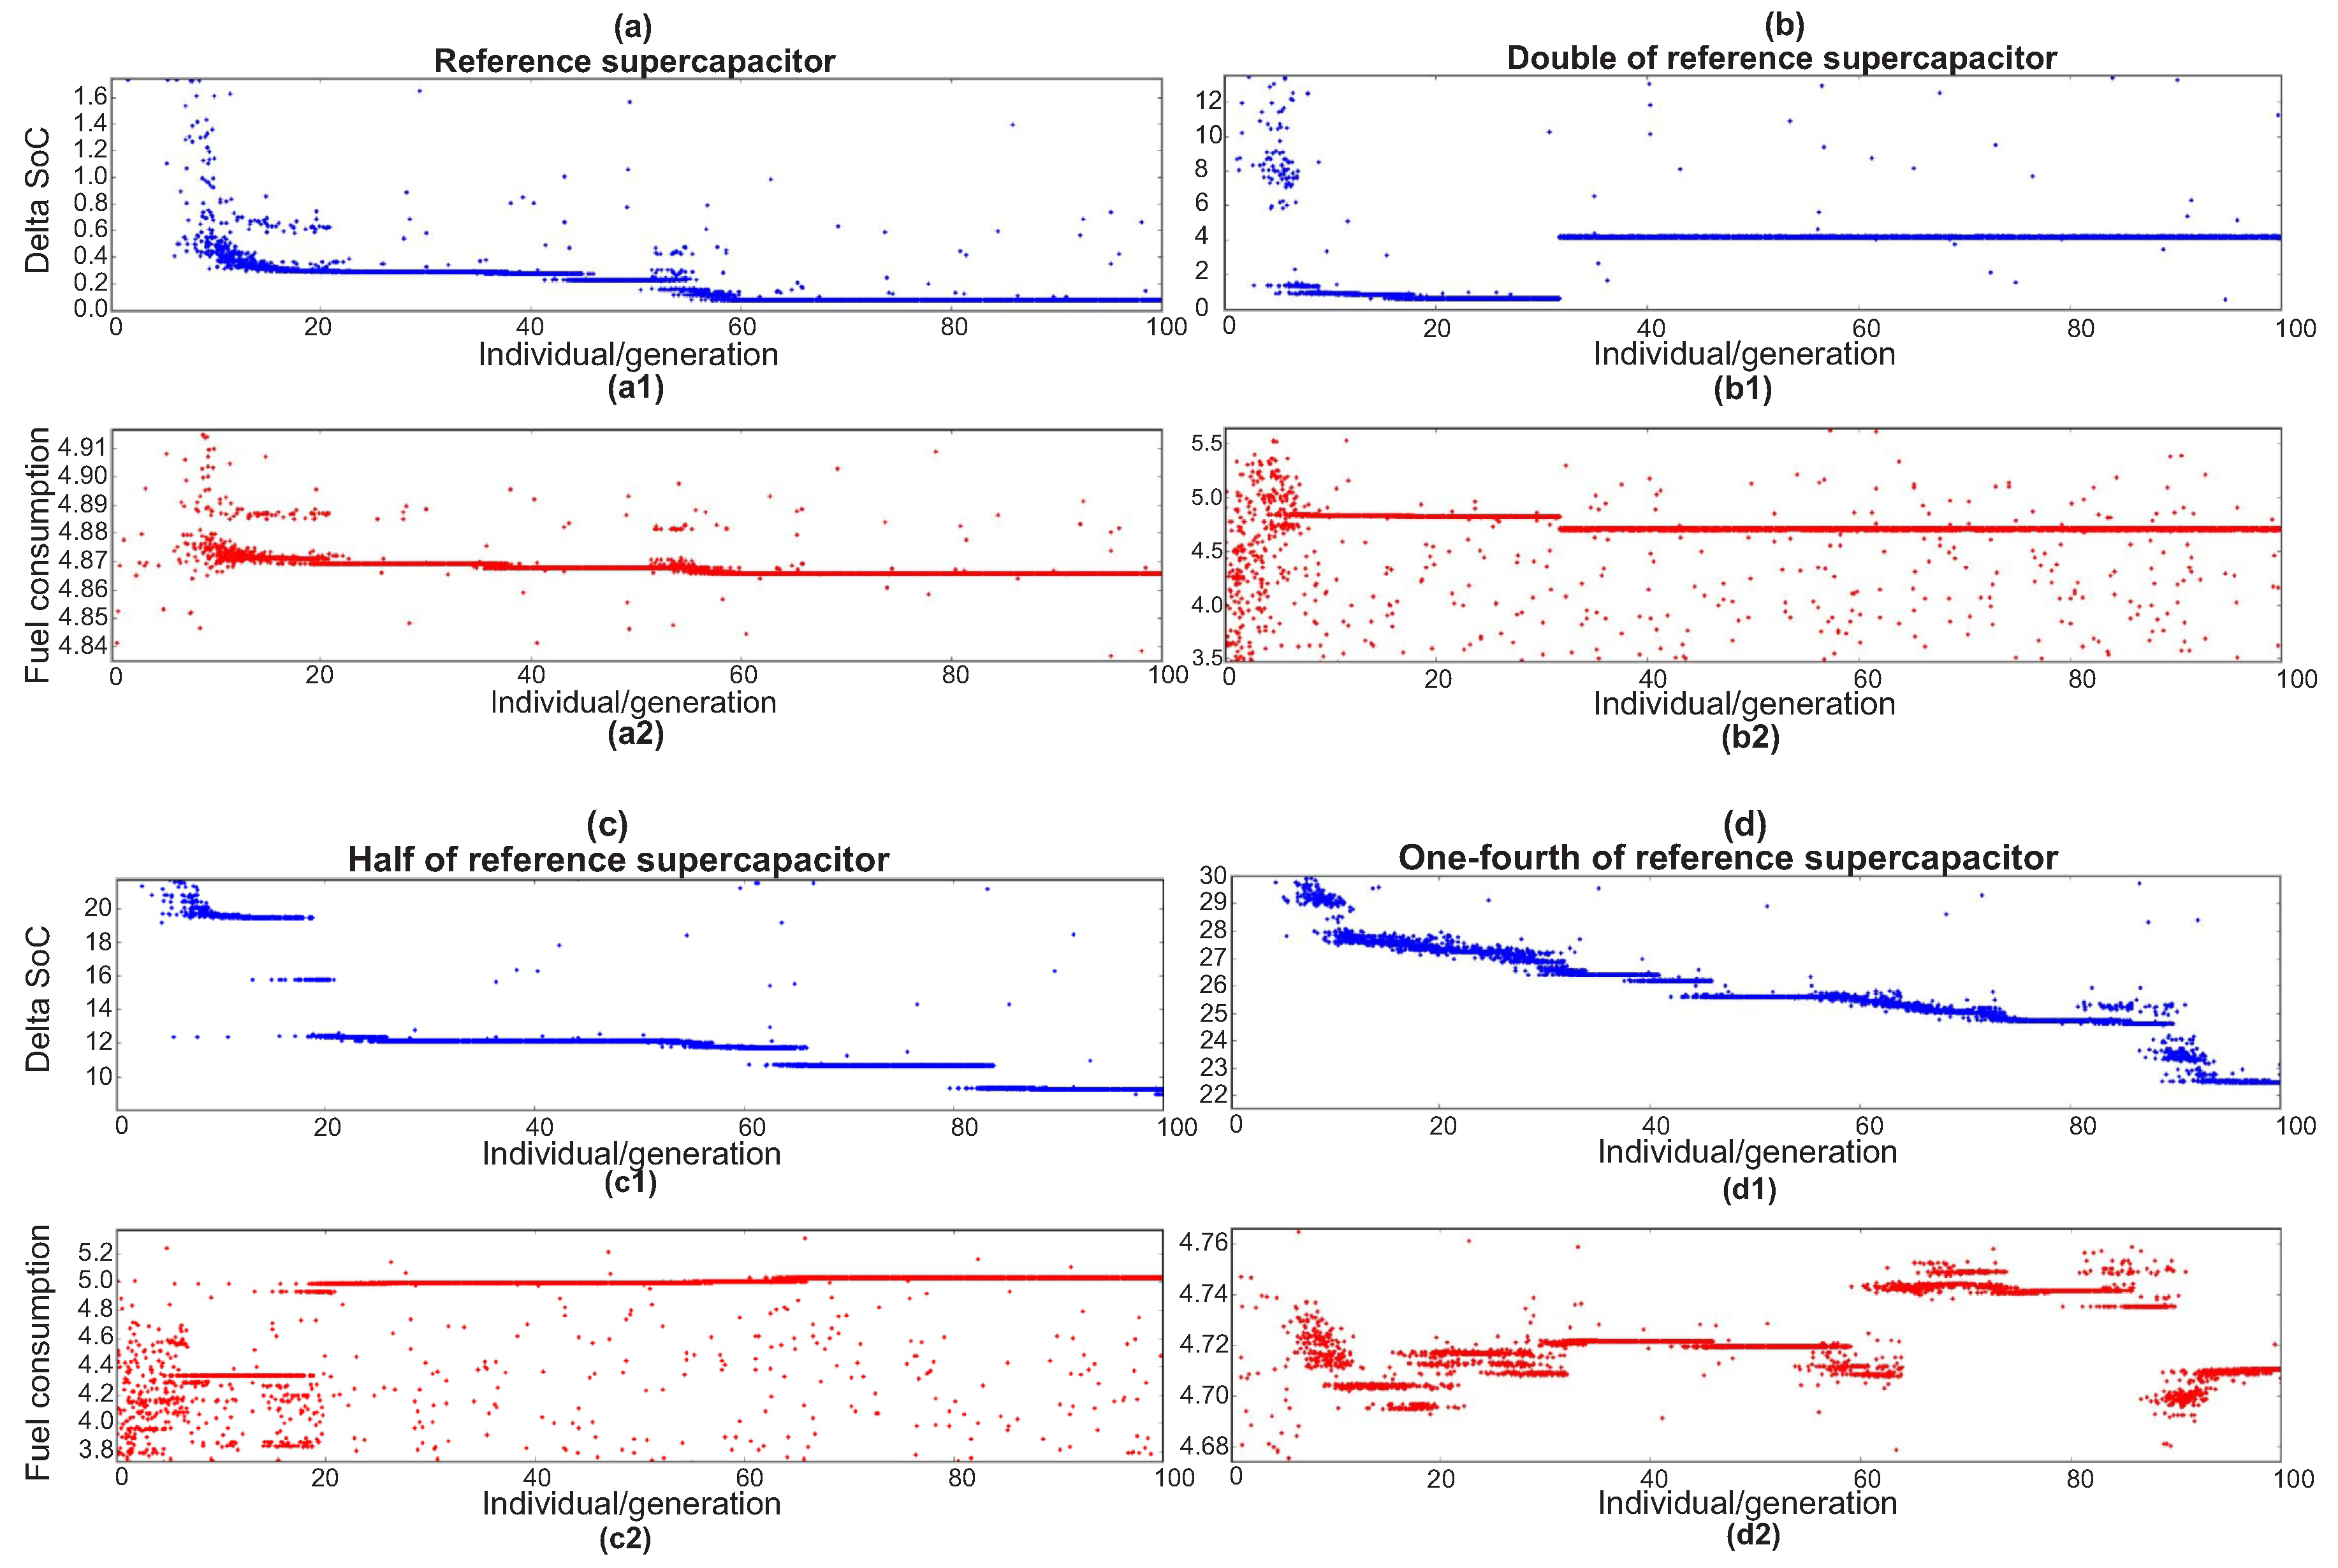
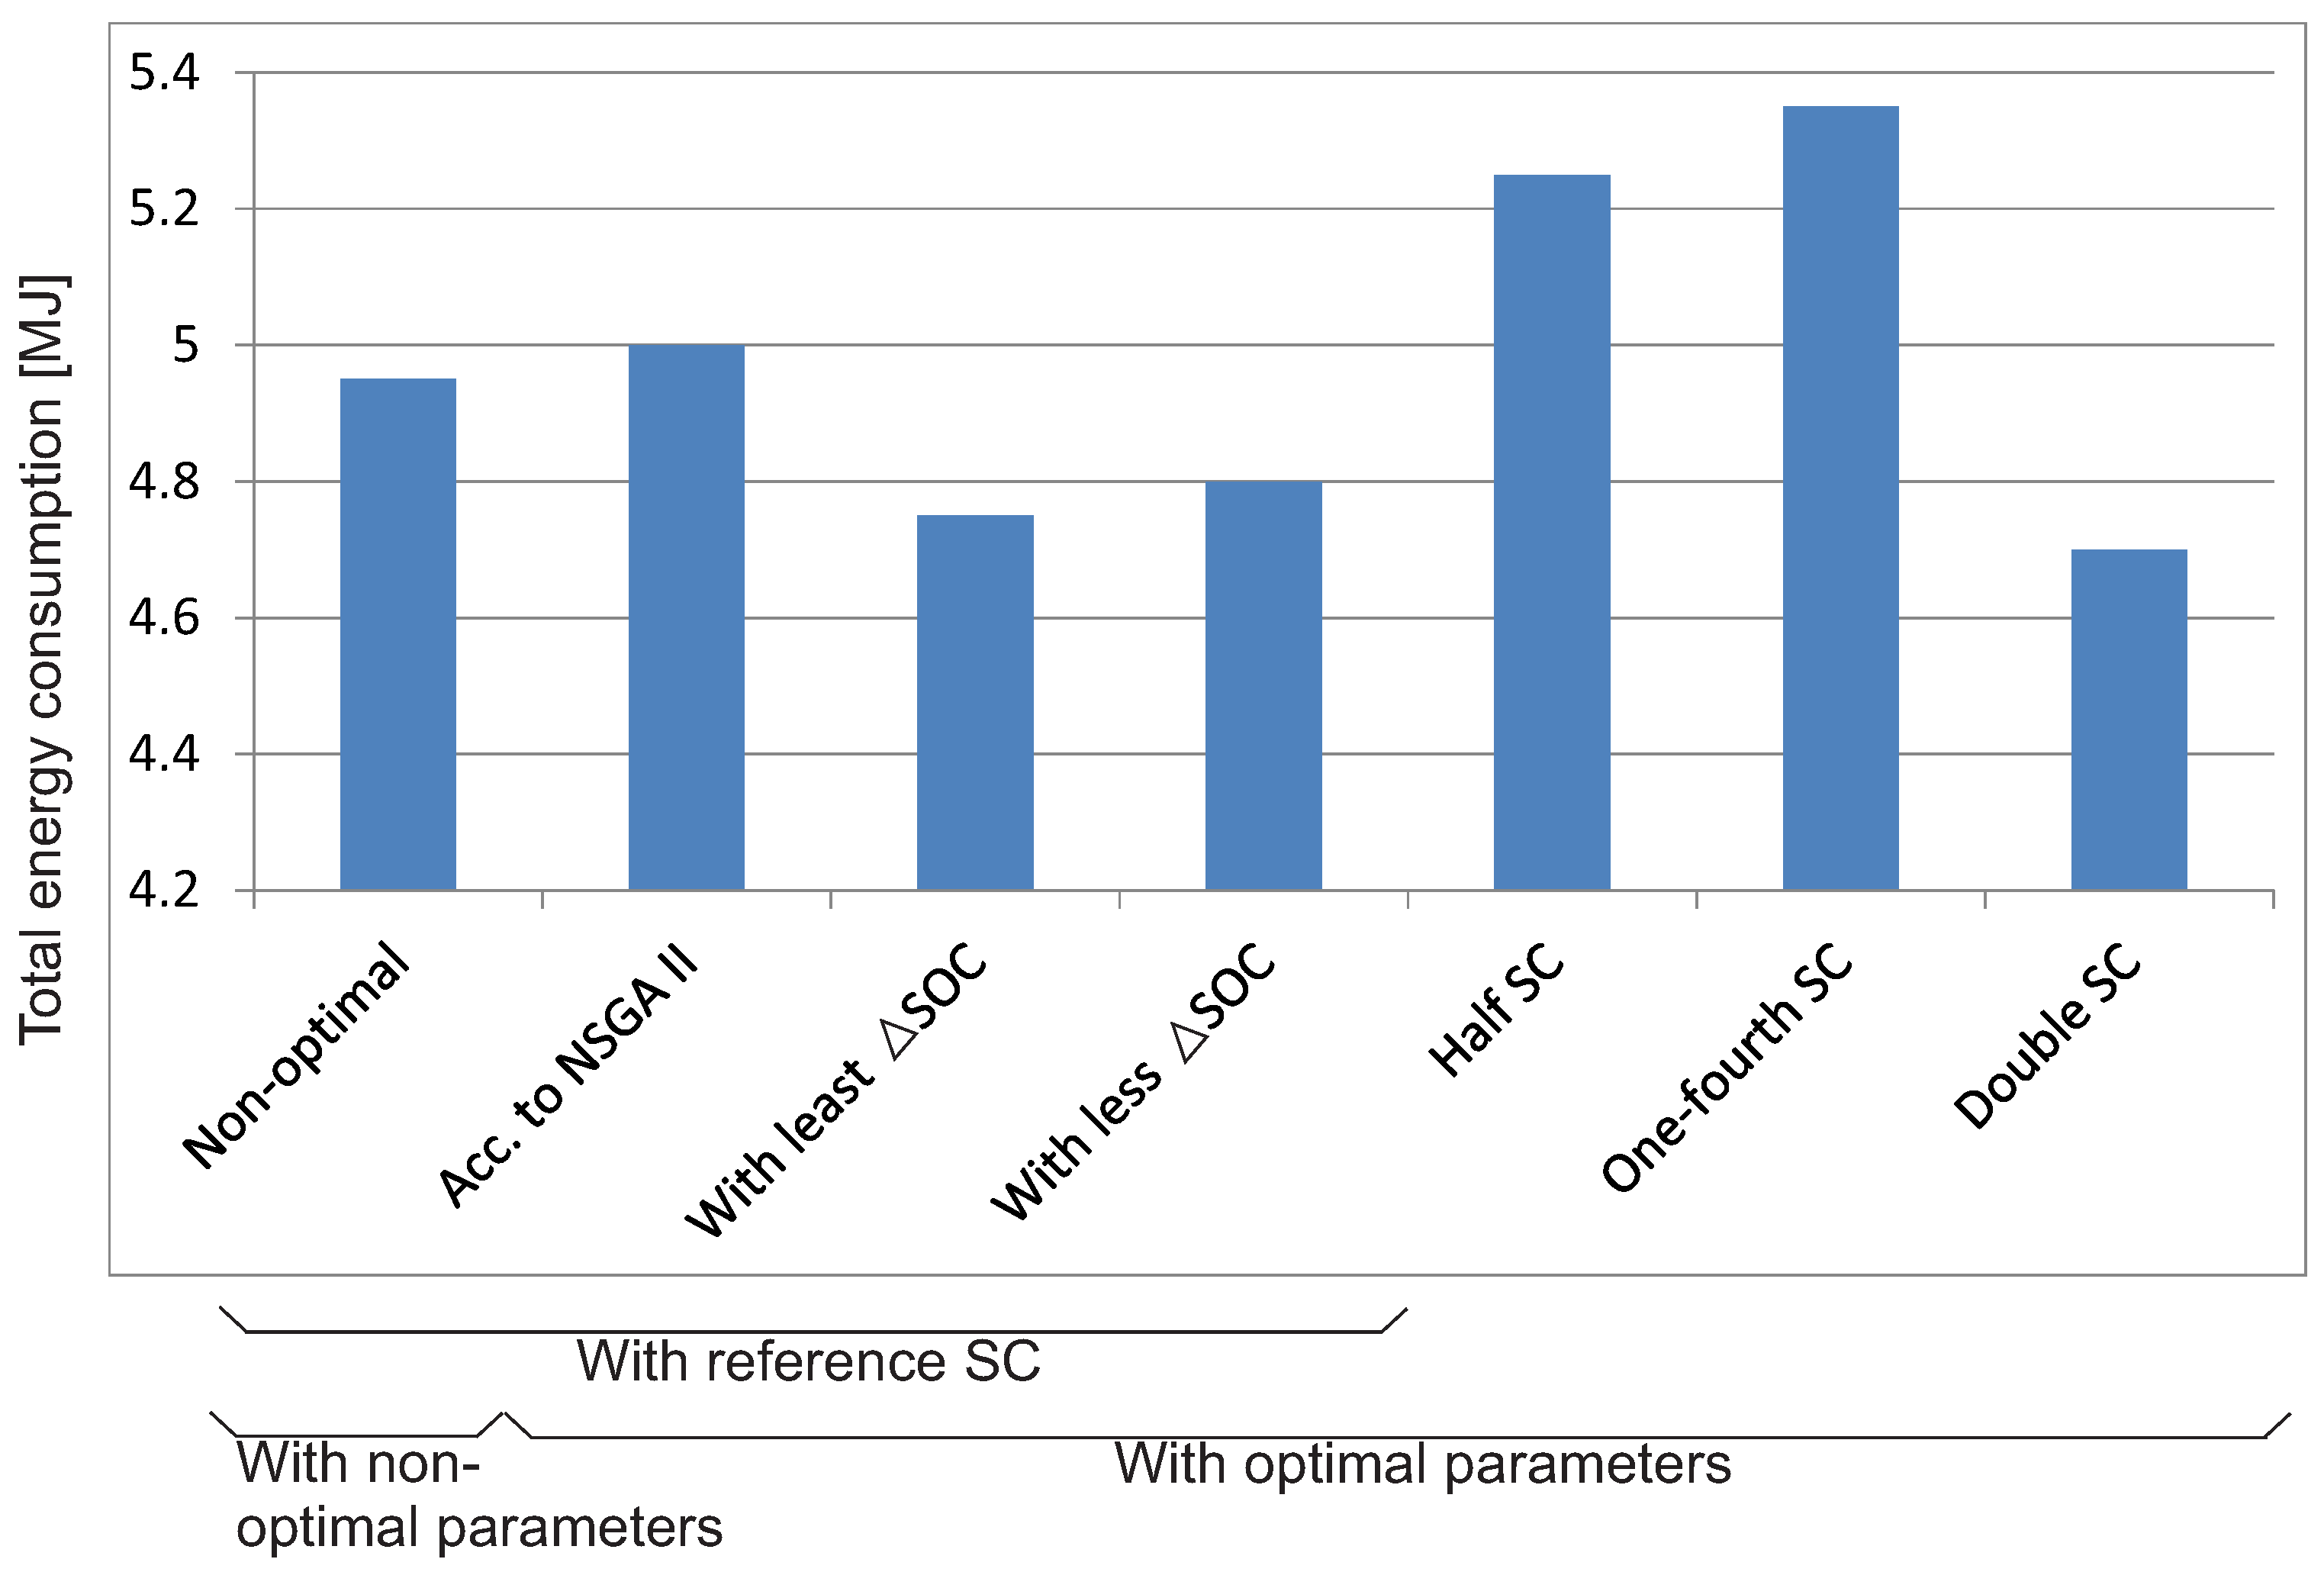
- To investigate the influence of component sizing, the variation of the two objective functions for different supercapacitor sizes is shown in Figure 21.
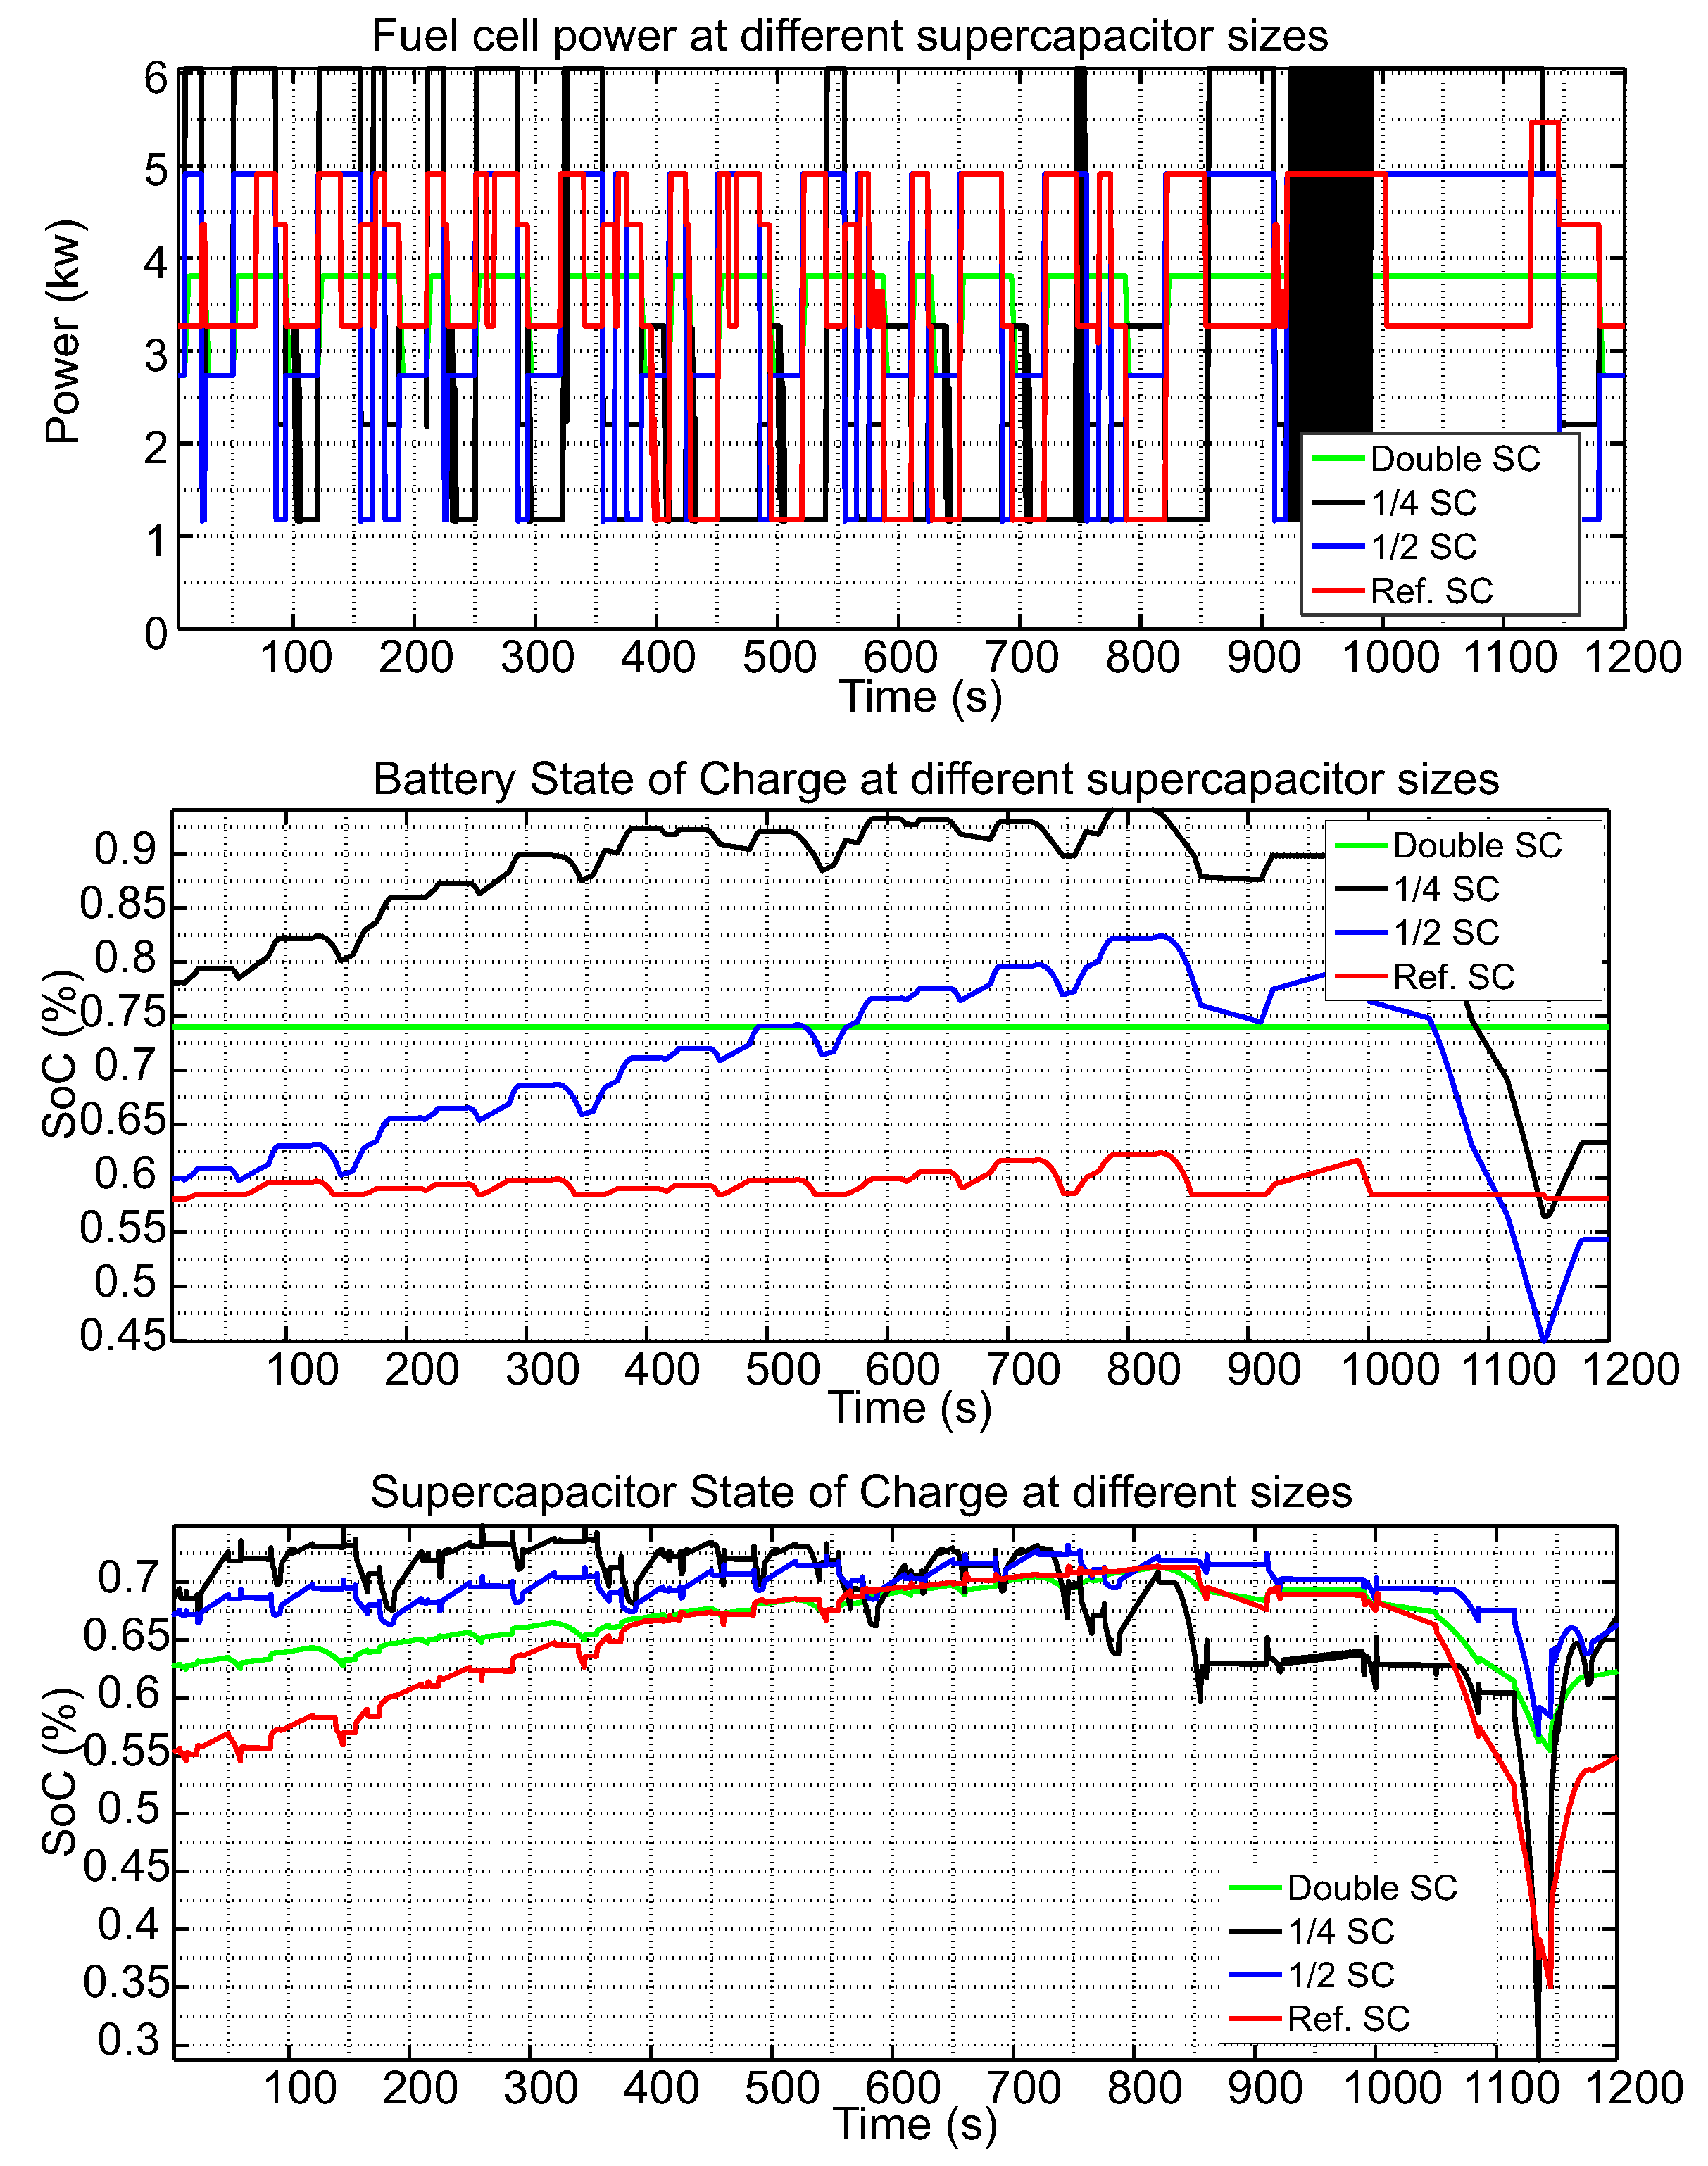
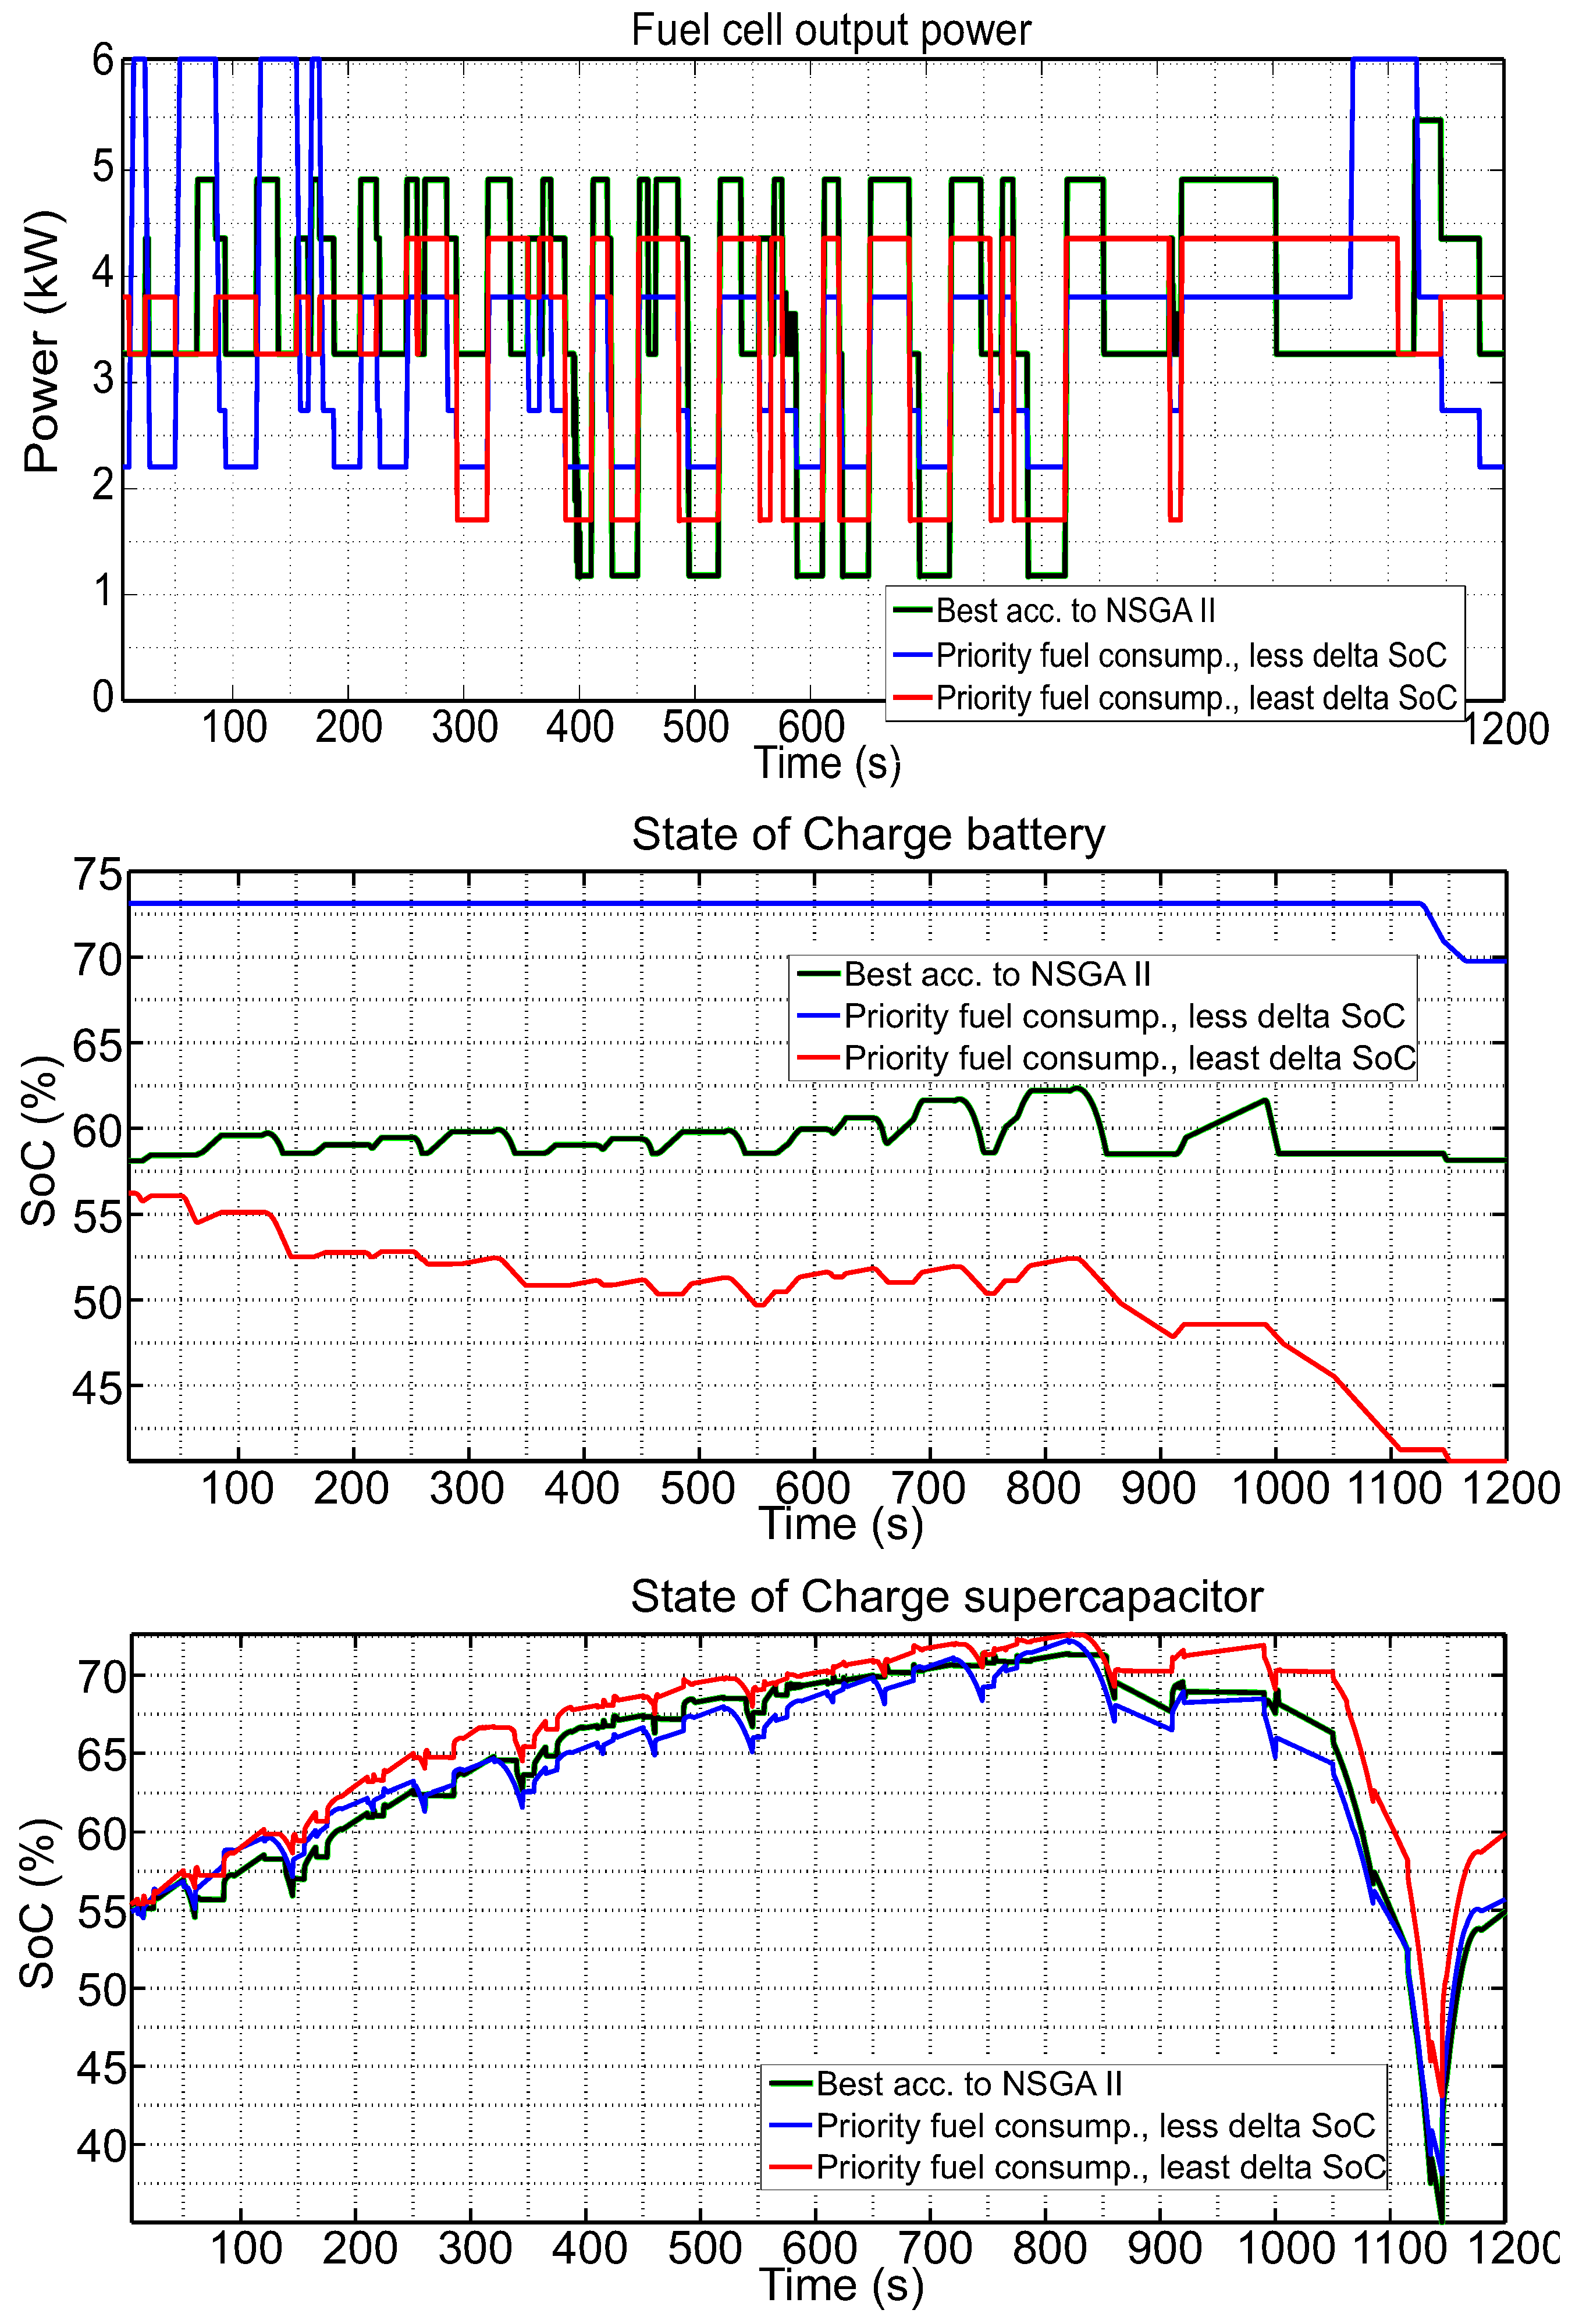
- A supercapacitor size is chosen, and the convergence of the two conflicting objectives for the chosen supercapacitor is shown in Figure 22.
- The preference between the two objectives is varied, and its influence on SoC variation is analyzed.
8. Summary and Conclusions
Acknowledgments
Author Contributions
Conflicts of Interest
References
- Khaligh, A.; Li, Z. Battery, ultracapacitor, fuel cell, and hybrid energy storage systems for electric, hybrid electric, fuel cell, and plug-in hybrid electric vehicles: State of the art. IEEE Trans. Veh. Technol. 2010, 59, 2806–2814. [Google Scholar] [CrossRef]
- Aharon, I.; Kuperman, A. Topological overview of powertrains for battery-powered vehicles with range extenders. IEEE Trans. Power Electron. 2012, 26, 868–876. [Google Scholar] [CrossRef]
- Paladini, V.; Donateo, T.; Risi, A.; Laforgia, D. Super-capacitors fuel-cell hybrid electric vehicle optimization and control strategy development. Energy Convers. Manag. 2007, 48, 3001–3008. [Google Scholar] [CrossRef]
- Khoucha, F.; Benbouzid, M.; Kheloui, A. An optimal fuzzy logic power sharing strategy for parallel hybrid electric vehicles. In Proceedings of the IEEE Vehicle Power and Propulsion Conference, Lille, France, 1–3 September 2010.
- Li, Q.; Chen, W.; Li, Y.; Liu, S.; Huang, J. Energy management strategy for fuel cell/battery/ultracapacitor hybrid vehicle based on fuzzy logic. J. Electr. Power Energy Syst. 2012, 43, 514–525. [Google Scholar] [CrossRef]
- Moulik, B.; Söffker, D. Optimal rule-based powermanagement for online, real-time applications with multiple sources and objectives: A review. Energ. Open Access Energy Res. Eng. Policy J. 2015, 8, 9049–9063. [Google Scholar]
- Moulik, B.; Söffker, D. Online powermanagement with embedded optimization for a multi-source hybrid with dynamic power sharing between components. In Proceedings of the ASME Dynamic Systems and Control (DSC) Conference, Columbus, OH, USA, 28–30 October 2015.
- Bayindir, K.; Gozukucuk, M.; Teke, A. A comprehensive overview of hybrid electric vehicle: Powertrain configurations, powertrain control techniques and electronic control units. Energy Convers. Manag. 2010, 52, 1305–1313. [Google Scholar] [CrossRef]
- Guzzella, L.; Sciarretta, A. Vehicle Propulsion Systems: Introduction to Modeling And Optimization, 2nd ed.; Springer: Berlin/Heidelberg, Germany, 2007. [Google Scholar]
- Lin, C.; Filipi, Z.; Louca, L.; Peng, H.; Assanis, D.; Stein, J. Modeling and control of a medium-duty hybrid electric truck. Int. J. Veh. Des. 2004, 11, 349–370. [Google Scholar]
- Meintz, A.; Ferdowsi, M. Control strategy optimization for a parallel hybrid electric vehicle. In Proceedings of the IEEE Vehicle Power and Propulsion Conference (VPPC), Harbin, China, 3–5 September 2008.
- Sorrentino, M.; Rizzo, G.; Arsie, I. Analysis of a rule-based control strategy for on-board energy management of series hybrid vehicles. Control Eng. Pract. 2011, 19, 1433–1441. [Google Scholar] [CrossRef]
- Hofman, T.; Steinbuch, M. Rule-based energy management strategies for hybrid vehicles. Int. J. Electr. Hybrid Veh. 2007, 1, 71–94. [Google Scholar] [CrossRef]
- Zhang, B.; Chen, Z.; Mi, C.; Murphey, Y. Multi-objective parameter optimization of a series hybrid electric vehicle using evolutionary algorithms. In Proceedings of the IEEE Vehicle Power and Propulsion Conference (VPPC), Dearborn, MI, USA, 1–3 September 2010.
- Serrao, L.; Onori, S.; Sciarretta, A.; Guezennec, Y.; Rizzoni, G. Optimal energy management of hybrid electric vehicles including battery aging. In Proceedings of the American Control Conference (ACC), San Francisco, CA, USA, 29 June–1 July 2011.
- Marx, M. Multiobjective Obtimization of the Power Flow Control of Hybrid Electric Power Train Systems within Simulation and Experimental Emulation Applications. Ph.D. Thesis, University of Duisburg-Essen, Essen, Germany, 2014. [Google Scholar]
- Mihael, C.; Pavković, D.; Petrić, J. A Control-oriented simulation model of a power-split hybrid electric vehicle. Appl. Energy 2013, 101, 121–133. [Google Scholar]
- Torres, J.; Gonzalez, R.; Gimenez, A.; Lopez, J. Energy management strategy for plug-in hybrid electric vehicles, a comparative study. Appl. Energy 2014, 114, 816–824. [Google Scholar] [CrossRef]
- Fotouhi, A.; Yusof, R.; Rahmani, R.; Mekhilef, S.; Shateri, N. A review on the applications of driving data and traffic information for vehicles’ energy conservation. Renew. Sustain. Energy 2014, 37, 822–833. [Google Scholar] [CrossRef]
- Lin, C.; Jeon, S.; Peng, H.; Moo Lee, J. Driving pattern recognition for control of hybrid electric trucks. Veh. Syst. Dyn. 2004, 42, 41–58. [Google Scholar] [CrossRef]
- Lukic, S.; Cao, J.; Bansal, R.; Rodriguez, F.; Emadi, A. Energy storage systems for automotive applications. IEEE Trans. Ind. Electron. 2008, 55, 2258–2267. [Google Scholar] [CrossRef]
- Lukic, S.; Wirasingha, S.; Rodriguez, F.; Cao, J.; Emadi, A. Power management of an ultracapacitor/battery hybrid energy storage system in an HEV. In Proceedings of the IEEE Vehicle Power and Propulsion Conference (VPPC), Windsor, ON, Canada, 6–8 September 2006.
- Baisden, A.; Emadi, A. ADVISOR-based model of a battery and an ultra-capacitor energy source for hybrid electric vehicles. IEEE Trans. Veh. Technol. 2004, 53, 199–205. [Google Scholar] [CrossRef]
- Cao, J.; Emadi, A. A new battery/ultracapacitor hybrid energy storage system for electric, hybrid, and plug-in hybrid electric vehicles. IEEE Trans. Power Electron. 2012, 27, 122–132. [Google Scholar]
- Hu, X.; Murgovski, N.; Johannesson, L.; Egardt, B. Comparison of three electrochemical energy buffers applied to a hybrid bus powertrain with simultaneous optimal sizing and energy management. IEEE Trans. Transp. Syst. 2014, 15, 1193–1205. [Google Scholar] [CrossRef]
- Valera, J.; Iglesias, I.; Peña, A.; Martin, A.; Sánchez, J. Integrated modeling approach for highly electrified HEV. Virtual design and simulation methodology for advanced powertrain prototyping. In Proceedings of the International Battery, Hybrid and Fuel Cell Electric Vehicle Symposium (EVS 24), Stavanger, Norway, 13–16 May 2009.
- Debert, M.; Colin, G.; Chamaillard, Y.; Guzzella, L.; Ketfi-Cherif, A.; Bellicaud, B. Predictive energy management for hybrid electric vehicles-Prediction horizon and battery capacity sensitivity. In Proceedings of the IFAC Symposium Advances in Automotive Control, Munich, Germany, 11 July 2010.
- Özbek, M.; Wang, S.; Marx, M.; Söffker, D. Modeling and control of a PEM fuel cell system: A practical study based on experimental defined component behavior. J. Process Control 2013, 23, 282–293. [Google Scholar] [CrossRef]
- Eker, J.; Hagander, P.; Årzén, K. A feedback scheduler for real-time controller tasks. Control Eng. Pract. 2000, 12, 1369–1378. [Google Scholar] [CrossRef]
- Hofmann, M.; Eckardt, B.; März, M.; Frey, L. Effizienzoptimierung integrierter elektrischer Antriebssysteme fuer Hybrid- und Elektrofahrzeuge. In Proceedings of the Elektromobilausstellung (EMA)—Fachtagung —Wettbewerbe, Aschaffenburg, Germany, 8–9 September 2010.
- Oei, D.; Adams, J.; Kinnelly, A. Direct-Hydrogen-Fueled Proton-Exchange-Membrane Fuel Cell System for Transportation Applications; No. DOE/CE/50389-503; Ford Motor Co.: Dearborn, MI, USA, 1997. [Google Scholar]
- He, H.; Xiong, R.; Guo, H.; Li, S. Comparison study on the battery models used for the energy management of batteries in electric vehicles. Energy Convers. Manag. 2012, 64, 113–121. [Google Scholar] [CrossRef]
- Waag, W.; Käbitz, S.; Sauer, D. Experimental investigation of the lithium-ion battery impedance characteristic at various conditions and aging states and its influence on the application. Appl. Energy 2014, 102, 885–897. [Google Scholar] [CrossRef]
- Knauff, M.C.; Dafis, C.J.; Niebur, D.; Kwatny, H.G.; Nwankpa, C.O. Simulink model for hybrid power system test-bed. In Proceedings of the IEEE Electric Ship Technologies Symposium, Arlington, VA, USA, 21–23 May 2007.
- Chen, M.; Rincon-Mora, G. Accurate electrical battery model capable of predicting runtime and I–V performance. IEEE Trans. Energy Convers. 2006, 21, 504–511. [Google Scholar] [CrossRef]
- Rahimi-Eichi, H.; Chow, M.Y. Adaptive parameter identification and state-of-charge estimation of lithium-ion batteries. In Proceedings of the IECON 2012—38th Annual Conference on IEEE Industrial Electronics Society, Montreal, QC, Canada, 25–28 October 2012.
- Fărcaş, C.; Petreuş, D.; Ciocan, I.; Palaghită, N. Modeling and simulation of supercapacitors. In Proceedings of the 15th International Symposium for Design and Technology of Electronics Packages, Gyula, Hungary, 17–20 September 2009.
- Johansson, P.; Andersson, B. Comparison of Simulation Programs for Supercapacitor Modelling. Master’s Thesis, Chalmers University of Technology, Gothenburg, Sweden, 2008. [Google Scholar]
- Uzunoglu, M.; Alam, M.S. Dynamic modeling, design and simulation of a PEM fuel cell/ultra-capacitor hybrid system for vehicular applications. Energy Convers. Manag. 2007, 48, 1544–1553. [Google Scholar] [CrossRef]
- Brusa. Brusa Elektronik AG. Available online: http://www.brusa.eu/ (accessed on 11 October 2015).
- Veneri, O.; Capasso, C.; Patalano, S. Experimental study on the performance of a ZEBRA battery based propulsion system for urban commercial vehicles. Appl. Energy 2016. (In press) [Google Scholar] [CrossRef]
- Kim, T.; Qiao, A. A hybrid battery model capable of capturing dynamic circuit characteristics and nonlinear capacity effects. IEEE Trans. Energy Convers. 2011, 26, 1172–1180. [Google Scholar] [CrossRef]
- Liu, K.; Zhu, C.; Lu, R.; Chan, C. Improved study of temperature dependence equivalent circuit model for supercapacitors. IEEE Trans. Plasma Sci. 2013, 41, 1267–1271. [Google Scholar]
- Emadi, A. Handbook of Automotive Power Electronics and Motor Drives; CRC Press: Boca Raton, FL, USA, 2005. [Google Scholar]
- Thacker, B.; Doebling, S.; Hemez, F.; Anderson, M.; Pepin, J.; Rodriguez, E. Concepts of Model Verification and Validation; No. LA-14167; Los Alamos National Lab: Los Alamos, NM, USA, 2004. [Google Scholar]
- Capasso, C.; Veneri, O. Experimental analysis on the performance of lithium based batteries for road full electric and hybrid vehicles. Appl. Energy 2014, 136, 921–930. [Google Scholar] [CrossRef]
- Chou, P.; Park, C.; Park, J.; Pham, K.; Liu, J. B#: A battery emulator and power profiling instrument. In Proceedings of the International Symposium on Low Power Electronics and Design, Seoul, Korea, 25–27 August 2003.
- Gao, F.; Blunier, B.; Bouquain, D.; Miraoui, A. Model based DC power source emulator for electrical and hybrid electrical vehicles drive train tests. In Proceedings of the IEEE Vehicle Power and Propulsion Conference (VPPC), Chicago, IL, USA, 6–9 September 2011.
- Ferreira, A.; Pomilio, J.; Spiazzi, G.; de Araujo Silva, L. Energy management fuzzy logic supervisory for electric vehicle power supplies system. IEEE Trans. Power Electron. 2008, 23, 107–115. [Google Scholar] [CrossRef]
- Parker-Allotey, N.; Bryant, A.; Palmer, P. The application of fuel cell emulation in the design of an electric vehicle powertrain. In Proceedings of the Power Electronics Specialists Conference, Recife, Brazil, 16 June 2005.
- Gao, F.; Blunier, B.; Simoes, M.; Miraoui, A.; El-Moudni, A. PEM fuel cell stack hardware-in-the-loop emulation using DC/DC converter design. In Proceedings of the Electrical Power and Energy Conference (EPEC), Montreal, QC, Canada, 22–23 October 2009.
- Marsala, G.; Pucci, M.; Vitale, G.; Cirrincione, M.; Miraoui, A. A prototype of a fuel cell PEM emulator based on a buck converter. Appl. Energy 2009, 86, 2192–2203. [Google Scholar] [CrossRef]
- Höcherl and Hackl. Battery Emulation with NL Source-Sink, H & H Customer Application 12. Available online: http://www.hoecherl-hackl.com/customer-applications.html (accessed on 25 November 2015).
- Rao, S.; Chandorkar, M. Electrical load emulation using power electronic converters. In Proceedings of the TENCON 2008-2008 IEEE Region 10 Conference, Hyderabad, India, 19–21 November 2008.
- Marx, M.; Özbek, M.; Söffker, D. Power management of a hybrid electric powertrain system—Design, power flow control and optimization targets. Int. J. Powertrains 2014, 3, 221–241. [Google Scholar] [CrossRef]
- Liu, Y.; Marx, M.; Moulik, B.; Söffker, D. Experiment-based simulation and optimization of wind powertrain systems based on electric power flow emulation. In Proceedings of the First Conference for Wind Power Drives, Aachen, Germany, 19–20 March 2013.
- Rauhut, T. Power Management and Optimization of a Multi-Source Hybrid Powertrain for Real Time Applications (Power-Management und Optimierung eines Multi-Quelle-Hybrid-Antriebes für Echtzeitanwendungen). Master’s Thesis, University of Duisburg-Essen, Essen, Gemany, 2015. [Google Scholar]
- Karbaschian, M.; Söffker, D. Review and comparison of power management approaches for hybrid vehicles with focus on hydraulic drives. Energies 2014, 7, 3512–3536. [Google Scholar] [CrossRef]
- MathWorks. Rate Limiter. Available online: http://www.mathworks.com (accessed on 26 January 2016).
- Moulik, B.; Karbaschian, M.; Söffker, D. Size and parameter adjustment of a hybrid hydraulic powertrain using a global multi-objective optimization algorithm. In Proceedings of the IEEE Vehicle Power and Propulsion Conference (VPPC), Beijing, China, 15–18 October 2013.
- Deb, K.; Jain, P.; Gupta, N.K.; Maji, H.K. Multiobjective placement of electronic components using evolutionary algorithms. IEEE Trans. Compon. Packag. Technol. 2004, 27, 480–492. [Google Scholar] [CrossRef]


© 2016 by the authors; licensee MDPI, Basel, Switzerland. This article is an open access article distributed under the terms and conditions of the Creative Commons Attribution (CC-BY) license (http://creativecommons.org/licenses/by/4.0/).
Share and Cite
Moulik, B.; Söffker, D. Online Power Management with Embedded Offline-Optimized Parameters for a Three-Source Hybrid Powertrain with an Experimental Emulation Application. Energies 2016, 9, 439. https://doi.org/10.3390/en9060439
Moulik B, Söffker D. Online Power Management with Embedded Offline-Optimized Parameters for a Three-Source Hybrid Powertrain with an Experimental Emulation Application. Energies. 2016; 9(6):439. https://doi.org/10.3390/en9060439
Chicago/Turabian StyleMoulik, Bedatri, and Dirk Söffker. 2016. "Online Power Management with Embedded Offline-Optimized Parameters for a Three-Source Hybrid Powertrain with an Experimental Emulation Application" Energies 9, no. 6: 439. https://doi.org/10.3390/en9060439
APA StyleMoulik, B., & Söffker, D. (2016). Online Power Management with Embedded Offline-Optimized Parameters for a Three-Source Hybrid Powertrain with an Experimental Emulation Application. Energies, 9(6), 439. https://doi.org/10.3390/en9060439