Article

The Applicability of Traditional Protection Methods to Lines Emanating from VSC-HVDC Interconnectors and a Novel Protection Principle

1
Key Laboratory of Smart Grid of Ministry of Education, Tianjin University, Tianjin 300072, China
2
Beijing Electric Power Corporation, Beijing 100075, China
*
Author to whom correspondence should be addressed.
Energies 2016, 9(6), 400; https://doi.org/10.3390/en9060400
Submission received: 10 April 2016 / Revised: 16 May 2016 / Accepted: 17 May 2016 / Published: 25 May 2016

Abstract

:
Voltage source converter (VSC)-based high voltage direct current (VSC-HVDC) interconnectors can realize accurate and fast control of power transmission among AC networks, and provide emergency power support for AC networks. VSC-HVDC interconnectors bring exclusive fault characteristics to AC networks, thus influencing the performance of traditional protections. Since fault characteristics are related to the control schemes of interconnectors, a fault ride-through (FRT) strategy which is applicable to the interconnector operating characteristic of working in four quadrants and capable of eliminating negative-sequence currents under unbalanced fault conditions is proposed first. Then, the additional terms of measured impedances of distance relays caused by fault resistances are derived using a symmetrical component method. Theoretical analysis shows the output currents of interconnectors are controllable after faults, which may cause malfunctions in distance protections installed on lines emanating from interconnectors under the effect of fault resistances. Pilot protection is also inapplicable to lines emanating from interconnectors. Furthermore, a novel pilot protection principle based on the ratio between phase currents and the ratio between negative-sequence currents flowing through both sides is proposed for lines emanating from the interconnectors whose control scheme aims at eliminating negative-sequence currents. The validity of theoretical analysis and the protection principle is verified by PSCAD/EMTDC simulations.

1. Introduction

Based on self-turn-off devices such as insulated gate bipolar transistors (IGBTs), voltage source converters (VSCs) are capable of independent control of active and reactive power in four quadrants of the P-Q plane [1,2,3]. With strong controllability and high reliability, the VSC-based high voltage direct current (VSC-HVDC) technology has broad application prospects in the integration of large-scale renewable sources, interconnection of AC networks, power supply of islands, long-distance power transmission and so on [3,4]. Interconnection of high voltage networks via a VSC-HVDC interconnector can realize power supply among different AC networks without increasing short-circuit currents, which is helpful to make full use of the power supply capacity of each network and enhance the reliability of power systems. Under normal conditions, the interconnector can balance loads in different networks, thus improving the efficiency of the system. When an AC network is under abnormal or fault conditions, the interconnector can provide dynamic reactive power and voltage support, thus enhancing the robustness of the power system [5]. After clearance of faults, fast and effective power support can be achieved among different networks to avoid cascading failures in power systems. Based on the advantages above, the demonstration project for interconnection of the Chang-Cheng and Cheng-Shun-Chao 220 kV AC networks via a VSC-HVDC interconnector will be put into operation in 2018. Therefore, it is very important to study on the applicability of traditional protections to lines in AC networks connected with VSC-HVDC interconnectors and the improvements in protection, especially new protection principles for lines emanating from VSC-HVDC interconnectors.
When a fault happens in an AC network connected with an interconnector, the interconnector will rapidly take corresponding measures according to the severity of the fault. The output characteristics of the interconnector after a fault are related to the operation state before the fault, fault location, fault type, fault resistance, and the control scheme of the interconnector, which are greatly different from those of traditional voltage sources composed of synchronous generators (SGs). There are studies on fault characteristics and protection of AC lines connected with a line-commutated current source converter (CSC)-based HVDC system [6,7,8,9,10]. However, the trigger angle of the thyristor is the only controllable variable in CSCs, and CSCs can’t realize independent control of reactive and active power. The CSC at the inverter station of a CSC-HVDC system is prone to commutation failures and transient power conversion due to faults in the AC network, and the magnitude and phase angle of the output currents of the CSC are uncontrollable in this situation. During faults, large amounts of inter-harmonic components are injected into the AC network from the CSC-HVDC system, which have an undesirable influence on the performance of relay protections based on the Fourier algorithm [7]. The direct current control method is usually employed in VSCs, and both the magnitude and phase angle of output currents of VSCs are controllable after faults. Compared with CSCs, VSCs can mitigate the harmonics in AC currents, especially if multilevel topologies are used [11]. Therefore, power transmission will not be interrupted unless the voltage of the interconnector AC bus falls to zero, which means VSC-HVDC interconnectors have fault ride-through (FRT) ability. In short, the control scheme and post-fault output characteristics of VSCs differ greatly from those of CSCs. The analysis and conclusions that distance protection, directional comparison pilot protection and differential protection are not applicable in [7,8,9,10] cannot be directly applied to the lines emanating from VSC-HVDC interconnectors. The influence of inverter-interfaced distributed generators (IIDGs) on distance protection of the AC lines directly emanating from the inverters is investigated in [12], and solutions are proposed in [13]. However, VSC-HVDC interconnectors and IIDGs are different in terms of the operation range and FRT strategy. Under normal condition, VSC-HVDC interconnectors can work in all four quadrants of the P-Q operating plane, while IIDGs only output active power. When a fault happens in an AC network, IIDGs only output active power or reactive power, but the fault side converter in the VSC-HVDC interconnector may work as a rectifier or an inverter, which makes the range of the angle of additional impedance measured by the distance relay larger than that in [12,13]. Therefore, the fault phase voltage summation-based measured impedance formula proposed for double-phase-to-ground faults, the fault current and measured impedance based pilot protection principle proposed for phase-to-phase faults, and the traditional ground distance protection mentioned in [12,13] are not applicable to AC lines emanating from VSC-HVDC interconnectors.
Distance protection and pilot protection are adopted in traditional high voltage AC lines, and therefore the influence of VSC-HVDC interconnectors on these protection systems needs to be further investigated. This paper is composed of seven sections. The model of an AC/DC hybrid system is introduced and the FRT strategy of the VSC-HVDC interconnector is presented in Section 2. The applicability of phase-to-phase distance protection, ground distance protection, and pilot protection to lines emanating from the VSC-HVDC interconnector is studied in Section 3, Section 4 and Section 5, respectively. Theoretical analysis shows that these traditional protections are inapplicable to lines emanating from interconnectors, and simulation results validate this analysis. For lines emanating from interconnectors, a novel pilot protection principle based on the ratio between phase currents and the ratio between negative-sequence currents flowing through both sides of the line is introduced and investigated in Section 6, and simulation results prove it can correctly recognize internal and external faults. The conclusions of the paper are given in Section 7.

2. Control System of the VSC-HVDC Interconnector

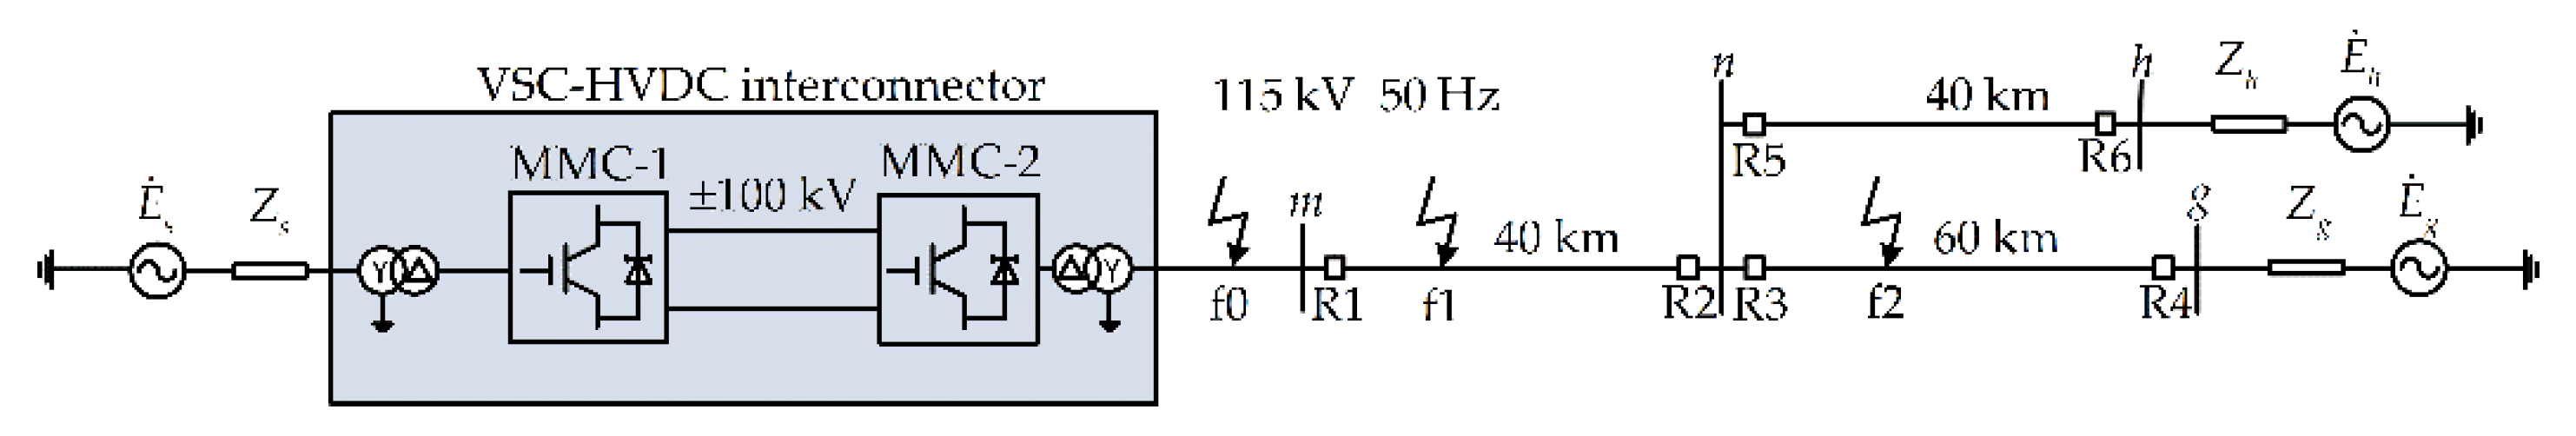
2.1. An AC/DC Hybrid System

The model of an AC/DC hybrid system is shown in Figure 1, which depicts 115-kV, 50-Hz AC networks interconnected via a VSC-HVDC interconnector. The back-to-back modular multilevel converter (MMC) topology [14] is employed in the interconnector. The DC side of the interconnector is rated at ±100 kV. The control mode of MMC-1 is constant DC voltage control and constant reactive power control, and the control mode of MMC-2 is constant active power control and constant reactive power control. Direct current control method is employed in MMCs of the interconnector. The control system of each MMC is composed of two inner positive-sequence current control loops, two inner negative-sequence current control loops [15], two outer power control loops, real-time symmetrical components detector based on space vector [16], synchronous d-q frame phase detector [17], carrier phase shifted sinusoidal pulse width modulation (CPS-SPWM) unit with capacitor voltage-balancing control [18], and FRT control unit. In order to prevent the performance of converters from deteriorating under unbalanced faults in AC networks and ensure the security of the interconnector, the inner negative-sequence current control loops are aimed at eliminating negative-sequence currents, so the command references of negative-sequence currents idref and iqref are set as zero [19,20].

2.2. FRT Control

In order to prevent the voltage of the AC network from dropping further after the outage of the VSC-HVDC interconnector and maintain the stability of the power grid, the interconnector should be kept running when a fault happens in an AC network and provide fast reactive power support for the AC network. Meanwhile, the interconnector should output maximum active currents within the rated current limitation, to make full use of the capacity of converter and try to maintain the balance of active power in the network.
To improve the response speed of the control system, the outer power control loops are blocked during the process of FRT, and the calculated command references idref+ and iqref+ are directly applied to the inner positive-sequence current control loops. If a fault happens in the AC network connected with MMC-1 in Figure 1, MMC-2 will be shifted to DC voltage control mode during the process of FRT of MMC-1 to maintain the DC voltage of the interconnector [21]. In this paper, current flowing out of the interconnector is specified as positive value. Considering the interconnector can work in all four quadrants before fault, the FRT strategy of the fault side converter is proposed as follows:
  • Once the positive-sequence voltage of the interconnector AC bus drops below 90% of the rated voltage, the two outer power control loops of the converter are blocked.
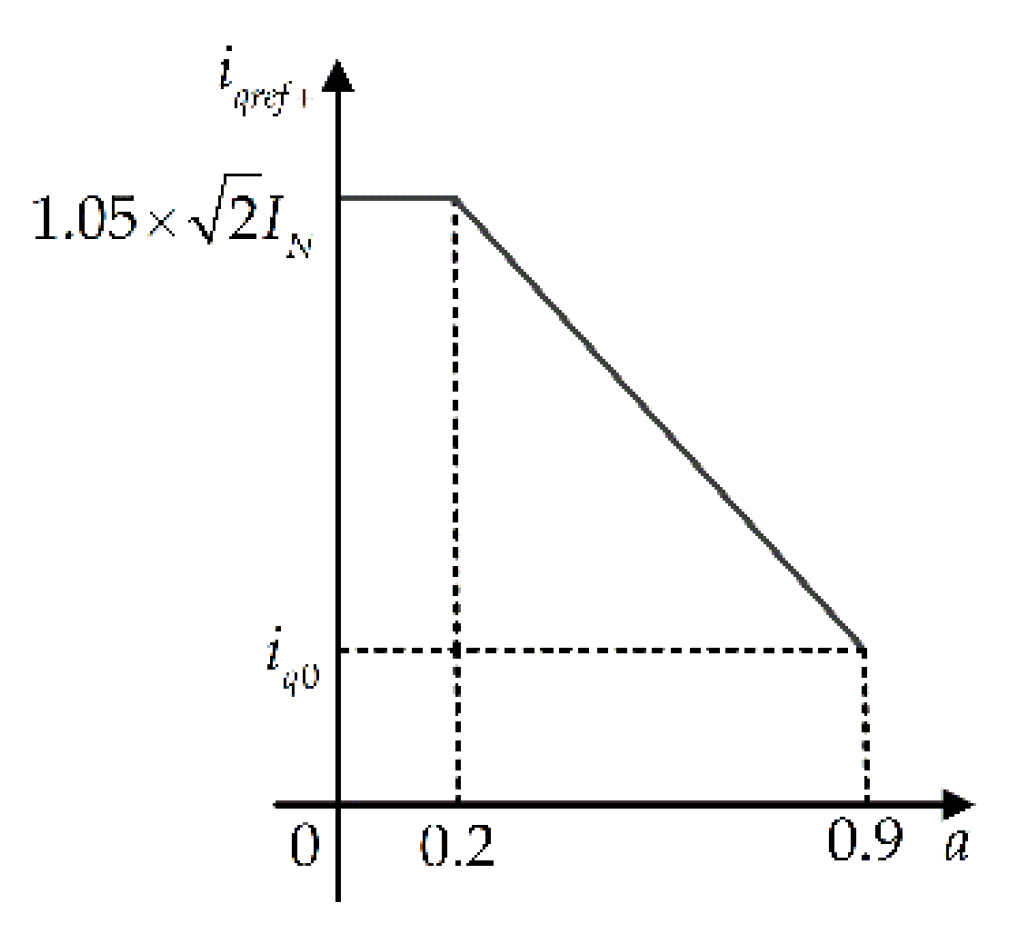
  • The command reference of positive-sequence reactive current iqref+ is adaptively adjusted according to the magnitude of positive-sequence voltage. Taking a as the ratio of positive-sequence voltage of the interconnector AC bus to the rated phase voltage. If 0.2 ≤ a < 0.9, iqref+ will increase linearly from iq0 to 1.05 times the rated current with the decrease of a, where iq0 is the command reference of positive-sequence reactive current before fault and iq0 is regarded as zero when iq0 < 0 before the fault. If a < 0.2, iqref+ will be set as 1.05 times the rated current. iqref+ is given by:
    i q r e f + = { ( 0.9 a ) ( 1.05 × 2 I N i q 0 ) 0.7 + i q 0 ,    0.2 a < 0.9 1.05 × 2 I N ,             a < 0.2
    where IN is the rated AC current expressed in abc frame, and it should be multiplied by 2 to be expressed in the d-q frame. The relationship between iqref+ and a is shown in Figure 2.
  • If the fault side converter works as an inverter before the fault, the command reference of positive-sequence active current idref+ will be set as ( 1.05 × 2 I N ) 2 ( i q r e f + ) 2 ; otherwise idref+ will be set as ( 1.05 × 2 I N ) 2 ( i q r e f + ) 2 . idref+ is given by:
    i d r e f + = { ( 1.05 × 2 I N ) 2 ( i q r e f + ) 2 , i d 0 0 ( 1.05 × 2 I N ) 2 ( i q r e f + ) 2 , i d 0 < 0
    where id0 is the command reference of positive-sequence active current before the fault.

2.3. Output Characteristics of the VSC-HVDC Interconnector after a Fault

In the analysis of the transient process after a fault happens on traditional AC lines, the effects of the electromechanical transient process of SGs are neglected, and traditional voltage sources can be modeled as an ideal voltage source in series with the equivalent impedance. The output currents of traditional voltage sources usually increase significantly after faults.
However, based on Section 2.2, when a fault happens in an AC network, the fault side converter of the interconnector can rapidly take corresponding measures according to the severity of the voltage drop and restrain negative-sequence currents under unbalanced fault conditions. If a ≥ 0.9, the converter will maintain the control target the same as that under normal operation; if a < 0.9, the outer control loops will be blocked, and command references will be directly applied to inner positive-sequence current control loops. Therefore for each AC network under fault conditions, the system behind the fault side converter transformer can be equivalent to a controlled positive-sequence current source, and the output currents of the equivalent source are related to the operation state of the interconnector before fault, fault location, fault type, and fault resistance.
According to the proposed FRT strategy, the magnitude of output positive-currents of the interconnector is limited and does not increase significantly after fault, while the phase angles of the currents may change greatly. The output positive-currents are no larger than 1.05IN when a < 0.9 after a fault. Since the interconnector can work in all four quadrants before the fault, it can still work in all four quadrants if a ≥ 0.9 after the fault, and the phase angle difference between output positive-sequence voltage and output positive-current of the interconnector can be any value in the range of 0°–360°; if a < 0.9, the interconnector can work in the first quadrant and the second quadrant where Q > 0, and the range of the phase angle difference between output positive-sequence voltage and output positive-sequence current is 0°–180°. Thus, the change of the phase angle of the output current can be any value in the range of 0°–360° after a fault.

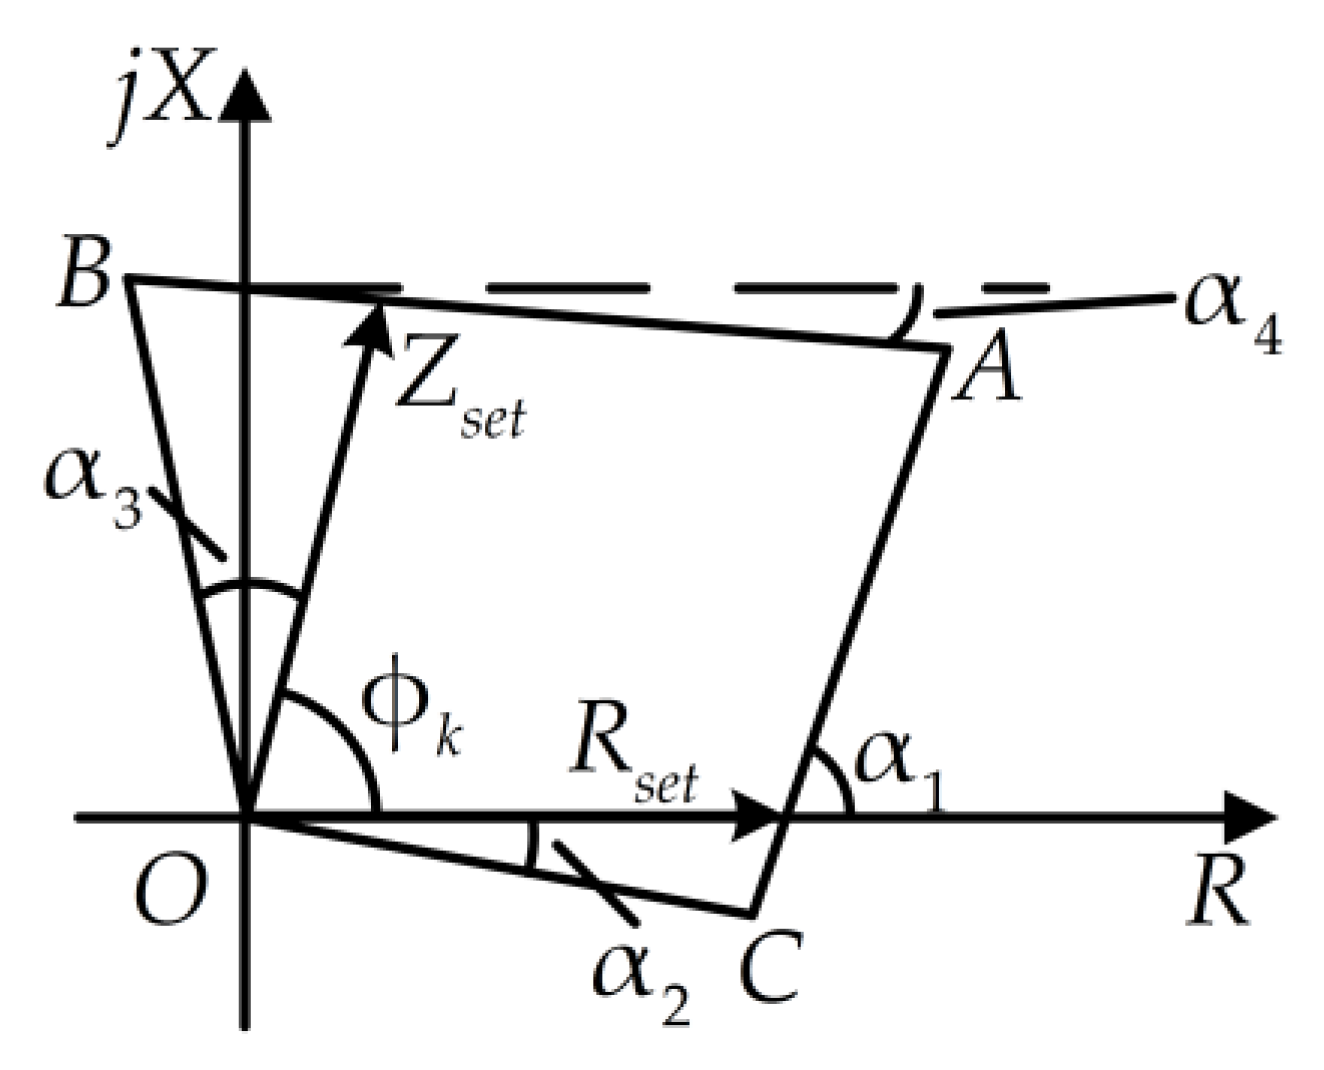
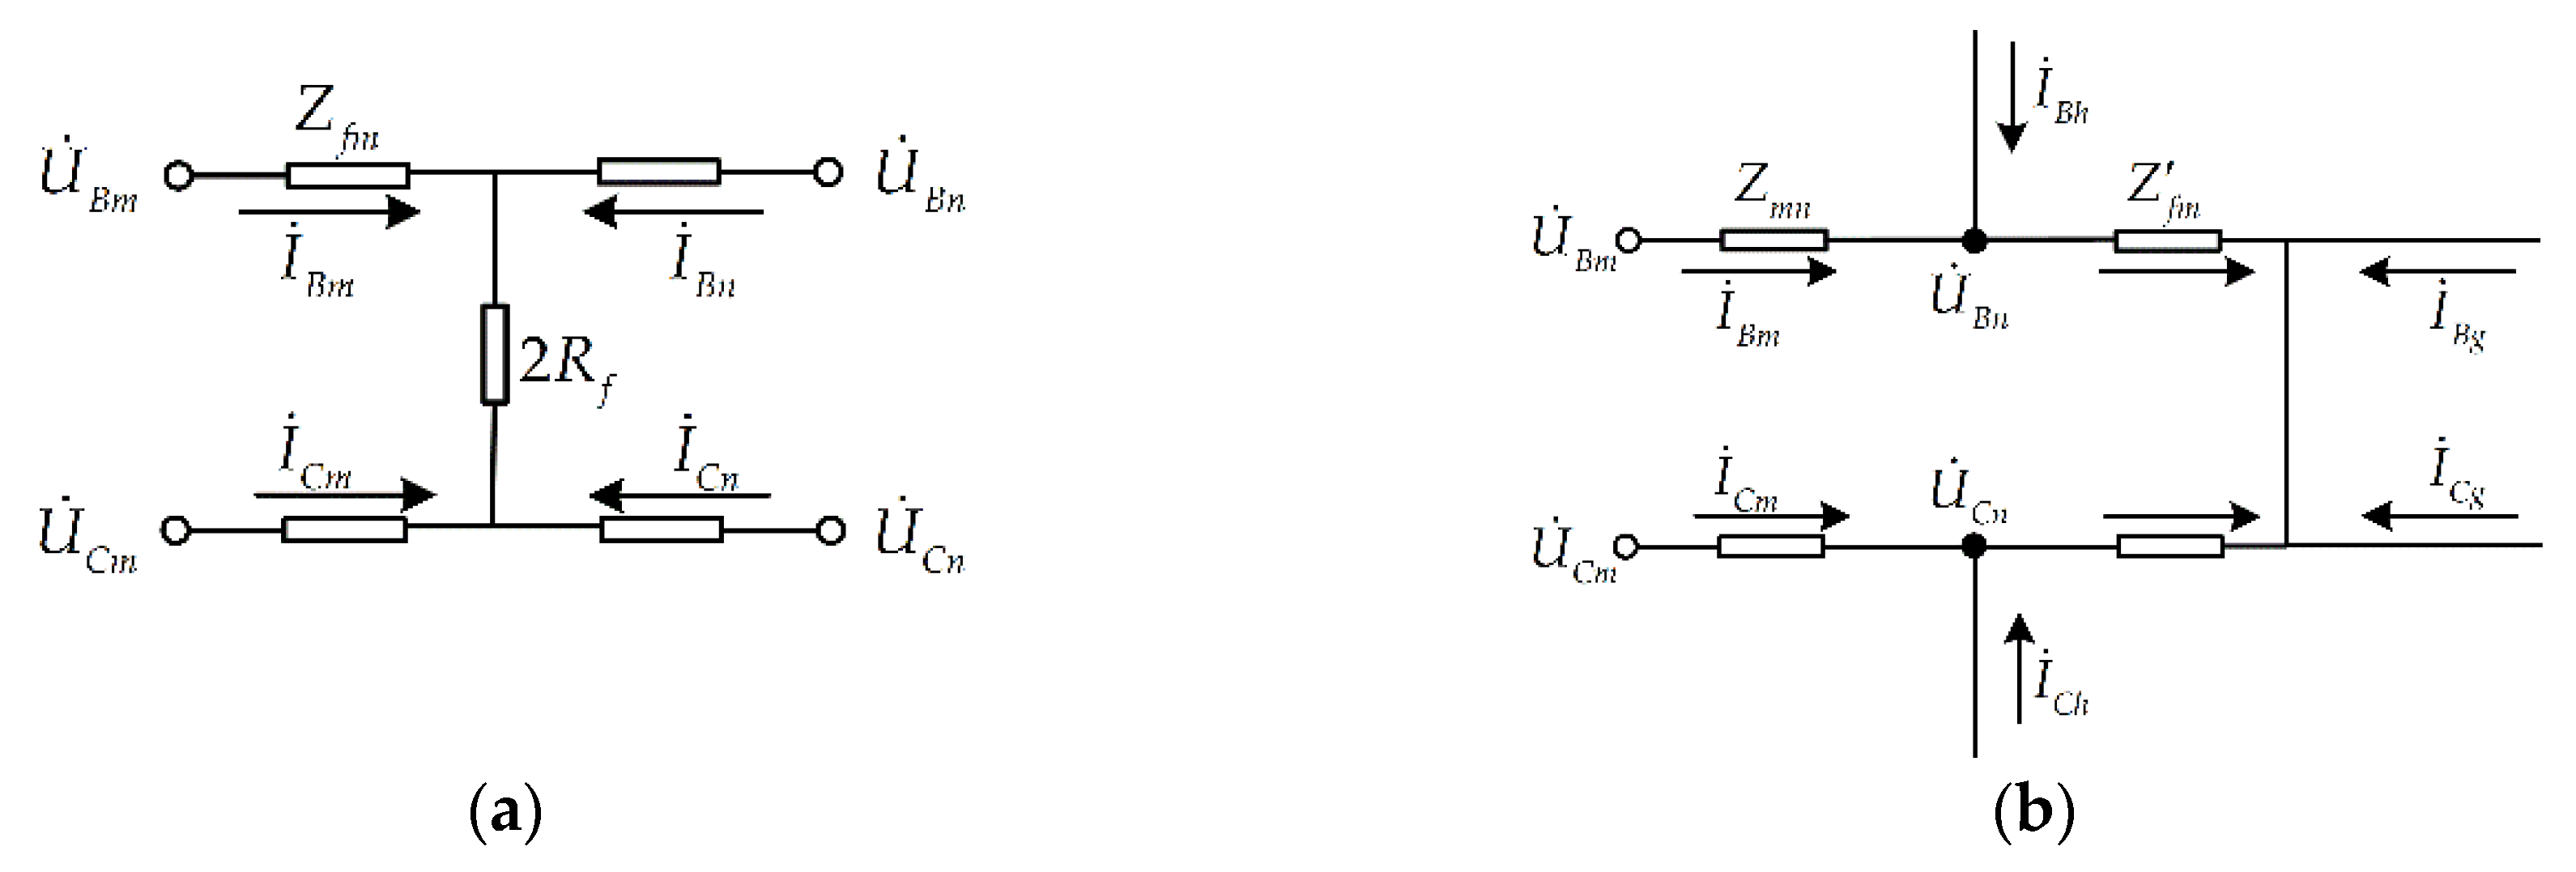
3. Applicability Analysis of Phase-to-Phase Distance Protection

Taking phase-to-phase faults that happen at f1 and f2 as example, the applicability of the phase-to-phase distance protection to the line emanating from the VSC-HVDC interconnector is discussed in this section. As shown in Figure 1, f1 is on line mn which emanates from the interconnector and f2 is on line ng which is adjacent to line mn. R1–R6 are distance relays, and their locations are also shown in Figure 1. Among them, R1 is installed at bus m side of line mn, and R2 is installed at bus n side of line mn.

3.1. Applicability Analysis of R1

When a phase B-to-phase C fault with fault resistance 2Rf happens at f1 on line mn, the impedance measured by the BC element in R1 is:
Z R 1 _ B C = U ˙ B m U ˙ C m I ˙ B m I ˙ C m = Z f m + R f ( 1 + I ˙ B n I ˙ C n I ˙ B m I ˙ C m ) Δ Z R 1 _ B C
where U ˙ B and U ˙ C are phase B voltage and phase C voltage, I ˙ B and I ˙ C are phase B current and phase C current, m and n indicate bus m side and bus n side of line mn, Z f m is the positive-sequence impedance between the relay location and the fault location f1, and Δ Z R 1 _ B C is the additional impedance caused by fault resistance. According to Section 2.3, I ˙ B m and I ˙ C m are output currents of the interconnector, and do not increase significantly after fault; I ˙ B n and I ˙ C n are provided by traditional voltage sources, and increase significantly after fault. Therefore | I ˙ B n I ˙ C n I ˙ B m I ˙ C m | > 1 , and the influence of I ˙ B n I ˙ C n on the measured impedance Z R 1 _ B C cannot be ignored. The angle of the additional impedance Δ Z R 1 _ B C depends on the phase relationship between currents flowing through bus m side and currents flowing through bus n side, which can be any value in the range of 0°–360°. The concrete analysis is as follow.
The fault currents provided by traditional voltage sources contain positive-sequence components and negative-sequence components under phase-to-phase fault, while the fault currents provided by the interconnector only contain positive-sequence components since the negative-sequence components are eliminated. To make it easier to analyze the influence of Δ Z R 1 _ B C on Z R 1 _ B C , the measured impedance can be derived using symmetrical component method and nodal voltage method (refer to Appendix). The measured impedance can be expressed as:
Z R 1 _ B C = Z f m + R f Z S e q + + ( Z m n Z f m ) Z S e q + + ( Z m n Z f m ) + R f ( 1 + E ˙ A n Z S e q + + ( Z m n Z f m ) I ˙ A m + ) Δ Z R 1 _ B C
where Z m n is the positive-sequence impedance of line mn, E ˙ A n and Z S e q + are phase A voltage of the equivalent voltage source and equivalent positive-sequence impedance at the back side of bus n, and I ˙ A m + is the phase A current flowing through R1 which only contains the positive-sequence component.
E ˙ A n Z S e q + + ( Z m n Z f m ) is represented by I ˙ A n _ e q in the following analysis. When the AC system at the back side of bus n remains unchanged, according to Equation (4), Δ Z R 1 _ B C is related to Z f m , R f , as well as the magnitude and phase relationship between I ˙ A m + and I ˙ A n _ e q . Assuming that the impedance angle of Z S e q + is the same with line mn, the phase angle of I ˙ A n _ e q is not related to fault location, which means the phase angle of I ˙ A n _ e q is a constant no matter where the fault happens. However, the phase angle of I ˙ A m + is influenced by the operation state of the interconnector before fault and fault conditions including fault type, fault location, and fault resistance. The interconnector can work in all four quadrants after a fault, and the phase angle of I ˙ A m + can be any value in the range of 0°–360°. Therefore, the phase angle difference between I ˙ A m + and I ˙ A n _ e q can also be any value in the range of 0°–360°. The magnitude of I ˙ A n _ e q is related to Z f m , and I ˙ A m + does not increase significantly after a fault. Based on the analysis above, Δ Z R 1 _ B C is greatly influenced by the magnitude and phase relationship between I ˙ A m + and I ˙ A n _ e q , and the magnitude and impedance angle of Δ Z R 1 _ B C are uncertain. Taking the simulation model established for this paper as example, the ratio of | I ˙ A n _ e q | to | I ˙ A m + | is larger than 2, and the phase angle difference between I ˙ A m + and I ˙ A n _ e q can be any value in the range of 0°–360°. Therefore when R f 0 , Δ Z R 1 _ B C can make Z R 1 _ B C differs greatly from Z f m , and probably cause malfunction of distance protection.
For a fault that happens on a line with two-terminal power supply in a traditional AC network, if the impedance angles of the systems at two sides of the fault spot are approximately equal, the phase angle difference of the currents at two sides of the fault spot are approximately equal to that of the pre-fault potentials of the systems at the two sides. Taking the stability of the power system and the transmission capacity limitation into account, the phase angle difference between the voltages of each end of the line is usually quite small. Therefore the phase angle difference between currents flowing through each end is also small, and the angle of additional impedance Δ Z is within a very small range around zero. Δ Z is nearly resistive.
Relay characteristic shapes with relatively large area in the direction of +R in the R-X diagram, such as quadrilateral relays, are usually employed in distance protection of traditional AC lines to reduce the influence of fault resistance. A common characteristic shape of quadrilateral relay is shown in Figure 3.
Line AB represents a reactance relay with a small negative tilt angle α4 to prevent the relay from overreaching caused by fault resistance, and α4 is usually in the range of 5°–8°; line AC is employed to avoid malfunctions caused by load impedance; line OC is employed to prevent the relay from failing to trip when a fault happens near the relay location and Δ Z is capacitive; the angle of the measured impedance is probably larger than 90° due to the angle error of potential transformer, current transformer and so on, and therefore line OB tilts to quadrant II to prevent the relay from failing to trip.
However, if the characteristic shape described above is applied to R1, R1 may fail to trip or overreach due to the uncertainty of the magnitude and impedance angle of ΔZR1_BC, as shown in Figure 4. The dashed circle indicates the scope of the measured impedance caused by ΔZR1_BC. As shown in Figure 4a, although the fault is located within the protection range of Zone 1, ΔZR1_BC is inductive and of large impedance angle, which makes R1 fail to trip. As shown in Figure 4b, ΔZR1_BC is capacitive and of large impedance angle, which makes the actual reach point of Zone 1 far exceed the setting range; if there are no branches at bus n in the AC/DC hybrid system shown in Figure 1, protection miscoordination of R1 and relay installed at the same side of adjacent line may be induced by ΔZR1_BC.
If there are branches at bus n, as shown in Figure 1, the fault circuit diagram of a bolted phase B-to-phase C fault that happens at f2 on the adjacent line of line mn is shown in Figure 5b. The impedance measured by the BC element in R1 is:
Z R 1 _ B C = Z m n + Z f m + Z f m I ˙ B h I ˙ C h I ˙ B m I ˙ C m Δ Z R 1 _ B C
where Z f m is the positive-sequence impedance between bus n and f2, and I ˙ B h and I ˙ C h are phase B current and phase C current which are injected into line ng from line nh, respectively. The circuit diagram of a non-bolted phase B-to-phase C fault that happens at f1 is shown in Figure 5a. Comparing Figure 5b with Figure 5a, it can be observed that the magnitude and phase relationship between the currents injected into fault circuit by traditional voltage sources and the currents flowing through R1 are similar. Therefore, the analysis on the bolted phase-to-phase fault at f2 is similar to the above analysis on the non-bolted phase-to-phase fault at f1. In Equation (5), the additional impedance ΔZ’R1_BC is induced by the injected currents of traditional voltage sources and the magnitude and impedance angle of ΔZ’R1_BC are uncertain. Therefore when fault happens on adjacent lines, ZR1_BC cannot reflect the fault location correctly, and R1 may fail to trip or overreach. If the fault at f2 is non-bolted, the measured impedance will be more complex under the effect of currents injected by source g, but the conclusion that R1 may fail to trip or overreach is confirmable. Similarly, R2 may misoperate when a backward fault happens.

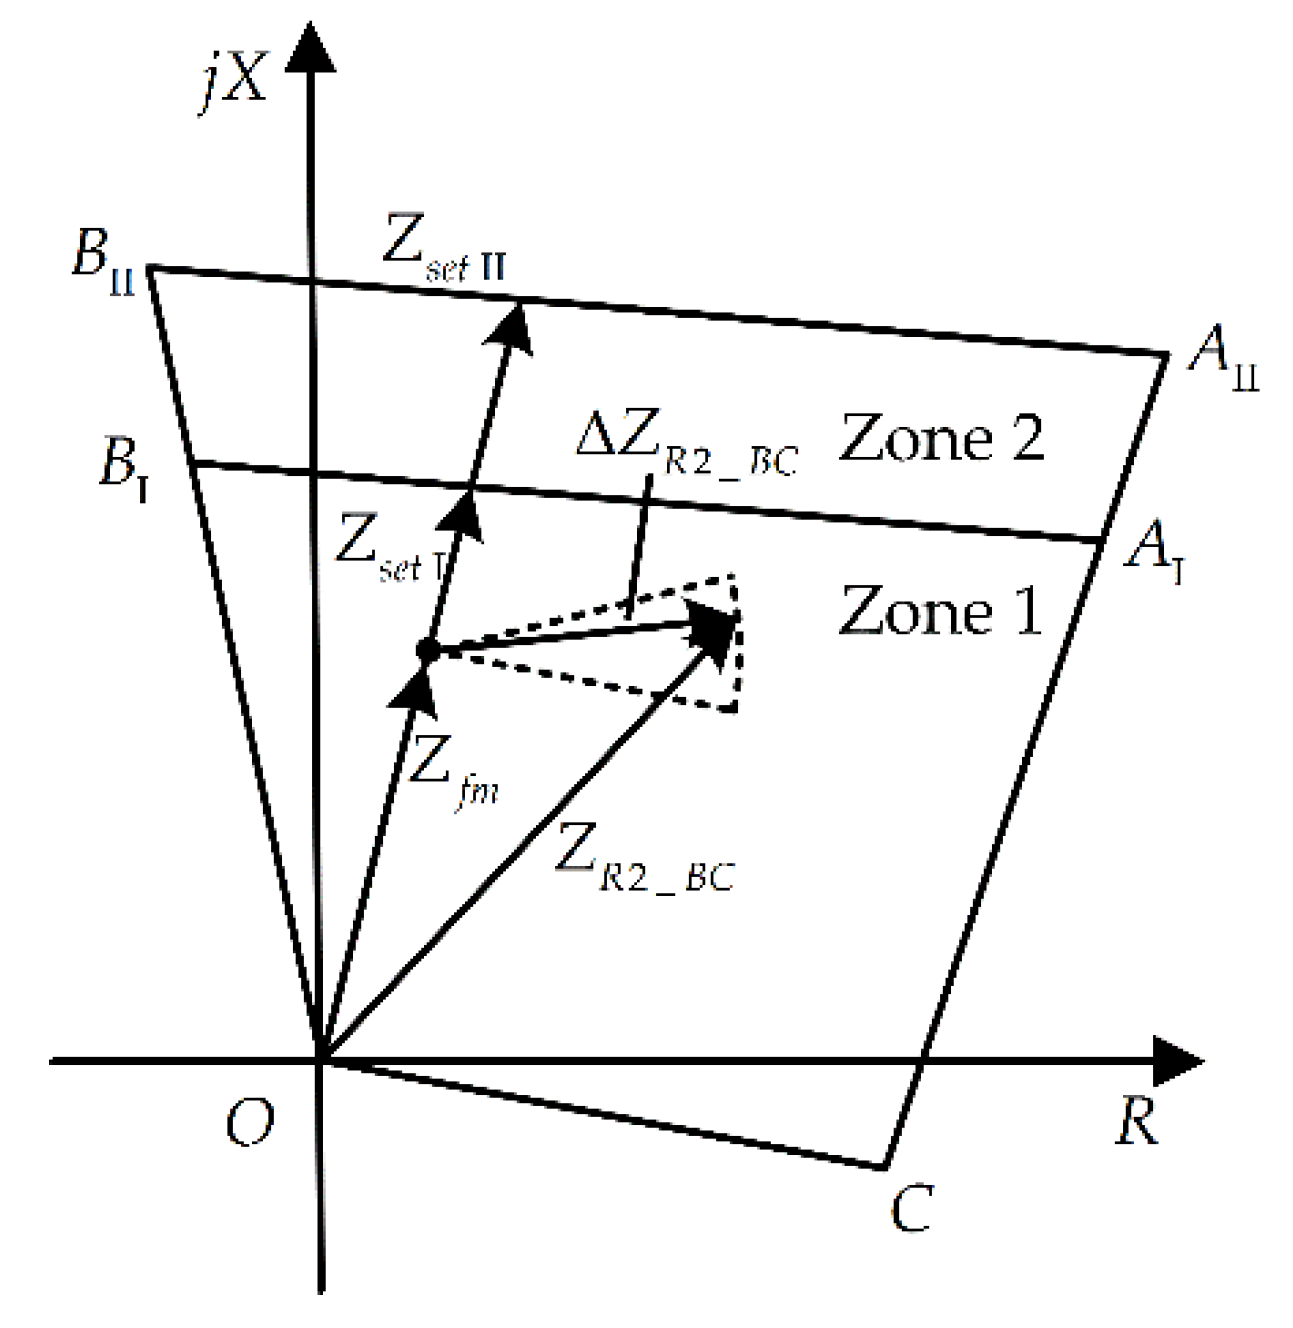
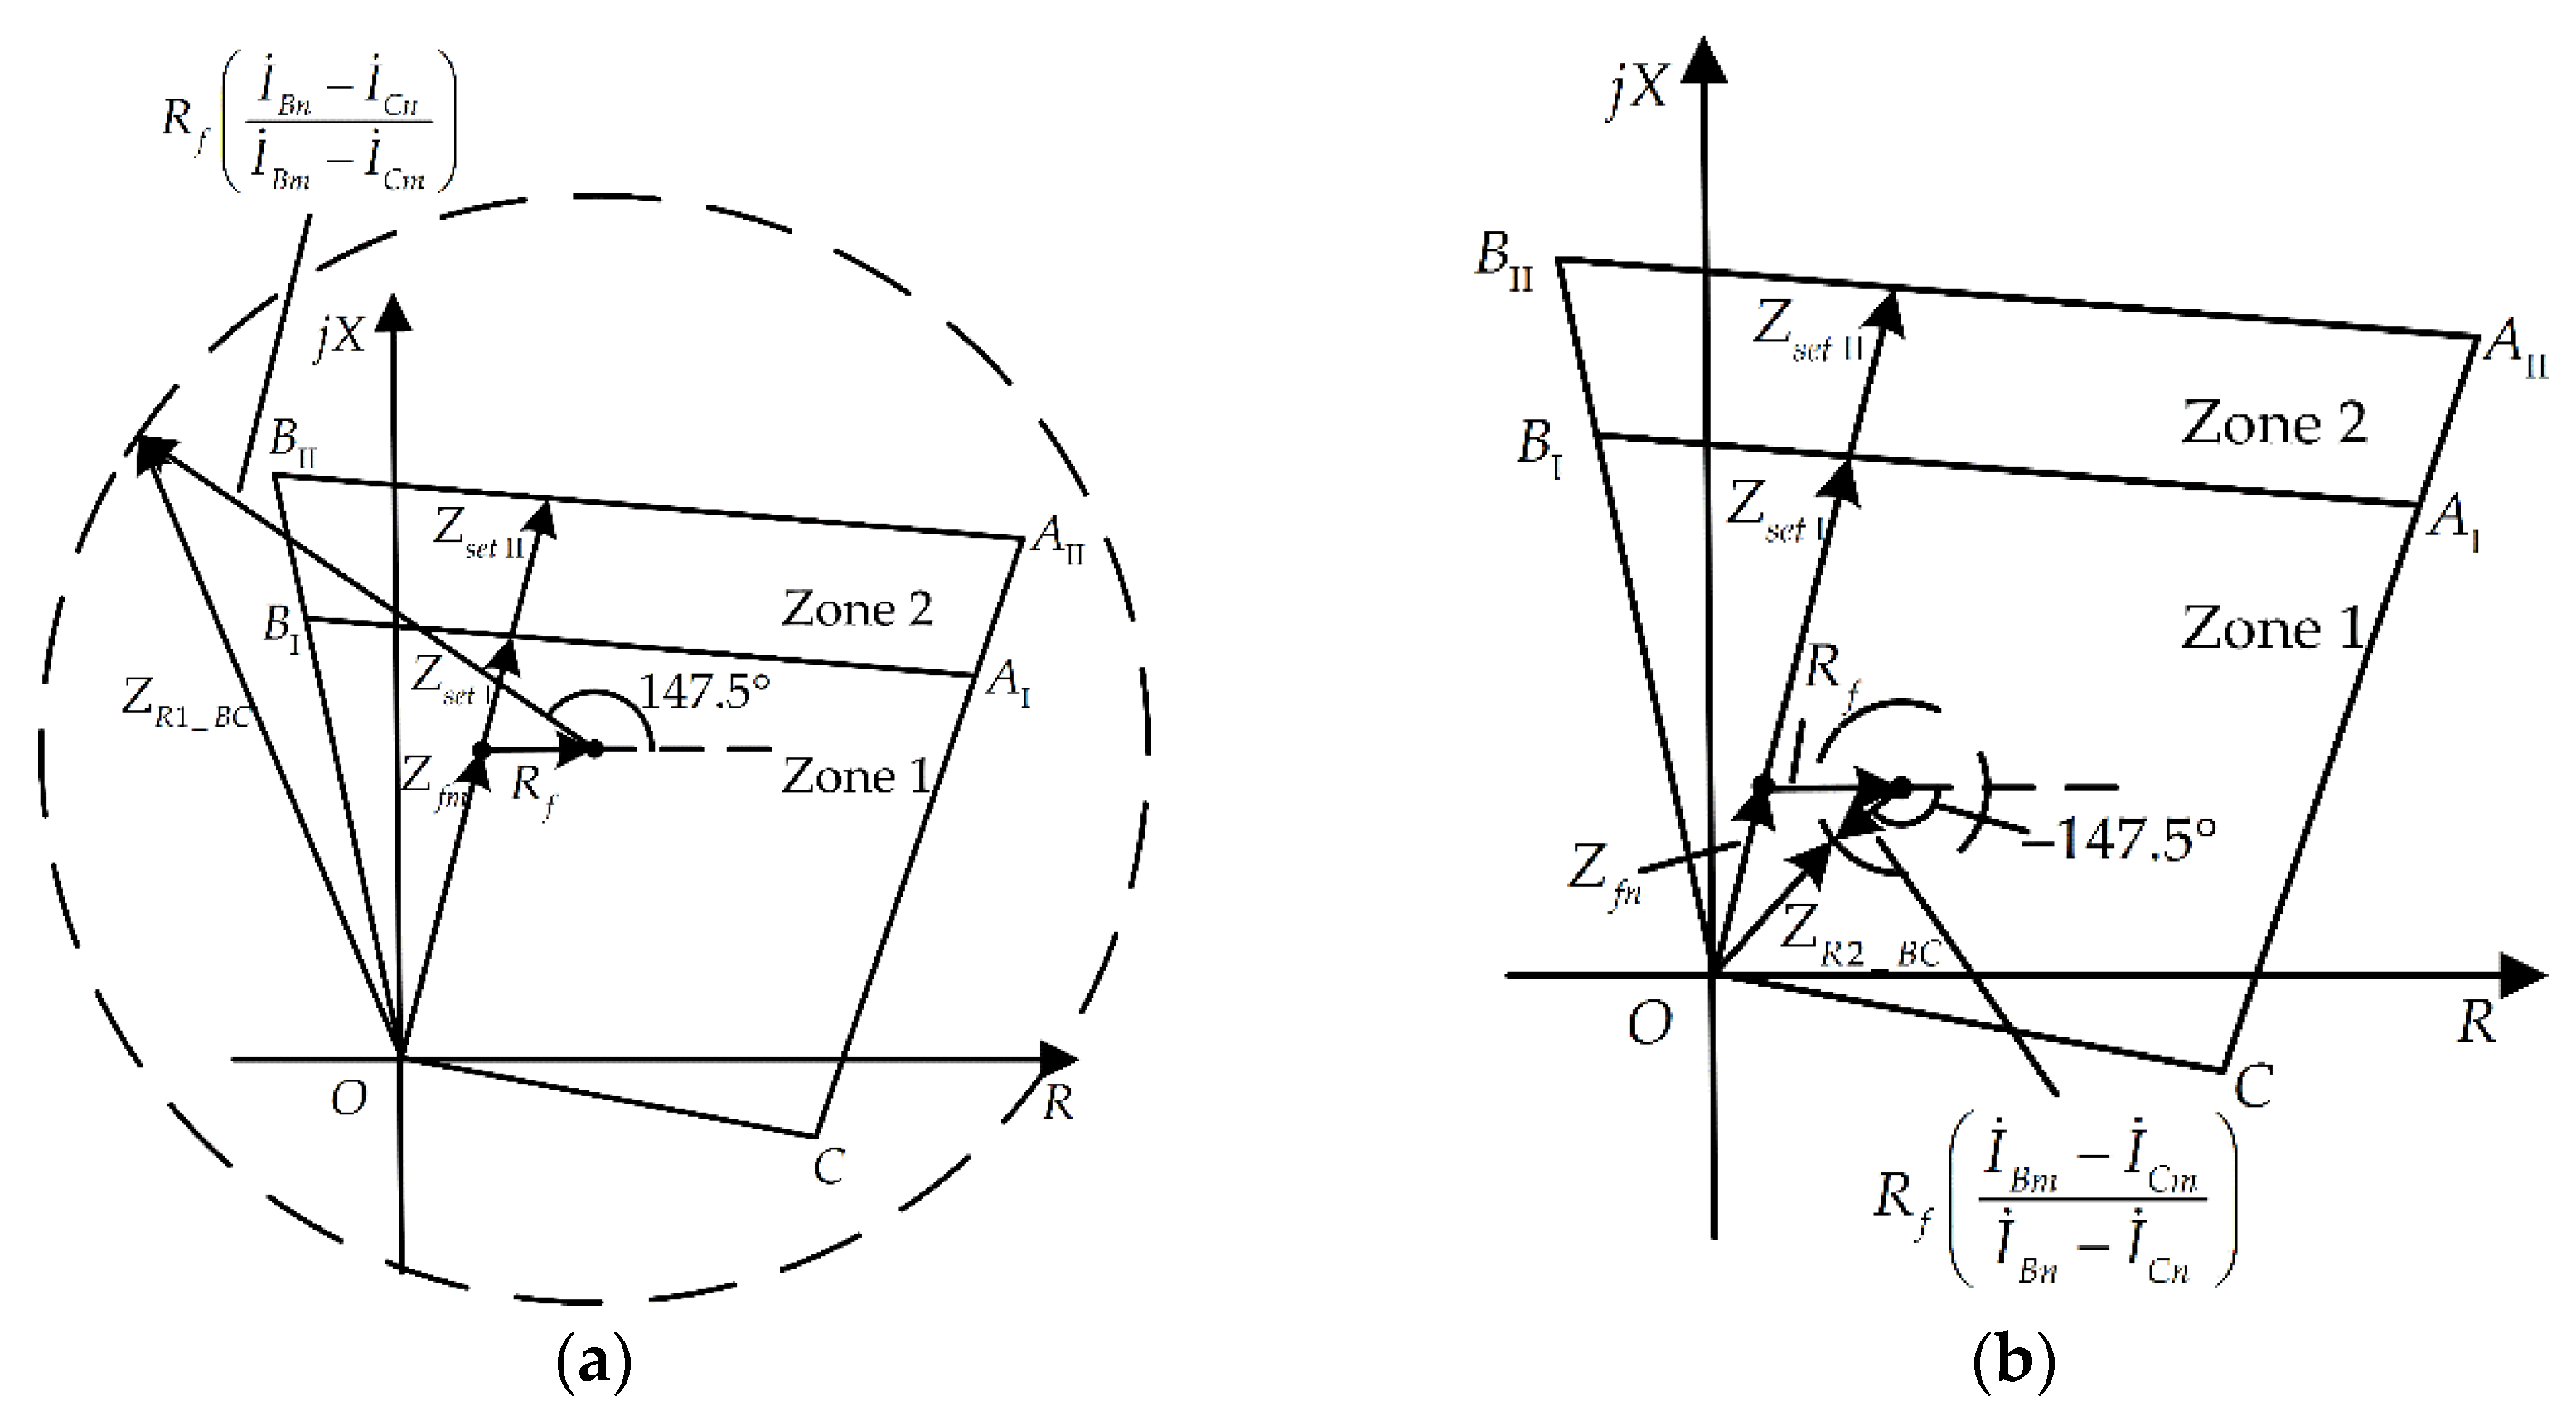
3.2. Applicability Analysis of R2

When a phase B-to-phase C fault with fault resistance 2Rf happens at f1, fault currents that flows through R1 are only provided by the interconnector, and fault currents that flows through R2 are only provided by traditional voltage sources. The impedance measured by the BC element in R2 is:
Z R 2 _ B C = U ˙ B n U ˙ C n I ˙ B n I ˙ C n = Z f n + R f ( 1 + I ˙ B m I ˙ C m I ˙ B n I ˙ C n ) Δ Z R 2 _ B C
where Zfn is the positive-sequence impedance between the relay location and the fault location f1. Obviously, ΔZR2_BC is affected by the magnitude and phase relationship between currents flowing through both ends of the line. Since | I ˙ B m I ˙ C m I ˙ B n I ˙ C n | < 1 , | Δ Z R 2 _ B C | < 2 R f . Assuming x = | I ˙ B m I ˙ C m I ˙ B n I ˙ C n | , the impedance angle of ΔZR2_BC is in the range of [ arcsin x , arcsin x ] whose span is less than 180°. Hence, when the magnitudes of fault currents flowing through both ends of line mn deviate from each other greatly, namely x is small, ΔZR2_BC is approximately resistive as a result, as shown in Figure 6. In that case, the influence of the fault current I ˙ B m I ˙ C m which is provided by the interconnector on the measured impedance of R2 can be neglected. However, when fault happens at the back side of bus n, for example at f2, the operation characteristic of R2 is the same with R1, and the difference between the impedances measured by R1 and R2 is Z m n .
In Figure 1, currents flowing through R3–R6 are not only provided by the interconnector. The network at the back of R3 or R5 contains traditional voltage sources and the interconnector, and there are only traditional voltage sources in the forward direction of R3 or R5; the network back of R4 or R6 only contains traditional voltage sources, and there are traditional voltage sources and the interconnector in the forward direction. Since the output currents of the interconnector are limited and do not increase significantly after the fault, the measured impedances of phase elements in R3–R6 are mainly influenced by the magnitude and phase relationship of currents provided by traditional voltage sources, and are scarcely influenced by the output currents of the interconnector. Therefore, for distance relays whose measured currents are not only provided by the interconnector, the impacts of fault resistances or currents injected from other branches on their measured impedances are similar to those on the measured impedances of distance relays in traditional AC networks. The analysis on the phase elements in R1-R6 under two-phase faults is also applicable to three-phase faults.

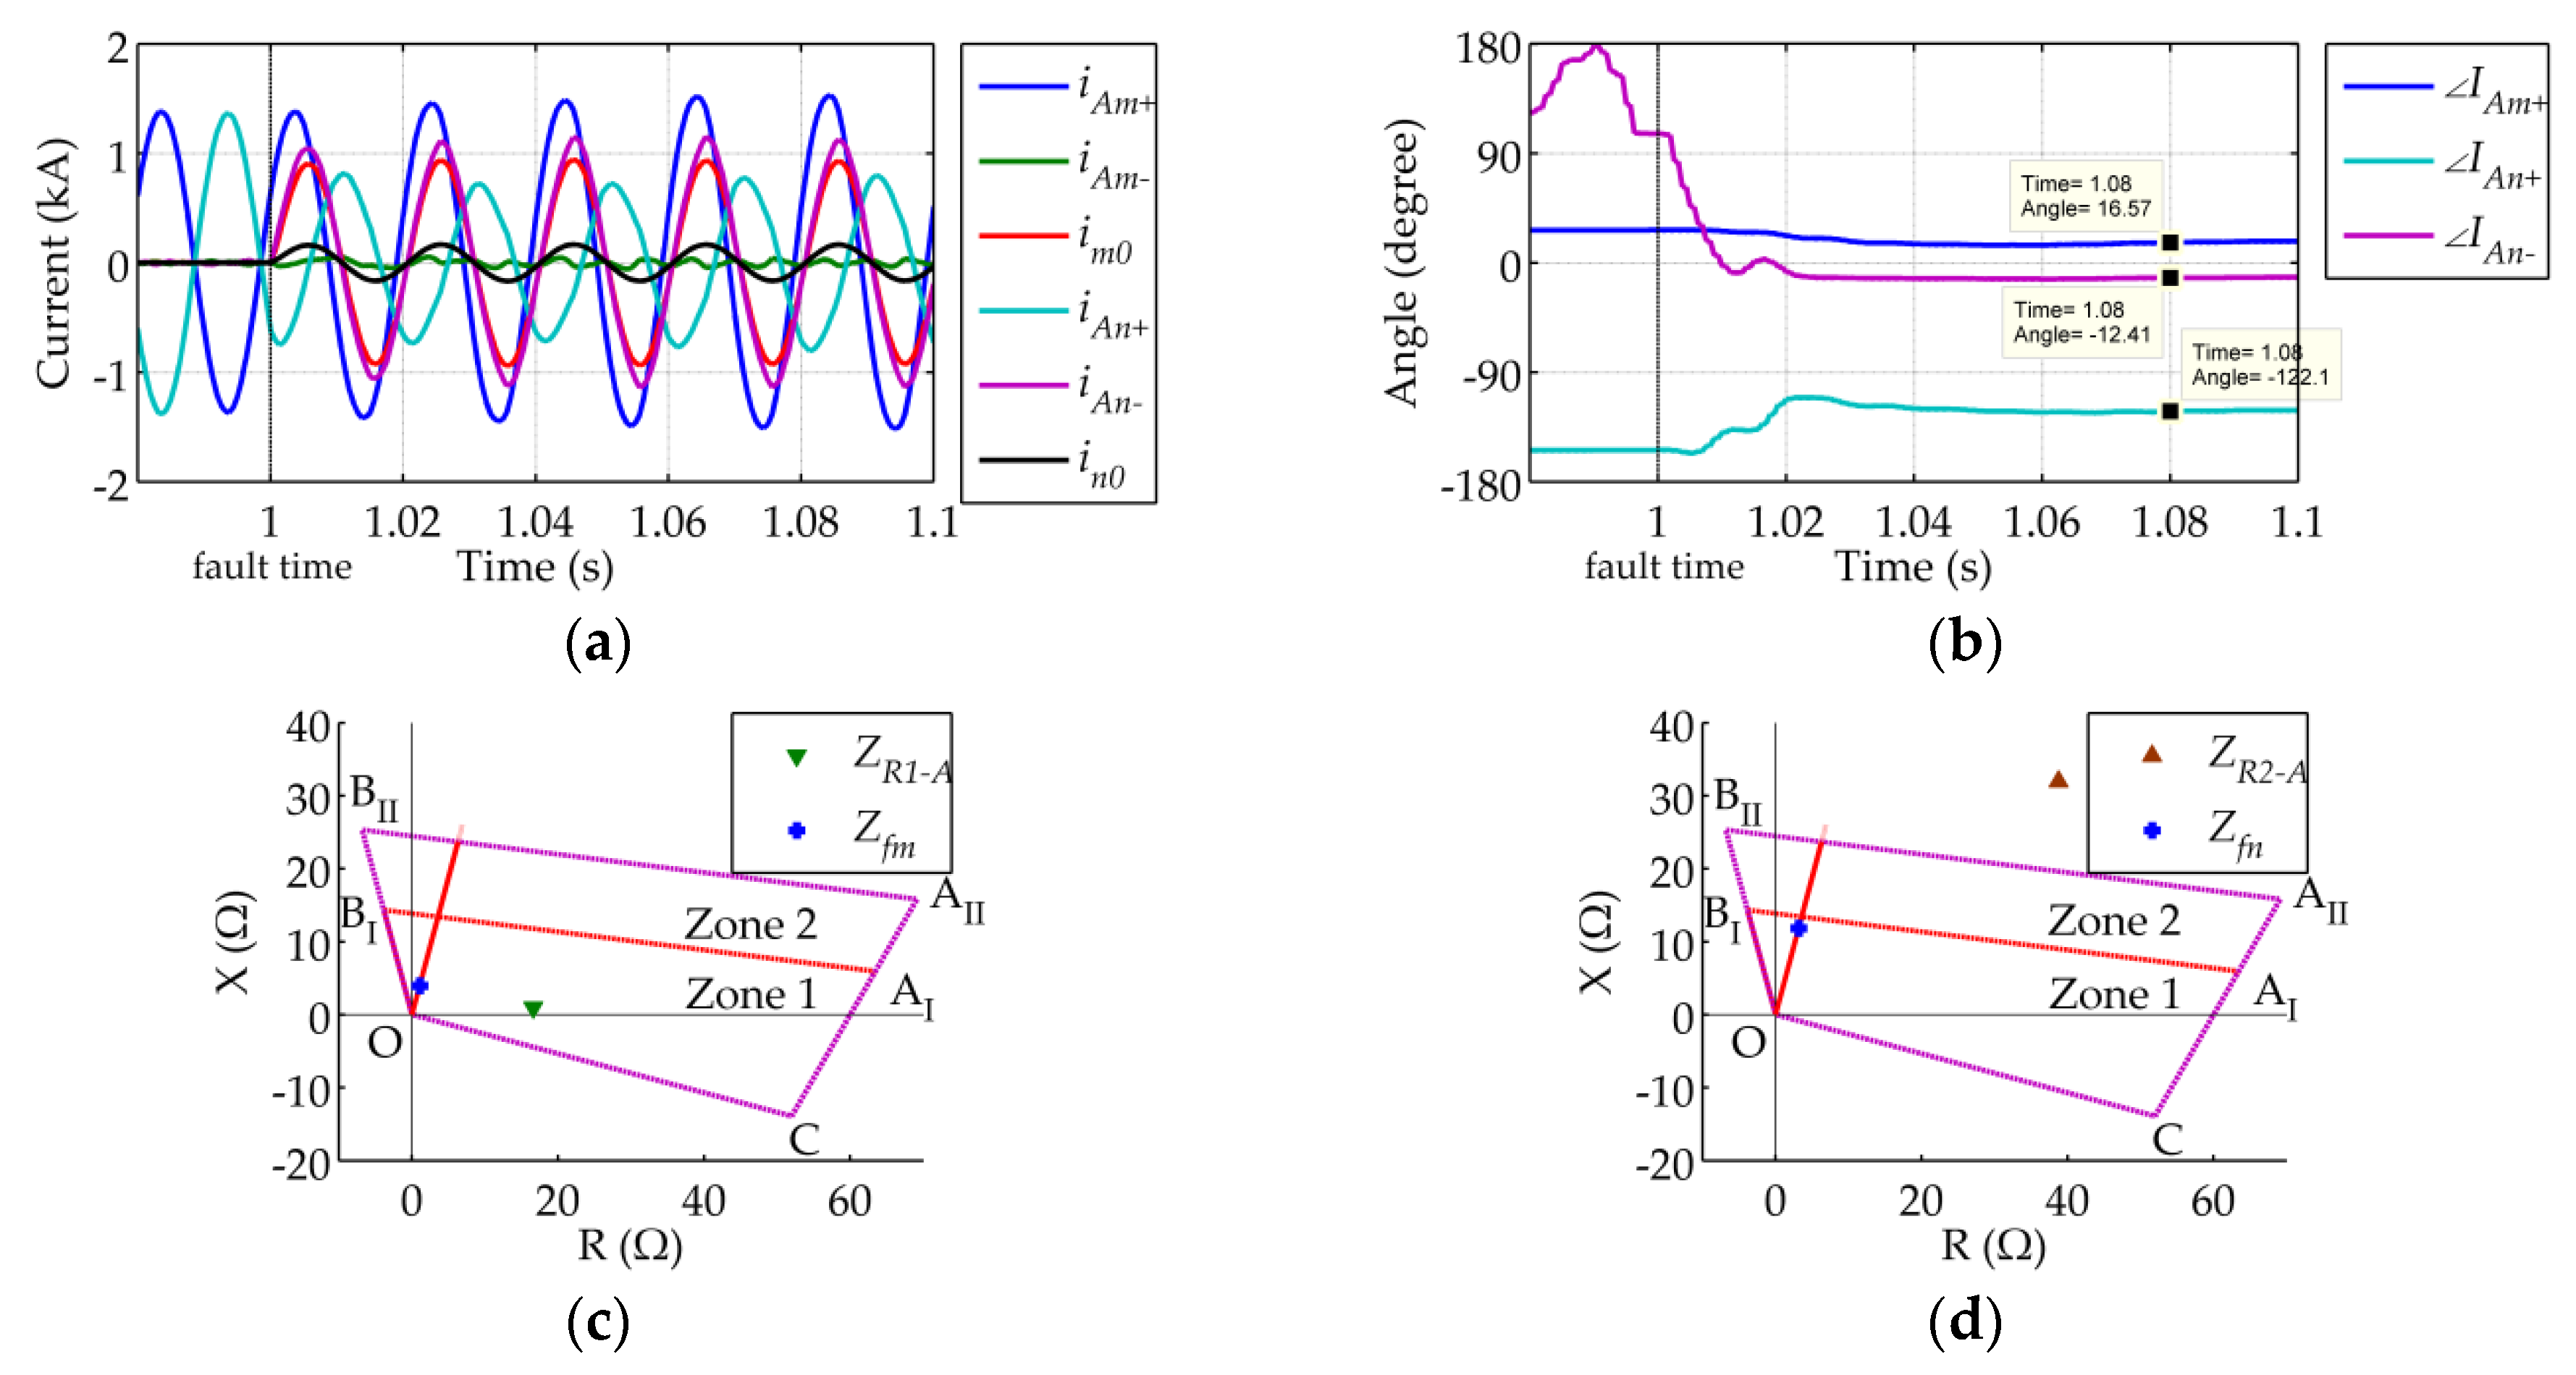
3.3. Simulation Results

The conclusions on the applicability of phase elements in R1 and R2 which are installed on the line emanating from the VSC-HVDC interconnector are verified in this section. The model of the AC/DC hybrid system shown in Figure 1 is built in PSCAD/EMTDC. The rated capacity of the interconnector is 200 MVA, the equivalent sources of AC networks at the back of bus g and bus h are Ėg = 115∠10° kV and Ėh = 115∠10° kV, and the equivalent impedances of these networks are Zg = 0.1Zng and Zh = 0.1Znh, respectively. The length of line mn, line ng and line nh are 40 km, 60 km, and 40 km, respectively. The parameters of these lines are summarized in Table 1.
Quadrilateral relays with the characteristic shape shown in Figure 3 are employed in R1 and R2. Rset = 60 Ω and ϕk is set as 75°, which represents the impedance angle of AC lines. By convention, α1 = 60°, α2 = 15°, α3 = 30°, and α4 = arctan⅛. The reach of Zone 1 is set at 85% of the line length. When setting Zone 2, injection branches are ignored [22]. The reach of Zone 2 is generally set at 120%–150% of the line length, and it must not cover beyond that of Zone 1 of the relays which are installed at the same side of adjacent lines [23]. In this paper, the reach of Zone 2 of R1 and R2 is set at 150% of the length of line mn. The setting values of R1 and R2 are as follows:
Z o p . R 1 I = Z o p . R 2 I = 0.85 Z m n
Z o p . R 1 II = Z o p . R 2 II = 1.5 Z m n
where the superscripts I and II indicate Zone I and Zone II, respectively.

3.3.1. Case Study

The output power of the interconnector at MMC-2 side is P0 = −100 MW and Q0 = 0 MVar before the fault. A phase B-to-phase C fault with 15 Ω fault resistance happens on line mn at 1 s, and the distance between R1 and the fault location is 30 km. The magnitudes and phase angles of İBmİCm and İBnİCn are shown in Figure 7. After the fault, İBmİCm, which is entirely provided by the interconnector, does not increase significantly, while İBnİCn increases dramatically. |İBnİCn| is about 3.8 times larger than |İBmİCm|, and İBnİCn leads İBmİCm by 147.5°. Therefore | I ˙ B n I ˙ C n I ˙ B m I ˙ C m | > 1 > | I ˙ B m I ˙ C m I ˙ B n I ˙ C n | , and the phase angles of I ˙ B n I ˙ C n I ˙ B m I ˙ C m and I ˙ B m I ˙ C m I ˙ B n I ˙ C n are 147.5° and −147.5°, respectively. According to Equations (3) and (6), Δ Z R 1 _ B C is inductive, and Δ Z R 2 _ B C is capacitive. In R-X diagram, the measured impedances of BC elements in R1 and R2, which are represented by Z R 1 _ B C and Z R 2 _ B C , locate at two circles respectively, as shown in Figure 8. The centers of the circles are O 1 = Z f m + R f and O 2 = Z f n + R f , and the radii of the circles are r 1 = R f | I ˙ B n I ˙ C n I ˙ B m I ˙ C m | and r 2 = R f | I ˙ B m I ˙ C m I ˙ B n I ˙ C n | , respectively. In addition, vector R f ( I ˙ B m I ˙ C m I ˙ B n I ˙ C n ) and R f ( I ˙ B n I ˙ C n I ˙ B m I ˙ C m ) have opposite phases. Therefore the impact of the interconnector on R1 and R2 is related to the magnitude of the relationship between fault currents flowing through each side of the line. In other words, it is related to the relationship between the short-circuit capacity of the traditional AC network and the rated capacity of the interconnector. In general, fault currents provided by a traditional AC network are larger than those provided by a VSC-HVDC interconnector, which makes r1 > Rf > r2. It can be seen from Figure 8 that the impact of the interconnector on R1 is greater than that on R2. Under the same fault conditions including fault type, fault location, and fault resistance, if the rated capacity of the interconnector increases, the impact of the interconnector on R1 will decrease, and the impact of the interconnector on R2 will increase.
The actual measured impedances of the BC elements in R1 and R2 are shown in Figure 9. ZR1_BC = −13.21 + 27.65j Ω, and the additional impedance caused by fault resistance is ZR1_BC = −16.36 + 15.80j Ω = 22.74∠136.0° Ω. R1 fails to trip. ZR2_BC = 6.92 + 2.87j Ω, and the additional impedance is ZR2_BC = −5.87 − 1.08j Ω = 5.97∠−10.5° Ω. R2 operates correctly. The simulation results verified the analysis in the paragraph above.

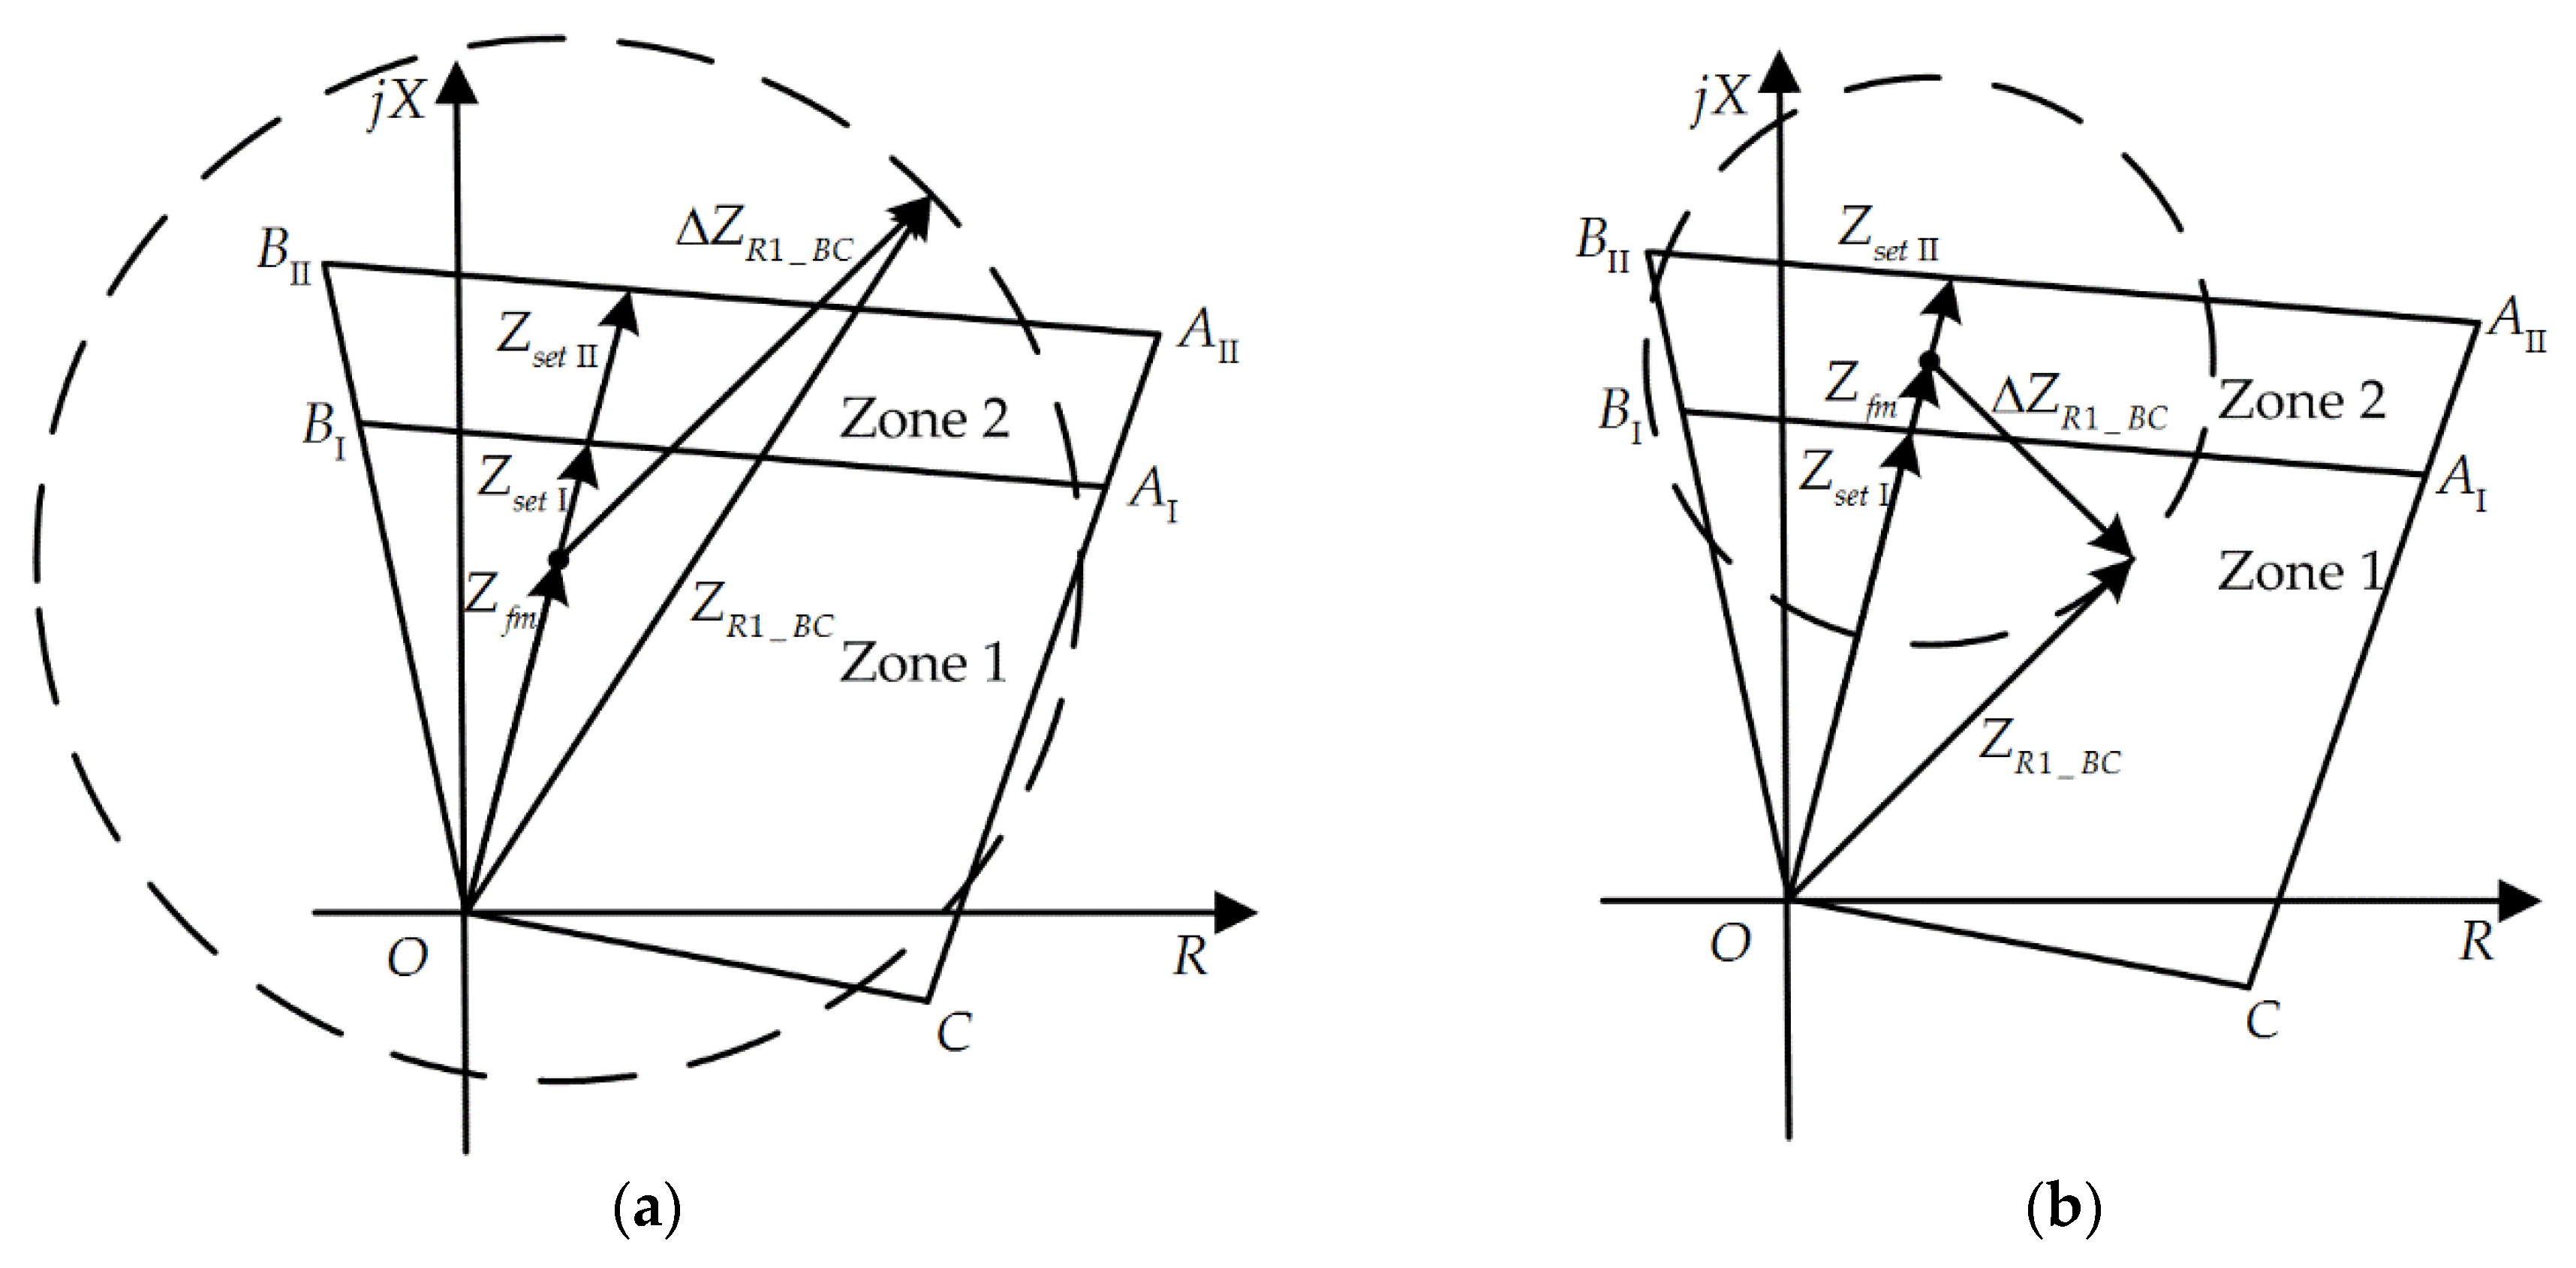
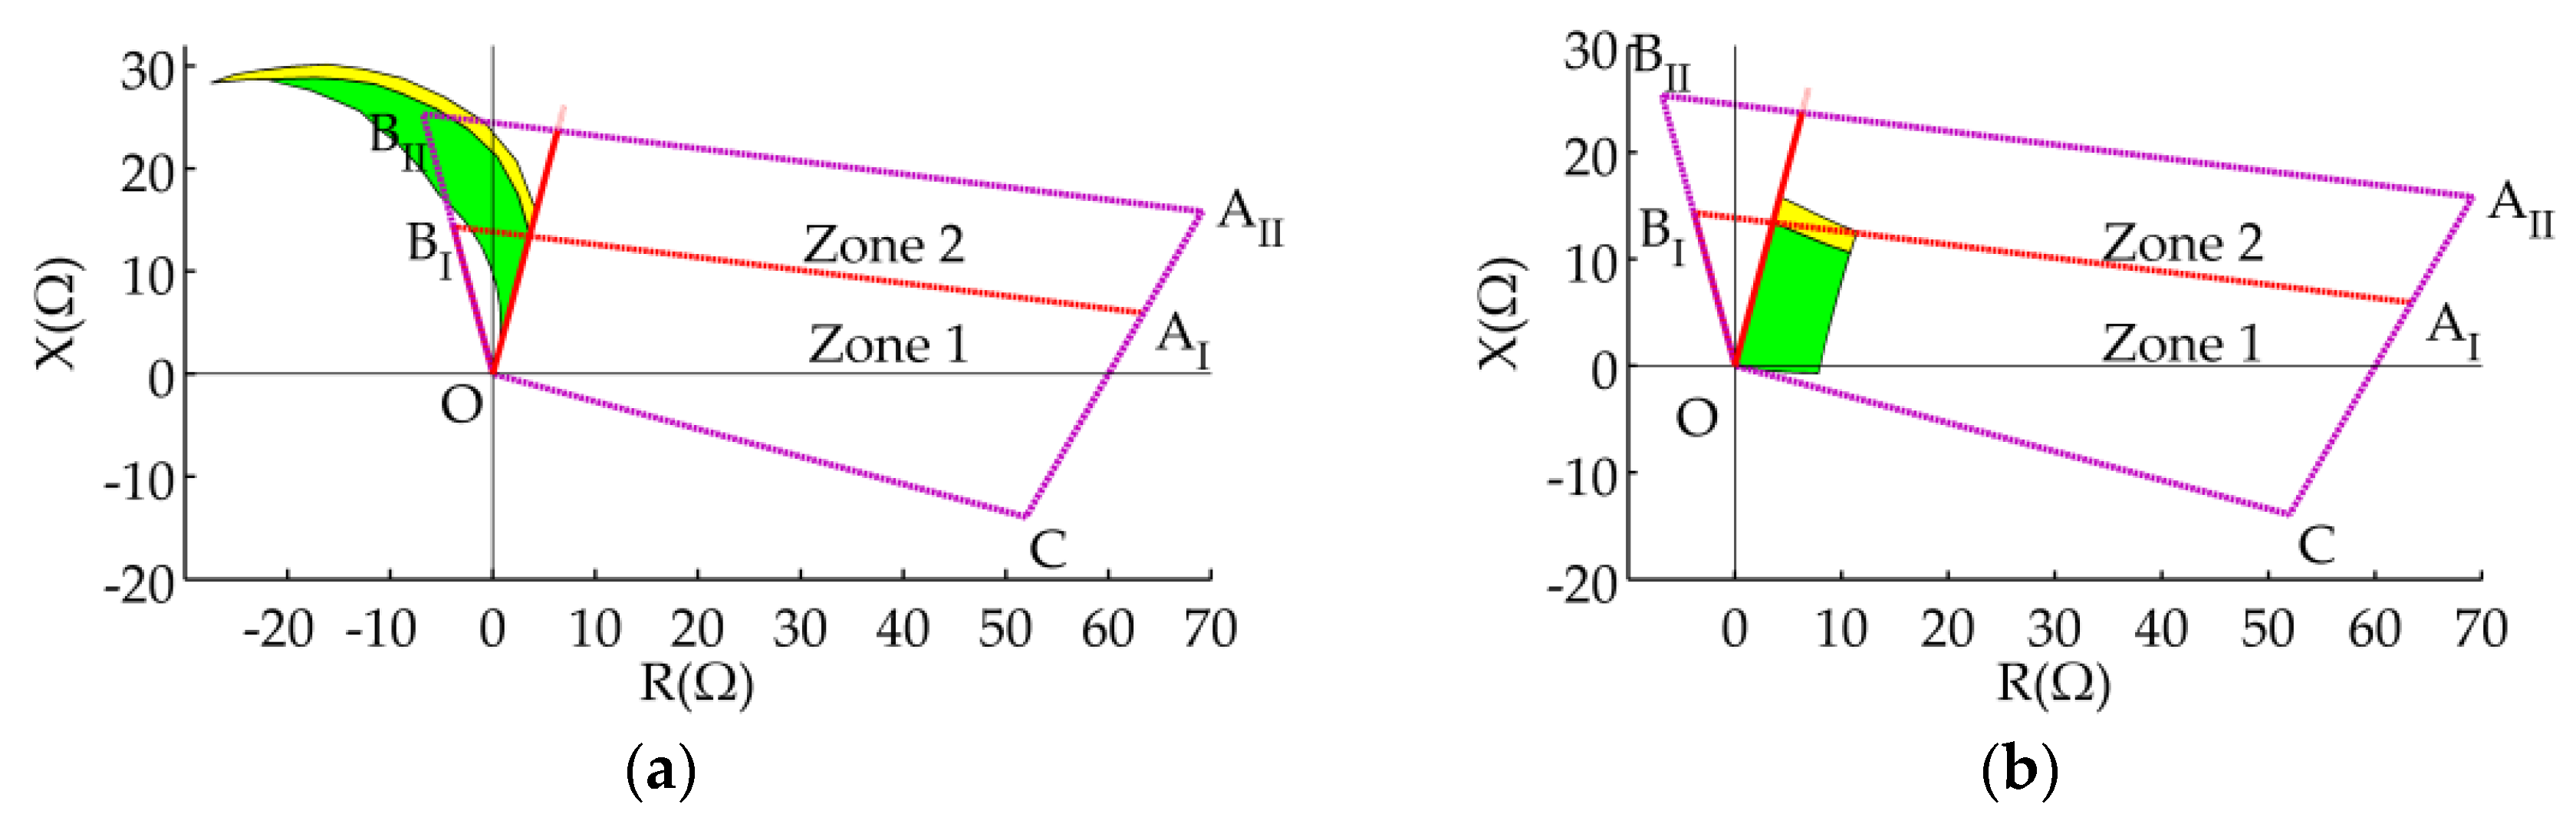
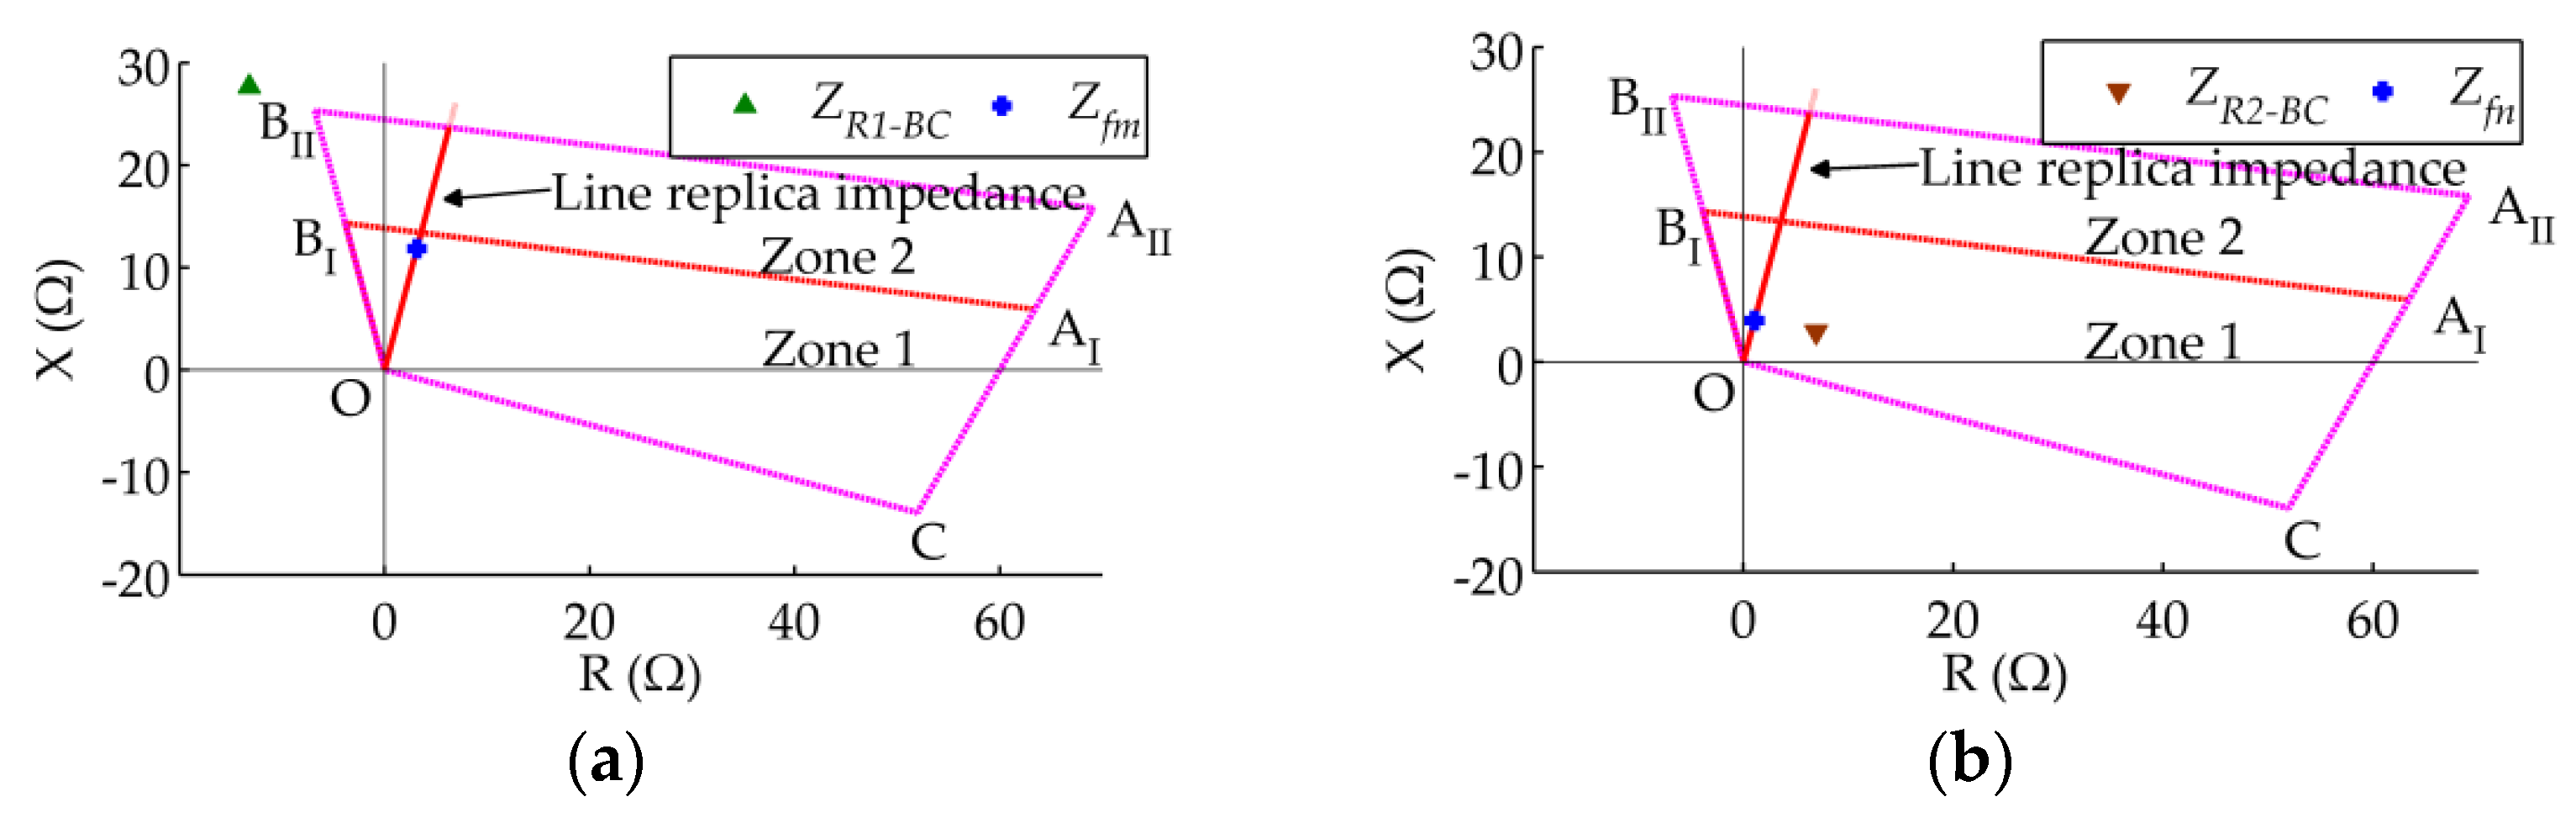
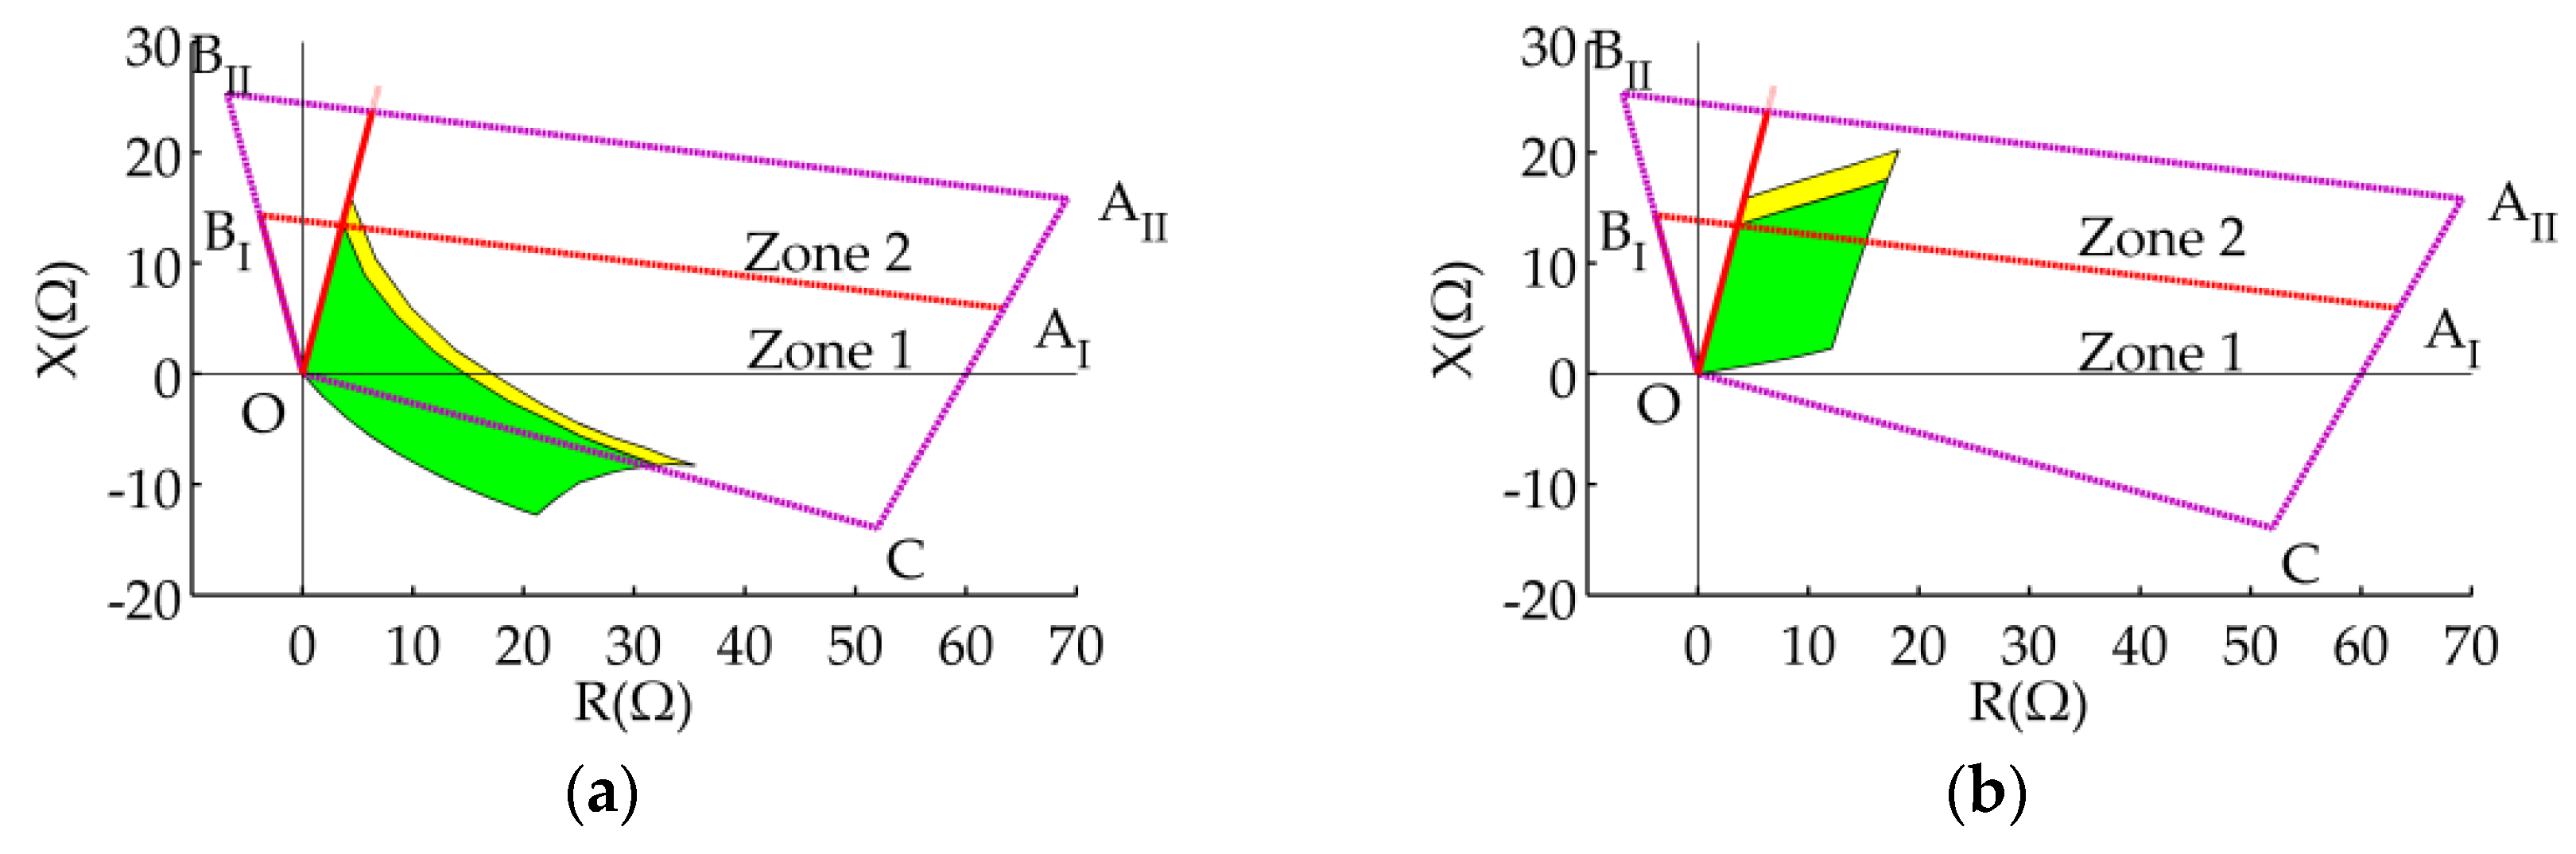
3.3.2. Area of Measured Impedance

Taking into consideration that the VSC-HVDC interconnector may operate at different states before faults, phase B-to-phase C faults with different fault resistances are simulated at different locations on line mn. The areas of measured impedances of the BC elements in R1 and R2 are obtained by changing the fault resistance (from 0 to 20 Ω) and the distance between relay location and fault location (from 0% to 100% of line mn). When the output power of the VSC-HVDC interconnector at MMC-2 side is P0 = 200 MW and Q0 = 0 MVar before the fault, the areas of measured impedances of R1 and R2 are shown in Figure 10a,b, respectively. When P0 = 100 MW and Q0 = 0 MVar, the areas of measured impedances of R1 and R2 are shown in Figure 11a,b, respectively. The green shaded area in each figure represents the area of measured impedances when the distance between relay location and fault location is within 0%–85% of line length, and the yellow shaded area represents the area of measured impedances when the distance between relay location and fault location is within 85%–100% of line length.
The influence of the interconnector on the measured impedances of the relays is related to its operation state before fault. Comparing Figure 11a with Figure 12a, and Figure 11b with Figure 12b, it can be seen that different operation states of the interconnector before fault will result in different output characteristics of the interconnector after fault. In other words, the output current İAm+ of the interconnector is different after fault, which makes the magnitudes and angles of the additional impedances measured by R1 and R2 different. Therefore the areas of measured impedances of the relays vary significantly. Comparing Figure 11a with Figure 11b, and Figure 12a with Figure 12b, it can be seen that the areas of measured impedances of R1 differ greatly from the pre-set area, while the areas of measured impedances of R2 differ little from the pre-set area. It can also be seen from Figure 11 and Figure 12 that when fault happens on line mn, Zone 1 of R1 may fail to trip under in-zone fault and overreach under out-of-zone fault, and Zone 2 of R1 may also fail to trip. However, Zone 1 of R2 may underreach or overreach only when fault happens near the end of the pre-set protection range, where the distance between the R2 and the fault location is greater than 50% of line mn, and Zone 2 of R2 can operate correctly. Therefore, the impact of the interconnector on R1 is greater than that on R2, which verifies the analysis in Section 3.2.
The simulation results in this section show that when a phase-to-phase fault with fault resistance happens on line mn, the angles of the additional impedances measured by R1 and R2 may not be within a very small range around zero, which is different from traditional AC lines with two-terminal power supplies. Therefore, traditional fixed-setting quadrilateral characteristic cannot improve the ability of the distance protections which are installed on lines emanating from the interconnector against fault resistance effectively, especially the protections located at the interconnector side such as R1. And traditional fixed-setting characteristics can cause significant error in these protections.

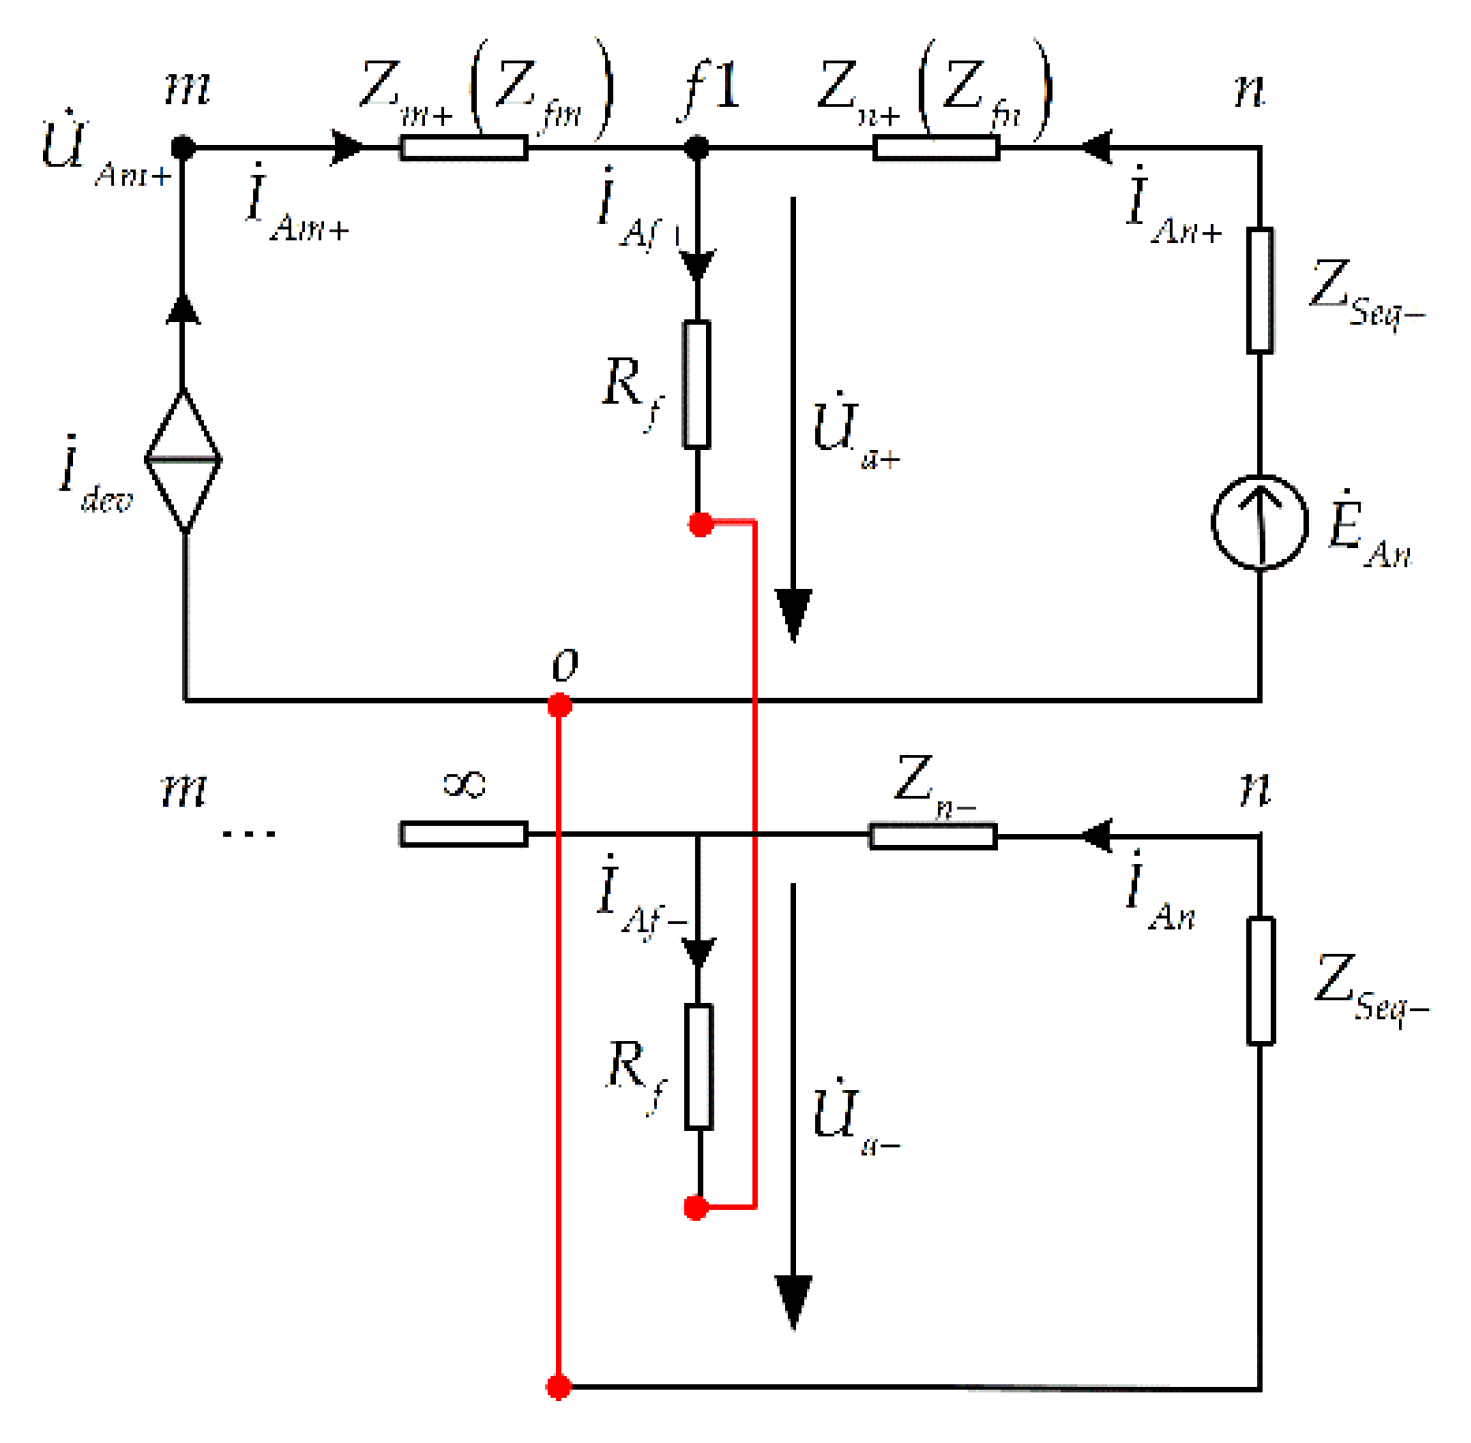
4. Applicability Analysis of Ground Distance Protection

Taking single-phase-to-ground faults that happen at f1 and f2 as example, the applicability of the ground distance protection to the line emanating from the VSC-HVDC interconnector is discussed in this section.

4.1. Applicability Analysis of R1 and R2

When a phase-A-to-ground fault with fault resistance Rf happens at f1, the impedances measured by the AG elements in R1 and R2 are:
Z R 1 _ A = Z f m + R f ( I ˙ A m + I ˙ A n I ˙ A m + K I ˙ m 0 ) B 1 Δ Z R 1 _ A
Z R 2 _ A = Z f n + R f ( I ˙ A n + I ˙ A m I ˙ A n + K I ˙ n 0 ) B 2 Δ Z R 2 _ A
where İAm and İAn are phase A currents flowing through R1 and R2, İm0 and İn0 are zero-sequence currents measured by R1 and R2, K = Z 0 Z 1 Z 1 is the zero-sequence compensation coefficient, and Δ Z R 1 _ A and Δ Z R 2 _ A are additional terms of Z R 1 _ A and Z R 2 _ A caused by fault resistance, respectively. İAn, which is provided by traditional voltage source, contains positive-sequence component, negative-sequence component and zero-sequence component, and therefore it can be expressed as İAn = İn+ + İAn + İn0; İAm contains positive-sequence component and zero-sequence component since the negative-sequence component are eliminated by the interconnector, and it can be expressed as İAm + İAm+ + İm0. The magnitude and phase angle of İAm+ is controlled by the FRT strategy of the interconnector and therefore |İAm+| does not increase significantly after the fault. The neutral-points of the converter transformers are ungrounded at the converter side, as shown in Figure 1, and therefore İm0 does not flow through the converter MMC-2 and is not controlled by the FRT strategy.
The compound sequence network of a single-phase-to-ground fault is the series of positive-sequence, negative-sequence and zero-sequence networks, and therefore the positive-sequence, negative-sequence and zero-sequence component of the fault path current meet Equation (11):
I ˙ A f + = I ˙ A f = I ˙ A f 0
where İAf+ + İAm+ + İAn+, İAf = İAn−, and İAf0 = İm0 + İn0. The compound sequence network of the fault is shown in Figure 12. İdev represents the output positive-sequence current of the interconnector. Zm+ and Zn+ have the same meaning as Zfm and Zfn, respectively. In a negative-sequence network, the negative-sequence impedance between R1 and the fault location is nearly infinite, and Zn is the negative-sequence impedance between R2 and the fault location, which equals to Zn+. Zm0 is the zero-sequence impedance between R1 and the fault location, and Zn0 is the zero-sequence impedance between R2 and the fault location. ZSeq+, ZSeq and ZSeq0 are equivalent positive-sequence impedance, negative-sequence impedance and zero-sequence impedance of the AC network at the back side of bus n, respectively. Other symbols have been mentioned in the preceding paragraphs. The impedance of the converter transformer is neglected in this paper. If the line-to-ground admittance is ignored, the relationship of the sequence currents is:
I ˙ A m + + I ˙ A n + = I ˙ A n = I ˙ m 0 + I ˙ n 0
The negative-sequence network only contains the bus n side of the fault location, and the zero-sequence network is the parallel circuit of zero-sequence equivalent impedances, ZΣm0 and ZΣn0, at each side of the fault location. Assuming that impedance angles of ZΣm0 and ZΣn0 are equal, İm0 is in phase with İn0, and in this case İAf+ and İAf (İAn) are also in phase with İn0 according to Equations (11) and (12).
According to Equation (12), B 1 and B 2 in Equations (9) and (10) can be expressed as Equations (13) and (14), respectively:
B 1 = 3 ( I ˙ m 0 + I ˙ n 0 ) I ˙ A m + + ( 1 + K ) I ˙ m 0
B 2 = 3 ( I ˙ m 0 + I ˙ n 0 ) I ˙ A n + + I ˙ m 0 + ( 2 + K ) I ˙ n 0
It is assumed that the zero-sequence impedance angle of AC line is equal to positive-sequence impedance angle in this paper, and therefore the zero-sequence compensation coefficient K is a real number. According to the analysis above, İm0 is in phase with İn0, İAm+ is directly controlled by the interconnector, and İAn+ is provided by traditional voltage sources. It can be seen from Equations (13) and (14) that the additional impedances ΔZR1_A and ΔZR2_A are determined by the magnitude and phase relationship among İAm+, İAn+, İm0 and İn0.

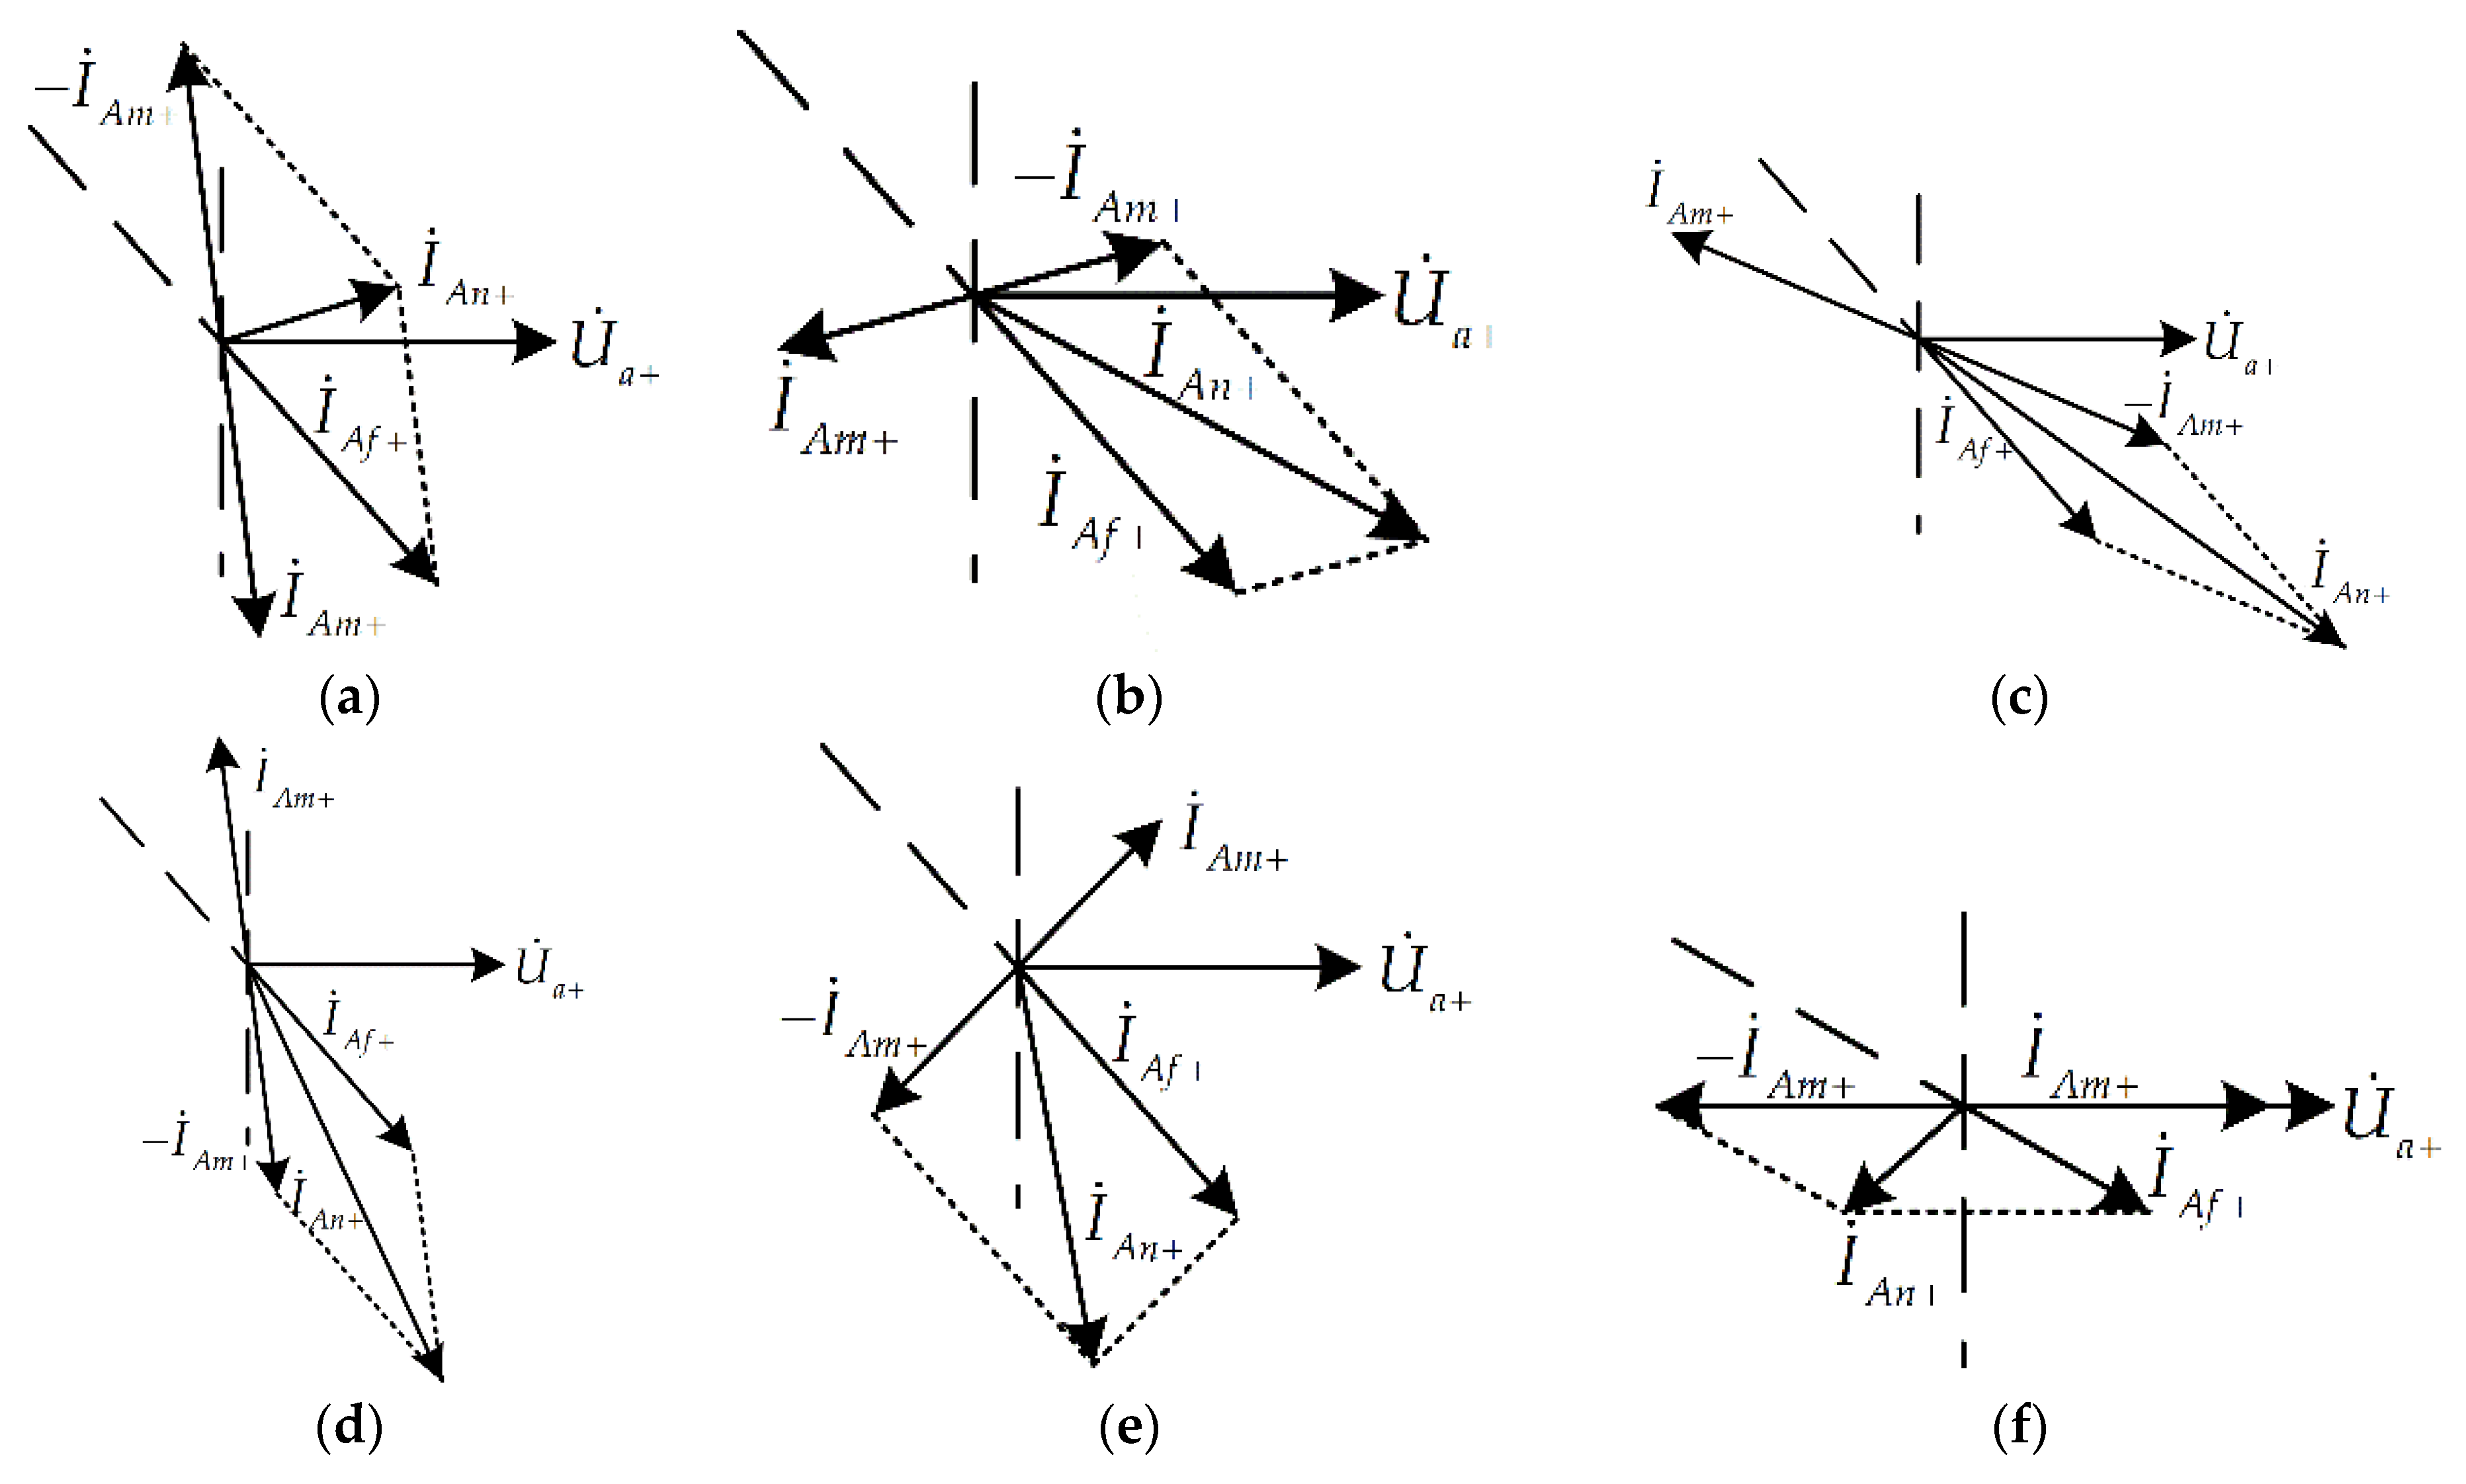
4.1.1. Analysis of the Phase Relationship between Positive-Sequence Voltage U ˙ a + at the Fault Location and İAm+

Figure 12 is simplified as Figure 13 for the analysis below. It can be observed that the phase relationship between U ˙ a + and İAm+ is related to the active power P’ and reactive power Q’ which are injected into the fault path from the interconnector side of the fault location, as shown in Figure 14, and is also related to the output active power P and reactive power Q of the interconnector. According to Section 2, if a ≥ 0.9 after fault, the interconnector can still work in all four quadrants and the phase angle difference between U ˙ a + and İAm+ can be any value in the range of 0°–360°. If a < 0.9, the interconnector can work in quadrant I and the quadrant II where Q > 0 , and the phase angle by which the output positive-sequence voltage of interconnector leads İAm+ is in the range of 0°–180°; if the line loss between the interconnector and the fault location is ignored, the phase angle by which U ˙ a + leads İAm+ is also in the range of 0°–180°.

4.1.2. Analysis of the Range of the Angle of Additional Impedance

It can also be seen from Figure 13 that the phase angle by which U ˙ a + leads İAf+ equals the impedance angle of 3Rf + ZΣ− + ZΣ0, which is in the range of 0°–75°. Due to the fact İAf+ = İAm+ + İAn+, the phase angles of the three variables increase or decrease in the sequence of İAm+, İAf+ and İAn+. The possible phase relationships among İAm+, İAf+ and İAn+ are shown in Figure 15.
In Figure 15a–c, İAm+ lags İAf+ and İAf+ lags İAn+, and the phase angle difference between İAm+ and İAf+ increases from Figure 15a to 15c; in Figure 15d–f, İAm+ leads İAf+ and İAf+ leads İAn+, and the phase angle difference between İAm+ and İAf+ decreases from Figure 15d to 15f. The actual relationship among İAm+, İAf+ and İAn+ is related to the output power of the interconnector and the impedance angle of 3Rf + ZΣ− + ZΣ0 shown in Figure 13. It can be seen from Equations (13) and (14) that if İAm+ lags İAf+ and İAf+ lags İAn+, ΔZR1_A will be inductive and ΔZR2_A will be capacitive, and vice versa. According to the analysis above, the phase angle by which U ˙ a + leads İAf+ is in the range of 0°–75°. If the phase angle difference between U ˙ a + and İAm+ is in the range of 0°–360°, the phase angle difference between İAm+ and İAf+ (or İm0, İn0) will also be in the range of 0°–360°. According to İAn+ = İAf+İAm+, if |İAm+| > |İAf+|, the phase angle difference between İAn+ and İAf+ (or İm0, İn0) will also be in the range of 0°–360°; if |İAm+| < |İAf+| and |İAm+|/|İAf+| = d < 1, the phase angle difference between İAn+ and İAf+ (or İm0, İn0) will be in the range of [−arcsind,arcsind], which is a relatively small range. Therefore in Equations (13) and (14), if the phase angle difference between İAm+ and (1 + K) İm+ is large, and |İAm+| is close to |(1 + K) İm0| or |İAm+| >> |(1 + K) İm0|, the impedance angle of ΔZR1_A will be probably quite large; similarly, if the phase angle difference between İAn+ and İm0 + (2 + K) İm0 is large, and |İAn+| is close to |İm0 + (2 + K) İn0| or |İAn+| >> |İm0 + (2 + K) İn0|, the impedance angle of ΔZR2_A will be probably quite large. Therefore when a single-phase-to-ground fault happens on line mn, the additional impedances caused by fault resistance can make the measured impedances of R1 and R2 differ greatly from Zfm and Zfn, and probably lead to malfunction of R1 and R2. Based on the analysis above, traditional ground distance elements in R1and R2 are unreliable. When a single-phase-to-ground fault with fault resistance happens on line mn and the fault resistance is not very large, the voltage of the interconnector AC bus drops dramatically, the magnitude and phase angle of its positive-sequence component change significantly after the fault, and the output characteristics of the interconnector are related to the operation state before the fault, fault location, fault resistance, etc. In this case, the output currents and voltages of the interconnector are controllable, and therefore the influence of the interconnector on the measured impedance of distance relays differs greatly from that of traditional voltage sources, which confirms the above analysis in this section. However, it is worth pointing out that if the fault resistance is very large, for example 50 Ω, the voltage of the interconnector AC bus drops very little, the output power of the interconnector is almost the same as before the fault, and the magnitude and phase angle of its positive-sequence component change insignificantly after the fault. Although the negative-sequence component of the output current is suppressed by the interconnector, the negative-sequence current is also very small when a single-phase-to-ground fault with large fault resistance happens on a traditional AC line. Therefore, under single-phase-to-ground fault conditions with a large fault resistance, there is no obvious difference between the output characteristics of the VSC-HVDC interconnector and those of the traditional voltage source whose output voltages before the fault are the same as the interconnector, and the impacts of the interconnector on distance relays are the same with this traditional voltage source.
When a bolted phase-A-to-ground fault happens at f2, the impedance measured by the AG element in R1 is:
Z R 1 _ A = Z m n + Z f m + Z f m ( I ˙ A h + K I ˙ h 0 I ˙ A m + K I ˙ m 0 ) C 1 Z R 1 _ A
where İAh is the phase A current which is injected into line ng from line nh, and İh0 is the zero-sequence component of İAh. Similar to the analysis on the non-bolted single-phase-to-ground fault that happens at f1, since the magnitude and phase relationship among İAh+, İAm+ and other components in C 1 is influenced by the operation state of the interconnector before fault, the FRT strategy of the interconnector and actual fault conditions, the magnitude and impedance angle of the additional term ΔZ’R1_A are uncertain, which may lead to malfunction of R1. Similarly, R2 may misoperate when a backward fault happens.
The applicability analysis on ground distance elements in R3–R6 is similar to that on phase elements. Since the currents flowing through R3–R6 are not only provided by the interconnector, the measured impedances of ground distance elements in R3–R6 are mainly influenced by the magnitude and phase relationship of currents provided by traditional voltage sources, and are scarcely influenced by the output currents of the interconnector. Based on the analysis presented in Section 3 and Section 4, it can be seen that traditional phase-to-phase distance protection principle and ground distance protection principle are still applicable to AC lines which are not directly emanating from the VSC-HVDC interconnector.

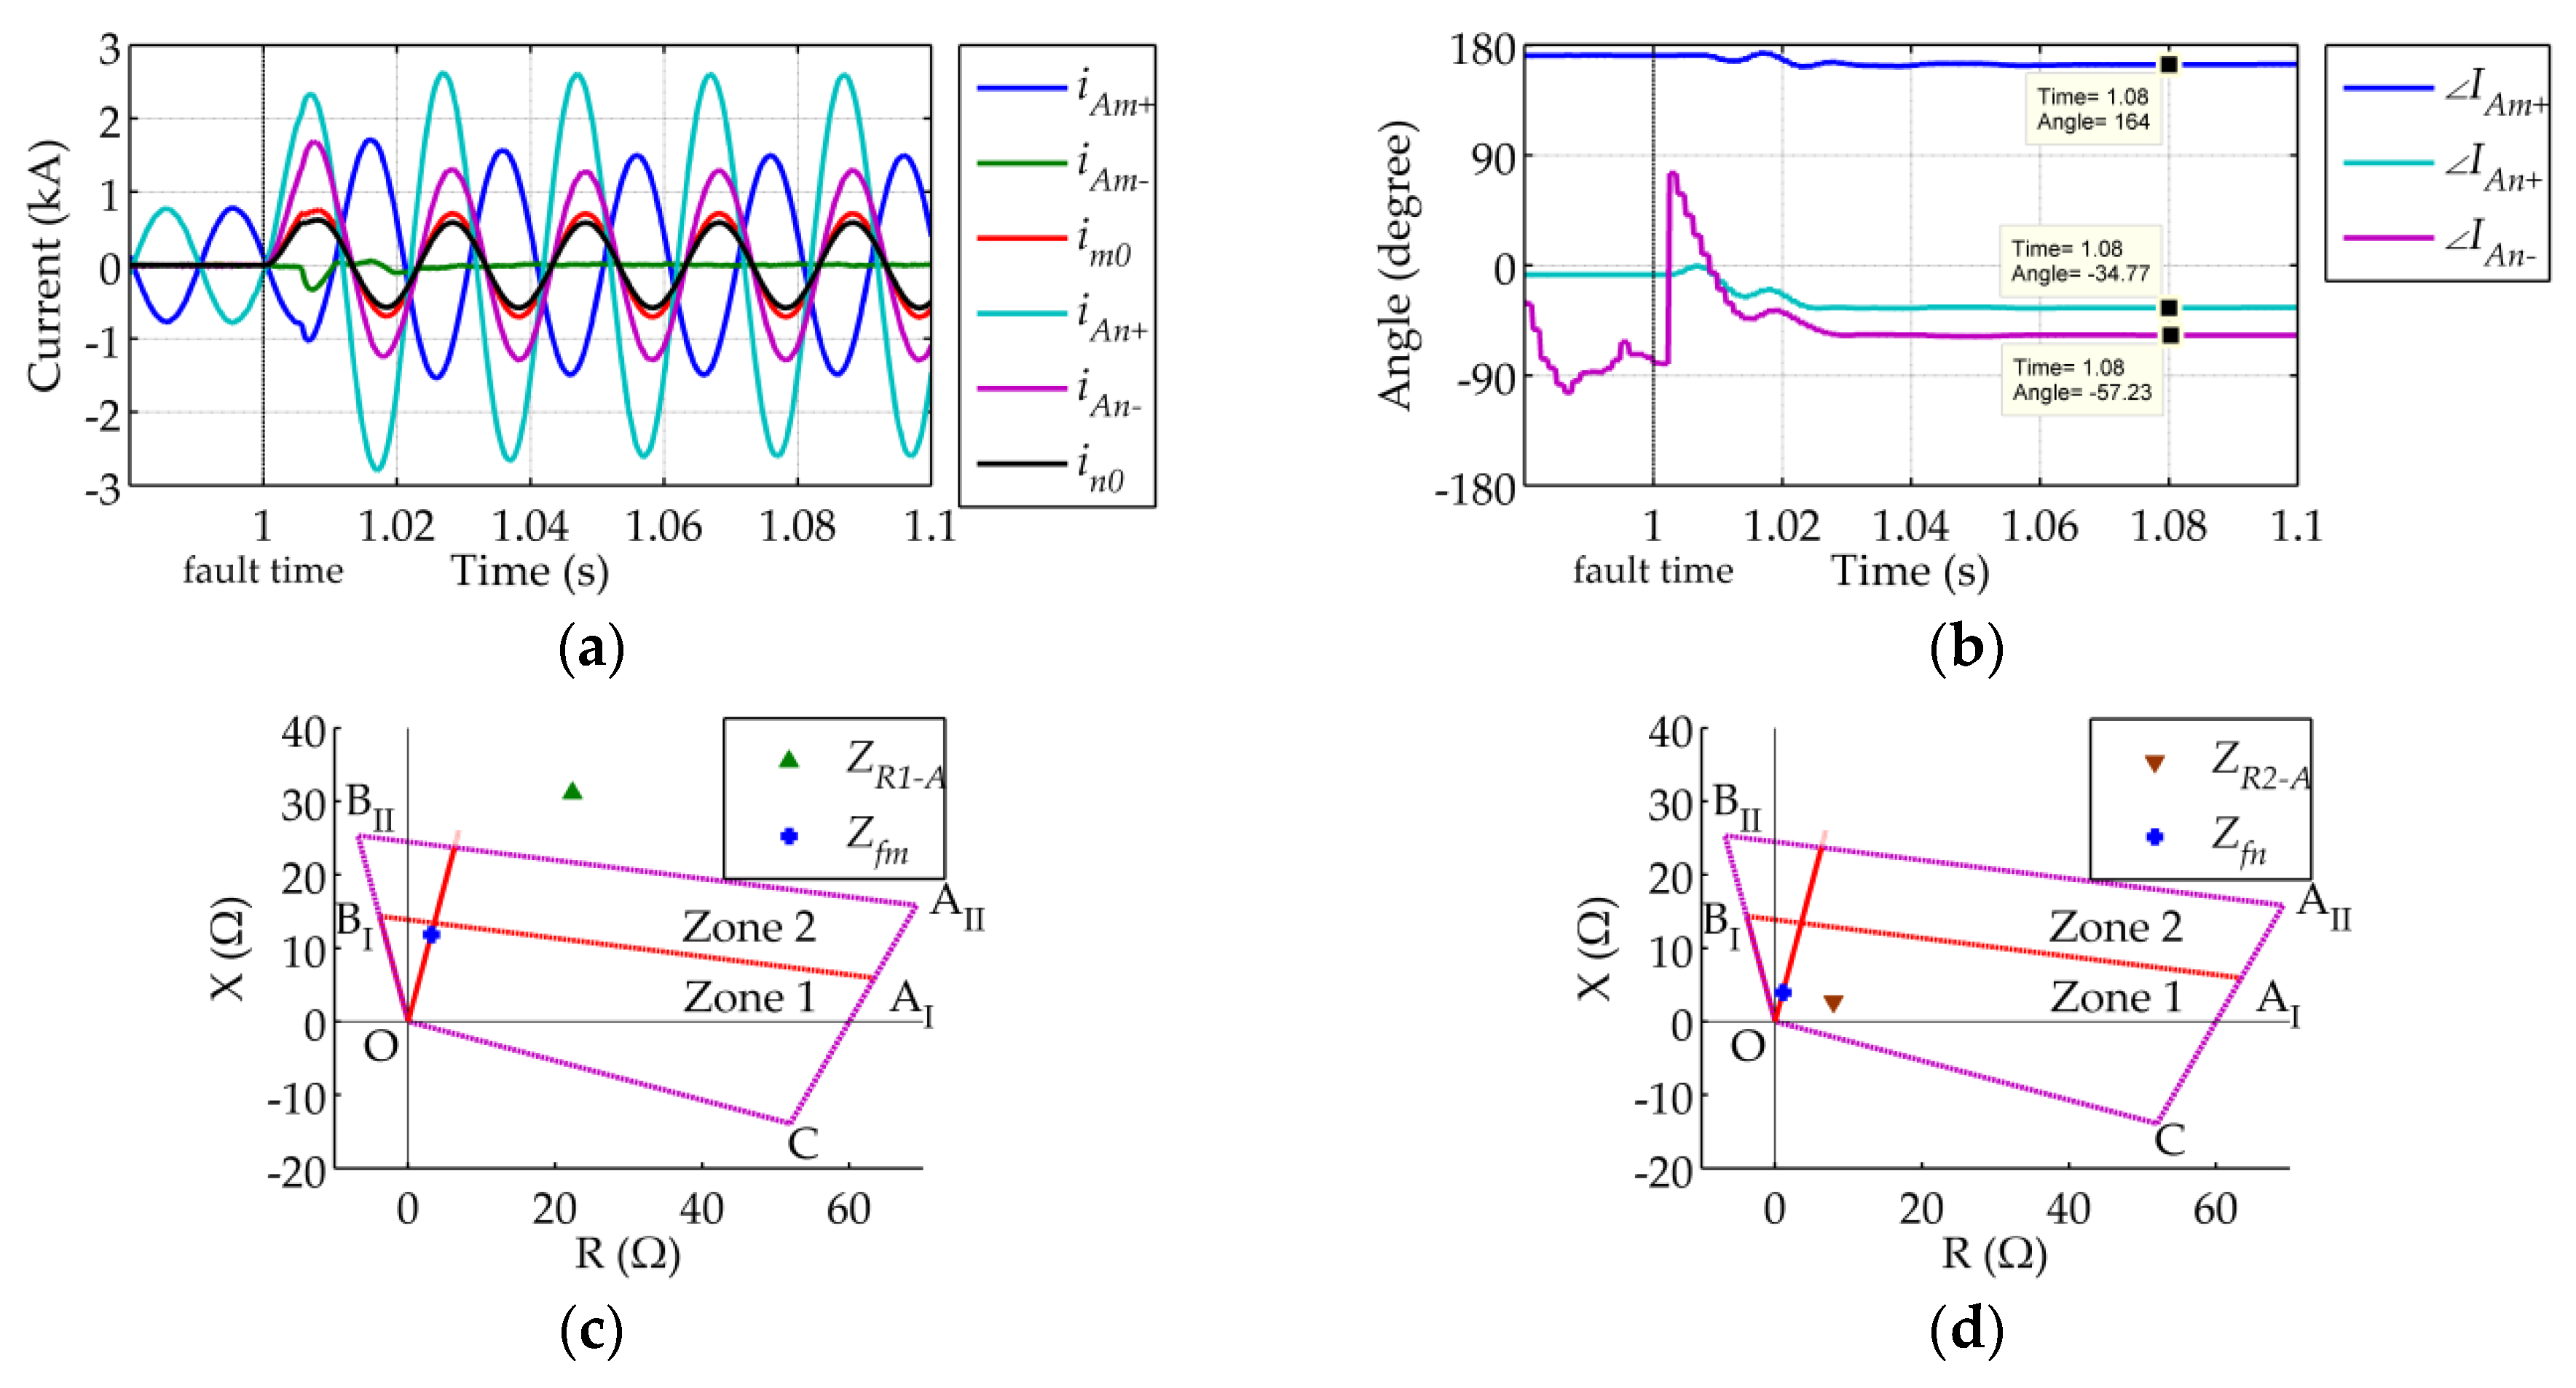
4.2. Simulation Results

The simulation model and quadrilateral relays in Section 3.3 are employed to verify the theoretical analysis in Section 4.1.

4.2.1. Case 1

The output power of the VSC-HVDC interconnector at the MMC-2 side is P0 = 200 MW and Q0 = 0 MVar before the fault. A phase-A-to-ground fault with 20 Ω fault resistance happens on line mn at 1 s, and the distance between R1 and the fault location is 10 km. The positive-sequence components, negative-sequence components and zero-sequence components of the currents flowing through R1 and R2, as well as the impedances measured by the AG elements in R1 and R2, are shown in Figure 16. As displayed in Figure 16a, the negative-sequence component İAn is in phase with İm0 and İn0, and İAm is nearly zero, which agrees with the theoretical analysis in Section 4.1. It can be seen from Figure 16b that İAm+ leads İAn and İAn leads İAn+, namely that İAm+ leads İAf+ and İAf+ leads İAn+, which matches with the phase relationship shown in Figure 15f. ZR1_A = 16.654∠3.2° Ω, ZR1_A = 15.866∠−10.9° Ω, and the AG element in R1 operates correctly, as shown in Figure 16c. ZR2_A = 50.239∠39.5° Ω, ZR2_A = 40.902∠29.4° Ω, and the AG element in R2 fails to trip, as shown in Figure 16d.
Since the magnitude and phase angle of İAm+ are directly controlled by the interconnector, and İAm+ + İAn+ = İAf+ = İAf = İAf0, the magnitude and phase angle of İAn+ are also influenced by the control of the interconnector. It can be seen from this simulation that İAm+ leads İAn (or İm0, İn0) by 29.0°, and therefore ZR1_A is slightly capacitive with a small impedance angle and R1 operates correctly. However, İAn+ lags İAn (or İm0, İn0) by 109.7°, and therefore ZR2_A is inductive and the impedance angle of ZR2_A is large, which makes R2 fail to trip.

4.2.2. Case 2

The output power of the VSC-HVDC interconnector at the MMC-2 side is P0 = −100 MW and Q0 = 0 MVar before the fault. A phase-A-to-ground fault with 10 Ω fault resistance happens on line mn at 1 s, and the distance between R1 and the fault location is 30 km. The positive-sequence components, negative-sequence components and zero-sequence components of currents flowing through R1 and R2, as well as the impedances measured by the AG elements in R1 and R2, are shown in Figure 17. As shown in Figure 17a, İAn is in phase with İm0 and İn0, and İAm is nearly zero, which is the same as Case 1. It can be seen from Figure 16b that İAn+ leads İAn and İAn leads İAm+, namely that İAn+ leads İAf+ and İAf+ leads İAm+, which matches with the phase relationship shown in Figure 15b. ZR1_A = 38.332∠54.3° Ω, ZR1_A = 27.221∠45.1° Ω, and the AG element in R1 fails to trip, as shown in Figure 17c. ZR2_A = 8.385∠18.8° Ω, ZR2_A = 6.998∠−10.3° Ω, and the AG element in R2 operates correctly, as shown in Figure 17d. In this case, İAm+ lags İAn (or İm0, İn0) by 138.8°, and therefore ZR1_A is inductive and the impedance angle of ZR1_A is large, which makes R1 fail to trip. İAn+ leads İAn (or İm0, İn0) by 22.5°, and therefore ZR2_A is slightly capacitive with a small impedance angle and R2 operates correctly.
The simulation results in this section show that under non-bolted single-phase-to-ground faults on line mn, the magnitude and phase angle of output positive-sequence currents of the interconnector are controllable, which has a great influence on the magnitude and phase relationship among the positive-sequence components, negative-sequence components, and zero-sequence components of the fault currents. Therefore the magnitude and angle of the additional impedances measured by ground distance elements in R1 and R2 are influenced by the interconnector, which may lead to malfunction of R1 and R2.

5. Applicability Analysis of Pilot Protection

The analysis in Section 3 and Section 4 reveals that due to the internal control of the VSC-HVDC interconnector, the output characteristics of the interconnector differ greatly from those of traditional voltage sources, which may lead to malfunctions of phase elements and ground distance elements in the distance relays installed on lines emanating from the VSC-HVDC interconnector. Traditional distance protection principles employed in R1 and R2 cannot satisfy the basic requirements of reliability and selectivity for power system relay protection. As is known, pilot protection is widely applied in traditional high voltage transmission lines. Common protection principles include the pilot distance protection principle, pilot directional protection principle, phase differential protection principle, current differential protection principle, etc. According to the analysis above, pilot distance protection is inapplicable to line mn. Since the magnitude and phase angle of output currents of the interconnector are controllable and the interconnector can work in all four quadrants after fault, pilot directional protection principle and phase differential protection principle are also inapplicable to line mn. There are many forms of restraint characteristics employed in current differential protection, such as ratio restraint characteristic and scalar product restraint characteristic, but these characteristics are all based on that the phase angle difference of the currents flowing through both sides of the line is different between internal and external faults. Assuming that the current differential protection with ratio restraint characteristic is employed for line mn, the operating criterion employed in the protection is:
| I ˙ d i f f | K r e s | I ˙ r e s | + I o p
where Kres is a restraint coefficient which is usually taken as 0.5 or 1 [24], İdiff = İm + İn and represents the phasor sum of the phase currents flowing through both sides of the protected line, İres = İmİn, and Kres|İres| is a common restraint current. When fault happens on line mn and the phase angle difference between the currents flowing through both sides of the line is close to 180°, the operating quantity |İdiff| may be smaller than the restraint quantity Kres|İres|+ İop, which may lead to failure of the protection.
Take a three-phase fault with 10-Ω fault resistance that happens on line mn at 1 s as example. The output power of the VSC-HVDC interconnector at the MMC-2 side is P0 = −100 MW and Q0 = 0 MVar before the fault, and the distance between R1 and fault location is 10 km. Phase A currents flowing through both sides of line mn and their phase angles, as well as İdiff, İAres and their magnitudes are shown in Figure 18. After the fault the phase angle difference between phase A currents flowing through both sides of line mn changes from 180° to 153.5°, and this change is not significant. |İAres| is about 2.02 times larger than |İdiff|, and the relays fail to trip the line.
For AC lines that are not directly emanating from the VSC-HVDC interconnector, the measured currents of the relays installed on these lines are not only provided by the interconnector, and the magnitude and phase relationship between fault currents flowing through both sides of these lines after fault are similar to the relationships in traditional AC system. Therefore traditional pilot protection principles are still applicable to AC lines that are not directly emanating from the interconnector. Based on the analysis above, it is necessary to develop a novel pilot protection principle for AC lines emanating from the interconnector.

6. A Novel Pilot Protection Principle and Verification

Through the analysis presented in previous sections, traditional distance protection and pilot protection are not applicable to lines emanating from the VSC-HVDC interconnector. In this section, a novel pilot protection principle is put forward for these lines, and the validity of the principle is verified by simulation results. Line mn in Figure 1 is taken as example for the study in this section.

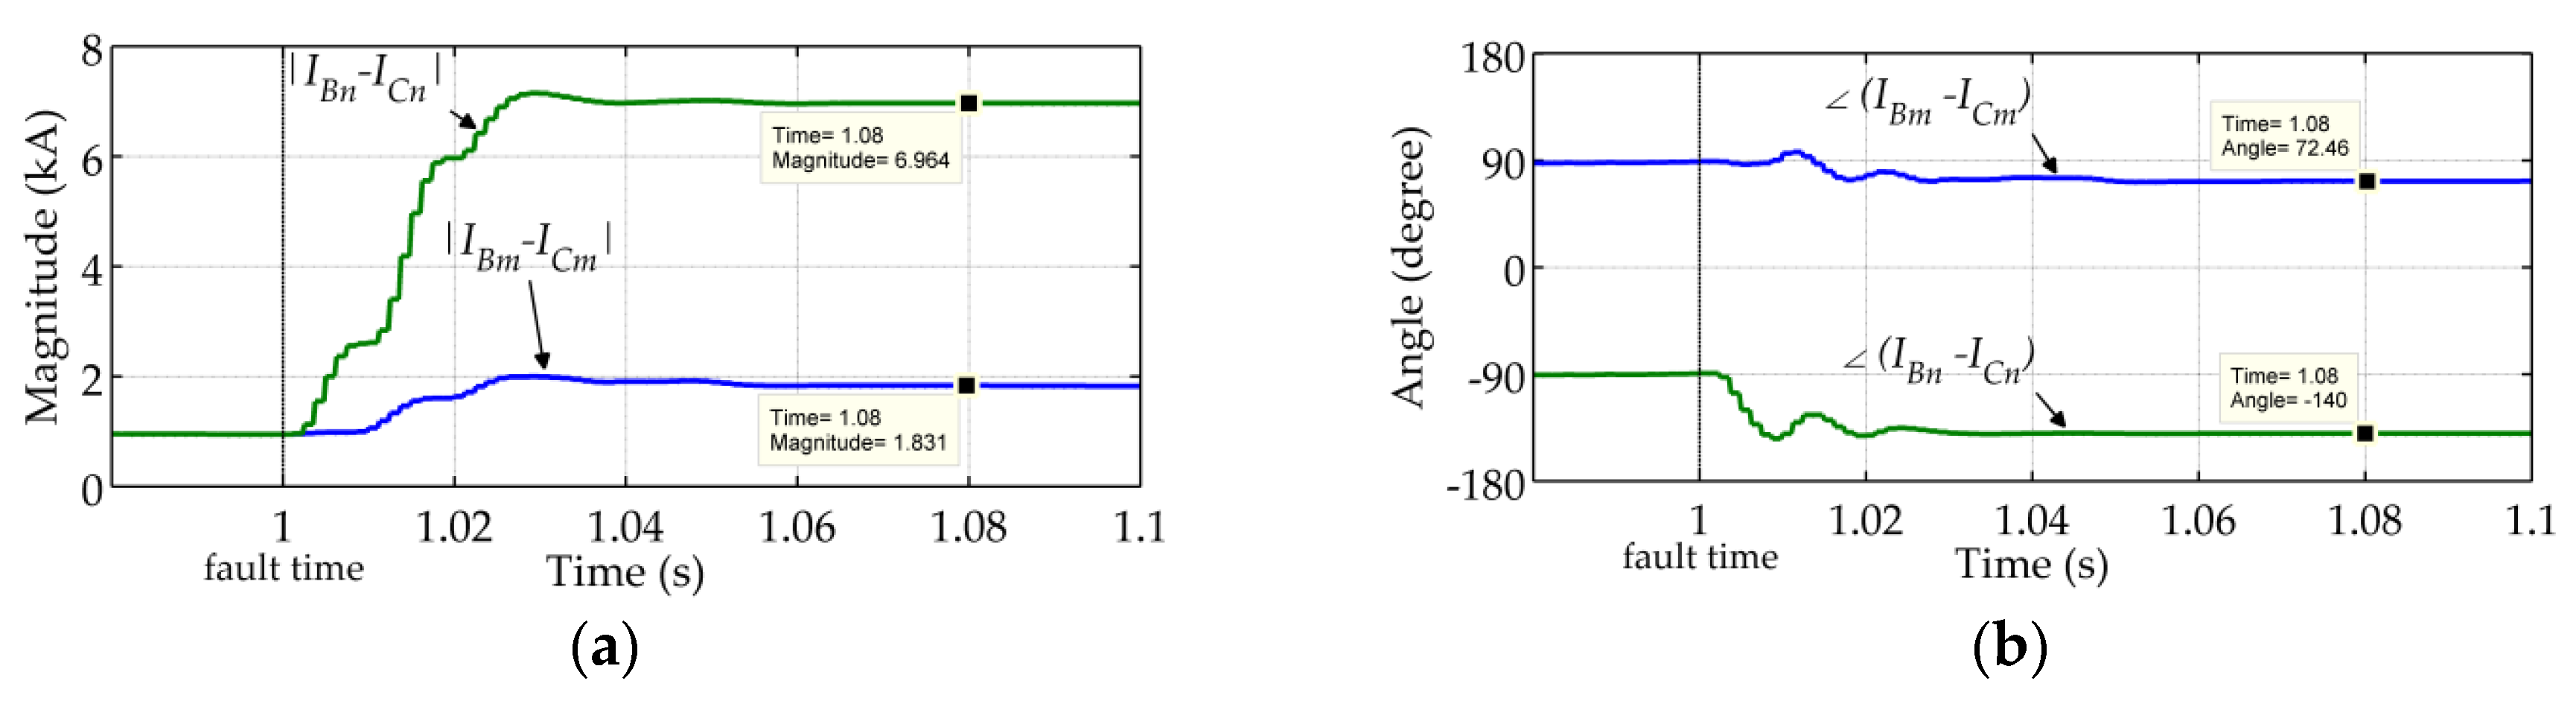
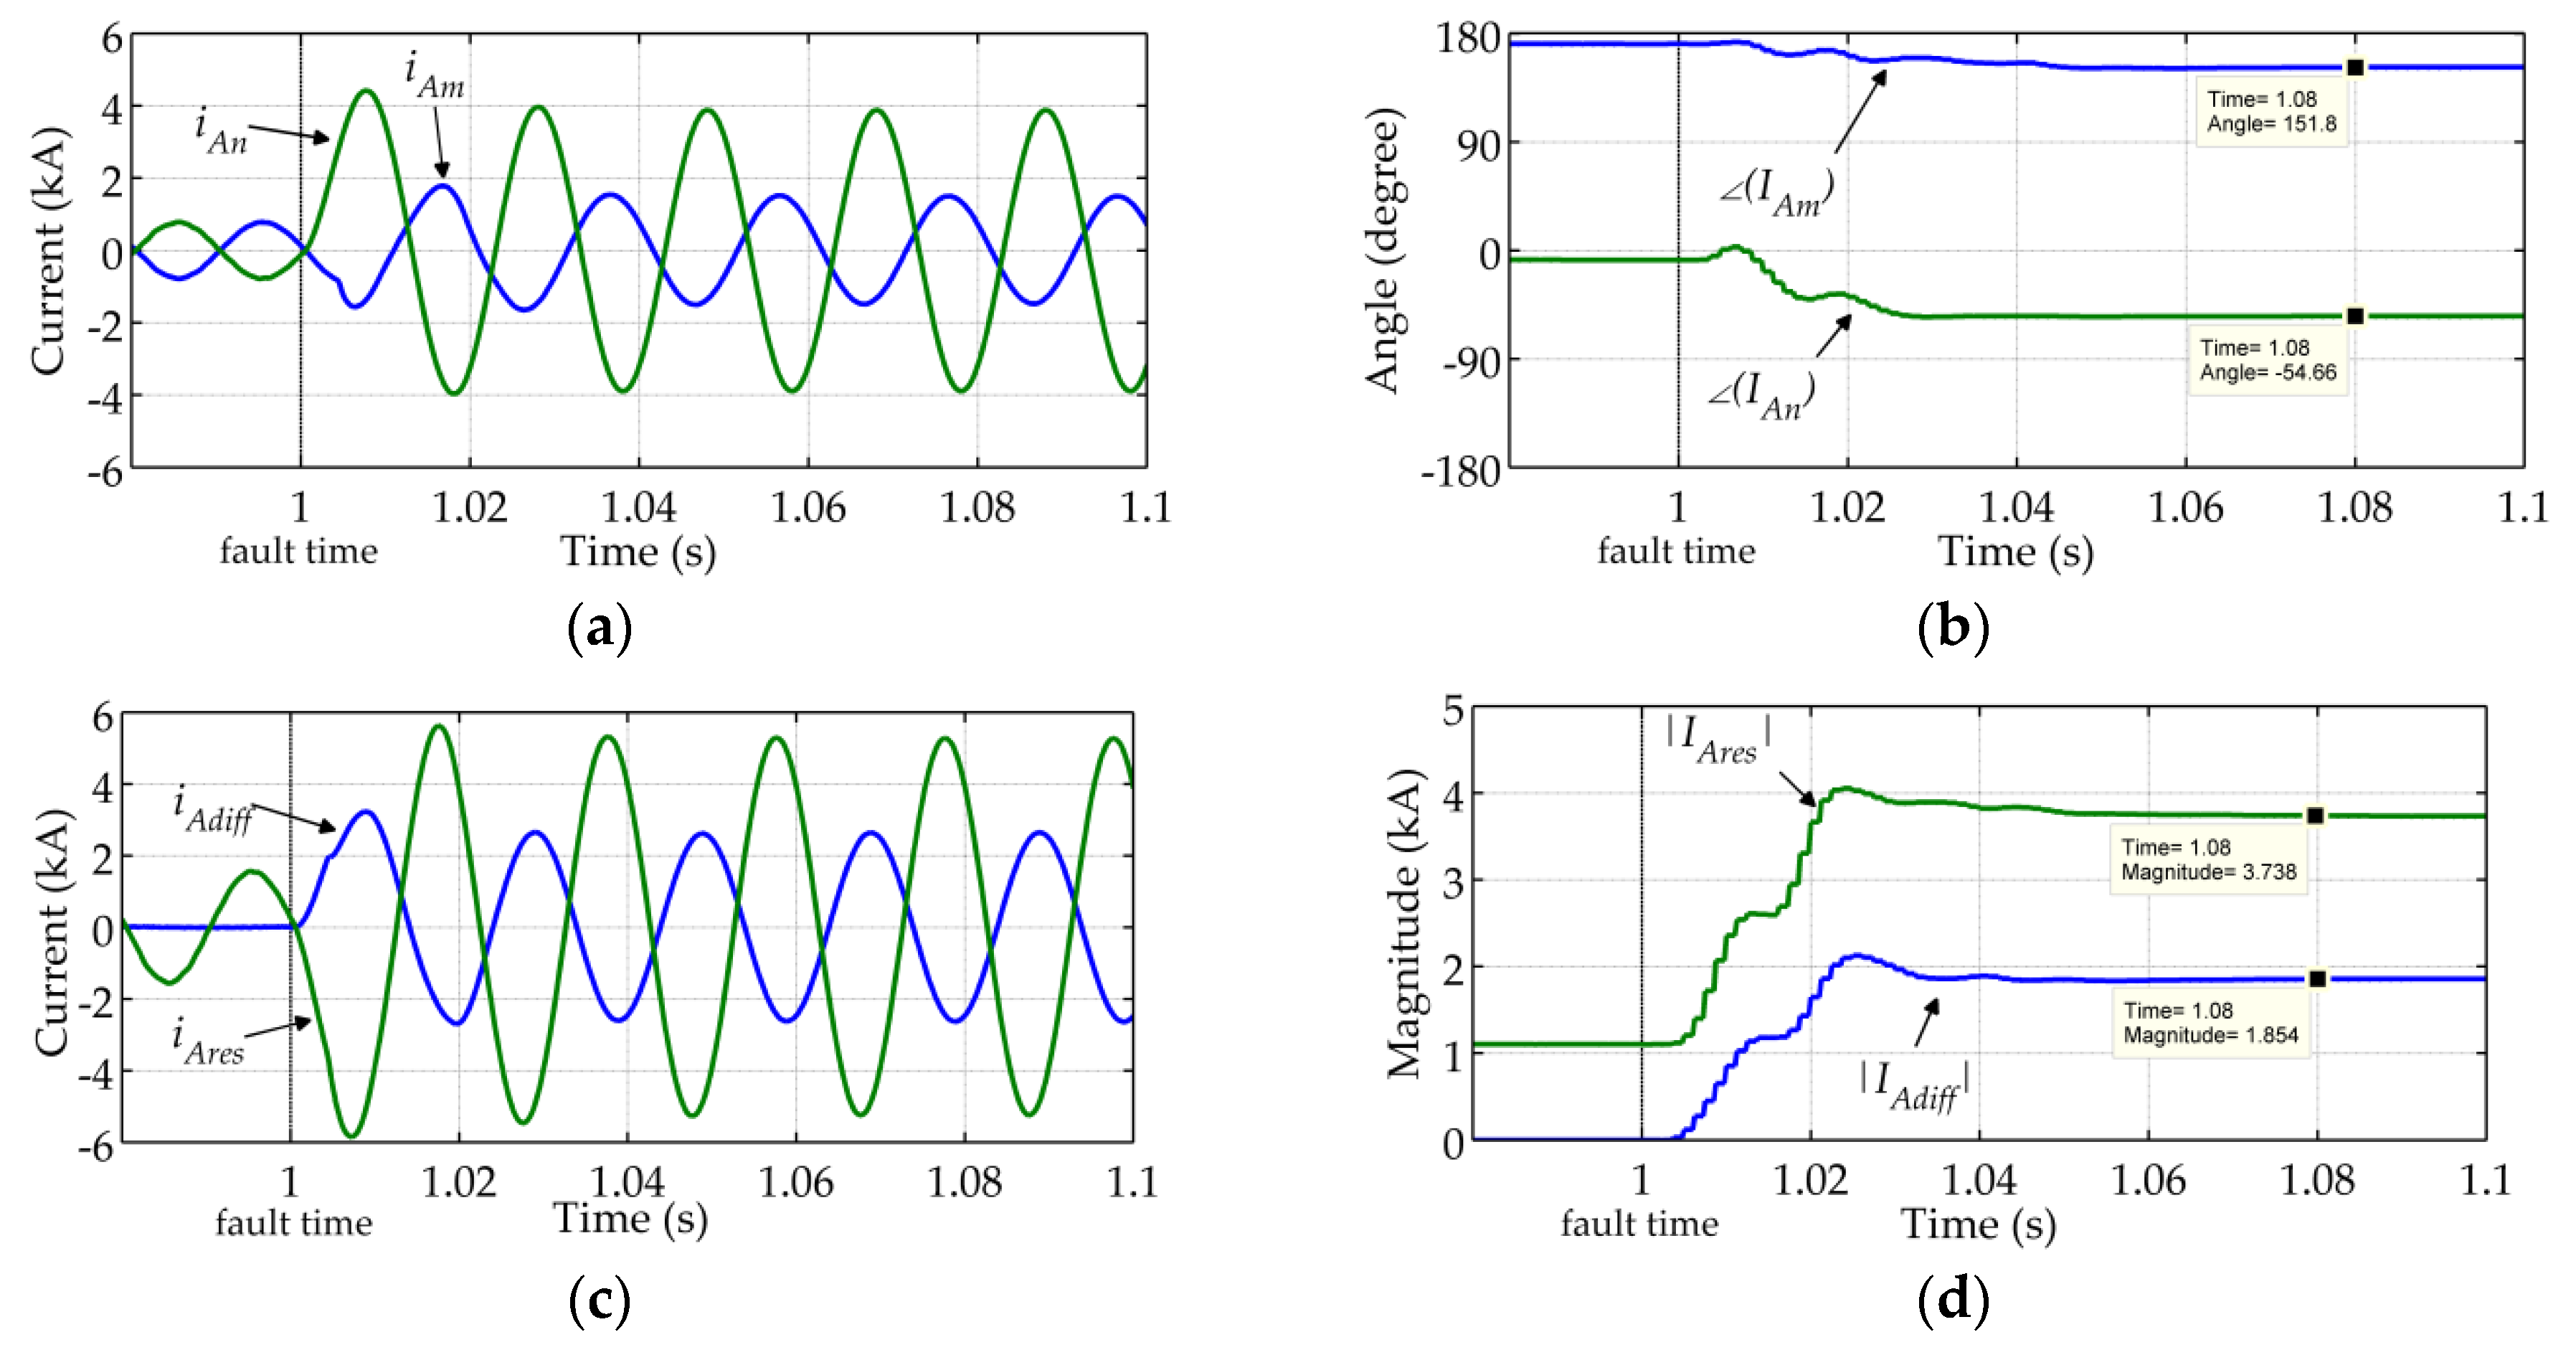
6.1. A Protection Principle Based on the Magnitude Comparison of Currents Flowing through Both Sides of the Line

According to the FRT strategy and output characteristics of the interconnector after a fault which are presented in Section 2, when an internal unbalanced fault happens on line mn, for example at f1 in Figure 1, the negative-sequence currents flowing through bus m side of the line are nearly zero, since the inner negative-current control loops of the interconnector are aimed at eliminating negative-sequence currents; but the negative-sequence currents flowing through bus n side of the line are very large. When an external unbalanced fault happens at the traditional AC side, for example at f2 in Figure 1, the negative-sequence currents flowing through both sides of line mn are close to zero. When an external unbalanced fault happens at the interconnector side, for example at f0 in Figure 1, the negative-sequence currents flowing through both sides of line mn are approximately equal in magnitude and usually large. It should be noticed that the fault located outside of line mn is called an external fault in this paper. Therefore, if a communication channel is installed on line mn, the ratio between the negative-sequence currents flowing through both sides of line mn can be utilized to identify whether an unbalanced fault is an internal fault or an external fault.
When a balanced fault happens, the negative-sequence components of currents and voltages only exist in the transient process after the fault and decay to nearly zero soon, and there are many non-integer harmonics included in these transient components. Since the internal control of the interconnector is based on fundamental frequency, and the control system take a transient process to respond to the output negative-sequence currents whose speed is related to the parameters of the controller and actual fault conditions, it is unreliable to identify whether a balanced fault is an internal fault or an external fault according to the ratio between negative-sequence currents flowing through both sides of line mn, even though the output negative-sequence currents of the interconnector can be restrained to some extent during the transient process after the fault. Therefore it is necessary to develop a separate protection principle to identify whether a balanced fault is an internal fault or an external fault. When an internal balanced fault happens on line mn, for example at f1 in Figure 1, the phase currents flowing through bus n side of the line increase significantly since the fault impedance under balanced fault is usually not very large; while the phase currents flowing through bus m side of the line are limited due to the FRT strategy of the interconnector. When an external balanced fault happens, for example at f0 or f2 in Figure 1, phase currents flowing through both sides of line are approximately equal. Therefore, the ratio between the phase currents flowing through both sides of line mn can be utilized to identify whether a balanced fault is an internal fault or an external fault.
For unbalanced faults, the operating criterion based on the ratio between negative-sequence currents flowing through both sides of line mn is:
( U m U t h o r   I m 0 I t h 0 o r I n 0 I t h 0 ) a n d ( I n > I t h a n d I n I m > K t h 1 )
where Um, İm−, İm0 are magnitudes of negative-sequence voltage, negative-sequence current and zero-sequence current which are measured by the relay installed at bus m side, respectively; İn−, and İn0 are magnitudes of negative-sequence current and zero-sequence current which are measured by the relay installed at bus n side, respectively. UmUth, Im0Ith0 together with In0Ith0 are used to distinguish between unbalanced faults and balanced faults on line mn. Uth is the threshold of negative-sequence voltage and it should be larger than the maximum negative-sequence voltage during initial transient process of balanced faults. The overcurrent criteria Im0Ith0 and In0Ith0 are introduced to consolidate the operating criterion shown in Equation (17) when some ground fault happens on line mn and Um < Uth. Ith0 is the threshold of zero-sequence current and it should be larger than the maximum unbalanced current during three-phase faults. Kth1 is the threshold of the ratio between negative-sequence currents, and it cannot be too large or too small in order to guarantee the sensitivity and reliability of the protection. When an external unbalanced fault happens at the back side of bus n, both In and Im are nearly zero, but In/Im may be larger than Kth1 due to the measurement error of current transformers or other factors. Therefore the negative-sequence overcurrent criterion In > Ith is introduced to prevent the protection from misoperating in this situation. Ith is the threshold of negative-sequence current and it should be larger than the maximum unbalanced current during external unbalanced faults at the back side of bus n.
For balanced faults, the operating criterion based on the ratio between phase currents flowing through both sides of line mn is:
U m < U t h a n d I m 0 < I t h 0 a n d I n 0 < I t h 0 a n d I φ n I φ m > K t h 2
where φ can represent phase A, phase B or phase C; Iφm and Iφn are phase currents flowing through bus m side and bus n side, respectively. Kth2 is the threshold of the ratio between phase currents, and it should be set as a constant larger than 1, taking into account the most undesirable situation in which an internal three-phase fault with fault resistance happens near bus m.
It should be pointed out that when an external grounded fault with high fault resistance happens at the interconnector side, for example at f0 in Figure 1, or an external phase-to-phase ungrounded fault happens at the traditional AC side and is far away from bus n, the fault is detected as a balanced fault because Um < Uth, Im0 < Ith0 and In0 < Ith0. However, Iφn/Iφm equals to 1 under these external faults, and therefore the balanced-fault element based on the operating criterion shown in Equation (18) does not misoperate. The reliability of the protection can be ensured.

6.2. Verification

The simulation model in Section 3.3 is employed in this section, and the protection principle proposed in Section 6.1 is applied to line mn. A lot of simulations are carried out to prove the feasibility of the protection principle. The thresholds of the protection are Uth− = 15 kV, Ith0 = 0.1 kA, Ith−= 0.1 kA, Kth1 = 5, and Kth2 = 1.5. The sampling frequency is 1.6 kHz, and phasor estimation is performed by the Fast Fourier Transform (FFT) algorithm [25].

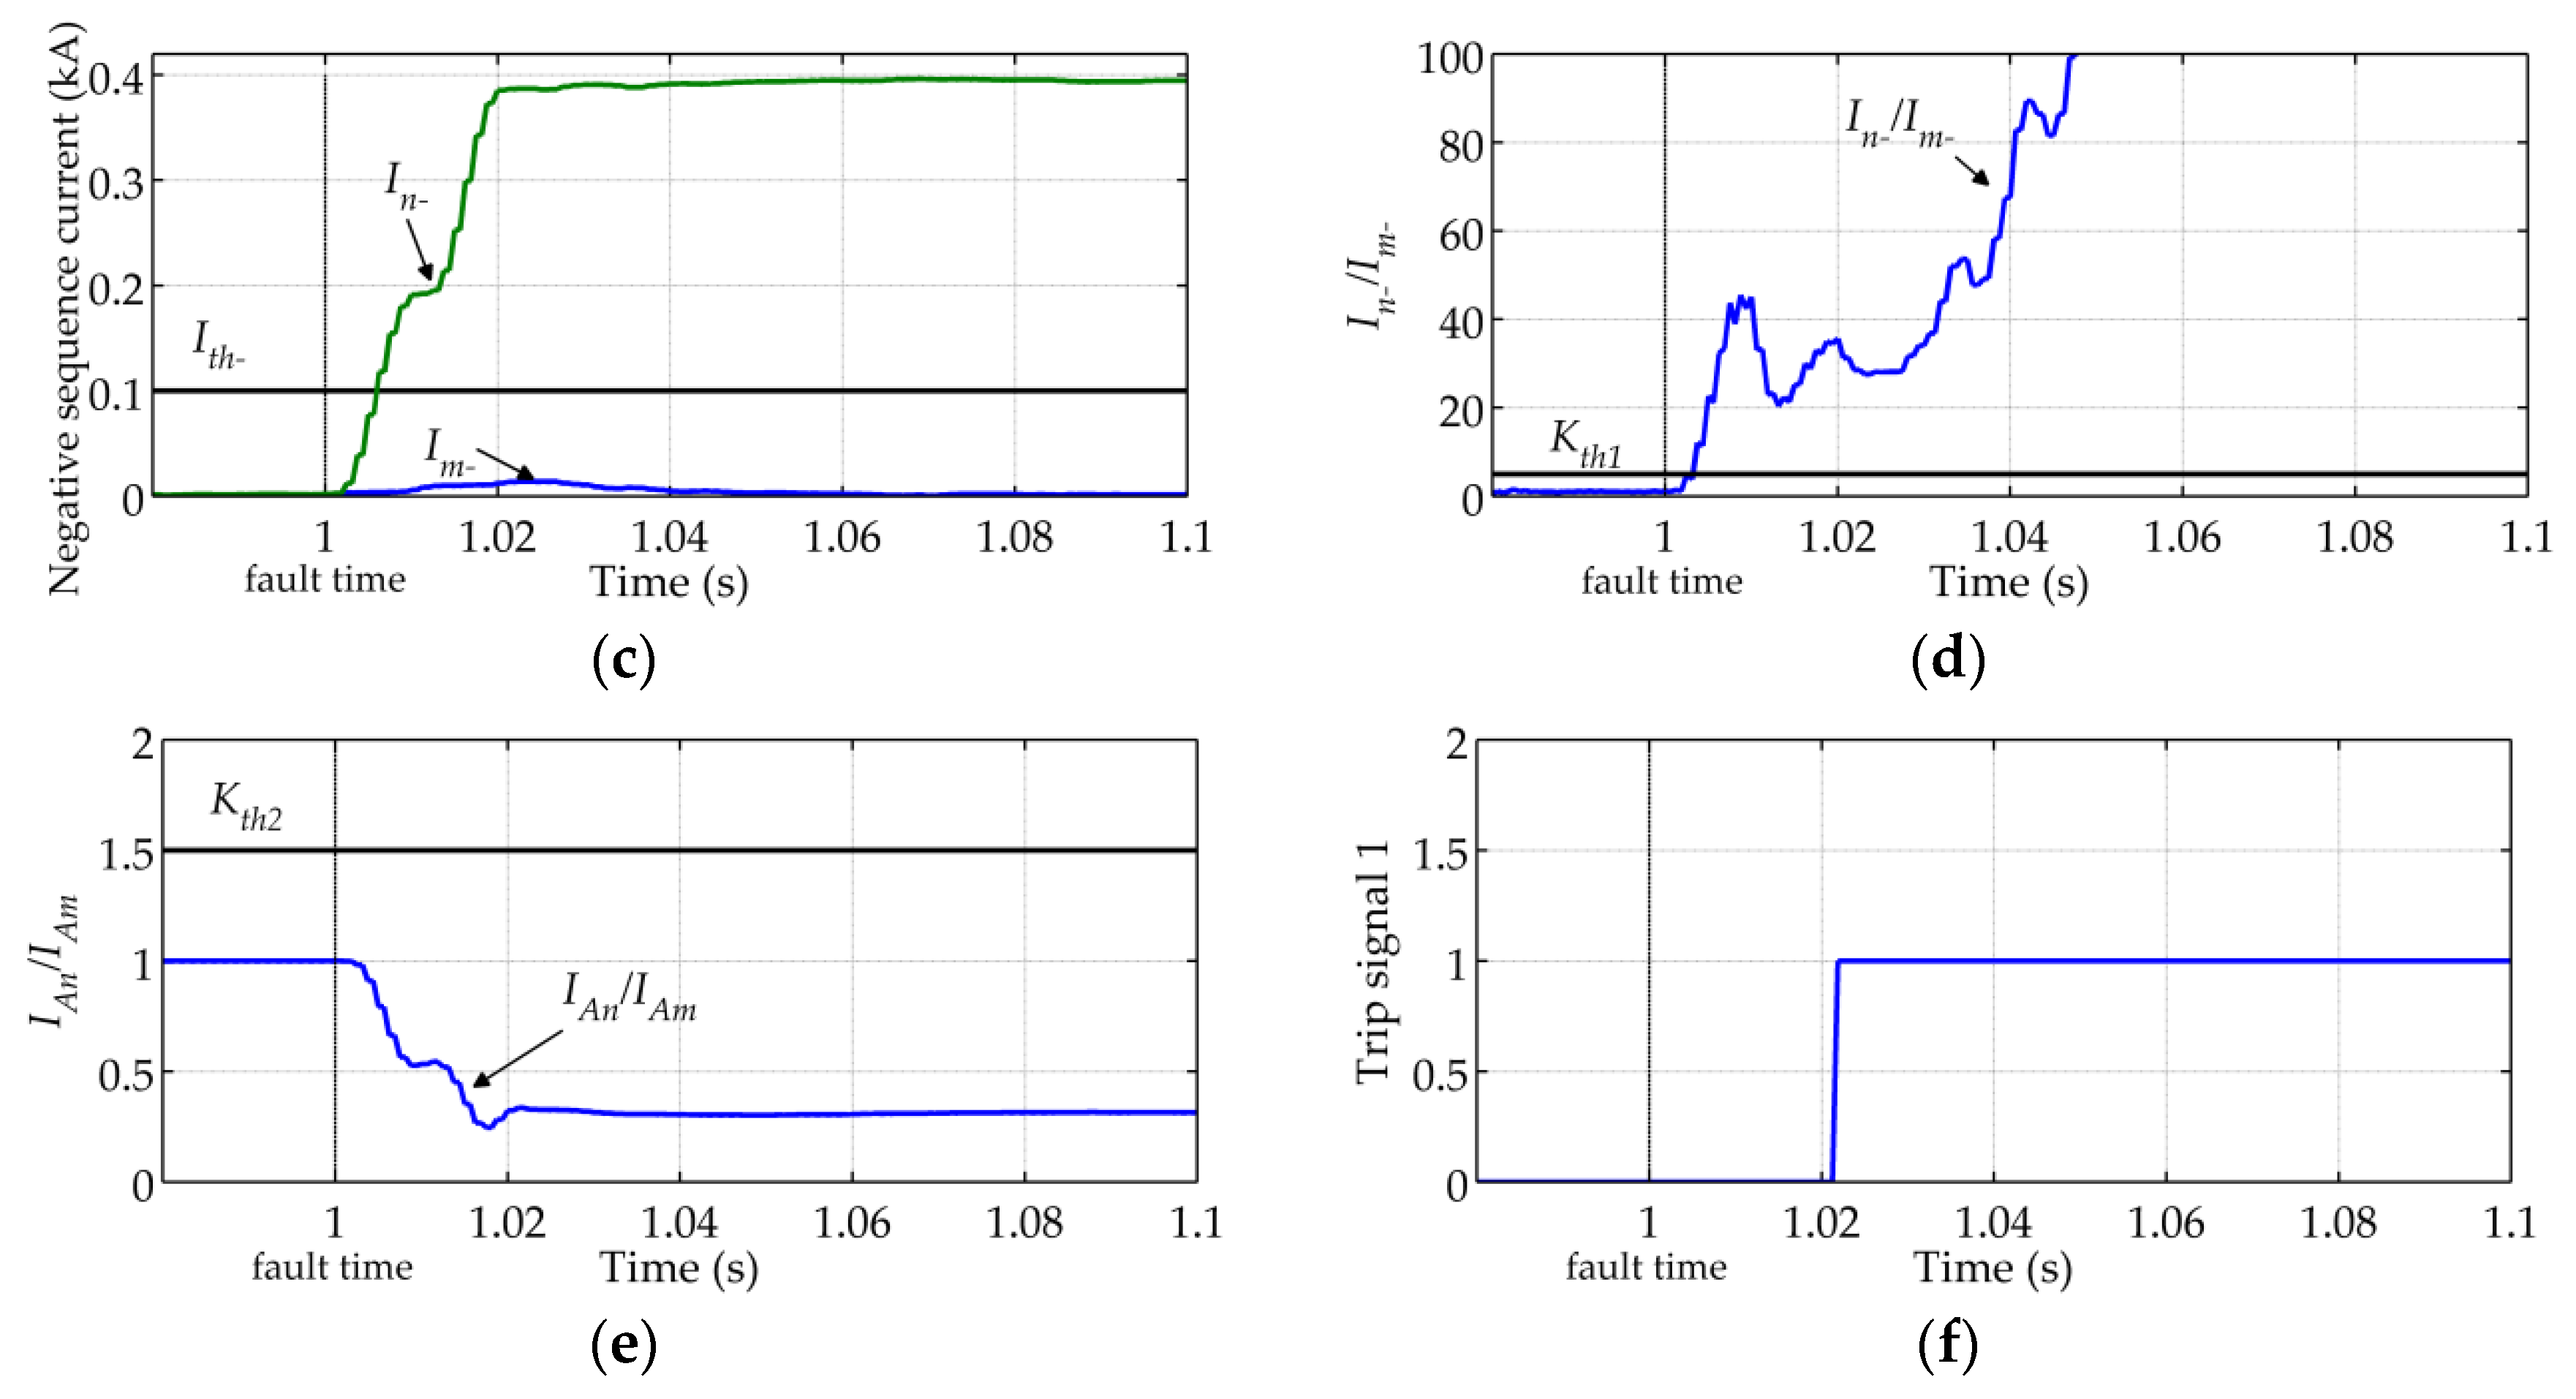
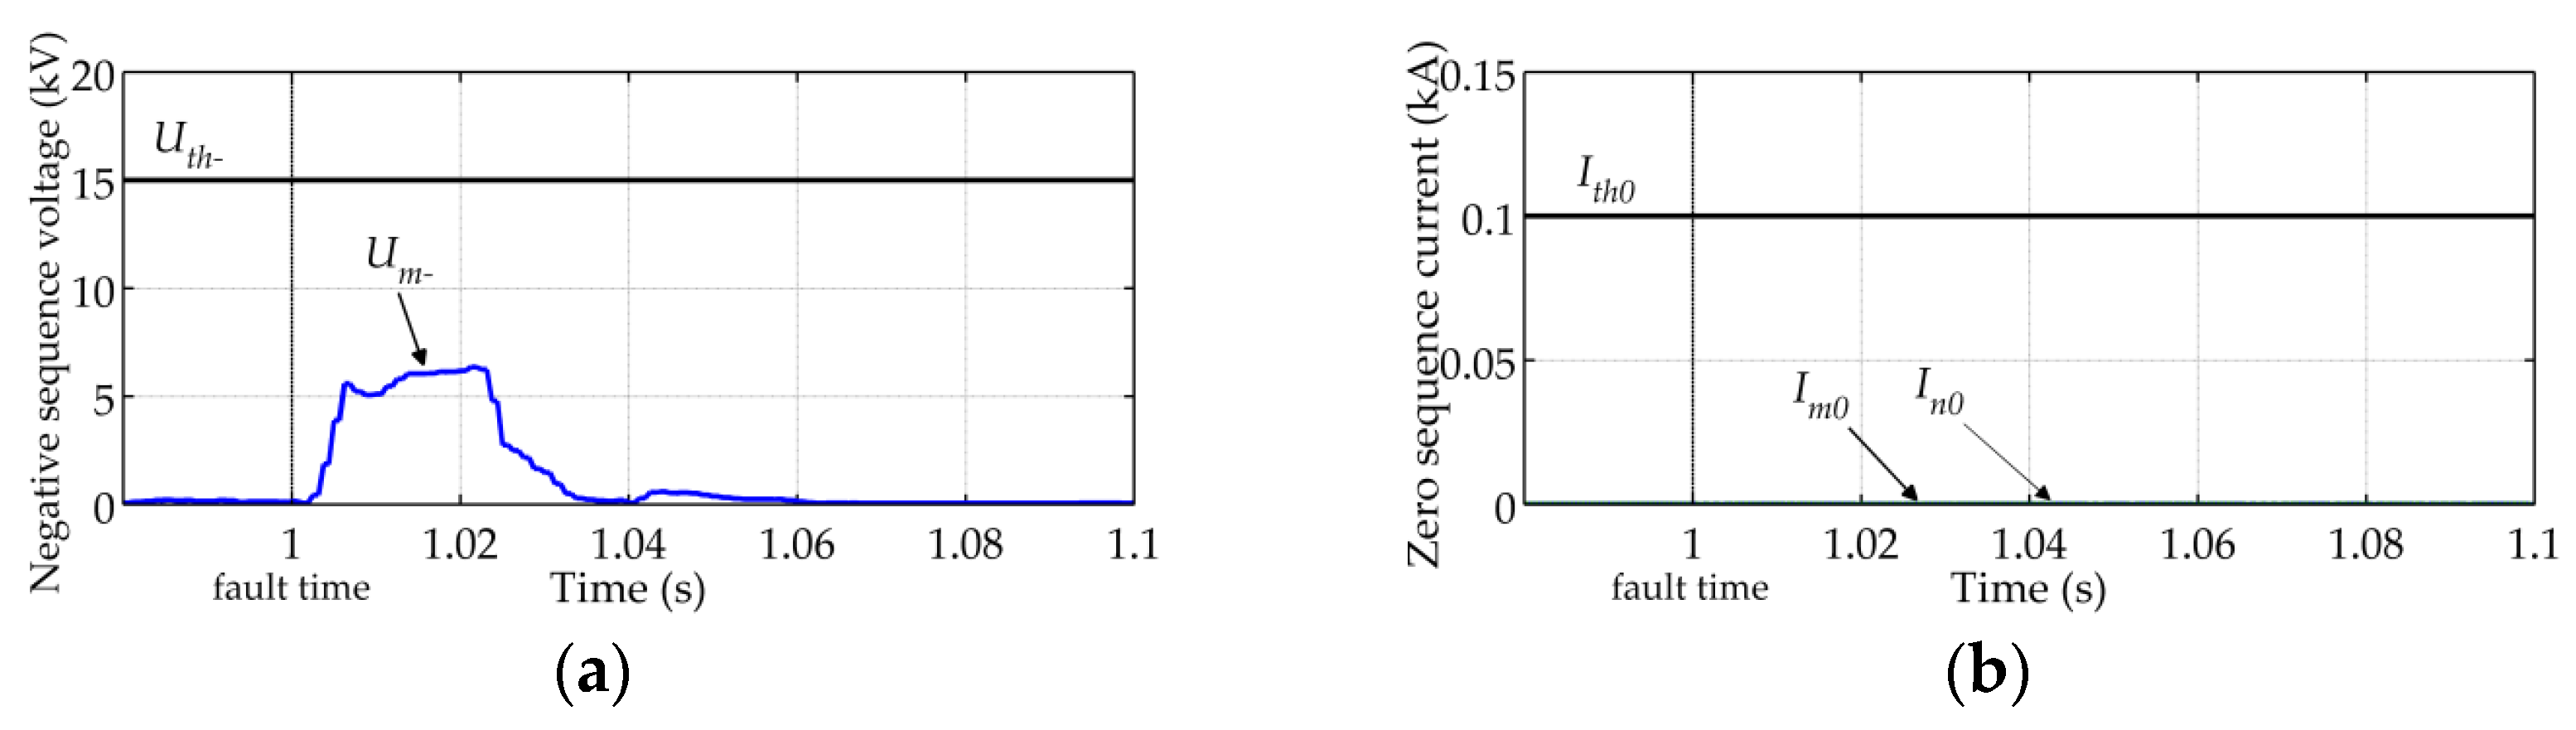
6.2.1. Internal Unbalanced Fault

The output power of the VSC-HVDC interconnector at the MMC-2 side is P0 = 200 MW and Q0 = 0 MVar before the fault. A phase-A-to-ground fault with 50-Ω fault resistance happens on line mn at 1 s, and the distance between bus m and the fault location is 30 km. Um, Im0, In0, Im, In, In/Im and IAn/IAm which are measured by the relays on line mn, as well as the trip signal for unbalanced fault are shown in Figure 19. As displayed in Figure 19a, Um is below the threshold Uth all the time due to the high fault resistance, but it can be seen from Figure 19b that after 20 ms from the fault inception, both Im0 and In0 are larger than the threshold Ith0. Therefore, the fault is detected as an unbalanced fault. It can be seen from Figure 19c that In is larger than the threshold Ith after 20 ms from the fault inception. Meanwhile, the ratio In/Im is larger than 5, as shown in Figure 19d. Besides, In/Im is still increasing after 1.02 s since the output negative-sequence current Im of the interconnector is still decreasing, as shown in Figure 19c. At 1.04 s, Im is restrained to nearly zero, and In/Im is larger than 80. The unbalanced fault is correctly detected by the unbalanced-fault element based on the operating criterion shown in Equation (17), as shown in Figure 19f.
It can be seen from Figure 19e that the ratio IAn/IAm is smaller than 1 after the fault, and therefore the criterion Iϕn/Iϕm > Kth2 cannot be utilized to identify an internal unbalanced fault. This case shows that the proposed protection principle has the ability to eliminate the influence of the fault resistance.

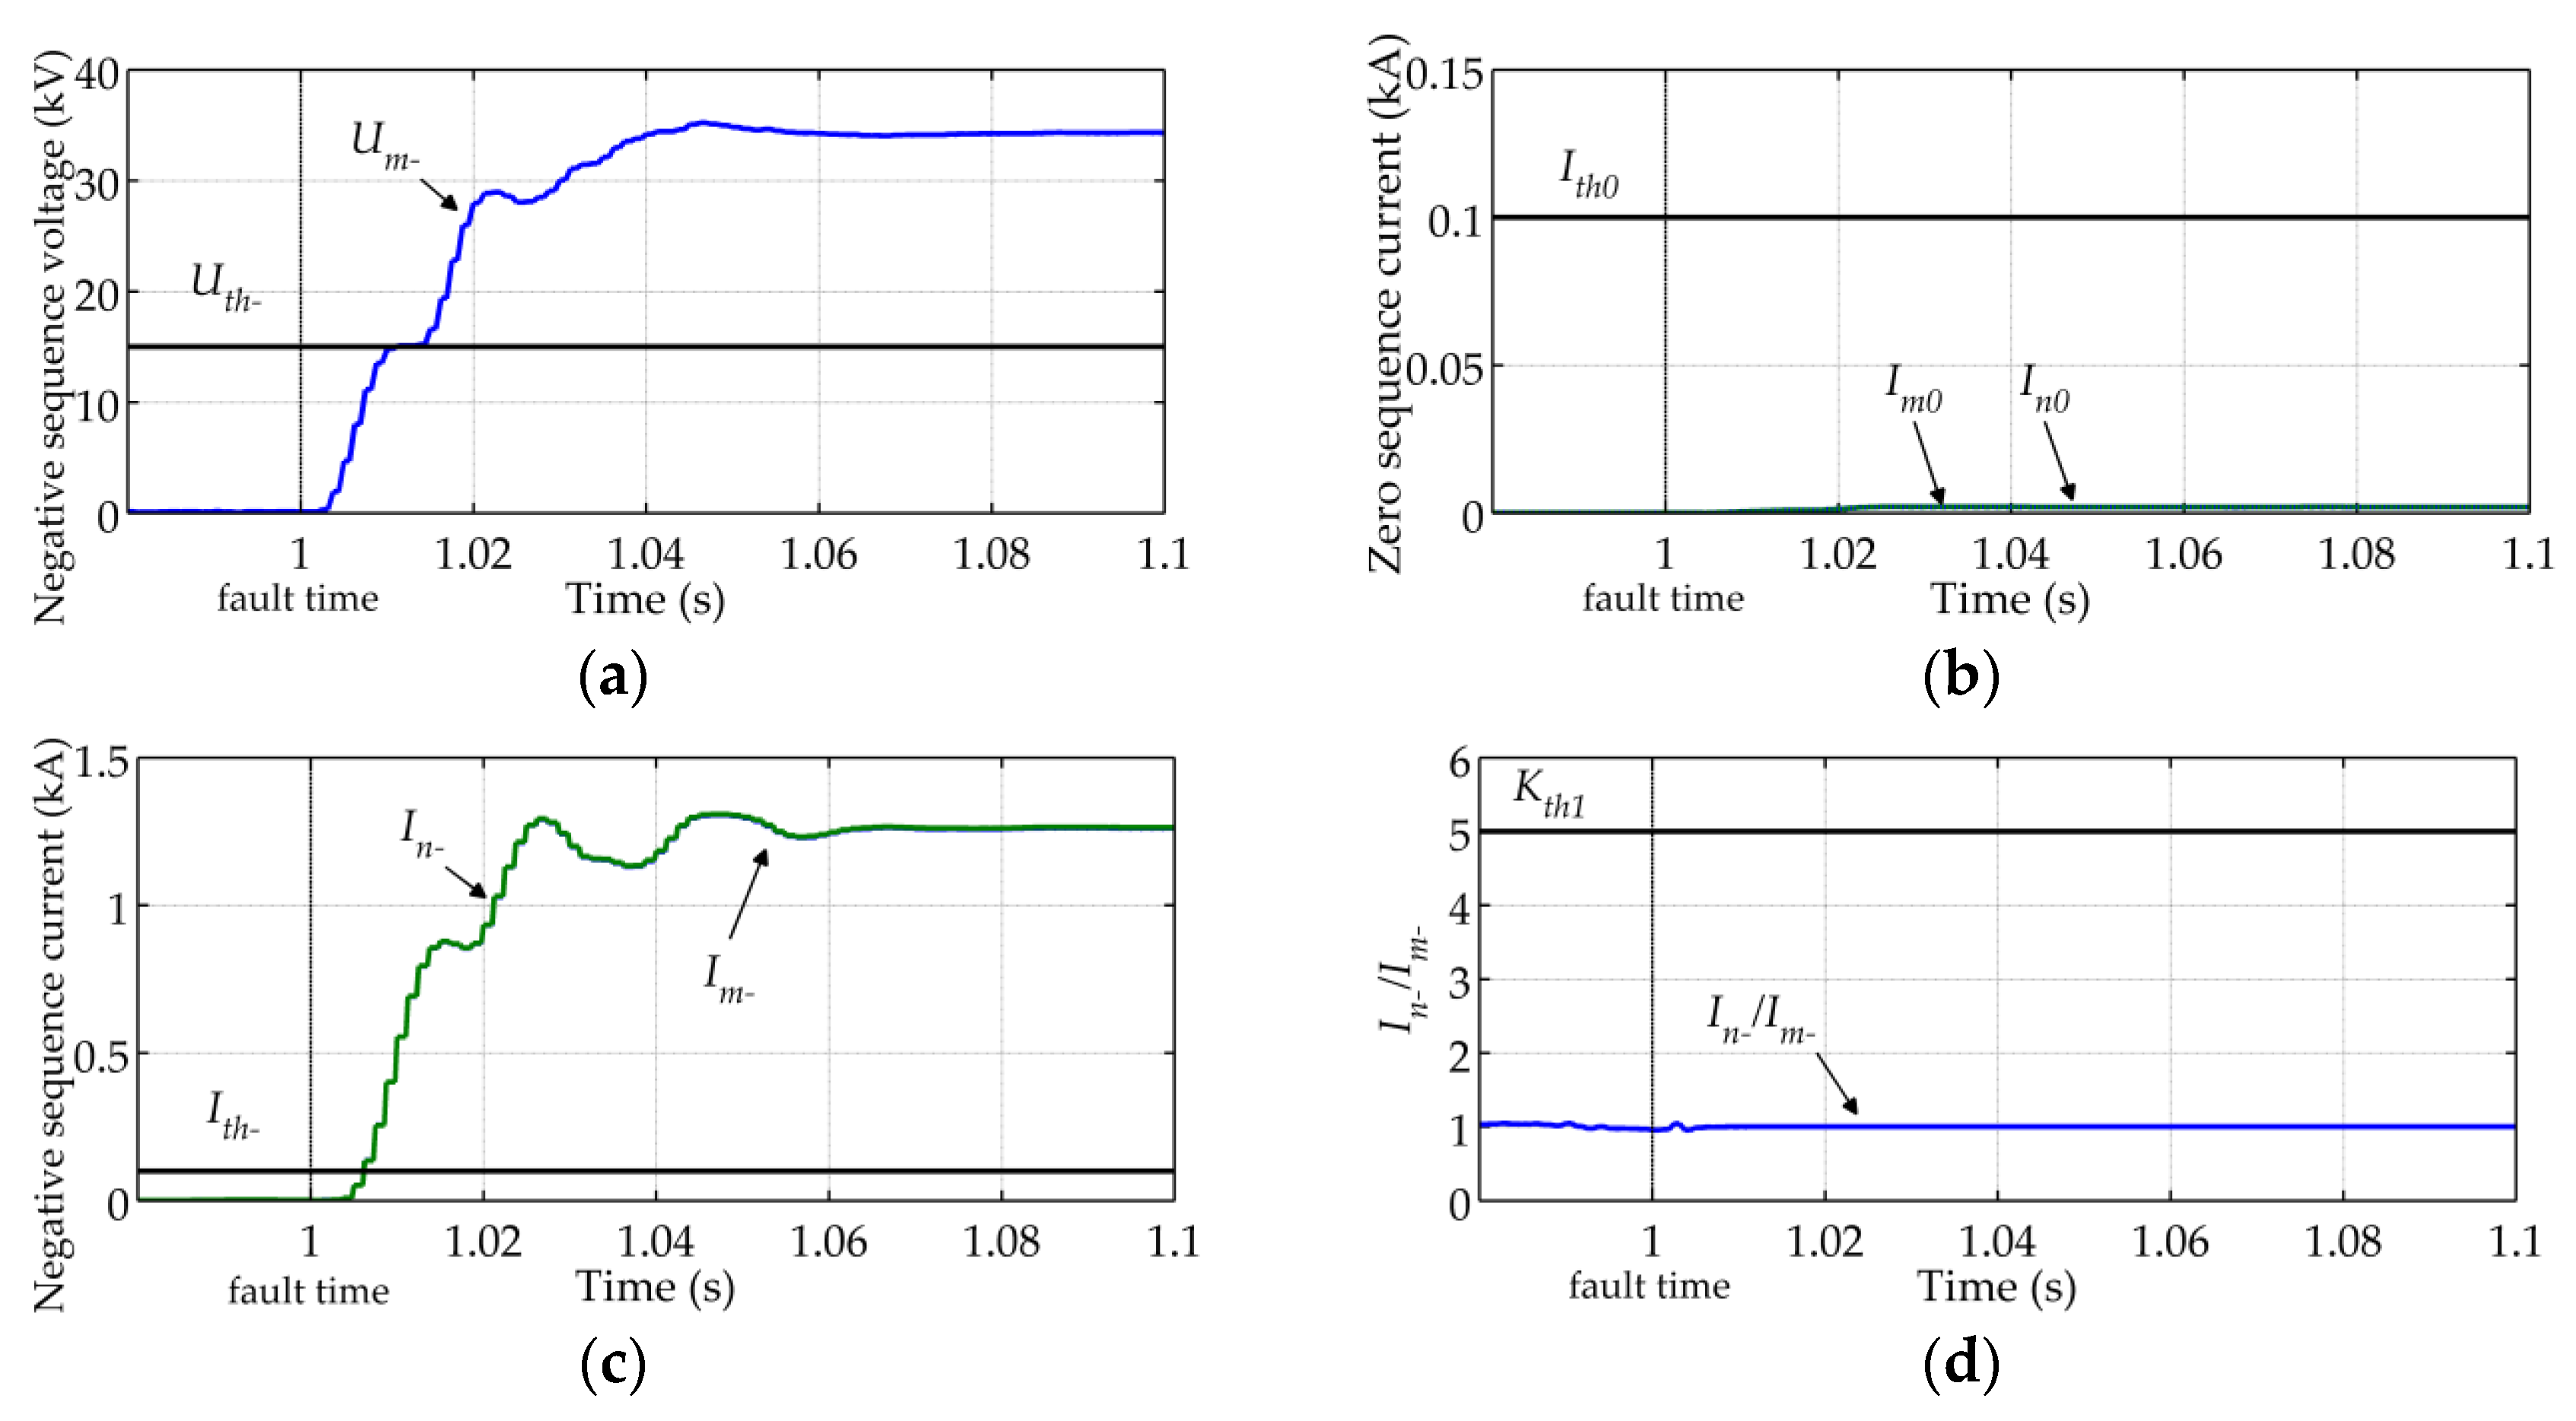
6.2.2. Internal Balanced Fault

The output power of the VSC-HVDC interconnector at the MMC-2 side is P0 = −100 MW and Q0 = 0 MVar before the fault. A three-phase fault with 10 Ω fault resistance happens on line mn at 1 s, and the distance between bus m and the fault location is 10 km. Um, Im0, In0, Im, In, In/Im and IAn/IAm, as well as the trip signal for balanced fault are shown in Figure 20. It can be seen from Figure 20a,b that Um is below the threshold Uth during the transient process after fault, and both Im0 and In0 are zero all the time. Therefore, the fault is detected as a balanced fault. Although In > Ith and In/Im > Kth1 are simultaneously satisfied in a short period after 20 ms from the fault inception, as shown in Figure 20c,d, the unbalanced-fault element does not misoperate. Meanwhile, it can also be seen from Figure 20d that In/Im > Kth1 is satisfied only in a very short period after 1.02 s, and therefore it is unreliable to identify an internal balanced fault based on the ratio between negative-sequence currents at both sides of line mn during the transient process after the fault.
As displayed in Figure 20e, after 20 ms from the fault inception, the ratio between phase A currents at both sides of line mn is close to the steady state 2.35 and therefore the balanced fault is correctly detected by the balanced-fault element, as shown in Figure 20f. The fault impedance under three-phase faults is usually small. The smaller the fault impedance is, the larger Iφn/Iφm will be in this case. Therefore, the proposed protection principle can identify internal balanced faults correctly.

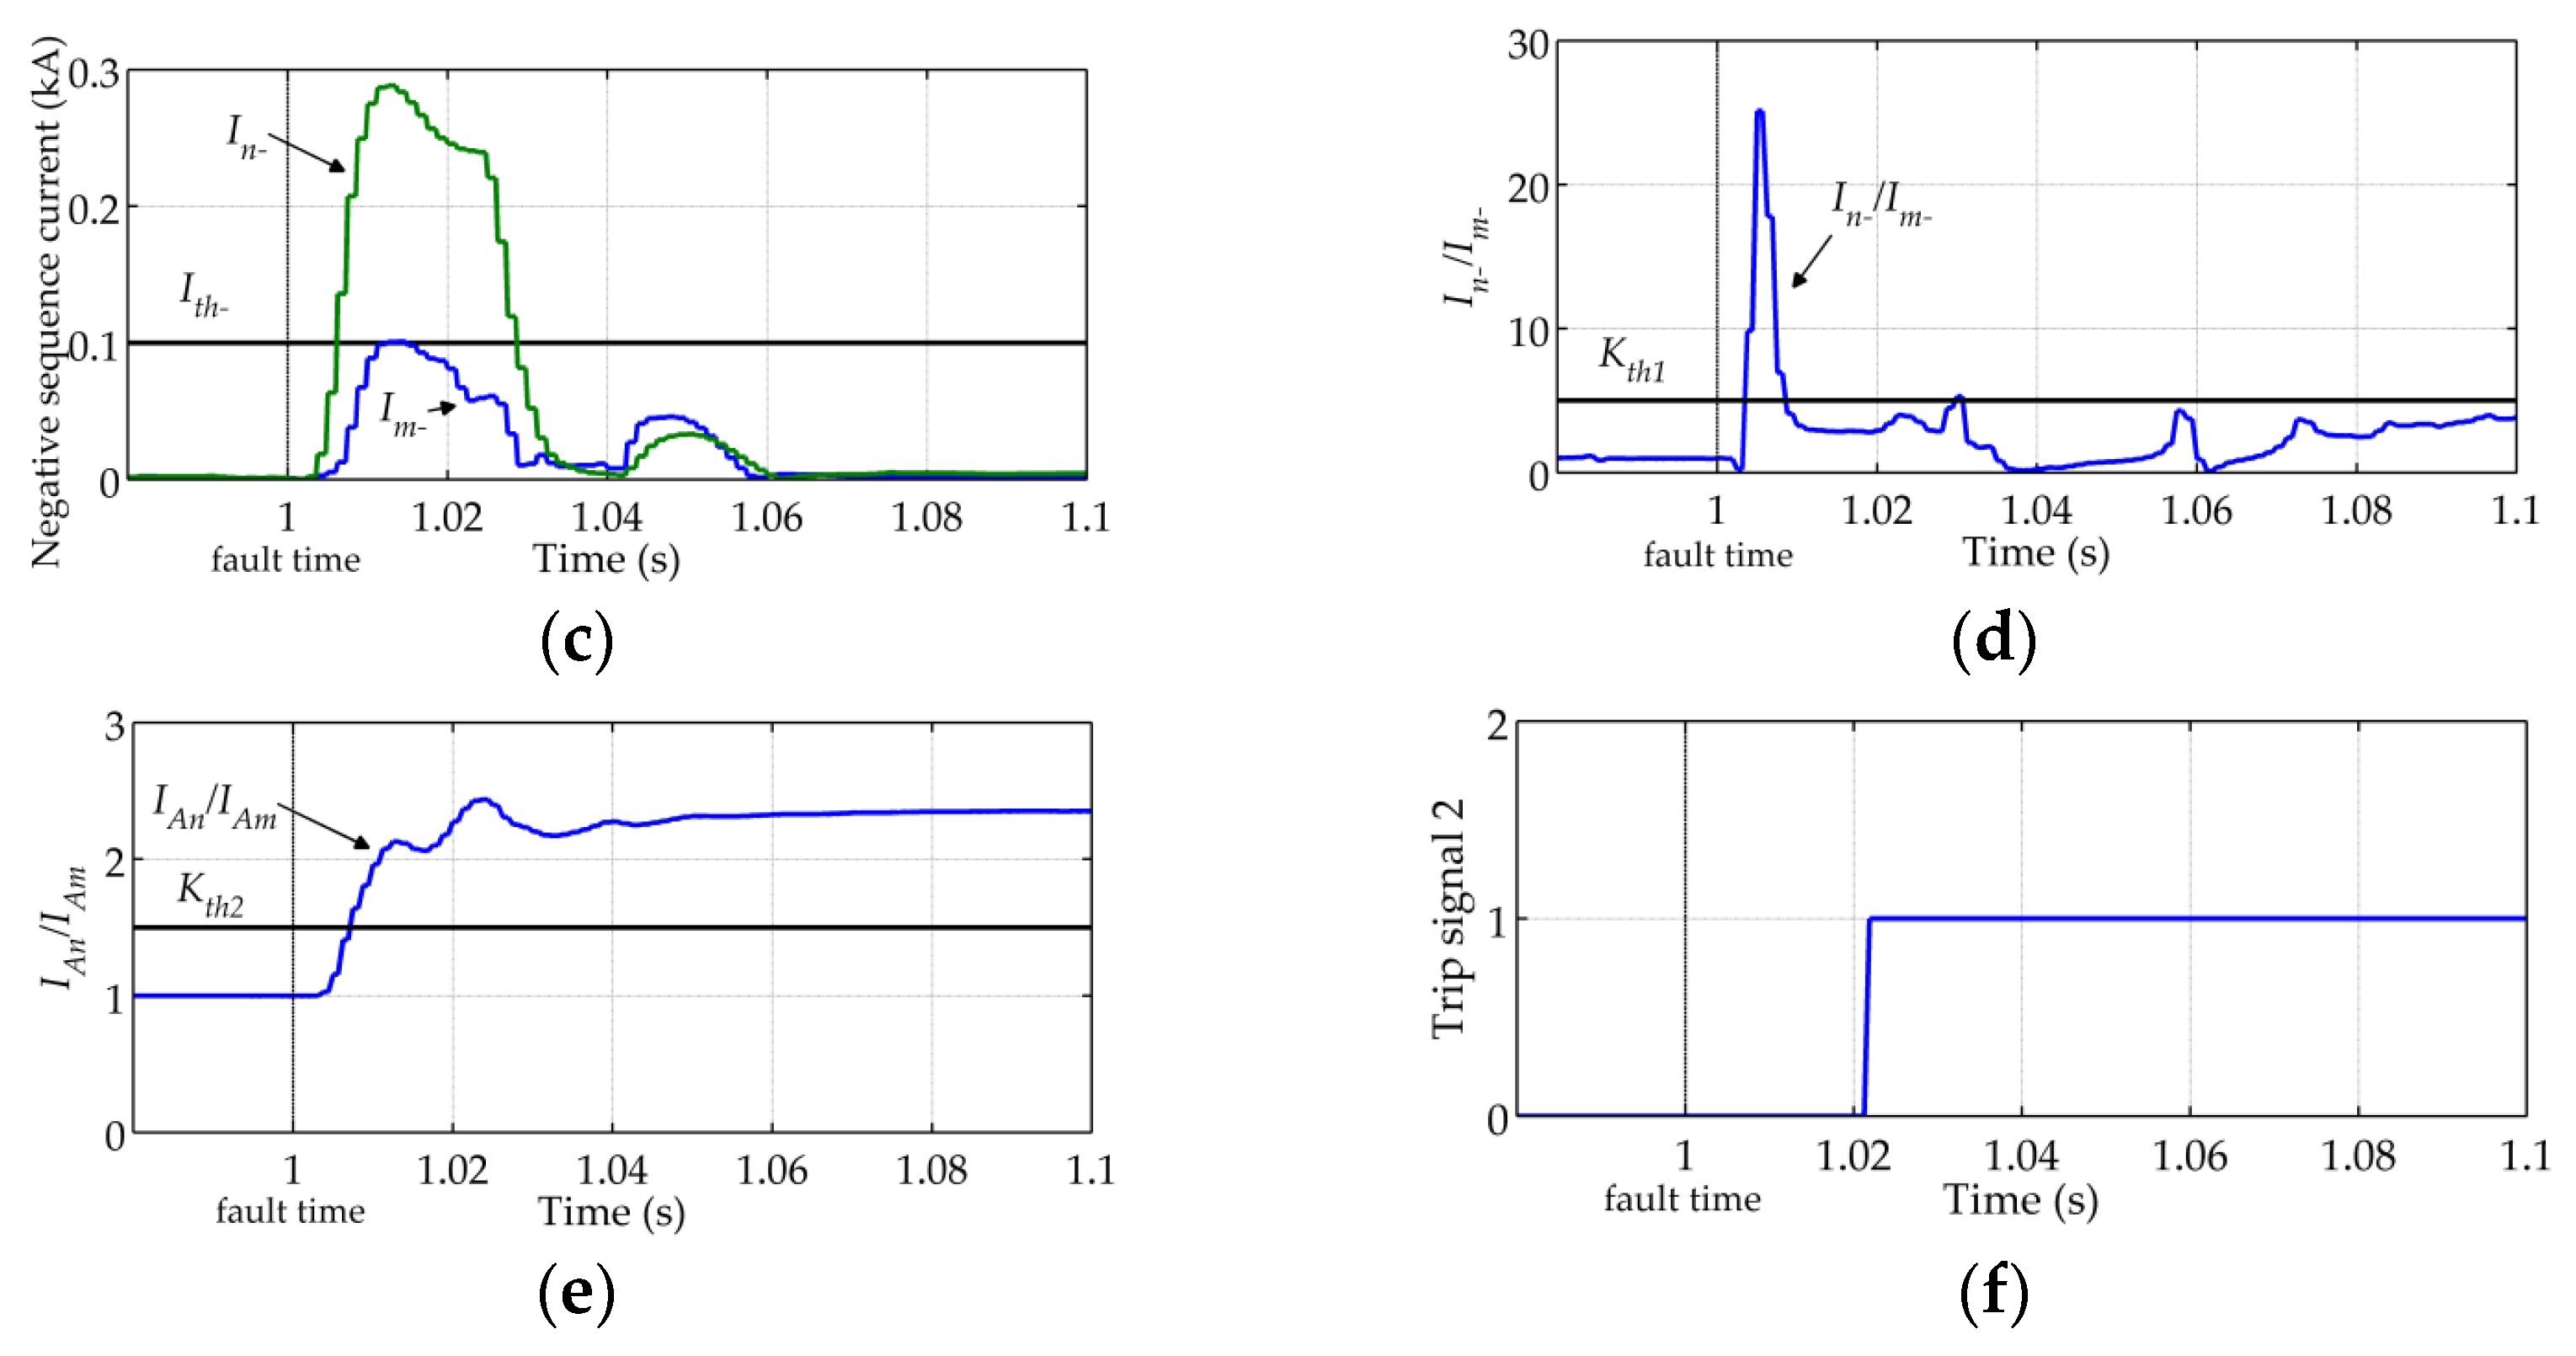
6.2.3. External Fault

The output power of the VSC-HVDC interconnector at the MMC-2 side is P0 = −100 MW and Q0 = 0 MVar before the fault. An external bolted phase-A-to-ground fault happens at f0, as shown in Figure 1, and f0 is near bus m. The fault starting time is also 1 s. Um, Im0, In0, Im, In and In/Im are shown in Figure 21.
As displayed in Figure 21a, Um exceeds the threshold Uth after the fault, and therefore the fault is detected as an unbalanced fault. As shown in Figure 21c, In > Ith after 20 ms from the fault inception and the negative-sequence currents flowing through both sides of line mn are approximately equal. Therefore, In/Im remains 1 after 20 ms from the fault inception, as shown in Figure 21d, and therefore the unbalanced-fault element does not misoperate. When a balanced fault happens at f0, the fault is detected as a balanced fault, but the ratio between phase currents flowing through both sides of line mn remains 1. Therefore, the protection does not misoperate. Simulation results are omitted here. The output power of the VSC-HVDC interconnector at the MMC-2 side is P0 = 200 MW and Q0 = 0 MVar before the fault. A bolted three-phase fault happens on line ng at 1 s, and the distance between bus n and the fault location is 10 km. Um, Im0, In0, and IAn/IAm are shown in Figure 22. It can be seen from Figure 22a,b that Um is below the threshold Uth all the time, and both Im0 and In0 are zero all the time. Therefore, the fault is detected as a balanced fault. As shown in Figure 22c, the ratio between phase currents flowing through both sides of line mn remains 1, and therefore the balanced-fault element does not misoperate. When an unbalanced fault happens here, the protection does not misoperate either. Simulation results are omitted.
It can be seen from Section 6.2 that the proposed protection principle can accurately recognize internal faults and external faults, and has the ability to eliminate the influence of fault resistance. In addition, many fault simulations are completed when the interconnector works in different operation states before fault or under different fault conditions. Simulation results show that the operation of the protection is not influenced by the operation state of the interconnector before fault, and the proposed protection principle is of high sensitivity and can achieve whole line high speed protection.

7. Conclusions

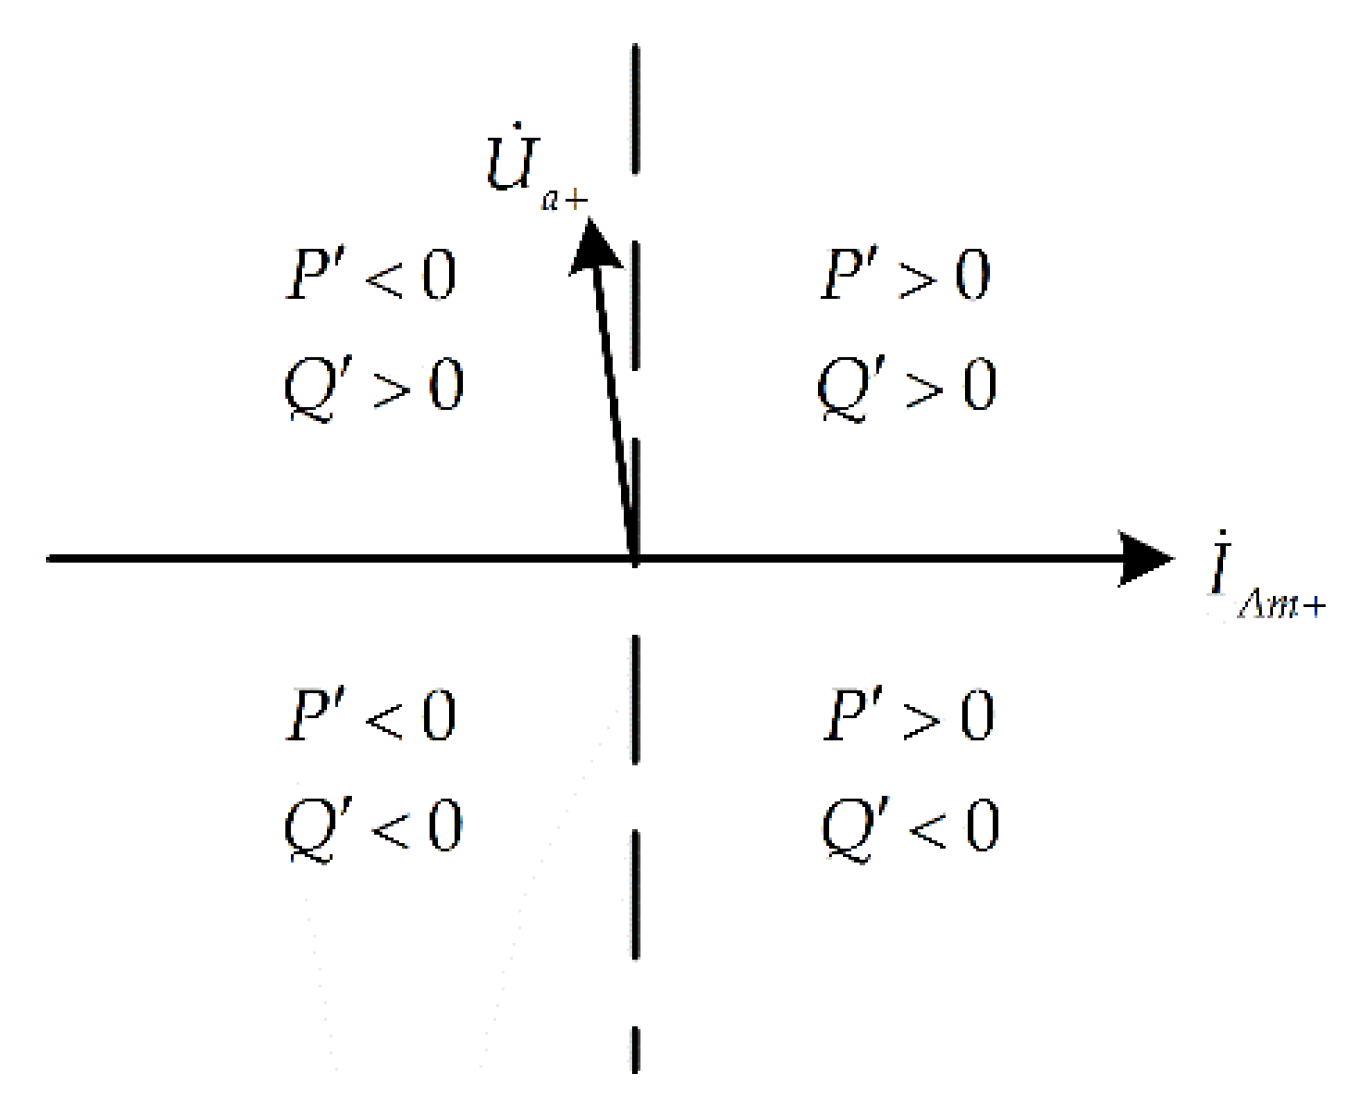
  • The output characteristics of the VSC-HVDC interconnector after faults are related to the operation state before the fault, fault location, fault type, fault resistance, etc. The magnitudes of output positive-sequence currents of the interconnector are limited after the fault, and the power factor angle of the interconnector at the fault side is in the range of 0°–360°.
  • The fault ride-through (FRT) strategy which is applicable to the VSC-HVDC interconnector operating characteristic of working in all four quadrants of the P-Q operating plane and capable of eliminating negative-sequence currents under unbalanced faults is proposed.
  • Theoretical analysis and simulation results show that traditional phase-to-phase distance protection, ground distance protection, and pilot protection are all inapplicable to lines emanating from the interconnector, while these protections are still applicable to AC lines that are not directly emanating from the interconnector. An investigation with a real protection system will be further conducted to confirm the theoretical analysis.
  • A novel pilot protection principle based on the ratio between phase currents and the ratio between negative-sequence currents flowing through both sides of the line is proposed for AC lines emanating from the interconnector. Simulation results shows that the proposed protection principle can accurately recognize internal faults and external faults including balanced and unbalanced faults, and has the ability to eliminate the influence of fault resistance.

Acknowledgments

The authors would like to acknowledge the financial support from the National High Technology Research and Development of China (863 program) (No. 2015AA050102).

Author Contributions

Shimin Xue proposed the idea and drafted the article. Jingyue Yang provided the results of the simulation. Valuable comments on the first draft were received from Yanxia Chen, Cunping Wang, Zhe Shi, Miao Cui and Botong Li.

Conflicts of Interest

The authors declare no conflict of interest.

Appendix

The compound sequence network under a phase B-to-phase C fault that happens at f1 on line mn is shown in Figure A1, and the fault resistance is 2Rf.
Figure A1. Compound sequence network under a phase B-to-phase C fault at f1.
Energies 09 00400 g023
In Figure A1, İdev represents the output current of the interconnector; İAm+ and İAn+ are the positive-sequence currents flowing through R1 and R2, respectively; İAn− is the negative-sequence current flowing through R2; U ˙ a + and U ˙ a are the positive-sequence voltage and negative-sequence voltage at the fault spot, respectively; U ˙ A m + is the positive-sequence voltage at bus m; Z m + is the positive-sequence impedance between R1 and the fault location and is represented by Z f m in this paper; Z n + is the positive-sequence impedance between R2 and the fault location and is represented by Z f n in this paper; since the negative-sequence currents flowing through bus m side are eliminated by the interconnector, the negative-sequence impedance between R1 and the fault location is nearly infinite in negative-sequence network, and U ˙ A m U ˙ a , where U ˙ A m is the negative-sequence voltage at bus m; Z n is the negative-sequence impedance between R2 and the fault location, and Z n = Z n + ; E ˙ A n is phase A voltage of the equivalent voltage source at the back side of bus n; Z S e q + and Z S e q are the equivalent positive-sequence impedance and negative-sequence impedance at the back side of bus n, respectively, and it is assumed that Z S e q + = Z S e q in this paper. According to symmetrical component method and nodal voltage method, the following two equations can be obtained:
( U ˙ A m + I ˙ A m + Z f m ) ( 1 Z S e q + + Z f n + 1 Z s e q + + Z f n + 2 R f ) = I ˙ A m + + E ˙ A n Z S e q + + Z f n
U ˙ a = ( U ˙ A m + I ˙ A m + Z f m ) Z s e q + Z n Z s e q + Z n + 2 R f
The impedance measured by the BC element in R1 is:
Z R 1 _ B C = U ˙ B m U ˙ C m I ˙ B m I ˙ C m = ( α 2 α ) U ˙ A m + + ( α α 2 ) U ˙ A m ( α 2 α ) I ˙ A m + + ( α α 2 ) I ˙ A m = U ˙ A m + U ˙ a I ˙ A m +
Substitute Equation (A2) into Equation (A3), and Equation (A4) can be obtained:
Z R 1 _ B C = Z f m + U ˙ A m + I ˙ A m + Z f m I ˙ A m + 2 R f Z s e q + + Z f n + 2 R f
Equation (A1) can also be written as:
U ˙ A m + I ˙ A m + Z f m = I ˙ A m + + E ˙ A n Z S e q + + Z f n 1 Z S e q + + Z f n + 1 Z s e q + + Z f n + 2 R f
Substituting Equation (A5) and Z f n = Z m n Z f m into Equation (A4), and the impedance measured by the BC element in R1 can be expressed as:
Z R 1 _ B C = Z f m + R f Z S e q + + ( Z m n Z f m ) Z S e q + + ( Z m n Z f m ) + R f ( 1 + E ˙ A n Z S e q + + ( Z m n Z f m ) I ˙ A m + ) Δ Z R 1 _ B C
where Z m n is the positive-sequence impedance of line mn.
When a three-phase fault happens on line mn and the fault resistance is Rf, the measured impedance of R1 can be derived in the same way as described above. And the impedance measured by the phase element in R1 can also be expressed as Equation (A6). The derivation process is omitted here.

References

  1. Ooi, B.T.; Wang, X. Boost-type PWM HVDC transmission system. IEEE Trans. Power Deliv. 1991, 6, 1557–1563. [Google Scholar] [CrossRef]
  2. Yazdani, A.; Iravani, R. Voltage-Sourced Converters in Power Systems: Modeling, Control, and Applications; Wiley and IEEE Press: Hoboken, NJ, USA, 2010; pp. 1–20. [Google Scholar]
  3. Flourentzou, N.; Agelidis, V.G.; Demetriades, G.D. VSC-based HVDC power transmission systems: An overview. IEEE Trans. Power Electron. 2009, 24, 592–602. [Google Scholar] [CrossRef]
  4. Asplund, G. Application of HVDC Light to power system enhancement. In Proceedings of the IEEE Power Engineering Society Winter Meeting, Singapore, 23–27 January 2000; pp. 2498–2503.
  5. Noroozian, M.; Edris, A.A.; Kidd, D.; Keri, A.J.F. The potential use of voltage-sourced converter-based back-to-back tie in load restorations. IEEE Trans. Power Deliv. 2003, 18, 1416–1421. [Google Scholar] [CrossRef]
  6. Zhang, R.; Zhao, C. Prony analysis of electrical transient characteristics of AC system during HVDC commutation failure. In Proceedings of the IPEC, Singapore, 27–29 October 2010; pp. 807–812.
  7. Huang, S.; Shen, H.; Fei, B.; Li, O. Effect of commutation failure on the distance protection and the countermeasures. IET Gener. Transm. Distrib. 2015, 9, 838–844. [Google Scholar] [CrossRef]
  8. Zhang, P.; Li, H.; Wang, G.; Zhu, G. The impact of HVDC commutation failure on the distance protection. In Proceedings of the Power and Energy Engineering Conference (APPEEC), Chengdu, China, 28–31 March 2010; pp. 1–4.
  9. Liu, Q.; Cai, Z.; Huang, M.; Liu, Z.; Li, Y.; Li, X.; Zhu, L. Influence of HVDC commutation failure on directional comparison pilot protection of AC system. In Proceedings of the Third International Conference on Electric Utility Deregulation and Restructuring and Power Technologies (DRPT), Nanjing, China, 6–9 April 2008; pp. 1943–1948.
  10. Shen, H.; Huang, S.; Fei, B. Transient characteristic of HVDC system during commutation failure, its effect on differential protection and countermeasures. Electr. Power Autom. Equip. 2015, 35, 109–114. (In Chinese) [Google Scholar]
  11. Abbas, A.M.; Lehn, P.W. PWM based VSC-HVDC systems—A review. In Proceedings of the Power & Energy Society (PES) General Meeting, Calgary, AB, Canada, 26–30 July 2009; pp. 1–9.
  12. Hooshyar, A.; Azzouz, M.A.; El-Saadany, E.F. Distance protection of lines emanating from full-scale converter-interfaced renewable energy power plants-part I: Problem statement. IEEE Trans. Power Deliv. 2015, 30, 1770–1780. [Google Scholar] [CrossRef]
  13. Hooshyar, A.; Azzouz, M.A.; El-Saadany, E.F. Distance protection of lines emanating from full-scale converter-interfaced renewable energy power plants-part II: Solution description and evaluation. IEEE Trans. Power Deliv. 2015, 30, 1781–1791. [Google Scholar] [CrossRef]
  14. Lesnicar, A.; Marquardt, R. An innovative modular multilevel converter topology suitable for a wide power range. In Proceedings of the IEEE Power Tech Conference, Bologna, Italy, 23–26 June 2003.
  15. Song, H.S.; Nam, K. Dual current control scheme for PWM converter under unbalanced input voltage conditions. IEEE Trans. Ind. Electron. 1999, 46, 953–959. [Google Scholar] [CrossRef]
  16. Zhang, G.; Xu, Z. A new real-time negative and positive sequence components detecting method based on space vector. In Proceedings of the IEEE Power Engineering Society Winter Meeting, Columbus, OH, USA, 28 January–1 February 2001; pp. 275–280.
  17. Lee, S.J.; Kang, J.K.; Sul, S.K. A new phase detecting method for power conversion systems considering distorted conditions in power system. In Proceedings of the IEEE Industry Applications Conference: Thirty-Fourth IAS Annual Meeting, Phoenix, AZ, USA, 3–7 October 1999; pp. 2167–2172.
  18. Zhao, X.; Li, G.; Zhao, C. Research on submodule capacitance voltage balancing of MMC based on carrier phase shifted SPWM technique. In Proceedings of the China International Conference on Electricity Distribution (CICED), Nanjing, China, 13–16 September 2010; pp. 1–6.
  19. Saeedifard, M.; Iravani, R. Dynamic performance of a modular multilevel back-to-back HVDC system. IEEE Trans. Power Deliv. 2010, 25, 2903–2912. [Google Scholar] [CrossRef]
  20. Guan, M.; Xu, Z. Modeling and control of a modular multilevel converter-based HVDC system under unbalanced grid conditions. IEEE Trans. Power Electron. 2012, 27, 4858–4867. [Google Scholar] [CrossRef]
  21. Ren, J.; Zhao, J.; Yu, D.; Li, K.; Niu, L.; Liang, Y. Mode switching control strategy for VSC-HVDC transmission system. Autom. Electr. Power Syst. 2012, 36, 69–73. (In Chinese) [Google Scholar]
  22. IEEE PES Power System Relaying and Control Committee. Available online: http://www.pes-psrc.org/Reports/D4_Application_of_Overreaching_Distance%20_Relays.pdf (accessed on 4 April 2016).
  23. Horowitz, S.H.; Phadke, A.G. Power System Relaying, 3rd ed.; Wiley and Research Studies Press: Chichester, UK, 2008; pp. 101–129. [Google Scholar]
  24. Altuve, H.; Benmouyal, G.; Roberts, J.; Tziouvaras, D.A. Transmission line differential protection with an enhanced characteristic. In Proceedings of the Eighth IEE International Conference on Developments in Power System Protection, Amsterdam, The Netherlands, 5–8 April 2004; pp. 414–419.
  25. Phadke, A.G.; Thorp, J.S. Computer Relaying for Power Systems, 2nd ed.; Wiley and Research Studies Press: Chichester, UK, 2009; pp. 55–108. [Google Scholar]
Figure 1. Model of an AC/DC hybrid system.
Energies 09 00400 g001
Figure 2. Command reference of positive-sequence reactive current when a < 0.9.
Energies 09 00400 g002
Figure 3. A common characteristic shape of quadrilateral relays.
Energies 09 00400 g003
Figure 4. Failure to operate or overreach of R1 under phase-to-phase faults with fault resistance: (a) R1 fails to trip when fault is located inside Zone 1; (b) R1 overreaches when fault is located outside Zone 1.
Energies 09 00400 g004
Figure 5. Circuit diagrams of phase B-to-phase C faults: (a) A non-bolted fault happens at f1; (b) A bolted fault happens at f2.
Energies 09 00400 g005
Figure 6. The measured impedance of R2 when the magnitudes of fault currents flowing through both ends of line mn differ greatly.
Energies 09 00400 g006
Figure 7. Current difference of fault phases at each side of line mn: (a) Magnitudes; (b) Phase angles.
Energies 09 00400 g007
Figure 8. The operating characteristic of BC elements in R1 and R2: (a) BC element in R1; (b) BC element in R2.
Energies 09 00400 g008
Figure 9. Measured impedances of the BC elements in R1 and R2: (a) Measured impedance of the BC element in R1; (b) Measured impedance of the BC element in R2.
Energies 09 00400 g009
Figure 10. Areas of measured impedances of BC element in each relay under phase B-to-phase C faults on line mn ( P 0 = 200  MW and Q 0 = 0  MVar ): (a) R1; (b) R2.
Energies 09 00400 g010
Figure 11. Areas of measured impedances of BC element in each relay under phase B-to-phase C faults on line mn ( P 0 = 100  MW and Q 0 = 0  MVar ): (a) R1; (b) R2.
Energies 09 00400 g011
Figure 12. Compound sequence network under a phase-A-to-ground fault at f1.
Energies 09 00400 g012
Figure 13. Simplified compound sequence network under a phase-A-to-ground fault at f1.
Energies 09 00400 g013
Figure 14. The relationship between the injected power from the interconnector side and the phase angle difference between U ˙ a + and İAm+.
Energies 09 00400 g014
Figure 15. Possible phase relationships among positive-sequence component İAm+ of current provided by the interconnector, positive-sequence component İAn+ of current provided by traditional voltage sources, and positive-sequence component İAf+ of the fault path current: (a)–(c) İAm+ lags İAf+ and İAf+ lags İAn+; (d)–(f) İAm+ leads İAf+ and İAf+ leads İAn+.
Energies 09 00400 g015
Figure 16. Sequence components of the fault currents and measured impedances in Case 1: (a) The sequence components of the currents flowing through R1 and R2; (b) Phase angles of the sequence components; (c) Measured impedance of the AG element in R1; (d) Measured impedance of the AG element in R2.
Energies 09 00400 g016
Figure 17. Sequence components of the fault currents and measured impedances in Case 2: (a) The sequence components of the currents flowing through R1 and R2; (b) Phase angles of the sequence components; (c) Measured impedance of the AG element in R1; (d) Measured impedance of the AG element in R2.
Energies 09 00400 g017
Figure 18. İAm, İAn, İdiff, and İAres: (a) İAm and İAn; (b) Phase angles of İAm and İAn; (c) İdiff and İAres (d) Magnitudes of İdiff and İAres.
Energies 09 00400 g018
Figure 19. Values detected by relays and the trip signal under an internal phase-A-to-ground fault: (a) Magnitude of negative-sequence voltage at bus m side of line mn; (b) Magnitudes of zero-sequence currents at both sides of line mn; (c) Magnitudes of negative-sequence currents at both sides of line mn; (d) The ratio between negative-sequence currents flowing through both sides of line mn; (e) The ratio between phase A currents flowing through both sides of line mn; (f) The trip signal for unbalanced fault.
Energies 09 00400 g019aEnergies 09 00400 g019b
Figure 20. Values detected by relays and the trip signal under an internal balanced fault: (a) Magnitude of negative-sequence voltage at bus m side of line mn; (b) Magnitudes of zero-sequence currents at both sides of line mn; (c) Magnitudes of negative-sequence currents at both sides of line mn; (d) The ratio between negative-sequence currents flowing through both sides of line mn; (e) The ratio between phase A currents flowing through both sides of line mn; (f) The trip signal for balanced fault.
Energies 09 00400 g020aEnergies 09 00400 g020b
Figure 21. Values detected by relays under an external phase-A-to-ground fault: (a) Magnitude of negative-sequence voltage at bus m side of line mn; (b) Magnitudes of zero-sequence currents at both sides of line mn; (c) Magnitudes of negative-sequence currents at both sides of line mn; (d) The ratio between negative-sequence currents flowing through both sides of line mn.
Energies 09 00400 g021
Figure 22. Values detected by relays under an external balanced fault: (a) Magnitude of negative-sequence voltage at bus m side of line mn; (b) Magnitudes of zero-sequence currents at both sides of line mn; (c) The ratio between phase A currents flowing through both sides of line mn.
Energies 09 00400 g022
Table 1. Parameters of the AC lines.
ParameterPositive-SequenceZero-Sequence
R/(Ω/km)0.1050.315
L/(mH/km)1.2583.774

