Case Report

Performance Analysis of a Grid-Connected Upgraded Metallurgical Grade Silicon Photovoltaic System

1
Department of Systems Engineering and Engineering Management, City University of Hong Kong, Kowloon, Hong Kong, China
2
Centre for Systems Informatics Engineering, City University of Hong Kong, Kowloon, Hong Kong, China
3
School of Management, University of Texas at Dallas, Richardson, TX 75080-3021, USA
*
Author to whom correspondence should be addressed.
Energies 2016, 9(5), 342; https://doi.org/10.3390/en9050342
Submission received: 2 March 2016 / Revised: 26 April 2016 / Accepted: 27 April 2016 / Published: 5 May 2016

Abstract

:
Because of their low cost, photovoltaic (PV) cells made from upgraded metallurgical grade silicon (UMG-Si) are a promising alternative to conventional solar grade silicon-based PV cells. This study investigates the outdoor performance of a 1.26 kW grid-connected UMG-Si PV system over five years, reporting the energy yields and performance ratio and estimating the long-term performance degradation rate. To make this investigation more meaningful, the performance of a mono-Si PV system installed at the same place and studied during the same period of time is presented for reference. Furthermore, this study systematizes and rationalizes the necessity of a data selection and filtering process to improve the accuracy of degradation rate estimation. The impact of plane-of-array irradiation threshold for data filtering on performance ratio and degradation rate is also studied. The UMG-Si PV system’s monthly performance ratio after data filtering ranged from 84% to 93% over the observation period. The annual degradation rate was 0.44% derived from time series of monthly performance ratio using the classical decomposition method. A comparison of performance ratio and degradation rate to conventional crystalline silicon-based PV systems suggests that performance of the UMG-Si PV system is comparable to that of conventional systems.

1. Introduction

During the last decade, the global photovoltaic (PV) market has grown at an average rate of 50% annually [1]. However, the high cost of PV cells made from conventional solar grade silicon is a hindrance to the rapid growth of the PV industry. One promising alternative is to use PV cells made from upgraded metallurgical grade silicon (UMG-Si) purified via the metallurgical process route [2,3,4]. The production of UMG-Si can be five times more energy efficiency than the conventional Siemens process to produce solar grade silicon; hence, the cost of UMG-Si is much lower [5,6]. However, UMG-Si contains more impurities, resulting in lower efficiency of crystalline silicon solar cells made from such materials than from the conventional Siemens process. Thanks to the improvements in the UMG purification process, Zheng et al., in 2016 [7] reported solar cells fabricated with 100% UMG-Si with peak efficiency of 20.9%, and 21.9% for a control device made from electronic grade silicon. Nevertheless, the potential advantage of low cost can be impaired if outdoor efficiency is reduced by degradation of quality due to high concentration of metallic and non-metallic impurities [8]. Manufacturers have started producing PV cells made of UMG-Si, and demonstration projects have been launched. PV modules made from UMG-Si manufactured by Canadian Solar and Silicor Materials are being tested at the National Renewable Energy Laboratory (NREL) [9]. In China, a UMG-Si PV plant with a capacity of 330 kW has been built [10]. Measurement and reporting of the outdoor performance of UMG-Si PV systems will help facilitate further improvements and better applications.
The outdoor performance of a PV system strongly depends on effective irradiation and module temperature. The power output as well as the module efficiency of crystalline silicon modules decreases with increasing cell temperature. In the field, however, there is often a difference between the observed incident irradiation on the surface of PV modules and the effective irradiation that is useful for PV production. This difference is explained by the influence of the solar spectrum and solar angle-of-incidence (AOI). PV modules respond more strongly to a certain range of wavelength of light contained in the solar spectrum [11]; the latter describes the intensity of irradiation at each wavelength of the incoming light, and varies as the day progresses. The influence of AOI on PV performance is due to two causes. One is the so called “cosine effect” which has already been removed from the pyranometer’s irradiation measurement; optical loss, however, related to AOI still remains [12].
The performance of PV modules tends to degrade over time. Degradation rate, Rd, which characterizes the changes of PV power delivery capacity over time, is of great importance in evaluating the long-term reliability of a PV system. Jordan et al. [13] surveyed nearly 2000 reported degradation rates, finding a median of 0.5% with a range from −0.2% to 4.2%. Rd is usually derived from time series of PV performance metrics such as performance ratio (PR). To obtain an accurate degradation rate, it is desirable for the impacts of non-degradation factors to be isolated from PV performance metrics. To improve the accuracy of degradation rate estimation, the research presented in a number of previous articles [14,15,16] has filtered the observed data, discarding data points with low levels of irradiation, eliminating data points on cloudy days with large fluctuations in irradiation, and removing outliers. Analytical techniques also greatly influence the accuracy of degradation rate estimation. In the literature, linear regression is the most widely used analytical technique to estimate Rd from time series of performance metrics [17]. Other analytical techniques, classical decomposition and autoregressive integrated moving average (ARIMA), were used in [18] to estimate Rd with stronger robustness against data shift, outliers, and shorter observation time than linear regression.
The aim of this study is to investigate the long-term outdoor performance of a 1.26 kW grid-connected UMG-Si PV system installed at the NREL in Golden, Colorado, USA. This investigation consists of two parts: evaluation of system performance in converting solar energy to electricity; and estimation of the long-term performance degradation rate. To make the investigation more meaningful, the performance of another 1 kW PV system consisting of PV cells made from monocrystalline silicon surrounded by ultra-thin amorphous silicon layers installed at the same place and studied during the same period of time is presented for reference. In the following sections, these two PV systems are identified as UMG-Si and mono-Si PV systems, respectively.
Furthermore, this study strives to systematize and rationalize the necessity of using a data selection and filtering procedure to obtain more reliable long-term performance metrics for degradation rate estimation. The impact of a plane-of-array (POA) irradiation threshold for data filtering on PR and estimated degradation rate is also studied.
The remainder of the paper is organized as follows. Section 2 briefly introduces the PV systems and database used in this study. In Section 3, the methods used to evaluate PV performance and to estimate the degradation rate are developed. Results and discussion are in Section 4. A comparison of PR and Rd for the UMG-Si PV system to those for conventional crystalline silicon-based PV modules is made in Section 5. This is followed by conclusions in Section 6.

2. PV System and Database

The UMG-Si PV system and the mono-Si PV system are located in Golden, CO, USA (latitude 39.74°N, longitude 105.18°W). The 1.26 kW UMG-Si PV array consists of 6 polycrystalline silicon based CS6P-210PE modules manufactured by Canadian Solar, and the 1 kW mono-Si PV array consists of 5 HIP-200BA3 modules manufactured by Sanyo (San Diego, CA, USA). The PV arrays are installed at a fixed direction with a tilt angle of 40° to receive maximal average solar irradiation. The PV arrays are connected to inverters manufactured by PV Powered for the UMG-Si PV system and by SMA for the mono-Si PV system. The inverter performs maximal power point tracking, which controls voltage at the optimum level to maximize power delivery. Thus, in this study the performance of PV is measured at the maximal power point. Electrical properties of the two kinds of modules are presented in Table 1.
The continuously observed data for the PV systems is measured using a Campbell Scientific data logger by NREL [9]. DC performance is measured over a 50 mV current shunt and voltage divider. Meteorological and electrical data are sampled every 5 s and averaged every minute. POA irradiation is measured with a Kipp and Zonen CMP-11 broadband pyranometer. Module temperature is measured with three T-type thermocouples. The mono-Si PV system was installed almost three years earlier than the UMG-Si PV system; however, only the performance of both systems from 1 January 2011 to 31 December 2015 will be reported and used to analyze the annual performance degradation rate.

3. Methods

3.1. Evaluation of PV Performance

IEC standard 61724 [19] defines normalized parameters like PV array yield (Ya) and reference yield (Yr) to quantify the energy production and solar resources over a period, and defines PR to describe the overall energy transformation capacity of a PV system. These normalized quantities can be updated daily, monthly, or yearly, and are often used to compare the performance of different PV systems. In this study, DC output from the UMG-Si PV array is used to minimize the effect of the inverter so as to focus on the performance of the PV array itself.
Ya is defined as energy E (integration of power over time) generated by the array during the given period divided by the array nominal power P0 (the theoretical power output given the reference irradiation and temperature):
Y a = E P 0 ( h )
Yr is defined as the ratio of the measured POA irradiation G over the given period to the reference irradiation G0:
Y r = G G 0 ( h )
PR is defined as Ya divided by Yr:
PR = 100 Y a Y r ( % )
In addition to the daily or monthly PR, we analyze its instantaneous counterpart, PRt, which is given by:
PR t = 100 P t / P 0 G t / G 0 ( % )
where Pt and Gt are instantaneous array power output and POA irradiation at time t, respectively.
PR over a period (daily or monthly) computed from instantaneous values is given by:
PR = 100 P t / P 0 G t / G 0 ( % )
Hence, PR is the ratio of the array’s output as a percentage of its nominal output, to actual irradiation as a percentage of nominal irradiation, indicating the response of the PV array to irradiation. PR normalizes power output for the most important driver of its variability, the first-order irradiation; thus, it removes this source of variability from power output variability making it a suitable performance metric to investigate long-term changes in PV performance.
This study will report the yields and PR of the UMG-Si PV system during the observation period in different time scales: minutely, daily, and monthly. Moreover, this study strives to investigate factors which make certain PR data points substantially less reliable in reflecting PV response to irradiation than others, thereby systematizing and providing the rationale for data filtering to obtain more reliable performance metrics for degradation rate estimation.

3.2. Estimation of Degradation Rate

Degradation rate is usually estimated from time series of PV performance metrics. In this study, the statistical technique of classical decomposition is used to derive the degradation rate from monthly PR.
Classical decomposition, in which the signal is partitioned into three components, the trend, the seasonality, and the irregular component, is mathematically expressed as:
Y t = T t + S t + e t , for t = 1, …, n
where Yt is the signal, Tt is the component of trend, St the component of seasonality, and et the remaining irregular component assumed to be random variables with zero mean and constant variance at time t [20,21]. In our study, Yt refers to the time series of monthly PR over the observed period of 60 months; hence, t ranges from 1 to 60 (n equals to 60). The component of trend is obtained from the original data by employing a two-step centered twelve-month moving average. For a 2× m moving average, (here m = 12, the number of months in a year), the centered average at time t is arrived at by:
T t = 1 2 m ( i = t m / 2 t + m / 2 1 Y i + i = t m / 2 + 1 t + m / 2 Y i )
where Tt is the trend for m/2 < t < n-m/2.
The degradation rate is obtained by applying a linear regression on the extracted trend Tt:
y = a x + b
where a is the slope of the line fitted to the series of Tt obtained in Equation (7) and b its corresponding intercept. b represents the estimated initial PR, and a represents the estimated monthly performance loss; thus, the annual degradation rate in percentage is expressed as:
R d = 100 12 a b ( % )
With the classical decomposition method, the impact of seasonal variation on Yt is expected to be reduced. The component of seasonality in each month throughout the observation period is derived by subtracting the extracted trend from the original signal. To eliminate the variation of seasonality in a given month of different years, average the values of each respective month throughout the observation period under the assumption that the seasonality in each month does not vary from year to year. After the seasonality is known, and using the trend, the remaining irregular component is calculated with Equation (6).

4. Results and Discussion

4.1. PV Performance

4.1.1. Instantaneous Performance

Instantaneous performance is analyzed on only five consecutive days from 28 March to 1 April 2015. These days are selected due to their variety of weather conditions. Figure 1 depicts the POA irradiation, power output, ambient temperature, and module temperature at time intervals of 1 min. 28 March and 29 March were sunny days on which there were no large fluctuations in irradiation over short time intervals. 30 March was a cloudy-sunny day, while 31 March was a sunny-cloudy day. 1 April was a cloudy day on which the fluctuation in irradiation was significant. The power was roughly proportional to the POA irradiation, and this relationship was tighter on sunny days than on cloudy days. Module temperature is related principally to ambient temperature, irradiation, and wind speed. The module temperature fluctuated synchronously with fluctuating incident POA irradiation, which was obviously observed on cloudy days.
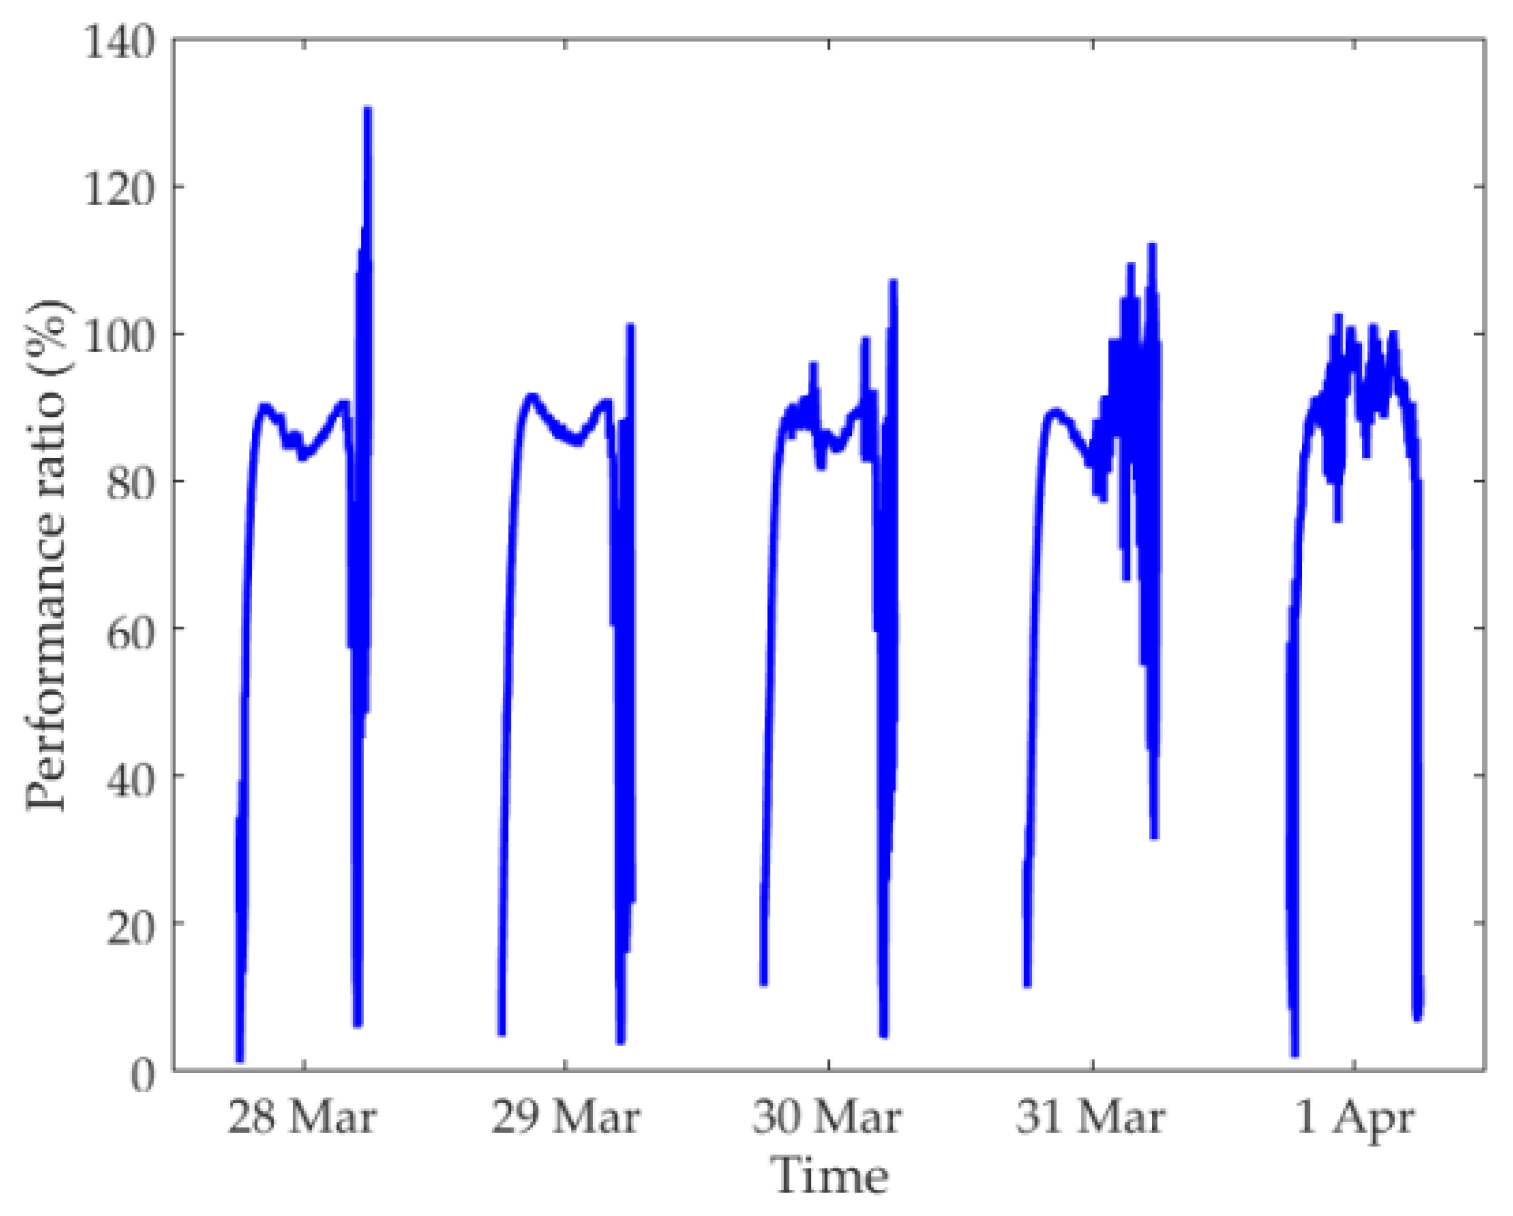
The instantaneous PR during the five consecutive days is presented in Figure 2. In the early morning, instantaneous PR increased quickly with increasing POA irradiation. This is explained partly by the decreasing solar angle-of-incidence, and partly by the variation of the solar spectrum. Oblique, that is, high, angles-of-incidence in early mornings result in small effective irradiation due to increased optical loss. The variation of the solar spectrum is primarily due to the variation in the air mass through which the irradiation travels in mornings, mid-days, and evenings. The air mass is greatest in mornings and evenings when the sun’s radiation passes at an oblique angle, thus passing through a large mass of air, and is lowest at mid-day. Instantaneous PR tended to be steady at around 88% at high mid-day levels of irradiation, while dropping slightly from prior hours due to higher module temperature. In the late afternoon, instantaneous PR fell in pace with decreasing POA irradiation due to the increasing angle-of-incidence as well as the change in solar spectrum. However, near sunset when the POA irradiation was close to zero, suspiciously high values of instantaneous PR, greater than 100%, were observed. This may have resulted from the inaccuracy of POA irradiation or power measurement at very low levels of irradiation, since a small error on the power or irradiation measurement can lead to large error in PR when the true value was very small. Figure 2 also shows that PR was more variable under cloudy conditions where solar irradiation largely fluctuated. This confirms that wide fluctuation in irradiation can considerably reduce the precision of PR [15]. Thus, it is necessary to discard data points with large fluctuation in irradiation to obtain more reliable PV performance metrics.
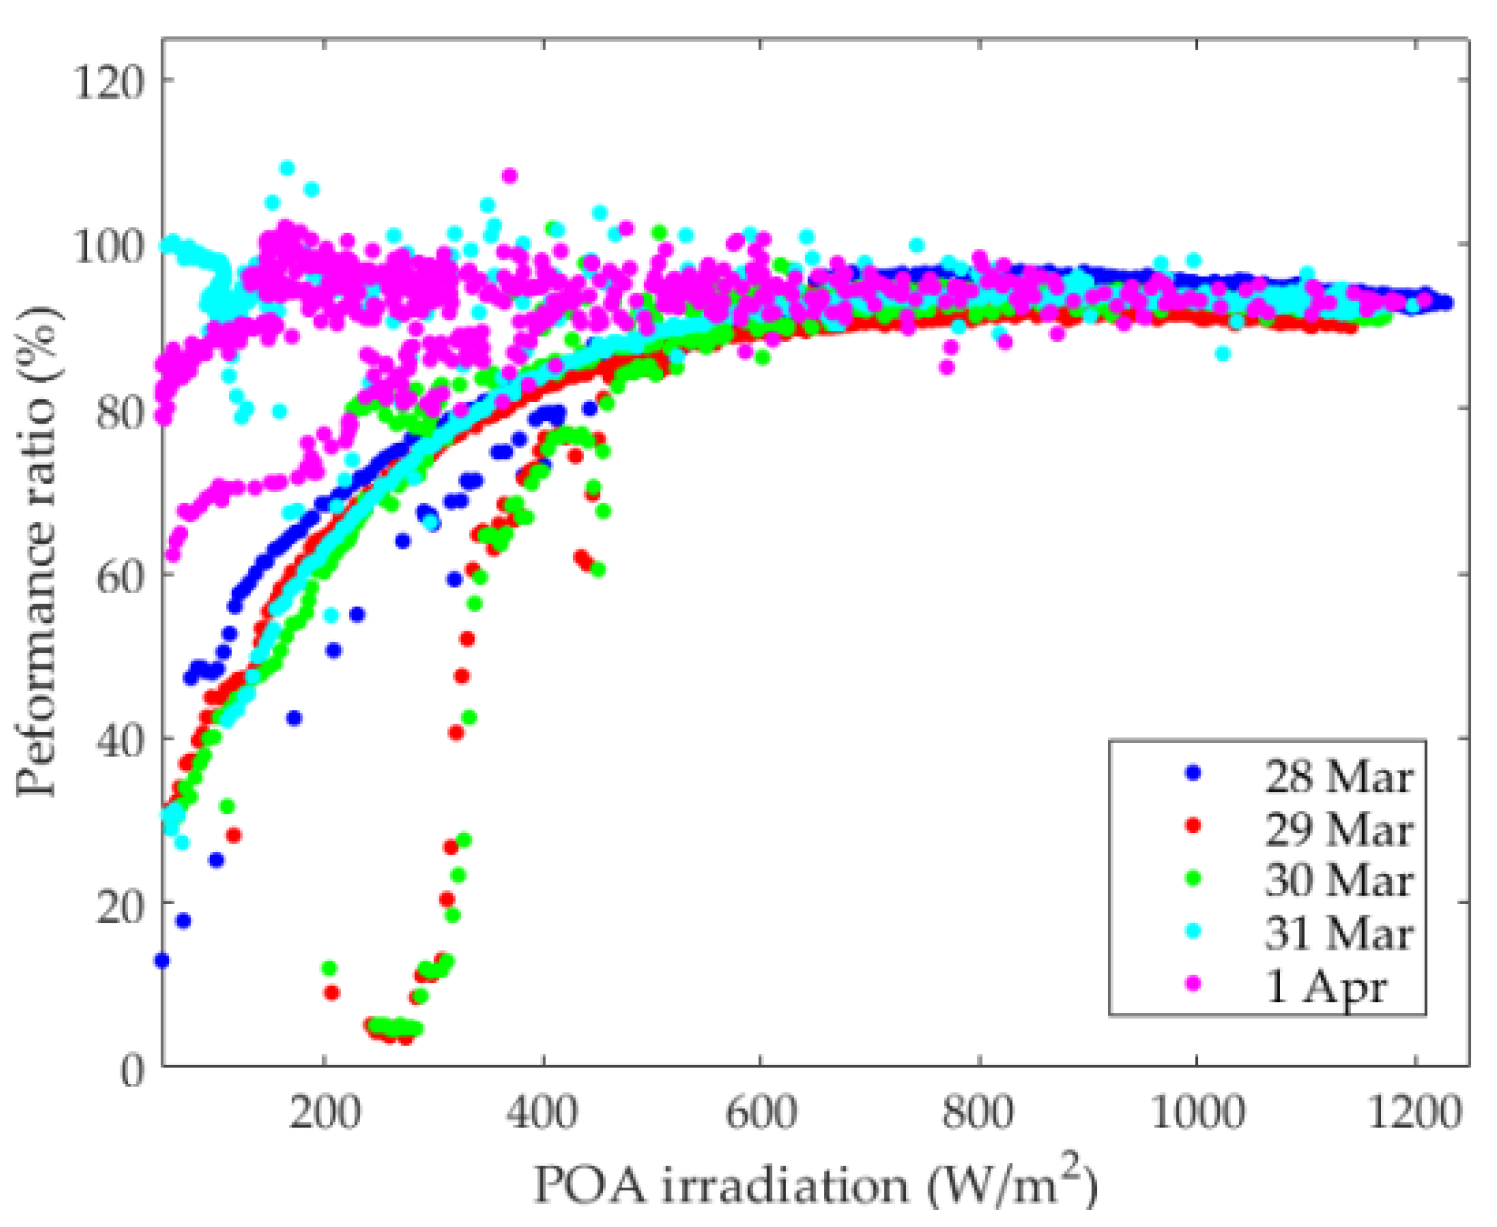
Figure 3 depicts the variation of PR as a function of POA irradiation. The impact of temperature is removed by converting PR to 25 °C using the maximal power temperature coefficient given in Table 1 with the equation PR25°C = PR/[1 + α(Tmod − 25)] where α is the maximal power temperature coefficient and Tmod is the module temperature. In Figure 3, data points where the POA irradiation is smaller than 50 W/m2 are dropped to eliminate misleading measurements at very low levels of irradiation.
As can be seen from Figure 3, irradiation intensity-dependent instantaneous PR varied little when the incident POA irradiation was greater than 600 W/m2; at this level of POA irradiation the influences caused by solar spectrum and solar angle-of-incidence were small. The effects of angle-of-incidence and solar spectrum explain why on cloudy days instantaneous PR at low levels of irradiation, around 200 W/m2, was greater than on sunny days. Suppose that the POA irradiation level on cloudy days at noon is close to the POA irradiation level in the early morning on sunny days. POA irradiation on cloudy days consists mainly of diffuse irradiation which reaches the surface of modules from all directions resulting in less optical loss compared to the beam component of POA irradiation at high oblique angle in the early morning on sunny days. The difference in solar spectrum between POA irradiation at noon on cloudy days and in the early morning on sunny days complicates the deviation of PR.
Analysis of the relationship between PR and POA irradiation strongly supports that, to obtain a more reliable PR series, it is necessary to discard data points at low levels of irradiation to reduce the impact of solar angle-of-incidence and solar spectrum.

4.1.2. Daily Performance

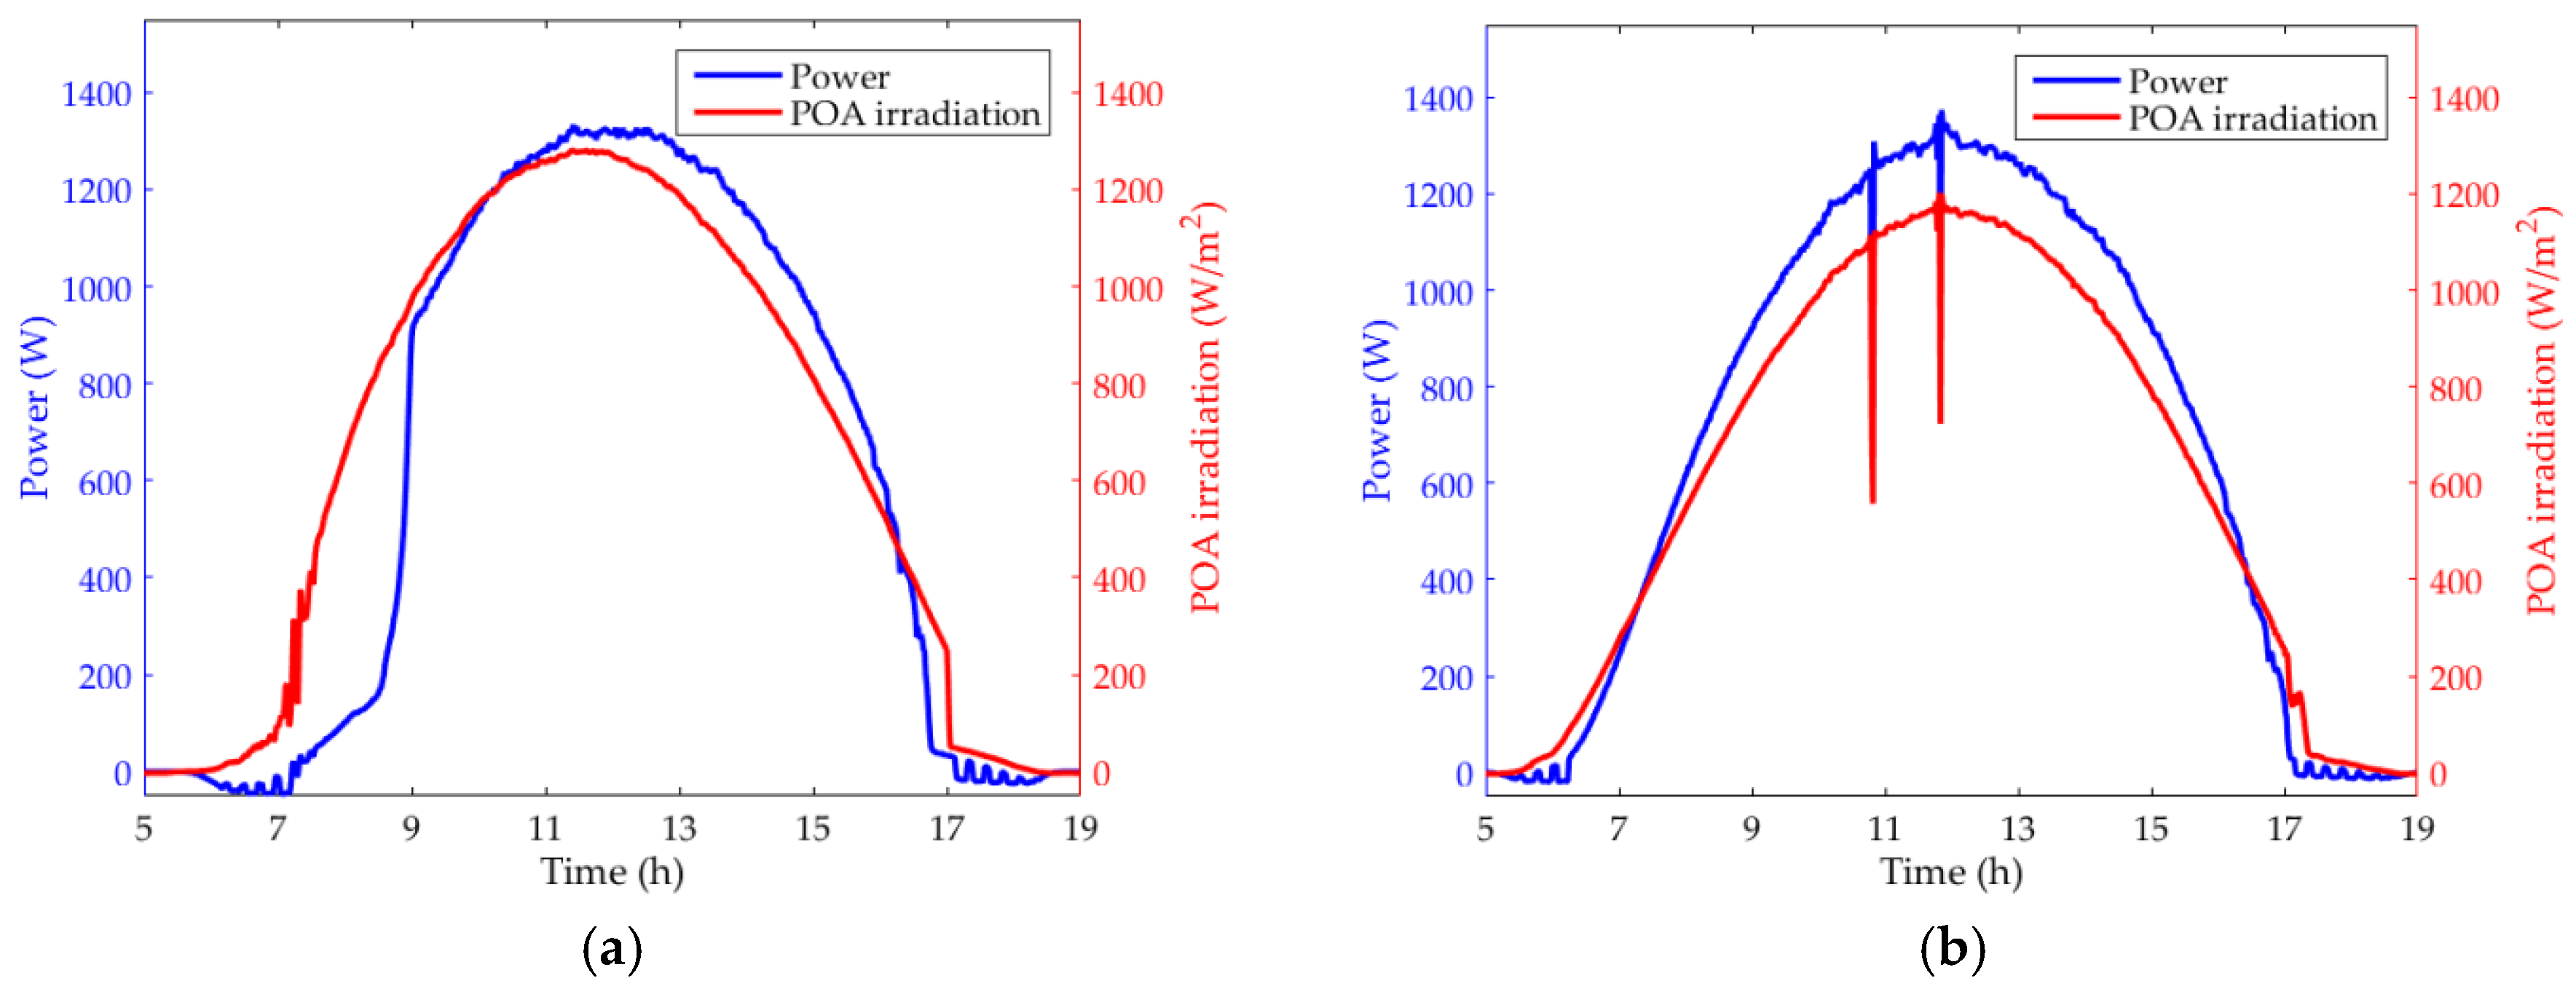
Figure 4 presents the daily array yield and daily reference yield from 1 January 2011 to 31 December 2015, which shows two peaks in each year. The peaks occurred on those dates when the sun was positioned so that the PV module received the most energy radiation. The observed maximal daily array yield 7.564 h (corresponding reference yield 8.581 h) occurred on 14 April 2013, while the observed maximal daily reference yield 9.207 h (corresponding array yield 6.808 h) occurred on 25 March 2013. The observed POA irradiation and PV power output on 25 March 2013 and on 14 April 2013 shown in Figure 5 explain why the day with maximal array yield did not coincide with the observed maximal daily reference yield. It is clearly illustrated that in the morning from 7 to 9 o’clock on 25 March 2013, the PV system didn’t fully respond to the incident irradiation, perhaps because of shading, resulting in less power generated than expected.
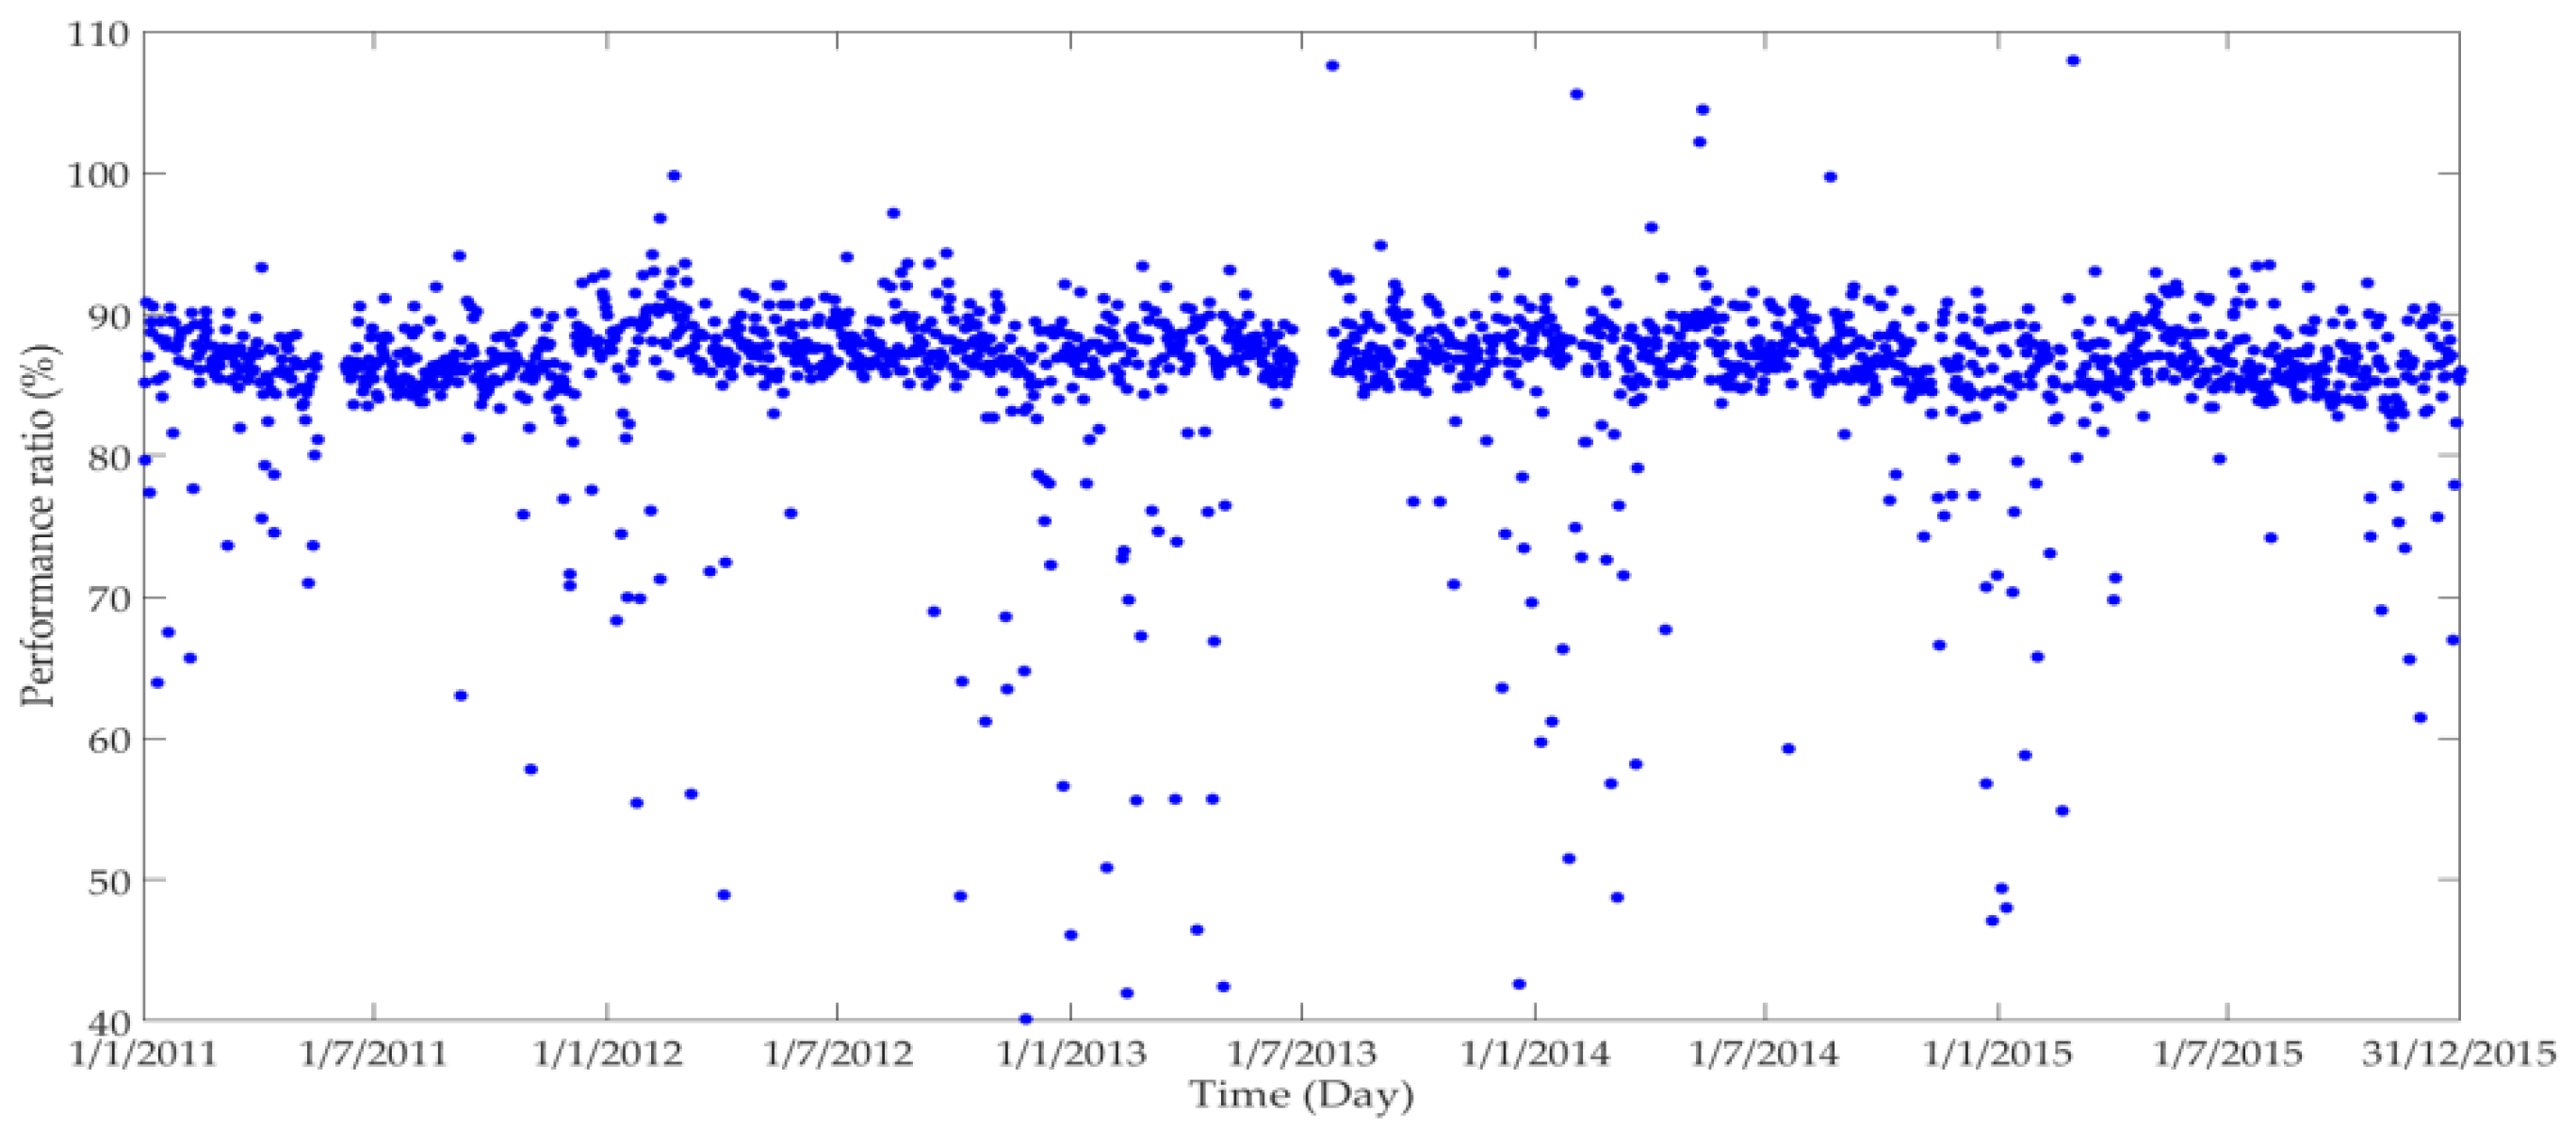
Figure 6 depicts the daily PR during the period of observation. Most values varied between 84% and 92%. Not much difference was observed from day to day or from year to year except for some irregular points. Those points with very low values resulted from snowing, shading of the PV array, system down-time, component failure, or errors in power data collection. Shading of the irradiation sensor or errors in irradiation data collection resulted in extremely high values of the daily PR. The daily PR can be used to identify operational problems.
There are some gaps in Figure 4a,b and Figure 6. This is due to system data unavailability from 19 May to 8 June 2011, and due to irradiation measurement error from 26 June to 23 July 2013.

4.1.3. Monthly Performance

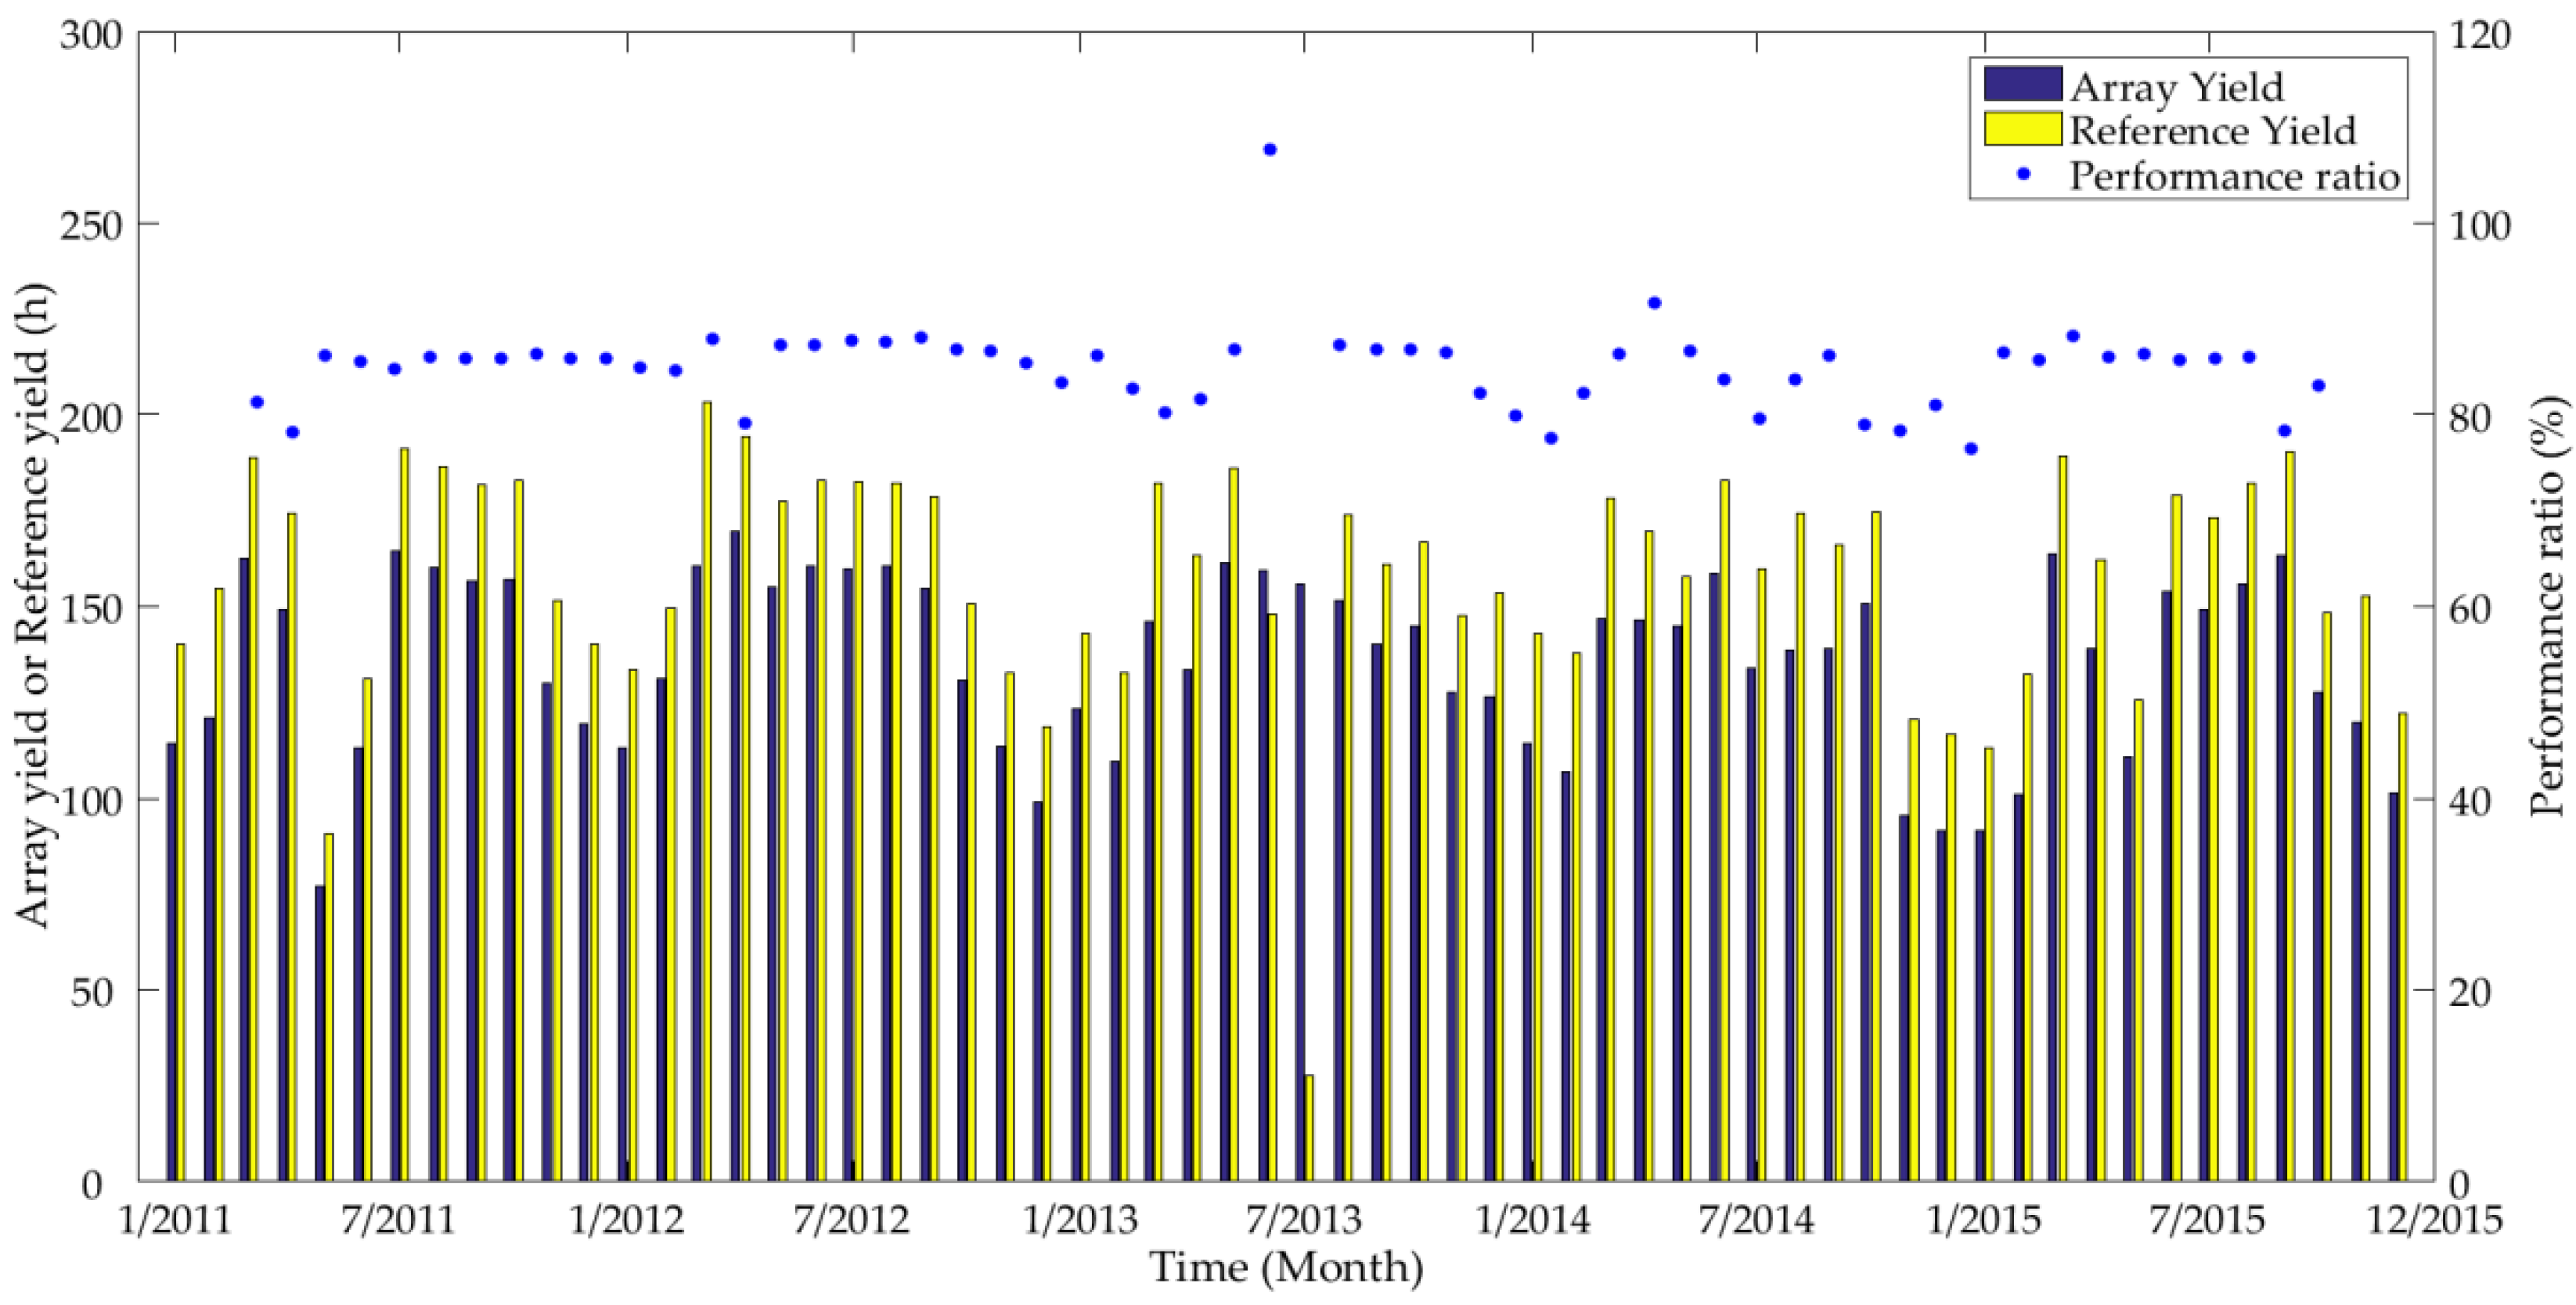
Figure 7 presents the monthly array yield, reference yield, and PR during the observed period; it shows that array yield and reference yield in summer were greater than in winter. The observed maximal monthly array yield and reference yield were 169.7 h and 203.2 h respectively, both in April 2012. Reference yield 90.6 h and array yield 76.9 h in May 2011 were abnormal compared to yields in the adjacent months as well as the yields in May of other years. This was a result of system data unavailability from 19 May to 8 June 2011 as shown in Figure 4a,b and Figure 6. From 26 June to 23 July 2013, due to irradiation measurement error shown in Figure 4b and Figure 6, array yields were greater than reference yields.
In Figure 7, the monthly PR excludes the data in July 2013 to avoid extremely high values due to measurement errors of irradiation. The monthly PR varied from 76.4% to 91.6%, and no obvious seasonal variation was observed.
Investigation of daily and monthly PV performance shows that outliers due to snowing, shading, system down-time, data availability, and measurement errors complicate performance metrics, making PR inefficiently reflect the response of the PV array to irradiation.
From analysis in this section, it will become clear that performance data points in the early morning and late evening when the POA irradiation is low, and data points on cloudy days with large fluctuation in irradiation, as well as certain outliers, are far more unreliable than those at mid-day on sunny days and need to be filtered out in order to obtain more reliable long-term performance metrics.

4.1.4. Performance after Data Filtering

To exclude influences from the aforementioned factors, the following steps were adopted to select appropriate data points:
  • Discarding data points with POA irradiation less than 600 W/m2 to reduce the impact of solar angle-of-incidence and solar spectrum.
  • Eliminating data points when the change of POA irradiation is more than 20 W/m2/min to reduce the impact of large fluctuations in irradiation on the precision of performance metrics.
  • Removing outliers based on instantaneous PR. Data points exceeding the lower or upper limit of PR, and data points with large deviation from the mean PR over a given period are considered outliers. In this study, the lower limit and upper limit of instantaneous PR are 75% and 100%, respectively, and the limit of deviation is ±5%.
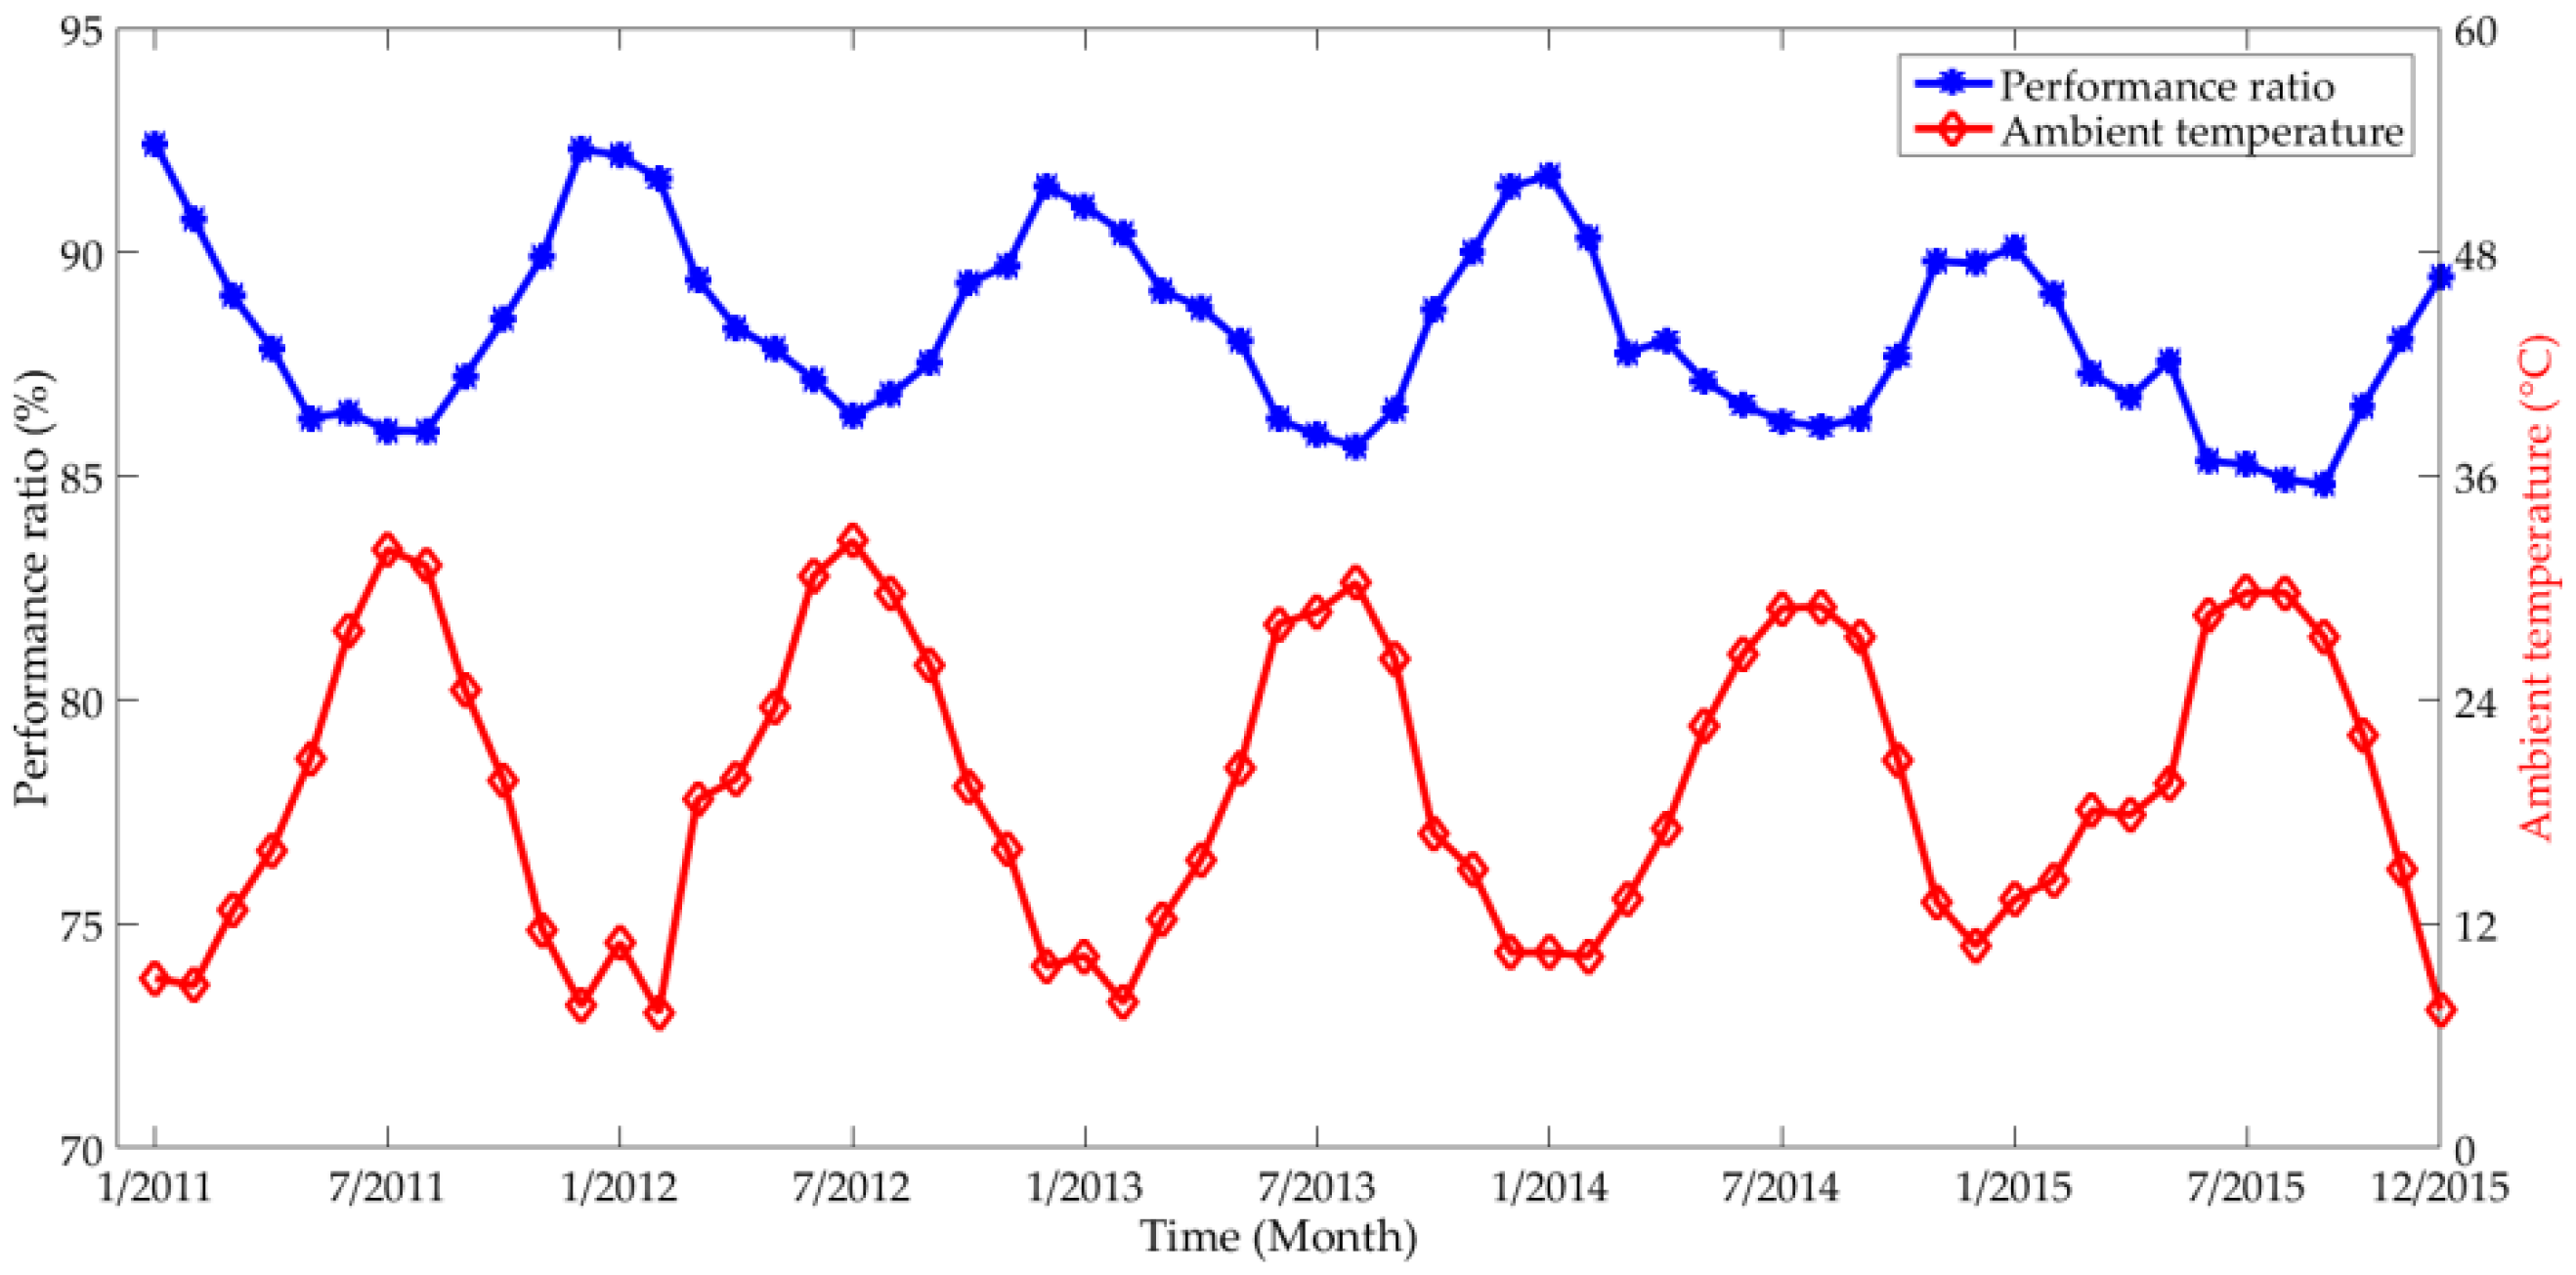
Figure 8 depicts the monthly PR after data filtering and the monthly average ambient temperature of selected data points. PR showed a strong seasonality and ranged from 84% to 93% over the observation period. This seasonality resulted from the seasonal variation of ambient temperature, wind speed, and remaining impacts of solar angle-of incidence and solar spectrum.

4.2. Annual Degradation Rate

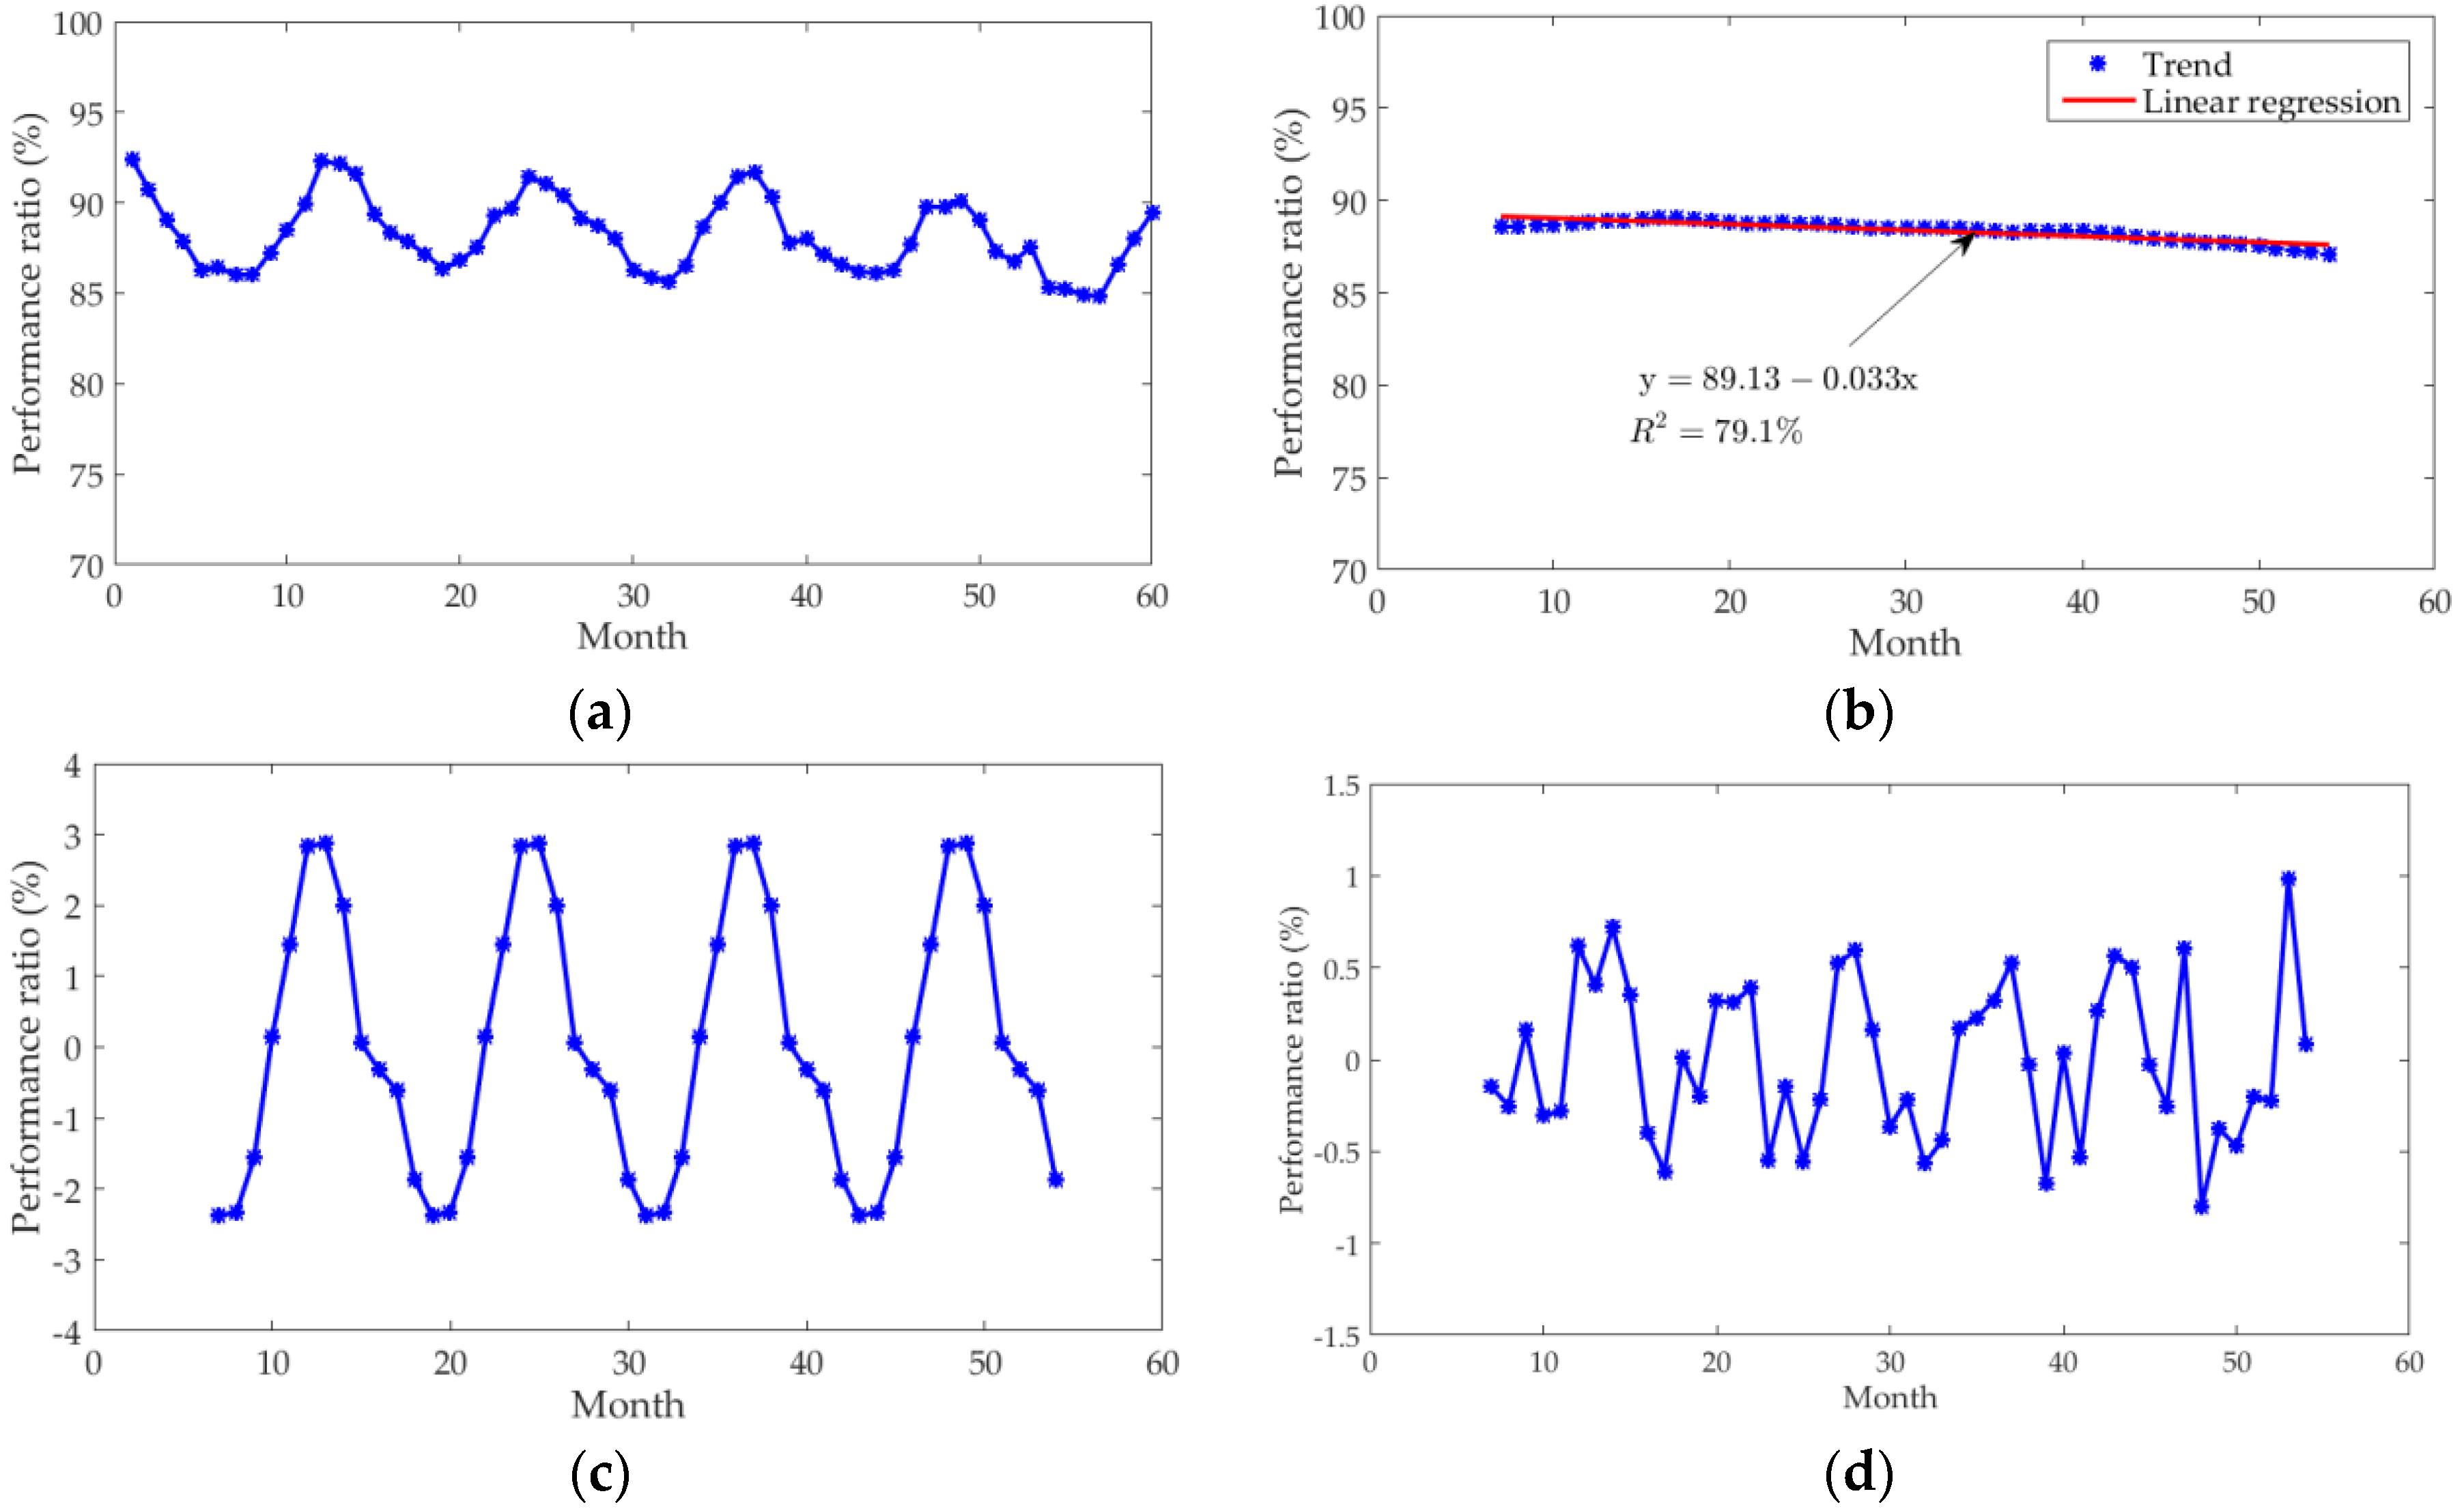
The three components after classical decomposition, the trend, the seasonality, and the irregularity are shown in Figure 9 accompanied by the original monthly PR. The trend shown in Figure 9b is obtained by applying a two-step centered twelve-month moving average expressed in Equation (7) to the original monthly PR in Figure 9a. A linear regression is applied to the trend to obtain the degradation rate. The fitted line using least square algorithm and its coefficient of determination R2 are also shown in Figure 9b. The coefficient of determination is a regression statistic which measures the goodness of fit. Higher values of the coefficient of determination imply better agreement between the fitted line and the observed data points [11]. The steps to obtain seasonal component and the remaining irregular component are well explained in Section 3.2. The estimated annual degradation rate was 0.44% using Equation (9).

4.3. Performance of the Mono-Si PV System

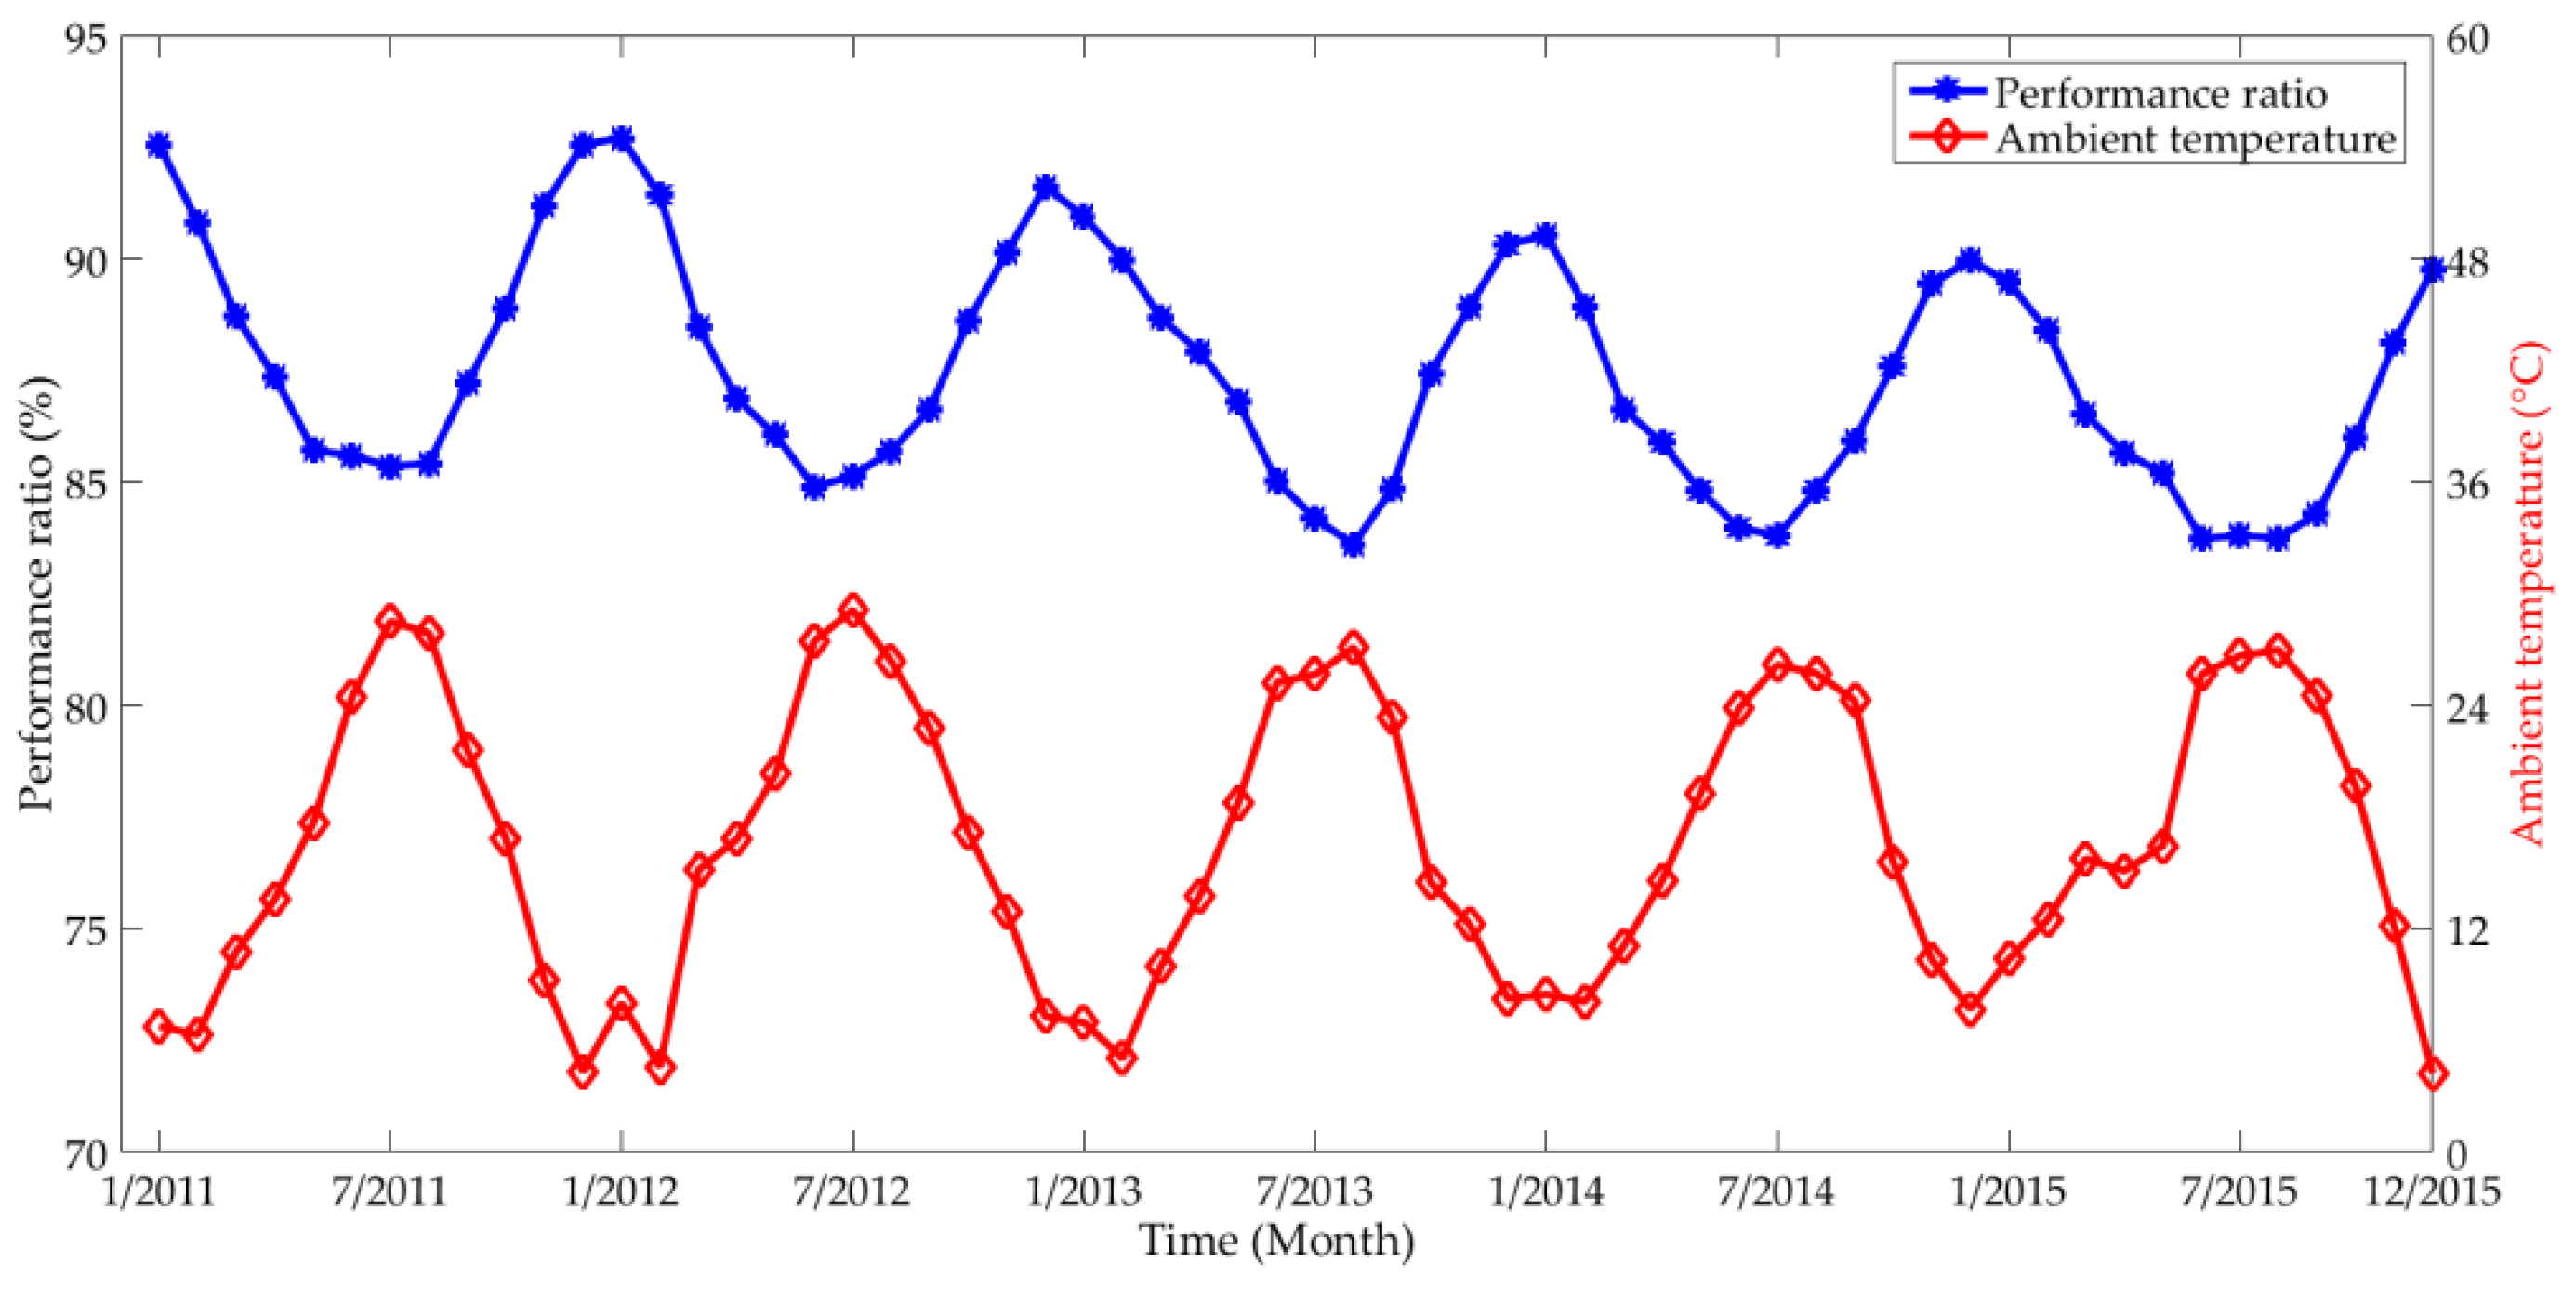
The monthly PR of the mono-Si PV system installed at the same place and studied during the same period of time is shown in Figure 10 after a similar data filtering process applied to the UMG-Si PV system. Classical decomposition is used again to obtain the annual performance degradation rate of the mono-Si PV system. The trend component and its linear regression are shown in Figure 11. The derived annual degradation rate was 0.71%.
These two PV systems show a similar pattern of PR over a year’s time, with larger PR in cooler winter months than in hotter summer months. The mono-Si PV system was installed almost three years earlier than the UMG-Si PV system. At the beginning of the common observation period the values of PR for the two systems were almost the same (Figure 8 vs. Figure 10) and the degradation rate of the mono-Si PV system was higher than that of the UMG-Si PV system; hence, it is expected that the PR of the mono-Si PV system at the beginning of its life would have been higher than that of the UMG-Si PV system.
The derived degradation rate of the mono-Si PV system is higher than that of the UMG-Si PV system showing that PV modules made of UMG-Si have the potential to retain high quality in long-term performance. But it is difficult to conclude that PV modules made from UMG-Si have smaller degradation rates than modules made from mono-Si since other factors, including effects of encapsulant and back sheet of PV modules, influences of dirtiness on the surface, and impacts of other components like inverter of PV systems, are not taken into account.

4.4. Comparison of PV Performance with Different Data Filtering Criteria

We have shown PR as a function of POA irradiation in Figure 3, and we filtered out the data points with POA irradiation less than 600 W/m2 for PV degradation rate estimation. In this subsection, we will vary the threshold of POA irradiation for data filtering from 200 W/m2 to 800 W/m2 in steps of 200 W/m2 to observe the impact on monthly PR and degradation rate.
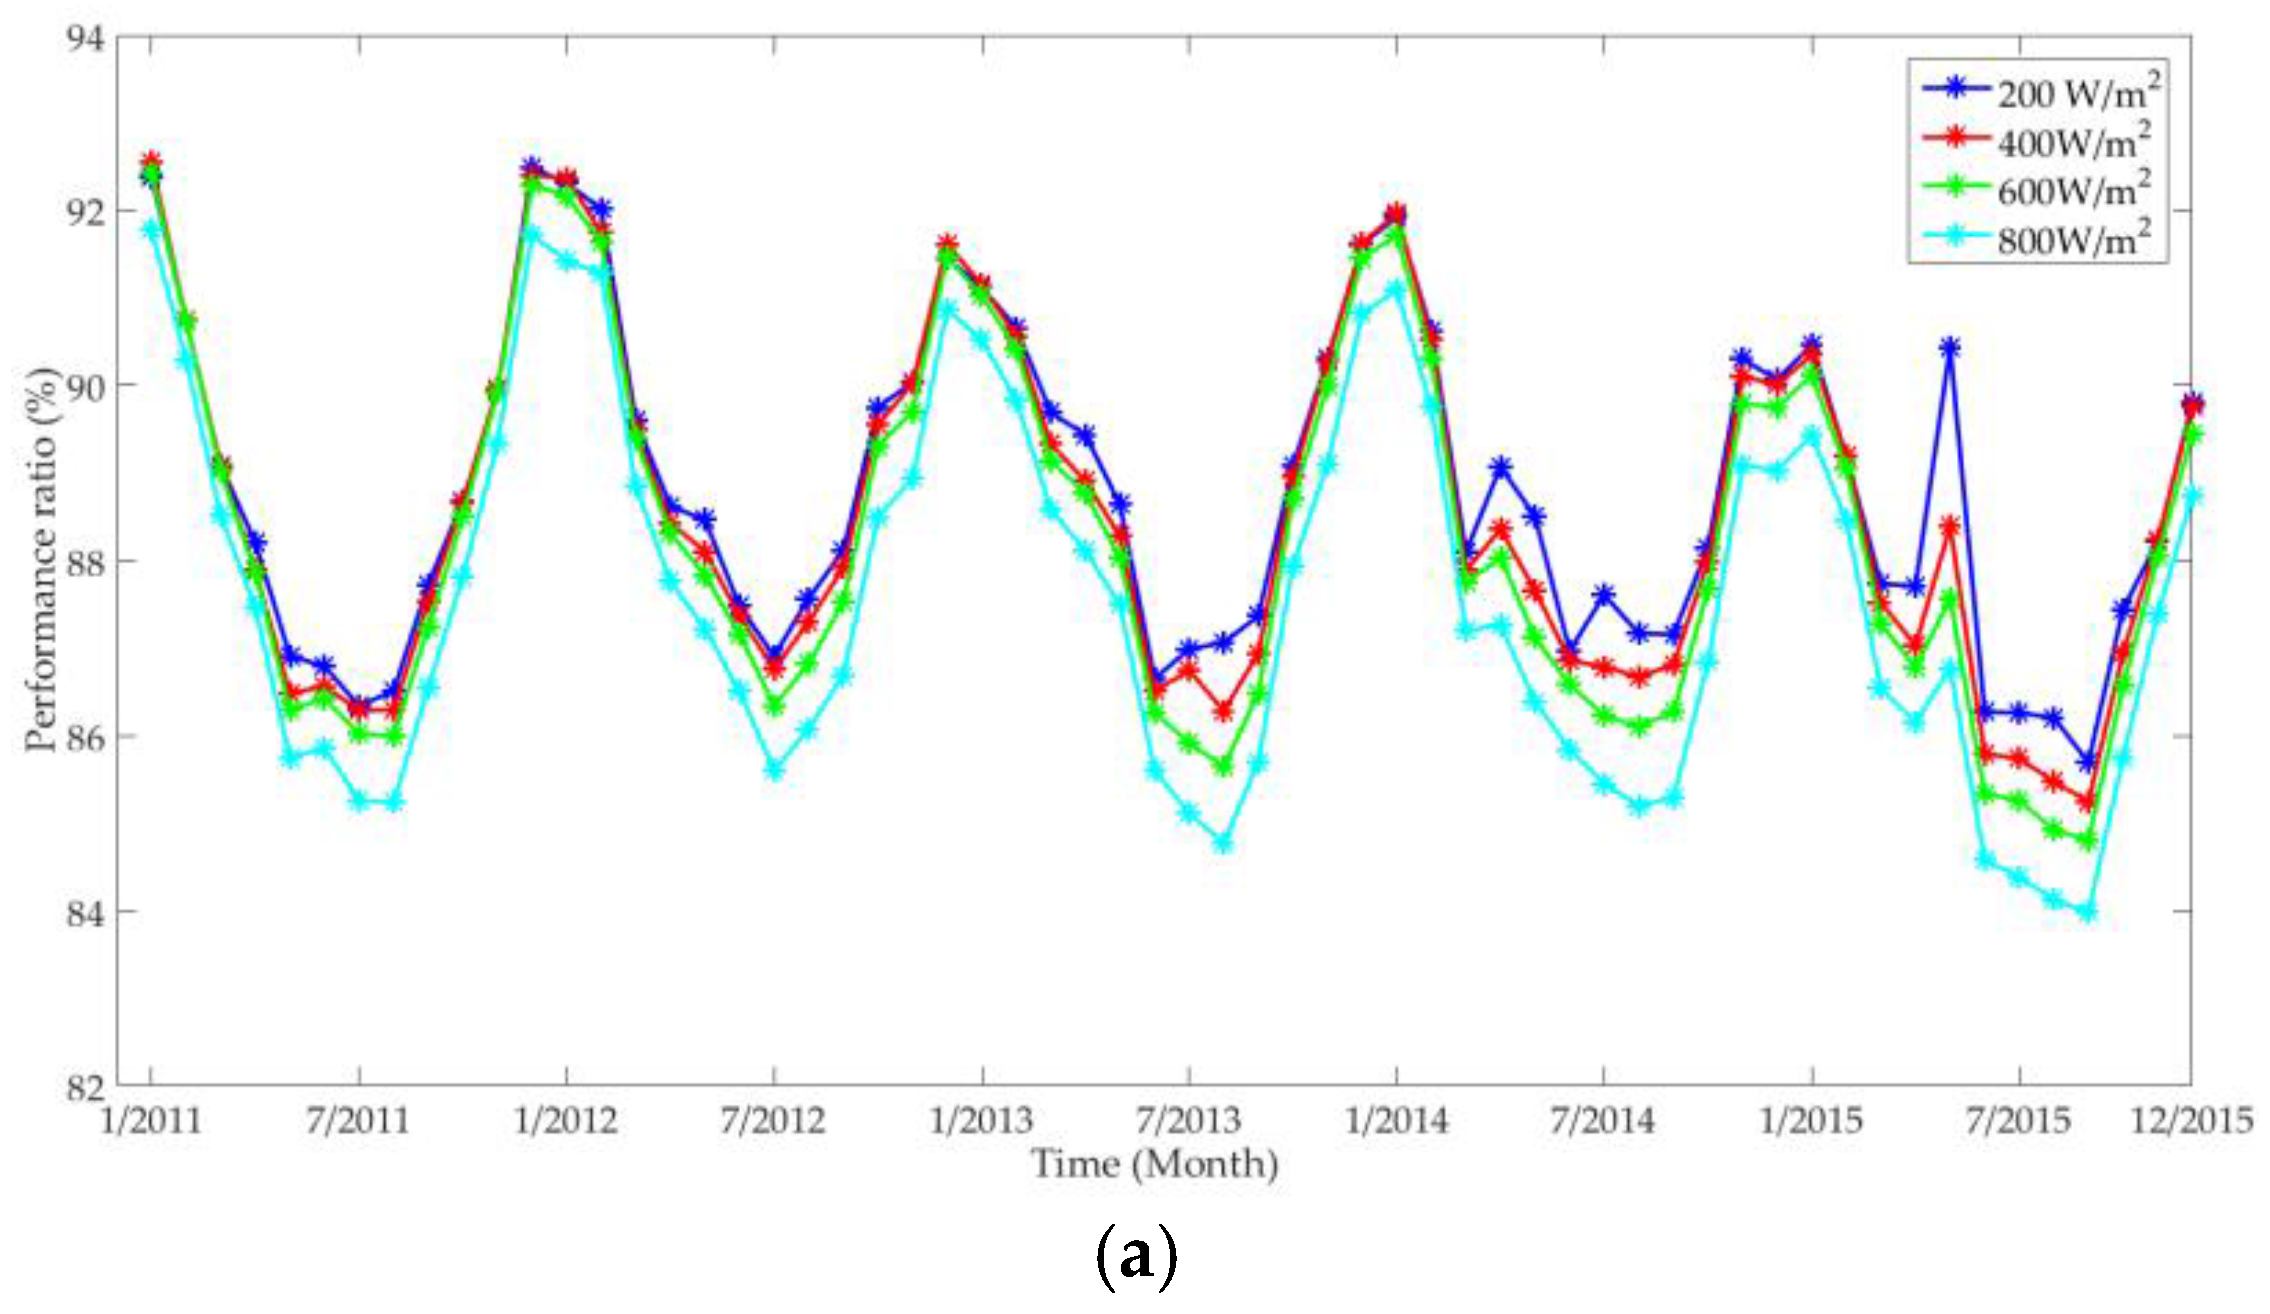
Figure 12 depicts monthly PR for both PV systems with various data filtering thresholds of POA irradiation. The pattern of PR being higher in winter than in summer remained almost the same with various thresholds for the whole observation period. With increasing thresholds, PR in each month decreased. However, in some months, especially May 2015, PR was unusual with suspiciously high values with lower thresholds (200 W/m2 and 400 W/m2) of POA irradiation for data filtering. The unusually high values of PR with lower thresholds were explained by the fact that in May 2015 there were more cloudy (rainy or overcast) days than in adjacent months and in May of other years. This fact was demonstrated by the observed monthly reference yield in May 2015 which was less than in April or June 2015. It is shown in Figure 3 that on cloudy days instantaneous PR was greater than on sunny days at low levels of POA irradiation, leading to the unusually high values of monthly PR with lower data filtering thresholds of POA irradiation. The unusual PR in May 2015 was reduced for the UMG-Si PV system and eliminated for the mono-Si PV system by increasing the threshold.
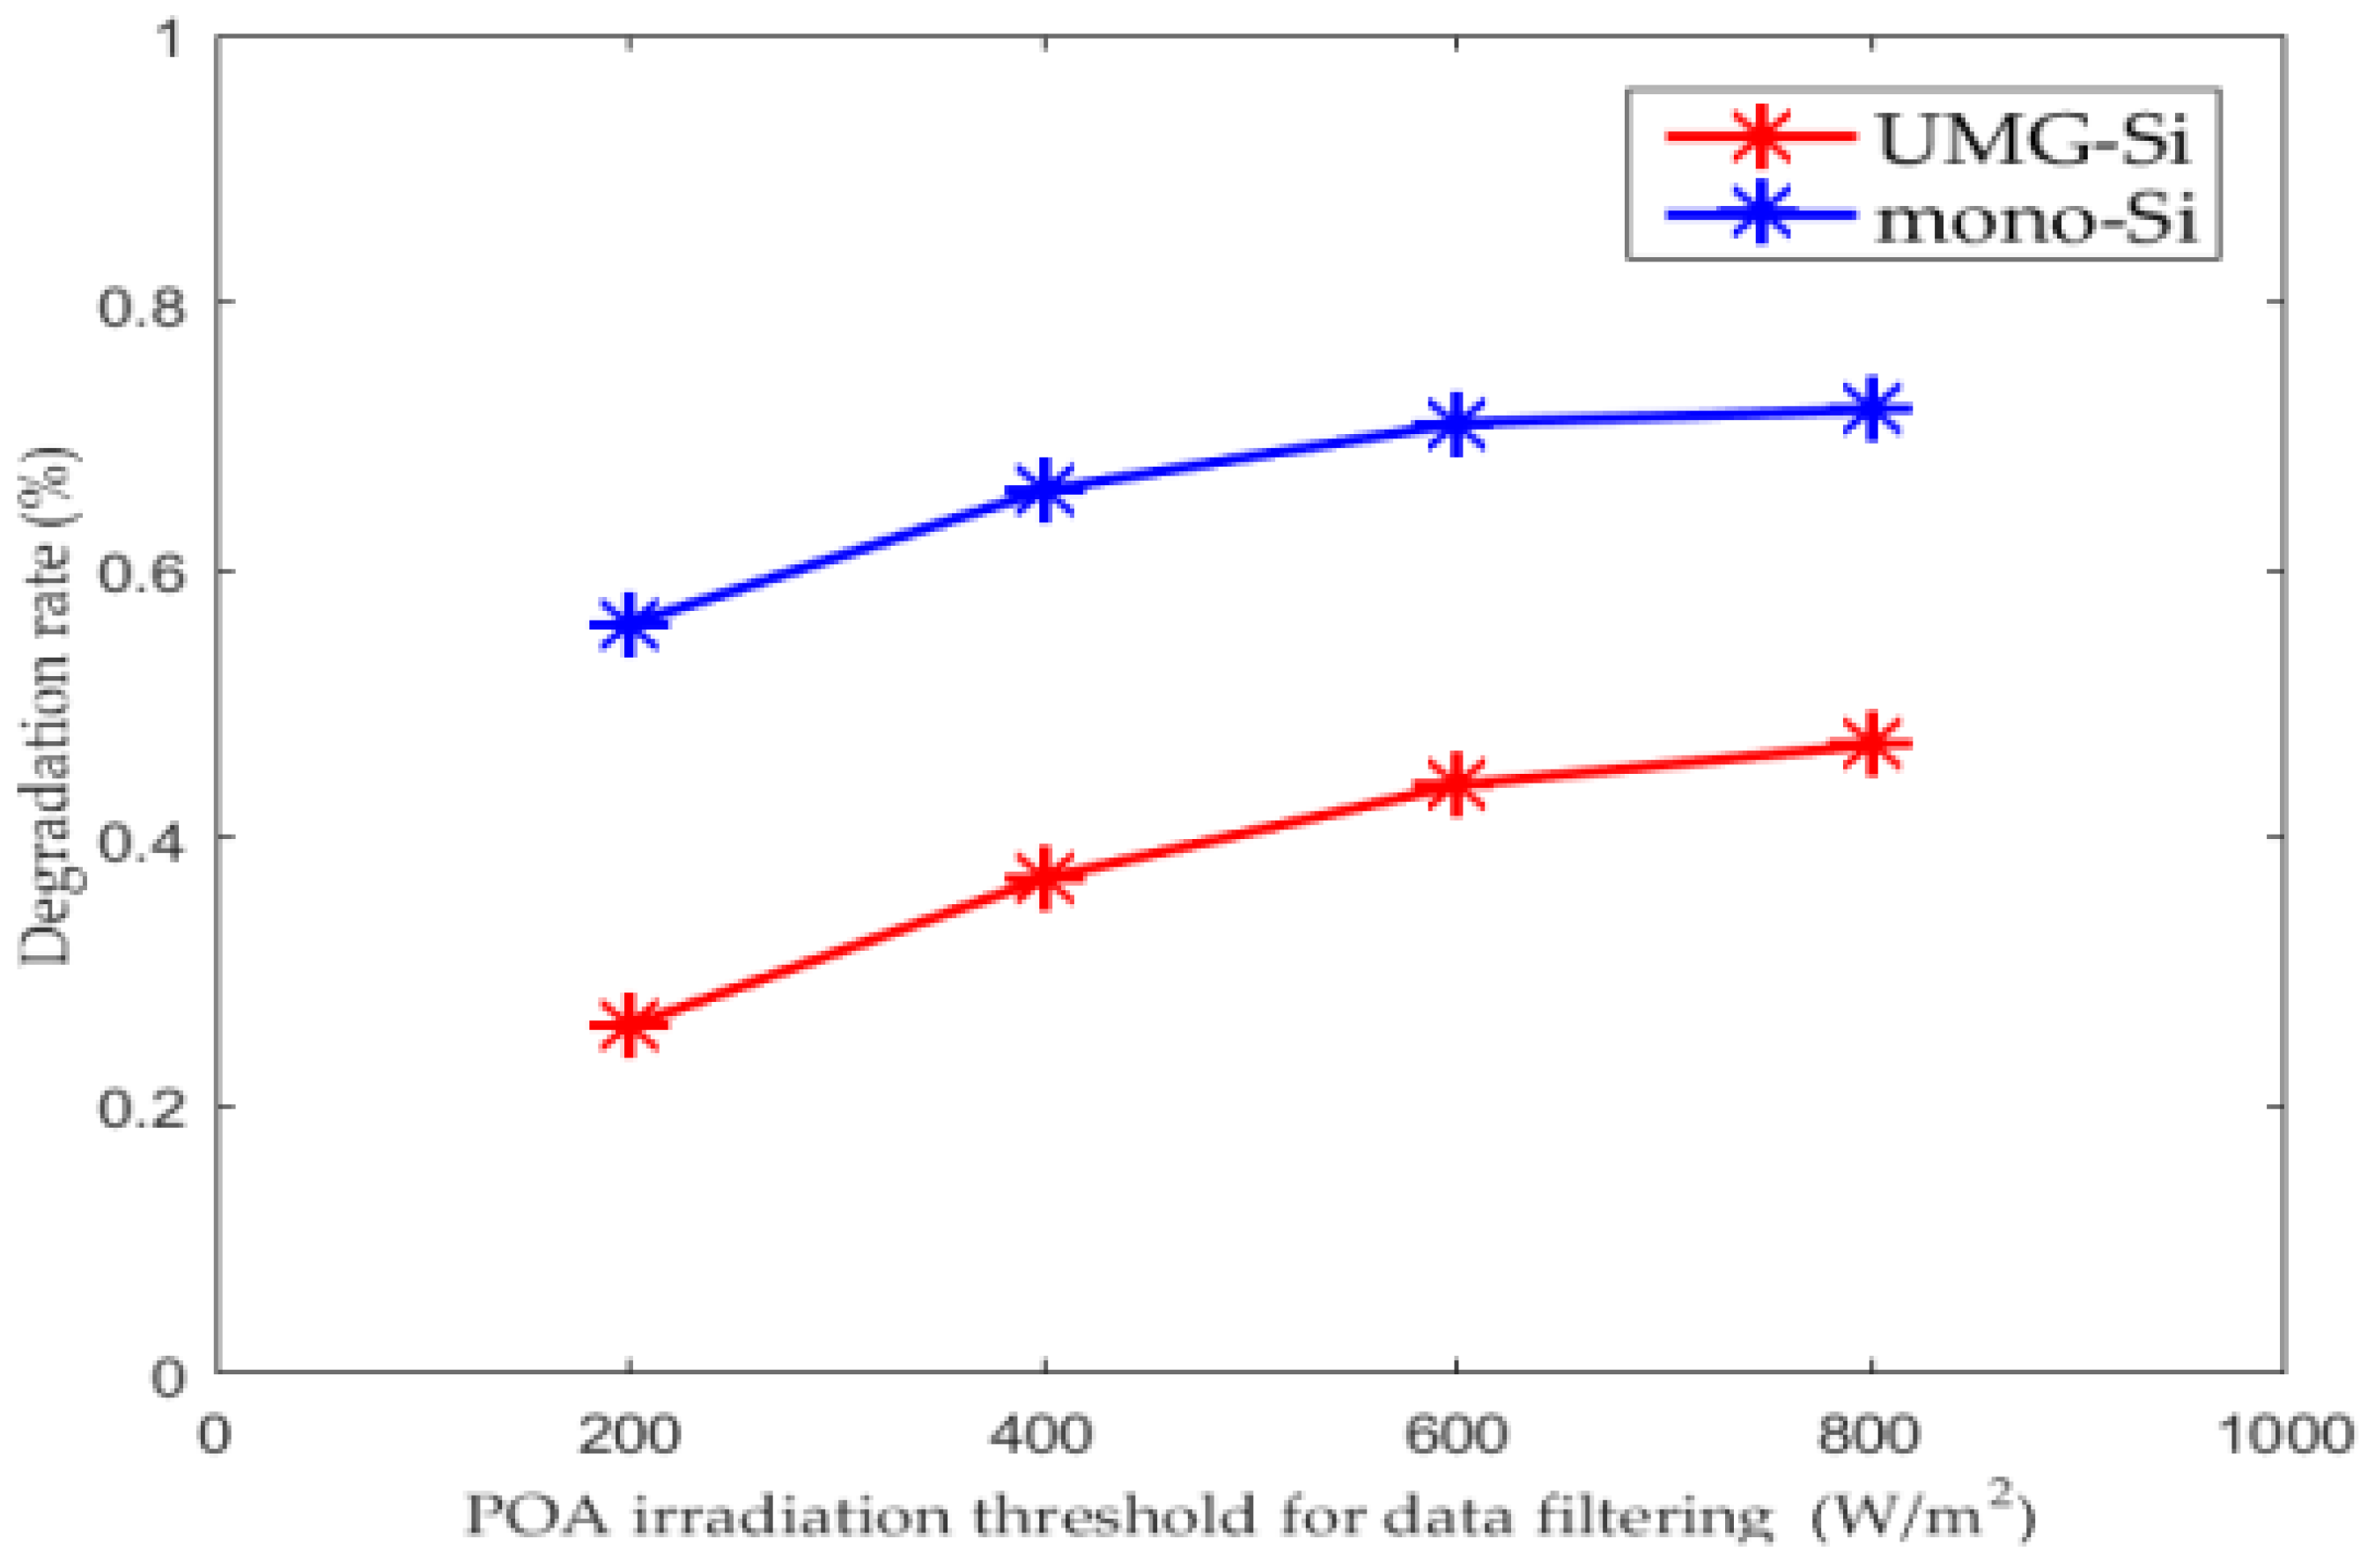
Figure 13 presents the estimated annual degradation rates with different data filtering thresholds of POA irradiation for two PV systems using the classical decomposition method. Degradation rate increased with increasing thresholds from 200 W/m2 to 600 W/m2, and tended to be steady above 600 W/m2 which was obvious for the mono-Si PV system while the tendency was weaker for the UMG-Si PV system; based on which, we select the values with data filtering threshold of 600 W/m2 as the final estimated annual degradation rates for the two PV systems.

5. Performance Comparison

To better characterize the long-term field performance of the investigated UMG-Si PV system and the mono-Si PV system at the same place, we compare PR and Rd with conventional crystalline silicon-based PV systems shown in Table 2.
It is indicated by Table 2 that the performance of the UMG-Si modules and the performance of the mono-Si PV system fall in the performance range of crystalline silicon modules, though the performance varies from one system to another within a broad range. The wide variation of performance could result from factors such as difference in design of modules, local climate, and operating conditions of each system. Therefore, the performance of the UMG-Si PV system is acceptable compared to conventional crystalline silicon modules.

6. Conclusions

In this study, long-term performance of a 1.26 kW UMG-Si PV system installed at NREL is investigated by analyzing continuously monitored data from 1 January 2011 to 31 December 2015. To make the investigation more meaningful, the performance of a mono-Si PV system installed at the same place and studied during the same period of time is presented for reference.
Analysis of the instantaneous, daily, and monthly performance shows that:
  • PR tends to be high and steady at high levels of POA irradiation where the impacts of solar angle-of-incidence and solar spectrum are weak.
  • PR is more variable and unreliable under cloudy conditions where irradiation largely fluctuates.
  • Outliers due to snowing, shading, system down-time, data availability, measurement errors, etc. make PR inefficiently reflect the response of the PV array to irradiation.
Hence, it is necessary to discard data points at low levels of irradiation and data points with large fluctuations in irradiation, as well as outliers, to obtain a more reliable PR. After data filtering, the monthly PR ranged from 84% to 93% over the observation period and showed strong seasonality. The impact of POA irradiation threshold for data filtering on PR and estimated degradation rate is also studied, showing that the estimated value of degradation rate increases with increasing thresholds from 200 W/m2 to 600 W/m2 and tends to be steady above 600 W/m2.
Long-term performance annual degradation rate, Rd, was 0.44% for the UMG-Si PV system and 0.71% for the mono-Si PV system with a data filtering threshold of 600 W/m2. A comparison of PR and Rd to conventional crystalline silicon-based PV systems shows that the performance of the UMG-Si PV system is acceptable.
These results are of value for further performance analysis of the UMG-Si PV system, such as short-term and long-term power output prediction. More importantly, this long-term performance evaluation provides a preliminary understanding of UMG-Si PV outdoor performance, and offers reference information for better and wider use of UMG-Si PV modules. Furthermore, the rationalization for the importance of data filtering will benefit analysis of long-term performance of other PV systems.

Acknowledgments

The first author would like to thank City University of Hong Kong for financial support on his Ph.D. research.

Author Contributions

Chao Huang developed the main part of this work. Michael Edesess contributed in writing the parts and editing the document. Alain Bensoussan and Kwok L. Tsui critically reviewed the paper and contributed in finalizing the manuscript.

Conflicts of Interest

The authors declare no conflict of interest.

Abbreviations

The following abbreviations are used in this manuscript:
AMAir Mass
AOIAngle of Incidence
ARIMAAutoregressive Integrated Moving Average
NRELNational Renewable Energy Laboratory
POAPlane of Array
PRPerformance Ratio
PVPhotovoltaic
UMG-SiUpgraded Metallurgical Grade Silicon

References

  1. Gan, P.Y.; Li, Z.D. Quantitative study on long term global solar photovoltaic market. Renew. Sustain. Energy Rev. 2015, 46, 88–99. [Google Scholar] [CrossRef]
  2. del Coso, G.; del Canizo, C.; Sinke, W.C. The impact of silicon feedstock on the PV module cost. Solar Energy Mater. Solar Cells 2010, 94, 345–349. [Google Scholar] [CrossRef] [Green Version]
  3. Jeong, K.P.; Kim, Y.K. Electrical properties of the multi-crystalline silicon ingots grown with UMG (upgraded metallurgical grade) silicon materials. Solar Energy Mater. Solar Cells 2012, 107, 201–204. [Google Scholar] [CrossRef]
  4. Rougieux, F.; Samundsett, C.; Fong, K.C.; Fell, A.; Zheng, P.; Macdonald, D.; Degoulange, J.; Einhaus, R.; Forster, M. High efficiency UMG silicon solar cells: Impact of compensation on cell parameters. Prog. Photovolt. Res. Appl. 2016, 24, 725–734. [Google Scholar] [CrossRef]
  5. Modanese, C.; Di Sabatino, M.; Søiland, A.-K.; Peter, K.; Arnberg, L. Investigation of bulk and solar cell properties of ingots cast from compensated solar grade silicon. Prog. Photovolt. Res. Appl. 2011, 19, 45–53. [Google Scholar] [CrossRef]
  6. Odden, J.O.; Lommasson, T.C.; Tayyib, M.; Vedde, J.; Buseth, T.; Friestad, K.; Date, H.; Tronstad, R. Results on performance and ageing of solar modules based on Elkem Solar Silicon (ESS (TM)) from installations at various locations. Solar Energy Mater. Solar Cells 2014, 130, 673–678. [Google Scholar] [CrossRef]
  7. Zheng, P.; Rougieux, F.E.; Samundsett, C.; Yang, X.; Wan, Y.; Degoulange, J.; Einhaus, R.; Rivat, P.; Macdonald, D. Upgraded metallurgical-grade silicon solar cells with efficiency above 20%. Appl. Phys. Lett. 2016, 108, 122103. [Google Scholar] [CrossRef]
  8. Forster, M.; Wagner, P.; Degoulange, J.; Einhaus, R.; Galbiati, G.; Rougieux, F.E.; Cuevas, A.; Fourmond, E. Impact of compensation on the boron and oxygen-related degradation of upgraded metallurgical-grade silicon solar cells. Solar Energy Mater Solar Cells 2014, 120, 390–395. [Google Scholar] [CrossRef]
  9. NREL. Available online: http://maps.nrel.gov/pvdaq (accessed on 15 January 2016).
  10. Yang, H.; Wang, H.; Wang, H.; Ding, J. Experimental verification of upgraded metallurgical silicon photovoltaic power plant. Clean Technol. Environ. Policy 2014, 17, 281–285. [Google Scholar] [CrossRef]
  11. Nofuentes, G.; Garcia-Domingo, B.; Munoz, J.V.; Chenlo, F. Analysis of the dependence of the spectral factor of some PV technologies on the solar spectrum distribution. Appl. Energy 2014, 113, 302–309. [Google Scholar] [CrossRef]
  12. King, D.L.; Kratochvil, J.A.; Boyson, W.E. Measuring solar spectral and angle-of-incidence effects on photovoltaic modules and solar irradiance sensors. In Proceedings of the 1997 Twenty-Sixth IEEE Conference on Photovoltaic Specialists, Anaheim, CA, USA, 29 September–3 October 1997; pp. 1113–1116.
  13. Jordan, D.C.; Kurtz, S.R. Photovoltaic degradation rates-an analytical review. Prog. Photovolt. Res. Appl. 2013, 21, 12–29. [Google Scholar] [CrossRef]
  14. Makrides, G.; Zinsser, B.; Schubert, M.; Georghiou, G.E. Performance loss rate of twelve photovoltaic technologies under field conditions using statistical techniques. Solar Energy 2014, 103, 28–42. [Google Scholar] [CrossRef]
  15. Ishii, T.; Takashima, T.; Otani, K. Long-term performance degradation of various kinds of photovoltaic modules under moderate climatic conditions. Prog. Photovolt. Res. Appl. 2011, 19, 170–179. [Google Scholar] [CrossRef]
  16. Jordan, D.C.; Kurtz, S.R. The Dark Horse of Evaluaitng Long-Term Field Performance—Data Filtering. IEEE J. Photovolt. 2014, 4, 317–323. [Google Scholar] [CrossRef]
  17. Phinikarides, A.; Kindyni, N.; Makrides, G.; Georghiou, G.E. Review of photovoltaic degradation rate methodologies. Renew. Sustain. Energy Rev. 2014, 40, 143–152. [Google Scholar] [CrossRef]
  18. Jordan, D.C.; Kurtz, S.R. Analytical improvements in PV degradation rate determination. In Proceedings of the 35th IEEE Photovoltaic Specialists Conference, Honolulu, HI, USA, 20–25 June 2010; pp. 2688–2693.
  19. International Eelectrotechnical Commission (IEC). IEC Standard 61724: Photovoltaic System Performance Monitoring-Guidelines for Measurement, Data Exchange, and Analysis; IEC: Geneva, Switzerland, 1998. [Google Scholar]
  20. Damrongkulkamjorn, P.; Churueang, P. Monthly energy forecasting using decomposition method with application of seasonal ARIMA. In Proceedings of the 2005 International Power Engineering Conference, Singapore, Singapore, 29 November 2015–2 December 2005; pp. 224–229.
  21. Theodosiou, M. Forecasting monthly and quarterly time series using STL decomposition. Int. J. Forecast. 2011, 27, 1178–1195. [Google Scholar] [CrossRef]
  22. Canete, C.; Carretero, J.; Sidrach-de-Cardona, M. Energy performance of different photovoltaic module technologies under outdoor conditions. Energy 2014, 65, 295–302. [Google Scholar] [CrossRef]
  23. Mondol, J.D.; Yohanis, Y.; Smyth, M.; Norton, B. Long term performance analysis of a grid connected photovoltaic system in Northern Ireland. Energy Convers. Manag. 2006, 47, 2925–2947. [Google Scholar] [CrossRef]
  24. Sharma, V.; Kumar, A.; Sastry, O.S.; Chandel, S.S. Performance assessment of different solar photovoltaic technologies under similar outdoor conditions. Energy 2013, 58, 511–518. [Google Scholar] [CrossRef]
  25. Osterwald, C.R.; Adelstein, J.; del Cueto, J.A.; Kroposki, B.; Trudell, D.; Moriarty, T. Comparison of degradation rates of individual modules held at maximum power. In Proceedings of the 2006 IEEE 4th World Conference on Photovoltaic Energy Conversion, Waikoloa, HI, USA, 7–12 May 2006; pp. 2085–2088.
  26. Polverini, D.; Field, M.; Dunlop, E.; Zaaiman, W. Polycrystalline silicon PV modules performance and degradation over 20 years. Prog. Photovolt. Res. Appl. 2013, 21, 1004–1015. [Google Scholar] [CrossRef]
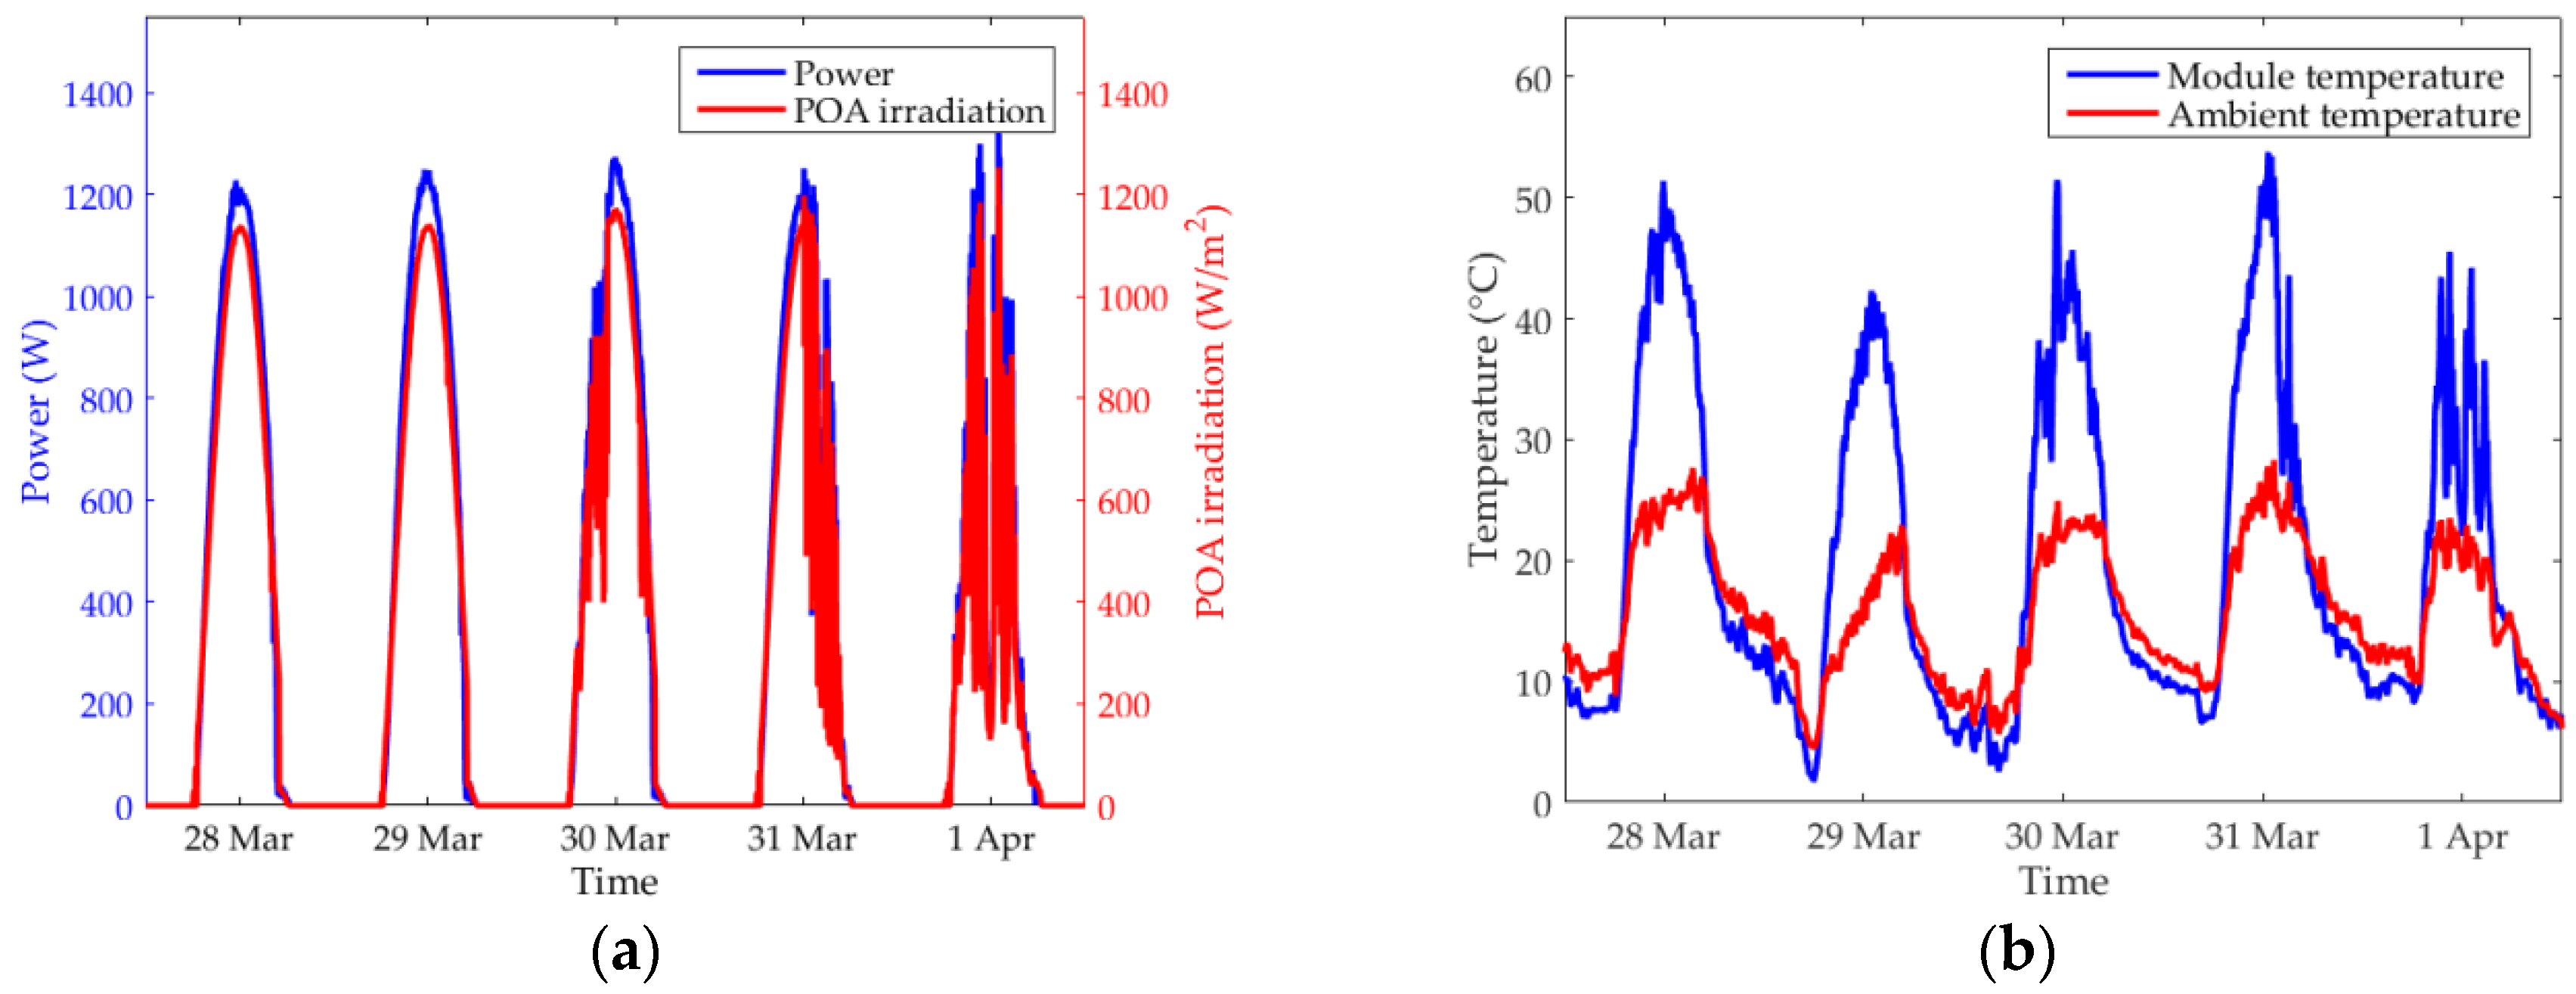
Figure 1. Measurements of meteorological data and PV output from 28 March to 1 April 2015: (a) power output and plane-of-array (POA) irradiation; (b) ambient and module temperature.
Energies 09 00342 g001
Figure 2. Instantaneous PR from 28 March to 1 April 2015.
Energies 09 00342 g002
Figure 3. Temperature-corrected PR as a function of POA irradiation.
Energies 09 00342 g003
Figure 4. Daily yields from 1 January 2011 to 31 December 2015: (a) array yield; (b) reference yield.
Energies 09 00342 g004
Figure 5. Observed power and POA irradiation: (a) 25 March 2013; (b) 14 April 2013.
Energies 09 00342 g005
Figure 6. Daily PR from 1 January 2011 to 31 December 2015.
Energies 09 00342 g006
Figure 7. Monthly reference yield, array yield, and PR from 1 January 2011 to 31 December 2015.
Energies 09 00342 g007
Figure 8. Monthly PR and ambient temperature after data filtering.
Energies 09 00342 g008
Figure 9. Classical times series decomposition of the monthly PR: (a) original signal; (b) component of trend and its linear regression line; (c) component of seasonality; (d) component of irregularity.
Energies 09 00342 g009
Figure 10. Monthly PR and ambient temperature for mono-Si PV.
Energies 09 00342 g010
Figure 11. Trend component and its linear regression for mono-Si PV.
Energies 09 00342 g011
Figure 12. Monthly PR for various data filtering thresholds of POA irradiation: (a) UMG-Si PV; (b) mono-Si PV.
Energies 09 00342 g012aEnergies 09 00342 g012b
Figure 13. Degradation rate with different thresholds for data filtering.
Energies 09 00342 g013
Table 1. Electrical properties of photovoltaic (PV) modules.
PropertyUMG-Simono-Si
Maximal power at STC (Pmax)210 W200 W
Maximal power voltage (Vmp)29.0 V55.8 V
Maximal power current (Imp)7.25 A3.59 A
Open circuit voltage (Voc)36.4 V68.7 V
Short circuit current (Isc)7.89 A3.83 A
Temperature coefficient (Pmax)−0.42%/°C−0.29%/°C
Table 2. Performance comparison with conventional crystalline silicon modules.
TechnologyPR (%)Rd (%)ReferenceComments
poly-Si90–1100.24–0.46[15]Data filtering: G > 750 W/m2, stability, and outliers Analytical: linear regression on monthly PR (3 years)
mono-Si90–1100.64–0.92[15]Data filtering: G > 750 W/m2, stability and outliers Analytical: linear regression on monthly PR (3 years)
poly-Si75–980.78–1.30[14]Analytical: classical decomposition on monthly PR (5 years)
mono-Si65–980.77–1.37[14]Analytical: classical decomposition on monthly PR (5 years)
poly-Si92.9\ [22]Annual average daily performance ratio of 1 year
mono-Si60–62\ [23]Annual average monthly performance ratio of 3 years
poly-Si76–95\ [24]Monthly performance ratio of 1 year
mono-Si\ 0.25[ 25]Analytical: linear regression on monthly maximal power using PVUSA (8 years)
poly-Si\ 0.22[26]Average decay of maximal power (I-V curves) of 70 modules over 20 years
mono-Si\ 0.71Present studyData filtering: G > 600 W/m2, stability, and outlier Analytical: classical decomposition on monthly PR (5 years)
UMG-Si84-930.44Present studyData filtering: G > 600 W/m2, stability, and outlier Analytical: classical decomposition on monthly PR (5 years)