Article

Critical Filler Concentration in Sulfated Titania-Added Nafion™ Membranes for Fuel Cell Applications

1
Chemistry Department, University of Roma La Sapienza, P.le Aldo Moro 5, 00185 Rome, Italy
2
Insitute for Complex Systems, National Research Council (ISC-CNR), via dei Taurini, 00185 Rome, Italy
3
Science Department, University of Basilicata, v.le Ateneo Lucano 10, 85100 Potenza, Italy
4
Informatics Department, University of Verona, Strada le Grazie 15, 37134 Verona, Italy
*
Author to whom correspondence should be addressed.
Energies 2016, 9(4), 272; https://doi.org/10.3390/en9040272
Submission received: 15 February 2016 / Revised: 22 March 2016 / Accepted: 29 March 2016 / Published: 6 April 2016
(This article belongs to the Special Issue Polymer Electrolyte Membrane Fuel Cells 2016)

Abstract

:
In this communication we present a detailed study of Nafion™ composite membranes containing different amounts of nanosized sulfated titania particles, synthesized through an optimized one-step synthesis procedure. Functional membrane properties, such as ionic exchange capacity and water uptake (WU) ability will be described and discussed, together with thermal analysis, atomic force microscopy and Raman spectroscopy data. Also electrochemical properties such as proton conductivity and performances in hydrogen fuel cells will be presented. It has been demonstrated that a critical concentration of filler particles can boost the fuel cell performance at low humidification, exhibiting a significant improvement of the maximum power and current density delivered under 30% low-relative humidity (RH) and 70 °C with respect to bare Nafion™-based systems.

1. Introduction

High-temperature (T) and low-relative humidity (RH) working polymer electrolyte membrane fuel cells (PEMFCs) are highly desirable due to the reduced need of noble metal catalyst, the mitigated poisoning effect of CO and sulfite contaminants and the easier water management [1,2]. In PEMFCs the most used electrolyte is Nafion™, a polymer membrane based on polytetrfluoroethylene with perfluorinated ether side-chains having acidic sulfonic end-groups and characterized by high proton conductivity, suitable mechanical properties, chemical and electrochemical stability, low fuel permeability and electronic insulation [3,4]. The major limit of this class of membranes is related to their operating temperature (typically ≤80 °C) and RH (close to 100%) conditions. The control of the operating conditions is a severe factor that has a high impact on the overall properties due to the very complex balance between the boosting of proton conductivity at relatively high temperature and the parallel dehydration of the membrane. In fact proton conduction and water content are intimately related, thus causing a sharp decay of the former responding to a decrease of the latter. Great efforts have been made to solve this problem. A promising strategy is the addition of an inorganic solid acid that helps to hold back water in the membrane by increasing the number of acid sites [5] and by mitigating the Nafion™ membrane deterioration above 80 °C [6]. Acidic solids belonging to the family of sulfated metal oxides are easy to synthesize with different and tailored morphology: they are low-cost and environmentally friendly [7]. A conspicuous interest has been devoted to these materials thanks to their great activity as catalysts in different organic reactions, such as hydrocarbon skeletal isomerization or alkylation of paraffins [8], in particular superacidic Zr [9], Ti [10], Fe [11], Hf [12], Si [13], Sn [14] and Al [15] metal oxides have been investigated in the field of catalysis. Regarding the application as additive in polymer membranes for fuel cell devices sulfated zirconium [16], silicon [17], aluminum [18] and tin oxides [19,20] have been tested.
More in general polymer membranes are at the center stage in several technological fields related to energy storage and conversion. In fact, besides fuel cell applications [21,22,23,24,25], also lithium and sodium batteries [26,27], dye sensitized solar cells [28] and supercapacitors [29] may profit of the unique mechanical and functional features provided by the incorporation of suitable polymer/composite membranes to modify the standard setups.
This study is the fourth part of a series of papers [30,31,32] devoted by us to the characterization of a novel sulfated titania nanomaterial (S-TiO2) as additive in polymer membranes for PEMFC application. In fact we have proposed the synthesis and the use of the sulfated titania nanoparticles as proton conductors [30] and their incorporation in Nafion™ polymer membranes [31,32]. In particular, a careful characterization of the filler particles, together with a molecular investigation of particles-polymer interaction, has been reported [31]; moreover the water dynamics inside the S-TiO2-Nafion™ composites has been discussed by nuclear magnetic resonance (NMR) spectroscopy [32]. Here we expand our recent study concerning the incorporation of S-TiO2 nanoparticles in Nafion™ systems. Composite membranes with different filler loading have been characterized by a variety of techniques and tested in hydrogen fuel cells. Our goal is to verify the effect of the filler on the fuel cell performances at low humidity and to elucidate the role of the S-TiO2 nanoparticles on the properties of Nafion™ membranes, with particular attention to the influence of the filler concentration on both the physical and functional properties of the composite membrane.

2. Material and Methods

2.1. Membrane Preparation

Composite membranes with sulfated titania filler concentrations of 2%, 5% and 7% w/w were prepared. The inorganic S-TiO2 additive was obtained as previously reported [31] by a very convenient 1-step synthesis procedure. A careful characterization of the filler nanoparticles has been already reported by us in [31] and is here omitted. Briefly X-ray diffraction (XRD) and Raman spectroscopy of S-TiO2 highlighted the crystallization of the anatase lattice with minor contaminations from the TiO2-B phase, typical of nanometric samples. Transmission electron microscopy (TEM) revealed that the powders obtained are constituted by round-shaped nanoparticles with mean diameter of about 8 nm. The powder functionalization by sulfate groups has been also confirmed by Raman spectroscopy and thermal gravimetric analysis (TGA): apparently even after a severe hydrothermal stability test, the sulfate groups are still retained. Membranes were prepared by a solvent-casting technique, starting from a Nafion™ 5% w/w solution (Ion Power Inc., New Castle, DE, USA), where solvents (water and alcohols) were gradually replaced by N,N-dimethylacetamide (Sigma Aldrich, St. Louis, MO, USA). The filler was added to this Nafion™ suspension and the mixture was poured into a Petri dish. After a heating treatment at 100 °C, dry membranes were extracted and hot-pressed at 170 °C and 50 atm for 15 min. The membranes were finally activated by immersion in boiling hydrogen peroxide (3% w/w), sulfuric acid (0.5 M) and water. After preparation, all the membrane samples were stored in distilled water. The membrane thickness was measured in the dry state, immediately after the hot-pressing procedure. For membranes of different composition, the nomenclature Mx is used, where x stands for % w/w of the filler, was used.

2.2. Characterization Techniques

Membranes water uptake (WU) was evaluated by a room temperature gravimetric method by comparing the weight of dry and humidified samples. Humidified membranes have been obtained by equilibrating the samples in a close container in presence of different saturated salt solutions, at least for 24 h (for higher conditioning time no weight difference was observed). The used salts are listed in the Table 1. RH values were taken from [33]. Samples were transferred from the conditioning box to the balance in a close vessel for the weighing procedure. Multiple measures were taken for each sample in order to verify the procedure repeatability. Dry samples were obtained by treating membranes in vacuum overnight.
The ion-exchange capacity (IEC) was evaluated by a titration method where the protons exchanged by membrane samples equilibrated in NaCl aqueous solutions were neutralized with NaOH (0.1 M); measurement errors have been evaluated with standard deviation of three different titrations.
Atomic force microscopy (AFM) experiments were carried out with an AFM XE120 instrument (Park Instruments, Santa Clara, CA, USA) equipped with a home-modified universal closed liquid cell in order to allow a careful control of the RH condition upon scanning. Measurements were performed at RH = 11, 33 and 100%. Prior to the AFM tests, membranes were fully conditioned for 30 days in a closed vessel at 11%, 33% and 100% RH (Table 1). The AFM study was carried out in tapping intermittent contact mode (TM). Phase and topographic maps were recorded. In this communication all shown AFM images are phase images being the corresponding elastic response highly sensitive to the transitions from hydrophobic to hydrophilic domains. AFM images were recorded on the two sides of the membranes for each RH in order to highlight possible differences: three different areas were sampled on all membrane sides by recording at least five different magnifications in each zone. AFM images were analyzed by the ImageJ software in order to study the evolution of the size of the hydrophobic and hydrophilic domains. Our procedure implies the analysis of at least three phase images recorded at different magnification and the identification of more than 500 pseudo-particles (hydrophobic and hydrophilic domains) for each sample at each RH condition. The size of the recorded particles have been then analyzed by deriving for each membrane at each RH the particle size distribution, the cluster dimension mean values and the corresponding standard deviations.
Micro-Raman spectroscopy measurements were carried out in backscattering geometry using a LABRAM HR spectrometer (Horiba-Jobin Yvon, Tokyo, Japan) equipped with a He-Ne laser (632.8 nm) and a notch filter. The output radiation passed through a diffraction grating having 600 lines/mm and was detected by a multichannel detector, a liquid nitrogen cooled charge coupled device (CCD, 1024 × 256 pixels). The spectral limit on the side of low wave-numbers, due to the notch filter, was about 200 cm−1. Samples were stored in close container in presence of different saturated salt solutions, at least for 24 h. The used salts are listed in Table 1. Before each measurement, samples were taken from the storage container and quickly moved to a sealed measuring chamber, in which the same salt solution was present in order to keep the desired RH condition also during the spectra acquisition. All the spectra were taken at least one hour after this procedure, in order to allow the re-equilibration of the sample with the environment. The spectra were obtained by focusing the laser beam onto a spot of about 2 µm in size through the lens of a long-working distance 50× objective, with high numerical aperture (N.A. = 0.5). The laser power at the samples surface was kept below 5 mW, and multiple spectra were taken in sequence from the same position to verify that the laser irradiation didn’t affect the sample integrity. The wavenumber calibration has been carried out by using an Ar spectral lamp. In order to verify the homogeneity of the samples and the reproducibility of the Raman spectral response, the surface of each membrane has been samples by micro-Raman in the same experimental conditions. The recorded spectra were processed to remove artifacts due to cosmic rays, while the luminescence background, consisting of a continuous line, having both shape and intensity dependent of the sample region, and underlying the overall Raman spectrum, was subtracted before starting the analysis of the experimental data. The obtained spectra were fitted with Lorentzian curves, to precisely derive the peak position in wavenumber.
TGA was performed in air flux at a heating rate of 5 °C/min with a TGA/SDTA 851 instrument (Mettler-Toledo, Columbus, OH, USA). Differential scanning calorimetry (DSC) was performed in nitrogen flux at scanning rate of 20 °C/min with Mettler Toledo DSC 821 instrument. Such measurements were performed on membrane samples stored in water, by drying their surface with laboratory towels in order to remove surface water drops.
Fuel cell tests were performed by using the 850C compact system (Scribner Associates Inc., Southern Pines, NC, USA) connected to a 5 cm2 cell fixture. The membrane electrode assembly (MEA) was prepared as follows: the surface of the electrodes (0.5 mg Pt cm−2, BASF, Ludwigshafen am Rhein, Germany) was brushed with Nafion™ solution (5% w/w in water and alcohols), resulting in ca. 0.4 mg dry Nafion™ cm−2 after the evaporation of the solvent. The given membrane was hot-pressed between two electrodes at 120 °C and 10 atm for 7 min. The cell was fed with H2 and air according to current-dependent mass flow rates (1.4 times anode stoichiometric flow and 3.3 times cathode stoichiometric flow), applying a back pressure of +1 atmosphere. The humidification of the cell was accomplished by bubbling the fed gases through stainless steel cylinders incorporated in the compact system and containing distilled water. Heating tape, wrapped around the feed lines, avoided condensation. The temperature of the humidifiers, as well as that of the cell, was properly set to achieve the desired RH. Prior to measurement the cell was conditioned by fast current scans, at 70 °C and 100% RH, feeding H2 and air at 2 atm of pressure, to carefully invert the MEA at half-time of the activation procedure. In-situ electrochemical impedance spectroscopy (EIS) was performed with the internal Impedance Analyzer 880 (Scribner Associates Inc., Southern Pines, NC, USA) able to add an AC sine wave to the DC current flowing in the cell, in the 10–0.001 kHz frequency range. The amplitude of the sine wave was chosen to be 5% of the DC current present at 0.65V cell voltage. Impedance measurements were used to evaluate proton conductivity under operating fuel cell conditions.

3. Results and Discussion

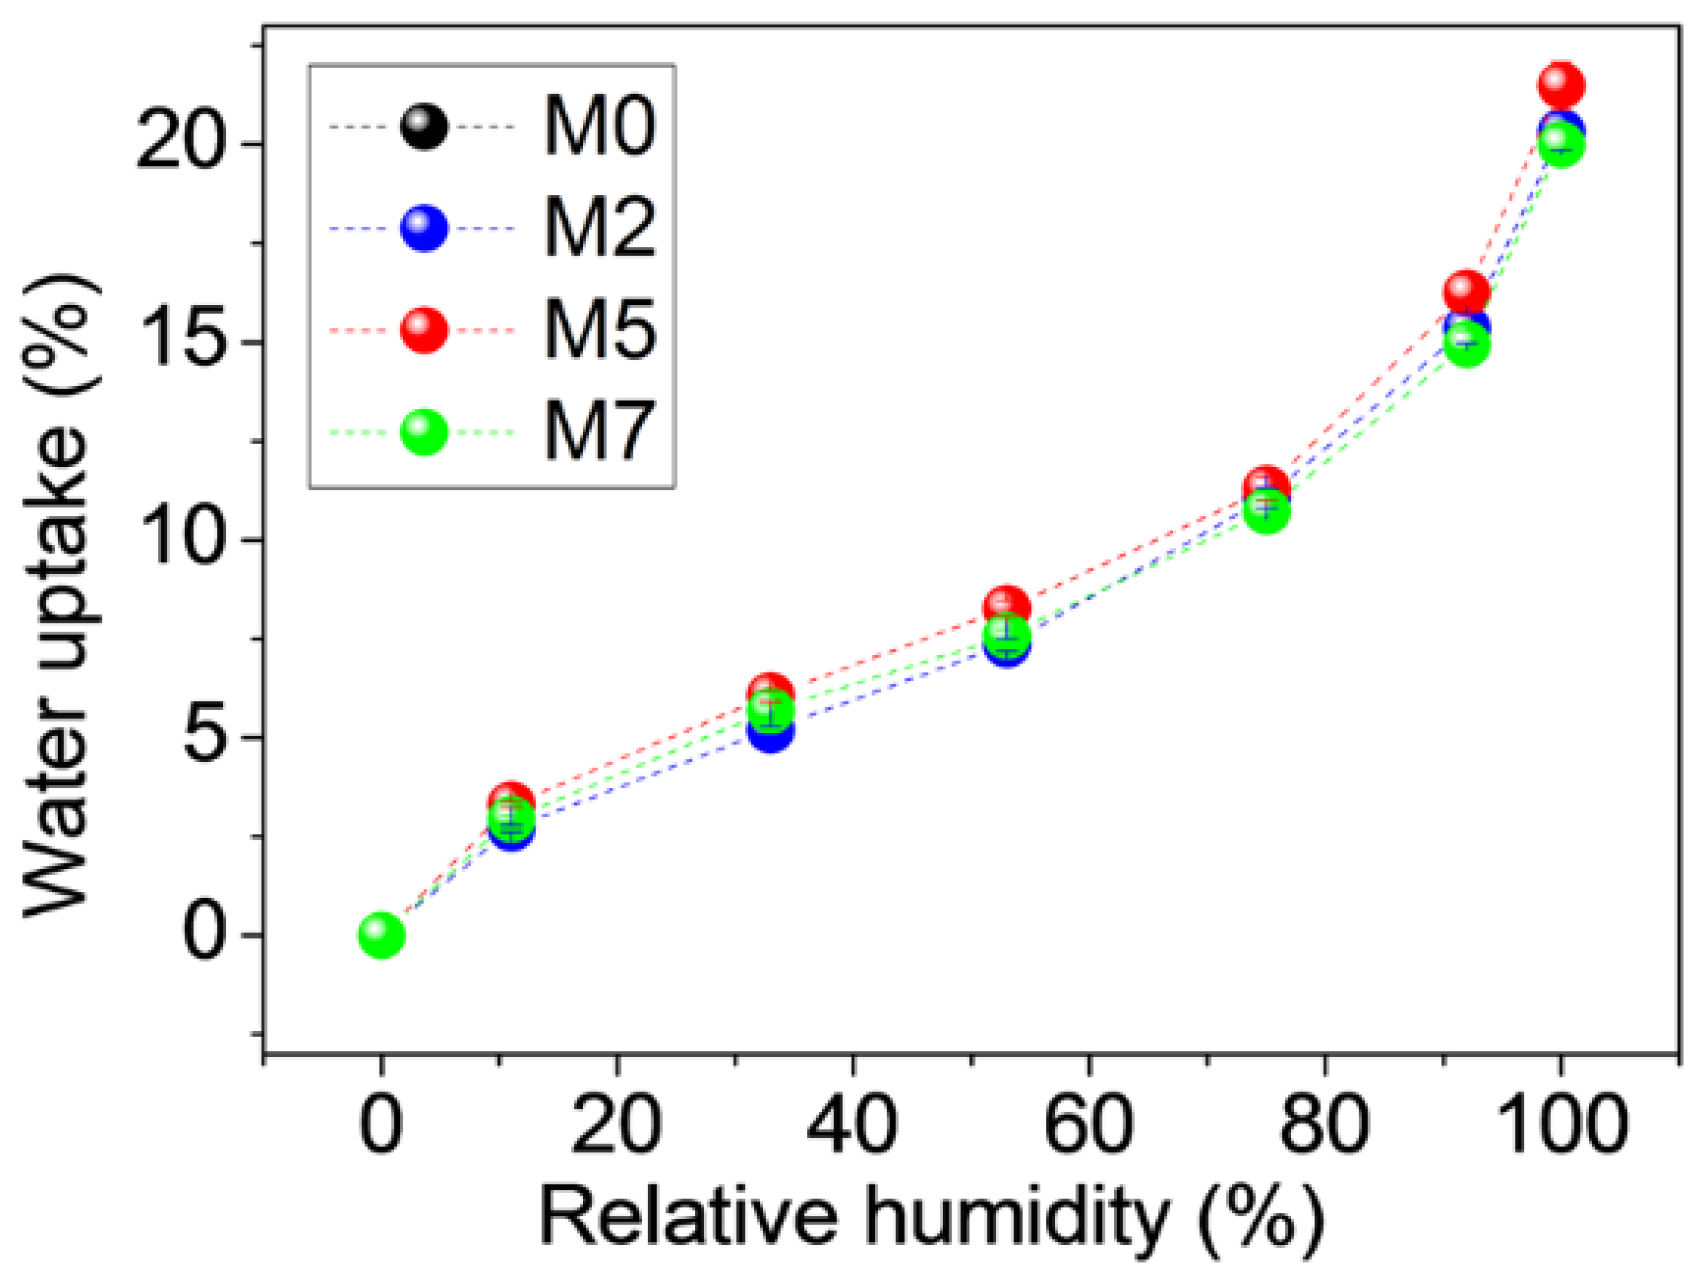
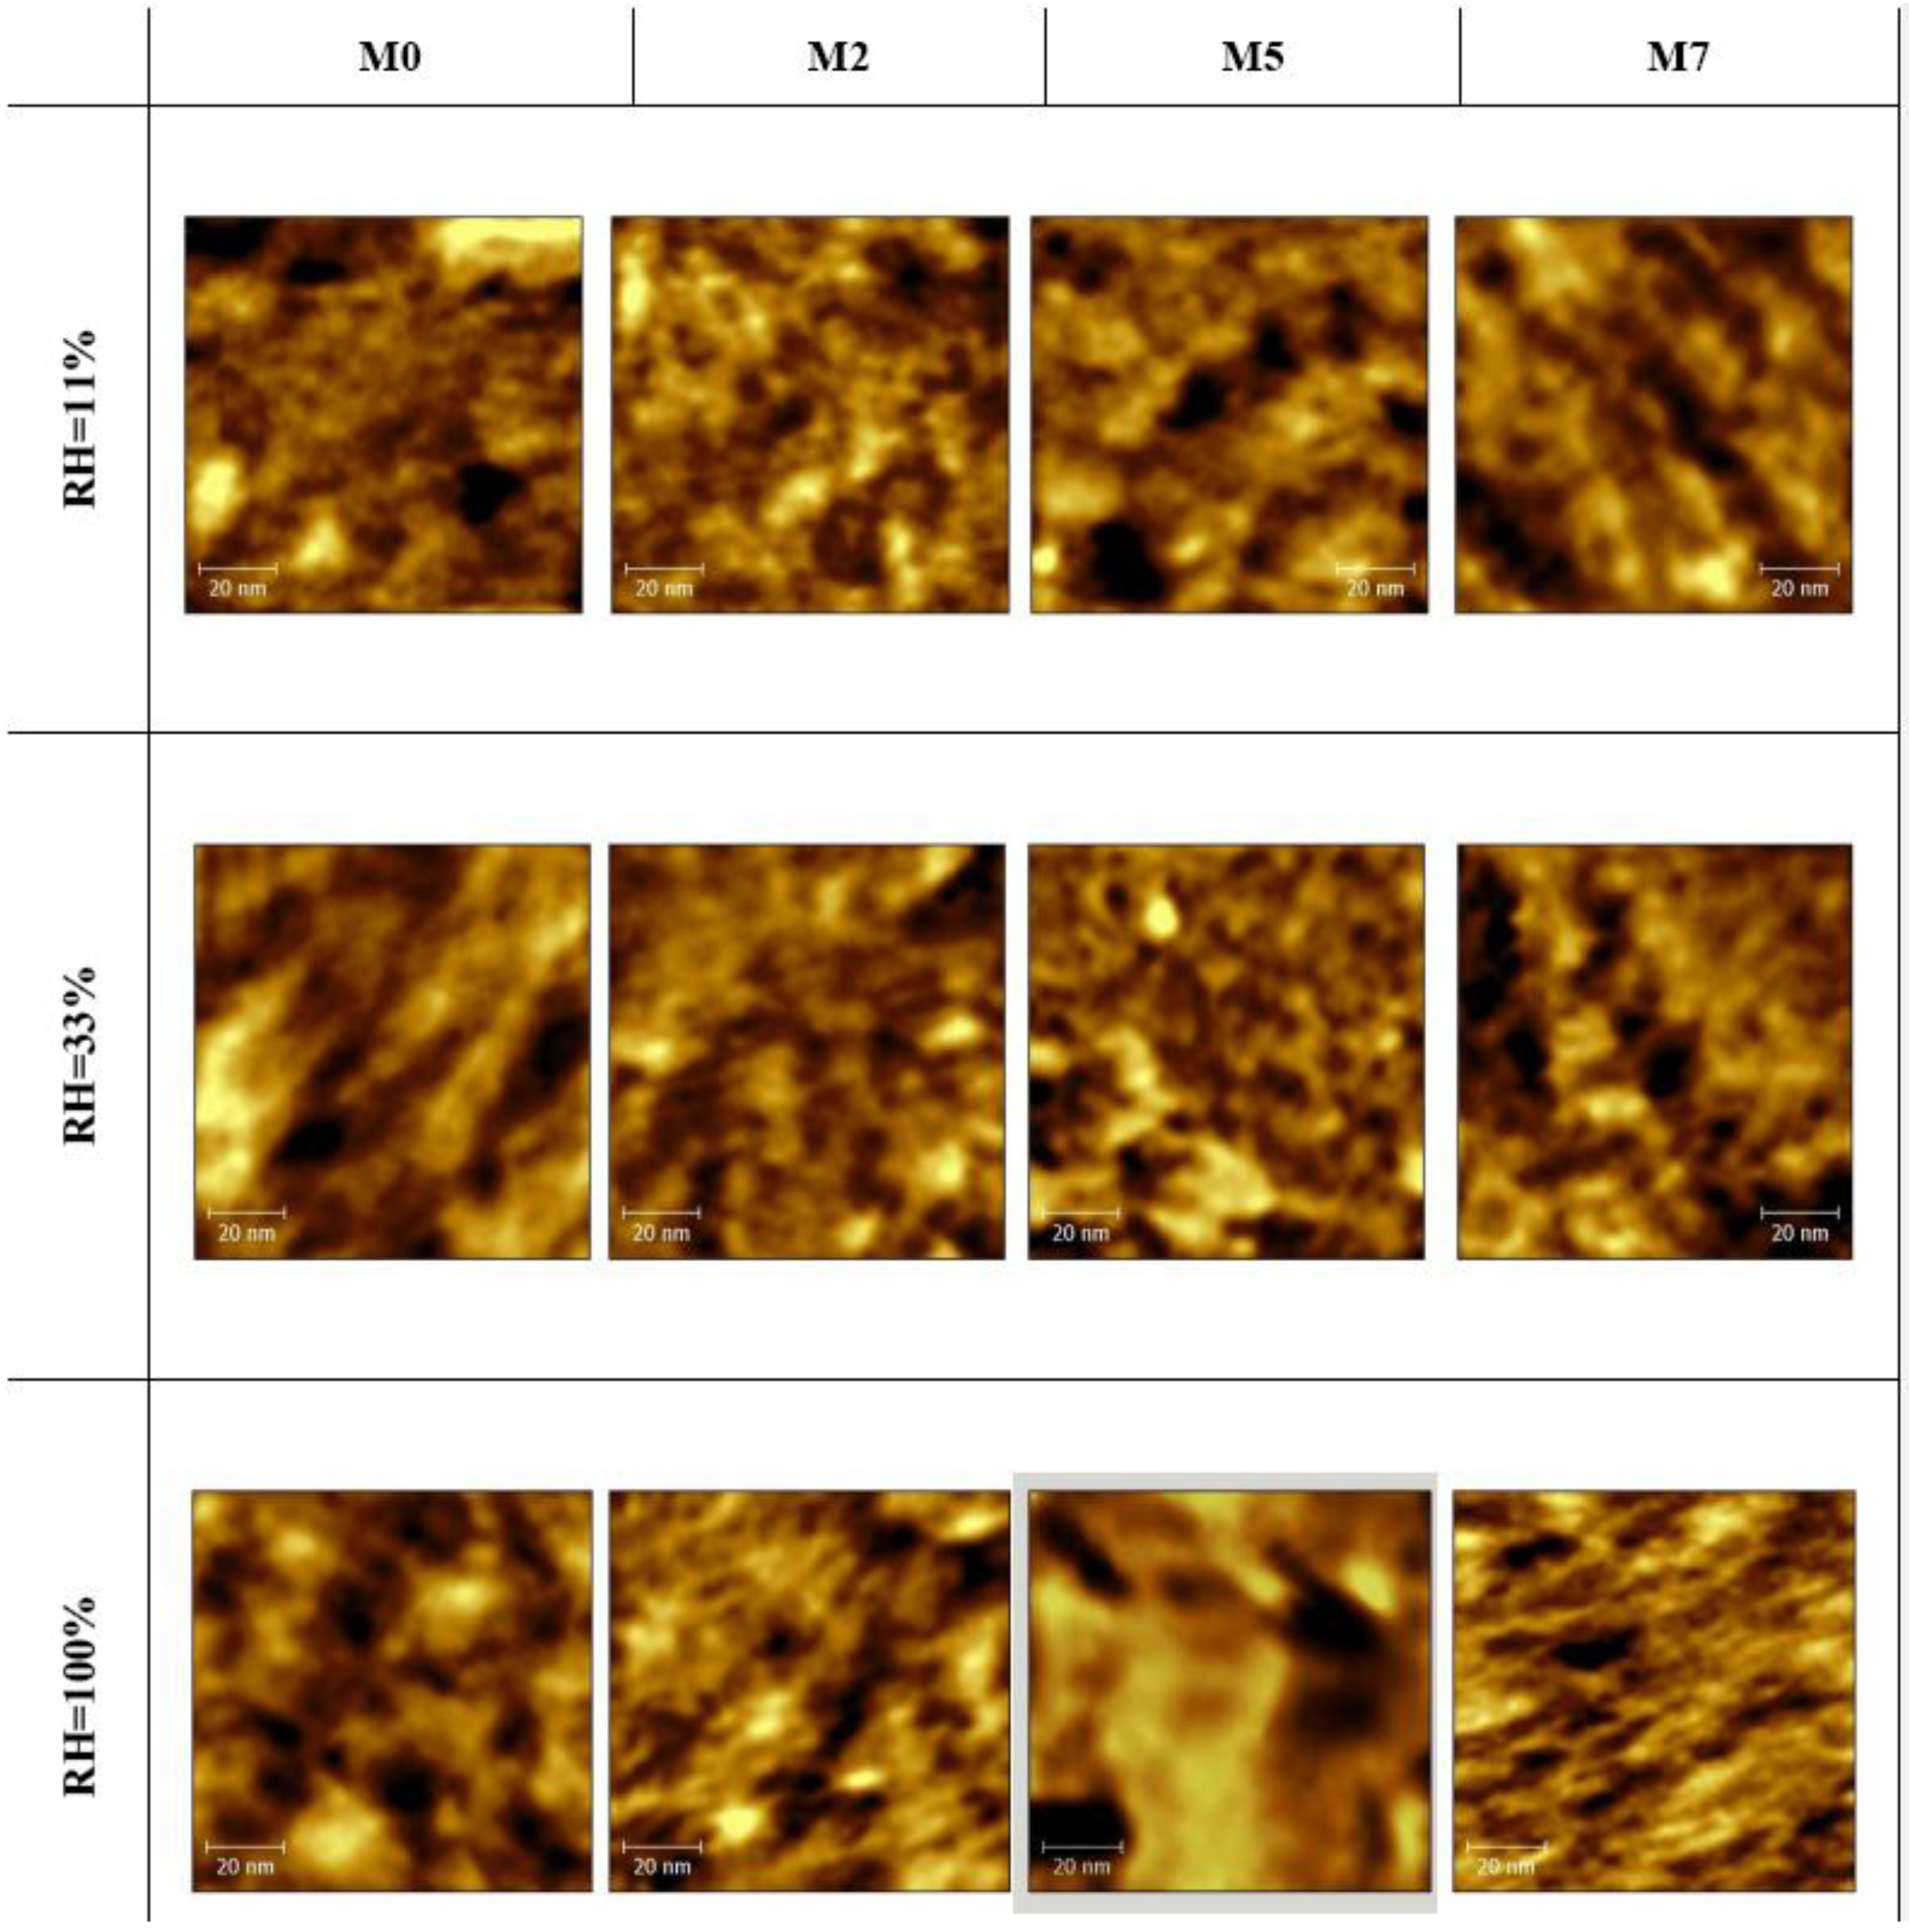
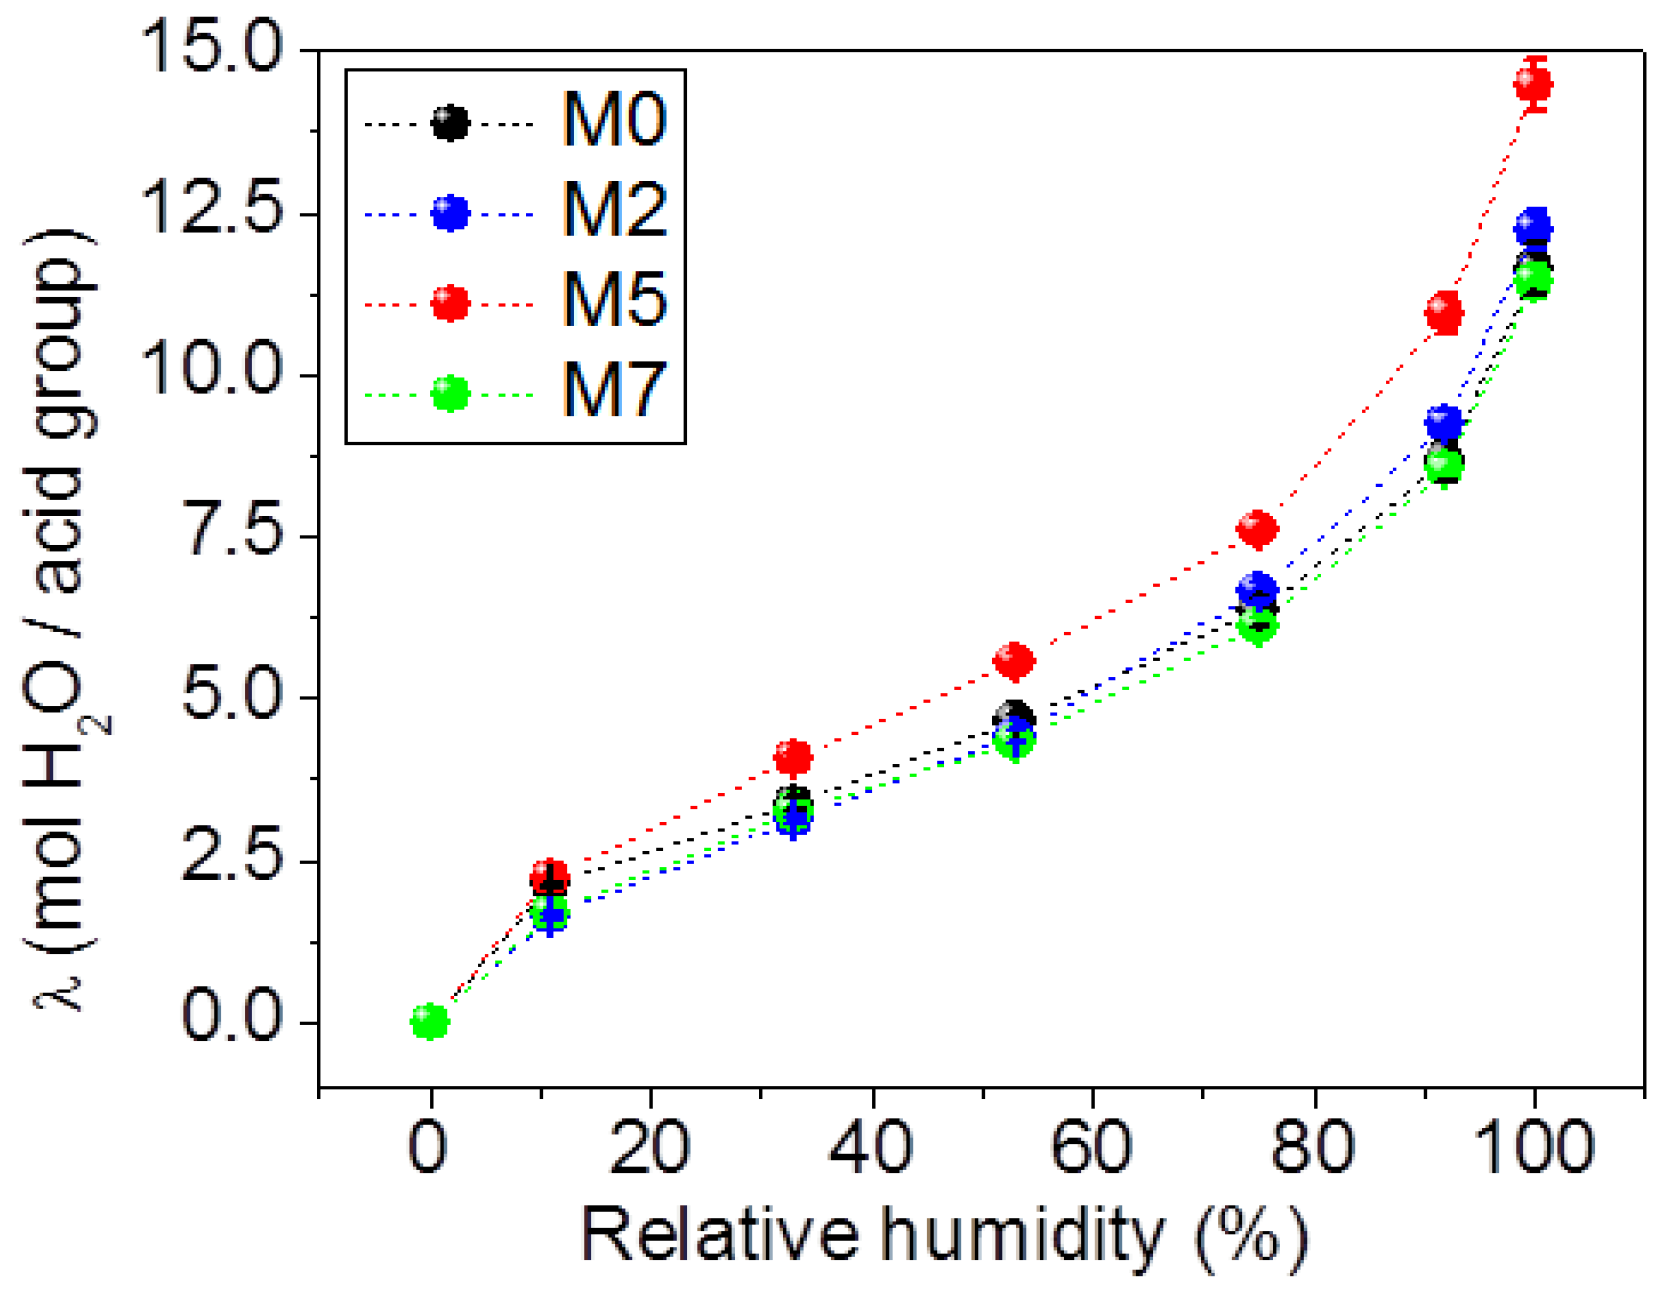
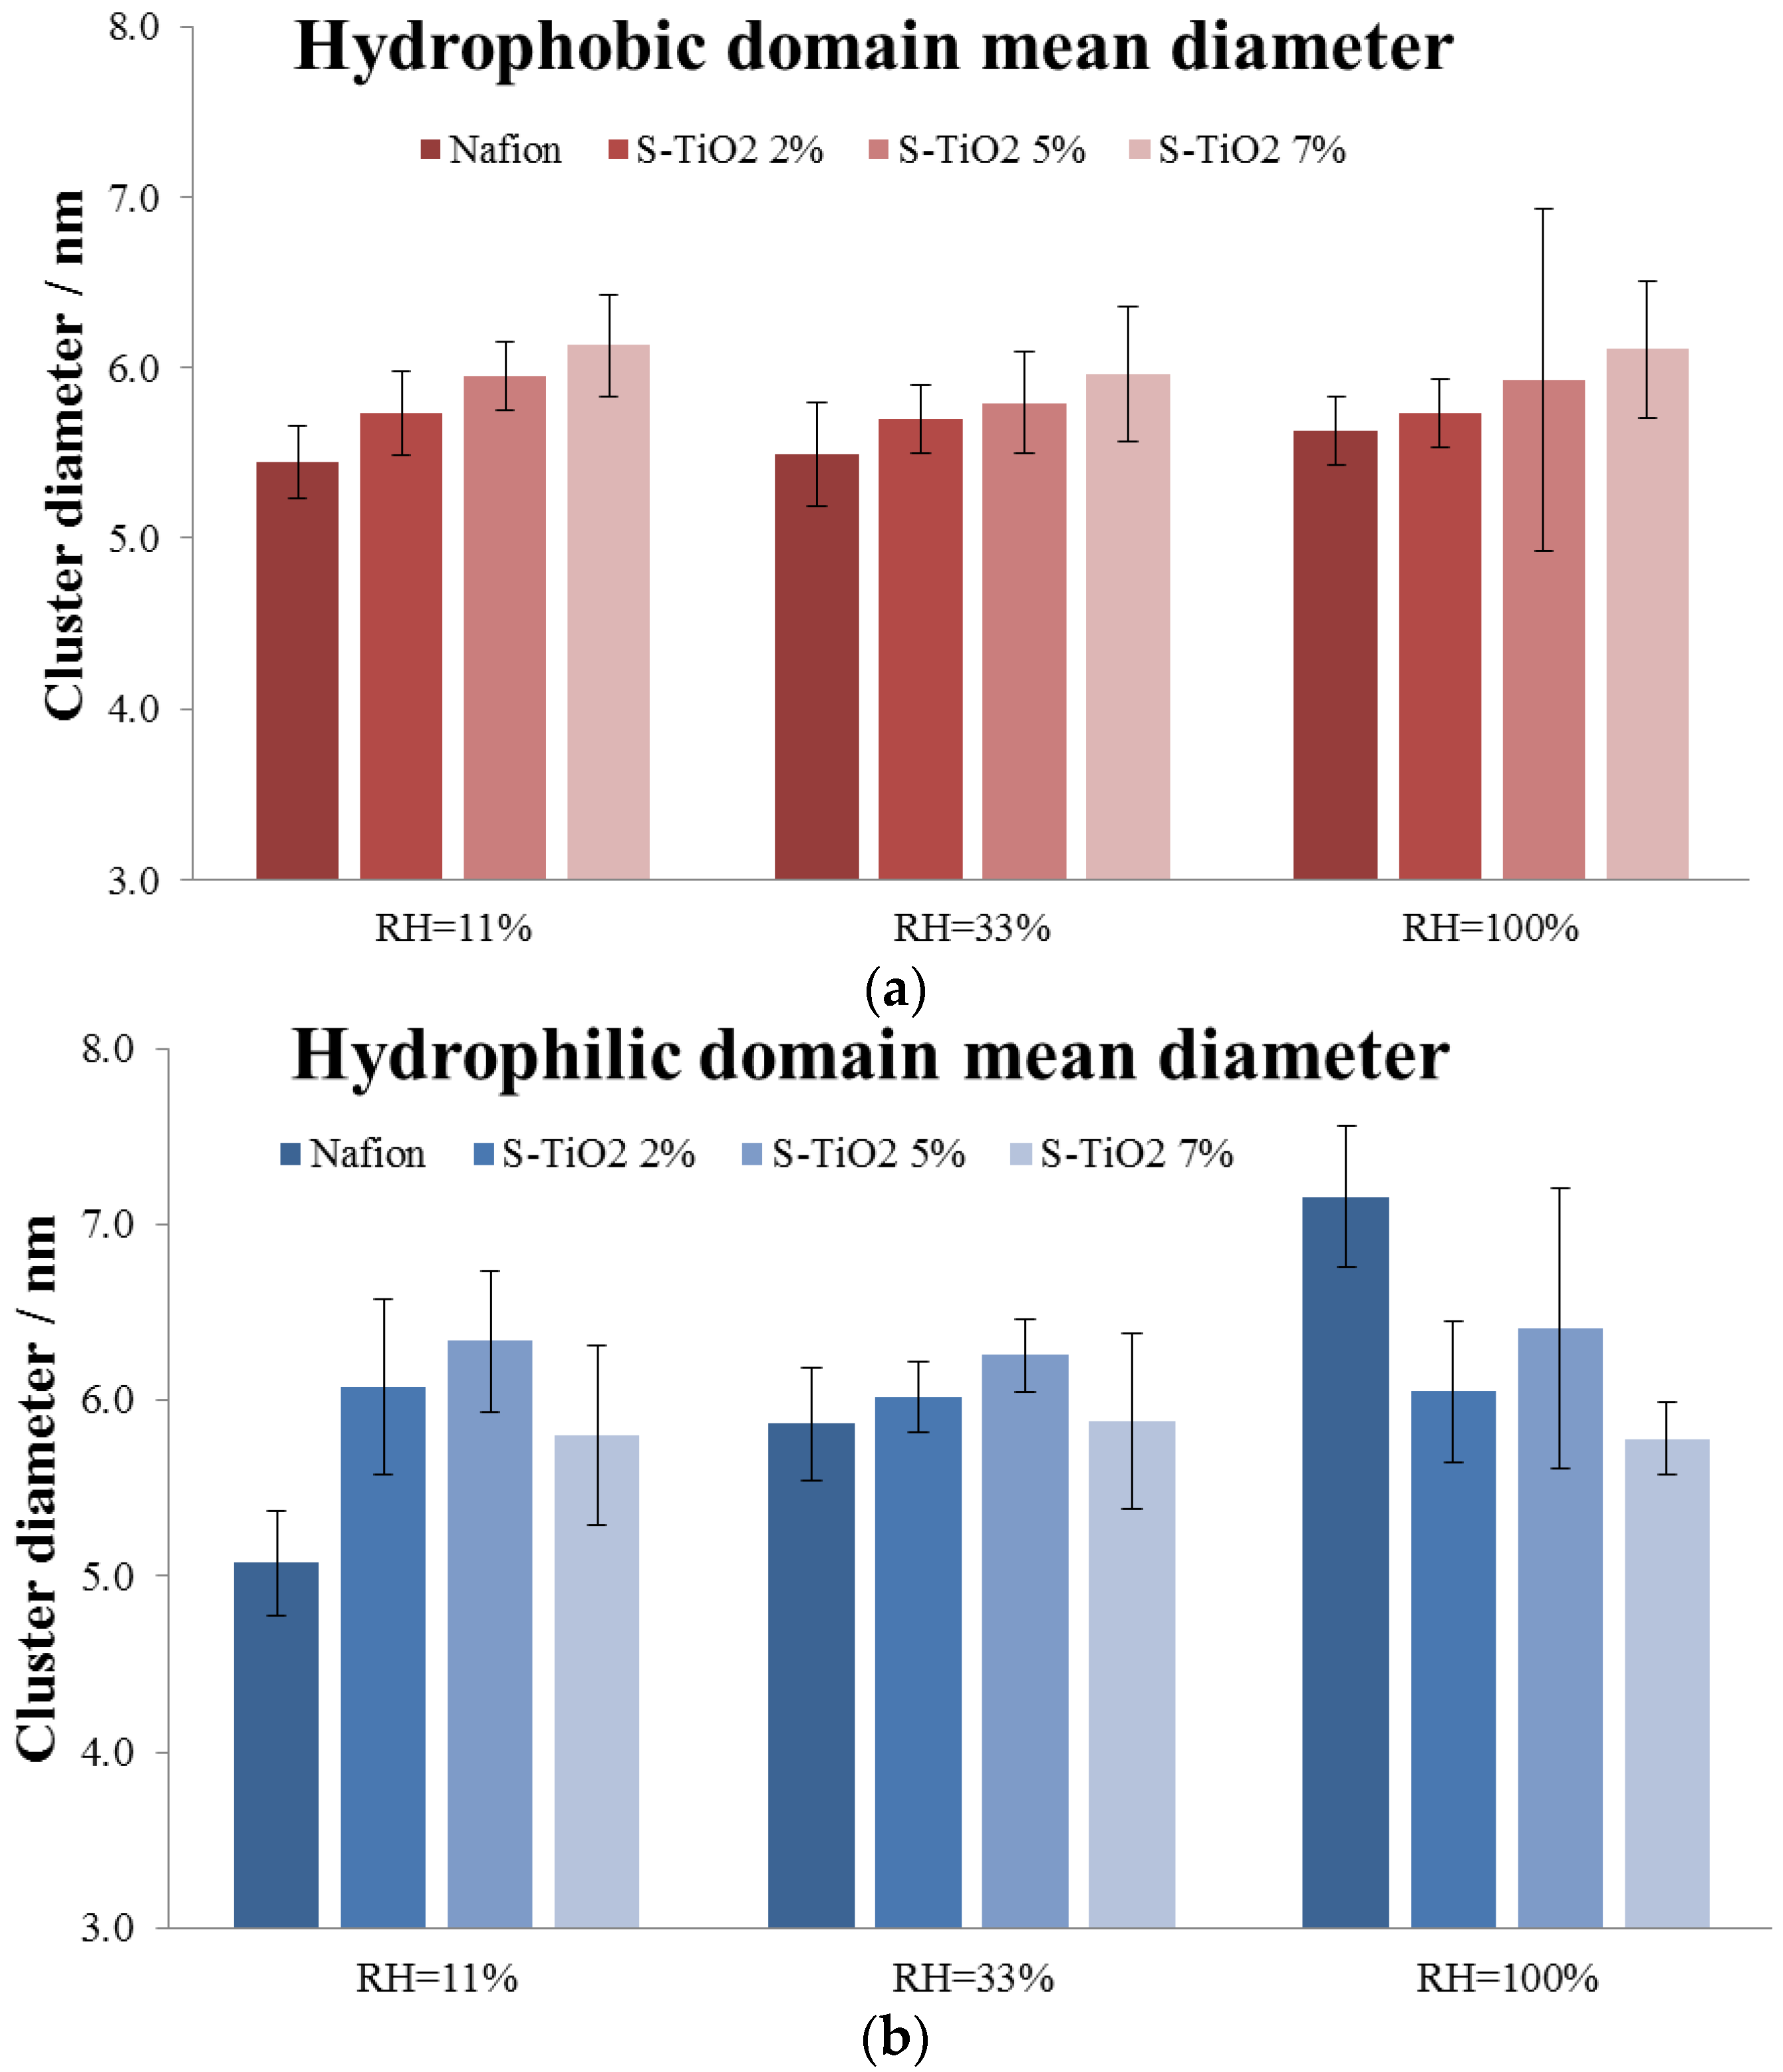
3.1. Water Absorption and Morphological Characterization of the Membranes

A summary of the samples prepared and characterized in this work and the corresponding acronym is reported in Table 2 together with the measured thicknesses and IEC values.
All membranes are homogeneous with a color going from transparent (M0) to intense white (M7): they present a similar thickness and show mechanical properties qualitatively suitable for applications as electrolyte for fuel cell devices. The measured IECs with the filler content show a minimum value for the M5 sample and an interesting reverse volcano trend. WU data are shown in Figure 1.
As expected, all samples show a similar isothermal trend with RH, typical of multilayered water adsorptions. Minor differences can be noted depending on the filler content. M0 and M2 display indistinguishable behaviors, whereas M5 sample keeps the highest hydration even compared to M7 either at low and high RH values.
Apparently the hygroscopic properties of the filler helps to bond water into the membranes. Even though its acidic behavior, proved by the IEC value reported in Table 2, the M7 sample shows a decrease in WU capability likely due to filler aggregation or segregation within the membrane. Interestingly, a decrease of WU in TiO2-composite Nafion™ membranes, compared to bare Nafion™, upon swelling in liquid water was found in the literature [34,35]. One has to consider that there is no general rationale available in explaining hydration properties of polymer electrolytes such as Nafion™ and, also in water vapor, small water droplets may have formed locally on the membrane as a result of little temperature gradients [36].
The ratio between WU and IEC allows to estimate an important functional parameter that is the number of water molecules adsorbed per unit of acid site (λ), reported in Figure 2 as a function of RH.
The M5 sample has the highest value of λ among all the others due to the combined effect of the smaller IEC and larger WU. This behavior may suggest the existence of critical filler concentration that optimizes the nano-morphology of the composite membrane by increasing the H2O molecules bonded to the -SO3H groups. In fact the incorporation of acidic fillers has been reported to alter the organization and size of the Nafion™ hydrophilic and hydrophobic domains [34,35,36]. Above the critical concentration the number of water molecules per acidic sites drops possibly due to: (a) the aggregation of the filler particles within the membrane; or (b) a further detrimental alteration of the membrane morphology at the nanosize. In order to validate our hypothesis an extended AFM study has been carried out on all the membranes at room temperature. In Figure 3, the TM-AFM phase images of the four membranes in the three different RH conditions are compared at the same magnification.
As expected, all AFM images show light round shaped pseudo-particles surrounded by darker areas. In AFM phase images the alternation of light and dark areas correspond to the transition between hydrophobic and hydrophilic domains, respectively, across the polymer matrix due to the interaction of the sulfonic groups dispersed within the hydrophobic network of the Nafion™ polymeric backbone [37,38,39,40]. This expected overall morphology is similar for all the membranes in all the experimental conditions. However it is possible to evaluate some trends in the variation of the hydrophilic and hydrophobic cluster dimensions with respect to both the RH and the S-TiO2 content.
In Figure 4, the trends of the hydrophilic and hydrophobic cluster size derived from AFM image analysis are shown.
Two general trends are observed:
(1)
An increase in the hydrophobic domain size at increasing oxide loading, independent on the membrane hydration. In particular, the sizes of the hydrophobic domains are very similar for all samples and range between 5.5 nm and 6.2 nm for all the membranes at all RH conditions.
(2)
A non-monotonic trend for the hydrophilic domain size at increasing oxide loading and RH condition.
Focusing on the last general trend, apparently the modification of the hydrophilic domains at different RH is strongly altered by the incorporation of the oxide particles. Recast Nafion™ without additives shows a monotonic expansion of the hydrophilic clusters from 5.5 nm to 7.3 nm in size passing from 11% RH to 100% RH. On the other hand all composite membranes show only minor alterations. Surprisingly the size of the hydrophilic domains in all S-TiO2-added membranes is rather independent from the membrane hydration.
Among the three composite membranes, it is possible to highlight an interesting bell-shaped-trend for the hydrophilic cluster size with the oxide loading at all RH condition. Apparently there is an optimum amount of oxide (5% w/w) that leads to the largest expansion at all RH of the dimensions of the hydrophilic domain, with a single exception at 100% RH where the maximum expansion is achieved by the pure Nafion™ recast membrane. The general trend here observed is parallel and identical to that of the number of water molecules per acid site discussed above.
Although highly speculative we may propose a possible interpretation of this peculiar parallelism. The S-TiO2 nanoparticles dispersed in the membrane are partially confined within the hydrophobic domains and partially pseudo-solvated within the hydrophilic domains, thus expanding their size. In fact the sulfated titania nanoparticles show a mean diameter of about 7.6 ± 2.5 nm [31]. Therefore the size of the sulfated titania nanoparticles are small enough to be fully immersed into the hydrophilic and the hydrophobic domains of the Nafion™ membranes as only minor local deformations may allow the accommodation of these particles within the polymeric structure. The particles dispersed in the hydrophilic channels can strongly interact with the sulfonic groups on polymer side-chains. This interaction may reduce the IEC due to the loss of exchangeability of protons on Nafion™ and on S-TiO2. However the net amount of water per acidic site is increased, up to a critical concentration of filler, due to the parallel expansion of the hydrophilic domains that can accommodate larger amount of bulk water. Above a specific concentration of filler this delicate morphological equilibrium is compromised and the influence on the overall morphology and membrane properties of the portion of the filler present in the hydrophobic domains starts to be noticeable. Indeed, in membrane M7 the IEC value increases in parallel with the increase of the hydrophobic cluster size and the contraction of the hydrophilic domains, thus resulting in the net reduction of adsorbed water in all RH conditions.
A direct evidence of the alteration of the local environment around the SO3H groups in the composite membranes at different RH can be drawn by considering the variation of the corresponding vibrational mode detected by Raman spectroscopy. Raman spectra were collected from the four samples at different RH and at two different temperatures: room temperature (approximately 25 °C) and 60 °C. A detailed analysis of the Raman spectra at ambient humidity and temperature of the fillers and composite membranes have been published elsewhere [31] and is omitted to avoid redundancies. Here our goal is to show and discuss the shift of the energy position of the peak attributed to the SO3 vibration mode approximately at 1060 cm−1 in respect to RH at two different temperatures for all the composite membranes. In fact, this vibration is easily modified by the availability of water within the polymer matrix [41]. The trend of the Raman wavenumber of the SO3 vibration mode measured on the pure Nafion™ and composite membranes is shown in Figure 5.
A shift in the position of the SO3 vibration in respect to RH has been already discussed for pure Nafion™ [42] and our results are in excellent agreement with the available literature. This energy shift may be explained by taking into consideration the different environment in the proximity of the SO3 groups at different water content: in dry conditions the SO3 ions are strongly associated to the H+ counter ions whereas at high RH water molecules have a shielding effect and may promote the ion pair dissociation [41]. Surprisingly the nanocomposite membranes show a behavior very different compared to Nafion™, in particular for the M5 and, in a little lower extent, for the M7 samples. At low humidity the sulfonic groups in the M5 and M7 membranes show a smaller vibrational energy compared to pure Nafion™, thus suggesting a reduced perturbation by the H+ counter ions. This effect may be due to: (a) a close interaction between the sulfonic groups on the polymer and the sulfate groups in the fillers thus resulting in a simultaneous interaction of H+ with both functional groups; or (b) a larger local shielding due to water compared to the pure Nafion™. This trend at low RH is enhanced at 60 °C.
On the other hand, at high RH M5 and M7 samples show a larger vibrational energy compared to pure Nafion™. In close symmetry with our previous interpretation, this behavior can be explained either with a reduced interaction effect or with smaller local water content in composite membranes.
In summary the Raman investigation suggests that the incorporation of the filler strongly alters the local environment close to the SO3H groups in the membranes at low as well as at high RH values compared to plain Nafion™, thus directly proving the interaction at molecular level between filler, polymer matrix and water molecules. These evidences agree with our interpretation of the WU and IEC trends as well as the morphological alteration evaluated by AFM with RH and filler content.

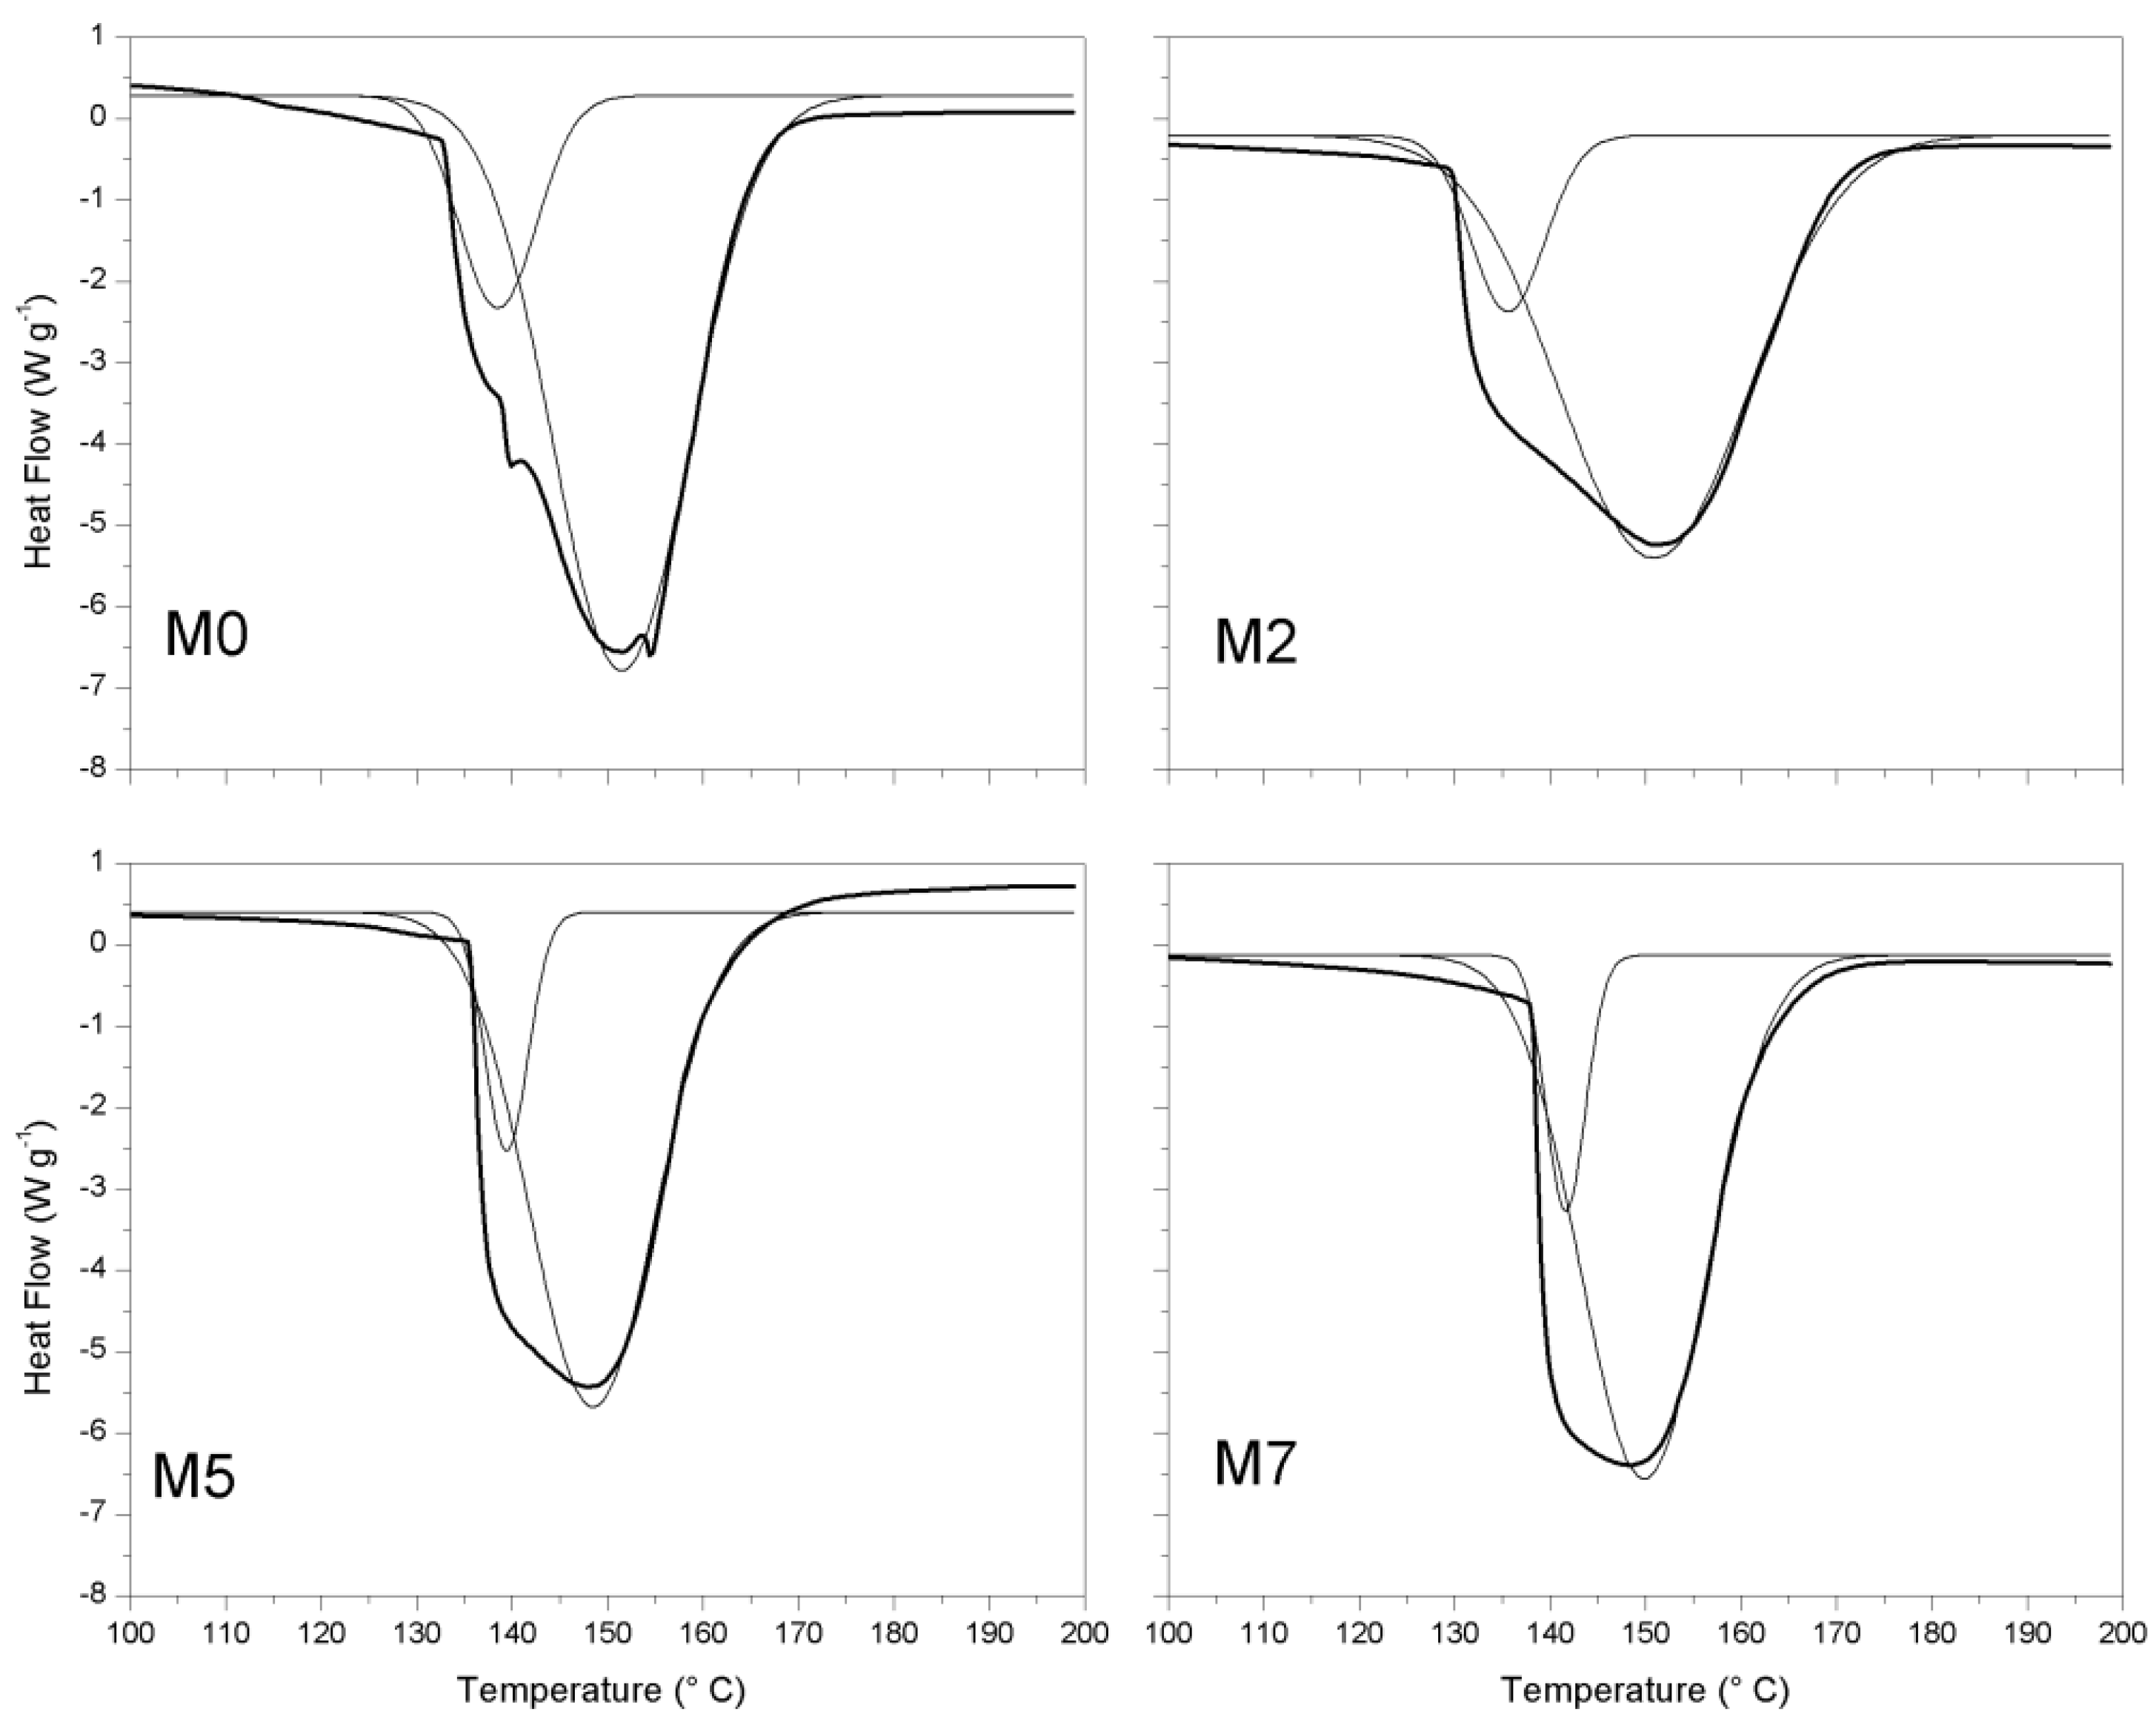
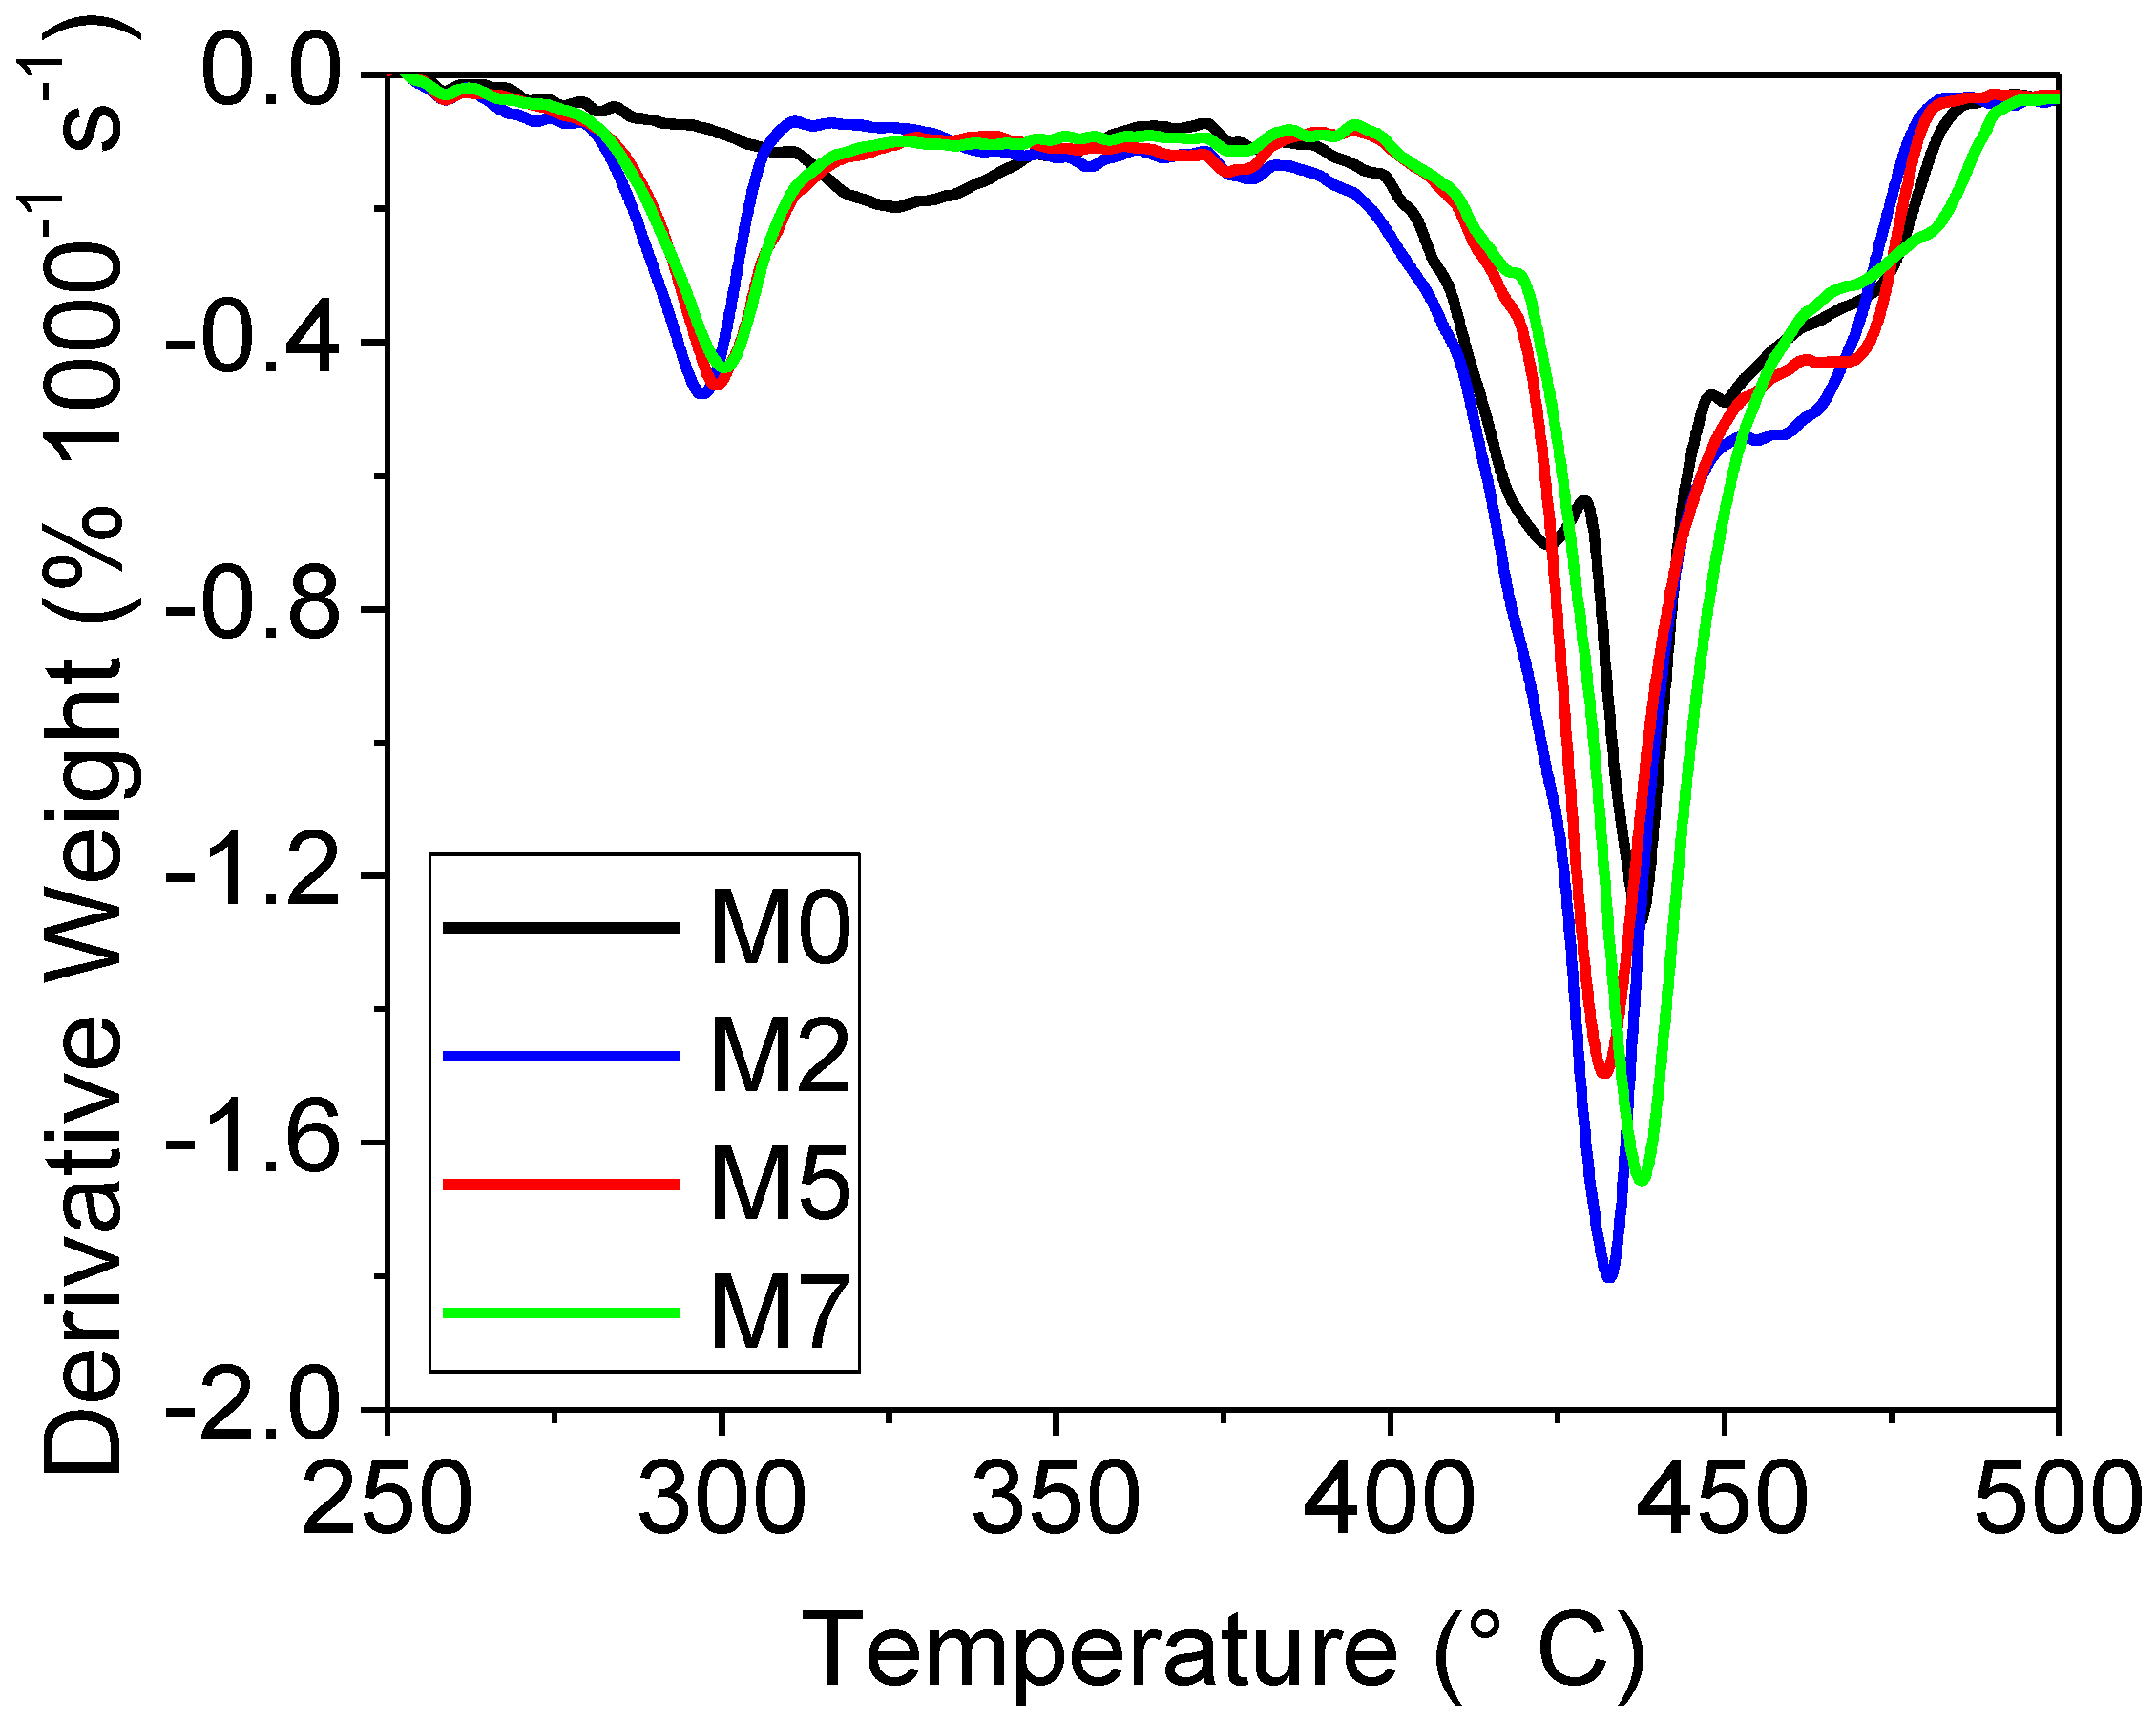
3.2. Thermal Properties of the Membranes

In order to understand more in detail the interaction between water/filler and polymer matrix an extended thermal characterization has been carried out for all the samples. The DSC curves recorded for all the membrane are plotted in Figure 6.
All the samples show an endothermic transition centered at around 145 °C: this peak is due to an order-disorder transition of ionic clusters due to the loss of water [43]. The onset temperature (Tonset) of this transition and the corresponding enthalpy variation (ΔH), easily derived by the peak area, depend on the degree of hydration of the membrane [44]. In fact larger amount of water adsorbed into the composite membrane are expected to decrease the Tonset, due to the increase of the free volume facilitating the chain mobility, and to increase the ΔH [44]. This last effect is related to the larger energy required to overcome the bonding interaction within highly hydrated hydrophilic domains. The broad endothermic peaks observed are referred to quite complex phenomena and can be deconvoluted in at least two overlapped Lorentzian functions. These two thermal fingerprints can be related to structural reorganization due to the water loss around the SO3H groups on one side and to the motions of the perfluoro backbone of Nafion™ on the other side [45]. The trends of the Tonset and ΔH are reported in Table 3.
Overall, the hydration of the membranes decreases at increasing ceramic content: this trend is apparently in contradiction with the WU measurements (see above). However the hydration degree evaluated by the thermal transition above 130 °C neglects the loss of “free” water molecules occurring at lower temperatures [46]. In this view, one may speculate that the filler addition may decrease the water strongly associated with the Nafion™ matrix and in parallel enhance the amount of water only weakly bonded within the membrane, at least for the M5 sample.
The derivative TGA curves measured for the four membranes are shown in Figure 7 in the 250–500 °C temperature range. The decomposition of the Nafion™ polymer matrix occurs in three main stages [16,43]. The first decomposition, associated with desulfonation of the side-chain of Nafion™, seems to be catalyzed by sulfated titania, as it occurs at lower temperatures for the ceramic-added membranes (i.e., 320 °C for M0 samples and below 300 °C for M2-5-7). The second and the third transitions, occurring in the range 400–450 °C, are related to side-chain and PTFE-backbone decompositions [47]. Sulfated titania looks to alter these transitions too. In fact the the two separated peaks observed for M0 are overlapped for the M2 sample, and totally convoluted in single sharp peaks for M5 and M7.
The modification of both the thermal decomposition reactions in the composite membranes are an indication of the intimate contact of the filler with the Nafion™ matrix. In all the composite membranes, the presence of the filler leads to a major alteration of the transition associated with desulfonation of the side chains within the hydrophilic clusters. However in the sample M2 the presence of the filler only moderately affects the decomposition of polymer PTFE backbone. On the contrary in both M5 and M7 membranes the thermal decomposition between 400 °C and 450 °C is strongly modified. This picture confirms our interpretation concerning the different repartition of filler between the hydrophilic and the hydrophobic domains depending on the concentration. Apparently a small amount of S-TiO2 mostly interacts with the sulfonic groups within the hydrophilic domains whereas larger concentrations highlight an evident interaction with hydrophobic fragments of the membrane.

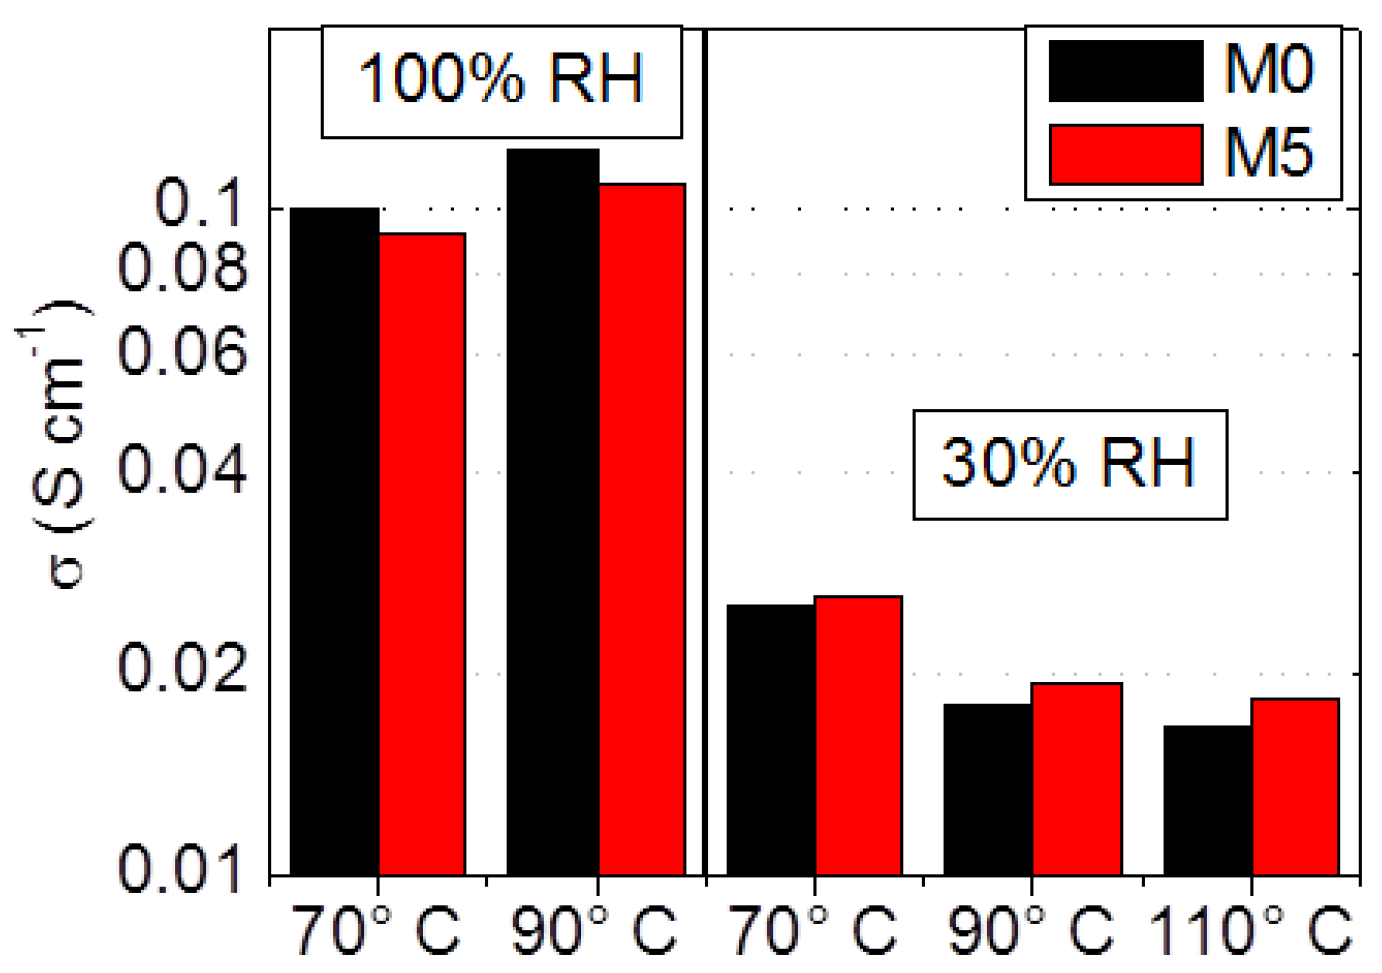
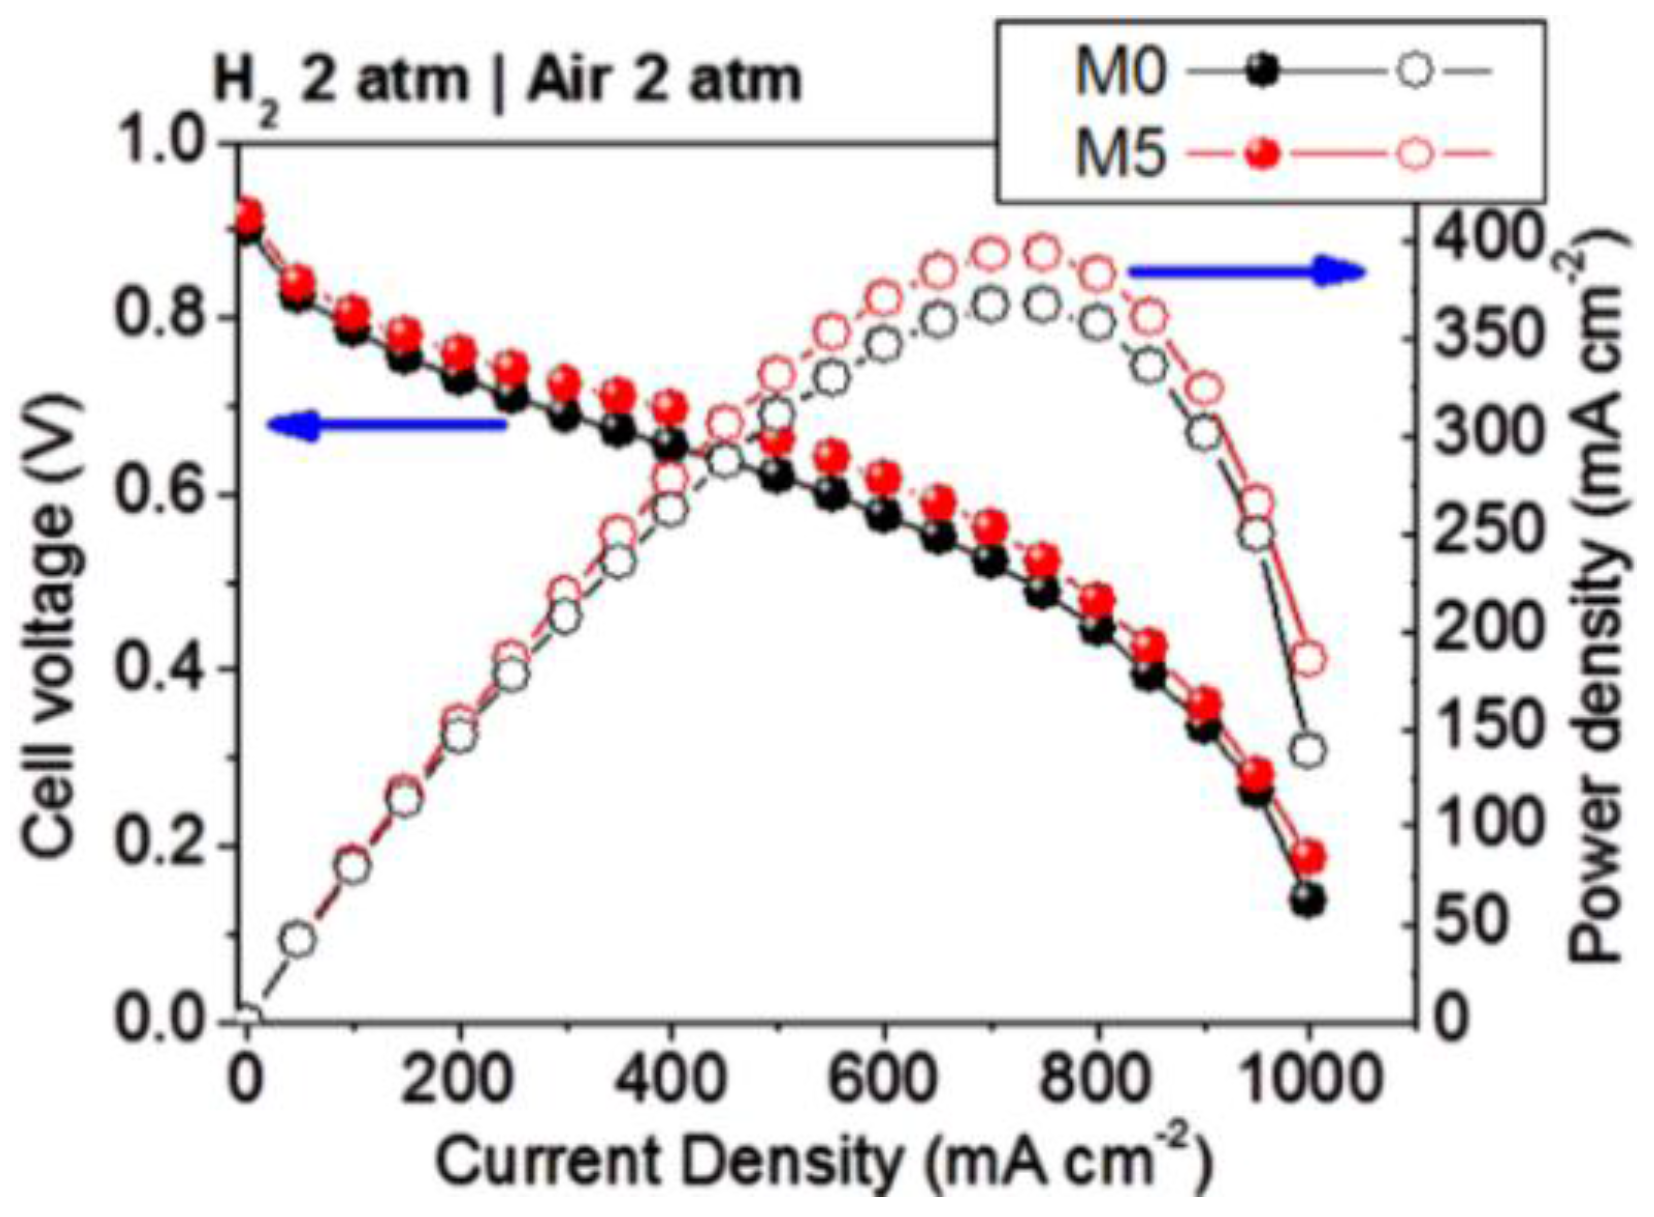
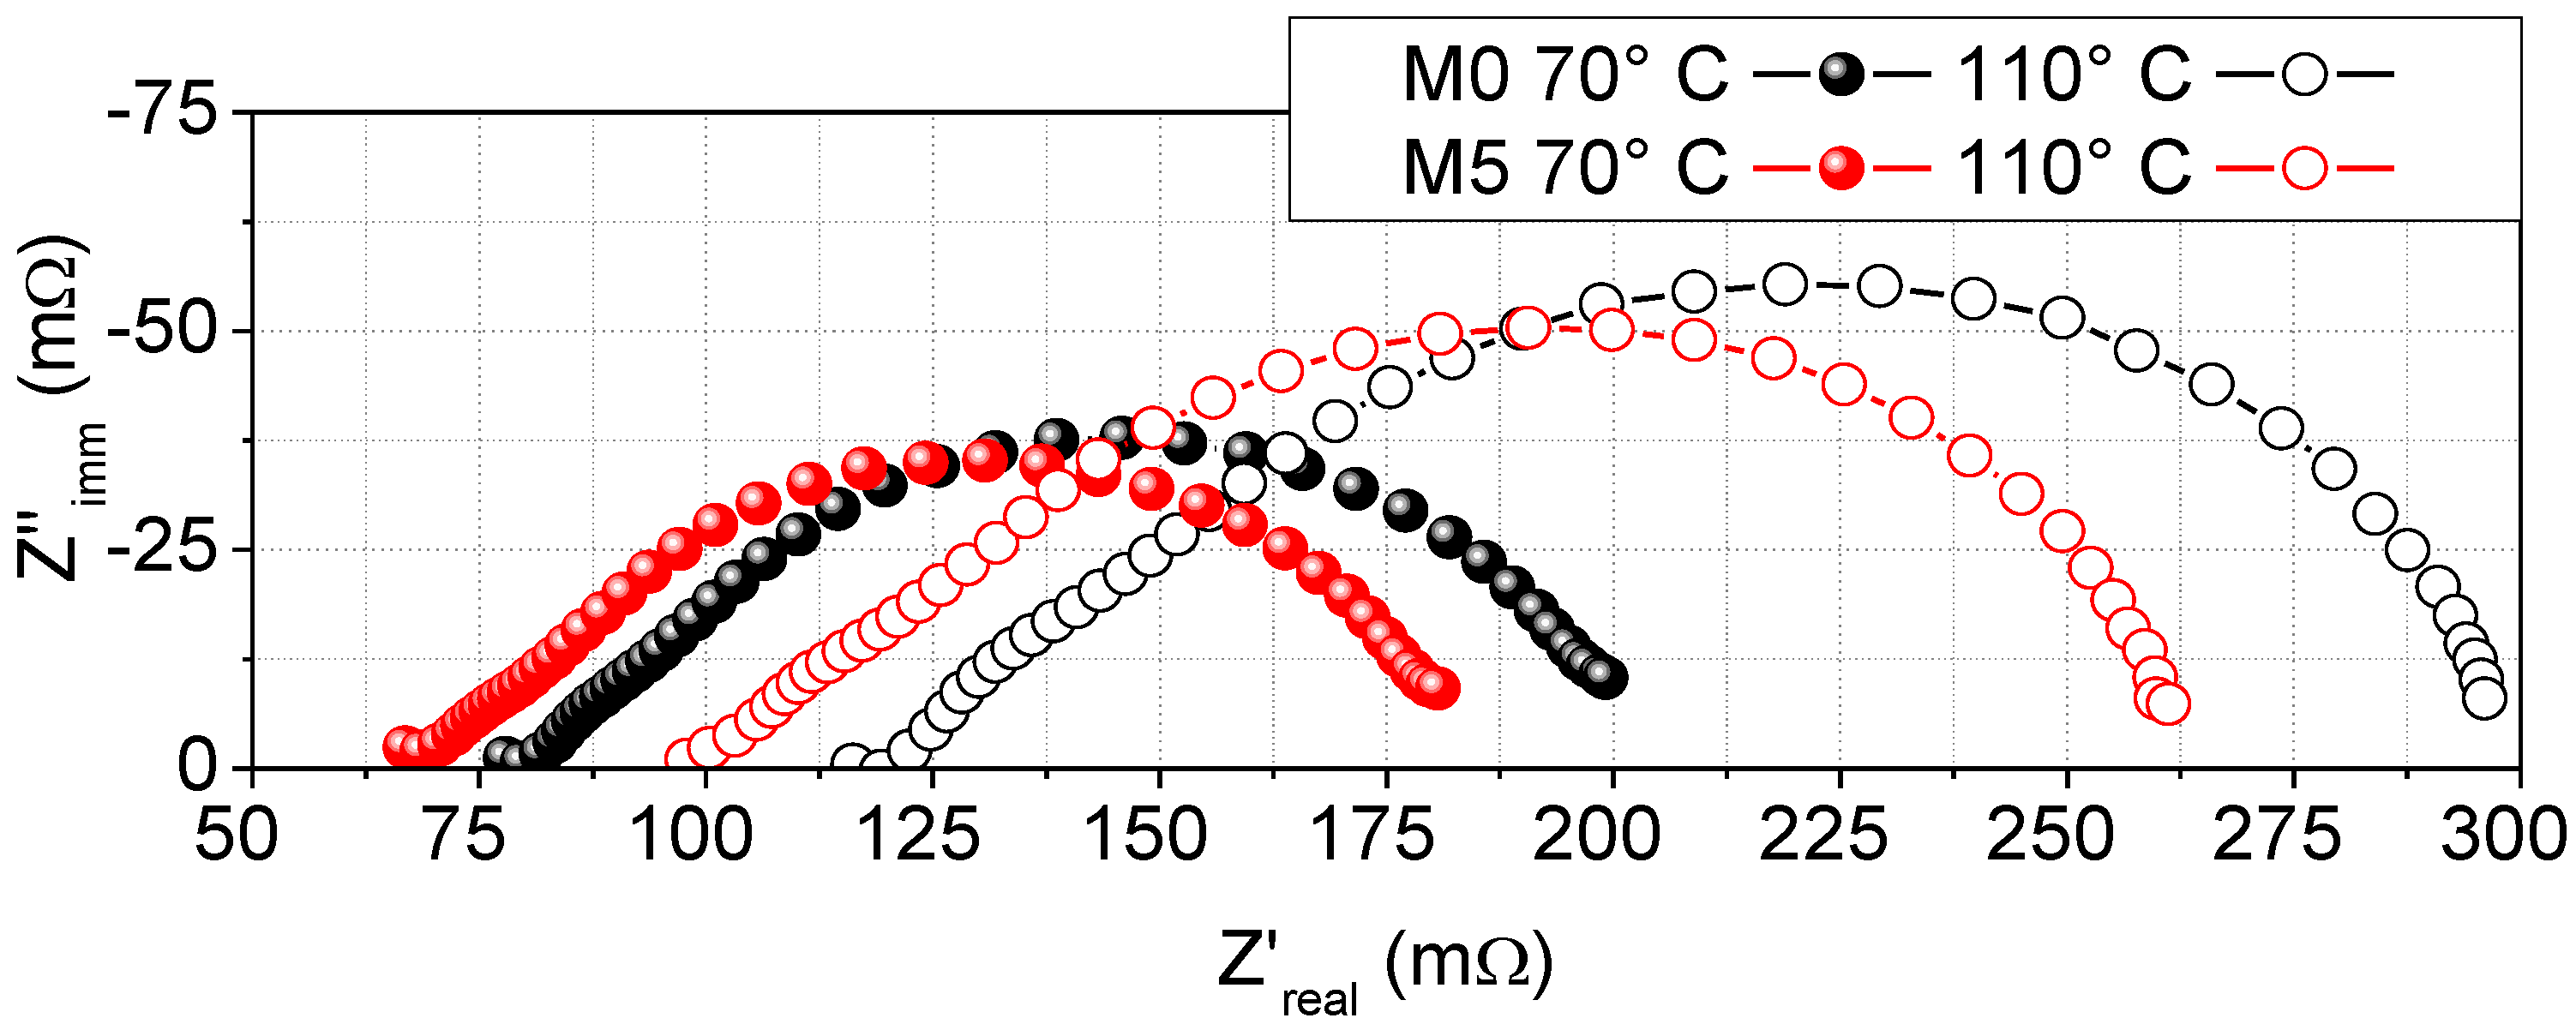
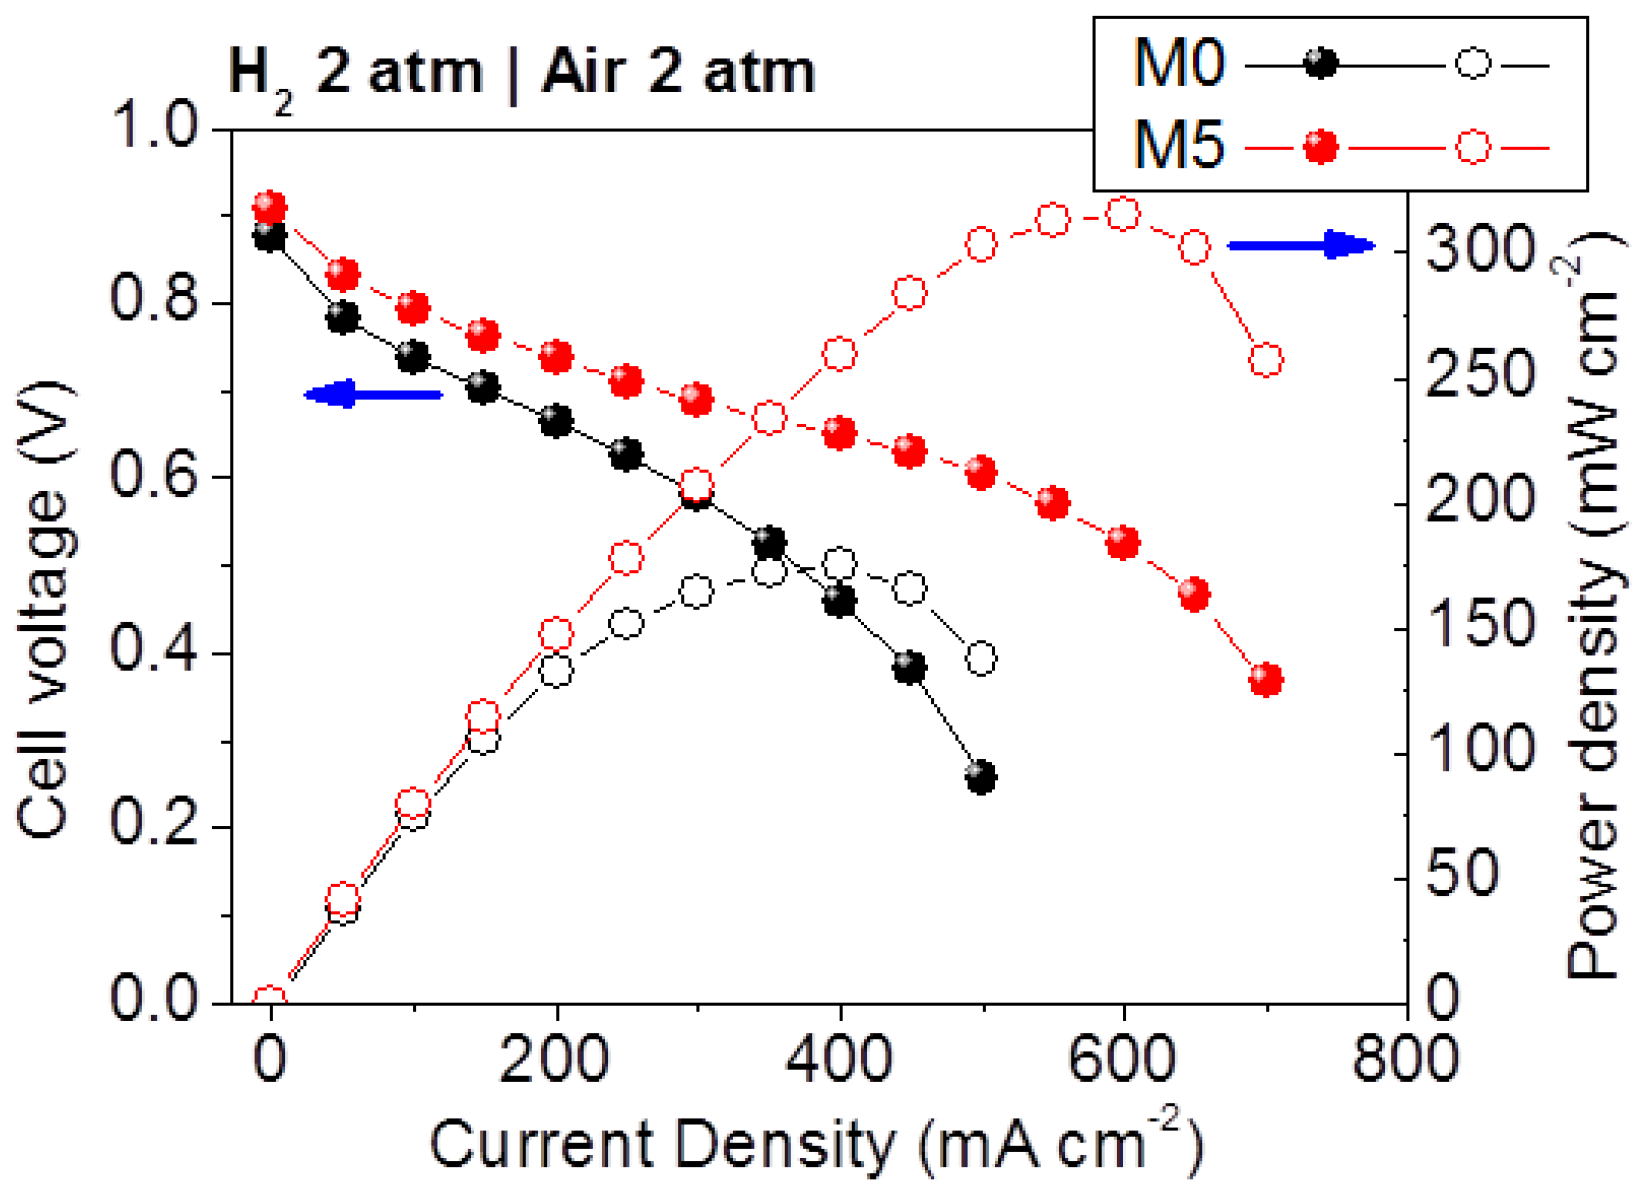
3.3. Ionic Conductivity and Hydrogen Fuel Cells Performances

The investigation of the properties of the composite membranes discussed in the previous sections suggest the existence of a critical concentration of S-TiO2 filler. In fact whereas the M2 sample has properties close to those of recast Nafion, M5 and M7 samples show different thermal and water bonding properties. Between M5 and M7 membranes, the first one has the larger WU, larger amount of water molecule per acidic site and larger size of the hydrophilic domains whereas thermal and proton bonding properties derived from Raman spectroscopy are very similar. In this view we selected membrane M5 for further electrochemical investigation, in close comparison with bare recast Nafion™. Proton conductivities of M0 and M5 samples, derived from impedance spectra recorded under fuel cell operations (see Section 2.2) are shown in Figure 8.
Apparently at RH = 100% recast Nafion™ M0 shows larger conductivity compared to the M5 samples. On the contrary at low RH (30%) membrane M5 overcomes the ionic conductivity of recast Nafion™. Similar behaviors have been reported by other authors for composite Nafion™ membranes [35,48] and can be interpreted considering the alteration of the WU and IEC for composite membranes compared to the additive-free one [49,50]. Apparently the M5 composite membrane has larger WU and smaller IEC compared to the recast Nafion™ M0. However a simple direct relation between the amount of adsorbed water and the ionic conductivity cannot be assumed as the proton mobility across the membranes depends also by the nature of adsorbed water [30]. In the case of the titania nanocomposite membranes, we showed, in a previous publication, that the ratio R between bound and free water in the matrix has different trends with the total WU depending by the concentration of filler [30]. In particular bare Nafion™ membranes suffer a rapid decrease of R at increasing WU, whereas composite membranes show more constant trends. In this view one may speculate that the larger amount of free water kept in the composite membrane at low RH compared to recast Nafion™ may enhance the proton mobility similarly to what occurs for the composite-free membranes at large RH.
Fuel cell performances have been evaluated by assembling two cells using either M0 or M5. Performances at 70 °C and RH = 30% are shown in Figure 9 whereas performances in more challenging conditions at 110 °C and low RH are presented in Figure 10.
In operating conditions of 70 °C and RH = 30% the performances of the cell adopting M5 membrane compare well to those of M0. As expected, at higher temperature and such low RH (30%) the overall performances of both cells decline. However the M5 cell outperforms plain recast Nafion™ at 110 °C. The different performances can be demonstrated comparing power and current values delivered by each cell: at 70 °C there are only slightly differences in maximum power (between 350 mW/cm2 and 400 mW/cm2), with no valuable difference in the current values; on the contrary, at 110 °C and 30% RH, the cell based on M5 shows strong increase in performances with respect to M0, both in maximum power (300 mW/cm2 for M5 and 150 mW/cm2 for M0) and current delivered at maximum power (600 mA/cm2 for M5 and 400 mA/cm2 for M0).
Impedance spectra measured at 6.5 V for both fuel cells under 70 °C and 110 °C and 30% RH are shown in Figure 11. The higher frequency intercepts on the real axis can be considered as the total non-electrode ohmic resistance of the cell, meanwhile the lower frequency intercepts is due to the overall charge transfer interfacial resistances. The composite M5 membrane shows smaller ohmic resistance both at 70 °C and 110 °C as well as smaller charge transfer resistance compared to M0. These enhanced electrode/electrolyte interfacial properties, as well as the lower ohmic resistance associated with M5, explain its better behavior showed above in terms of cell performance. Since the thickness of the two membranes is comparable (see data shown in Table 1) and electrode active area is the same, the reduction of the ohmic resistance can be easily attributed to the larger conductivity value observed for the M5 membrane compared to Nafion™ at low humidity (RH = 30%). Turning to the different charge transfer resistance, one may speculate about a possible improved interfacial properties between membrane and electrode in the presence of the S-TiO2 filler. In literature the beneficial effect of inorganic additives on the relaxation process of Nafion™ at high temperature and low humidity has been discussed [6]. Apparently fillers may reduce the shrinkage of membranes thus preserving the quality of the electrolyte/electrode interface in non-standard operating conditions. Also the increased hydration of the M5 membrane at low RH compared to recast Nafion™ may contribute to the reduction of the charge transfer resistance.

4. Conclusions

The properties of Nafion™ membranes, with and without sulfated titania fillers, have been investigated at different RH conditions. Incorporation of the synthesized sulfated oxide powders in the polymer matrix produces a clear effect on peculiar membrane properties, such as hydration and local filler-polymer interactions. In summary, a direct evidence of the alteration of the local environment around the SO3H groups in the composite membranes has been demonstrated, being this strongly dependent on the relative filler amount. A critical concentration of S-TiO2 has been revealed. M5 membrane, showing the largest WU, λ and size of the hydrophilic domains, has been selected for the electrochemical fuel cell investigations, in comparison with bare Nafion™. Proton conductivity of M5 exceeds that of M0 only when the RH is kept at very low level (30%). Cell performances, evaluated at 30% RH in terms of polarization curves and in-situ impedance spectra, suggest reduced charge transfer resistance, as well as lower ohmic resistance, associated with M5 at 110 °C. Such electrochemical response has been related to the higher amount of free water kept in the composite membrane at low RH and high T, compared to plain Nafion™, which enhances the proton mobility, and to the beneficial effect of the inorganic additive in the electrode/electrolyte interfacial properties.

Acknowledgments

This work has been performed in the framework of the NAMED-PEM Project “Advanced nanocomposite membranes and innovative electrocatalysts for durable polymer electrolyte membrane fuel cells” (PRIN 2010-2011, protocollo 2010CYTWAW_001), funded by the Italian Ministry of University and Research. Maria Assunta Navarra acknowledges Sapienza University of Rome for the financial support to the project titled “Polymer electrolyte membrane water electrolysers: innovative, cost-effective electrocatalysts with enhanced durability” (2015, protocollo C26A15HE93).

Author Contributions

Maria Assunta Navarra, Stefania Panero and Gino Mariotto designed the research. Mirko Sgambetterra and Maria Assunta Navarra synthesized the samples. Mirko Sgambetterra, Sergio Brutti and Valentina Allodi characterized the samples. Sergio Brutti, Gino Mariotto and Maria Assunta Navarra wrote the manuscript.

Conflicts of Interest

The authors declare no conflict of interest.

References

  1. Li, Q.; Jensen, J.O.; Savinell, R.F.; Bjerrum, N.J. High temperature proton exchange membranes based on polybenzimidazoles for fuel cells. Prog. Polym. Sci. 2009, 34, 449–477. [Google Scholar] [CrossRef] [Green Version]
  2. Zhang, J.; Xie, Z.; Zhang, J.; Tang, Y.; Song, C.; Navessin, T.; Shi, Z.; Song, D.; Wang, H.; Wilkinson, D.P.; et al. High temperature PEM fuel cells. J. Power Sources 2006, 160, 872–891. [Google Scholar] [CrossRef]
  3. Springer, T.E.; Zawodzinski, T.A.; Gottesfeld, S. Polymer electrolyte fuel cell model. J. Electrochem. Soc. 1991, 138, 2334–2342. [Google Scholar] [CrossRef]
  4. Sumner, J.J.; Creager, S.E.; Ma, J.J.; DesMarteau, D.D. Proton conductivity in Nafion® 117 and in a novel bis[(perfluoroalkyl)sulfonyl]imide ionomer membrane. J. Electrochem. Soc. 1998, 145, 107–110. [Google Scholar] [CrossRef]
  5. Malhotra, S.; Datta, R. Membrane-supported nonvolatile acidic electrolytes allow higher temperature operation of proton-exchange membrane fuel cells. J. Electrochem. Soc. 1997, 144, 23–26. [Google Scholar] [CrossRef]
  6. Giffin, G.A.; Piga, M.; Lavina, S.; Navarra, M.A.; D’Epifanio, A.; Scrosati, B.; Di Noto, V. Characterization of sulfated-zirconia/Nafion® composite membranes for proton exchange membrane fuel cells. J. Power Sources 2012, 198, 66–75. [Google Scholar] [CrossRef]
  7. Wu, Y.N.; Liao, S.J. Review of SO42−/MxOy solid superacid catalysts. Front. Chem. Eng. China 2009, 3, 330–343. [Google Scholar] [CrossRef]
  8. Hino, M.; Arata, K.J. Synthesis of solid superacid catalyst with acid strength of H0 ≤ –16.04. J. Chem. Soc. Chem. Commun. 1980, 18, 851–852. [Google Scholar] [CrossRef]
  9. Reddy, B.M.; Patil, M.K. Organic syntheses and transformations catalyzed by sulfated zirconia. Chem. Rev. 2009, 109, 2185–2208. [Google Scholar] [CrossRef] [PubMed]
  10. Chen, J.P.; Yang, R.T. Selective catalytic reduction of no with NH3 on SO4−2/TiO2 superacid catalyst. J. Catal. 1993, 139, 277–288. [Google Scholar] [CrossRef]
  11. Hino, M.; Arata, K. Catalytic activity of iron oxide treated with wulfate ion for dehydration of 2-propanol and ethanol and polymericazion of isobuthyl vinyl ether. Chem. Lett. 1979, 8, 477–480. [Google Scholar] [CrossRef]
  12. Arata, K.; Hino, M. Reaction of butane to isobutane catalyzed by the solid superacid of HfO2 treated with sulfate ion. React. Kinet. Catal. Lett. 1984, 25, 143–145. [Google Scholar] [CrossRef]
  13. Matsuhashi, H.; Hino, M.; Arata, K. Synthesis of solid superacid of silica treated with sulfuryl chloride. Catal. Lett. 1991, 8, 269–271. [Google Scholar] [CrossRef]
  14. Chavan, S.; Zubaidha, P.; Dantale, S.; Keshavaraja, A.; Ramaswamy, A.; Ravindranathan, T. Facile deprotection of allyl esters mediated by solid superacid (sulphated SnO2). Tetrahedron Lett. 1996, 37, 237–240. [Google Scholar] [CrossRef]
  15. Smirnova, M.; Toktarev, A.; Ayupov, A.; Echevsky, G. Sulfated alumina and zirconia in isobutane/butene alkylation and n-pentane isomerization: Catalysis, acidity, and surface sulfate species. Catal. Today 2010, 152, 17–23. [Google Scholar] [CrossRef]
  16. Navarra, M.A.; Croce, F.; Scrosati, B. New, high temperature superacid zirconia-doped Nafion™ composite membranes. J. Mater. Chem. 2007, 17, 3210–3215. [Google Scholar] [CrossRef]
  17. Wang, C.; Chalkova, E.; Lee, J.K.; Fedkin, M.V.; Komarneni, S.; Lvov, S.N. Composite membranes with sulfonic and phosphonic functionalized inorganics for reduced relative humidity PEM fuel cells. J. Electrochem. Soc. 2011, 158, B690–B697. [Google Scholar] [CrossRef]
  18. Branchi, M.; Sgambetterra, M.; Pettiti, I.; Panero, S.; Navarra, M.A. Functionalized Al2O3 particles as additives in proton-conducting polymer electrolyte membranes for fuel cell applications. Int. J. Hydrog. Energy 2015, 40, 14757–14767. [Google Scholar] [CrossRef]
  19. Scipioni, R.; Gazzoli, D.; Teocoli, F.; Palumbo, O.; Paolone, A.; Ibris, N.; Brutti, S.; Navarra, M.A. Preparation and characterization of nanocomposite polymer membranes containing functionalized SnO2 additives. Membranes 2014, 4, 123–142. [Google Scholar] [CrossRef] [PubMed]
  20. Brutti, S.; Scipioni, R.; Navarra, M.A.; Panero, S.; Allodi, V.; Giarola, M.; Mariotto, G. SnO2-Nafion® nanocomposite polymer electrolytes for fuel cell applications. Int. J. Nanothecnol. 2014, 11, 882–896. [Google Scholar] [CrossRef]
  21. Hwang, K.; Kim, J.; Kim, S.; Byun, H. Preparation of polybenzimidazole-based membranes and their potential applications in the fuel cell system. Energies 2014, 7, 1721–1732. [Google Scholar] [CrossRef]
  22. Ma, H.; Cheng, W.; Fang, F.; Hsu, C.; Lin, C. Compact design of 10 kW proton exchange membrane fuel cell stack systems with microcontroller units. Energies 2014, 7, 2498–2514. [Google Scholar] [CrossRef]
  23. Rabbani, A.; Rokni, M. Modeling and analysis of transport processes and efficiency of combined SOFC and PEMFC systems. Energies 2014, 7, 5502–5522. [Google Scholar] [CrossRef] [Green Version]
  24. Xiao, Y.; Cho, C.D. Experimental investigation and discussion on the mechanical endurance limit of Nafion membrane used in proton exchange membrane fuel cell. Energies 2014, 7, 6401–6411. [Google Scholar] [CrossRef]
  25. Jang, H.; Sutradhar, S.; Yoo, J.; Ha, J.; Pyo, J.; Lee, C.; Ryu, T.; Kim, W. Synthesis and characterization of sulfonated poly(phenylene) containing a non-planar structure and dibenzoyl groups. Energies 2016, 9. [Google Scholar] [CrossRef]
  26. Liang, B.; Jiang, Q.B.; Tang, S.Q.; Li, S.L.; Chen, X. Porous polymer electrolytes with high ionic conductivity and good mechanical property for rechargeable batteries. J. Power Sources 2016, 307, 320–328. [Google Scholar] [CrossRef]
  27. Bella, F.; Colò, F.; Nair, J.; Gerbaldi, C. Photopolymer electrolytes for sustainable, upscalable, safe, and ambient-temperature sodium-ion secondary batteries. ChemSusChem 2015, 8, 3668–3676. [Google Scholar] [CrossRef] [PubMed]
  28. Imperiyka, M.; Ahmad, A.; Hanifah, S.A.; Bella, F. A UV-prepared linear polymer electrolyte membrane for dye-sensitized solar cells. Phys. B Condens. Matter 2014, 450, 151–154. [Google Scholar] [CrossRef]
  29. Anothumakkool, B.; Torris AT, A.; Veeliyath, S.; Vijayakumar, V.; Badiger, M.V.; Kurungot, S. High-performance flexible solid-state supercapacitor with an extended nanoregime interface through in situ polymer electrolyte generation. ACS Appl. Mater. Interfaces 2016, 8, 1233–1241. [Google Scholar] [CrossRef] [PubMed]
  30. Sgambetterra, M.; Panero, S.; Hassoun, J.; Navarra, M.A. Hybrid membranes based on sulfated titania nanoparticles as low-cost proton conductors. Ionics 2013, 19, 1203–1206. [Google Scholar] [CrossRef]
  31. Allodi, V.; Brutti, S.; Giarola, M.; Sgambetterra, M.; Navarra, M.A.; Panero, S.; Mariotto, G. Structural and spectroscopic characterization of sulfated TiO2-added nanocomposite Nafion membranes for fuel cell applications. Polymers 2016, 8. [Google Scholar] [CrossRef] [Green Version]
  32. Nicotera, I.; Kosma, V.; Simari, C.; Ranieri, G.A.; Sgambetterra, M.; Panero, S.; Navarra, M.A. An NMR study on the molecular dynamic and exchange effects in composite Nafion/sulfated titania membranes for PEMFCs. Int. J. Hydrog. Energy 2015, 40, 14651–14660. [Google Scholar] [CrossRef]
  33. Greenspan, L. Humidity fixed points of binary saturated aqueous solutions. J. Res. Natl. Bur. Stand. A Phys. Chem. 1977, 81A, 89–95. [Google Scholar] [CrossRef]
  34. Adjemian, K.T.; Dominey, R.; Krishnan, L.; Ota, H.; Majsztrik, P.; Zhang, T.; Mann, J.; Kirby, B.; Gatto, L.; Velo-Simpson, M.; et al. Function and characterization of metal oxide−Nafion composite membranes for elevated-temperature H2/O2 PEM fuel cells. Chem. Mater. 2006, 18, 2238–2248. [Google Scholar] [CrossRef]
  35. Wu, Z.; Sun, G.; Jin, W.; Hou, H.; Wang, S.; Xin, Q. Nafion® and nano-size TiO2–SO42− solid superacid composite membrane for direct methanol fuel cell. J. Membr. Sci. 2008, 313, 336–343. [Google Scholar] [CrossRef]
  36. Kreuer, K.D. The role of internal pressure for the hydration and transport properties of ionomers and polyelectrolytes. Solid State Ion. 2013, 252, 93–101. [Google Scholar] [CrossRef]
  37. Bussian, D.A.; O’Dea, J.R.; Metiu, H.; Buratto, S.K. Nanoscale current imaging of the conducting channels in proton exchange membrane fuel cells. Nano Lett. 2007, 7, 227–232. [Google Scholar] [CrossRef] [PubMed]
  38. He, Q.; Kusoglu, A.; Lucas, I.T.; Clark, K.; Weber, A.Z.; Kostecki, R. Correlating humidity-dependent ionically conductive surface area with transport phenomena in proton-exchange membranes. J. Phys. Chem. B 2011, 115, 11650–11657. [Google Scholar] [CrossRef] [PubMed]
  39. James, P.J.; Antognozzi, M.; Tamayo, J.; McMaster, T.J.; Newton, J.M.; Miles, M.J. Interpretation of Contrast in Tapping Mode AFM and Shear Force Microscopy. A Study of Nafion. Langmuir 2001, 17, 349–360. [Google Scholar] [CrossRef]
  40. James, P.J.; Elliot, J.A.; McMaster, T.J.; Newton, J.M.; Elliott, A.M.S.; Hanna, S.; Miles, M.J. Hydration of Nafion studied by AFM and X-ray scattering. J. Mater. Sci. 2000, 35, 5111–5119. [Google Scholar] [CrossRef]
  41. Kunimatzu, K.; Bae, B.; Miyatake, K.; Uchida, H.; Watanabe, M. ATR-FTIR study of water in Nafion membrane combined with proton conductivity measurements during hydration/dehydration cycle. J. Phys. Chem. B 2011, 115, 4315–4321. [Google Scholar] [CrossRef] [PubMed]
  42. Haraa, M.; Inukai, J.; Miyatake, K.; Uchidaa, H.; Watanabe, M. Temperature dependence of the water distribution inside a Nafion membrane in an operating polymer electrolyte fuel cell. A micro-Raman study. Electrochim. Acta 2011, 58, 449–455. [Google Scholar] [CrossRef]
  43. De Almeida, S.H.; Kawano, Y. Thermal behavior of Nafion membranes. J. Therm. Anal. Calorim. 1999, 58, 569–577. [Google Scholar] [CrossRef]
  44. Navarra, M.A.; Abbati, C.; Scrosati, B. Properties and fuel cell performance of a Nafion-based, sulfated zirconia-added, composite membrane. J. Power Sources 2008, 183, 109–113. [Google Scholar] [CrossRef]
  45. Guo, B.; Tay, S.W.; Liu, Z.; Hong, L. Assimilation of highly porous sulfonated carbon nanospheres into Nafion® matrix as proton and water reservoirs. Int. J. Hydrog. Energy 2012, 37, 14482–14491. [Google Scholar] [CrossRef]
  46. Gierke, T.D.; Munn, E.; Wilson, F.C. The morphology in Nafion perfluorinated membrane products, as determined by wide- and small-angle X-ray studies. J. Polym. Sci. Polym. Phys. Ed. 1981, 19, 1687–1704. [Google Scholar] [CrossRef]
  47. Samms, S.R.; Wasmus, S.; Savinell, R.F. Thermal stability of Nafion® in simulated fuel cell environments. J. Electrochem. Soc. 1996, 143, 1498–1504. [Google Scholar] [CrossRef]
  48. Rhee, C.H.; Kim, Y.; Lee, J.S.; Kim, H.K.; Chang, H. Nanocomposite membranes of surface-sulfonated titanate and Nafion® for direct methanol fuel cells. J. Power Sources 2006, 159, 1015–1024. [Google Scholar] [CrossRef]
  49. Zawodzinski, T.A.; Neeman, M.; Sillerud, L.O.; Gottesfeld, S. Determination of water diffusion coefficients in perfluorosulfonate ionomeric membranes. J. Phys. Chem. 1991, 95, 6040–6044. [Google Scholar] [CrossRef]
  50. Zawodzinski, T.A.; Derouin, C.; Radzinski, S.; Sherman, R.J.; Smith, V.T.; Springer, T.E.; Gottesfeld, S. Water uptake by and transport through Nafion® 117 membranes. J. Electrochem. Soc. 1993, 140, 1041–1047. [Google Scholar] [CrossRef]
Figure 1. Water uptake (WU) values of membrane samples obtained through a relative humidity (RH)-controlled box with the presence of appropriate saturated salt solutions.
Energies 09 00272 g001
Figure 2. Number of water molecules per acid site of membrane samples.
Energies 09 00272 g002
Figure 3. Atomic force microscopies (AFM) for the four membranes in three different RH conditions.
Energies 09 00272 g003
Figure 4. AFM image analysis: (a) trends of the hydrophobic; and (b) hydrophilic cluster dimensions.
Energies 09 00272 g004
Figure 5. Peak position attributed to the SO3 vibration mode measured on the pure Nafion™ and on composite membranes in function of RH (a) at room temperature; and (b) at 60 °C.
Energies 09 00272 g005
Figure 6. Differential scanning calorimetry (DSC) traces of the membranes samples (black line) and Lorenztian functions utilized to fit them (gray line).
Energies 09 00272 g006
Figure 7. Derivative thermal gravimetric analysis (TGA) curves of the membrane samples.
Energies 09 00272 g007
Figure 8. Conductivity of the membranes at different temperature (x-axis) and different RH.
Energies 09 00272 g008
Figure 9. Fuel cell performances under 30% RH and 70 °C. H2-Air fed at 2 atm.
Energies 09 00272 g009
Figure 10. Fuel cell performances under 30% RH and 110 °C. H2-Air fed at 2 atm.
Energies 09 00272 g010
Figure 11. Electrochemical impedance spectroscopy (EIS) reported as Nyquist plots recorded in the range 10 kHz–1Hz at different temperature at 30% RH for cells containing the M0 and M5 membranes.
Energies 09 00272 g011
Table 1. Summary of saturated salt solutions used for the samples conditioning at different relative humidity (RH).
Salts for Saturated Aqueous SolutionRH
25 °C60 °C
LiCl11%11%
MgCl233%30%
Mg(NO3)253%40%
NaCl75%62%
KNO394%75%
K2SO4-96%
H2O100%-
Table 2. Properties of the membranes Mx (x stands for % w/w of the filler).
SampleFiller content al bIEC c
M0-1000.97 ± 0.02
M22950.92 ± 0.01
M55950.82 ± 0.01
M77900.97 ± 0.02
a Nominal filler content (% w/w); b thickness of membranes (μm); c Ion-exchange capacity (IEC; meq·g−1).
Table 3. Analysis of DSC measurements.
SampleTonset a (°C)ΔH b (J gpol−1)
M0130 ± 1468 ± 12
M2132 ± 1450 ± 11
M5135 ± 1410 ± 9
M7137 ± 2408 ± 9
a Temperature of the onset of transition; and b Enthalpy normalized for the weight of the polymer.

