Article

Optimal Siting of Charging Stations for Electric Vehicles Based on Fuzzy Delphi and Hybrid Multi-Criteria Decision Making Approaches from an Extended Sustainability Perspective

1
School of Economics and Management, North China Electric Power University, Beijing 102206, China
2
School of Natural Resources and Environment, University of Michigan, Ann Arbor, MI 48108-1041, USA
*
Author to whom correspondence should be addressed.
Energies 2016, 9(4), 270; https://doi.org/10.3390/en9040270
Submission received: 25 January 2016 / Revised: 28 February 2016 / Accepted: 22 March 2016 / Published: 6 April 2016

Abstract

:
Optimal siting of electric vehicle charging stations (EVCSs) is crucial to the sustainable development of electric vehicle systems. Considering the defects of previous heuristic optimization models in tackling subjective factors, this paper employs a multi-criteria decision-making (MCDM) framework to address the issue of EVCS siting. The initial criteria for optimal EVCS siting are selected from extended sustainability theory, and the vital sub-criteria are further determined by using a fuzzy Delphi method (FDM), which consists of four pillars: economy, society, environment and technology perspectives. To tolerate vagueness and ambiguity of subjective factors and human judgment, a fuzzy Grey relation analysis (GRA)-VIKOR method is employed to determine the optimal EVCS site, which also improves the conventional aggregating function of fuzzy Vlsekriterijumska Optimizacijia I Kompromisno Resenje (VIKOR). Moreover, to integrate the subjective opinions as well as objective information, experts’ ratings and Shannon entropy method are employed to determine combination weights. Then, the applicability of proposed framework is demonstrated by an empirical study of five EVCS site alternatives in Tianjin. The results show that A3 is selected as the optimal site for EVCS, and sub-criteria affiliated with environment obtain much more attentions than that of other sub-criteria. Moreover, sensitivity analysis indicates the selection results remains stable no matter how sub-criteria weights are changed, which verifies the robustness and effectiveness of proposed model and evaluation results. This study provides a comprehensive and effective method for optimal siting of EVCS and also innovates the weights determination and distance calculation for conventional fuzzy VIKOR.

1. Introduction

With the rapid economic development and depletion of natural resources, energy shortages and climate change have become severe issues for the sustainable development of the present world. China, as the largest greenhouse gas (GHG) emitter and energy consumer, has proposed the corresponding strategies for energy utilization. In past a few years, urbanization development and an explosive demand for automobiles have stimulated an increase in energy consumption and carbon emissions in the transportation sector. The Chinese transportation sector accounted for about 21% of the total national energy consumption, as well as 7% of China’s gross carbon emissions [1]. Electric vehicles (EVs), as a kind of new environmentally-friendly means of transportation, are an effective way to tackle the problems related to environment pollution and fossil resource utilization [2]. Therefore, the Chinese government has devoted considerable resources to promote the adoption of electric vehicles, and has set up a target of putting five million EVs on the road by 2020 [3]. Meanwhile, a significant amount of investment has been made to subsidize EV manufacturers and buyers, build charging stations and posts, and offer tax breaks and other non-monetary incentives.
Charging infrastructure, as the energy provider of electric vehicles, is critical to the development of an electric vehicle system. The availability of efficient, convenient and economic EVCSs could enhance the willingness to buy of consumers and promote the development of the sector. Low availability of charging infrastructure could hinder EV adoption, which could then in turn reduce incentives to invest in charging infrastructure development [4]. EVCS siting is the preliminary stage of EVCS construction, and has a significant impact on the service quality and operation efficiency of EVCSs during their whole life cycle. Therefore, it is essential to establish a proper framework to determine the optimal sites for EVCSs.
Sustainability in the scope of energy management aims to meet present demand without compromising the energy utilization by future generations. Sustainable development can be realized by renewable resources, cleaner production and more efficient technologies. The “sustainability” in energy management is described as a long-term development integrating three pillars: economic growth, social development and environment protection [5]. To promote the sustainable development of the EV industry, optimal EVCS siting should be performed from a sustainability perspective. Moreover, concerning the diversity of advanced science and technical constraints, technology is another important perspective to determine the optimal site of EVCSs. Therefore, integrating the issues of technology, an extended concept of sustainability is proposed to determine the optimal EVCS site, which has not been addressed in previous studies. In this study, extended sustainability is employed to determine the initial evaluation criteria for optimal siting of EVCSs, which covers four perspectives, such as “economy”, “society”, “environment” and “technology”. On this basis, 13 final sub-criteria are determined by a fuzzy Delphi method (FDM) through a series of intensive questionnaires.
Considering that optimal siting of EVCSs includes multiple factors, a Multiple Criteria Decision Making model is employed to evaluate the performance of all alternatives under conflicting criteria in this study. Vlsekriterijumska Optimizacijia I Kompromisno Resenje (VIKOR) is a compensatory aggregation MCDM method, which has been used to appraise performance in many fields [6,7,8]. VIKOR has a simple and logical computation procedure that simultaneously considers the closeness to positive ideal as well as negative ideal solutions [9]. Due to the increasing complexity of decision-making, more and more qualitative, uncertain and imprecise factors are involved in MCDM problems [10,11], and thus a fuzzy VIKOR method is constructed to determine the fuzzy compromise solutions for multiple criteria, which can efficiently grasp ambiguous information as well as the essential fuzziness of human judgment [12,13,14]. Moreover, Grey relation analysis (GRA) is used to modify the conventional aggregating function of fuzzy VIKOR, which can better measure the distance between fuzzy numbers as well as give a ranking order of alternatives with precise numbers [15,16,17,18]. On the other hand, in the application of VIKOR for optimal siting of EVCSs, weighting determination turns out to be crucial for the final ranking of alternatives. To obtain a better weights determining system for fuzzy VIKOR, a combination weights system based on subjective judgment and objective information are introduced in this study. The subjective weights are determined by experts’ opinions, and the objective weights are obtained by the Shannon entropy method. Therefore, in our research, a hybrid framework on the basis of FDM, combination weights and fuzzy GRA-VIKOR methods will be employed to determine the optimal sites for EVCSs.
The remainder of this paper is organized as follows: a review of the literature related to the EV industry, optimal EVCS site determination, and the main contributions of this research can be found in Section 2. In Section 3, the basic theories of related methods are elaborated. Section 4 presents the proposed framework for optimal siting of electric vehicle station. The evaluation index system for optimal siting of EVCSs is established by FDM in Section 5. Section 6 performs the EVCS siting by employing combination weighting and a fuzzy GRA-VIKOR model. Results discussion and sensitivity analysis are performed to check the rationality and robustness of the proposed model and results in Section 7. Conclusions are drawn in Section 8.

2. Literature Review

The construction of electric vehicle charging stations is important in the whole life cycle of the electric vehicle industry. Meanwhile, an appropriate site and capacity for EVCS can not only benefit the related stakeholders, but also promote the sustainable development of the EV industry. Over the last decade, many studies related to the economic and environmental benefit, influence and technology in the EV industry have been conducted. Simpson [19] presented a comparison of the costs (vehicle purchase costs and energy costs) and benefits (reduced petroleum consumption) of PHEVs related to hybrid-electric and conventional vehicles. By 2011 little was known about the economic rationale for public fast chargers for electric vehicles, Schroeder et al. [20] aimed to provide an insight into the business case for this technology in a case study for Germany. Hawkins et al. [21] developed and provided a transparent life cycle inventory of conventional vehicles and electric vehicles, which verified that EVs have decreased global warming potential (GWP) relative to conventional diesel or gasoline vehicles. Matsuhashi et al. [22] developed a process-relational model to estimate lifecycle CO2 emissions from electric vehicles (EVs) and gasoline vehicles (GVs), which indicated that the manufacture and driving of EVs produces less CO2 emissions than that of GVs. Putrus et al. [23] analyzed the impact of electric vehicles on existing power distribution networks, including supply/demand matching and potential violations of statutory voltage limits, power quality and imbalance. Clement-Nyns et al. [24] pointed out that uncoordinated power consumption on a local scale would lead to grid problems, and computed the optimal charging profile of plug-in hybrid electric vehicles by minimizing the power losses and maximizing the main grid load. Mets et al. [25] presented smart energy control strategies based on quadratic programming for charging PHEVs, aiming to minimize the peak load and flatten the overall load profile. Rivera et al. [26] proposes a novel architecture for PEV DC charging stations by using a grid-tied neutral point clamped converter.
Research focused on siting and sizing of EVCSs has received much more attention in recent years. Liu et al. [27] presented a modified primal-dual interior point algorithm to solve the optimal sizing of EV charging stations, in which environmental factors and the service radius of EV charging stations were considered. Wirges et al. [28] presented a dynamic spatial model of a charging infrastructure development for electric vehicles in the German metropolitan region of Stuttgart, and generated several scenarios of a charging infrastructure development until 2020. Jia et al. [29] introduced an optimization process for the sizing and siting of electric vehicle charging stations with minimized integrated cost of charging stations and consumers’ costs, in which the charging demand and road network structure were variables. Aiming at minimizing users’ losses on the way to the charging station, Ge et al. [30] determines the best location by using a Genetic Algorithm (GA) considering the traffic density and the charging station’s capacity constraints. Xi et al. [31] developed a simulation–optimization model to determine the location of electric vehicle chargers, and explored the interactions between the optimization criterion and the available budget. Sathaye et al. [32] utilized a continuous facility location model for optimally siting electric vehicle infrastructure in highway corridors, and carefully dealt with the influence of demand uncertainty. Pashajavid et al. [33] proposed a scenario optimization based on a particle swarm optimization (PSO) algorithm to allocate charging stations for plug-in electric vehicles (PEVs), and a multivariate stochastic modeling methodology based on the notion of copula is provided in order to develop a probabilistic model of the load demand due to PEVs. Zi et al. [34] presented an adaptive particle swarm optimization (APSO) algorithm to optimize the siting and sizing of electric vehicle charging stations, which considered geographic information, construction costs and running costs. In order to install alternative fuel charging stations at suitable locations for alternative-fuel vehicles (AFVs), You et al. [35] developed a mixed-integer programming model to address budget limitations and to maximize the number of people who can complete round-trip itineraries. Yao et al. [36] developed a multi-objective collaborative planning strategy to address the optimal planning issue in integrated power distribution and EV charging systems, in which the overall annual cost of investment and energy losses are minimized simultaneously with maximization of the annual traffic flow captured by fast charging stations (FCSs). An equilibrium-based traffic assignment model and decomposition-based multi-objective evolutionary algorithm were developed for obtaining the optimal solution. Sadeghi et al. [37] presented a Mixed-Integer Non-Linear (MINLP) optimization approach for the optimal placement and sizing of fast charging stations, which considered the station development cost, EV energy loss, and electric gird loss as well as the location of electric substations and urban roads. Chung et al. [38] formulated a multi-period optimization model based on a flow-refueling location model for strategic charging station location planning, and then developed a case study based on the real traffic flow data of the Korean Expressway network in 2011.
After analyzing the literature, it can be concluded that the majority of existing studies related to the optimal siting of EVCSs are concentrated on Multi-Objective Decision Making (MODM) methods, such as linear/nonlinear programming, stochastic programming, mixed-integer programming and multilayer programming. In most cases, heuristic algorithms such as GA and PSO were applied to tackle the optimal solution. However, there are two major critiques with such MODM approaches. First, although the aforementioned optimization models are remarkable it is less likely they can be implemented in practice due to the complexity of modeling real-world problems. Second, optimization models can only account for quantitative variables such as construction cost and running cost, electric grid loss, EV energy loss and so on, but are not capable of modeling important qualitative variables such as ecological environment (e.g., deterioration on soil and vegetation), etc.
In view of this, herein another kind of decision-making method, i.e., the Multiple-Criteria Decision-Making method will be employed to determine the optimal site of electric vehicle charging stations from an extended sustainability perspective. The MCDM method can comprehensively capture the quantitative and qualitative criteria that both play important roles in EVCS site selection. The main contributions of this paper are as follows:
(1)
This is the first study that involves both quantitative and qualitative criteria for EVCS siting from an extended sustainability perspective, which overcomes the defects of traditional mathematical programming in addressing qualitative but nevertheless important factors.
(2)
The conventional concept of sustainability is improved through integrating the issues of technology, namely economy, society, environment and technology perspectives, which have not been considered in previous studies. In this study, the initial criteria are established based on extended sustainability. Furthermore, to obtain the most reliable consensus among a group of experts in a shorter time, FDM is employed to determine the final sub-criteria for EVCS site selection.
(3)
The fuzzy VIKOR method, which shows good performance in the decision-making of alternatives selection, has been applied in many fields. To the best of our knowledge, this is a novel hybrid MCDM technique based on combination weights and fuzzy GRA-VIKOR for the optimal siting of EVCSs, which also extends the application domains of the fuzzy VIKOR method. The proposed model addresses the fuzziness and uncertainty of subjective factors and human judgment, and additionally it considers subjective and objective information within the weights calculation process. Moreover, GRA are used to measure the distances of fuzzy numbers between alternatives to ideal solutions in this study, which can better measure the distance between fuzzy numbers as well as provide a ranking order of alternatives with precise numbers.
(4)
Since experts with various knowledge backgrounds may have different priorities as their main objective, it is essential to probe the impacts of sub-criteria weights on the final results. This study is the first paper to research the economy, society, environment and technology perspectives for optimal siting of EVCSs by changing the sub-criteria weights.

3. Research Method

3.1. Fuzzy Logic

Fuzzy theory, proposed by Zadeh in 1965, is used to map linguistic terms to numerical terms within human decisions. The fuzzy set is often defined to solve the uncertainty and vagueness in criteria weighting and alternatives ratings of multi-criteria decision making problems [39]. A fuzzy set, featured by a membership function, assigns each criterion a membership rating among (0, 1), reflects criteria grades belonging to a set. In addition, linguistic terms such as “good”, “fair” and “bad” are put forward to define numerical intervals [40].
A triangular fuzzy number M ˜ , denoted by (a,b,c), is the most popular fuzzy number in fuzzy applications [41]. The membership function is defined as follows:
μ M ( x ) = { x a b a , a x b c x c b , b x c 0 , o t h e r w i s e
and –∞ < axb < ∞.
In concrete terms, the membership function μ M ( x ) = 1 indicates that variable x fully belongs to the fuzzy set M ˜ . Conversely, if the variable x does not belong to the fuzzy set M ˜ , then μ M ( x ) = 0 [42].
Let M ˜ 1 = ( l 1 , m 1 , r 1 ) and M ˜ 2 = ( l 2 , m 2 , r 2 ) be two triangular fuzzy numbers, the operation laws are shown as below:
M ˜ 1 M ˜ 2 = ( l 1 + l 2 , m 1 + m 2 , r 1 + r 2 )
M ˜ 1 M ˜ 2 ( l 1 l 2 , m 1 m 2 , r 1 r 2 )
λ M ˜ 1 = ( λ l 1 , λ m 1 , λ r 1 ) , λ > 0
M ˜ 1 1 ( 1 / l 1 , 1 / m 1 , 1 / r 1 )
And the distance of M ˜ 1 = ( l 1 , m 1 , r 1 ) and M ˜ 2 = ( l 2 , m 2 , r 2 ) can be defined as follows [43]:
d ( M ˜ 1 , M ˜ 2 ) = 1 2 0 1 [ l 1 + ( m 1 l 1 ) α + r 1 ( r 1 m 1 ) α l 2 ( m 2 l 2 ) α r 2 + ( r 2 m 2 ) α ] d α
In most MCDM processes, decision makers often provide uncertain answers rather than precise values. Linguistic values and fuzzy set theory are recommended to rate preference instead of traditional numerical method. Therefore, the fuzzy set theory has been integrated into various MCDM methods, such as fuzzy AHP, fuzzy TOPSIS, fuzzy VIKOR, and so on, which should be more appropriate and effective than conventional ones in real problems involving uncertainty and vagueness [44,45,46].

3.2. Fuzzy Delphi Method

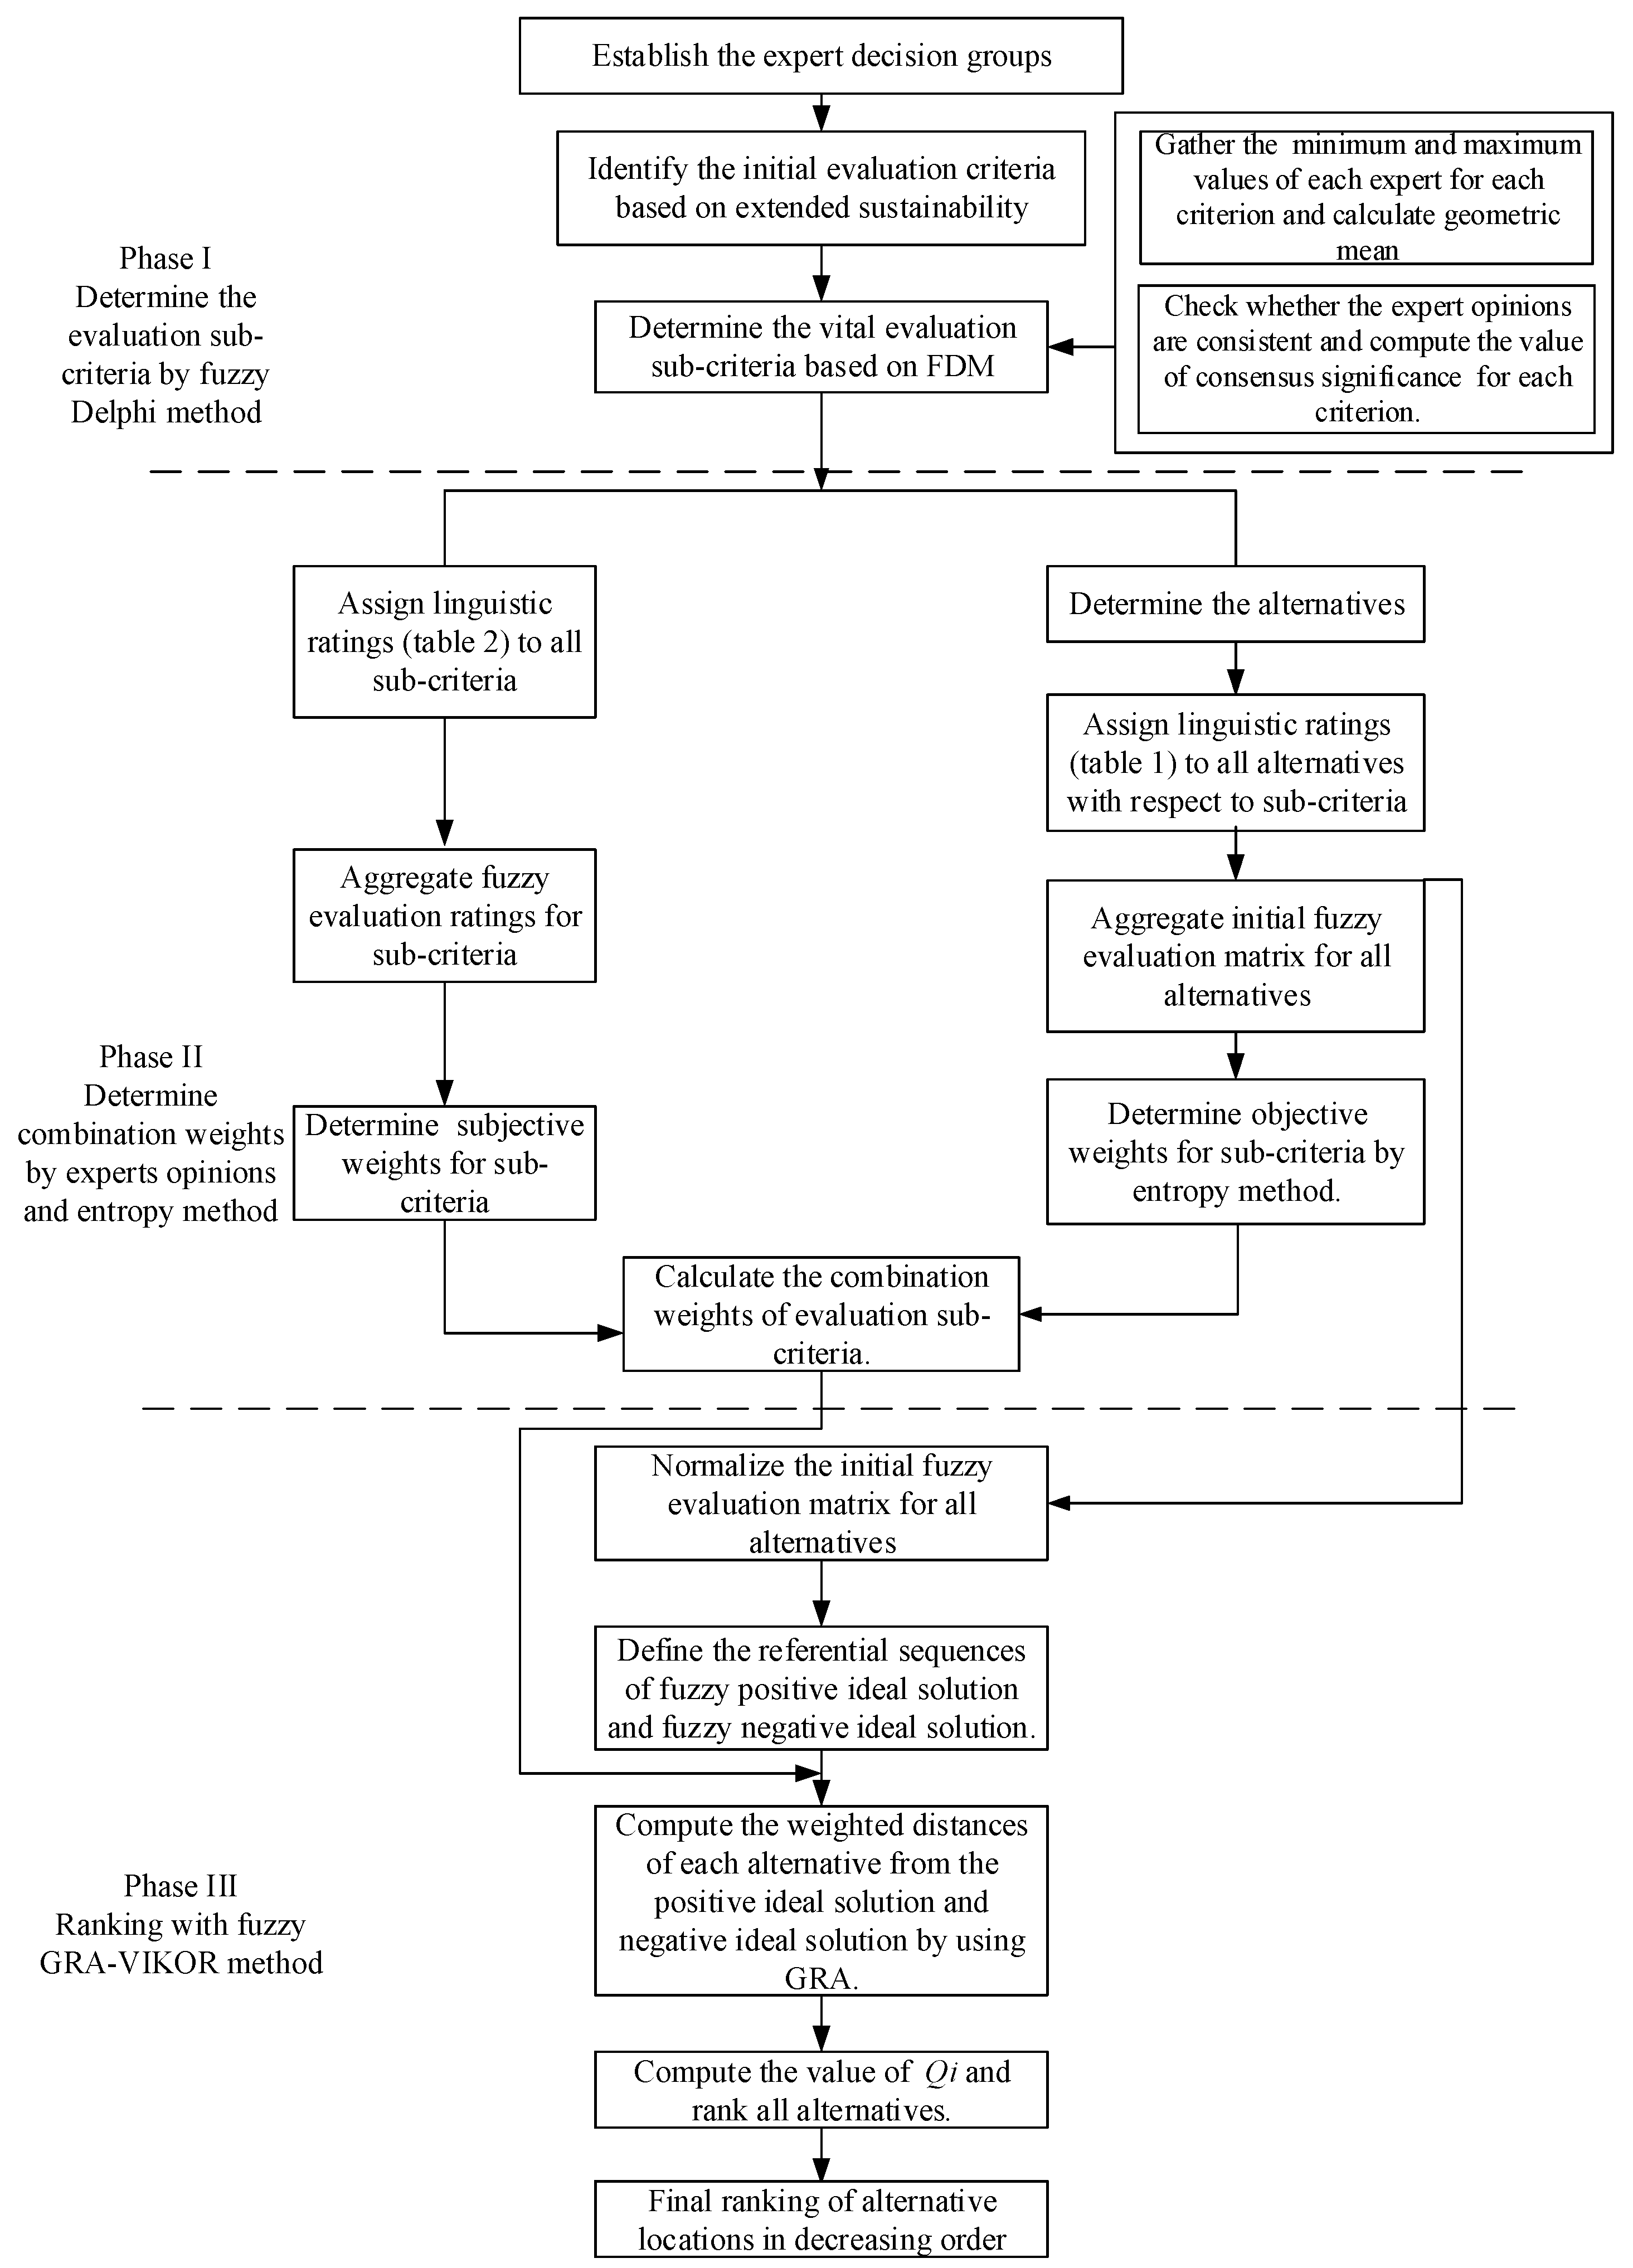
The Delphi method (DM) is a technique used to obtain the most reliable consensus among a group of experts. It was proposed by Dalky and Helmer in 1963 and has been widely used in decision and prediction making. This technique offers experts opportunities to receive feedback and modify previous opinions through several rounds of consulting. Furthermore, owning to its deficiency in handling ambiguity and uncertainty within expert surveys, fuzzy Delphi method (FDM) was proposed to solve these defects combing DM with fuzzy logic theory. Experts can provide their opinions through triangular fuzzy numbers (TFNs), and are not required to modify them again and again. Moreover, no useful information would be lost, because all opinions can be effectively taken into account by the membership degrees. Due to its advantages in evoking group decisions, FDM is embraced in various studies to construct evaluation. To recognize the vital criteria for the optimal siting of EVCS, the FDM is introduced in this paper. Essential steps of the FDM are listed as follows:
Step 1: Administer questionnaires and determine the most conservative value and the most optimistic value ranging from 0 to 10 for each criterion among a group of experts.
Step 2: Gather the minimum and maximum values and calculate the geometric mean for each criterion. Then, compute the conservative TFN ( C L i , C M i , C U i ) and optimistic TFN ( O L i , O M i , O U i ) in terms of each criterion. C L i and O L i represent the minimum remaining conservative value and minimum remaining optimistic value, respectively; C U i and O U i represent the maximum remaining conservative value and maximum remaining optimistic value, respectively; and C M i and O M i represent the geometric mean of the remaining conservative value and the geometric mean of the remaining optimistic value, respectively.
Step 3: Check that the consistency of expert opinions, and compute the consensus significance Gi for each criterion.
(1)
If C U i O L i , the criterion i holds consensus, and the value of the consensus significance Gi is computed by Equation (7):
G i = G M i + O M i 2
(2)
If C U i > O L i , and the gray zone interval value ( Z i = C U i O L i ) is smaller than the interval value M i = O U i C M i , correspondingly, the value of the consensus significance is computed by Equation (2):
G i = [ ( C U i × O M i ) ( O L i × C M i ) ] [ [ ( C U i C M i ) + ( O M i O L i ) ] ]
When C U i > O L i , however, the gray zone interval value ( Z i = C U i O L i ) is greater than the interval value ( M i = O U i C M i ), which means that the expert opinions are inconsistent. Thus, Steps 1–3 should be repeated until each criterion converges and the value of the consensus significance can be calculated.

3.3. Fuzzy GRA-VIKOR Method

The Vlsekriterijumska Optimizacijia I Kompromisno Resenje (VIKOR) method, put forward by Opricovic in 1998, was developed for multi-criteria optimization of complex systems. This model focuses on ranking different alternatives against various even conflicting decision criteria. It relies on an aggregating function that can reflect distance to both positive and negative ideal points [47]. In order to handle the imprecision and subjectivity of decision makers, linguistic values are introduced into the conventional VIKOR. The fuzzy VIKOR combines the advantages of the conventional VIKOR and fuzzy set theory, which is much more sufficient to model problems in the real world than precise values [12,13,14,48,49].
In fuzzy VIKOR, the multi-criteria measurement process for ranking alternatives is developed from an aggregating function, which represents the distance of each alternative from positive ideal point and negative ideal point. As mentioned in the introduction, in order to better examine the extent of the connection between alternative and ideal points, grey relation analysis is used to modify the conventional aggregating function, which can better identify relationships among fuzzy numbers in a system [15,16]. Moreover, the fuzzy VIKOR based on GRA method can efficiently overcome the deficiencies of fuzzy results and the inconsistent ranking of alternatives [17,18]. More details of this approach are shown as below:
Here, the ratings of criteria are expressed in linguistic terms (the triangular fuzzy numbers), as in Table 1.
Step 1. Calculate the aggregated fuzzy linguistic ratings for criteria performance of alternatives.
Suppose that there are m alternatives A = {A1,A2,…Am} to be evaluated. The performance of n criteria are by linguistic terms which are obtained from r decision makers.
Let x ˜ i j k = ( x i j k L , x i j k M , x i j k U ) , 0 x i j k L x i j k M x i j k U 1 , i = 1 , 2 , m , j = 1 , 2 , n , k = 1 , 2 , r be the linguistic rating on the performance criteria Cj respect to alternative Ai by expert Ek. Then the aggregated fuzzy linguistic rating x ˜ i j = ( x i j L , x i j M , x i j U ) can be obtained as follows:
x ˜ i j = ( x i j L , x i j M , x i j U ) = ( k = 1 r x i j k L r , k = 1 r x i j k M r , k = 1 r x i j k U r )
Step 2. Assemble the initial fuzzy decision matrix.
According to Equation (9), the initial fuzzy decision matrix D ˜ can be obtained, as shown in Equation (10). A MCDM problem can be expressed concisely in the form of triangular fuzzy number, as follows:
D ˜ = ( x ˜ i j ) m × n = [ x ˜ 11 x ˜ 12 x ˜ 1 n x ˜ 21 x ˜ 22 x ˜ 2 n x ˜ m 1 x ˜ m 2 x ˜ m n ] = [ ( x 11 L , x 11 M , x 11 U ) ( x 12 L , x 12 M , x 12 U ) ( x 1 n L , x 1 n M , x 1 n U ) ( x 21 L , x 21 M , x 21 U ) ( x 22 L , x 22 M , x 22 U ) ( x 2 n L , x 2 n M , x 2 n U ) ( x m 1 L , x n 1 M , x n 1 U ) ( x m 2 L , x m 2 M , x m 2 U ) ( x m n L , x m n M , x m n U ) ]
Step 3. Normalize the initial fuzzy decision matrix using linear scale transformation.
To ensure the compatibility among evaluation criteria, the initial fuzzy decision matrix should be transformed into a comparable scale. The normalized fuzzy decision matrix is denoted by R ˜ [50]:
R ˜ = [ r ˜ i j ] m × n
For the benefit criteria:
r ˜ i j = ( x i j L u i j + , x 12 M u i j + , x 12 U u i j + )   and   u i j + = max i x i j U
For the cost criteria:
r ˜ i j = ( u i j x i j L , u i j x i j M , u i j x i j U )   and   u i j = min i x i j L
Step 4. Define the referential sequences of fuzzy positive ideal solution and negative ideal solution.
The referential sequences of positive ideal solution A+ and negative ideal solution A can be determined as follows:
A + = [ r ˜ 01 + , r ˜ 02 + , r ˜ 0 n + ] , A = [ r ˜ 01 , r ˜ 02 , r ˜ 0 n ]
where r ˜ 0 j + = max i ( r ˜ i j ) , r ˜ 0 j = min i ( r ˜ i j ) , j = 1,2,…n
Step 5: Compute the distances of each alternative from the positive ideal solution and negative ideal solution [51].
S ˜ i = j = 1 n w j ( r ˜ 0 j + r ˜ i j r ˜ 0 j + r ˜ 0 j )
R ˜ i = max j [ w j ( r ˜ 0 j + r ˜ i j r ˜ 0 j + r ˜ 0 j ) ]
i = 1 , 2 m , j = 1 , 2 n
where wj represents the weight of criteria Cj, S ˜ i denotes the distance rate of Ai to the positive ideal solution A+, and R ˜ i denotes the distance rate of Ai to the negative ideal solution A.
In order to better reflect distance of each alternative to the positive and negative ideal points, the fuzzy grey relation coefficient (FGRC) is introduced to modify the conventional formula of fuzzy VIKOR, which are shown as follows [16]:
γ ( r ˜ 0 j u , r ˜ i j ) , u = + , γ ( r ˜ 0 j u , r ˜ i j ) = min i min j d ˜ i j u + ξ max i max j d ˜ i j u d ˜ i j u + ξ max i max j d ˜ i j u = min i min j d ˜ ( r ˜ 0 j u , r ˜ i j ) + ξ max i max j d ˜ ( r ˜ 0 j u , r ˜ i j ) d ˜ ( r ˜ 0 j u , r ˜ i j ) + ξ max i max j d ˜ ( r ˜ 0 j u , r ˜ i j )
S ˜ i = j = 1 n w j γ ( r ˜ 0 j + , r ˜ i j )
R ˜ i = max j w j γ ( r ˜ 0 j , r ˜ i j )
Step 6: Compute the value of Qi for each alternative as below:
Q i = ν S i S + S S + + ( 1 ν ) R i R + R R +
where S+ = maxiSi, S = miniSi, R+ = maxiRi, R = miniRi, and v is the weight of the strategy of “the maximum group utility”, whereas (1–v) represents the weight of the individual regret.
Step 7: Rank the alternatives according to the value of Qi in Step 5.
On the basis of the concepts of GRA and fuzzy VIKOR method, all alternatives can be ranked by the value of Qi. Obviously, for the alternative Ai which is closer to the positive ideal point and farther from the negative ideal point, the value of Qi is zero.
In addition, only when the alternative which is the best ranked by the value of Qi satisfies the following conditions, it can be selected as the optimal solution.
(I)
Acceptable advantage:
Q ( A ( 2 ) A ( 1 ) ) D Q
where A(2) is the second in the list of priorities by Qi; DQ = 1/(N–1), N is the number of alternatives [51].
(II)
Acceptable stability in decision-making:
The alternative A(1) must also be the best ranked by S ˜ i or Ri. This compromise solution is stable within the decision-making process, which could be the strategy of maximum group utility (when v > 0.5 is needed), or “by consensus” (v ≈ 0.5), or “with veto” (v < 0.5). If one of the conditions is not satisfied, then the set of solutions is proposed [16], which consists of:
A(1) and A(2), if only the condition (II) is not satisfied, or
A(1),A(2),A(3),…A(M), if the condition (II) is not satisfied; A(M) is determined by the relation Q(A(M)A(1)) < DQ, for maximum M (the positions of these alternatives are “in closeness”).

3.4. The Combination Weights

The weighted sum of the “distances” from an alternative to corresponding ideal points over all criteria is essential for performance comparison among all designated alternatives. From the previous literature on MCDM, the weights of criteria are usually subjective weights determined by decision makers. However, critiques of human errors and inconsistency are often associated with subjective weights for such weighting processes in MCDM. With this regard, to improve the weighting accuracy, some objective weighting models are applied by mathematical techniques. To obtain a better weight determining system for fuzzy VIKOR, combination weights based on subjective methods and objective methods are introduced in this study, which can composite subjective judgment and objective information. On the one hand, the subjective weights are determined by experts’ opinions. On the other hand, the objective weights are obtained by the Shannon entropy method.

3.4.1. The Subjective Weights

On the one hand, the subjective weights could be obtained from experts’ opinions. Here, the ratings of criteria are expressed in linguistic terms (the triangular fuzzy numbers), as in Table 2.
Let s ˜ j k = ( s j k L , s j k M , s j k U ) , 0 s j k L s j k M s j k U 1 , j = 1 , 2 , n , k = 1 , 2 , r be the superiority linguistic rating on criteria weight assigned to criteria Cj by expert Dk can be calculated by:
s ˜ j k = ( s j k L , s j k M , s j k U ) = ( k = 1 r s j k L r , k = 1 r s j k M r , k = 1 r s j k U r )
In order to maintain the consistency between objective weights and subjective weights, the criteria weights based on triangular fuzzy numbers should be also defuzzied based on Equation (21). In this paper, the graded mean integration approach is employed to transform a triangular fuzzy number M = (l,m,u) into a precise number:
P ( M ˜ ) = M = l + 4 m + u 6

3.4.2. Shannon Entropy and Objective Weights

The entropy concept proposed by Shannon in 1948 is a measure of uncertainty in formulated information, which has been widely used in many fields such as management, engineering and so on. According to the ideal of entropy theory, the number or quality of information from decision-making process is determined by the accuracy and reliability of the decision-making problem [52]. Therefore, entropy can be applied to the assessment problem in different decision-making processes. Moreover, entropy can also be used to analyze the quantity of information provided by data [53]. The basic theory and specific steps of Shannon entropy weighting method are shown as below:
Shannon entropy is capable of evaluating the decision making units and being employed as a weighting decision method. Assume that a MCDM problem contains m alternatives and n criteria, thus the decision making matrix is defined as below:
[ x 11 x 12 x 1 n x 21 x 22 x 2 n x m 1 x m 2 x m n ]
Then, the criteria weights can be determined based on the entropy concept through the following steps:
Step 1: Normalize the evaluation criteria as below:
P i j = x i j j x i j
Specially, for the fuzzy MCDM problem, the fuzzy decision making matrix should be defuzzyed firstly, according to Equation (21).
Step 2: Calculate the entropy measure of each criterion as [51]:
e j = k j = 1 n P i j ln ( P i j )
where k = (ln(m))–1.
Step 3: Define the divergence of each criterion through:
d i v j = 1 e j
The more the divj is, the more important the jth criterion is.
Step 4: Determined the normalized weights of all criteria through [54]:
w j = d i v j j d i v j
Finally, the combination weights of all criteria are equal to the average of subjective and objective weights.

4. The Framework of the Integrated MCDM Model

The proposed framework for optimal siting of electric vehicle station based on FDM, combination weighting and fuzzy GRA-VIKOR methods involves the following three phases (Figure 1).

Phase 1: Identify the vital evaluation sub-criteria based on extended sustainability and FDM

In the first phase, professors, scholars, residents, governors, EV users and producers, as well as the project management personnel in the field of electric power system, electric vehicle industry, transportation system and sustainability are selected to establish three expert decision groups. According to the extended sustainability concept and industry background, the initial evaluation criteria are determined, which are associated with economy, society, environment and technology perspectives. Further, the vital (final) sub-criteria for optimal siting of EVCS are determined based on FDM technique.

Phase 2: Determine the combination weights of the evaluation sub-criteria based on the fuzzy experts’ ratings and entropy approach

In this step, the vital (final) evaluation sub-criteria are weighted by integrating the subjective weights and objective weights. For the subjective weights, three groups of experts firstly assign linguistic ratings to all sub-criteria by using the rating scales given in Table 2. Then, the fuzzy evaluations for sub-criteria are aggregated and the subjective weights for sub-criteria can be computed. On the other side, for the objective weights based on entropy method, linguistic ratings to all alternatives with respect to sub-criteria are firstly allocated by using rating scales in Table 1, and then are transformed to triangular fuzzy numbers. After aggregating the initial fuzzy evaluation matrix for all alternatives, the objective weights for all sub-criteria are determined by using entropy method. Based on above results, the combination weights for all sub-criteria are eventually aggregated by combining subjective weights and objective weights simultaneously.

Phase 3: Rank all alternatives for EVCS and determine the optimal site using the fuzzy GRA-VIKOR

In this step, the normalized fuzzy decision matrix is assembled based on the aggregated initial fuzzy evaluation matrix in phase 2. Next, define the referential sequences of fuzzy positive ideal solution and negative solution. Then, the GRA method is employed to compute the weighted distances of each alternative from ideal solutions. Finally, all EVCS site alternatives are ranked in a descending order of performance based on the values of Qi.

5. Evaluation Index System for Optimal Siting of Vehicle Charging Station

Evaluation criteria are very important to the optimal EVCS siting. It is important to establish an evaluation index system to comprehensively reflect the inherent characteristics of EVCS siting. However, the electric-vehicle industry is still in the early stages of management and technological exploration, so there is no consistent list of criteria for EVCS site selection in China. Since electric vehicles are a sustainable way of energy development, the evaluation index system for optimal EVCS siting is built from the perspective of extended sustainability. The conventional sustainability theory put forward a new development way which can achieve economic growth and social development without environmental damage, and sustainability is designed as economy sustainability, society sustainability and environment sustainability. Moreover, since EVCS construction involves large numbers of technical conditions, the technology sustainability is introduced to improve the classical idea of sustainability. Therefore, the evaluation index system for optimal EVCS siting includes economy criteria, society criteria, environment criteria and technology criteria. Further, the sub-criteria that are affiliated with above four criteria are determined by fuzzy Delphi method as follows.
First of all, based on the extended sustainability theory, academic literatures and feasibility reports of EVCS, 37 initial sub-criteria are collected according to relative industry standards and expert consultation, in which economy, society, environment and technology are covered. Furthermore, the vital sub-criteria are selected as the final evaluation sub-criteria based on the FDM.
Experts firstly express their opinions on the sub-criteria importance through conservative and optimistic values. And the scores of sub-criteria lies on the scale from 0 to 10. Subsequently, according to Equations (1) and (2), the conservative TFN ( C L i , C M i , C U i ) and optimistic TFN ( O L i , O M i , O U i ) of each expert respect to each criterion are calculated (Table 3). Then, the consistency of the experts’ opinions are verified by calculating the values of Zi and Mi. Finally, the vital sub-criteria are determined based on the consensus value Gi. Particularly, the threshold value of Gi in is set to 6.0, which has been accepted by more than 92% of experts [15]. Therefore, 13 evaluation sub-criteria are selected to realize the optimal site selection of vehicle charging station (Table 3). The evaluation index system is summarized in the flowchart shown in Figure 2.

6. Empirical Analysis

Tianjin is one of the most famous modern cities in China, which has been devoted to developing the electric-vehicle industry. In order to promote the sustainable development and management of the EV industry in Tianjin city, it is necessary to select the optimal sites for EVCSs. After reviewing the project feasibility research reports, the expert groups finally determine five EVCS site alternatives. The geographical locations of these five alternatives are shown in Figure 3. Five alternatives Ai(1,2,…5) are located in the Beichen district, Dongli district, Nankai district, Jinnan district and Tanggu district in Tianjin, respectively.
The MCDM problem related to optimal siting of EVCS includes four criteria (economy, society, environment and technology) and thirteen sub-criteria. After reviewing the literatures and research reports related to all alternatives, each experts group give the linguistic ratings judgments for sub-criteria weights and sub-criteria performance of all alternatives. The rating results are listed in Table 4 and Table 5.
Then, according to Table 4 and Equations (9) and (10), the initial fuzzy decision matrix D ˜ can be obtained, as below:
D ˜ = [ C 1 C 2 C 3 C 4 C 5 ( 0.50    0.30    0.21 0.43    0.27    0.20 0.75    0.38    0.25 0.25    0.19    0.17 1.00    0.50    0.30 ) ( 0.38    0.59    0.81 0.27    0.49    0.70 0.70    0.89    1.00 0.24    0.43    0.65 0.38    0.59    0.78 ) ( 0.29    0.18    0.14 0.50    0.25    0.17 1.00    0.40    0.22 0.20    0.14    0.11 0.25    0.17    0.13 ) ( 0.23    0.46    0.69 0.34    0.57    0.80 0.57    0.80    1.00 0.29    0.51    0.74 0.51    0.74    0.97 ) ( 0.33    0.55    0.79 0.30    0.55    0.79 0.55    0.79    1.00 0.24    0.48    0.73 0.48    0.73    0.94 ) C 6 C 7 C 8 C 9 C 10 ( 0.26    0.46    0.69 0.29    0.51    0.74 0.63    0.83    1.00 0.29    0.51    0.74 0.51    0.74    0.94 ) ( 0.44    0.67    0.86 0.33    0.56    0.78 0.61    0.83    1.00 0.11    0.28    0.50 0.36    0.56    0.75 ) ( 0.17    0.10    0.07 0.20    0.11    0.08 1.00    0.29    0.14 0.14    0.09    0.07 0.20    0.11    0.08 ) ( 0.21    0.42    0.63 0.42    0.63    0.84 0.68    0.87    1.00 0.11    0.24    0.42 0.47    0.68    0.87 ) ( 0.51    0.72    0.90 0.36    0.56    0.77 0.67    0.87    1.00 0.26    0.46    0.67 0.62    0.82    0.97 ) C 11 C 12 C 13 ( 0.06    0.23    0.46 0.34    0.57    0.80 0.63    0.83    0.97 0.14    0.34    0.57 0.57    0.80    1.00 ) ( 0.11    0.08    0.06 0.14    0.09    0.07 1.00    0.25    0.13 0.08    0.06    0.05 1.00    0.25    0.13 ) ( 0.23    0.17    0.14 0.50    0.28    0.19 1.00    0.42    0.25 0.25    0.18    0.14 1.00    0.42    0.25 ) ]
According to Table 4, Equations (20) and (21), the subjective weights of sub-criteria can be obtained. On the other side, the objective weights of sub-criteria can also be obtained by fuzzy decision matrix D ˜ and Equations (21)–(26). Finally, the combination weights of all sub-criteria equal to the average of subjective and objective sub-criteria weights, which are shown in Table 6, can be obtained that C2, C4, C5, C6, C7, C10, C11 are benefit sub-criteria and C1, C3, C8, C9, C12, C13 are cost sub-criteria.
The normalized fuzzy decision matrix can be obtained based on Equations (11) and (12). Then the distances of alternatives from the positive ideal solutions and negative ideal solutions can be calculated according to Equations (6) and (16)–(18). Finally, compute the values of Qi for five EVCS site alternatives according to Equation (13). And thus rank and determine the optimal site for EVCS based on the principle of VIKOR. The results are shown in Table 7.
Obviously, EVCS site alternative A3 outranks other four alternatives. Therefore, A3, namely the EVCS site in Nankai district of Tianjin should be selected as the optimal EVCS site.

7. Discussion

The EVCS site alternatives are ranked by using FDM, combination weights and fuzzy GRA-VIKOR methods. Based on the Qi, the ranking of all EVCS selections in descending order are A3, A5, A2, A1 and A4. The best alternative is found to be A3, and the second best alternative is A5. Based on above results, this proposed model can easily evaluate and select a best alternative. In this section, to examine the rationality and stability of the proposed framework and analysis results, the sensitivity analysis of ν value and sub-criteria weights are presented.
Table 6 shows that the sub-criteria C9 and C10 affiliated with the environmental aspect obtain much more attention from the expert group, which reflects the strategy and energy saving and environment protection goals of the Chinese government. Meanwhile, the sub-criteria affiliated with economic development are not so important as before, which is consistent with the development goals of China. As we all know, in recent years, transportation and electricity industry has suffered pressures and challenges from the “twelfth five-year” plan and the environmental protection law of China, which indicates the responsibility and target of these industries for environment protection. Moreover, the severe environment and resource issues have posed undesirable conditions to humans for living. Therefore, the environmental aspect has been given more consideration by experts for the optimal siting for EVCSs in China.
As mentioned above, this study uses the variation of v values to demonstrate that all of them do not affect the analysis results (Figure 4). The v values are postulated to change from 0.1 to 0.9, while the ranking orders of five EVCSs are same, namely A3 > A5 > A2 > A1 > A4. And thus, this study can confirm that the results obtained by using the proposed model are reliable and effective.
Next, a sensitivity analysis on the impacts of sub-criteria weights for optimal EVCS siting is presented, so as to obtain better insight of evaluation results and verify the robustness of evaluation results. According to the criteria, thirteen sub-criteria are divided into four analysis aspects, namely economy, society, environment and technology. All sub-criteria have 10%, 20% and 30% less weight than the base weight and 10%, 20% and 30% more weight than the base weight (all base weights are shown in Table 6).
It can be seen that in Figure 5, the Qi of A5 and A1 decrease when the sub-criterion C1 becomes less important. The Qi of A2 increases when the weight of C1 becomes more important, and it ranks fourth, surpassed by A1. However, no matter how the C1 weight changes, the Qi of A3 always has the lowest score, indicating the best alternative. As C2 is given more importance, only the Qi of A2 shows a small rising tendency, while the scores of other alternatives remain relatively stable although C2 carries large weight in the optimal EVCS siting. In the case of C3, the Qi of A1 and A5 dramatically rise along with weight increase, which gets closer to that of A4 and A2, respectively. A3 and A4 are still the optimal and worst sites the same as in the base case. Apparently, C1 and C3 are sensible sub-criteria which dramatically affect the optimal EVCS siting results. However, no matter how the weights in the economy group change, A3 is always the best choice in the optimal siting of EVCS in Tianjin.
The case where the society sub-criteria have 10%, 20% and 30% more or less weight than the base weight are shown in Figure 6. The Qi scores of the five EVCSs have tiny variations, no matter how the sub-criteria C4, C5, C6 and C7 change. Therefore, the sub-criteria in the society group are not sensitive factors, and A3 and A4 are the optimal and worst site in the optimal siting for EVCSs, no matter how the sub-criteria weights in the society group change.
For the sub-criteria in the environment group, the Qi of A1, A2 and A5 increase when the sub-criteria C8 becomes more important, and A2 ranks third, surpassed by A1(Figure 7). Meanwhile, the score of A3 and A4 remain stable with the weight variation of C8. For the weight changes of C9, scores of A1, A2 and A5 show a decreasing tendency along with increase of weights, while the rank of all alternatives keep consistent with the base situation. In the case of C10, the Qi of the five alternatives remain stable with increasing weight. Therefore, C8 in the sensitive sub-criterion which obviously affects the EVCS site selection results. No matter how the weights in the economy group change, A3 is always the best choice in the optimal EVCS siting.
For the sub-criteria in the technology group, the Qi of the five alternatives remain stable when the sub-criteria C11 and C12 become more important (Figure 8). Moreover, when the weight of C13 becomes more important, the Qi of A1 and A2 present a rising tendency, while the Qi of A5 shows a decreasing tendency. However, no matter how the sub-criteria weights in the technology group change, the ranking order of the five EVCSs remains relatively stable, and A3 is always the top choice in the EVCS site selection.
Above all, electric vehicle charging station A3 always secures its best ranking, no matter how the sub-criteria weights change. It can be verified that the optimal EVCS siting results using GRA-VIKOR and combination weighting techniques is robust and effective. This study can distinguish the priorities of alternatives more easily, and thus help decision makers evaluate and identify the best alternative and more improvement items.

8. Conclusions

A comprehensive framework for selecting the optimal site for EVCSs is studied in this paper. Considering the concept of extended sustainability, experts’ opinions, and industry background, the final evaluation sub-criteria for optimal EVCS siting are determined based on FDM, which consists of four pillars: economy, society, environment and technology. To address the fuzziness and uncertainty of subjective factor and human judgment, a fuzzy GRA-VIKOR method is employed to determine the optimal EVCS site. It is worth mentioning that GRA is used to measure the distances of fuzzy numbers between alternatives to ideal solutions in this study, which can efficiently avoid the priority result of fuzzy numbers, as well as ensure a consistent ranking list for all alternatives. Moreover, in order to provide a scientific weighting system, the sub-criteria weights are determined combining the subjective weights of experts’ opinions as well as the objective weights of the entropy method, which updates the weighting process of conventional fuzzy VIKOR. The evaluation results shows that the sub-criteria C9 and C10 affiliated with the environment obtain much more attention from the experts group, and the alternative A3 in Tianjin Nankai district is determined as the optimal EVCS site. Last but not least, to test the robustness and effectiveness of decision results, a sensitivity analysis is presented, which showed that the siting results remain stable no matter how the v value and sub-criteria weights change. Moreover, it can also be found that C1, C3 and C8 are the sensitive sub-criteria which dramatically affect the optimal EVCS siting result.
Although this study realized the optimal siting of EVCSs by using FDM, combination weighting and fuzzy GRA-VIKOR techniques, limitations may still exist due to the fact the evaluation criteria will change along with objective conditions. Moreover, from a methodological perspective, it would be helpful to test the proposed framework with other approaches. The results from these approaches could be compared with the results in this paper, which is an outline for the future research.

Acknowledgments

This study is supported by China Scholarship Council, the National Natural Science Foundation of China (Project number: 71373076), the Fundamental Research Funds for the Central Universities (2015XS31), and the Science and Technology Project of State Grid Corporation of China (Contract number: SGHB0000DKJS1400116).

Author Contributions

Huiru Zhao and Nana Li conceived and designed the research method used in this paper; Nana Li performed the empirical analysis and wrote the paper.

Conflicts of Interest

The authors declare no conflict of interest.

References

  1. Mao, X.; Yang, S.; Liu, Q.; Tu, J.; Jaccard, M. Achieving CO2 emission reduction and the co-benefits of local air pollution abatement in the transportation sector of China. Environ. Sci. Policy 2012, 21, 1–13. [Google Scholar] [CrossRef]
  2. Tie, S.F.; Tan, C.W. A review of energy sources and energy management system in electric vehicles. Renew. Sustain. Energy Rev. 2013, 20, 82–102. [Google Scholar] [CrossRef]
  3. Wu, Y.; Yang, Z.; Lin, B.; Liu, H.; Wang, R.; Zhou, B.; Hao, J. Energy consumption and CO2 emission impacts of vehicle electrification in three developed regions of China. Energy Policy 2012, 48, 537–550. [Google Scholar] [CrossRef]
  4. Cai, H.; Jia, X.; Chiu, A.S.; Hu, X.; Xu, M. Siting public electric vehicle charging stations in Beijing using big-data informed travel patterns of the taxi fleet. Transp. Res. Part D Transp. Environ. 2014, 33, 39–46. [Google Scholar] [CrossRef]
  5. Subhadra, B.G. Sustainability of algal biofuel production using integrated renewable energy park (IREP) and algal biorefinery approach. Energy Policy 2010, 38, 5892–5901. [Google Scholar] [CrossRef]
  6. Opricovic, S.; Tzeng, G.H. Compromise solution by MCDM methods: A comparative analysis of VIKOR and TOPSIS. Eur. J. Oper. Res. 2004, 156, 445–455. [Google Scholar] [CrossRef]
  7. Rojas-Zerpa, J.C.; Yusta, J.M. Application of multicriteria decision methods for electric supply planning in rural and remote areas. Renew. Sustain. Energy Rev. 2015, 52, 557–571. [Google Scholar] [CrossRef]
  8. Tansel İç, Y.; Yıldırım, S. Moora-based taguchi optimisation for improving product or process quality. Int. J. Prod. Res. 2013, 51, 3321–3341. [Google Scholar] [CrossRef]
  9. San Cristóbal, J. Multi-criteria decision-making in the selection of a renewable energy project in Spain: The vikor method. Renew. Energy 2011, 36, 498–502. [Google Scholar] [CrossRef]
  10. Mardani, A.; Jusoh, A.; Zavadskas, E.K. Fuzzy multiple criteria decision-making techniques and applications—Two decades review from 1994 to 2014. Expert Syst. Appl. 2015, 42, 4126–4148. [Google Scholar] [CrossRef]
  11. Tzeng, G.-H.; Huang, C.-Y. Combined DEMATEL technique with hybrid MCDM methods for creating the aspired intelligent global manufacturing & logistics systems. Ann. Oper. Res. 2012, 197, 159–190. [Google Scholar]
  12. Kaya, T.; Kahraman, C. Multicriteria renewable energy planning using an integrated fuzzy VIKOR & AHP methodology: The case of Istanbul. Energy 2010, 35, 2517–2527. [Google Scholar]
  13. Mardani, A.; Zavadskas, E.K.; Govindan, K.; Amat Senin, A.; Jusoh, A. VIKOR technique: A systematic review of the state of the art literature on methodologies and applications. Sustainability 2016, 8, 37. [Google Scholar] [CrossRef] [Green Version]
  14. Mardani, A.; Jusoh, A.; Zavadskas, E.K.; Cavallaro, F.; Khalifah, Z. Sustainable and renewable energy: An overview of the application of multiple criteria decision making techniques and approaches. Sustainability 2015, 7, 13947–13984. [Google Scholar] [CrossRef]
  15. Chang, S.-C.; Tsai, P.-H.; Chang, S.-C. A hybrid fuzzy model for selecting and evaluating the e-book business model: A case study on Taiwan e-book firms. Appl. Soft Comput. 2015, 34, 194–204. [Google Scholar] [CrossRef]
  16. Kuo, M.-S.; Liang, G.-S. Combining VIKOR with GRA techniques to evaluate service quality of airports under fuzzy environment. Expert Syst. Appl. 2011, 38, 1304–1312. [Google Scholar] [CrossRef]
  17. Zhang, S.-F.; Liu, S.-Y. A GRA-based intuitionistic fuzzy multi-criteria group decision making method for personnel selection. Expert Syst. Appl. 2011, 38, 11401–11405. [Google Scholar] [CrossRef]
  18. Hou, J. Grey relational analysis method for multiple attribute decision making in intuitionistic fuzzy setting. J. Converg. Inf. Technol. 2010, 5, 194–199. [Google Scholar]
  19. Simpson, A. Cost-Benefit Analysis of Plug-in Hybrid Electric Vehicle Technology; National Renewable Energy Laboratory: Golden, CA, USA, 2006.
  20. Schroeder, A.; Traber, T. The economics of fast charging infrastructure for electric vehicles. Energy Policy 2012, 43, 136–144. [Google Scholar] [CrossRef]
  21. Hawkins, T.R.; Singh, B.; Majeau-Bettez, G.; Strømman, A.H. Comparative environmental life cycle assessment of conventional and electric vehicles. J. Ind. Ecol. 2013, 17, 53–64. [Google Scholar] [CrossRef]
  22. Matsuhashi, R.; Kudoh, Y.; Yoshida, Y.; Ishitani, H.; Yoshioka, M.; Yoshioka, K. Life cycle of CO2-emissions from electric vehicles and gasoline vehicles utilizing a process-relational model. Int. J. Life Cycle Assess. 2000, 5, 306–312. [Google Scholar] [CrossRef]
  23. Putrus, G.; Suwanapingkarl, P.; Johnston, D.; Bentley, E.; Narayana, M. Impact of electric vehicles on power distribution networks. In Proceedings of the Vehicle Power and Propulsion Conference, Dearborn, MI, USA, 7–11 September 2009; pp. 827–831.
  24. Clement-Nyns, K.; Haesen, E.; Driesen, J. The impact of charging plug-in hybrid electric vehicles on a residential distribution grid. IEEE Trans. Power Syst. 2010, 25, 371–380. [Google Scholar] [CrossRef] [Green Version]
  25. Mets, K.; Verschueren, T.; Haerick, W.; Develder, C.; De Turck, F. Optimizing smart energy control strategies for plug-in hybrid electric vehicle charging. In Proceedings of the Network Operations and Management Symposium Workshops (NOMS Wksps), Osaka, Japan, 19–23 April 2010; pp. 293–299.
  26. Rivera, S.; Wu, B.; Kouro, S.; Yaramasu, V.; Wang, J. Electric vehicle charging station using a neutral point clamped converter with bipolar DC bus. IEEE Trans. Ind. Electron. 2015, 62, 1999–2009. [Google Scholar] [CrossRef]
  27. Liu, Z.; Wen, F.; Ledwich, G. Optimal planning of electric-vehicle charging stations in distribution systems. IEEE Trans. Power Deliv. 2013, 28, 102–110. [Google Scholar] [CrossRef]
  28. Wirges, J.; Linder, S.; Kessler, A. Modelling the development of a regional charging infrastructure for electric vehicles in time and space. Eur. J. Transp. Infrastruct. Res. 2012, 12, 391–416. [Google Scholar]
  29. Jia, L.; Hu, Z.; Song, Y.; Luo, Z. Optimal siting and sizing of electric vehicle charging stations. In Proceedings of the 2012 IEEE International Electric Vehicle Conference (IEVC), Greenville, NC, USA, 4–8 March 2012; pp. 1–6.
  30. Ge, S.; Feng, L.; Liu, H. The planning of electric vehicle charging station based on grid partition method. In Proceedings of the 2011 International Conference on Electrical and Control Engineering (ICECE), Yichang, China, 16–18 September 2011; pp. 2726–2730.
  31. Xi, X.; Sioshansi, R.; Marano, V. Simulation-optimization model for location of a public electric vehicle charging infrastructure. Transp. Res. Part D Transp. Environ. 2013, 22, 60–69. [Google Scholar] [CrossRef]
  32. Sathaye, N.; Kelley, S. An approach for the optimal planning of electric vehicle infrastructure for highway corridors. Transp. Res. Part E Logist. Transp. Rev. 2013, 59, 15–33. [Google Scholar] [CrossRef]
  33. Pashajavid, E.; Golkar, M. Optimal placement and sizing of plug in electric vehicles charging stations within distribution networks with high penetration of photovoltaic panels. J. Renew. Sustain. Energy 2013, 5, 053126. [Google Scholar] [CrossRef]
  34. Zi-fa, L.; Wei, Z.; Xing, J.; Ke, L. Optimal planning of charging station for electric vehicle based on particle swarm optimization. In Proceedings of the Innovative Smart Grid Technologies-Asia (ISGT Asia), Tianjing, China, 21–24 May 2012; pp. 1–5.
  35. You, P.-S.; Hsieh, Y.-C. A hybrid heuristic approach to the problem of the location of vehicle charging stations. Comput. Ind. Eng. 2014, 70, 195–204. [Google Scholar] [CrossRef]
  36. Yao, W.; Zhao, J.; Wen, F.; Dong, Z.; Xue, Y.; Xu, Y.; Meng, K. A multi-objective collaborative planning strategy for integrated power distribution and electric vehicle charging systems. IEEE Trans. Power Syst. 2014, 29, 1811–1821. [Google Scholar] [CrossRef]
  37. Sadeghi-Barzani, P.; Rajabi-Ghahnavieh, A.; Kazemi-Karegar, H. Optimal fast charging station placing and sizing. Appl. Energy 2014, 125, 289–299. [Google Scholar] [CrossRef]
  38. Chung, S.H.; Kwon, C. Multi-period planning for electric car charging station locations: A case of Korean expressways. Eur. J. Oper. Res. 2015, 242, 677–687. [Google Scholar] [CrossRef]
  39. Yager, R.R.; Zadeh, L.A. An Introduction to Fuzzy Logic Applications in Intelligent Systems; Springer Science & Business Media: New York, NY, USA, 2012; Volume 165. [Google Scholar]
  40. Novák, V.; Perfilieva, I.; Mockor, J. Mathematical Principles of Fuzzy Logic; Springer Science & Business Media: New York, NY, USA, 2012; Volume 517. [Google Scholar]
  41. Kumar, A.; Kaur, J.; Singh, P. A new method for solving fully fuzzy linear programming problems. Appl. Math. Model. 2011, 35, 817–823. [Google Scholar] [CrossRef]
  42. Li, D.-F. A ratio ranking method of triangular intuitionistic fuzzy numbers and its application to MADM problems. Comput. Math. Appl. 2010, 60, 1557–1570. [Google Scholar] [CrossRef]
  43. Yao, J.-S.; Wu, K. Ranking fuzzy numbers based on decomposition principle and signed distance. Fuzzy Sets Syst. 2000, 116, 275–288. [Google Scholar] [CrossRef]
  44. Lee, A.H.; Chen, W.-C.; Chang, C.-J. A fuzzy AHP and BSC approach for evaluating performance of it department in the manufacturing industry in Taiwan. Expert Syst. Appl. 2008, 34, 96–107. [Google Scholar] [CrossRef]
  45. Chen, T.-Y.; Tsao, C.-Y. The interval-valued fuzzy TOPSIS method and experimental analysis. Fuzzy Sets Syst. 2008, 159, 1410–1428. [Google Scholar] [CrossRef]
  46. Chen, L.Y.; Wang, T.-C. Optimizing partners’ choice in IS/IT outsourcing projects: The strategic decision of fuzzy VIKOR. Int. J. Prod. Econ. 2009, 120, 233–242. [Google Scholar] [CrossRef]
  47. Hsu, C.-H.; Wang, F.-K.; Tzeng, G.-H. The best vendor selection for conducting the recycled material based on a hybrid MCDM model combining danp with VIKOR. Resour. Conserv. Recycl. 2012, 66, 95–111. [Google Scholar] [CrossRef]
  48. Zhang, N.; Wei, G. Extension of VIKOR method for decision making problem based on hesitant fuzzy set. Appl. Math. Model. 2013, 37, 4938–4947. [Google Scholar] [CrossRef]
  49. Shemshadi, A.; Shirazi, H.; Toreihi, M.; Tarokh, M.J. A fuzzy VIKOR method for supplier selection based on entropy measure for objective weighting. Expert Syst. Appl. 2011, 38, 12160–12167. [Google Scholar] [CrossRef]
  50. Sanayei, A.; Mousavi, S.F.; Yazdankhah, A. Group decision making process for supplier selection with VIKOR under fuzzy environment. Expert Syst. Appl. 2010, 37, 24–30. [Google Scholar] [CrossRef]
  51. Lihong, M.; Yanping, Z.; Zhiwei, Z. Improved vikor algorithm based on AHP and Shannon entropy in the selection of thermal power enterprise’s coal suppliers. In Proceedings of the International Conference on Information Management, Innovation Management and Industrial Engineering, Taipei, Taiwan, 19–21 December 2008; pp. 129–133.
  52. Stahura, F.L.; Godden, J.W.; Xue, L.; Bajorath, J. Distinguishing between natural products and synthetic molecules by descriptor Shannon entropy analysis and binary QSAR calculations. J. Chem. Inf. Comput. Sci. 2000, 40, 1245–1252. [Google Scholar] [CrossRef] [PubMed]
  53. Godden, J.W.; Stahura, F.L.; Bajorath, J. Variability of molecular descriptors in compound databases revealed by Shannon entropy calculations. J. Chem. Inf. Comput. Sci. 2000, 40, 796–800. [Google Scholar] [CrossRef] [PubMed]
  54. Ghorbani, M.; Arabzad, S.M.; Bahrami, M. Implementing Shannon entropy, SWOT and mathematical programming for supplier selection and order allocation. Int. J. Suppl. Chain Manag. 2012, 1, 43–47. [Google Scholar]
Figure 1. The framework of the proposed model for optimal siting of charging stations for electric vehicles.
Energies 09 00270 g001
Figure 2. Evaluation index system for optimal siting of charging stations for electric vehicles.
Energies 09 00270 g002
Figure 3. The geographical locations of five EVCS site alternatives
Energies 09 00270 g003
Figure 4. Sensitivity analysis of v value for each alternative.
Energies 09 00270 g004
Figure 5. Sensitivity analysis results of sub-criteria in the economy group.
Energies 09 00270 g005
Figure 6. Sensitivity analysis results of the sub-criteria in the society group.
Energies 09 00270 g006
Figure 7. Sensitivity analysis results of the sub-criteria in the environment group.
Energies 09 00270 g007
Figure 8. Sensitivity analysis results of the sub-criteria in the technology group.
Energies 09 00270 g008
Table 1. Fuzzy evaluation scores for the alternatives.
Linguistic TermsFuzzy Score
Very poor(0, 0, 1)
Poor(0, 1, 3)
Medium poor(1, 3, 5)
Fair(3, 5, 7)
Medium good(5, 7, 9)
Good(7, 9, 10)
Very good(9, 10, 10)
Table 2. Fuzzy evaluation scores for criteria weights.
Linguistic TermsMembership Function
Of little importance(0, 0, 0.3)
Moderately important(0, 0.3, 0.5)
Important(0.2, 0.5, 0.8)
Very important(0.5, 0.7, 1)
Absolutely important(0.7, 1, 1)
Table 3. Calculation results of evaluation sub-criteria based on FDM.
PerspectivesInitial Sub-CriteriaPessimistic ValueOptimistic ValueGeometric Mean M i Z i Consensus Value
C L i C U i O L i O U i C M i O M i G i
EconomyInvestment pay-back period13583.546.983.025.26 < 6.0
Total construction cost14794.977.544.466.26 > 6.0
Annual economic benefit27595.116.160.845.98 < 6.0
Internal rate of return267105.317.653.356.48 > 6.0
Land acquisition costs28693.366.070.933.86 < 6.0
Annual operation and maintenance cost16894.368.692.316.53 > 6.0
Removal cost267103.555.995.014.77 < 6.0
Causeway construction costs37692.676.541.463.63 > 6.0
SocietyEV ownership in the service area286105.847.340.665.47 < 6.0
Service area population25793.755.685.324.72 < 6.0
Service radius16592.597.650.353.89 < 6.0
Service capacity157104.598.493.516.54 > 6.0
Residents professional habit16784.056.272.735.16 < 6.0
Residents consumption habits347103.565.247.594.40 < 6.0
Traffic convenience16794.357.842.166.10 > 6.0
Impact on living level of resident165104.587.651.355.12 < 6.0
Coordinate level of EVCS with urban development planning36795.067.642.366.35 > 6.0
Level of public facilities27694.527.680.324.72 < 6.0
EnvironmentDeterioration on water resource16593.547.240.764.18 < 6.0
Deterioration on soil and vegetation278105.247.353.656.30 > 6.0
Waste discharge265103.758.260.744.56 < 6.0
Noise pollution26793.646.843.165.24 < 6.0
Atmospheric particulates emission reduction16794.598.061.946.33 > 6.0
Industrial electromagnetic field257103.685.646.364.66 < 6.0
Radio interference387105.168.590.415.20 < 6.0
GHG emission reduction46894.968.852.156.91 > 6.0
Ecological influence15794.366.844.165.60 < 6.0
TechnologySubstation capacity permits157104.168.643.366.40 > 6.0
Distance from the substation157104.356.895.115.62 < 6.0
Power quality influence376105.897.681.326.35 > 6.0
Power balance level376103.648.040.964.44 < 6.0
Power grid security implications478105.686.544.466.11 > 6.0
Transformer capacity-load ratio25694.646.873.135.76 < 6.0
Interface flow margin387103.748.940.064.79 < 6.0
Voltage fluctuation18795.665.982.023.09 < 6.0
Power grid frequency deviation27594.217.64−0.645.21 < 6.0
Harmonic pollution26773.954.683.324.32 < 6.0
Table 4. Linguistic ratings for sub-criteria weights.
C1C2C3C4C5C6C7C8C9C10C11C12C13
E1IIMIMIIIMIMIVIVIIMIMI
E2IVIIIVIVILIIAIVILIII
E3IVIIILIMIMIIIAIMILII
E4VIAIMIIVIMIIVIVIAIIMIVI
Table 5. Linguistic ratings for sub-criteria performances of five EVCS site alternatives.
C1C2C3C4C5C6C7C8C9C10C11C12C13
E1A1MGFMGMPFMGFFMPGMPFMG
A2FMGMPMPMPFMPMPFFMPFF
A3MPFMGFFMGMPFVPMPFMGMG
A4VGFMGFFMGFMGVPMPMPMGF
A5PFFMGMPMGPMPFGFPP
E2A1FMGGFMGMPFMGFFPFG
A2MGMPFFFFMGMPFMPFFMG
A3FFFMGMPMPMPMGPFMPMGF
A4FFFMGMPMPFFMPFFGMG
A5MPMPMGFFFMPMGFMGMGPMP
E3A1MPFMPMPFFGFFFMPVGF
A2FMPFMGFMPFMGMGMGFMGMP
A3MGFGMPFFPMPFVGVPGVG
A4MGFGMPFFMPMPMGMGPMGG
A5MGFFMGGGPFMGGGMPF
E4A1FFFFPPFMPMPMGPMGG
A2FFMPFFFFFMGMGMGFMP
A3VGPMGMPMPMPPFMPMPMPVGMG
A4GMPMGMPMPMPMPMGMPMPMPVGMG
A5PGMGMGMGFGMGGMGMGMPMP
Table 6. Combination weights of evaluation criteria.
C1C2C3C4C5C6C7C8C9C10C11C12C13
w s u b j e c t i v e 0.08530.11090.06030.06860.07630.06860.04290.07690.11090.12820.05130.04290.0769
w o b j e c t i v e 0.08320.08450.07640.07690.07870.07950.07980.06810.07870.07280.06890.07810.0743
w j 0.08420.09770.06830.07270.07750.07410.06140.07250.09480.10050.06010.06050.0756
Table 7. The values of Si, Ri and Qi for each alternative.
A1A2A3A4A5
S i 0.5120.5320.9720.4430.759
R i 0.0700.0660.0490.0840.064
Q i 0.7330.6550.0001.0000.408
Rank43152

