Article

The Performance of Surfactant-Polymer Flooding in Horizontal Wells Consisting of Multilayers in a Reservoir System

Department of Energy Resources Engineering, Inha University, Incheon 402-751, Korea
*
Author to whom correspondence should be addressed.
Energies 2016, 9(4), 244; https://doi.org/10.3390/en9040244
Submission received: 17 February 2016 / Revised: 12 March 2016 / Accepted: 22 March 2016 / Published: 26 March 2016

Abstract

:
Surfactant-polymer (SP) flooding has been demonstrated to be an effective method to recover oil in the enhanced oil recovery (EOR) stage when water flooding is no longer relevant. Theoretically, adding surfactant causes the reduction of the interfacial tension between oil and water in pores, therefore reducing the residual oil saturation, whereas the sweep efficiency will be significantly improved by the polymer injection as a result of proper mobility control. With regard to the well patterns, water flooding has demonstrated a high productivity in horizontal wells. Recently, other EOR processes have been increasingly applied to the horizontal wells in various well patterns. In this study, the efficiency of SP flooding applied to horizontal wells in various well configurations is investigated in order to select the best EOR performance in terms of either a technical or economical point of view. Furthermore, the reservoir is assumed to be anisotropic with four different layers that have same porosity but different permeability between each layer. The study figures out that, the utilization of a horizontal injector and producer always gives a higher oil production in comparison with the reference case of a conventional vertical injector and producer; however, the best EOR performances that demonstrate the higher oil recovery and lower fluid injected volume than those of the reference case are achieved when the production well is located in bottom layers and parallel with the injection well at a distance. While the location of producer decides oil productivity, the location of injector yet affects the uniformity of fluids propagation in the reservoir. A predefined feasibility factor is also taken into consideration in order to reject the infeasible cases that might give a high oil production but require a higher injected volume than the reference case. This factor is used as an economic parameter to evaluate the success of the EOR performance. The simulation is carried out in a quarter five-spot pattern reservoir with the support of the Computer Modeling Group (CMG) simulator. Understanding the predominant EOR performance of SP flooding in horizontal wells will help to select the best plan to obtain the highest oil recovery when considering economic issues.

1. Introduction

Recently, the utilization of horizontal wells to recover trapped oil in the enhanced oil recovery stage has been developed as the significant well patterns installed in conventional reservoirs. Improvements in horizontal well technologies have been demonstrated to be technically and economically attractive compared to the use of only conventional vertical wells [1]. Many previous works have investigated the success of horizontal well patterns on water flooding and achieved considerable conclusions. The first experiment of horizontal wells utilizing water flooding carried out by Hadia and Chauhari has shown the significant increase of ultimate oil recovery by horizontal well after the oil production stopped from conventional vertical wells configuration [2]. Popa and Ploiesty found that the pressure loss along a horizontal section of the well will influence the sweep efficiency of water flooding without considering the well patterns [3]. Furthermore, the work of Clippea clarified the uniform degree of fluid flux within the reservoir by verifying different values of the pressure drawdown between the heel and toe of the horizontal section for either injectors or producers [4]. The numerical studies of Algharaib on water-flooding processes concluded that increases in the lengths of the horizontal wells do not result in a linear increase in the additional oil recovery [5]; however, a long horizontal well was not necessary for recovering the trapped oil in a heterogeneous reservoir [6]. In terms of risk analysis, Dai et al., have investigated the uncertainty metrics affecting the enhanced oil recovery (EOR) performances by CO2 injection in heterogeneous reservoirs using Monte Carlo simulation; they concluded that reservoir permeability, porosity and net thickness are crucial parameters controlling the CO2 injection process as well as oil and gas recovery rate [7,8].
This work focuses on the utilization of horizontal wells for surfactant-polymer (SP) flooding in a heterogeneous reservoir. Many well combinations will be installed, which include various horizontal section lengths, directions of wells with respect to each other, and locations of wells. It is known that two horizontal wells facing each other are the most favorable configuration [9,10]. The horizontal wells can provide cost effective solution in terms of productivity [11,12], however, the length of the well and, obviously, the long project life caused by the long horizontal well should be considered, and the injectivity reduction (when injecting polymer) can significantly affect the economics [13]. Different layers are proposed for the reservoir system to investigate the effects of the locations where the horizontal wells will be installed. In addition, the heterogeneous reservoir complicates the EOR processes owing to the unstable and unpredictable performance [14,15].

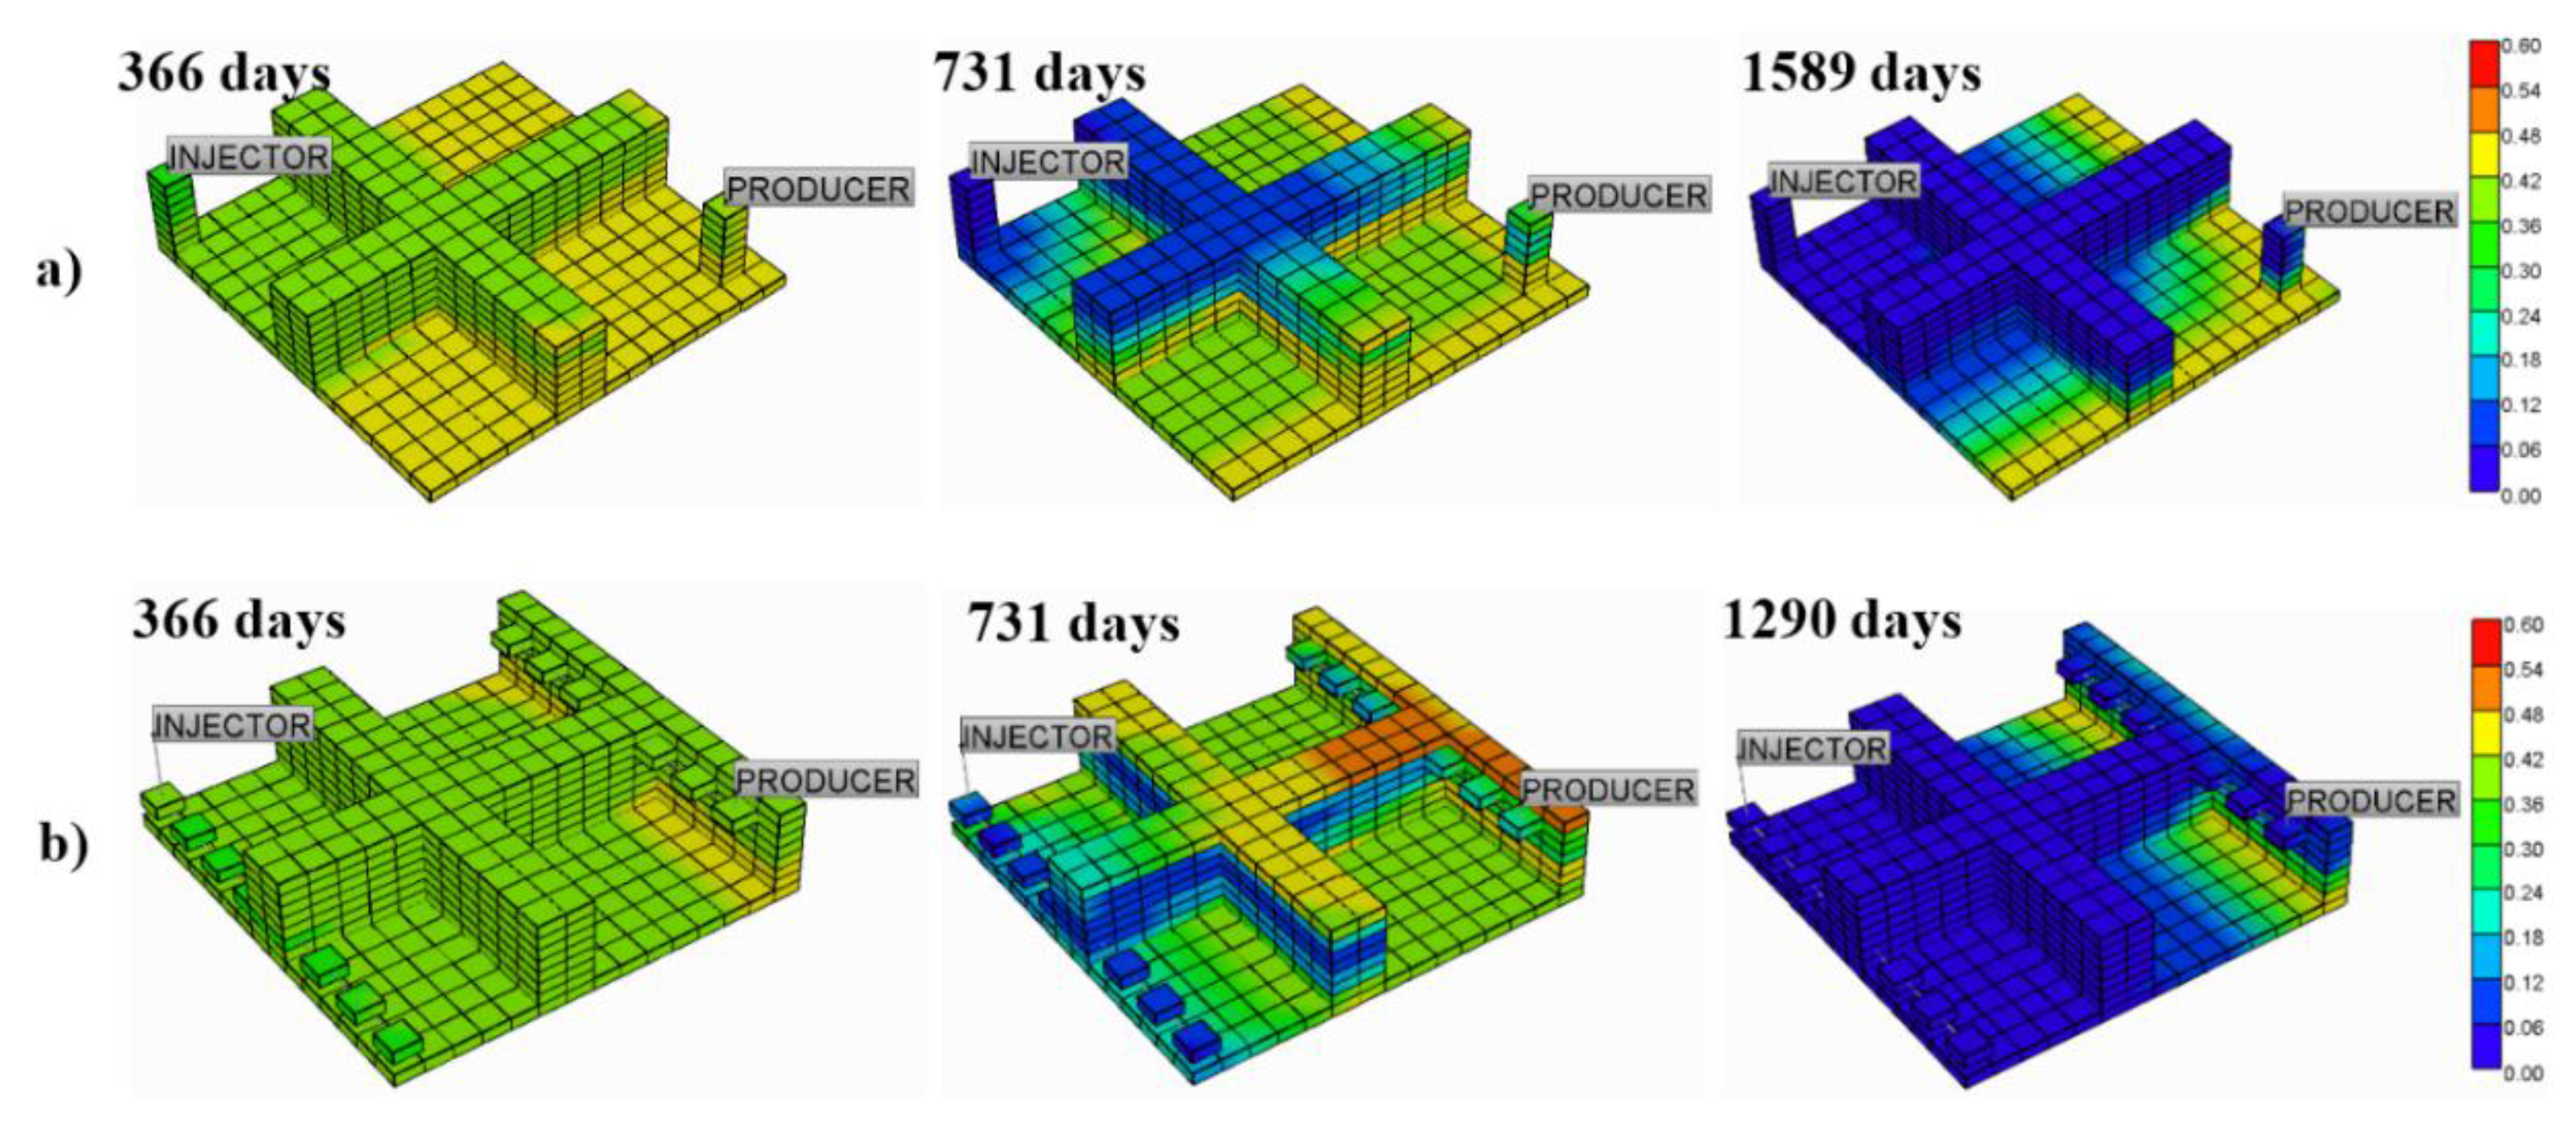
2. Reservoir Description

A quarter five-spot pattern reservoir is applied to investigate the effectiveness of EOR processes by SP flooding. A reservoir model has been built in the STARS black-oil simulator (Computer Modelling Group, Calgary, AB, Canada) for a field scale of 600 × 600 × 68 ft3 with 15 × 15 × 8 gridblocks in Cartesian coordinates. A large area between horizontal wells is recommended as a result of achieving better economic terms due to the efficiency of controlling the operated wells [16]. The reservoir porosity is assumed to be constant over the reservoir; however, the permeability changes vertically, corresponding to different layers. In total, the reservoir consists of four equal-thickness layers, in which the horizontal permeability changes from 300 to 1200 md (milli-Darcy), as presented in Table 1. The ratio of the vertical to horizontal permeability is also equal between layers and set as 0.1 uniformly over the reservoir.
The fluids contained in the pore volumes are oil and connate water; no gas exists within the reservoir. At the start of the simulation, the oil saturation was set to 50% of the pore volume, with water-flooding residual-oil saturation as high as 35% for the entire reservoir. The reservoir rock system is described as being water-wet condition. Reservoir properties partly refer to the previous reliable work of Najafabadi [17].

3. Well Combination Case Studies

3.1. Reference Case

The combination of one vertical injector and one vertical producer (V-V) is established as the reference case before investigating the other cases. Both wells are fully completed and perforated over the reservoir thickness. The wellhead locations of both wells in the reference case are also fixed for all of the other well combinations. Conventionally, the use of two vertical wells like this is always relevant in EOR projects in terms of economic and technical issues. By perforating throughout the reservoir, it is evident that the producing well can produce oil flowing in all bearing layers. In addition, the displacing fluids from the injector can also approach and effectively sweep the entire reservoir after the EOR project has been properly designed.

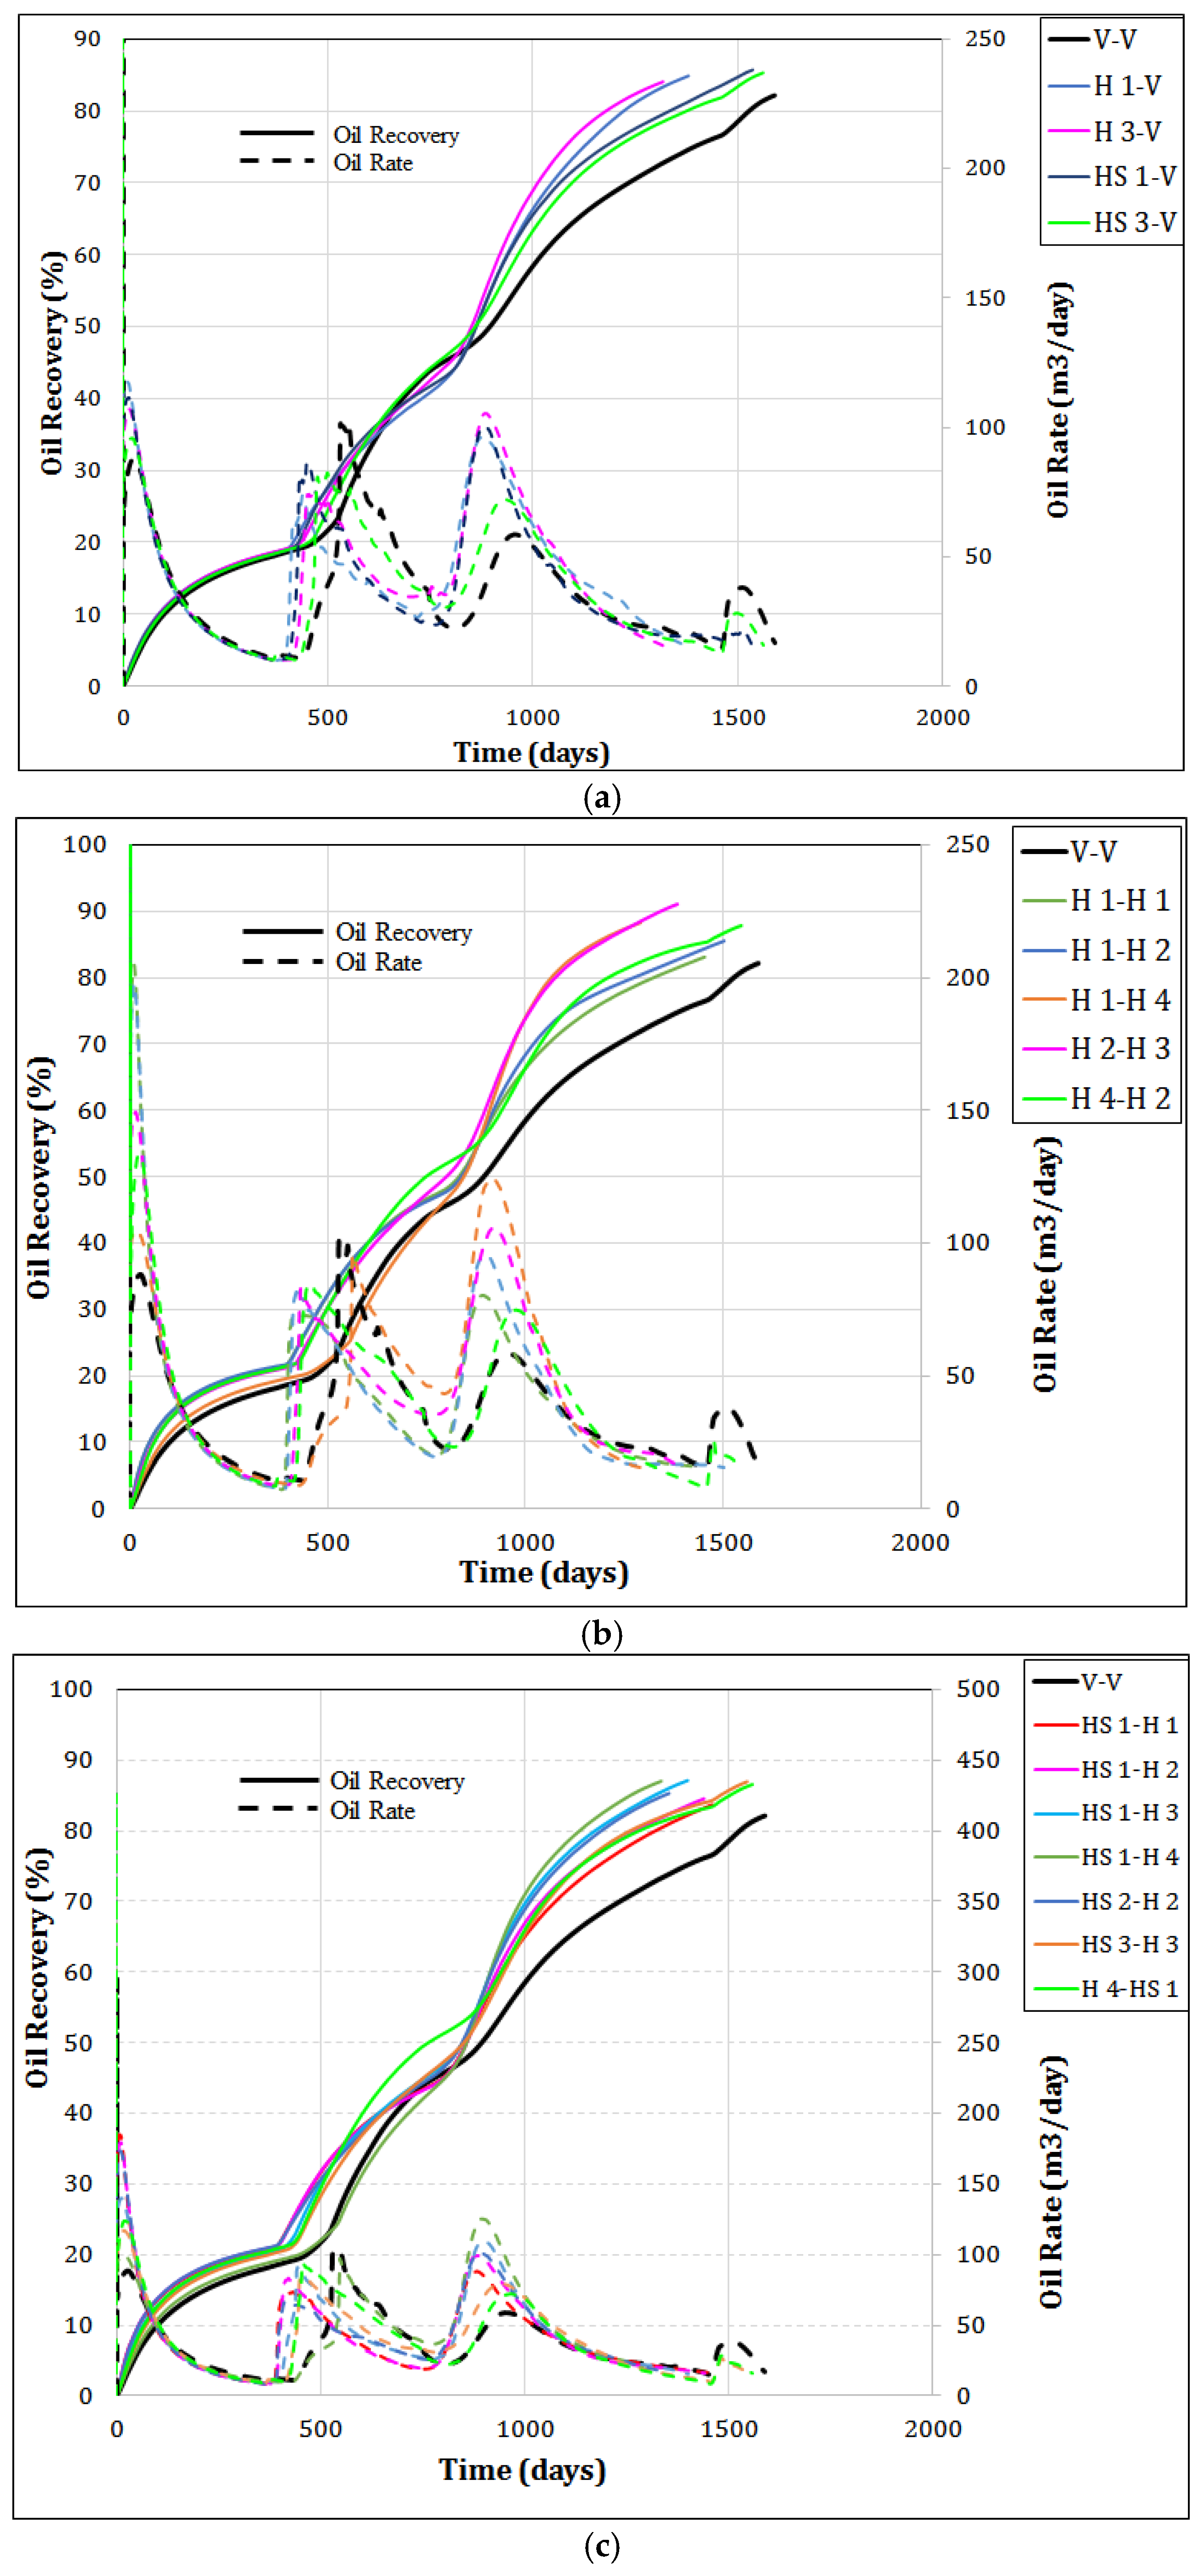
3.2. Horizontal Injector–Vertical Producer

This case considers the SP flooding performance for fluids injected from a horizontal well (H) when the producer is a vertical well (V). The producing well is completed in the same manner as the reference case, whereas the horizontal section of the injector is perforated along the Y-axis. The well combinations for this case only differ by changes in the horizontal well, including the change in length, the change in direction, and finally, the change in the location of the horizontal section. The terminations of all combinations are defined in Table 2.
In Table 2, Full length means that the horizontal section is along entire the Y-axis, and Short length (S) refers to a length that is half of the horizontal section of Full length. This work also investigates the case in which the horizontal section is on-line between the two wells, termed Straight line, where the names of the well combinations of this type are assigned by the number 45 to indicate the angle between this line and the Y-axis. The numbers 1, 2, 3, and 4 in Table 2 clearly indicate the layer where the horizontal well is located.

3.3. Vertical Injector–Horizontal Producer

This case is the opposite of the previous case, where the producer is a horizontal well, and the injector is a vertical well. Similarly, the horizontal well is also changed with respect to the length, direction, and location, whereas the vertical well is the entire thickness of the reservoir. The terminations of all combinations of this case are summarized in Table 3, where Full length, Short length, and Straight line are defined in the same manner as the previous case above.
Even though this case is the inverse case of the horizontal injector–vertical producer case, the success of the EOR processes are different between these two cases. Theoretically, the previous case mainly investigates the sweep efficiency of SP flooding for different injection well patterns, whereas this case tries to understand the oil production performance of dissimilar horizontal well patterns.

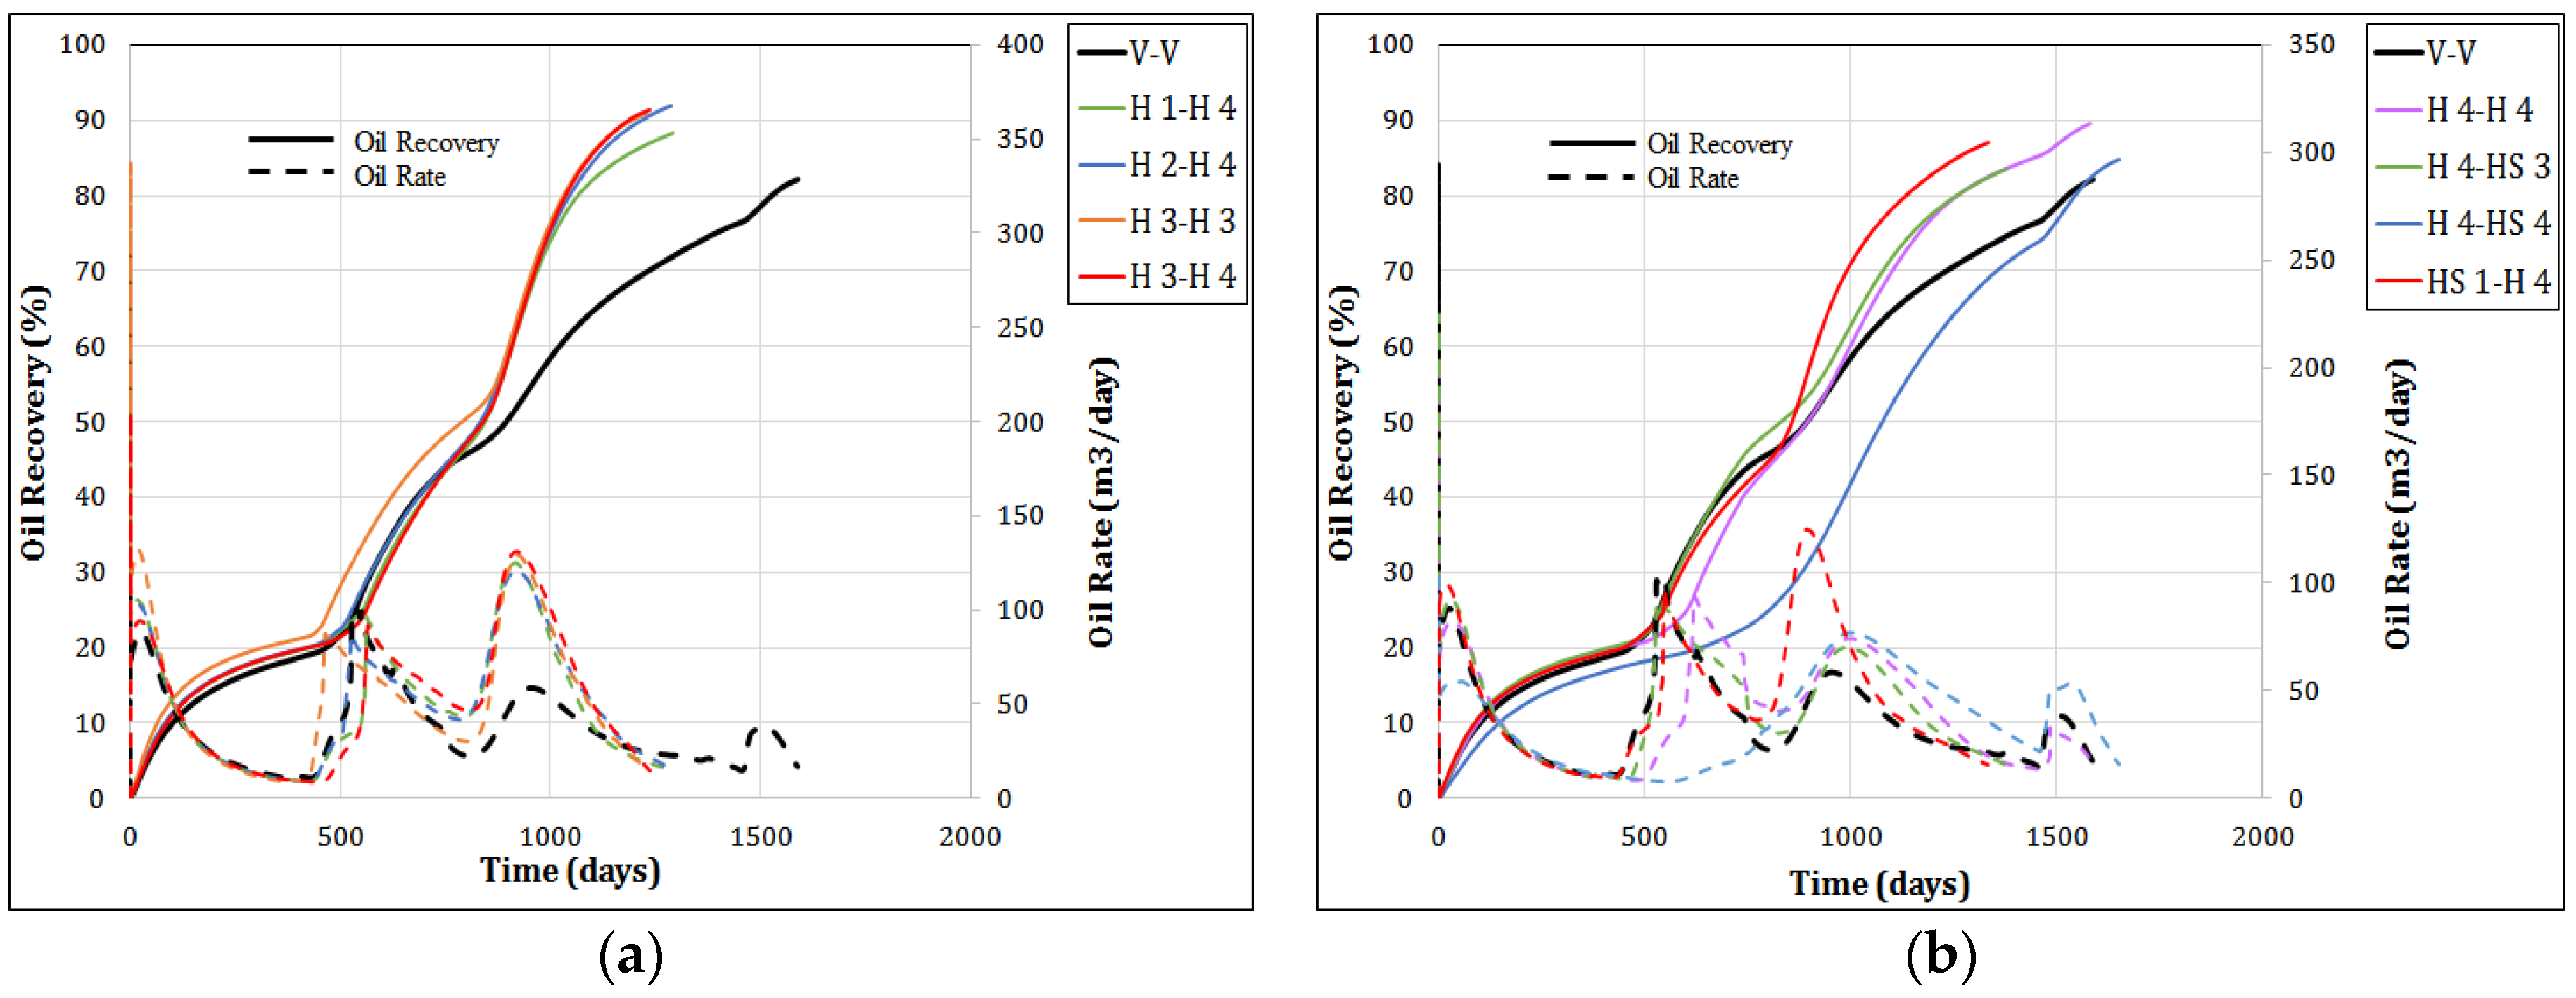
3.4. Horizontal Injector–Horizontal Producer

Either the sweep efficiency or productivity is studied for this case by assuming that both the injector and producer are horizontal wells. Many different well combinations are investigated by interchanging the horizontal injection and producing wells, including the horizontal section location and the direction and length of the well. Similar to the previous cases, there is no perforation on the vertical section of the wells; only the horizontal sections are completed. All combinations are divided into six distinct groups as follows:
  • H-H: Full length horizontal injector and producer. Two wells are located in an inverted line drive pattern, where the horizontal length is the entire Y-axis. The interchanges of this group come from the location changes by placing the wells in different layers. Table 4 presents the combinations of the H-H group, where the number again indicates the layer where injector, producer, or both wells are completed.
  • H-HS: Full length horizontal injector and short length horizontal producer. This group has the same well pattern as H-H; however, the length of the horizontal section of the producing well is only half of the full length. This group is analyzed for all interchange combinations, as summarized in Table 5.
  • HS-H: Short length horizontal injector and full length horizontal producer. As the opposite of H-HS, this group alters the injection well from full length to short length, and the horizontal producing well from short length to full length, as presented in Table 6.
  • HS-HS: Short length horizontal injector and Short length horizontal producer. The combinations are presented in Table 7.
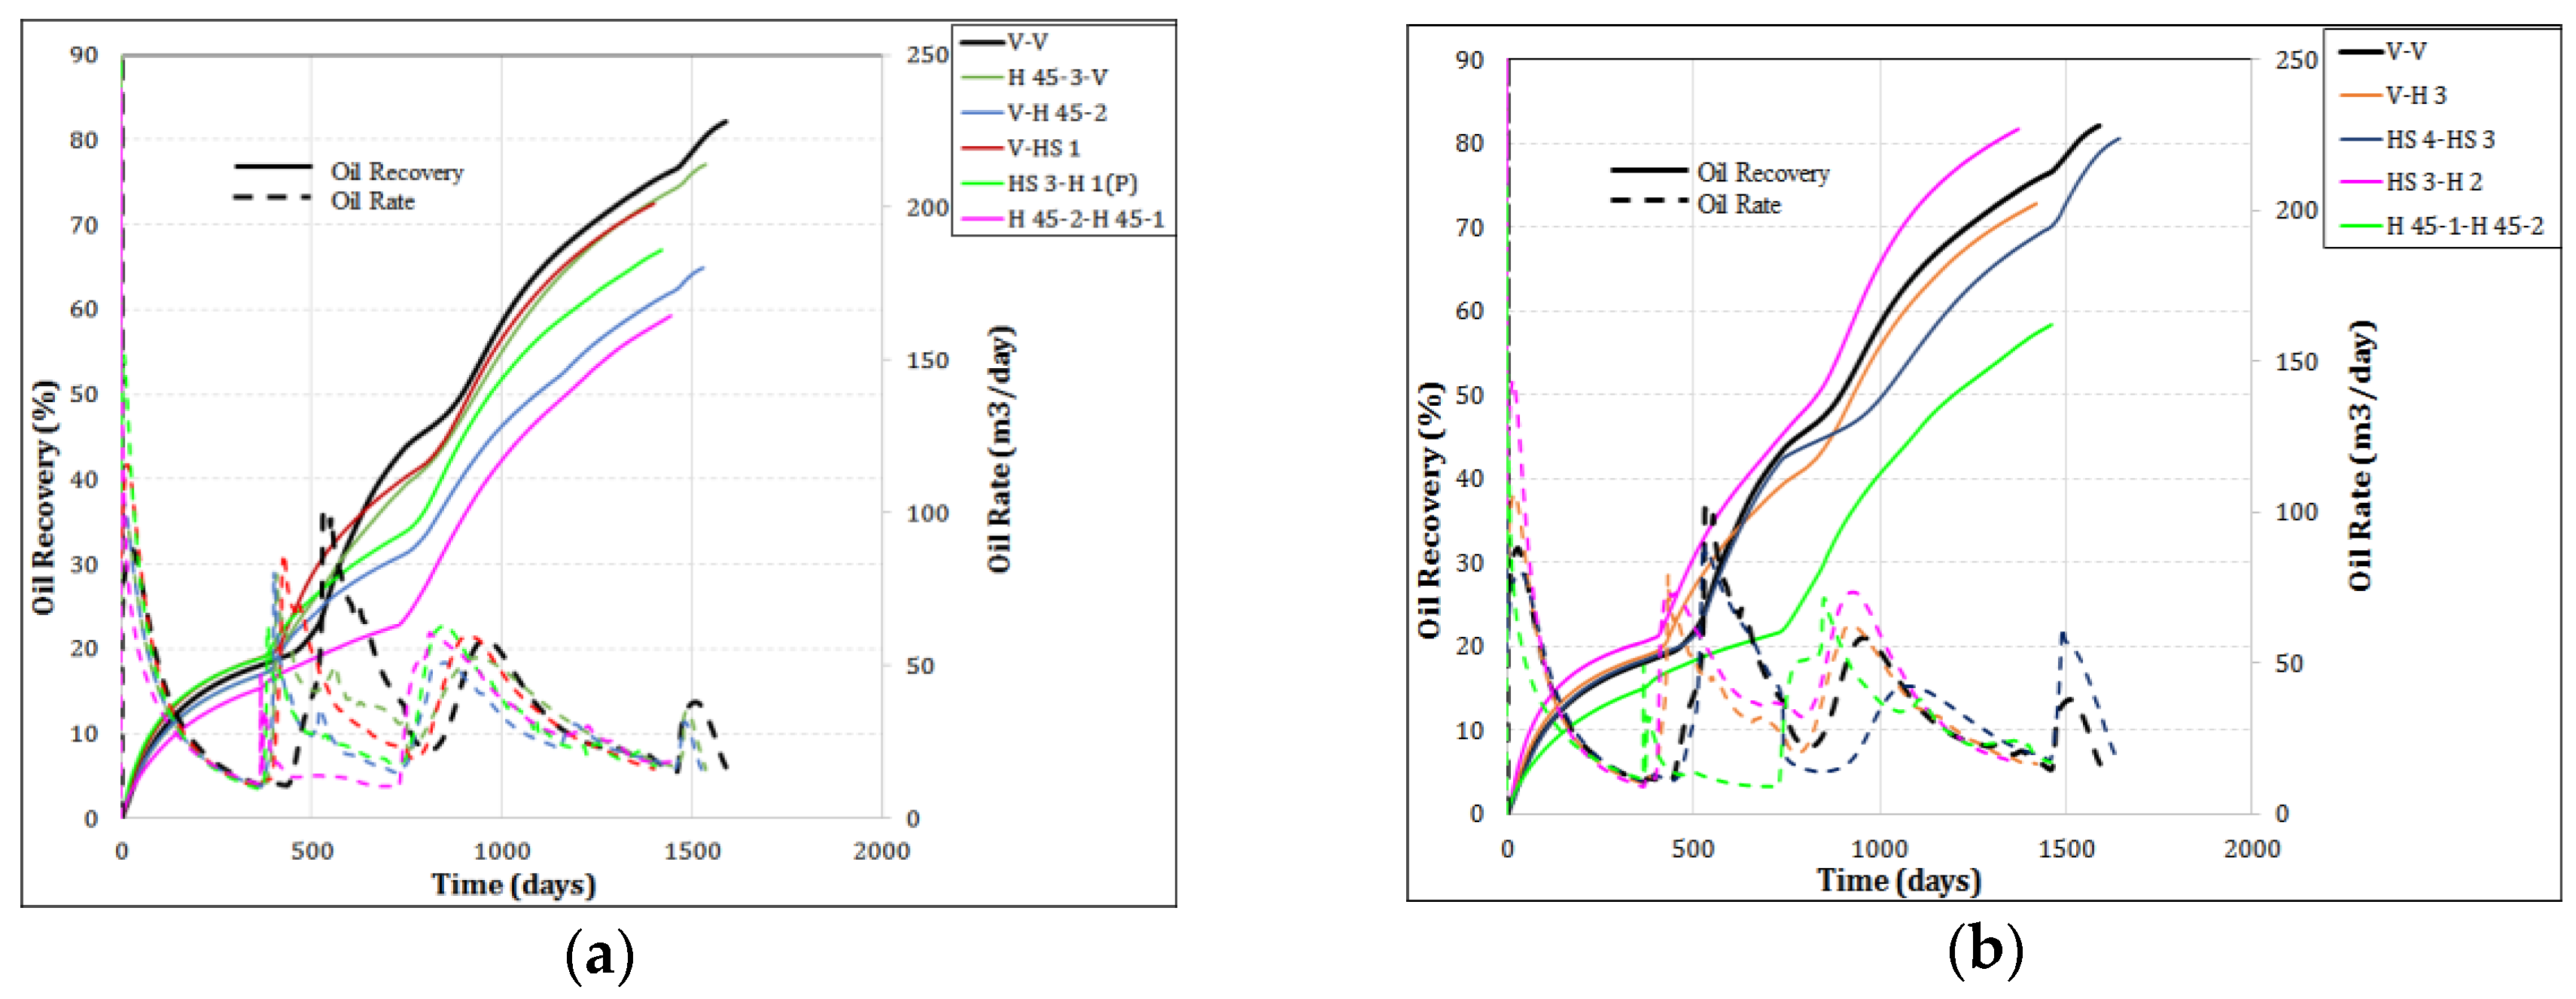
  • H 45-H 45: Both the horizontal injector and producer are oriented along a straight line between the two wells. As explained previously, the number 45 indicates the angle between this line and the Y-axis. However, from a technical point of view, the two wells are placed such that they are not located in the same layer. The combinations are summarized in Table 8.
  • H-H (P): For this group, it is assumed that two horizontal wells are oriented perpendicular (P) to each other and not located in the same layer, as presented in Table 9.

3.5. Liquid Injection Strategies

After defining the well configurations, the same EOR processes for most simulations will be proposed, including the bottom-hole pressure, injection rate, producing rate, and injection strategies as follows:
  • The bottom-hole pressure is set to be maintained at a maximum of 6.89 MPa for the injector and a minimum of 0.689 MPa for the producer.
  • The highest liquid injection rate and production rate are 636 m3/day.
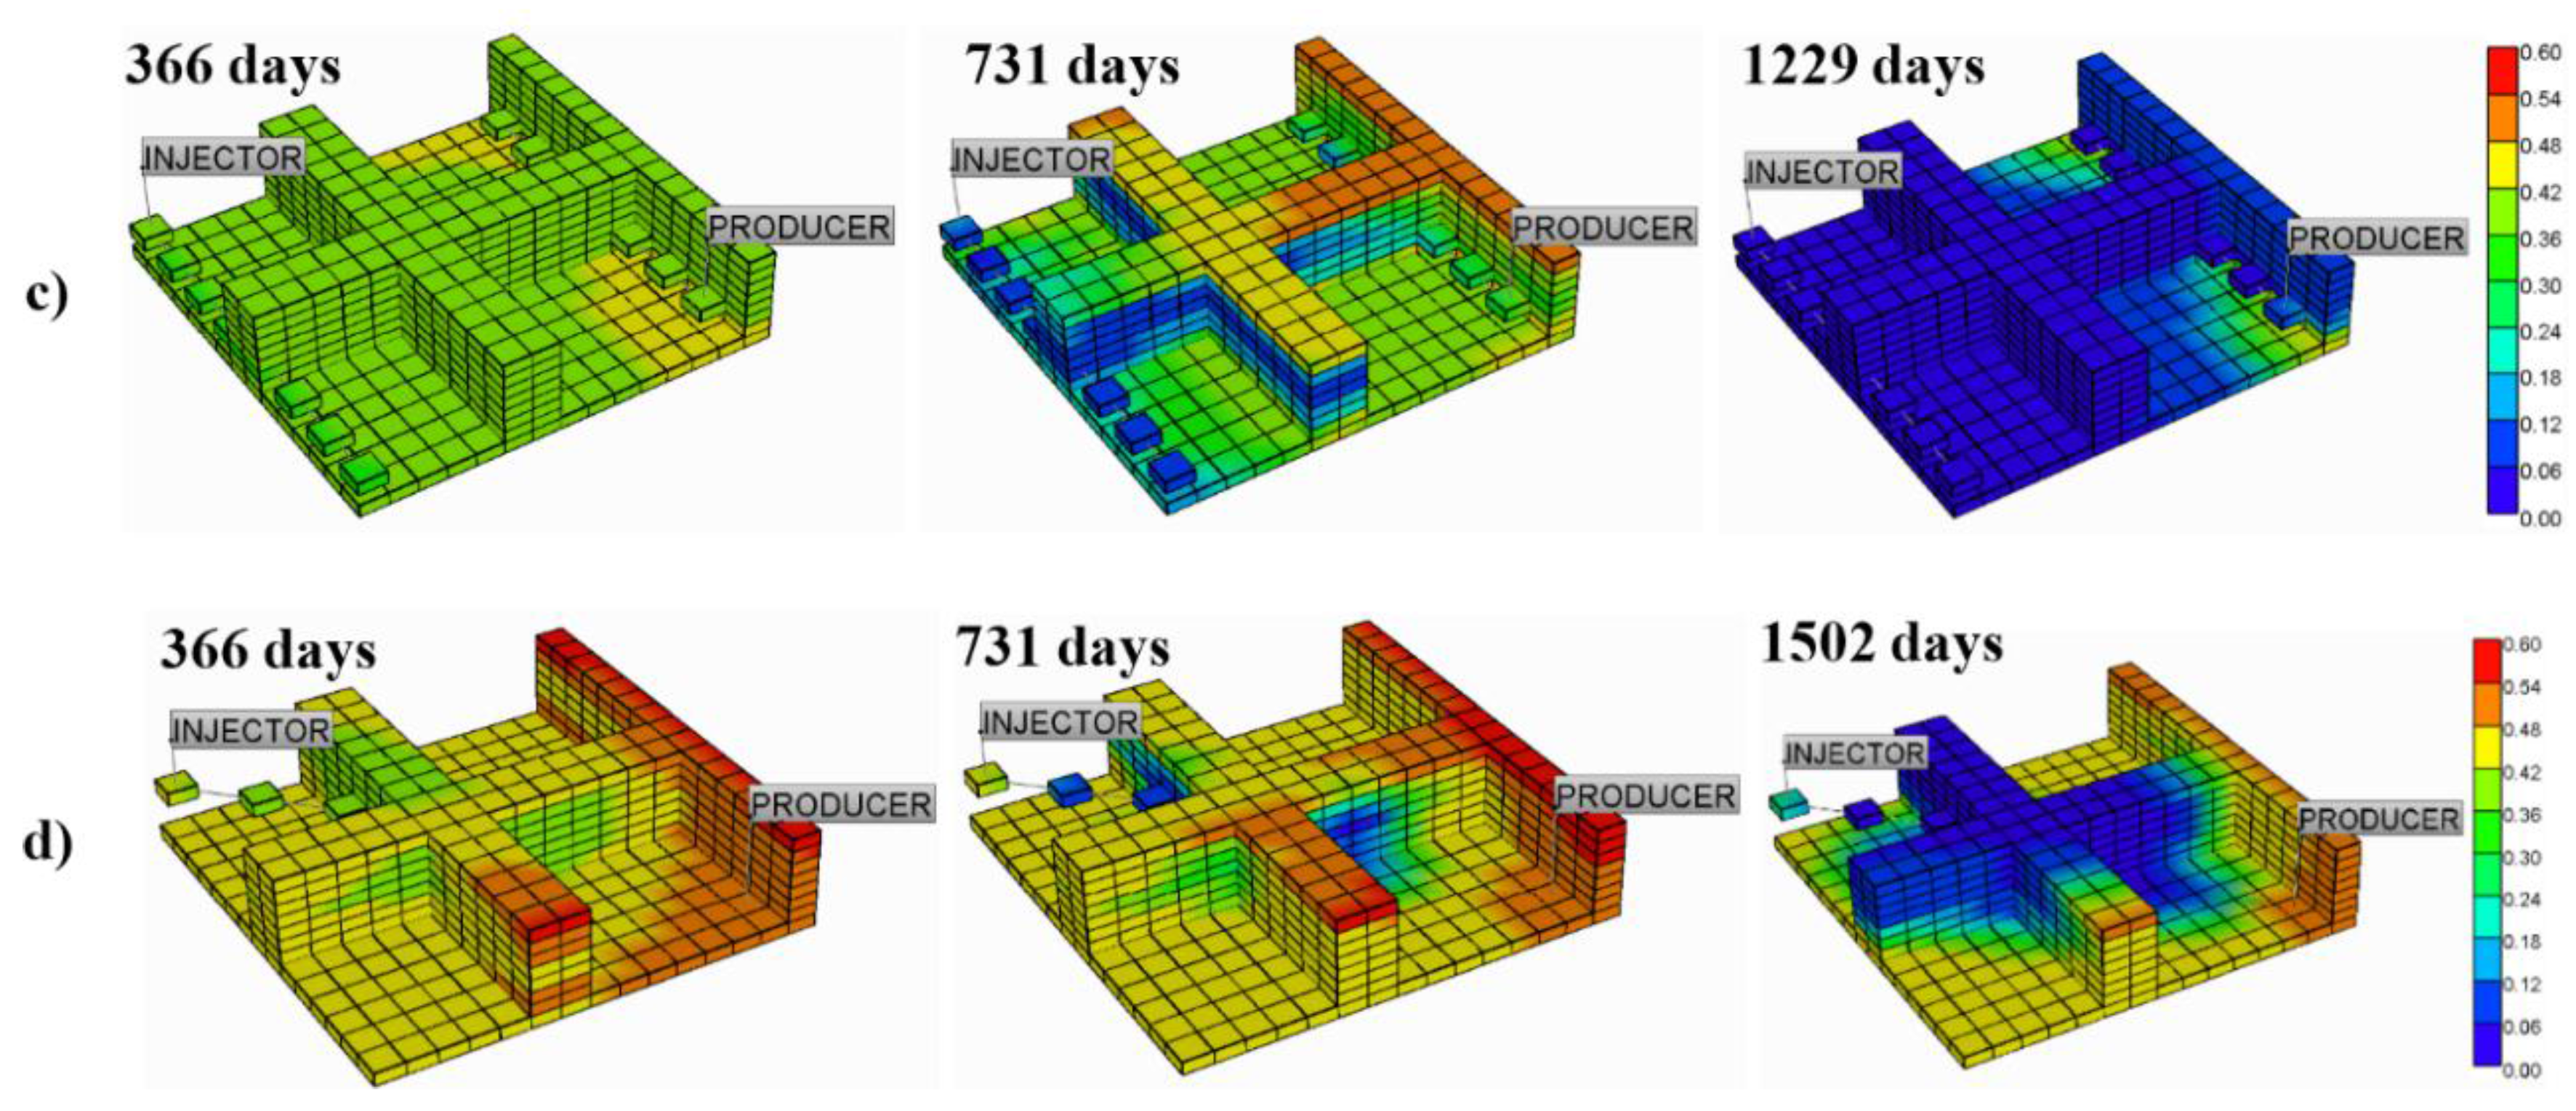
  • Fluid injection strategy: Water is injected for one year (2000); after that, starting in 2001, 0.83 vol. % surfactant is continuously injected with artificial water. From 2002 to 2004, 400 ppm polymer is added to the injected fluid; then, no more polymer is injected until the end of the EOR project.
  • All simulations will be stopped when the oil rate reaches approximately 15.9 ± 0.79 m3/day and declines continuously thereafter.
First, water flooding is carried out as a regular practical EOR process. After conventional water flooding, the residual oil in the reservoir remains in a discontinuous phase owing to oil droplets trapped by capillary forces [18]. In order to produce a large amount of the remaining oil, it is necessary to inject efficient agents in combination with water [19]. A surfactant is the best candidate for adding agents for the purpose of successfully reducing the interfacial tension between oil and water to an ultralow value [20], whereas a polymer is used to control the mobility of the displacing fluids effectively. In particular, the use of a polymer in chemical agents in a high-permeability multilayered reservoir system enhances the crossflow between the low and the high permeable layers resulting from the shear-thinning behavior of the polymer solution [21]. In addition, the salinity of the artificial water has to be considered in terms of the degree of adsorption of the surfactant-slug compositions [22].

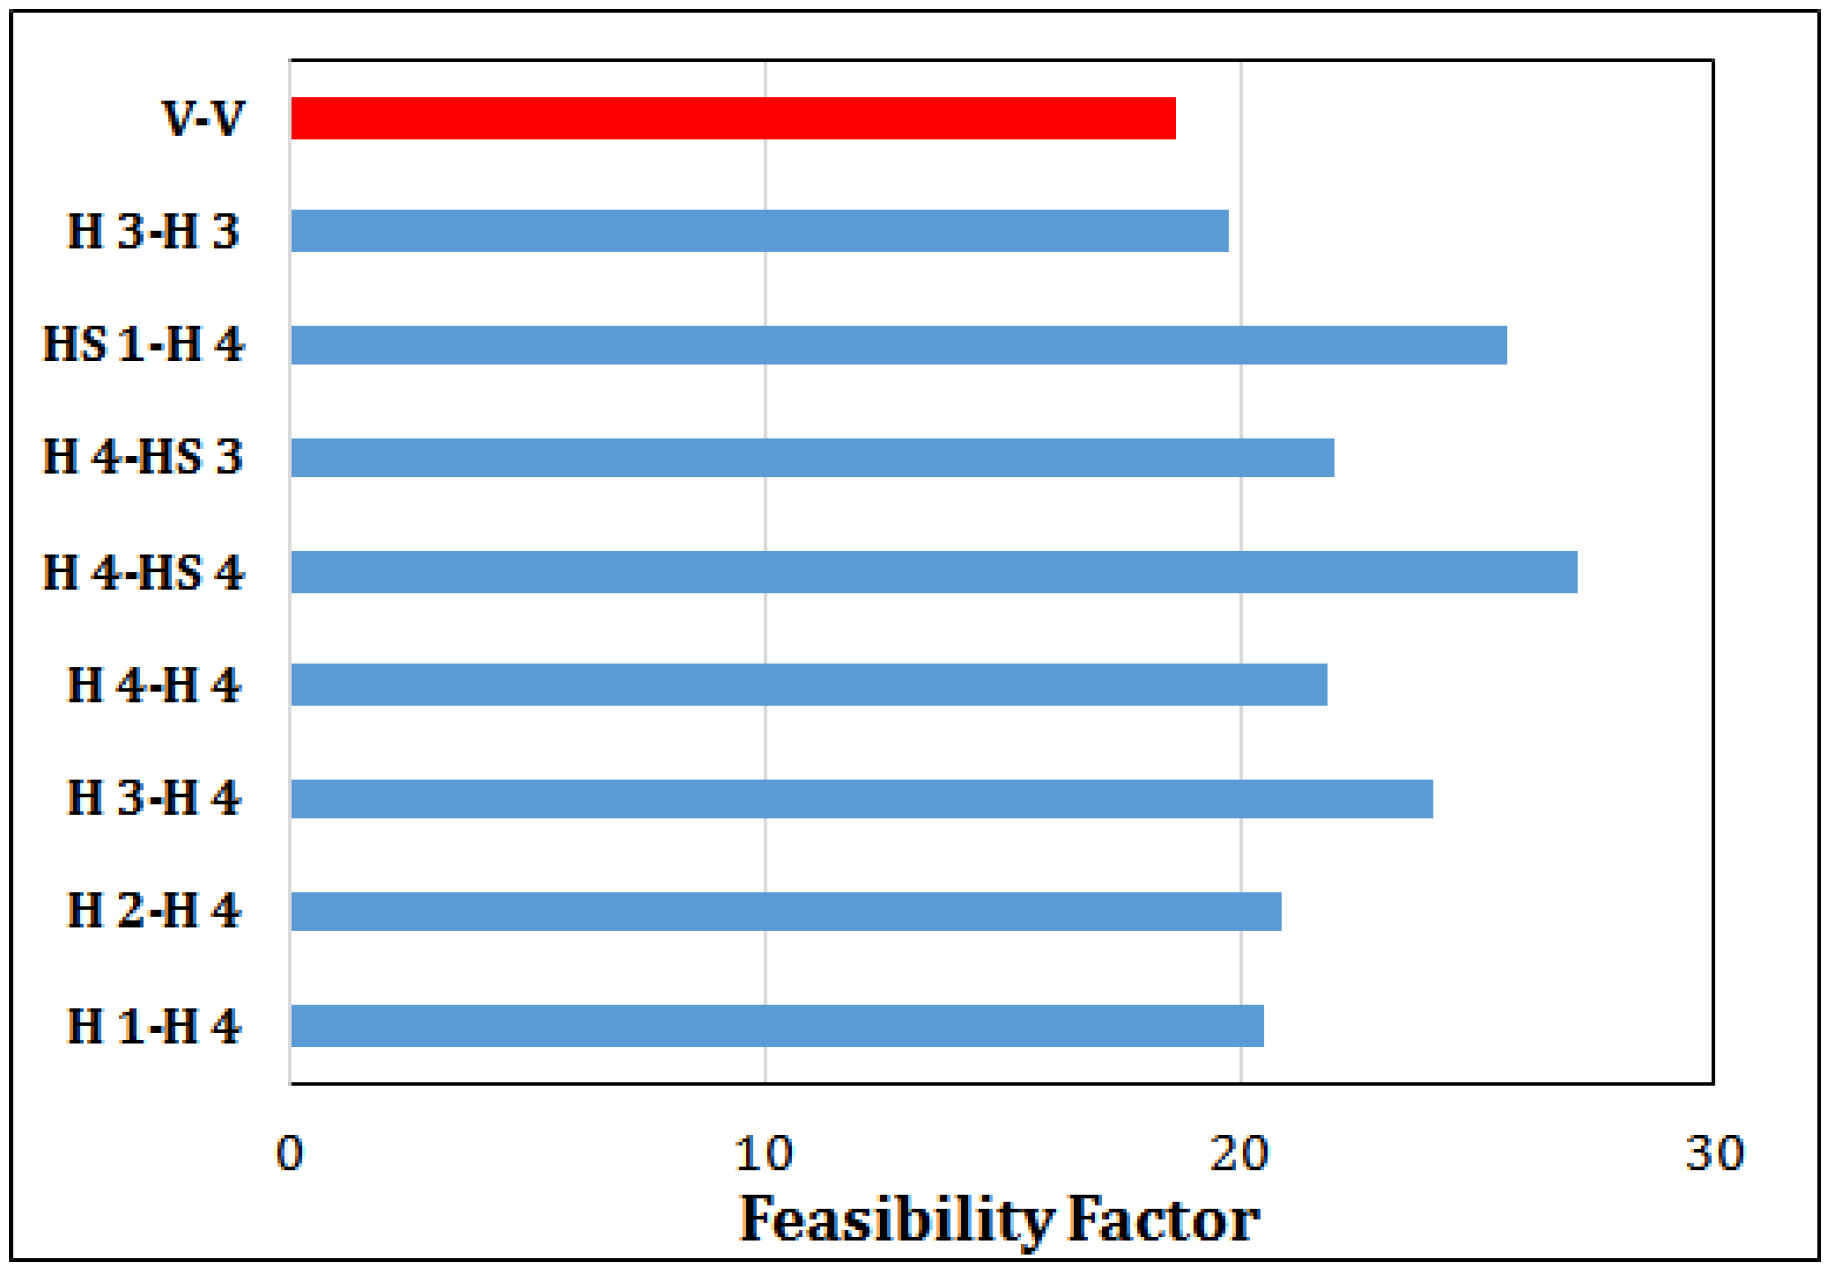
4. Discussion of Results

All of the combinations have been simulated and categorized on the basis of the EOR performance of the reference case. In that case, approximately 4.4 PV (pore volume) fluids were injected for 1589 days. The final oil rate reached 16.69 m3/day, and approximately 82% of the oil in place (OIP) was recovered for the V-V combination. The results for the other combinations have been divided into three categories according to the following standards:
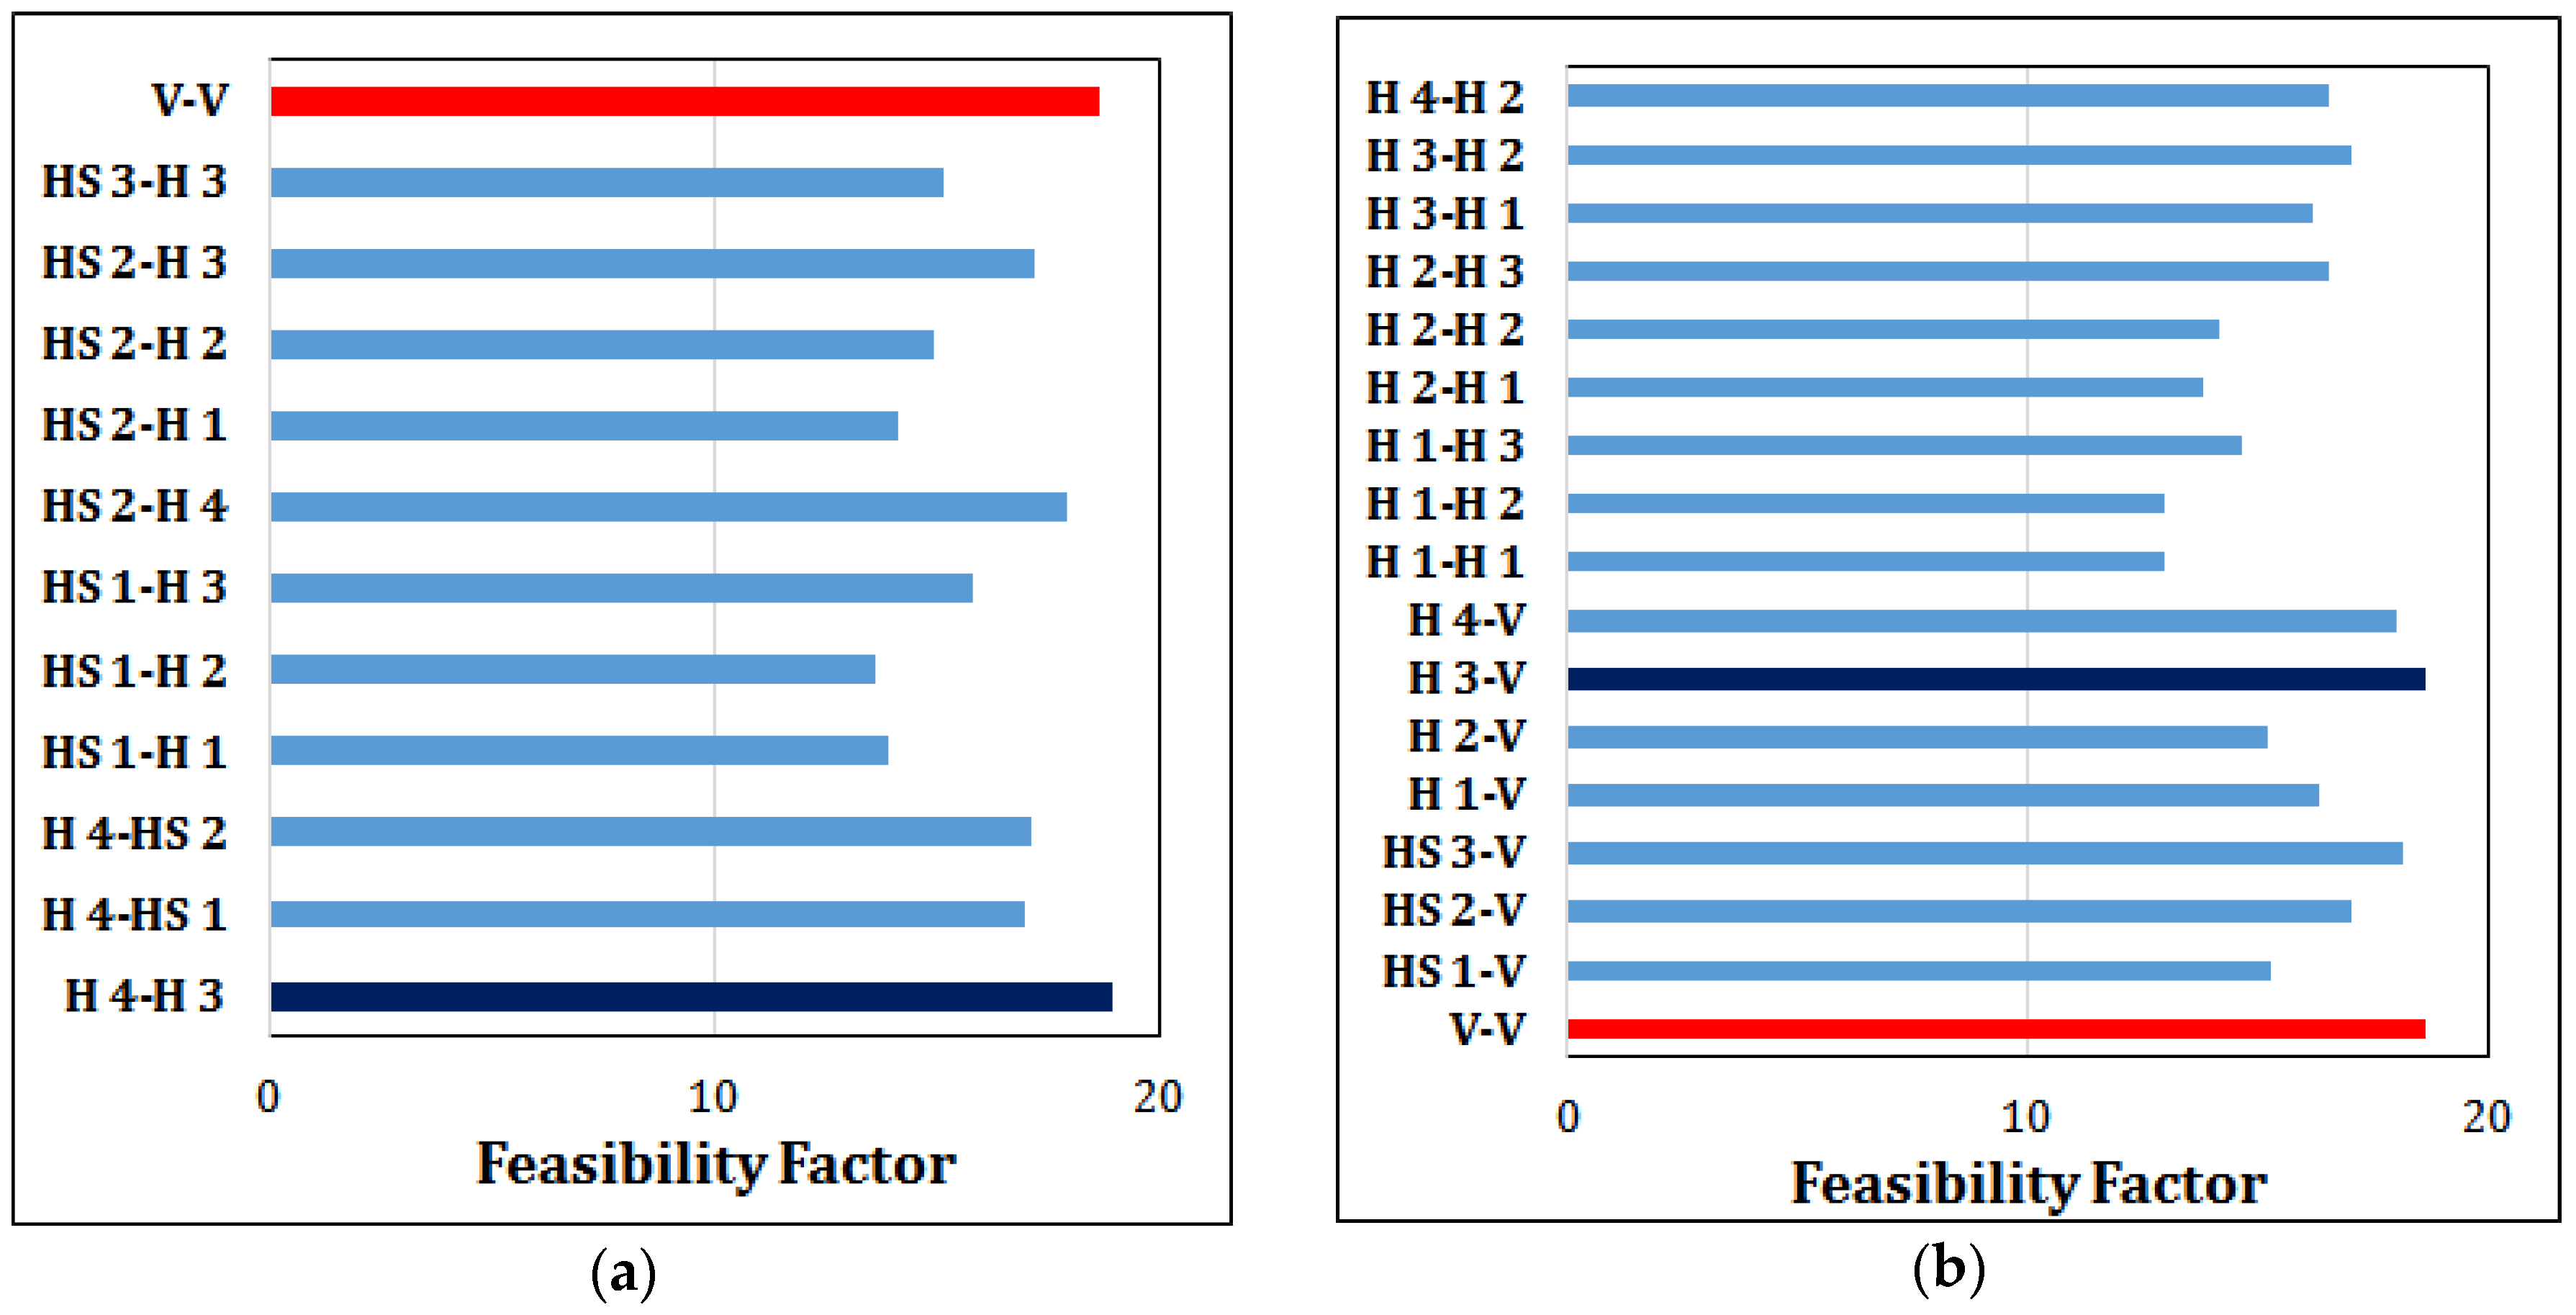
  • Category A: Combinations that have a higher oil recovery and injected fluid volume than the reference case. This category will be further examined to determine whether or not these combinations are acceptable on the basis of the feasibility factor.
  • Category B: Combinations that have a higher oil recovery but lower injected fluid volume than the reference combination. Obviously, all combinations in this category will be considered to be completely acceptable from a technical point of view.
  • Category C: Combinations that have a lower oil recovery than the reference combination. These combinations are completely rejected owing to the infeasibility of deploying the EOR project.

4.1. Category A

Category A includes seven combinations of the H-V case and 20 combinations of the H-H case, and generally, the H-H case gives a higher oil recovery. Figure 1 shows the oil production performance of some of the well combinations in this category. A very high oil recovery was achieved by some predominant combinations, such as H 1-H 3, H 2-H 3, and HS 2-H 4 with 89.48%, 91.07%, and 89.70% of the OIP produced, respectively. However, these combinations also needed a high volume of injected fluids during the EOR processes with 6.1, 5.5, and 5.0 injection PV for well combinations H 1-H 3, H 2-H 3, and HS 2-H 4, respectively, in comparison with the reference case. Generally, the injectivity of all of the well combinations in this category was relatively high, although the oil sweep efficiency partly depended on the locations of the wells. In detail, the highest volume of 6.6 PV has been injected to recover only 85.52% of the OIP for the H 1-H 2 combination, whereas the H 4-H 3 combination recovered more than 89% of the OIP with only 4.7 PV injected. In particular, it is evident from Figure 1 that all combinations that have horizontal producing wells located in layers 3 and 4 always give a very high oil recovery with more than 87% of the OIP. However, the effective EOR performance is not only based on the cumulative oil production but also on the injected volume.
In order to evaluate the results of the combinations belonging to Category A comprehensively, this work defines a parameter called the feasibility factor (FF). This factor is simply calculated by dividing the recovery factor (RF) by the cumulative injected fluid volume (IV) for each combination until the end of the EOR project as follows:
FF = RF × 100 IV
Following the formula, FF of the V-V case is 82% × 100/4.4 = 18.6; this value will be applied as the standard value in order to compare FF with other combinations. The criterion for selecting the feasible combinations is that a combination must have a value of FF that is higher than the standard value. Figure 2 shows the values of FF for all well combinations belonging to the H-V and H-H cases.
As can be seen in Figure 2, even though there are many combinations in this category with a high oil recovery, only two well combinations have a value of FF that is higher than 18.6, which are H 3-V and H 4-H 3. These two combinations can be considered as effective patterns for deploying the EOR project.

4.2. Category B

This category consists of the most effective combinations that make the EOR performance more successful than the reference case. All well combinations in Category B belong to the H-H case. These are H 1-H 4, H 2-H 4, H 4-H 4, H 4-HS 3, H 4-HS 4, HS 1-H 4, and H 3-H 3. These combinations not only give the high oil recovery until the end of the EOR processes but also require less liquid volume to be injected into a reservoir compared to the reference combination. In detail, the H 2-H 4 combination gives the highest oil production, with nearly 92% of the OIP at 15.74 m3/day after the injection of 4.4 PV liquids, whereas the H 4-HS 3 requires 3.8 PV to recover approximately 83% of the OIP after 1379 simulation days. Figure 3 shows the oil production performance of all combinations belonging to this category.
Again, it is easily recognized that all of the effective combinations in this category have horizontal producers located in layers 3 and 4 (the same as Category A); therefore, it is concluded that the injection well patterns of these combinations mainly determine the sweep efficiency and injectivity of the EOR processes for either Categories B or A.
Obviously, if the FF is considered for Category B, it will be significantly higher than the reference case, as shown in Figure 4.
Figure 4 confirms that these combinations are the most relevant well patterns to consider when carrying out EOR projects from technical and economic (in terms of the injected volume) points of view.

4.3. Category C

The rest of the well combinations are categorized in Category C as the least effective well patterns owing to their low cumulative oil production compared to the performance of the reference case. As illustrated in Figure 5, the maximum oil recovery factor of this group is 81.74% for the HS 3-H 2 combination after injected 4.9 PV liquids over 1371 days, whereas nearly 67% OIP has been produced by HS 3-H 1(P) combination after 5.2 PV displacing fluid being pumped for 1420 days.
The results also show that the most inefficient EOR performance is observed for the H 45-H 45 group out of all of the combinations, which exhibited a very low oil production and also required a high injected volume compared to the reference well combination. As can be seen, the H 45-H 45-2 combination produced only 58.4% of the OIP after being injected with a 6.3 PV displacing liquid volume, whereas the H 45-2-H 45-1 combination produced 59.3% of the OIP with a 6.4 PV injected fluid volume. As a consequence, it is clear that all of the well combinations in Category C should be rejected from both technical and economic points of view.
With regard to the injection well patterns, it is confirmed that the EOR process will not perform properly if the relevant injection well is not installed in terms of either the well patterns or locations, even though the horizontal producer is located in layers 3 and 4. Theoretically, the injection well pattern mostly determines the directions of the displacing fluids propagating within the reservoir, whereas the well location determines the uniformity of the swept area due to the different permeable layers. This is apparently confirmed for the vertical injection well, which is always completed with a full reservoir thickness; therefore, the injected fluids can flow uniformly in all layers as a result of the injecting liquid contemporarily, whereas the producer can produce throughout the entire reservoir thickness. In addition, this argument is demonstrated for the combinations of two full length horizontal wells as the most predominant well pattern in terms of successful EOR. When the horizontal injector is parallel to the horizontal producer, particularly when the two wells fully occupy the Y-axis, the injected liquids will predominantly be oriented towards the producer rather than other aspects. However, these horizontal combinations still give a high sweep efficiency over the whole reservoir owing to the good mobility control of SP flooding since a polymer was injected. Obviously, it is very difficult to obtain the most optimal EOR development by horizontal well without considering the effect of either anisotropic permeability or well pattern parameters [23]. Therefore, the results of this work are still restricted in terms of covering the other more complicatedly heterogeneous reservoirs in which the orders of permeable layers are completely different.
Figure 6 clearly shows the orientations of the displacing fluids and the sweep efficiencies of three representatives of each category through oil-saturation profiles until the end of the EOR project. In reference case, the difference of fluid propagation velocity between layers is the result of heterogeneity, therefore almost oil in layer 1 and 2 has been swept while a considerable amount of oil still remained in the rest of reservoir at the end of the project. For H-H group, initially fluids flow predominantly in the layer where the injector located, thereafter propagating in other layers with the gradual increases of uniformity as the result of improved crossflow; however the fluids flow with higher velocity in high permeable layer (layers 1 and 2), thus oil is swept less thoroughly in bottom layers (layers 3 and 4). Due to that mechanism, the horizontal production well installed in bottom layers will support the propagation of fluids better than in high permeable layers. In H 45-2-H 45-4, a very limited area of oil has been displaced and produced due to the close distance between two well and the opposite facing; furthermore, in this case, the fluid flows from the injector to producer majorly depend on the interlayer crossflow, therefore resulting the failed EOR performance.

5. Conclusions

Nearly all interchanged well combinations have been investigated in order to select the optimistic enhanced oil recovery performance and reject the infeasible combinations from either technical or economical points of view in a multilayered reservoir system. The vertical injector and producer are standardized in terms of the oil production performance and a predefined feasibility factor for the purposes of evaluation and categorization. In total, 10 combinations in Categories A and B have been selected on the basis of the feasibility factor; however, practically, the best one should be chosen with consideration of all other critical factors for a real project.
From the simulation results, it is demonstrated that combinations that have a horizontal producer located in bottom layers always give a high productivity rather than located in the higher permeable layers. In addition, the success of EOR performance also depends on either well pattern or location of the injector in terms of sweep efficiency. The results have proved the effectiveness of utilizing horizontal injection well for chemical flooding, particularly when the injector is parallel and opposite to the horizontal producer; however, selection of Short length or Full length still depends on a comprehensive evaluation of the project.
The sweep efficiency is evaluated crucially through oil saturation profile that reflects the effect of reservoir system properties and well spacing on the fluid propagation. The close distance between two wells presents the negative effect on enlarging the displacing fluids then limits the swept area, while the un-uniform profile is mainly caused by the heterogeneity of the reservoir even though the crossflow has been improved by the injected polymer. Understanding the effects of the well combinations associated with reservoir system features on EOR performance for SP flooding will contribute to the success of oil recovery plans in terms of technical and economic issues.

Acknowledgments

This work was supported by Inha University Research Grant. Data were provided by the Computer Modelling Group (CMG).

Author Contributions

All authors have worked on this manuscript together and all authors have read and approved the final manuscript.

Conflicts of Interest

The authors declare no conflicts of interest.

References

  1. Ferreira, H.; Mamora, D.D.; Startzman, R.A. Simulation studies of waterflood performance with horizontal wells. In Proceedings of the SPE Permian Basin Oil and Gas Recovery Conference, Midland, TX, USA, 27–29 March 1996.
  2. Hadia, N.; Chauhari, L.; Sushanta, K.; Vinjamur, M.; Singh, R. Experimental investigation of use of horizontal wells in water flooding. Pet. Sci. Eng. 2007, 56, 303–310. [Google Scholar] [CrossRef]
  3. Popa, C.G.; Turta, A.T. Waterflooding by horizontal injectors and producers. In Proceedings of the SPE International Thermal Operations and Heavy Oil Symposium and International Horizontal Well Technology Conference, Calgary, AB, Canada, 4–7 November 2002. Paper Number SPE 78989-MS.
  4. Popa, C.G.; Clippea, M. Improved waterflooding efficiency by horizontal wells. In Proceedings of the SPE International Conference on Horizontal Well Technology, Calgary, AB, Canada, 1–4 November 1998. Paper Number SPE 50400-MS.
  5. Algharaib, M.; Ertekin, T. The efficiency of horizontal and vertical well patterns in waterflooding: A numerical study. In Proceedings of the SPE Mid-Continent Operations Symposium, Oklahoma City, OK, USA, 28–31 March 1999. Paper Number SPE 52196-MS.
  6. Algharaib, M.; Gharbi, R.B.C.A. Comparative analysis of waterflooding projects using horizontal wells. In Proceedings of the SPE Middle East Oil and Gas Show and Conference, Sanabis, Kingdom of Bahrain, 12–15 March 2005. Paper Number SPE 93743-MS.
  7. Dai, Z.; Viswanathan, H.; Fessenden-Rahn, J.; Middelton, R.; Pan, F.; Jia, W.; Lee, S.; McPherson, B.; Ampomah, W.; Grigg, R. Uncertainty quantification for CO2 sequestration and enhanced oil recovery. Energy Proced. 2014, 63, 7685–7693. [Google Scholar] [CrossRef]
  8. Dai, Z.; Middleton, R.; Viswanathan, H.; Fessenden-Rahn, J.; Bauman, J.; Pawar, R.; Lee, S.; McPherson, B. An integrated framework for optimizing CO2 sequestration and enhanced oil recovery. Environ. Sci. Technol. Lett. 2013, 1, 49–54. [Google Scholar] [CrossRef]
  9. Taber, J.J.; Seright, R.S. Horizontal injection and production wells for EOR or waterflooding. In Proceedings of the SPE Permian Basin Oil and Gas Recovery Conference, Midland, TX, USA, 18–20 March 1992. Paper Number SPE 23952-MS.
  10. Lee, K.S. Efficiency of horizontal and vertical well patterns on the performance of Micellar-polymer flooding. Energy Proced. 2012, 16, 889–894. [Google Scholar] [CrossRef]
  11. Lanier, G.H.; Kok, A.; Young-Mclaren, A.; Al-Riyami, M.M.; Ambusiadi, M.A.; Van Wunnik, J.N.M. Conformance control in horizontal wells for steam and polymer flooding projects in the Sultanate of Oman. In Proceedings of the SPE EOR Conference at Oil & Gas West Asia, Muscat, Oman, 11–13 April 2010. Paper Number SPE 129156-MS.
  12. EI-Abbas, A.M.; EI-Sallaly, E.M.; Sayyouh, M.H.; EL-Batanony, M.H.; Darwich, T.M.; Desouky, S.M. Feasibility of oil recovery by chemical flooding through horizontal wells. In Proceedings of the SPE International Conference on Horizontal Well Technology, Calgary, AB, Canada, 1–4 November 1998. Paper Number SPE 50431-MS.
  13. Dakhlia, H.; Wu, W.J.; Lim, M.T.; Delshad, M.; Pope, G.A.; Sepehrnoori, K. Simulation of surfactant flooding using horizontal wells. In Proceedings of the Annual Technical Meeting of the Petroleum Society of CIM, Calgary, AB, Canada, 7–9 June 1995. Paper Number PETSOC 95–82.
  14. Gharbl, R.B.; Peters, E.J.; Elkamel, A.; Afzal, N. The Effect of hetoregeneity on the performance of EOR processes with horizontal wells. In Proceedings of the SPE Western Regional Meeting, Long Beach, CA, USA, 25–27 June 1997. Paper Number SPE 38320-MS.
  15. EI-Abbas, A.; Shedid, A. Experimental investigation of the feasibility of steam/chemical steam flooding processes through horizontal wells. In Proceedings of the SPE Asia Pacific Oil and Gas Conference and Exhibition, Jakarta, Indonesia, 17–19 April 2001. Paper Number SPE 68768-MS.
  16. Ling, Z.; Wang, L.; Hu, J.; Li, B. Flood pattern optimization of horizontal well injection. Pet. Explor. Dev. 2008, 31, 85–91. [Google Scholar] [CrossRef]
  17. Najafabadi, N.F.; Delshad, M.; Han, C.; Sepehrnoori, K. Formulation for a three-phase, fully implicit, parallel, EOS compositional surfactant-polymer flooding simulator. J. Pet. Sci. Eng. 2012, 86, 257–271. [Google Scholar] [CrossRef]
  18. Carrero, E.; Queipo, N.V.; Pintos, S.; Zerpa, L.E. Global sensitivity analysis of alkali-surfactant-polymer enhanced oil recovery processes. J. Pet. Sci. Eng. 2007, 58, 30–42. [Google Scholar] [CrossRef]
  19. Sharma, T.; Velmurugan, N.; Patel, P.; Chon, B.H.; Sangwai, J.S. Use of oil-in-water pickering emulsion stabilized by nanoparticles in combination with polymer flood for enhanced oil recovery. Pet. Sci. Technol. 2015, 33, 1595–1604. [Google Scholar] [CrossRef]
  20. Lohne, A.; Fjelde, I. Surfactant flooding in heterogeneous formations. In Proceedings of the SPE Improved Oil Recovery Symposium, Tulsa, OK, USA, 14–18 April 2012. Paper Number SPE 154178-MS.
  21. Lee, K.S. Performance of polymer flood with shear-thinning fluid in heterogeneous layered systems with crossflow. Energies 2011, 4, 1112–1128. [Google Scholar] [CrossRef]
  22. Liu, S.; Li, R.F.; Miller, C.A.; Li, R.F.; Hirasaki, G. Alkaline/surfactant/polymer processes: Wide range of conditions for good recovery. SPE J. 2010, 15, 282–293. [Google Scholar] [CrossRef]
  23. Liu, Y.T. Methodology for horizontal well pattern design in anisotropic oil reservoirs. Pet. Explor. Dev. 2008, 35, 619–624. [Google Scholar] [CrossRef]
Figure 1. Oil production performance of several well combinations belonging to Category A: (a) H-V case and HS-V group; (b) H-H group; (c) HS-H and H-HS groups.
Energies 09 00244 g001
Figure 2. Comparison of the values of FF between the combinations in Category A and the reference case: (a) HS-H, H-HS and H-H groups; (b) H-H group, H-V case and HS-V group.
Energies 09 00244 g002
Figure 3. Oil production performance of several well combinations belonging to Category B: (a) H-H group; (b) H-H, H-HS and HS-H groups.
Energies 09 00244 g003
Figure 4. Feasibility factor of all of the combinations belonging to Category B.
Energies 09 00244 g004
Figure 5. Oil production performance of several well combinations belonging to Category C: (a) H-V and V-H cases, V-HS, HS-H (P) and H 45-H 45 groups; (b) V-H case, HS-HS, HS-H and H 45-H 45 groups.
Energies 09 00244 g005
Figure 6. Oil saturation profiles of various well combinations during the EOR processes until the end of the project: (a) V-V; (b) H 3-H 1; (c) H 3-H 3; (d) H 45-2-H 45-4.
Energies 09 00244 g006aEnergies 09 00244 g006b
Table 1. Reservoir parameters.
Reservoir Model PropertiesValues
Grid15 × 15 × 8
Porosity0.2
Horizontal permeability
Layer 11200 md
Layer 21000 md
Layer 3500 md
Layer 4300 md
Initial oil saturation0.5
Depth396.34 m
Reservoir pressure4.136 MPa
Table 2. Well pattern descriptions of the H-V case.
InjectorFull LengthShort LengthStraight Line
Layer 1H 1-VHS 1-VH 45-1-V
Layer 2H 2-VHS 2-VH 45-2-V
Layer 3H 3-VHS 3-VH 45-3-V
Layer 4H 4-VHS 4-VH 45-4-V
Table 3. Well pattern descriptions of the V-H case.
ProducerFull LengthShort LengthStraight Line
Layer 1V-H 1V-HS 1V-H 45-1
Layer 2V-H 2V-HS 2V-H 45-2
Layer 3V-H 3V-HS 3V-H 45-3
Layer 4V-H 4V-HS 4V-H 45-4
Table 4. Well pattern descriptions of H-H group.
ProducerLayer 1Layer 2Layer 3Layer 4
Injector
Layer 1H 1-H 1H 1-H 2H 1-H 3H 1-H 4
Layer 2H 2-H 1H 2-H 2H 2-H 3H 2-H 4
Layer 3H 3-H 1H 3-H 2H 3-H 3H 3-H 4
Layer 4H 3-H 1H 4-H 2H 4-H 3H 4-H 4
Table 5. Well pattern descriptions of the H-HS group.
ProducerLayer 1Layer 2Layer 3Layer 4
Injector
Layer 1H 1-HS 1H 1-HS 2H 1-HS 3H 1-HS 4
Layer 2H 2-HS 1H 2-HS 2H 2-HS 3H 2-HS 4
Layer 3H 3-HS 1H 3-HS 2H 3-HS 3H 3-HS 4
Layer 4H 3-HS 1H 4-HS 2H 4-HS 3H 4-HS 4
Table 6. Well pattern descriptions of the HS-H group.
ProducerLayer 1Layer 2Layer 3Layer 4
Injector
Layer 1HS 1-H 1HS 1-H 2HS 1-H 3HS 1-H 4
Layer 2HS 2-H 1HS 2-H 2HS 2-H 3HS 2-H 4
Layer 3HS 3-H 1HS 3-H 2HS 3-H 3HS 3-H 4
Layer 4HS 3-H 1HS 4-H 2HS 4-H 3HS 4-H 4
Table 7. Well pattern descriptions of the HS-HS group.
ProducerLayer 1Layer 2Layer 3Layer 4
Injector
Layer 1HS 1-HS 1HS 1-HS 2HS 1-HS 3HS 1-HS 4
Layer 2HS 2-HS 1HS 2-HS 2HS 2-HS 3HS 2-HS 4
Layer 3HS 3-HS 1HS 3-HS 2HS 3-HS 3HS 3-HS 4
Layer 4HS 4-HS 1HS 4-HS 2HS 4-HS 3HS 4-HS 4
Table 8. Well pattern descriptions of the H45-H45 group.
ProducerLayer 1Layer 2Layer 3Layer 4
Injector
Layer 1-H 45-1-H 45-2H 45-1-H 45-3H 45-1-H 45-4
Layer 2H 45-2-H 45-1-H 45-2-H 45-3H 45-2-H 45-4
Layer 3H 45-3-H 45-1H 45-3-H 45-2-H 45-3-H 45-4
Layer 4H 45-4-H 45-1H 45-4-H 45-2H 45-4-H 45-3-
Table 9. Well pattern descriptions of the H-H (P) group.
ProducerLayer 1Layer 2Layer 3Layer 4
Injector
Layer 1-H 1-H 2 (P)H 1-H 3 (P)H 1-H 4 (P)
Layer 2H 2-H 1 (P)-H 2-H 3 (P)H 2-H 4 (P)
Layer 3H 3-H 1 (P)H 3-H 2 (P)-H 3-H 4 (P)
Layer 4H 4-H 1 (P)H 4-H 2 (P)H 4-H 3 (P)-

