Article

On the Front Lines of a Sustainable Transportation Fleet: Applications of Vehicle-to-Grid Technology for Transit and School Buses

Department of Civil, Environmental, and Construction Engineering, University of Central Florida, Orlando, FL 32816, USA
*
Author to whom correspondence should be addressed.
Energies 2016, 9(4), 230; https://doi.org/10.3390/en9040230
Submission received: 10 December 2015 / Revised: 23 February 2016 / Accepted: 8 March 2016 / Published: 24 March 2016
(This article belongs to the Special Issue Multi-Disciplinary Perspectives on Energy and Sustainable Development)

Abstract

:
The electricity generation/supply and transportation sectors are the two largest contributors to greenhouse gas (GHG) emissions in the U.S., and vehicle-to-grid (V2G) technology is a rapidly emerging solution to reduce these emissions with the adoption of battery-electric (BE) vehicles. Deployments of BE transit and school buses are expected to have larger battery capacities than passenger vehicles, making them more feasible candidates for V2G service. Five electricity generation regions are considered for cash flow analysis of BE and diesel transit and school buses over their entire respective lifetimes with the allowance of V2G services’ net revenue. Besides, the environmental benefits of using the V2G system are studied in place of combustion power generation plants for the regulation services of each study region. Air emission externalities are another crucial issue for bus operations because buses are operated near highly populated areas, so these externalities are also studied in this research with the benefits of a V2G emission reduction potential taken into account. The analysis concluded that BE transit and school buses with V2G application have potential to reduce electricity generation related greenhouse-gas emissions by 1067 and 1420 tons of CO2 equivalence (average), and eliminate $13,000 and $18,300 air pollution externalities (average), respectively.

Graphical Abstract

1. Introduction

Altogether, the power generation and transportation sectors were responsible for 58% of the total greenhouse gas (GHG) emissions in the U.S. in 2013 [1]. Therefore, these two main contributors to GHG emissions attract significant amounts of attention from various industries, research institutes, and government organizations as key areas in which to reduce climate change impacts. For this purpose, electric vehicle technologies are a promising alternative fuel initiative for vehicles, and have been supported through a variety of research studies and government incentives [2,3]. Moreover, although energy source of electricity generation is also depended on fossil fuels, electric vehicles are a promising solution for today’s high fossil fuel dependency and the environmental emissions of the transportation sector with the increasing availability of renewable energy sources for electricity generation (please see Supplementary Materials (SM) document Table S1 for electricity generation mix projections) [4]. Since the clean air act cites diesel as one of the most harmful fuel types [5], the adoption of alternative fuel options such as electric vehicles is especially crucial for heavy-duty vehicles, most of which still currently use diesel as their primary fuel source. Fortunately, recent battery and electric motor powertrain developments have removed the main barriers for using electricity as a fuel source for heavy-duty vehicles [6]. Battery electric buses are the most common battery electric heavy-duty vehicle in today’s market, and hundreds of transit and school bus examples can be found in the U.S. However, other heavy-duty vehicle deployment is only limited to refuse trucks, which is still under development stage and only two in-use and 13 planned orders can be found in the U.S. [6].
Early stages in the development of battery electric (BE) buses were not feasible for market adoption due to their low ranges, high initial costs, and other factors. Conversely, today’s BE transit buses are a competitive alternative to internal combustion engine buses as well as other types of alternative fuel buses, such as natural gas and biodiesel buses. Transit bus fleet statistics indicate that the market shares of diesel, natural gas, and electric/hybrid buses in the total U.S. fleet were (respectively) 86.8%, 12.4%, and 0.3% in 2004 whereas the corresponding 2014 market shares for these same fuel types were 56.3%, 16.8%, and 17.9%, respectively [7]. Although the overall market penetration of electric/hybrid vehicles mostly consists of hybrid (electric-diesel) buses (i.e., battery electric transit bus deployment is lower than 0.04% in electric/hybrid bus fleet [6]), this change in market shares clearly depicts the significant deployment of electric powertrain technologies for transit buses in only ten years. In addition, there are almost 500,000 school buses in today’s U.S. fleet, where transit bus fleet only consists of 66,218 buses including bus rapid transit but excluding commuter bus systems [8]. Although reports promoting the greater adoption of alternative fuels for school buses date as far back as the early 2000s, alternative fuel school buses have not yet been as widely adopted as alternative fuel transit buses [9].
Transit buses should be in operation most of the time, as they are purchased to serve and earn revenue for transit authorities. Transit bus operation cycles could require heavy payloads, frequently stop-and-go operational patterns, longer route requirements, and operation schedules of typically seven days a week with revenue hours ranging from 8 h to 12 h compared to the operation schedules of school buses [10]. Chandler et al.’s report states that revenue hours for transit buses could even reach as many as 24 h per day [11]. On the other hand, school bus operation schedules are more feasible for electric buses, because they travel an average of 50 miles per day within a certain route and are in use for 4 to 5 h per day on average [12]. Moreover, school buses are in use mostly for school days, which in the U.S. amounts to a total of only 180 days per year [13]. Therefore, school buses could be a promising and convenient candidate for electrification, but the deployment and application of BE school buses is limited to few experiments in the U.S. which is due to safety certification of battery electric school buses are still in the progress of approval in many states and well-known school bus manufacturers have not been involved in developing such school buses [6].
In addition to sustainable transportation ideas using alternative energy sources, another sector’s harmful emissions from inefficient power plants could be eliminated using a novel technology called the vehicle-to-grid (V2G) system. The main goal of the V2G technology is to support grid operators for their mission to supply grid by reliable electricity service. Thus, V2G technology uses the stored energy from an electric vehicle’s battery during idle times to supply electricity to the local power grid for reliable and sustainable service. The average electricity grid system has several demand fluctuations throughout any given time period, and today’s utility service providers use combustion power generation systems to supply these demand changes for continuous service, although these conventional systems have significant environmental emission impacts. Alternately, instead of using combustion power generators, utility service providers may be required to buy electricity from other nearby available providers to supply high demand, but doing so is often inefficient in terms of cost or environmental concerns. On the other hand, grid providers have contracts with V2G service providers (often electric vehicle or fleet owner) for fixed rates of per unit power dispatched (discussed subsequently and rates are shown in SM Table S2. Therefore, grid providers can choose to supply its demand from feasible energy sources which could be V2G system or any other available ancillary service [14].
One of the measures of V2G system capacity is battery storage capacity. BE buses have larger battery sizes compared to electric passenger vehicles, so this study will investigate the potential of V2G service availability from BE transit and school buses in the U.S. in terms of economic and environmental benefits. In addition, these bus types are compared with internal combustion engine diesel buses in terms of cumulative cash flow and air emission externality results for the operation-related downstream (on-site) and upstream (off-site) emission impacts. Since transit and school bus operations generally occur in or near highly populated areas, it is crucial to present air emission externalities as an environmental impact category.
Kempton and Tomic and Kempton et al.’s studies [14,15,16] are cited in this research extensively for some of the materials and method that is used for V2G related impact analysis. Furthermore, their studies provide key elements that lead the research of V2G technology and their research is advanced by adding cash flow and environmental impact analyses. As opposed to the most of V2G related studies with passenger vehicle examples, this research used transit and school buses for its analysis. Noel and McCormack [12] presented comparison analysis of diesel and BE school bus using V2G, however it did not consider lifetime cash flow analysis of both buses, V2G related emission savings, and diesel production related (upstream) emission externalities in five ISO regions. Therefore, this study distinguishes itself from previous efforts in the research community by considering both transit and school buses for V2G applications, including regional electricity generation mixes, and completing this analysis with the comparison of diesel buses and air pollution externalities for public health. The organization of this article is structured as follows; the background information on the life cycle costs, vehicle to grid technology, and the air pollution externalities are summarized in a table. Then the mathematical content of the used methods are explained and the assumptions and preliminary data are described. Finally, the results are presented and the study is concluded.

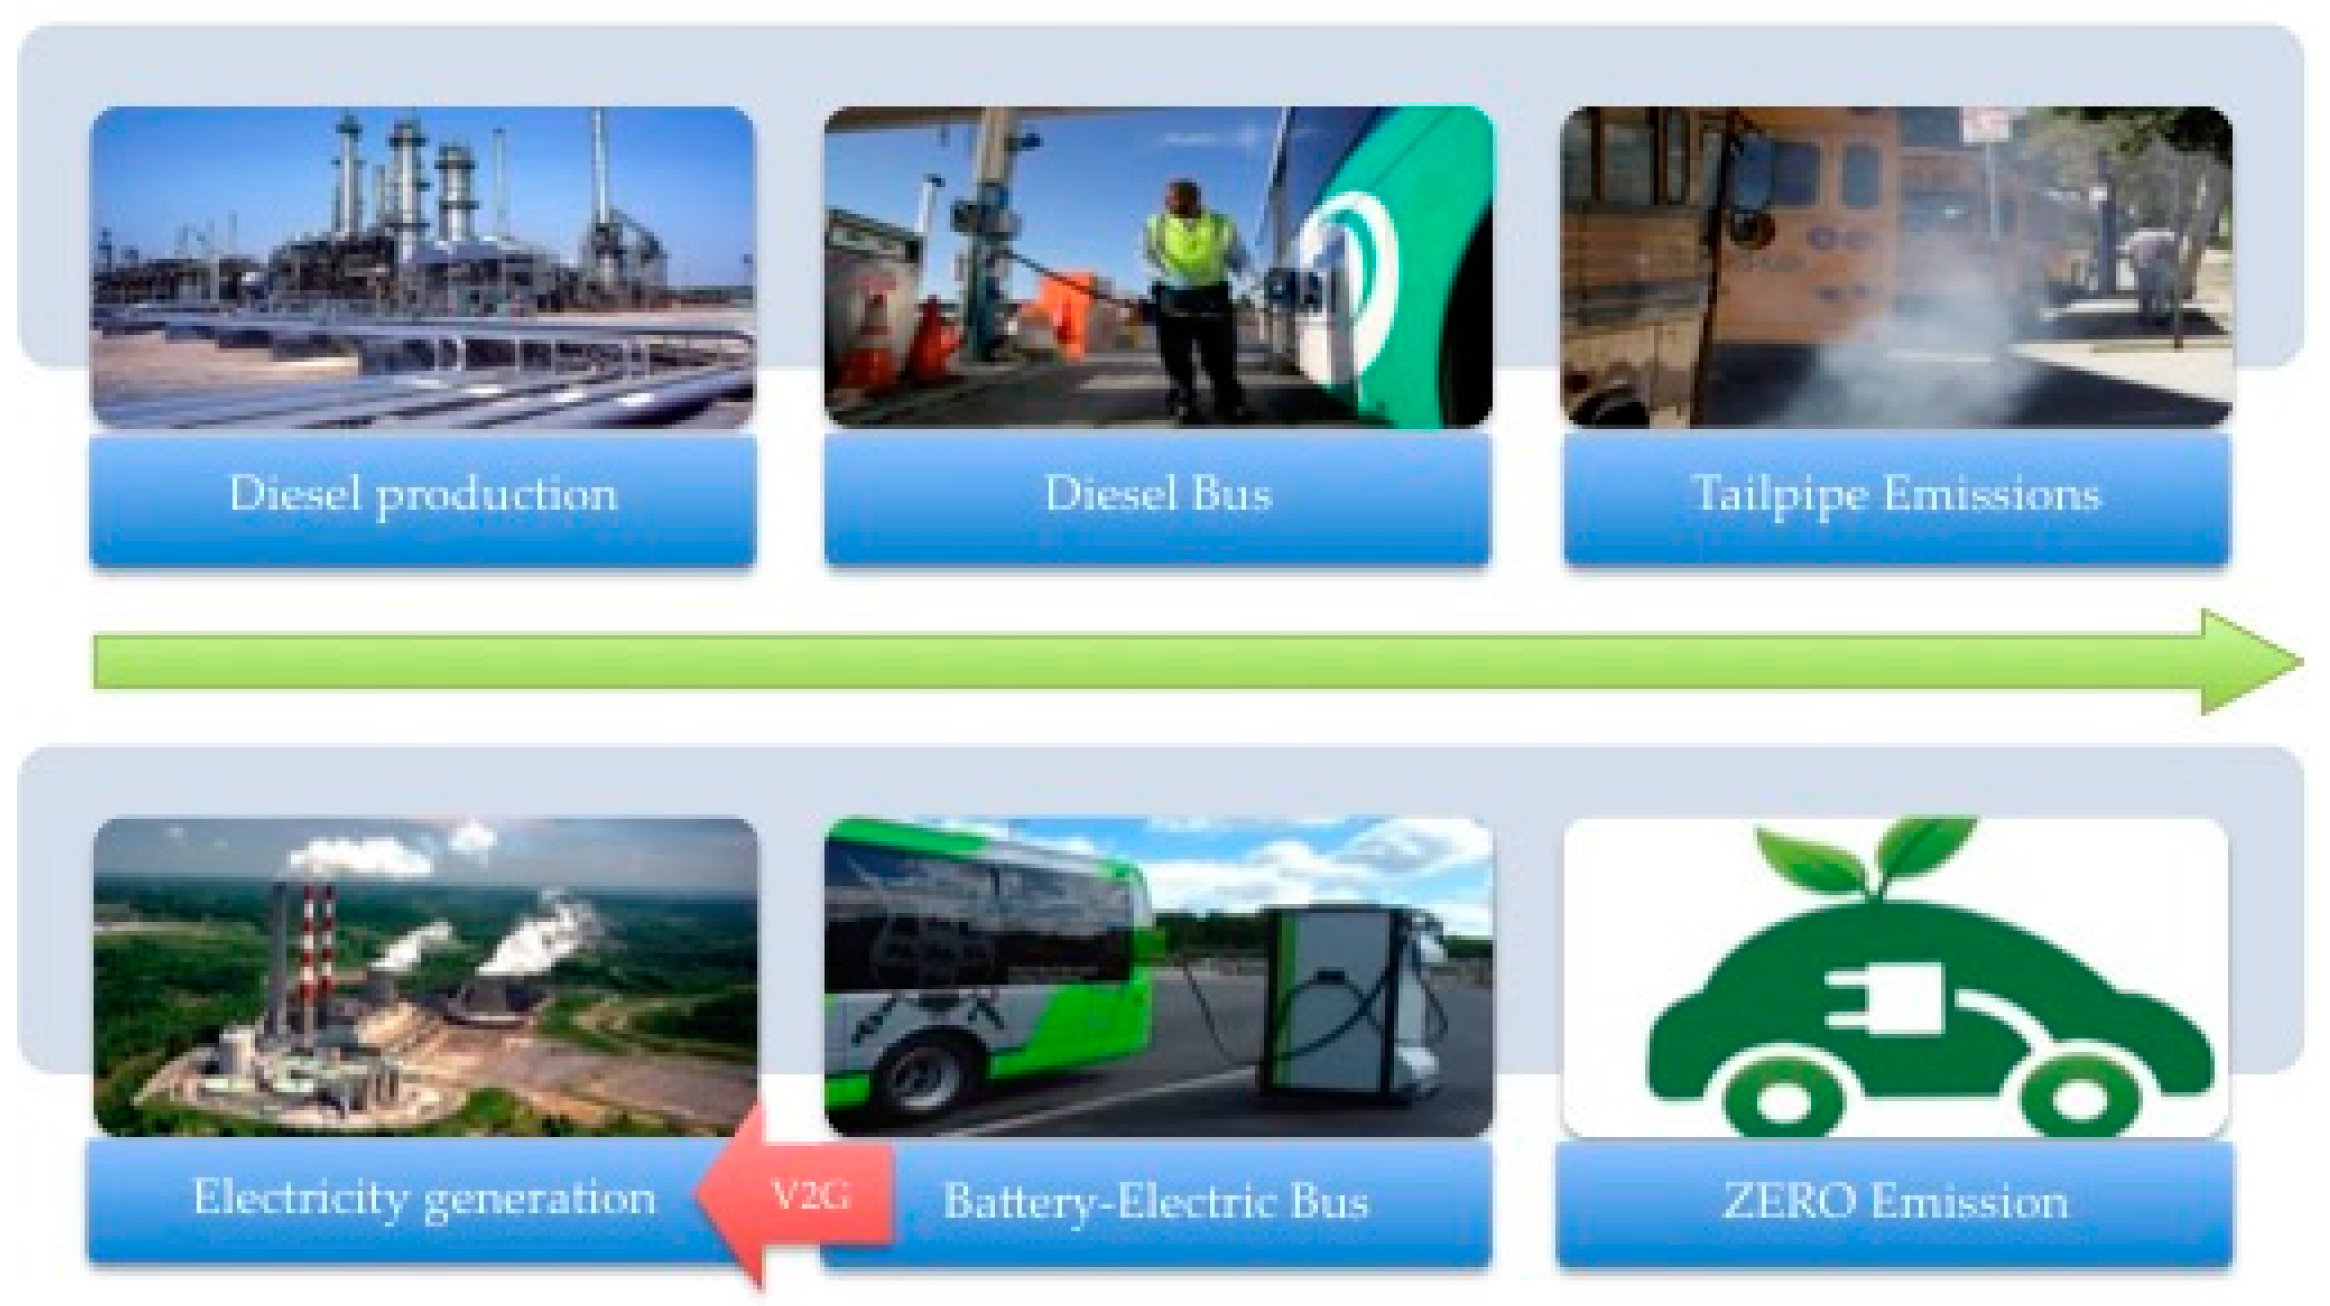
2. Background Information

Life cycle assessment (LCA) methodology is widely used in the literature to analyze on-road vehicles with different fuel options. This methodology can also be utilized for V2G technology applications. Some of the examples of BE vehicle studies are presented in Table 1 with V2G availability. Integration of air pollution externalities and LCA results is also crucial for transportation and electricity generation sectors, so Table 1 also presents some of studies that provide on-road vehicle use related externalities. More detail discussion of following literature can be found in Supplementary Materials document under Section S1.

3. Materials and Methods

3.1. Environmental Emission Calculation Methods

LCA method is utilized in this research and it only considers the use phase of transit and school buses, and a well-to-wheel (WTW) approach is used to assess the relevant downstream and upstream emissions. In addition to the use phase of buses, some of other LCA phases are excluded from this study such as manufacturing and end-of-life. Since two different fuel options are considered for two different types of buses, use phase impacts are distinct for the comparison of these bus type combinations and even though the fuel types are different, manufacturing impacts can be assumed similar due to identical body (shell) types for buses [23,30]. Moreover, this research emphasizes on V2G application for transit and school buses, which is affecting the use phase related impacts.
Each fuel type and vehicle type has different emission characteristics. After identifying the bus and fuel types, the analysis could be separated in terms of downstream-phase and upstream-phase impacts. As per the LCA methodology, downstream impacts can be considered to be on-site activity related impacts, which in this case these are quantified as tailpipe and tire & brake wear (TBW) related emissions. Downstream impacts are gathered from the emission data for diesel transit and school buses from environmental protection agency’s (EPA) widely utilized MOVES tool with the consideration of yearly emission changes [38].
Diesel production and electricity generation activities are also responsible for upstream impacts, corresponding to emissions from petroleum refineries and the applicable power generation and supply sectors, respectively. Therefore, as a part of overall WTW analysis, upstream impacts (well-to-pump WTP) analysis results are gathered from the tool GREET 2015 [39]. The WTW analysis can then be concluded with the summation of downstream and WTP emissions for each bus and fuel type. In Figure 1, the pathway of emissions from diesel bus is graphical illustrated on the upper part where BE bus is shown on lower part of the graph. The only difference that can be captured in this figure relative to regular operation is V2G service availability, which provides support back to the grid as needed. Further explanations on LCA methods and related literatures are discussed further in SM document Section S2.
Different independent system operators (ISOs) or regional transmission organizations (RTOs) regulate electricity prices, and each region’s power plant types determine the environmental emission rates for that region. Therefore, four ISO regions and one RTO region are utilized in this analysis due to lack of corresponding data from other regions (further discussion on region selection and representative U.S map could be found in SM Figure S1). The regions included in this study are: The Pennsylvania-New Jersey-Maryland (PJM) interconnection (RTO region), The New-York ISO (NYISO) region, The ISO-New England (ISO-NE) region, The Electric Reliability Council of Texas (ERCOT) ISO region, and The California ISO (CAISO) region.
The downstream electricity generation impacts of these regions are gathered from the GREET model’s database [39]. Since the analysis in this study covers the full lifetime of the buses in question, the electricity generation emissions should be adjusted with the energy information administration’s (EIA) regional electricity generation mix projection multipliers (please see SM document Table S1) [4]. Upstream (indirect) impacts related to electricity consumption are calculated with eGRID’s gross grid loss factors, allowing the analysis to capture transmission and distribution emissions [40]. Equation (1) calculates the yearly downstream and upstream emissions from electricity generation in each region for each air pollutant type, including a summation of the impacts of each power plant type:
Electricity consumption emissions j r y = [ ( eGRID j r y ) 1 GLF r ] + [ p = 1 10 ( UG j p * EM p r y ) ]
The notation expressed in Equation (1) is explained in Table 2. It should be also noted that regional electricity generation related emissions are expected to decrease for future years with the promises for renewable energy deployments, which can be seen in SM document Table S3 Although there are opportunities to power electric vehicle fleets with only renewable energy sources on site, it is out of scope of this analysis and studied in reference [41].
Similarly, V2G-related emissions are calculated using Equation (2) for each region in each analysis year:
V2G related emission savings r y = [ N disp * M combustion ] [ ( N disp * M grid r y ) + M battery dep ]
where Ndisp is the dispatched electricity (kWh), Mcombustion is the gas combustion turbine emissions rate, Mgrid is the electricity production emissions rate in r region for y year, and Mbattery dep is the emissions rate corresponding to battery depreciation or wear-out from providing V2G services. It should be noted with respect to Equation (2) that gas combustion turbines have relatively low efficiencies and high environmental emission impacts compared to energy storage methods such as those offered via V2G technology. Moreover, separate studies by Lin et al. and by Makarov et al. both argued that combustion turbines that are used for regulation services are two to three times less efficient than energy storage systems [42,43]. Based on this assumption, the value of Mcombustion in Equation (2) is assumed to be two to three times higher than the theoretical gas combustion turbine emissions. Per unit emission factor projections for each type of power plants are considered as normally distributed with ±10% uncertainty. Battery wear-out emissions are calculated from the Li-Ion battery report of EPA (2012), which considers an environmental-LCA analysis of Li-Ion batteries, including emissions from the raw material extraction phase, manufacturing phase, use phase, and end-of-life phase [44].

3.2. Air Pollution Externatilty Calculation Methods

As mentioned in previous sections, there is a wide range of applications for reducing air pollutant emissions from the transportation and electricity generation sectors. These air pollutants are not only harmful to the environment, but also to human health and to the economy. The air pollution emission experiments and policy (APEEP) model quantified these harmful impacts by each pollutant type in terms of dollars [33,34]. Furthermore, the APEEP model has been enhanced through Michalek et al.’s (2011) research to define air pollutant externalities by their area of impact [35]. Transit and school buses are operated mostly near highly populated areas, so it is crucial to present their air pollutant related damage costs. This is especially crucial for school buses compared to transit buses, as the emissions from school buses mainly affect a non-adult population. On-site emissions are treated differently from upstream emissions in terms of their damage costs, since upstream emissions are more likely to occur in or near rural areas. The SM document (please see Table S4) presents the downstream and upstream related air pollutant externalities gathered from Michalek et al.’s [35] study. Total air pollutant externality values for diesel buses and electric buses can in turn be calculated with Equations (3) and (4), respectively:
Air Externality Diesel = j = 1 7 ( UE i j * UA i j ) + j = 1 n ( DE i j * DA i j )   ( Diesel )
Air Externality Electric = j = 1 7 ( K i * B j )   ( Electricity )
where “i” represents the bus type (i = 1 for transit; i = 2 for school). Air pollutant types are indexed using the “j” notation, as previously described in Table 2 above. It should be noted here that BE bus operation related air pollution externalities are measured based on annual electricity consumption which rely on fuel economy and annual mileage values. Then the V2G related emission savings are quantified due to eliminating use of combustion power plants. The electricity consumption of BE buses are same with or without V2G system, however combustion power plants’ emissions can be extinguished by this system, which also lead to the reduction of air pollution externalities.

3.3. Cash Flow and Net Revenue Calculation Methods

Diesel and BE buses for transit and school bus options have different cost parameters due to the specifications required for each bus application. For this reason, the annual cash flow is determined for each bus type, taking into consideration each bus type’s initial cost, maintenance cost (excluding battery), fuel cost (diesel or electricity), battery replacement cost, V2G equipment cost for regulation service, charging facility equipment and installation costs, charging facility maintenance cost, and vehicle, V2G equipment, charging station resale value. Costs corresponding to charging facilities are only considered for BE buses, as it is assumed that suitable diesel fueling station infrastructure are already available to fleet operators. Battery replacement cost is also only considered for BE buses due to the larger and more expensive batteries required for BE buses compared to those required for diesel buses. It is also assumed that all vehicles, V2G equipment on the vehicles and charging station equipment are sold at the end of their respective lifetimes, and the resulting profit is considered to be the total resale value. Finally, cash flow indicators include revenue from using the V2G system, which is represented as a negative value for cash flow. Revenue available from the V2G system for BE bus owners is explained more detail in later sections. Another negative value in cash flow is the tax incentives provided by state governments for purchasing new BE buses. Out of the regions considered in this study, only New York and California are supplying such incentives for new BE bus purchases [45]. For instance, New York provides support with a tax incentive of up to $60,000 for BE buses [46], whereas California offers up to $117,000 in incentives for BE transit buses. California tax incentives are determined by the battery storage size and purchase cost, so the tax incentives offered for a 40 foot BE-transit bus tax incentive could add up to a total from $95,000 to $117,000, whereas the corresponding available BE-school bus incentives could range from $80,000 to $90,000 [47]. In light of this information on cash flow indicators, annual cash flows can be calculated using Equation (5) (corresponding indexes are presented in Table 2 above). All of these cash flow indicators are explained and presented with their references in later sections.
Annual cash flow i r y          = Initial Cost i + Maintenance Cost i + Diesel or Electricity Cost i r y          + Battery Replacement Cost i          + Charging facility equipment and installation cost          + Charging facility maintenance cost          + Cost of V2G Upgrade on Vehicle i          Resale value of vehicle, V2G equipment, charging station          Net revenue of V2G service i r y Tax incentives i r y
Some of the parameters presented in Equation (5) refer to notations presented in Table 3. For instance, the initial cost is Cbus, the maintenance cost is CB-main, the battery cost is Cbattery, the charging infrastructure equipment and installation cost is the sum of Cequipment and Cinstallation respectively, the charging facility maintenance cost is CC-main, and the cost of V2G upgrades for the vehicle is CV2G.
Annual cash flow could be presented as net present annual cash flow, with the consideration of economic parameters such as discount rates (Equation (6)). Like the above-mentioned cash flow indicators, the considered discount rate (Drate) is also described further in later sections and more specifically in Table 3.
Net present annual cash flow i r y = Annual cash flow i r y ( 1 + D rate ) y
One of the key parameters for calculating the total annual cash flow is the revenue earned from providing V2G services, which is another value that must be determined using the methodology developed by Kempton and Tomic [14] and improved by Noori et al., Yang and Tatari, and Yang et al. by considering the applicable degrees of uncertainty and other relevant parameters [59,60,61], and by following the calculation steps adopted from Noori et al.’s EVRO model [14,62]. EVRO is an optimization model previously developed by the authors [62] that uses several previously established methodologies in LCA of energy systems [63,64], Multi Criteria Decision Making [65,66], Decision Making Under Uncertainty [67], Intelligent Transportation Systems [68,69], and Stochastic Optimization [70,71]. The net revenue of using the V2G system can be calculated by simply subtracting the cost of the electricity consumed for charging from the total revenue earned due to providing V2G services. Capacity payments and energy payments are the two main components of total revenue. Capacity payments are measured by the grid operator and rely on the vehicle’s available time for providing V2G services (plugged time) as well as available power capacity parameters. Therefore, Equation (7) is used to calculate the total capacity payment revenue:
Capacity payment = C cap * P dispatch * T plug
where Ccap represents each ISO/RTO region’s payment rates for regulation capacity in $/kwh, Pdispatch is the available power in kW that could be derived from the vehicle, and Tplug is available time (plugged time) in hours of the vehicle in question for providing V2G services. Ccap values for each region could be found in SM Table S5 and all other parameters’ values are presented in Section 4.2, Table 3. As it mentioned in Introduction section, school buses are parked for 18 h to 24 h. However, this range occurs due to number of school days, where school buses are available for 18 h a day for 180 school days of year and 24 h available for rest of the days of a year. Therefore, Tplug value range is calculated with the consideration of number of holidays and school days in a year as it shown in Table 3.
Grid providers also make separate energy payments, the total revenue of which is measured based on the exchanged electricity from regulation signal responses. Equations (8) and (9) (presented below) are used to calculate the total energy payment revenue:
Energy payment = C elect * E dispatch
E dispatch = i = 1 N dispatch P dispatch * T cycle
where Celect is the retail electricity price in $/kWh and Edispatch is the total dispatched electricity in kWh. Celect value projections for future study years are derived from the EVRO model, and their values can be found in SM Table S3 [62]. In the formula for Edispatch (Equation (9)), Ndispatch represents the number of regulation cycles, Pdispatch once again represents the available power in kW, and Tcycle is the regulation cycle duration in hours. The value of Tcycle is assumed to be a random value between 3.6 and 9 min, due to the random occurrence of regulation cycles [16]. The number of regulation cycles (Ndispatch) is a randomly selected value between 30 cycles and 40 cycles, meaning the V2G system responds to regulation request signals 30–40 times [16]. These calculated results are then converted to annual values since the results are to be presented on an annual basis for each projected study year. In order to present results on an annual basis, all of the uncertainties and random selections in the aforementioned calculations are performed for 1000 iterations. Finally, the total revenue is the sum of Capacity payments and Energy payments as shown in Equation (10):
Total Revenue = Capacity payment + Energy payment
On the other hand, the cost of providing regulation services is calculated with vehicle’s battery degradation taken into account. Equation (11) is used to calculate the cost of providing V2G services for fleet owners:
C regu = C battery E battery * E dispatch + C capital
where Cregu represents the gross cost of providing V2G services (excluding revenue), Cbattery is the cost of a new battery in $/kWh, Ebattery is the total amount of energy dispatched from the battery throughout its lifetime in kWh, Edispatch is the dispatched electricity as previously described in Equations (8) and (9), and Ccapital is the annualized capital cost of the battery. The components of the value of Cregu are calculated using Equations (12) through (14) below:
C battery = P cap * C bat unit
E battery = T battery * P cap * D o D
C capital = C battery E battery * E dispatch * D rate 1 ( 1 + D rate ) m
where Pcap represents the battery capacity in kWh, Cbat unit is the unit cost of the battery in $/kWh (see Section 4, Table 3), Tbattery is the total number of charging cycles over the battery’s lifetime, Pcap is the battery’s capacity in kWh, and DoD is the Depth of Discharge of the battery (see Section 4.1). Moreover, Drate is the discount rate for future years, and m is the lifetime of the battery in years. Finally, the net revenue of V2G service can be calculated using Equation (15):
Net Revenue of V2G Service = Total revenue C regu

4. Data Collection

4.1. Transit and School Bus Specifications

As briefly explained in Section 1, transit buses and school buses have different operation conditions and requirements and therefore cannot be analyzed as a single bus type, so detailed data is collected on diesel and BE fuel options for transit and school buses. Table 3 summarizes the overall inputs utilized in this research. The analysis and data collection steps used in this research are performed for 40’ long diesel and BE transit buses and for Type C diesel and BE school buses. More detail transit and school bus types related specifications are explained in SM document Section S3.
Transit buses and school buses are both assumed to have a lifetime of 12 years. Some studies suggest a lifetime of 16 years, but since the American Public Transportation Association (APTA) and the Federal Transit Administration (FTA) both assume a minimum transit bus lifetime of 12 years, this same assumption is used for purposes of this study [72]. Based on this average assumed lifetime, the study period of this study is also determined from 2015 to 2027. The average annual mileages of the bus types in this study are 37,000 miles for transit buses and 12,000 miles for school buses [12,73]. This is a reasonable difference between these two types because transit buses are expected to operate seven days a week whereas school buses only operate on school days, or 180 days per year on average in the U.S. [13]. Based this annual mileage information, the average daily VMTs (DVMT) are calculated for transit and school buses. It must be noted that, in addition to regular daily school bus activity, school buses can also be deployed for field trip duties, which is not accounted for in the value of DVMT calculated in this study.
The initial costs of BE transit and school buses are presented in Table 3. The significant difference between these initial costs for BE buses is also evident for diesel buses. Due to transit buses’ cost incentive requirements (low-floor body type, improved powertrain reliability for higher lifetime mileage compared to school buses, etc.), transit buses are significantly more expensive than school buses. Compared to BE buses’ initial costs, diesel transit buses cost $340,000 each while diesel school buses cost $110,000 each [72]. Resale value and maintenance cost (excluding battery replacement) data references and discussions can be found in SM Section S3.
Another key parameter that differs significantly between transit and school buses is battery capacity. Transit buses have longer-range requirements for uninterrupted revenue service compared to the driving cycle ranges school buses. Therefore, the maximum weight limit of 4000 lb (1814 kg) for transit buses is often utilized [23]. Recent Lithium-Ion (Li-Ion) battery developments allow transit buses to reach driving ranges of up to 250 kilometers with a battery capacity of 324 kWh [74]. However, these technologies are still in an experimental phase, so battery capacity (Pcap) assumptions are made by using transit buses currently in use for transit agencies in the U.S. [30,48]. It is even more difficult to make an accurate assumption for the battery capacity of BE-school buses, since the current deployment of this type is very small in the U.S. as opposed to BE transit buses. Noel and McCormack’s (2014) recent study assumes this battery capacity (Pcap) to be 80 kWh [12]. In addition to battery capacity, the replacement time of the battery over the total vehicle lifetime is also crucial for evaluating emission and cost analysis impacts. Moreover, since battery technology is constantly in terms of capacity and lifetime aspects, this parameter also has a degree of uncertainty that must be taken into account. Therefore, the battery lifetime of transit and school buses are included in this study as a range of charging cycles. As shown in Table 3, this wide range is applicable for both types of buses, and the corresponding range references include broad discussions about the V2G effects on battery lifetime. The literature is still not clear about the impacts of V2G on battery lifetime, since the extent of the depth-of-discharge impacts has not yet been clearly proven [50,75]. Emissions from battery production are based on those in Noori et al.’s study, but one to three times higher than EPA’s reports on Li-Ion battery results since it considers upstream emission impacts of battery production [62,76].
Fuel economy is one of the key components of any life cycle analysis. Table 3 only presents the fuel economy ranges for BE bus types, but diesel bus types have their own separate fuel economy ranges. BE transit buses have lower fuel economy because the passenger payload, number of stops, traffic congestion, climate effects, and other relevant factors all have a stronger influence on fuel economy than on the driving cycles of school buses. On the other hand, the electricity consumption of BE school bus has been tested and reported in Noel and McCormack’s study, where it was found to be as low as 0.75 kWh/mile [12], whereas the California King County School District’s BE school bus testing project reported an electricity consumption rate of 2 kWh/mile [51]. The fuel consumption rates of transit and school diesel buses have been tested in many different aspects, and the resulting data is available from multiple sources. Therefore, transit diesel bus fuel economy is assumed to vary between 2.82 and 4.14 MPDGE (miles per diesel gallon equivalent) and 7 MPDGE for diesel school bus [12,30,77]. Fuel economy related further discussions and references can be found in SM Section S3. Diesel price projection in study regions for next twelve years is also considered and presented in SM Table S6. Tailpipe emissions of diesel buses are also discussed in SM Section S2.1 and Tables S7 and S8.
Charging facility cost is another important requirement for BE vehicle operations, and requires more consideration from fleet owners; in fact, some studies in the available literature aim to optimize the number of charging facilities based on cost limitations [78]. It is assumed that charging facilities should have Level 3 charging for convenient service (please see SM document Section S3 for more details on charging facility assumption). Based on these assumptions, the charging facility cost (Cequipment) is assumed to be same for school and transit BE buses as presented in Table 3. In addition, the charging infrastructure’s installation (Cinstallation) and maintenance (Cc-main) costs are gathered separately from Chang et al.’s report [54]. It is also assumed that charging infrastructure requires annual maintenance at a cost of 5% of the initial equipment cost. The last cost item considered for cash flow calculations is the cost of the necessary upgrades to the vehicle and to the charging facility for accommodating V2G services. Based on Kempton and Tomic’s study, the V2G system equipment cost (CV2G) for buses is expected to be similar to that of other vehicle types from the research, as shown in Table 3 [14].

4.2. Vehicle-to-Grid System Specifications

The total time in which a vehicle is available to provide V2G services (Tplug) is one of the key parameters influencing the total potential revenue that operator could gain from V2G system. From the values of Tplug summarized in Table 3, it can be assumed that school buses could generate more V2G service revenue, while the charging behavior of transit buses during their normal business hours (opportunity charging, as previously discussed) is not applicable for V2G services, meaning that transit buses can only provide V2G services during overnight charging.
Pveh is another key parameter for calculating the overall revenue from BE buses, and is to be determined based on Kempton and Tomic’s study [14]. Equation (16) below has been adopted from their study and applied to the variables previously defined in Section 3 and in Section 4.1. For the average fuel economy (FE) values, Pveh could be calculated as 132 kW for BE school buses and 9.3 kW for BE transit buses with the consideration of battery to grid conversion efficiency factor (Xconvert). The significantly low Pveh value for transit bus is due to the assumption that transit buses return to their charging facilities with a low remaining battery power percentage. On the other hand, school buses use only a small portion of their battery storage power for two-way trip operations, and therefore return to their charging facilities with more available battery power:
P veh = ( P cap ( D VMT B range ) F E ) * X convert T dispatch
In addition to Pveh values, Pdispatch is another factor that determines the allowable power transfer. It is possible for a vehicle’s battery to provide 200 kW, but if it is connected to a Level 1 charger, this power transfer will be limited to the charger’s maximum electricity transfer capacity. As seen in Table 3, Pdispatch is assumed to range from 70 kW to 140 kW. Kempton and Tomic’s calculation method for V2G service revenue states that the higher value between Pveh and Pdispatch can be used for later steps [14]. Therefore, Pveh can be disregarded in this study, and the aforementioned Pdispatch value range is used for calculations.

5. Results

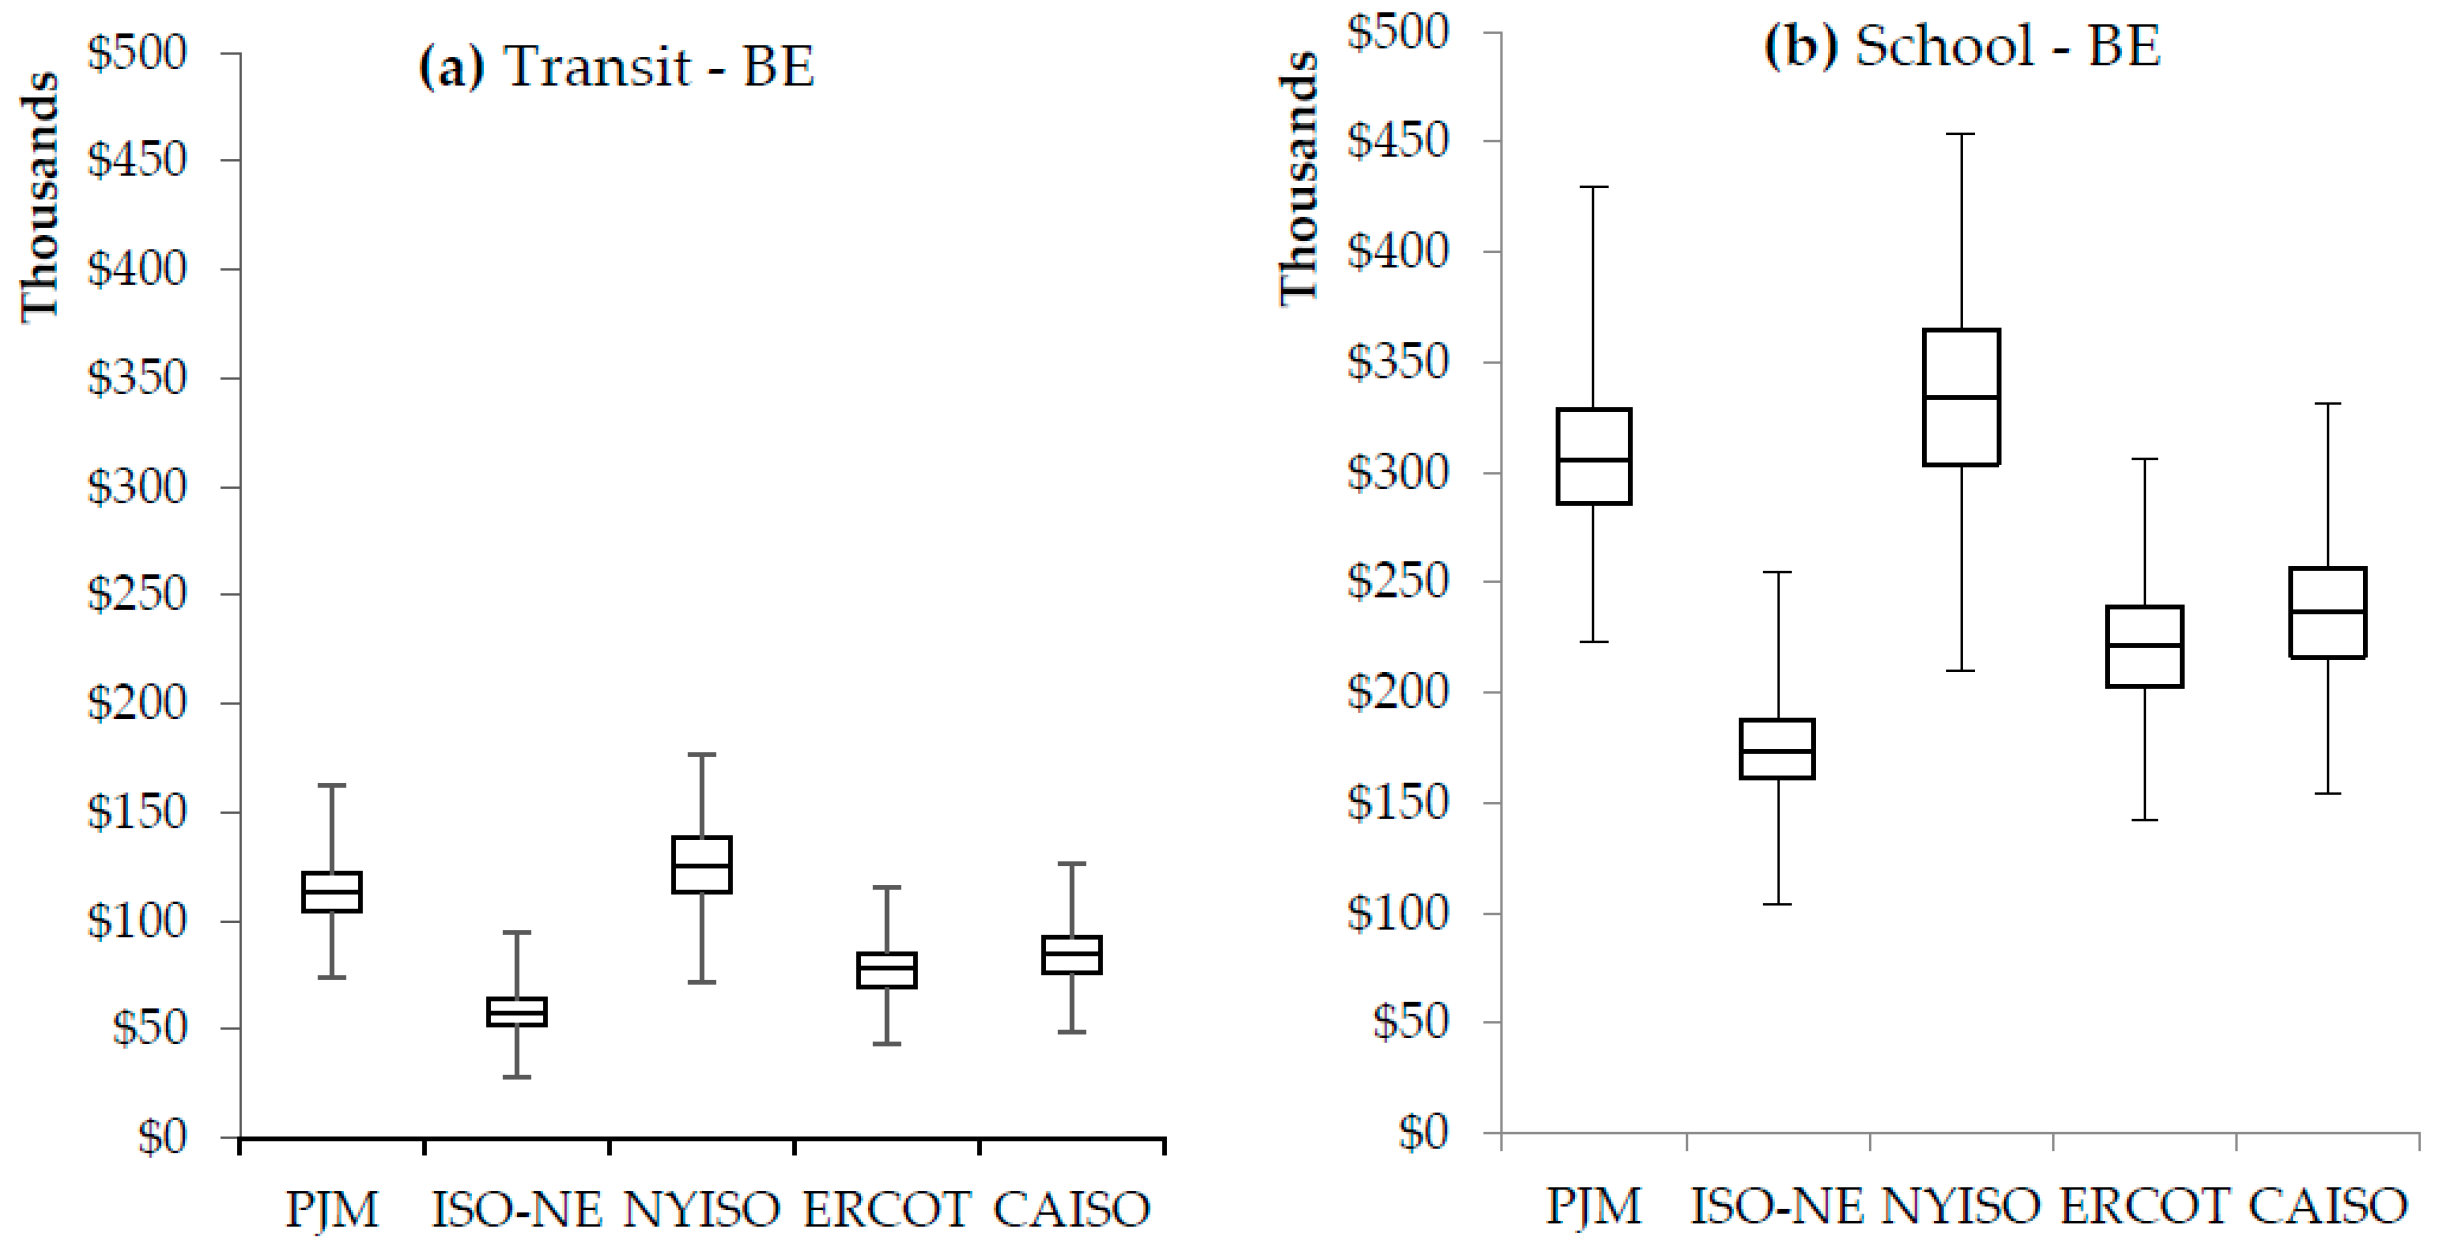
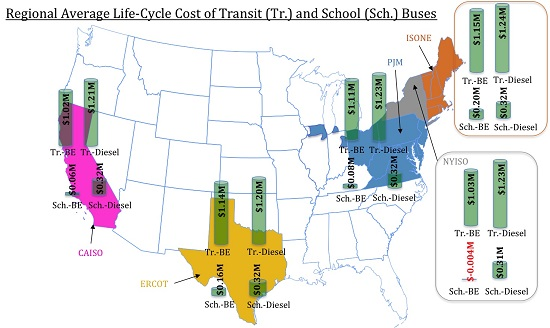
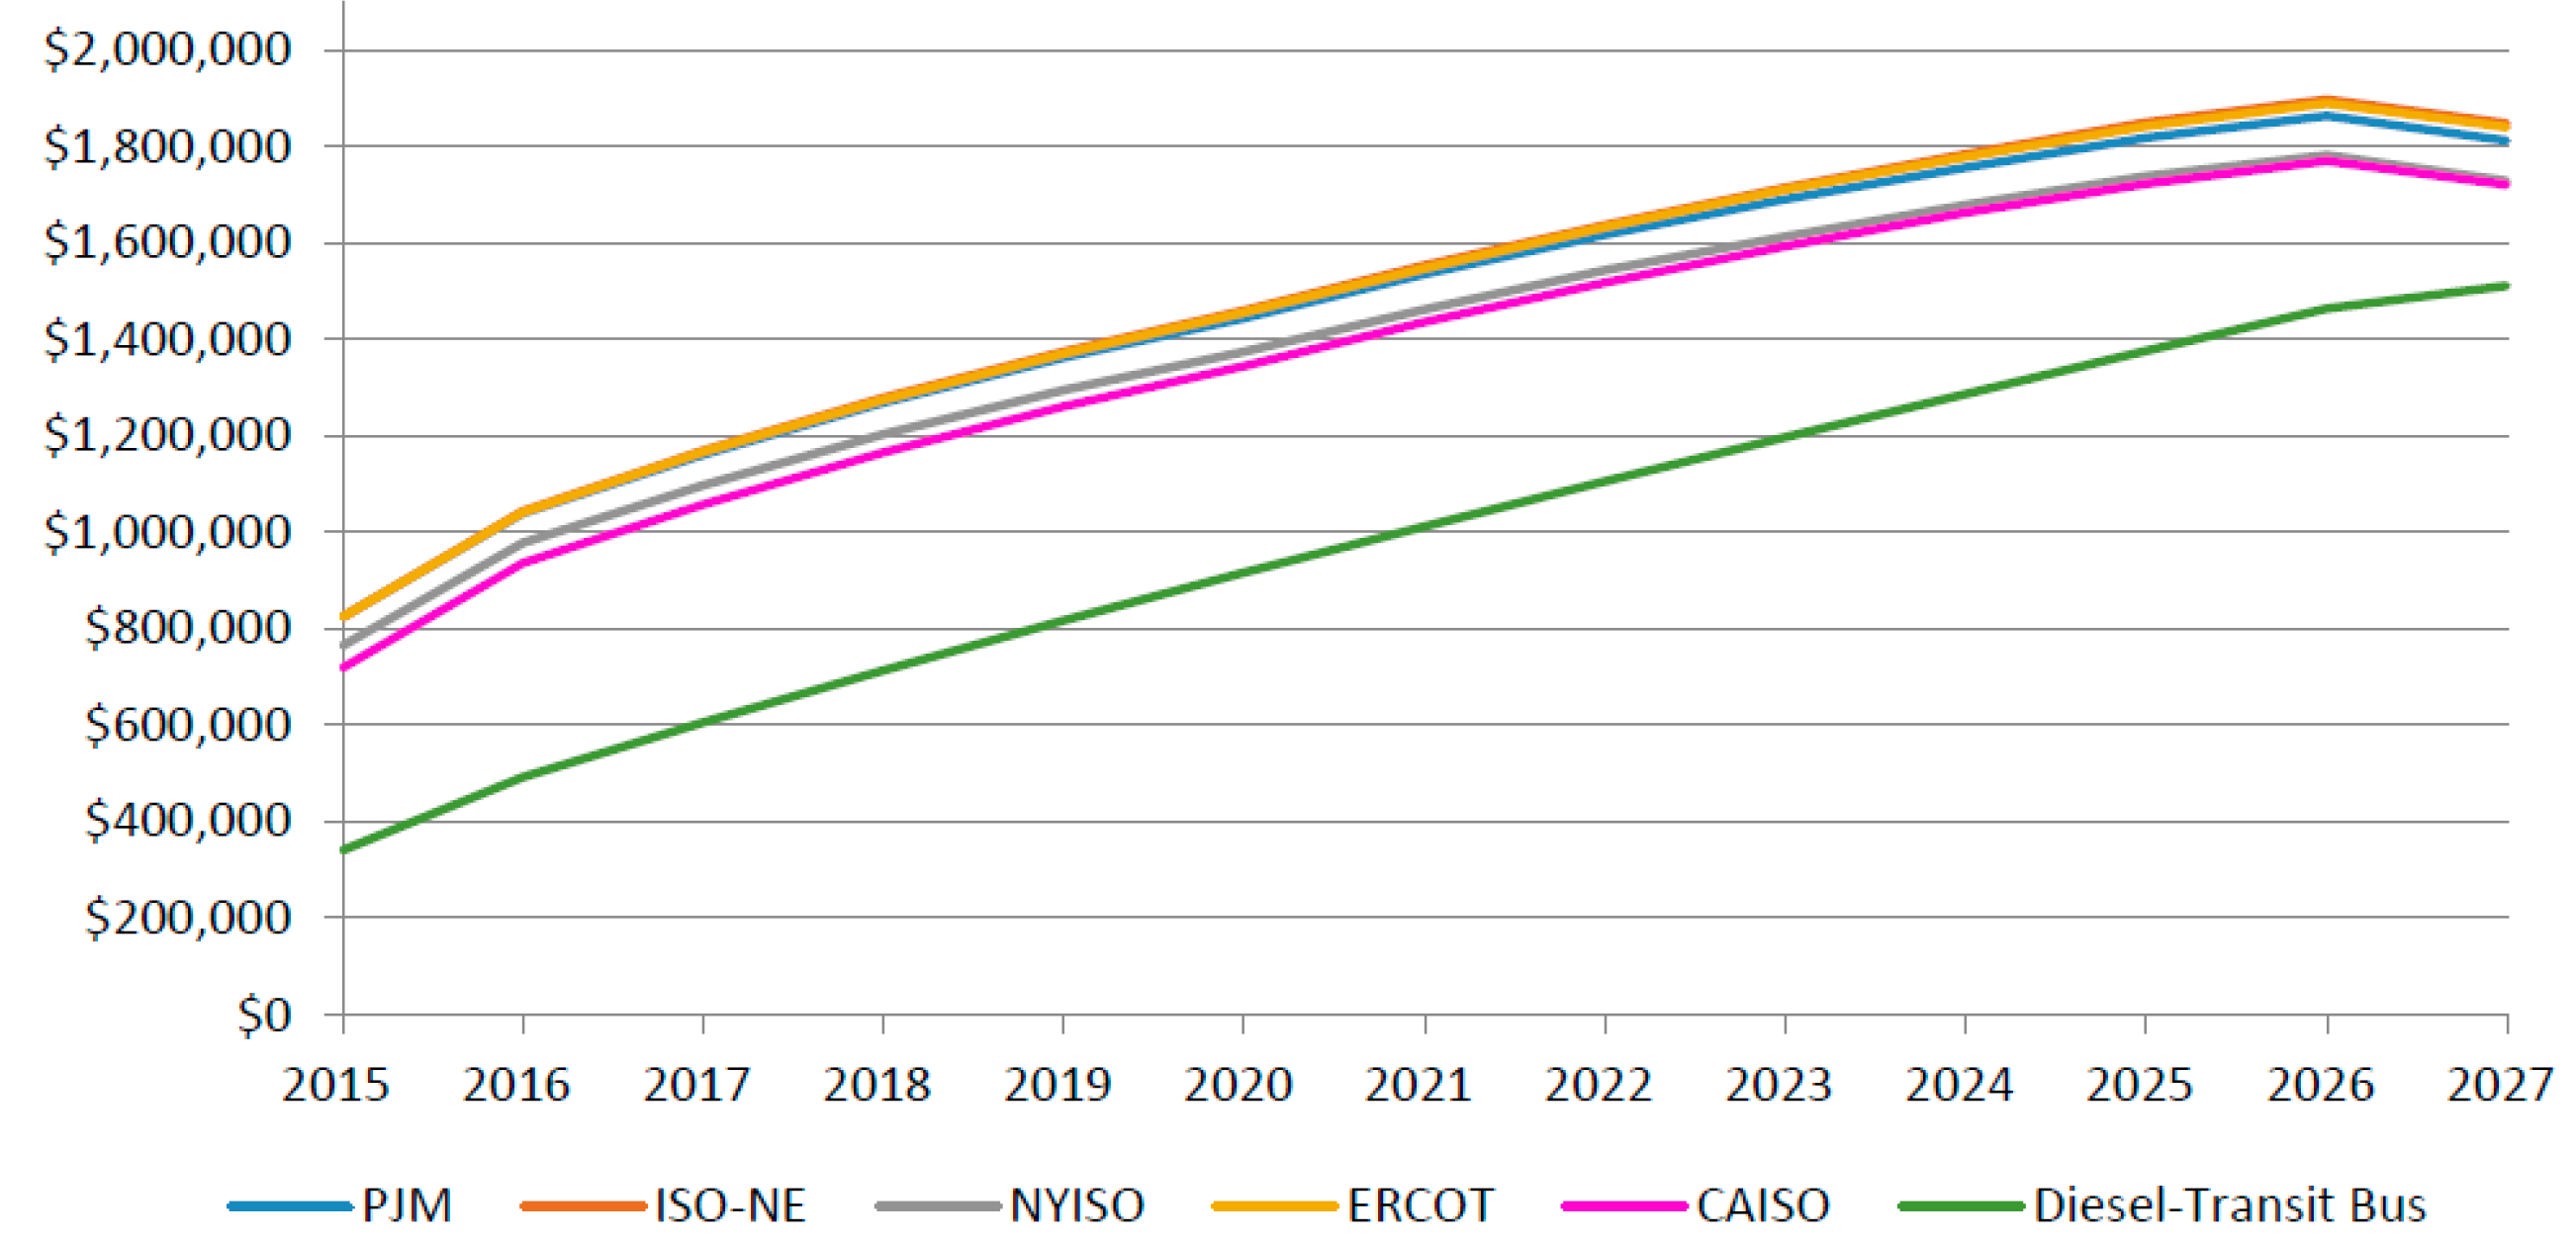
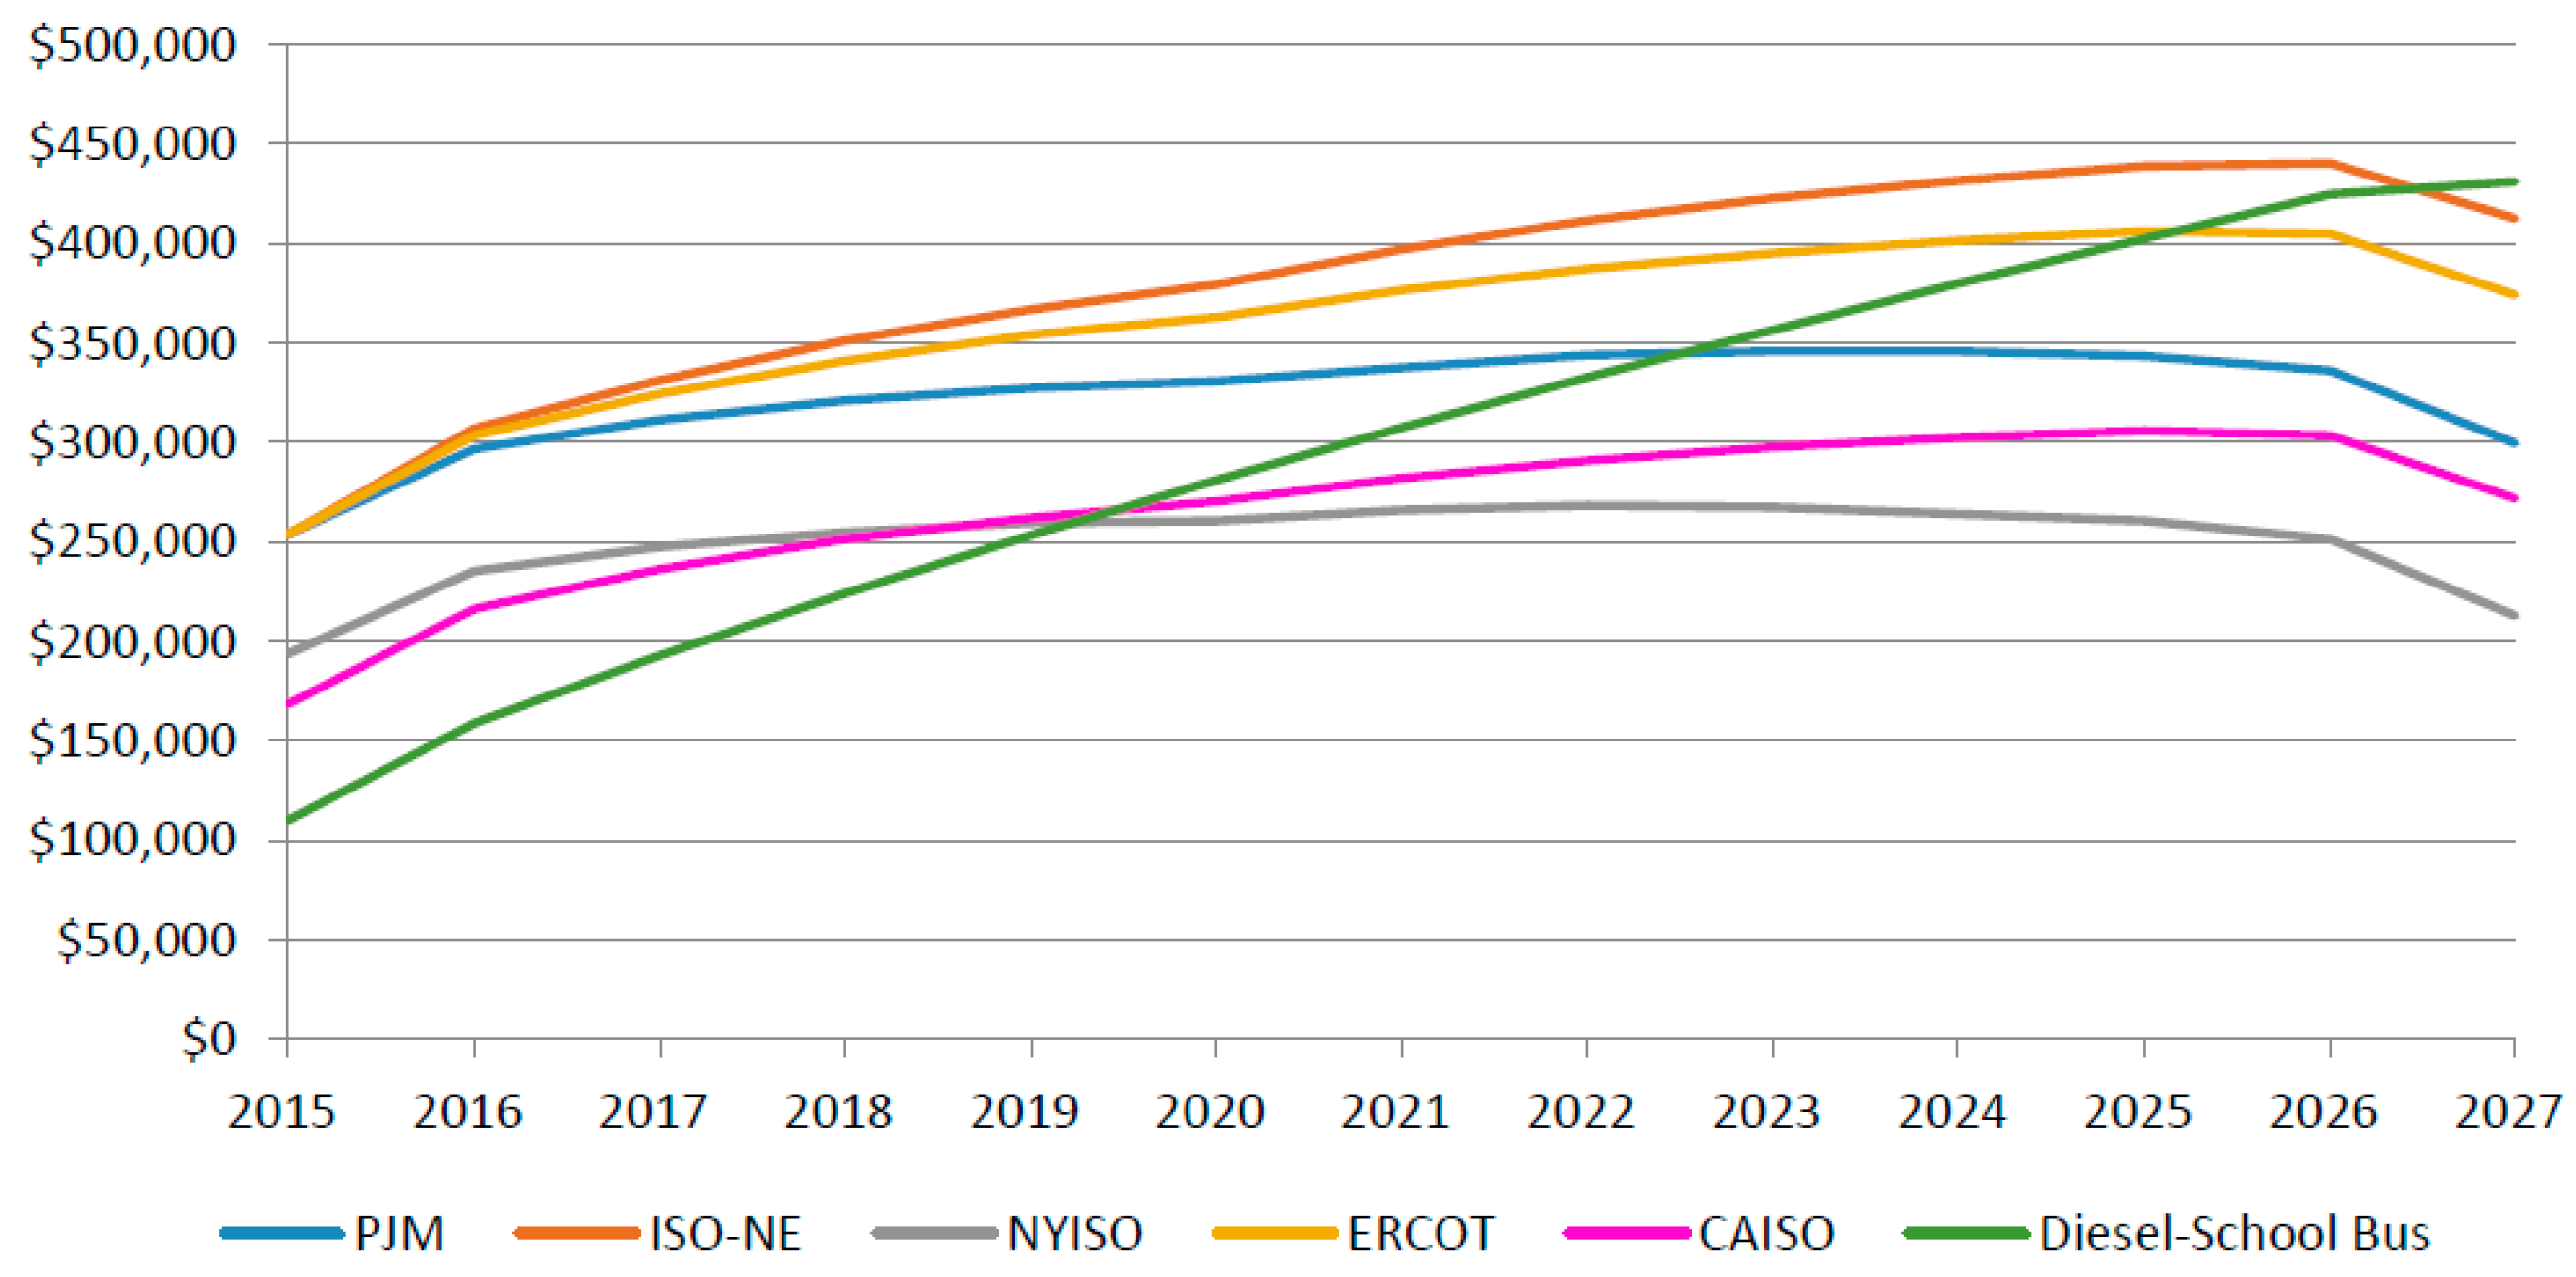
5.1. Cash Flow Results

The ISO/RTO regions summarized in Section 3.1 are used as the scope of this study, for which a V2G system application analysis is performed for BE transit and school buses in order to compare them with internal combustion engine diesel transit and school buses. BE bus adoption is still in a relatively early stage for transit and school bus fleet operators due to their high purchase prices compared to diesel and other alternative fuel options. Hence, a cumulative cash flow analysis is performed in this study for different bus types over their full lifetimes.
Figure 2 presents the transit bus cash flow results for diesel and BE fuel options. As previously discussed in Section 4.1, the initial cost of a BE transit bus is almost three times higher than that of a diesel transit bus, and thus diesel transit buses have lower cumulative cash flow results than BE transit buses. Although the results in Figure 2 accounted for the V2G system revenues for BE transit buses, and even though diesel transit buses were shown to accumulate significant total lifetime cost, BE transit buses are still not cost feasible. This study assumes that vehicles will be sold at the end of their lifetimes for their resale value, and this negative value on cash flow is shown to be seen significant for BE buses as opposed to diesel buses, again due to the high initial cost requirements of BE buses. Diesel prices are considered with regional projections in the analysis, but since this accounts for the only regional difference in terms of diesel transit bus operation, these regional projections do not yield any significant difference so only average value of cumulative cash flow for diesel transit bus is shown in figure. However, these same regional impacts yielded moderate differences (i.e., the regional difference vary between 7% and14%) in terms of BE bus operation due to regional electricity price variations and its related dependent variables. The New York (NYISO) and California (CAISO) state regions provide relatively close results for BE transit bus operation, both demonstrating lower costs than other regions since they are the only two states that provide tax incentives for BE bus purchases. However, these tax incentives are still far from making BE transit bus competitive with diesel transit bus for overall cash flow analysis.
Same as the transit bus results in Figure 2, the school bus cash flow results for the diesel and BE fuel options are compared in Figure 3. In contrast to the transit bus results, BE school buses demonstrated lower cost results compared to diesel school buses, at the end of their 12 year lifetime. This is an interesting finding that although diesel school bus has lower initial cost; cumulative cash flow value becomes higher than the value of BE school buses after 4th year in NYISO and CAISO regions where tax incentives are available. Also, like in Figure 2, regional variations had no significant effect on the results in Figure 3 due to the lower diesel price variability between regions compared to the corresponding electricity price variability so diesel school buses’ cumulative cash flow results are presented as average for regions. Moreover, also like Figure 2, Figure 3 demonstrated lower cash flow results for the NYISO and CAISO regions than those of any other region. Conversely, BE bus operation costs are higher for transit and school bus options in the New England ISO (ISO-NE) region than in any other region.
Both Figure 2 and Figure 3 presents the cumulative cash flow analysis for transit and school buses, however it is also crucial to present the components of this cash flow analysis an overall life cycle cost. Table 4 depicts the components of costs and revenues that are spent and earned throughout the lifetime of all bus types in CAISO region. Similar results of other four study regions are presented in SM document as Table S9. Life cycle cost results indicate that although BE buses require two or three times higher initial costs compared to diesel bus types, overall net costs are less than diesel bus ownership for BE buses. Therefore, it can be clearly stated that operating BE buses with V2G technology and allowance of government incentives cost less than traditional diesel buses on top of environmental benefits which are presented in next subsection. In addition to V2G related revenues, this significance difference can be explained with several more aspects such as fuel cost of diesel buses are four to six times higher than BE buses due to low fuel efficiency and higher unit cost of diesel. Maintenance cost is another component that affect life cycle cost of diesel buses compared to BE buses. It should be noted here that battery replacement due to operation and battery degradation costs due to V2G service cause critical increase on results, however, as it stated for initial cost difference, those costs can be eliminated with V2G revenues and government incentives.
The initial cost difference for BE and diesel school buses is not as significant as that for transit buses, but the cost effective lifetime performance of BE school buses compared to diesel school buses cannot be explained with only this reason. The primary focus of this study is to demonstrate the potential V2G system benefits, as the resulting revenue for fleet owners will also have an influence on the cash flow of a BE school bus. Therefore, Figure 4 depicts the net revenue results for transit and school bus options with V2G service revenues taken into account. Due to the operation specifications of a typical school bus, school buses are highlighted as a better candidate than transit buses for offering V2G services. Figure 4 also indicates parallel results to support this theory that school buses provide significantly higher revenues for fleet owner than transit buses. Out of the five regions considered in this study, the New York-ISO region provides the highest rate of revenue on average for both bus types due to its higher capacity price (Ccap) ranges compared to other regions. Therefore, it can be concluded that there is a balancing act between school and transit buses in terms of net available revenues from V2G services, since school bus V2G revenues are much higher than those of transit buses whereas the battery capacity of transit buses is much higher than that of school buses. Hence, this balancing act again highlights the importance of the value of Tplug, which represents the available V2G service time for BE buses.

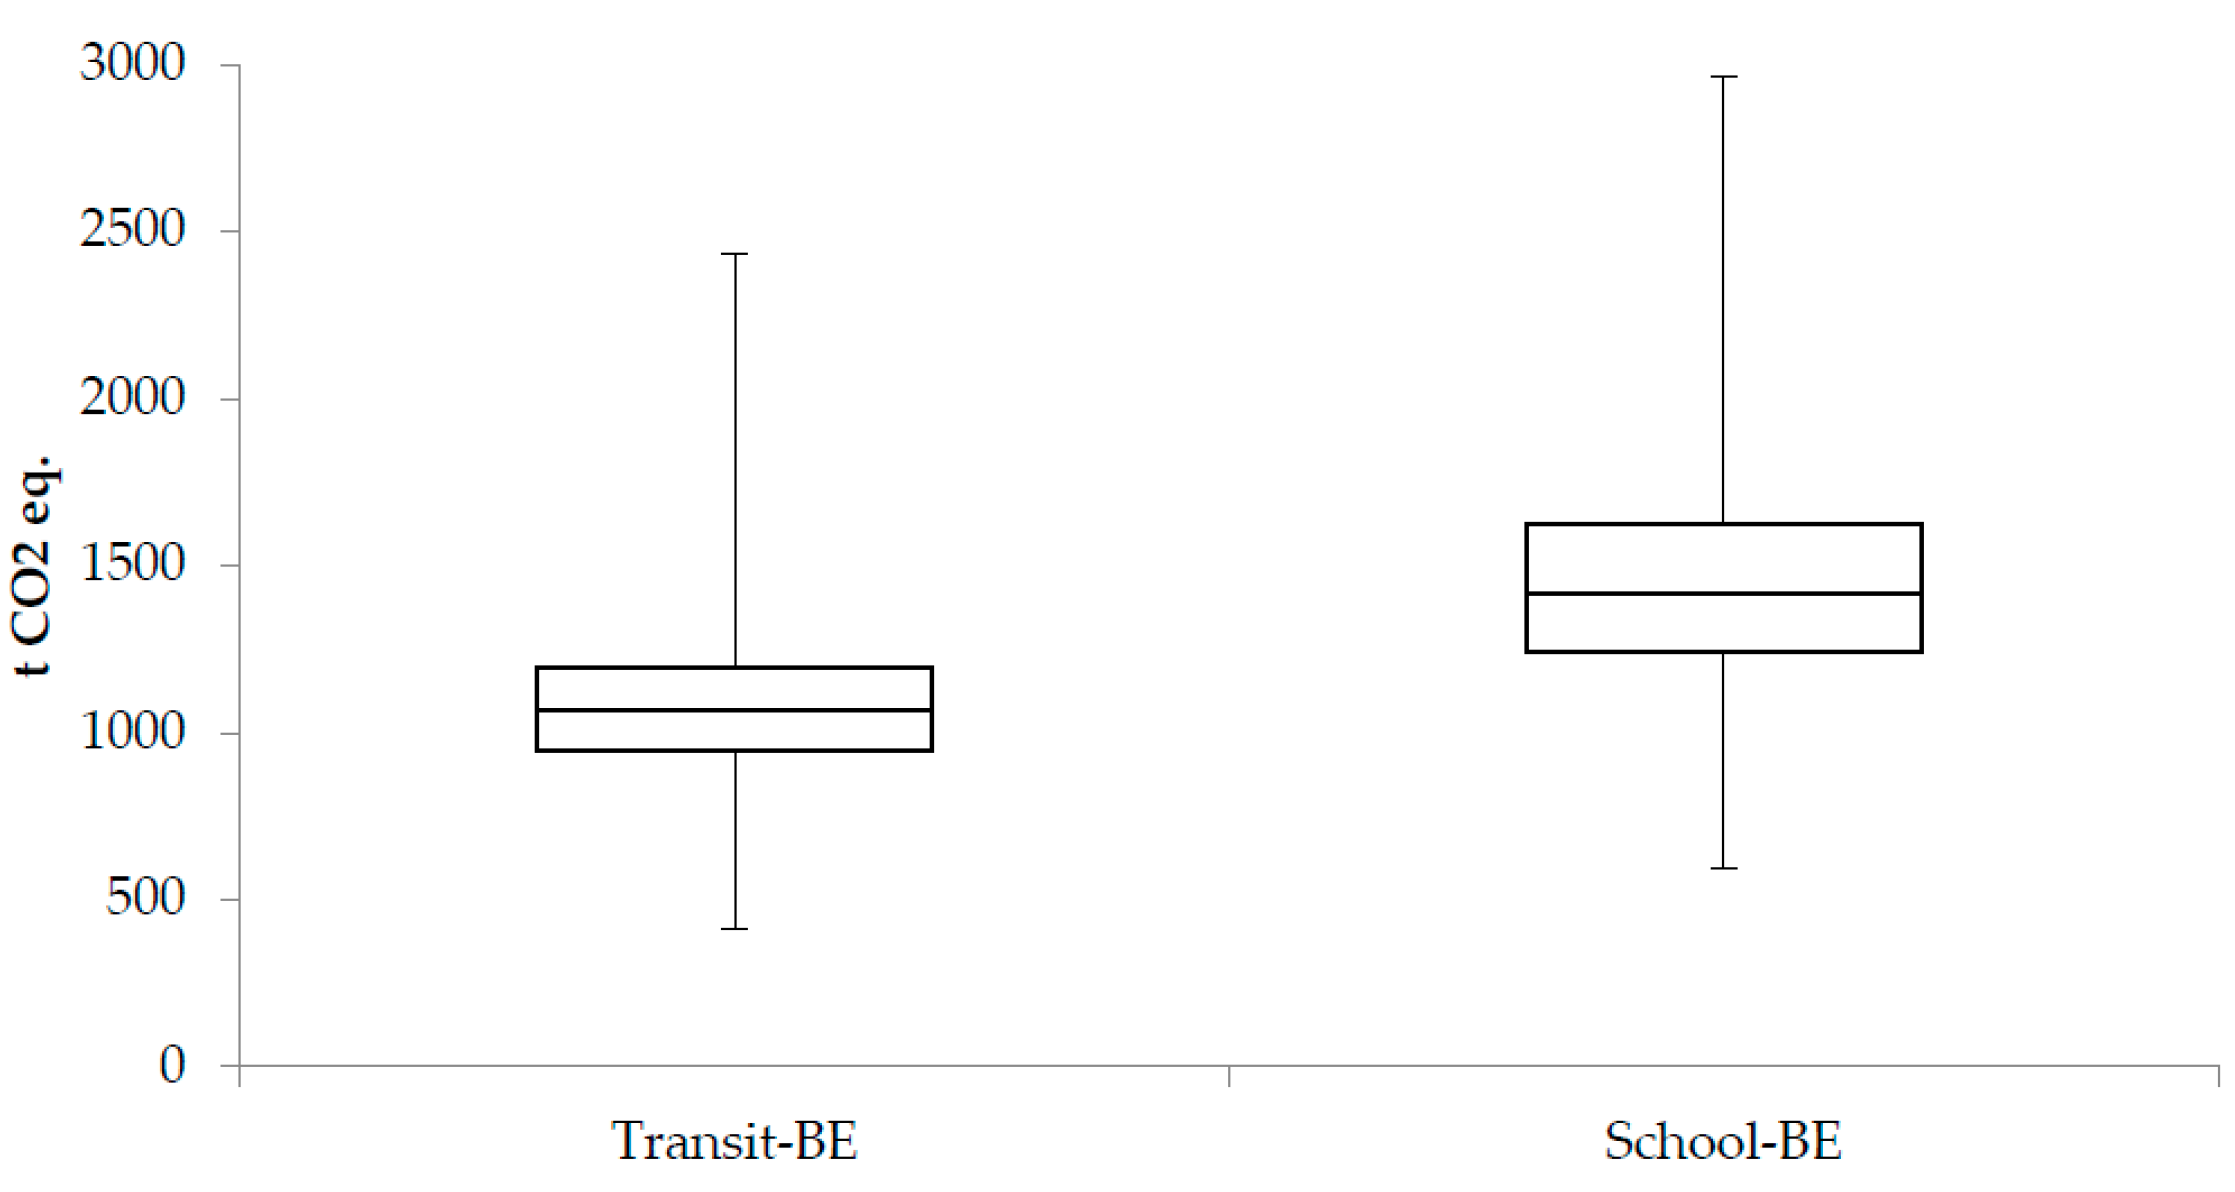
5.2. Environmental Emission Results

There are a significant number of cited studies from available literature that present environmental life cycle assessment analysis results for diesel and BE transit buses and school buses. Furthermore, using V2G technology could eliminate the air emissions caused by combustion power plants (which are not environmentally efficient) when accommodating high electricity demand fluctuations. Hence, per one of the goals of this study, Figure 5 presents the potential regional average cumulative environmental emission reductions from the use of V2G services from transit and school buses over their entire lifetimes. It should be noted that Figure 5 indicates the cumulative GHG emission benefits in year 2027, which covers the whole lifetimes of BE transit buses and school buses. Figure 5 shows that BE transit buses using the V2G system can help to eliminate 1000 metric tons of CO2-equivalent GHG emissions on average over its lifetime. Similar to the net revenue results in Figure 4, the emission benefits are also higher for school buses than for transit buses. However, there is an interesting point that it should be highlighted for Figure 4 and Figure 5. V2G service related BE school bus net revenues are almost three times higher than BE transit buses (Figure 4) and this difference is almost one-and-half times more for emissions savings (Figure 5). The reason behind this difference is basically due to the consideration of battery degradation. Both of these calculations account for battery degradation and related battery replacement cost and emissions are not linearly influencing the net revenue and emission savings for this analysis. Moreover, the impact of battery replacement impacts in terms of emissions and cost are significantly different and it is more sensitive to emission impacts. Therefore, net revenue benefits of BE school buses are much higher than emission saving benefits. However, it is crucial to highlight here that, Figure 4 and Figure 5 only consider battery degradation due to V2G service but not operation related battery replacement impacts which are presented in Table 4.

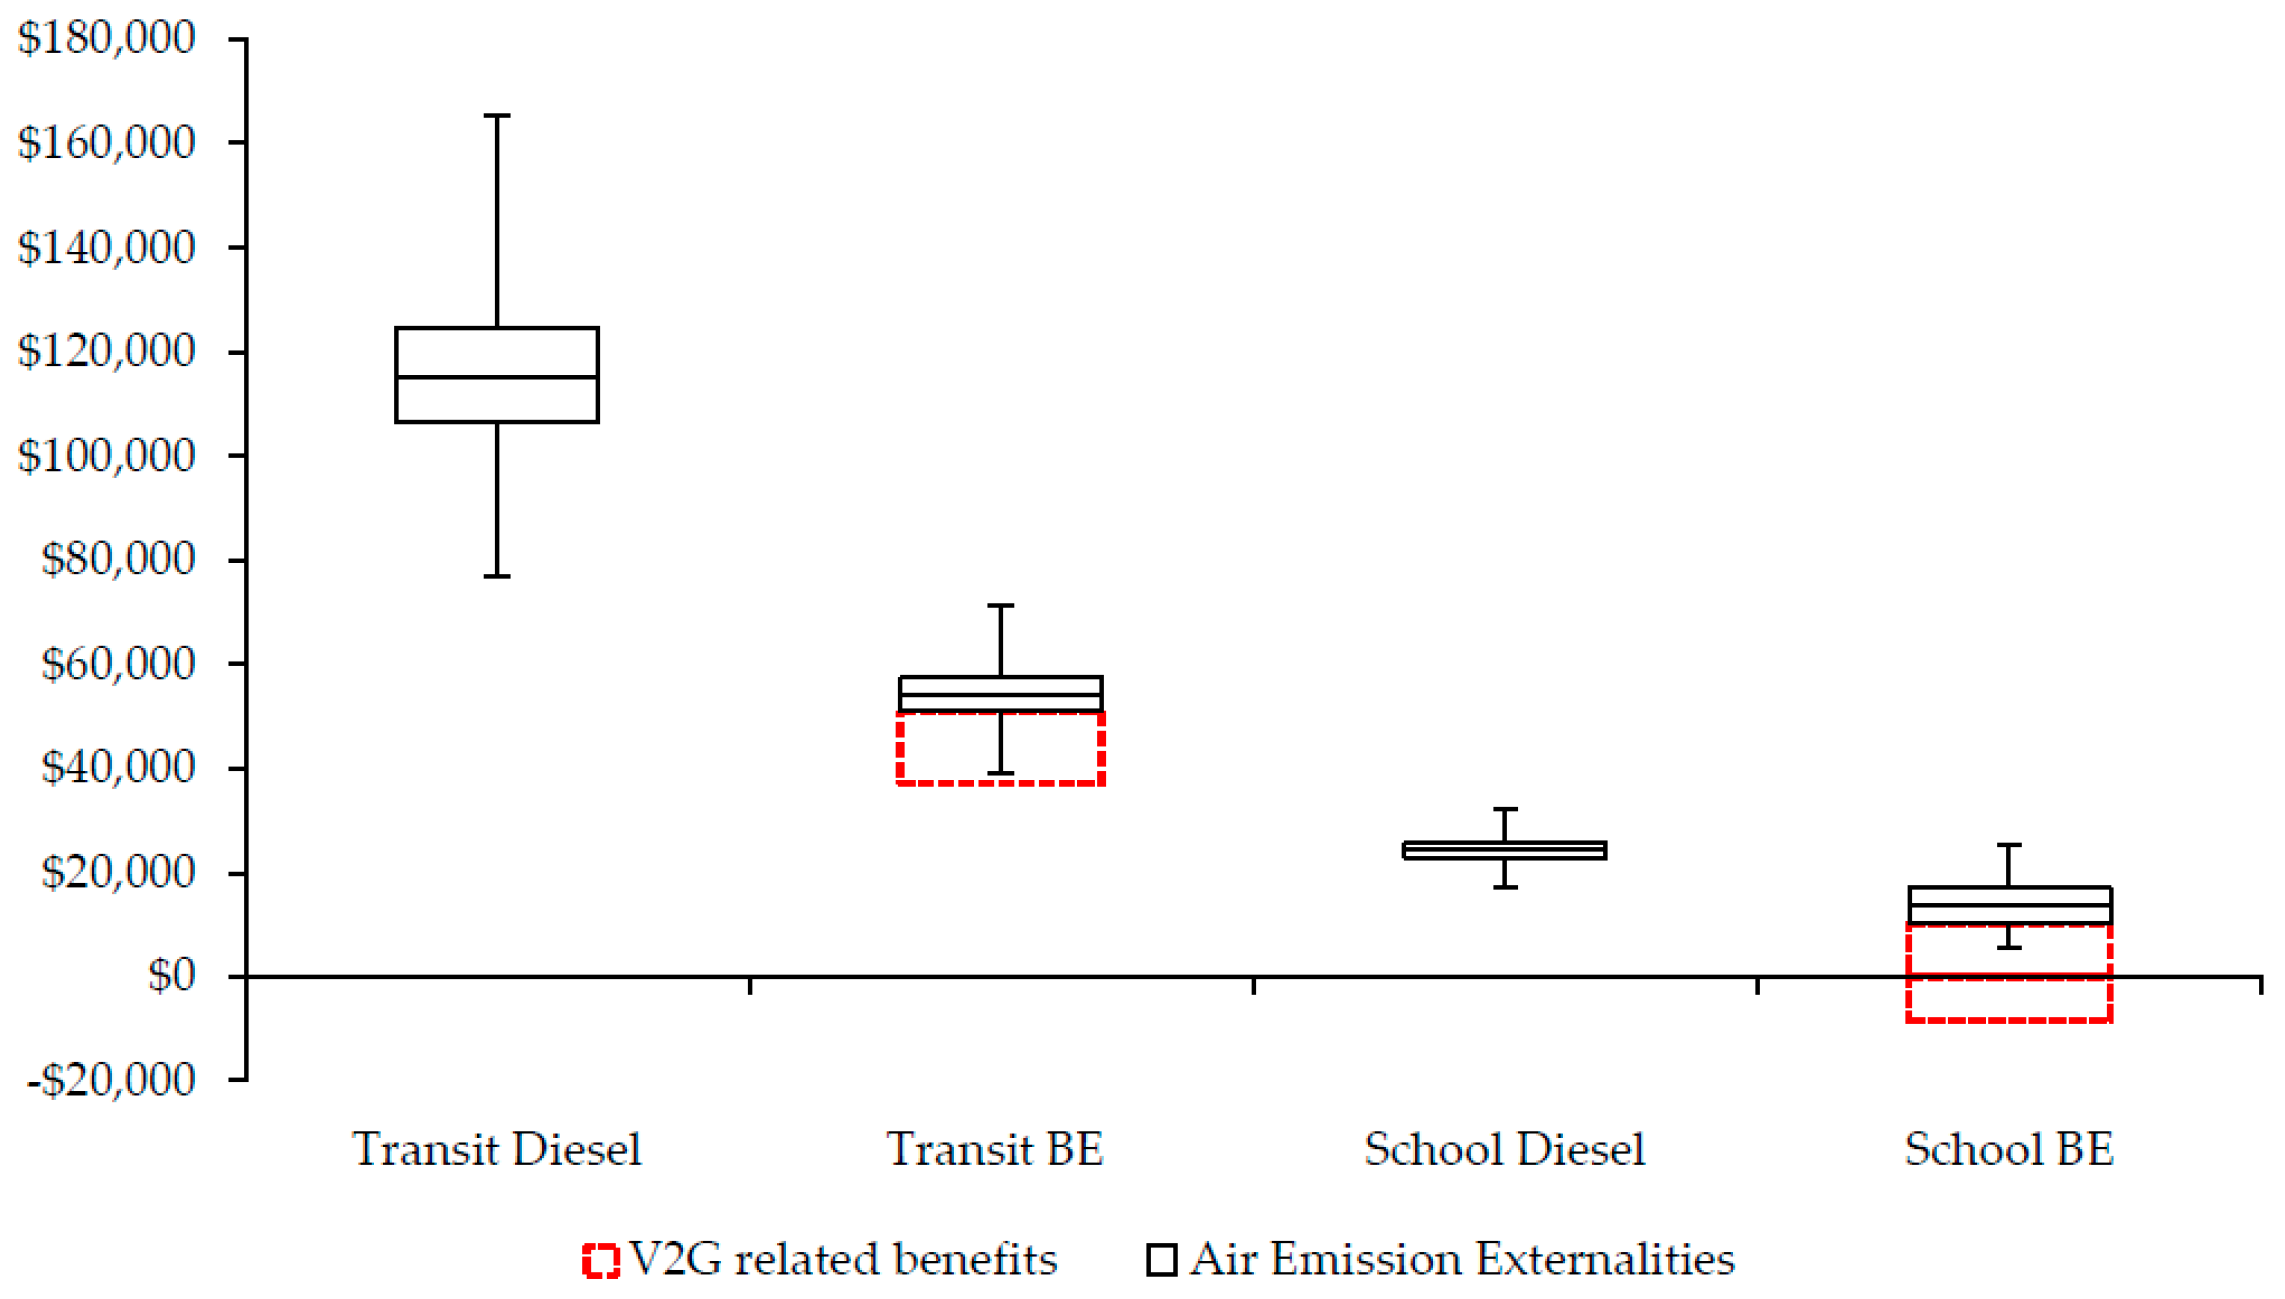
5.3. Air Pollution Externatilty Results

Finally, the air emission externalities for BE and diesel transit and school buses are presented in Figure 6. In addition to the economic and GHG emission impacts, air emission externalities are another crucial indicator that should be defined for every air emission source, especially when said source operates/emits near highly populated areas. It is important to note that tailpipe emissions contribute the most to these externalities, as the tailpipe emissions for transit and school buses are assumed to occur primarily in and near highly populated areas. Due to high annual mileage values, transit buses cause significantly higher air emission externalities than school buses.
In addition to reducing the public health costs of all of these air emission types, the V2G system could eliminate some of the emissions from combustion power plants, as presented in Figure 5 in the previous section. Therefore, the V2G system can provide enough electricity back to the grid to reduce the mean air externality value of transit BE buses by $13,000, which reduce it to almost the maximum air externality rate of diesel school buses (please see red-dotted lines on Figure 6 for V2G related reduction). More interestingly, V2G services provided from BE school buses effectively eliminated their mean externality value, and even provided a net benefit due to less electricity generation and emissions from power plants. However, it should be noted that negative externality values do not necessarily mean that BE school bus operations can provide negative emissions, but it does mean that V2G systems can neutralize all of the emission impacts of electricity consumption from BE school bus operations. Hence, Figure 6 clearly highlights the potential benefits of V2G technology in terms of public health cost reductions.

6. Discussion

V2G technology is a relatively new approach to eliminating some of the barriers hindering the rapid adoption of electric vehicles. Current literature highlights V2G systems as a promising technological application, as they provide a source of revenue for electric vehicle owners as well as an efficient electricity source for utility providers. V2G technology is also emerging as a powerful environmental solution, as it can be used to reduce GHG emissions from the two highest-contributing sectors (transportation and power generation) to such emissions in the U.S.
This study is multi-disciplinary in many ways such as analyzing not only transportation sector related environmental emissions but also investigating the upstream environmental emissions of battery electric buses, economic impacts (i.e., cash flow), and air pollutant externalities for public health with downstream and upstream consideration. Besides, this analysis also integrated the V2G service availability where power generation sector could also eliminate some of the environmental emissions. The multi-disciplinary impacts of the integration of these two sectors is not limited environmental and economic matters, but also includes integrity and reliability of electricity grid and resiliency of power supply during the extreme events. In other words, this study interacts with the researches where V2G service can increase the reliability of electricity grid and provide energy for vehicle user’s home, facility etc. during extreme events of long power outages. Furthermore, as the results indicated, heavy-duty vehicles such as buses have potential to provide these benefits more than passenger vehicles that have been studied in current literature broadly for V2G applications.
Therefore, this study investigated possible V2G applications in five different ISO/RTO regions for transit buses and school buses, and performed an additional comparison to internal combustion engine diesel transit and school buses. Based on the methods and data used in this research, the results in this study indicated the following key findings:
  • The cash flow analysis results in this study indicated that BE transit buses are not economically feasible to operate even with V2G net revenues taken into account, and the initial purchase price of a BE transit bus is especially discouraging for fleet owners compared to those of diesel buses and buses with other alternative fuel options. However, this could change in the near future with battery development and market demand trends for alternative fuel transit buses. On the other hand, BE school buses effectively eliminated their high initial cost requirements throughout their lifetimes, whereas diesel school buses did not.
  • Transit buses also yielded less net revenue for fleet owners from V2G service. However, this result does not mean that V2G services are not feasible or applicable for BE transit buses. It should be noted that the primary duty of transit buses is to serve society for reliable public transportation and to provide a source of revenue for transit agencies. It is therefore still beneficial for transit agencies to collect additional revenue from BE transit buses even while they are not in use. Conversely, with extensive cash flow benefits, BE school buses can easily substitute diesel school buses for the fleet owners’ cost perspective.
  • If the total number of transit and school bus fleets in the U.S. is taken into account, the overall potential of V2G system applications and BE bus adoption can be significant. However, it is not clear if the current electricity generation and distribution infrastructure could support that adoption. Therefore, BE bus deployment levels should be studied further and optimized parallel to current development trends in the utility generation and supply system.
  • In addition to V2G technology, there are other new technologies similar to V2G that provide power as needed from plugged-in electric vehicles back to a home (V2H) or back to a building (V2B). These similar technologies could be an interesting future area of study through which to present the possible benefits of providing electricity from an electric vehicle fleet back to the workplace buildings (administrative, maintenance, etc.) of a fleet operator. That said, as highlighted in this research, buses have a significant amount of power available from their batteries compared to any passenger vehicle’s capacity. Thus, heavy-duty vehicles are more capable of providing power support to a building than light-duty vehicles are. This concept can also lead to another research area where there is potential of V2G, V2H, or V2B technologies to enhance the resiliency of grid/building during extreme events.
  • The air emission externality results in this study are especially noteworthy because this study focuses on vehicles operating in or near highly populated areas. This is particularly true for school buses, the tailpipe emissions of which are emitted mainly near a non-adult population. Moreover, since air emission externalities are not defined specifically for non-adult populations, the public health damage rates for school bus emissions could be even higher than the average rates used in this study. Also, although electricity generation does not usually occur near populated areas, conventional power generation methods still have high emission rates of hazardous pollutants due to the high fossil fuel dependency of the U.S. power generation sector. These per-kWh emission rates for electricity generation are expected to decrease in future years as the U.S. invests more and more in renewable energy sources and technologies. However, this study shows that V2G technology can already provide significant air emission externality reduction benefits from BE transit buses and school buses.
BE transit and school bus examples are still largely in an experimental phase in the U.S., and so there are still data limitations regarding their operation and especially with respect to V2G application specifications; for this same reason, only five ISO/RTO regions could be considered in this research due to a lack of usable data for other regions. This study could therefore be extended in the future with the inclusion of other U.S. regions as well as additional data on renewable energy deployments.

Supplementary Materials

The following are available online at www.mdpi.com/1996-1073/9/4/230/s1. Figure S1: International standards organization/regional transmission organizations ISO/RTO regions for the scope of this study; Table S1: Regional electricity generation mix projections from 2014 to 2027; Table S2: Combustion (inefficient) power plant emissions for regulation services in study regions (emissions/kWh); Table S3: Electricity price (Celect) and emission projections for study period based on EVRO tool’s results; Table S4: Air externality cost rates by emission source and types; Table S5: Ranges for capacity price (Ccap) in each study region; Table S6: Regional diesel price projections for study regions based on Energy Information Administration’s Energy Outlook forecast for 2040; Table S7: Diesel-Transit Bus Tailpipe Emission Rates for Each Year [gram/mile]; Table S8: Diesel-School Bus Tailpipe Emission Rates for Each Year [gram/mile]; Table S9: Life cycle cost analysis results for each bus types in five ISO regions.

Acknowledgments

This work was supported in part by an award to the University of Central Florida, as part of grant number DTRT13-G-UTC51 from the US Department of Transportation’s University Transportation Centers Program.

Author Contributions

This research was a collaborative effort between all of the authors. Yang Zhao contributed with extensive background information on Vehicle-to-Grid technology and data collection of fuel cycles and Vehicle-to-Grid related specifications. Mehdi Noori developed the methods of cash flow and environmental emission savings and performed the analysis. Tolga Ercan gathered data for air pollution externalities, life cycle assessment of electric and school buses and developed related methods for calculations, and finally wrote the manuscript. Omer Tatari mentored the research by providing constructive comments on the developed of the methods and contributed the editing and reviewing of the manuscript. All authors have read and approved the final manuscript.

Conflicts of Interest

The authors declare no conflict of interest.

Abbreviations

The following abbreviations are used in this manuscript:
AFLEETAlternative fuel life-cycle environmental and economic transportation
APEEPAir pollution emission experiments and policy analysis
BEBattery electric
CAISOCalifornia independent system operators
CNGCompressed natural gas
EIAEnergy information administration
EPAEnvironmental protection agency
ERCOTElectric Reliability Council of Texas
GHGGreenhouse gases
GREETGreenhouse-gases Regulated Emissions, and Energy use in Transportation
ISO-NEIndependent system operators of new England region
ISOInternational standards organization
ISO/RTOIndependent system operators/regional transmission organizations
LCALife cycle assessment
LNGLiquefied natural gas
MOVESMotor vehicle emission simulation
MPDGEMiles per diesel gallon equivalent
NERCNorth American electricity reliability corporation
NRELNational renewable energy laboratory
NYISONew York independent system operators
PJMPennsylvania-New Jersey-Maryland interconnection RTO
SOCState-of-charge
TBWTire & brake wear
V2GVehicle-to-grid
WTPWell-to-pump
WTWWell-to-wheel

References

  1. Inventory of U.S. Greenhouse Gas Emissions and Sinks: 1990–2013; U.S. Environmental Protection Agency: Washington, DC, USA, 2015.
  2. Onat, N.C.; Kucukvar, M.; Tatari, O.; Zheng, Q.P. Combined application of multi-criteria optimization and life-cycle sustainability assessment for optimal distribution of alternative passenger cars in U.S. J. Clean. Prod. 2015, 112, 291–307. [Google Scholar] [CrossRef]
  3. Onat, N.C.; Gumus, S.; Kucukvar, M.; Tatari, O. Application of the TOPSIS and intuitionistic fuzzy set approaches for ranking the life cycle sustainability performance of alternative vehicle technologies. Sustain. Prod. Consum. 2016, 6, 12–25. [Google Scholar] [CrossRef]
  4. U.S. Department of Energy—Energy Information Administration. Annual Energy Outlook 2015 with Projections to 2040; U.S. Energy Information Administration: Washington, DC, USA, 2015.
  5. The Clean Air Act Amendments. The Clean Air Act Amendments. Available online: https://www.epa.gov/clean-air-act-overview/clean-air-act-text#toc (accessed on 15 Novmber 2015).
  6. California Environmental Protection Agency Air Resources Board. Technology Assessment: Medium- and Heavy- Duty Battery Electric Trucks and Buses. Available online: http://www.arb.ca.gov/msprog/tech/techreport/bev_tech_report.pdf (accessed on 1 December 2015).
  7. 2015 Public Transportation Fact Book Appendix A: Historical Tables; American Public Transportation Association: Washington, DC, USA, 2015.
  8. Neff, J.; Dickens, M. 2015 Public Transportation Fact Book; American Public Transportation Association: Washington, DC, USA, 2015. [Google Scholar]
  9. Laughlin, M. Analysis of U.S. School Bus Populations and Alternative Fuel Potential; Antares Group Inc.: Washington, DC, USA, 2004. [Google Scholar]
  10. Public Transportation Fact Book; American Public Transportation Association: Washington, DC, USA, 2014.
  11. Chandler, K.; Walkowicz, K.; Eudy, L. New York City Transit Diesel Hybrid-Electric Buses: Final Results; National Renewable Energy Laboratory: Golden, CO, USA, 2002. [Google Scholar]
  12. Noel, L.; McCormack, R. A cost benefit analysis of a V2G-capable electric school bus compared to a traditional diesel school bus. Appl. Energy 2014, 126, 246–255. [Google Scholar] [CrossRef]
  13. Mikulecky, M. Number of Instructional Days/Hours in the School; Education Commission of the States: Denver, CO, USA, 2013. [Google Scholar]
  14. Kempton, W.; Tomić, J. Vehicle-to-grid power fundamentals: Calculating capacity and net revenue. J. Power Sources 2005, 144, 268–279. [Google Scholar] [CrossRef]
  15. Kempton, W.; Tomić, J. Vehicle-to-grid power implementation: From stabilizing the grid to supporting large-scale renewable energy. J. Power Sources 2005, 144, 280–294. [Google Scholar] [CrossRef]
  16. Kempton, W.; Udo, V.; Huber, K.; Komara, K.; Letendre, S.; Baker, S.; Brunner, D.; Pearre, N. A Test of Vehicle-to-Grid (V2G) for Energy Storage and Frequency Regulation in the PJM System; Industry-University Research Partnership: Newark, DE, USA.
  17. Frey, H.C.; Rouphail, N.M.; Zhai, H.; Farias, T.L.; Gonçalves, G.A. Comparing real-world fuel consumption for diesel- and hydrogen-fueled transit buses and implication for emissions. Transp. Res. D Transp. Environ. 2007, 12, 281–291. [Google Scholar] [CrossRef]
  18. Hess, D. What is a clean bus? Object conflicts in the greening of urban transit. Sustain. Sci. Pract. Policy 2007, 3, 45–58. [Google Scholar]
  19. Ally, J.; Pryor, T. Life-cycle assessment of diesel, natural gas and hydrogen fuel cell bus transportation systems. J. Power Sources 2007, 170, 401–411. [Google Scholar] [CrossRef]
  20. Chester, M.V.; Horvath, A. Environmental assessment of passenger transportation should include infrastructure and supply chains. Environ. Res. Lett. 2009, 4. [Google Scholar] [CrossRef]
  21. Ou, X.; Zhang, X.; Chang, S. Alternative fuel buses currently in use in China: Life-cycle fossil energy use, GHG emissions and policy recommendations. Energy Policy 2010, 38, 406–418. [Google Scholar] [CrossRef]
  22. Ou, X.; Zhang, X.; Chang, S. Scenario analysis on alternative fuel/vehicle for China’s future road transport: Life-cycle energy demand and GHG emissions. Energy Policy 2010, 38, 3943–3956. [Google Scholar] [CrossRef]
  23. Cooney, G.; Hawkins, T.R.; Marriott, J. Life Cycle Assessment of Diesel and Electric Public Transportation Buses. J. Ind. Ecol. 2013, 17, 689–699. [Google Scholar] [CrossRef]
  24. Sánchez, J.A.G.; Martínez, J.M.L.; Martín, J.L.; Holgado, M.N.F.; Morales, H.A. Impact of Spanish electricity mix, over the period 2008–2030, on the Life Cycle energy consumption and GHG emissions of Electric, Hybrid Diesel-Electric, Fuel Cell Hybrid and Diesel Bus of the Madrid Transportation System. Energy Convers. Manag. 2013, 74, 332–343. [Google Scholar] [CrossRef]
  25. Lajunen, A. Energy consumption and cost-benefit analysis of hybrid and electric city buses. Transp. Res. C Emerg. Technol. 2014, 38, 1–15. [Google Scholar] [CrossRef]
  26. Onat, N.C.; Kucukvar, M.; Tatari, O. Towards Life Cycle Sustainability Assessment of Alternative Passenger Vehicles. Sustainability 2014, 6, 9305–9342. [Google Scholar] [CrossRef] [Green Version]
  27. Donateo, T.; Ingrosso, F.; Licci, F.; Laforgia, D. A method to estimate the environmental impact of an electric city car during six months of testing in an Italian city. J. Power Sources 2014, 270, 487–498. [Google Scholar] [CrossRef]
  28. Xu, Y.; Gbologah, F.E.; Lee, D.Y.; Liu, H.; Rodgers, M.O.; Guensler, R.L. Assessment of alternative fuel and powertrain transit bus options using real-world operations data: Life-cycle fuel and emissions modeling. Appl. Energy 2015, 154, 143–159. [Google Scholar] [CrossRef]
  29. Rogge, M.; Wollny, S.; Sauer, D. Fast Charging Battery Buses for the Electrification of Urban Public Transport—A Feasibility Study Focusing on Charging Infrastructure and Energy Storage Requirements. Energies 2015, 8, 4587–4606. [Google Scholar] [CrossRef] [Green Version]
  30. Ercan, T.; Tatari, O. A hybrid life cycle assessment of public transportation buses with alternative fuel options. Int. J. Life Cycle Assess. 2015, 20, 1213–1231. [Google Scholar] [CrossRef]
  31. Turton, H.; Moura, F. Vehicle-to-grid systems for sustainable development: An integrated energy analysis. Technol. Forecast. Soc. Chang. 2008, 75, 1091–1108. [Google Scholar] [CrossRef]
  32. Kudoh, Y.; Motose, R.; Tahara, K.; Genchi, Y. A potential CO2 reduction of vehicle to home system from life cycle perspective. In Proceedings of the IEEE Electric Vehicle Symposium and Exhibition (EVS27), Barcelona, Spain, 17–20 November 2013; pp. 1–10.
  33. Muller, N.Z.; Mendelsohn, R. The Air Pollution Emission Experiments and Policy Analysis Model (APEEP) Technical Appendix; Yale University: New Haven, CT, USA, 2006; Volume 1. [Google Scholar]
  34. Muller, N.Z.; Mendelsohn, R. Measuring the damages of air pollution in the United States. J. Environ. Econ. Manag. 2007, 54, 1–14. [Google Scholar] [CrossRef]
  35. Michalek, J.J.; Chester, M.; Jaramillo, P.; Samaras, C.; Shiau, C.S.N.; Lave, L.B. Valuation of plug-in vehicle life-cycle air emissions and oil displacement benefits. Proc. Natl. Acad. Sci. USA 2011, 108, 16554–16558. [Google Scholar] [CrossRef] [PubMed]
  36. Gouge, B.; Dowlatabadi, H.; Ries, F.J. Minimizing the health and climate impacts of emissions from heavy-duty public transportation bus fleets through operational optimization. Environ. Sci. Technol. 2013, 47, 3734–3742. [Google Scholar] [CrossRef] [PubMed]
  37. Ercan, T.; Zhao, Y.; Tatari, O.; Pazour, J.A. Optimization of transit bus fleet’s life cycle assessment impacts with alternative fuel options. Energy 2015, 93, 323–334. [Google Scholar] [CrossRef]
  38. Motor Vehicle Emission Simulator (MOVES); U.S. Environmental Protection Agency: Washington, DC, USA, 2010.
  39. The Greenhouse Gases, Regulated Emissions, and Energy Use in Transportation (GREET) Model; Argonne National Laboratory: Lemont, IL, USA, 2015.
  40. U.S. Environmental Protection Agency. eGRID2012 Summary Tables; EPA: Washington, DC, USA, 2015; Volume 1.
  41. Donateo, T.; Congedo, P.M.; Malvoni, M.; Ingrosso, F.; Laforgia, D. An Integrated Tool to Monitor Renewable Energy Flows and Optimize the Recharge of a Fleet of Plug-in Electric Vehicles in the Campus of the University of Salento: Preliminary Results. In Proceedings of the 19th World Congress of The International Federation of Automatic Control, Cape Town, South Africa, 24–29 August 2014; pp. 7861–7866.
  42. Makarov, Y.V.; Du, P.; Kintner-Meyer, M.C.W.; Jin, C.; Illian, H.F. Sizing energy storage to accommodate high penetration of variable energy resources. IEEE Trans. Sustain. Energy 2012, 3, 34–40. [Google Scholar] [CrossRef]
  43. Lin, J.; Damato, G.; Hand, P. Energy Storage—A Cheaper, Faster, & Cleaner Alternative to Conventional Frequency Regulation; California Energy Storage Alliance: Berkeley, CA, USA, 2011. [Google Scholar]
  44. Amarakoon, S.; Smith, J.; Segal, B. Lithium-ion Batteries and Nanotechnology for Electric Vehicles: A Life Cycle Assessment; U.S. Environnemental Protection Agency: Washington DC, USA, 2012.
  45. U.S. Department of Energy—Energy Efficiency & Renewable Energy. Alternative Fuel Data Center—State Incentives 2015. Available online: http://www.afdc.energy.gov/laws/all?state= (accessed on 1 October 2015).
  46. New York State. New York State Electric Vehicle—Voucher Incentive Fund (NYSEV-VIF) 2015. Available online: https://truck-vip.ny.gov/NYSEV-VIF-vehicle-list.php (accessed on 1 October 2015).
  47. California HVIP. California Hybrid and Zero-Emission Truck and Bus Voucher Incentive Project (HVIP) 2015. Available online: https://www.californiahvip.org/default.aspx (accessed on 1 October 2015).
  48. Brecher, A.; Energy Analysis and Sustainability Division; Energy and Environmental Systems Technical Center; Volpe National Transportation Research Center. Transit Bus Applications of Lithium Ion Batteries: Progress and Prospects; CreateSpace Independent Publishing Platform: North Charleston, SC, USA, 2012. [Google Scholar]
  49. Hill, D.M.; Agarwal, A.S.; Ayello, F. Fleet operator risks for using fleets for V2G regulation. Energy Policy 2012, 41, 221–231. [Google Scholar] [CrossRef]
  50. Peterson, S.B.; Apt, J.; Whitacre, J.F. Lithium-ion battery cell degradation resulting from realistic vehicle and vehicle-to-grid utilization. J. Power Sources 2010, 195, 2385–2392. [Google Scholar] [CrossRef]
  51. Clements, J.D.; Nagrani, U. Central Valley Electric School Bus Demonstration Project; Kings Canyon Unified School District: Reedley, CA, USA, 2014. [Google Scholar]
  52. Proterra. Proterra Catalyst XR Specifications 2015. Available online: http://www.proterra.com/wp-content/uploads/2015/05/Tearsheets_CatalystPlatform.pdf (accessed 1 October 2015).
  53. Sioshansi, R.; Denholm, P. The value of plug-in hybrid electric vehicles as grid resources. Energy J. 2010, 31, 1–23. [Google Scholar] [CrossRef]
  54. Chang, D.; Erstad, D.; Lin, E.; Rice, A.F.; Goh, C.T.; Angel, A. Financial Viability of Non-Residential Electric Vehicle Charging Stations; Luskin Center for Innovation: Los Angeles: CA, USA, 2012. [Google Scholar]
  55. Burnham, A. Alternative Fuel Life-Cycle Environmental and Economic Transportation (AFLEET) Tool 2013; Argonne National Laboratory: Lemont, IL, USA, 2013. [Google Scholar]
  56. Pitkanen, W.; Van Amburg, B. Best Fleet Uses, Key Challenges and the Early Business Case for E-Trucks: Findings and Recommendations of the E-Truck Task Force; Calstart: Pasadena, CA, USA, 2012; Volume 1. [Google Scholar]
  57. Bankrate CD Investment rates results. Available online: http://www.bankrate.com/funnel/cd-investments/cd-investment-results.aspx?&prods=15&local=false (accessed on 1 November 2015).
  58. The Budget and Economic Outlook: 2015-2025; Congressional Budget Office: Washington DC, USA, 2015.
  59. Zhao, Y.; Noori, M.; Tatari, O. Vehicle to Grid regulation services of electric delivery trucks: Economic and environmental benefit analysis. Appl. Energy 2016, 168, 146–158. [Google Scholar] [CrossRef]
  60. Noori, M.; Zhao, Y.; Onat, N.; Gardner, S.; Tatari, O. Light-duty electric vehicles to improve the integrity of the electricity grid through vehicle-to-grid technology: Analysis of regional net revenue and emissions savings. Appl. Energy 2016, 170, 161–175. [Google Scholar] [CrossRef]
  61. Zhao, Y.; Tatari, O. A hybrid life cycle assessment of the vehicle-to-grid application in light duty commercial fleet. Energy 2015, 93, 1277–1286. [Google Scholar] [CrossRef]
  62. Noori, M.; Gardner, S.; Tatari, O. Electric vehicle cost, emissions, and water footprint in the United States: Development of a regional optimization model. Energy 2015, 89, 610–625. [Google Scholar] [CrossRef]
  63. Noori, M.; Kucukvar, M.; Tatari, O. Environmental Footprint Analysis of On-shore and Off-shore Wind Energy Technologies. In Proceedings of the IEEE International Symposium on Sustainable Systems and Technology, Boston, MA, USA, 16–18 May 2012.
  64. Noori, M.; Kucukvar, M.; Tatari, O. Economic Input–Output Based Sustainability Analysis of Onshore and Offshore Wind Energy Systems. Int. J. Green Energy 2015, 12, 939–948. [Google Scholar] [CrossRef] [Green Version]
  65. Noori, M.; Kucukvar, M.; Tatari, O. A macro-level decision analysis of wind power as a solution for sustainable energy in the USA. Int. J. Sustain. Energy 2015, 34, 629–644. [Google Scholar] [CrossRef]
  66. Nam, B.; Golestani, B.; Noori, M.; Tatari, O.; An, J. Investigation of Reflective Cracking Mitigation Techniques; Final Report; University of Central Florida: Orlando, FL, USA, 2014. [Google Scholar]
  67. Noori, M. Sustainability Assessment of Wind Energy for Buildings; University of Central Florida: Orlando, FL, USA, 2013. [Google Scholar]
  68. Consoli, F.A.; Alomari, A.H.; Al-Deek, H.; Rogers, J.; Sandt, A.; Noori, M.; Tatari, O.; Hadi, M. Evaluation of Conditional Transit Signal Priority Technology for Regional Implementation. Transp. Res. Rec. J. Transp. Res. Board 2015. [Google Scholar] [CrossRef]
  69. Ercan, T.; Kucukvar, M.; Tatari, O.; Al-Deek, H. Congestion Relief Based on Intelligent Transportation Systems in Florida. Transp. Res. Rec. J. Transp. Res. Board 2013, 2380, 81–89. [Google Scholar] [CrossRef]
  70. Noori, M.; Tatari, O.; Nam, B.; Golestani, B.; Greene, J. A stochastic optimization approach for the selection of reflective cracking mitigation techniques. Transp. Res. A Policy Pract. 2014, 69, 367–378. [Google Scholar] [CrossRef]
  71. Kucukvar, M.; Noori, M.; Egilmez, G.; Tatari, O. Stochastic decision modeling for sustainable pavement designs. Int. J. Life Cycle Assess. 2014, 19, 1185–1199. [Google Scholar] [CrossRef]
  72. Kay, M.; Clark, M.; Duffy, C.; Laube, M.; Lian, F.S. Bus Lifecycle Cost Model for Federal Land Management Agencies: User’s Guide; U.S. Department of Transportation Research and Innovative Technology Administration John A. Volpe National Transportation Systems Center: Cambridge, MA, USA, 2011. [Google Scholar]
  73. Neff, J.; Dickens, M. 2013 Public Transportation Fact Book; American Public Transportation Association: Washington, DC, USA, 2013. [Google Scholar]
  74. BYD. BYD 40′ Electric Transit Bus 2015. Available online: http://www.byd.com/na/auto/40feet.html (accessed on 20 May 2010).
  75. Cicconi, P.; Landi, D.; Morbidoni, A.; Germani, M. Feasibility analysis of second life applications for Li-ion cells used in electric powertrain using environmental indicators. In Proceedings of the IEEE International Energy Conference and Exhibition (Energycon), Florence, Italy, 9–12 September 2012; pp. 985–990.
  76. Amarakoon, S.; Smith, J.; Segal, B. Application of Life- Cycle Assessment to Nanoscale Technology: Lithium-ion Batteries for Electric Vehicles; EPA: Washington, DC, USA, 2013. [Google Scholar]
  77. Barnitt, R.; Gonder, J. Drive Cycle Analysis, Measurement of Emissions and Fuel Consumption of a PHEV School Bus Preprint. National Renewable Energy Laboratory (NREL): Golden, CO. USA, 2011. [Google Scholar]
  78. De Filippo, G.; Marano, V.; Sioshansi, R. Simulation of an Electric Transportation System at The Ohio State. Appl. Energy 2014, 113, 1686–1691. [Google Scholar] [CrossRef]
Figure 1. Transit and school buses’ environmental emissions data collection and analysis path.
Energies 09 00230 g001
Figure 2. Cumulative cash flow of transit diesel (average) and BE (regional) buses.
Energies 09 00230 g002
Figure 3. Cumulative cash flow of school diesel (average) and BE (regional) buses.
Energies 09 00230 g003
Figure 4. Regional net revenue of V2G service for transit (a) and school (b) bus options.
Energies 09 00230 g004
Figure 5. Regional average of cumulative GHG emission savings in 2027 for transit and school battery electric (BE) bus due to V2G availability [tons].
Energies 09 00230 g005
Figure 6. Total air pollution externalities of bus and fuel types.
Energies 09 00230 g006
Table 1. Literature review of life cycle assessment (LCA), vehicle-to-grid (V2G), and air pollution externality studies. Greenhouse gas: GHG.
Study typeReferenceShort description of the articles
LCA studiesFrey et al. [17]Comparison of the LCA results for diesel and hydrogen fuel cell transit buses.
Hess [18]Evaluating the environmental emissions of alternative fuel transit buses.
Ally and Pryor [19]Comparison of diesel, natural gas, and fuel cell bus options by using process-LCA tool GaBI and fuel cycle models.
Chester and Horvath [20]It defines and quantifies all of the public transportation modes’ LCA analysis results, but although it is an important study in terms of methods and data, the study itself is beyond the scope of this research which will assume that the infrastructure of BE and diesel buses will be the same except for the charging infrastructure of each bus type, as will be further explained in later sections.
Ou et al. [21]Alternative fuel use level scenarios for future years under various scenarios related to the adoption of alternative fuels for transit buses are investigated.
Ou et al. [22]Evaluation of different policy recommendations for reducing GHG emissions and fossil fuel consumption in China by using alternative fuels for transit buses.
Cooney et al. [23]A hybrid-LCA approach to evaluate the environmental emission impacts of BE and diesel transit buses, taking the different state-based electricity grid mixes into account.
García Sánchez et al. [24]Comparison of the GHG emissions and energy consumption rates of BE, hybrid, and diesel buses for Spain’s current and future electricity generation mixes.
Lajunen [25]The lifetime energy consumption rates and cost-benefit analysis results of BE and hybrid transit buses are presented.
Onat et al. [26]Hybrid and BE passenger vehicles are analyzed for their LCA impacts for environmental, social, and economic concerns.
Donateo et al. [27]Real life experiment (driving cycles) for electric vehicle related environmental emissions.
Xu et al. [28]The environmental emission performance of various alternative fuel options for transit buses in different U.S. cities under different operational conditions is investigated.
Rogge et al. [29]Drive range anxiety of battery electric transit buses are studied for feasible charging solutions of uninterrupted service.
Ercan and Tatari [30]Diesel, hybrid, BE, biodiesel, Compressed Natural Gas (CNG), and Liquefied Natural Gas (LNG) fuel options of transit buses in terms of their lifetime environmental emissions and water withdrawal impacts with the consideration of regional electricity generation mixes.
V2G studiesKempton and Tomic [14]Comparison of V2G ancillary service revenues as well as the costs incurred due to battery degradation.
Kempton and Tomic [15]Business models for the incorporation of V2G and fluctuated renewable energy.
Noel and McCormack [12]Comparison of V2G available BE and diesel school buses for life cycle cost and environmental emission externalities.
Turton and Moura [31]V2G system is analyzed with an energy-system model has been used to project the future changes of both energy and transportation systems.
Kudoh et al. [32]Vehicle to Home (V2H) systems are analyzed with LCA perspective.
Externality studiesMuller and Mendelsohn [33,34]Air Pollution Emission Experiments and Policy (APEEP) analysis model to quantify conventional air emissions’ human health impacts.
Michalek et al. [35]Quantified air emission externalities for vehicle manufacturing, fuel production, electricity generation, and tailpipe emissions.
Gouge et al. [36]Optimal transit bus operation for reducing air pollution externalities.
Ercan et al. [37]Optimal bus fleet in terms of life cycle cost, CO2 emissions, and air emission externalities with different alternative fuel choices for transit buses under different driving conditions.
Table 2. Explanations of notations and indexes. regional transmission organization: RTO; independent system operators: ISO; Pennsylvania-New Jersey-Maryland interconnection RTO: PJM; Independent system operators of new England region: ISO-NE; New York independent system operators: NYISO; Electric Reliability Council of Texas: ERCOT; California independent system operators: CAISO.
NotationExplanationTypeIndex
jAir pollutant typeGHGj = 1
COj = 2
NOxj = 3
PM10j = 4
PM2.5j = 5
SOxj = 6
VOCj = 7
pPower plant typeCoalp = 1
Oilp = 2
Gasp = 3
Other Fossilp = 4
Nuclearp = 5
Hydrop = 6
Biomassp = 7
Windp = 8
Solarp = 9
Geo-Thermalp = 10
rISO/RTO regionsPJMr = 1
ISO-NEr = 2
NYISOr = 3
ERCOTr = 4
CAISOr = 5
yAnalysis period years-y = 2015 - 2027
iBus typeTransiti = 1
Schooli = 2
eGRIDjryYearly (y) emission rate of energy losses in r region for j air pollutant based on eGRID data (lb/kWh)
GLFrGrid loss factor (GLF) for r region based on eGRID data
UGjpWell-to-pump (WTP) analysis emissions of energy source for p power plant for j air pollutant (lb/kWh)
EMpryYearly (y) emission rate of electricity production at p power plant in r region (lb/kWh)
UEijUpstream j type of emissions for diesel i type of bus
UAijUpstream j type of air externality cost for diesel i type of bus
DEijDownstream j type of emissions for diesel i type of bus
DAijDownstream j type of air externality cost for diesel i type of bus
KiLifetime electricity consumption of i type bus
BjAir externality cost of per MWh electricity generation for j type of emission
Table 3. Specifications of bus types and V2G system.
NotationValueDefinitionUnitReference
BE-School BusBE-Transit Bus
Pcap80203Battery Capacity or max power available from buskWh[12,30,48]
TbatteryUniform (2000–6000)Battery lifetime charging cyclescycles[14,23,49,50]
DVMT50101Daily vehicle miles traveled (VMT)miles[23]
BRange00Buffering range to return safely charging facilitymiles-
FE0.75–2.00 a1.70–2.24 bFuel economykWh/milesa Low range: [12]; High range [51].
b Low range: [52]; High range: [23].
Tdispatch0.30.3Dispatch timeh
Xconvert0.930.93DC to AC conversion factor-[53]
Pdispatch70–14070–140Capacity of charging facility could transfer for revenuekW-
Tplug19.5–218–12Number of hours that bus is plugged to the chargerhours[11,12]
Cinstallation$5000–$10,000$5000–$10,000Charging facility installation cost$ (2014)[54]
Cequipment$12,000–$20,000$12,000–$20,000Charging facility equipment cost (Level 3)$ (2014)[54]
CC-Main$600–$1000$600–$1000Charging facility annual maintenance cost (5% of Cequipment)$ (2014)/year[54]
CB-Main$0.2–$0.75$0.75Per mile maintenance cost of bus$(2014)/mile[12,55]
Cbus$230,000$800,000Purchase cost of bus$ (2014)[6,12,25]
Cbat unit$600Battery price per kWh capacity$-year/kWh[56]
CV2GUniform ($1900–$2100)Cost of V2G system equipment$ (2014)[14]
Drate0.65%–1.15%Annual Discount Ratepercentage[57]
Irate±10% of CBO’s projectionsAnnual Inflation Ratepercentage[58]
Table 4. Average lifetime cash flow analysis of transit and school buses in CAISO region.
Value TypeSchool Bus- BESchool Bus- DieselTransit Bus- BETransit Bus- Diesel
Purchase price (Cbus)$230,000 $110,000$800,000$340,000
Lifetime fuel cost (diesel or electricity)$21,915$82,494$87,181$500,113
Maintenance cost (CB-Main)$66,814$140,461$311,892$415,856
Charging station purchase cost (Cinstallation + Cequipment)$23,446$0$23,587$0
Charging station maintenance cost (CC-Main)$8971$0$8979$0
Battery replacement cost (due to operation) (Cbattery)$29,819$0$76,073$0
V2G capacity payment revenue−$229,498$0−$96,261$0
V2G energy payment revenue (exchanged electricity)−$56,329$0−$56,469$0
V2G cost (V2G equipment + battery degradation) (Cregu)$79,285$0$79,423$0
Resale value−$32,658−$17,199−$106,123−$43,810
Government incentives (if applicable)−$84,876$0−$106,146$0
Net value$56,888$315,756$1,022,135$1,212,158

