Article

Pulse-Based Fast Battery IoT Charger Using Dynamic Frequency and Duty Control Techniques Based on Multi-Sensing of Polarization Curve

School of Electronics Engineering, Kyungpook National University, Daegu 702-701, Korea
*
Author to whom correspondence should be addressed.
Energies 2016, 9(3), 209; https://doi.org/10.3390/en9030209
Submission received: 18 January 2016 / Revised: 8 March 2016 / Accepted: 9 March 2016 / Published: 17 March 2016

Abstract

:
The pulse-based charging method for battery cells has been recognized as a fast and efficient way to overcome the shortcoming of a slow charging time in distributed battery cells, which is regarded as a connection of cells such as the Internet of Things (IoT). The pulse frequency for controlling the battery charge duration is dynamically controlled within a certain range in order to inject the maximum charge current into the battery cells. The optimal frequency is determined in order to minimize battery impedance. The adaptation of the proposed pulse duty and frequency decreases the concentration of the polarization by sensing the runtime characteristics of battery cells so that it guarantees a certain level of safety in charging the distributed battery cells within the operating temperature range of 5–45 °C. The sensed terminal voltage and temperature of battery cells are dynamically monitored while the battery is charging so as to adjust the frequency and duty of the proposed charging pulse method, thereby preventing battery degradation. The evaluation results show that a newly designed charging algorithm for the implemented charger system is about 18.6% faster than the conventional constant-current (CC) charging method with the temperature rise within a reasonable range. The implemented charger system, which is based on the proposed dynamic frequency and duty control by considering the cell polarization, charges to about 80% of its maximum capacity in less than 56 min and involves a 13 °C maximum temperature rise without damaging the battery.

1. Introduction

Recently, demands for various applications based on large-scale battery cells, such as electric vehicle (EV) and remotely-installed industrial appliances, are beginning to grow [1]. Large capacity battery-operated appliances have not been widely used due to the high price of purchasing the battery cells and the long charging times.
We consider collection of battery cells as Internet of cell-Things (IoCT), where the distributed cells share their status with each other. Actually, multiple battery pack is now implemented with a wire-connected package, but in the future, the supervisor (e.g., the gateway) and the viewer (e.g., the mobile phone) will enable seamless communication between battery cells installed around us. The proposed approaches introduce our initial effort to improve the charging-control method of the multiple cell-things without supervisor configuration. It can be considered as a smart IoCT application.
Based on this concept, we proposed the fast battery-charging architecture for the distributed multiple battery cells as IoCT, which is illustrated in Figure 1a. This large-scale battery pack is composed of 80 cells connected in series, and the battery management microcontrollers are mounted on each battery cell. Figure 1b describes the system-level evaluation environment of the proposed fast charging method. The four cells are integrated with the on-battery microcontroller (MCU)-based controller and host-side charger algorithm.
A MCU is a tiny embedded system including dedicated hardware to be executed by the on-chip programmed software algorithm. A fully passive hardware component-based charger solution needs more complex implementation efforts to perform case-by-case management under the unexpected various situations of battery packs; therefore, a software-configurable MCU-based charger is more preferable.
The battery charger has to control the reasonable current injection at a specifically biased voltage level by sensing and sharing the dynamically changed characteristics of the battery’s status, such as voltage, injected current, load current, and operating temperature. The trade-off between the charging speed and the reliability of the internal electrochemical reaction process has to be considered, which is a barrier to increasing the charging speed.
There are lots of studies on how to increase the speed of battery charging, such as variants of the constant current, constant voltage (CC-CV) charging method, polarization curve-based charging method, and pulse-based charging method. The traditional CC-CV charging method has a limitation in terms of providing fast charging mode [2]. Actually, a battery charger with a fast charging method, which is available on the market, cannot fully charge to around 80% capacity in a relatively short period of time of about 70 min [3].
The pulse-based charging method has been recognized as a fast and efficient way to overcome the shortcoming of the slow charging time in distributed battery cells, which was also presented in our previous work [4]. The pulse frequency for controlling the battery charge duration will be dynamically changed within a certain range in order to inject the maximum charge current into the battery cells. This paper describes our efforts to design a fast battery-charging algorithm based on optimal frequency and duty control, while still protecting battery cells from over-voltage or over-heating status, in order to provide a long life cycle for the battery pack. We implemented the total solution of the fast battery charger, including the charger algorithm in the host and the battery management system-on-chip in the battery pack.
This paper is organized as follows. In Section 2, our research motivation and related work are discussed. Section 3 describes the details of the proposed fast battery-charging method. The implementation and experimental results are presented in Section 4. Finally, we conclude the paper by summarizing our contributions in Section 5.

2. Background

The discussion of this paper mainly focuses on lithium rechargeable batteries because this kind of battery is mostly common used and they have some good features, such as high energy density, a long life cycle,wide operating range in temperature, and the quality of being robust against short circuit.
A lot of research has been done on the battery charging method, but the performance enhancement of battery charging is still needed. Several representative charge algorithms are discussed in this section. These algorithms are analyzed in detail. Both the advantages and disadvantages of each are also described.

2.1. Constant Current, Constant Voltage Charging Algorithm

CC-CV is a widely adopted method for rechargeable cells. The charged current is automatically adjusted during the charge process because the voltage difference between the charger and the battery is decreased, but this process requires a few hours to charge the battery to full capacity [5].
In the first stage, the constant high current, which in this paper is 2500 mA , is injected, and the charger voltage is increased to 4.2 V , which is the objective in a fully-charged state, as shown in Figure 2 and Figure 3.
However, the battery terminal voltage is still 3.86 V due to the voltage drop in the current sensor and the line resistance. In the second stage, the charging current automatically drops and the constant voltage of 4.2 V is still constantly biased until the state of charge (SOC) reaches 80%, at which point the terminal voltage is 4.08 V and the elapsed charge time is 4075 s.
As an example of controlling the charging process for multiple battery cells, electric vehicle (EV) manufacturers have adopted the constant-current charging method to reduce the charging time. The thermal response test is performed at the high charging rate of 3 C , and there is a high cell temperature increase of 18 C in free air [6].

2.2. Multi-State Current Charging Algorithm

Figure 4 illustrates the five stages of the constant current charging algorithm. In each stage, the constant current is injected to charge the battery until the terminal voltage reaches a specified level. The current magnitude decreases according to the transition between each stage. It is critical to determine the proper charging current at every stage with the preset voltage limit.
Many previous studies have been done on the optimal current determination. Some research showed that the multistage charging method, using complex calculation in a high performance MCU, is faster and more efficient than the traditional method [7].

2.3. Pulse-Based Charging Algorithm

To achieve a high charging speed for multiple battery cells, pulse-based battery charging approaches, such as variable frequency pulse charge system (VFPCS) and duty-varied voltage pulse-charge strategy (DVVPCS), have been introduced in previous literature, such as [8,9].
Figure 5a shows the biased charge period when the charge pulse is high and the following relaxation period when the charge pulse is off. An immediate rise and drop in the charging current can be observed between the beginning and ending of the charge injection, respectively.
Figure 5b shows the diffusion relaxation after a period of the constant-current charging mode. Terminal voltage declines abruptly after the charging period due to the polarization voltage decreasing rapidly. The relaxation time will last a few hours before the status completely settles down. The terminal voltage settles down after 1000 s (at absolute time 1250 s) is elapsed from the pulse release. In this paper, we considered that the polarization voltage is small enough to be ignored after 1000 s [10].
Compared to the traditional CC-CV method, pulse charging has many advantages, including high efficiency, high charging rate, and a long battery life cycle [11]. The charge speed of the VFPCS and the charge efficiency of the DVVPCS are good enough to be used in the recharging applications for multiple cells, but neither considers both frequency and duty cycle factors simultaneously. Based on the optimal frequency and duty control, our effort to design an efficient battery-charging algorithm focuses on improving the charging speed and energy efficiency.
However, pulse-based charging needs the complex hardware configuration and algorithmic manipulation sensing the current, voltage, and temperature in the charging runtime. In addition to the cost of design complexity, the unexpected variation of the charging current may lead to performance loss due to the compensation of the current flow.
In this paper, we propose a newly designed charger to control the duty and frequency of the charge pulse based on polarization curve characteristics according to the status of SOC. The newly designed pulse charger requires two input values: frequency and duty cycle. The searching methods for the optimal frequency and duty cycle are based on two approaches, which are described in the following two sections.

3. Proposed Architecture

3.1. Basic Principle of Lithium Battery

The charge rate in a battery is an important parameter to assess the speed of charging, which is allowed in terms of reliability. The charge rate C/10 means that the battery capacity is returned in 10 h. The SOC refers to how much charge is available in a battery. SOC is proportional to the remaining charge compared to the state of the fully charged battery. SOC is not measurable, and can be only estimated only by other measurable parameters, such as open circuit voltage (OCV), and OCV-SOC curve. We adopted the coulomb counting-based SOC estimation method with the following:
S O C ( t ) = S O C ( 0 ) - 1 Q 0 t I ( t ) d t
Figure 6 shows an example of an OCV-SOC profile, which is measured for the INR18650-25R lithium battery model.
The equivalent circuit model [12] is a powerful approach to the numerical analysis of battery behavior, which describes the characteristics of the battery as capacitative and resistant. The high-fidelity model has also been also adopted as the basis of this work; it consists of an ideal voltage source ( E m ), an resistor-capacitor (RC) block ( R 1 , C 1 ), and an internal resistance ( R 0 ), as shown in Figure 7a. These fundamental parameters describing the status of the battery cells are dependent on the dynamically changed temperature and SOC of the cell [13].
A two-dimensional lookup table (LUT) for the parameters of the multiple battery cells is statically built from the feature points that are collected in runtime using the parameter estimation tool in Simulink Design OptimizationTM. The generated LUT for the multiple battery cells, which is used in this study, is shown in Figure 7b.
After performing the parameter estimation procedure using independent experimental data, an additional step is needed to verify whether the equivalent circuit model can meet all the dynamic characteristics of the cell.
Polarization voltage is the dropout voltage on the RC block and it can be calculated by the following equation:
V p = V o - O C V SOC - I R 0
V o is the battery terminal voltage. The OCV is a voltage value related to its SOC value at a given time, as shown in Figure 6. A series of experimental results, which was introduced in our previous works [14], show that polarization voltage is relatively small when SOC is greater than 20% and less than 80%. In the earlier stage and the final stage (SOC < 20% or SOC > 80%), polarization rapidly increases.

3.2. Acceptable Current Selection Based on Polarization

Based on the mechanism of polarization, the allowed current injection is restricted by considering the SOC of the battery, which is measured in Figure 8a. Therefore, the appropriately acceptable charging current has to be selected during the runtime of the charge process by increasing the charging rate to reduce the time or by decreasing the charging rate to minimize the damage to the battery.
It is obvious that the polarization phenomenon is serious in the low and high SOC and relatively stable in the middle SOC, just like a bowl. First, charging the battery at C/3 using a constant current from 0% to 20% SOC is shown in Figure 8b. Then 2 C is adopted until it meets the calculated acceptable current curve, reducing the charging current every 5% of SOC and stopping charging when SOC is 80%. This kind of method has already been proved as a quick charging method in the SOC from 20% to 80% [10]. This SOC region is the most commonly used and is very practical for EVs or plug-in hybrid electric vehicles (PHEV).
The calculated acceptable charging current in the specified range of SOC is shown in Table 1. In the experimental phase, this table will be used as the basis.
In this paper, we adjust the duty and frequency of the charge pulse simultaneously to select the acceptable injection current.

3.3. Optimal Frequency Searching Mode

The capacitative characteristic of the battery cell causes different responses at different frequency pulses, which are activated when the battery is charging. Figure 7a shows that the battery impedance is the summation of Z 0 and Z 1 , as described in Equations (3) and (4):
Z 1 = R 1 1 j w C 1 R 1 + 1 j w C 1
Z = Z 0 + Z 1 = R 0 + R 1 1 j w C 1 R 1 + 1 j w C 1
This search mode finds the optimal frequency while minimizing the cell impedance, using the highest charging current to reduce the energy consumption in the battery. Figure 9 shows that impedance Z 1 is more dependent on the pulse charging frequency than SOC. We take 0.01 Hz , 0.1 Hz , 1 Hz , and 100 Hz as examples, indicating that Z 1 will regularly drop when the frequency rises.
The AC impedance of the battery decreases as the frequency increases to 5000 Hz , which is measured by the Solartron 1280 analyzer (AMETEK, Oak Ridge, TN, USA). However, AC impedance increases exponentially in the range of 5000–100,000Hz [15].
The charger proposed in this paper uses a 50% duty cycle and adjusts the frequency range from 500 Hz to 5000 Hz by increasing the frequency by 500 Hz steps. Considering the complexity of the 80 cells connected in a series, we adopt an optimal frequency search mode instead of using the fixed frequency determined by experience.
The proposed algorithm for the optimal search mode is illustrated in Figure 10. First, the charger must confirm that the SOC is under 0.8. If the proposed method is enabled when SOC is above 0.8, the fast charging process will be stopped to prevent over-heating or over-voltage in a short period.
The pulse frequency is initialized as 500 Hz , the duty cycle is kept at 50%, the optimal current ( I optimal ) is initialized as 0 A and the optimal frequency F optimal is initialized as 500 Hz . The sweep function of the search frequency and the charging current is described in Equations (5) and (6):
F N = N * 500 H z , ( w h e r e , N : 1 . . 10 )
I N = 0 A ( w h e r e , N : 1 . . 10 )
After charging for five seconds by F N , the charging current calculation is immediately performed by averaging the current in the last five seconds, followed by updating the corresponding I N . If I N is bigger than I optimal , the I optimal and the corresponding F optimal will be updated with newer I N and F N , respectively. F N will increase by 500 Hz steps until the frequency reaches 5000 Hz or the SOC reaches 0.8.
From the successful operation of this mode, we obtain the optimal frequency, at which the battery impedance is extremely minimized and the largest charging current is injected into the battery cell. In particular, the optimal frequency will be used as a basis in the following two modes.

3.4. Optimal Duty Cycle Search Mode

Figure 11 shows the charging current being pumped into the battery and then followed by a voltage relaxation period. An immediate rise and drop in the charging current amplitude can be observed between the start and the stop of the charge injection, respectively. The instantaneous response corresponds to R 0 in the equivalent cell model, and the delayed response corresponds to the R–C reaction. In particular, the results show that the voltage relaxation requires more than ten minutes to completely settle down.
Because the concentrated polarization of battery cells is high at the end of the charging period, the battery has to diffuse the reactant evenly in an electrochemical reaction. This duty cycle search mode focuses on finding an appropriate length for the relaxation period, which may be a value that is neither too short in diffusion nor too long in extending the charging time.
The duty and frequency of the charging pulse signal can be dynamically controlled using the cell temperature and SOC in runtime to determine the maximum rate of the current injection. The acceptable charging current based on polarization characteristics has to be determined [10]. The charging current has to be under the boundary curve, taking polarization voltage as the limit, which is illustrated in Figure 11. If the charging current is always higher than the limit of the boundary curve, the battery will raise the terminal voltage, and even the temperature will rise to the threshold.
As the SOC of the battery increases, the acceptable current based on the polarization curve is gradually decreased. By sensing the polarization curve to determine the maximum charging current, the proposed pulse duty cycle search method gradually reduces the average charging current. The sweep function of the searching duty cycle and the charging current is described in Equations (7) and (8):
T = T c + T r = 1 F optimal
I = I c * T c T c + T r
T c is the charging period, T r is the relaxation period, I c is the average charging current during the charging period, and I is the equivalent charging rate in a cycle. In order to balance the influences of the polarization voltage and the charging time, the proposed charger adaptive controls the charging pulse voltage, as shown in Figure 11. The equivalent charging rate in a cycle matches the boundary curve exactly.
Figure 12 shows the algorithm of the optimal duty cycle ( D optimal ) search mode. At the beginning, the optimal frequency, which was obtained from the previous mode, is initialized, and the 10% duty cycle ( D 1 ), as described in Equation (9), is selected as an initial value, which is used to charge the battery for 5 s. I ave is the equivalent charging current in these 5 s, and I limit is the acceptable current corresponding to the SOC.
D n = n * 0 . 1 ( w h e r e , n : 1 . . 9 )
If I ave is below I limit , we can assume that the cell reactant, which is described in the equivalent cell model, can be diffused at the end of the charging period and that the battery is ready for the next charging pulse. In order to reduce the charging time, D n increases by 10% steps until the duty cycle reaches 90% or the SOC reaches 0.8. If I ave is larger than I limit , the D optimal will be updated to the newer D n .
The relaxation period during the charging process provides an opportunity to keep the concentration of the charging current at a relatively low level, preventing the battery from overheating. The proposed search method enables the dynamic determination of D optimal and effective control at the right time for the processes of charge pumping, reaction, and diffusion.

3.5. Optimal Frequency and Duty Cycle Charging Mode

In this mode, the optimal frequency and the duty cycle will be used simultaneously to charge the battery in fast mode to diminish the cell polarization voltage. Real-time monitoring of whether the SOC is divisible by 2 or 5, then the optimal duty and frequency, should be repeatedly obtained by performing the proposed searching mode again, respectively, which is shown in Figure 13. Because the battery state parameters are changed a lot, the instantaneous status of the multiple battery cells (e.g., battery voltage, temperature, and SOC) needs to be constantly monitored and shared across all cells.

4. Implementation and Experimental Results

4.1. Evaluation Framework Setup

The evaluation framework is implemented using the MATLAB/Simulink environment to design the proposed battery charger system, including the proposed search algorithm of the pulse frequency and the duty cycle, which is shown in Figure 14. The physical model of the battery cells is developed using the SimscapeTM package, which requires a solver reconfiguration.
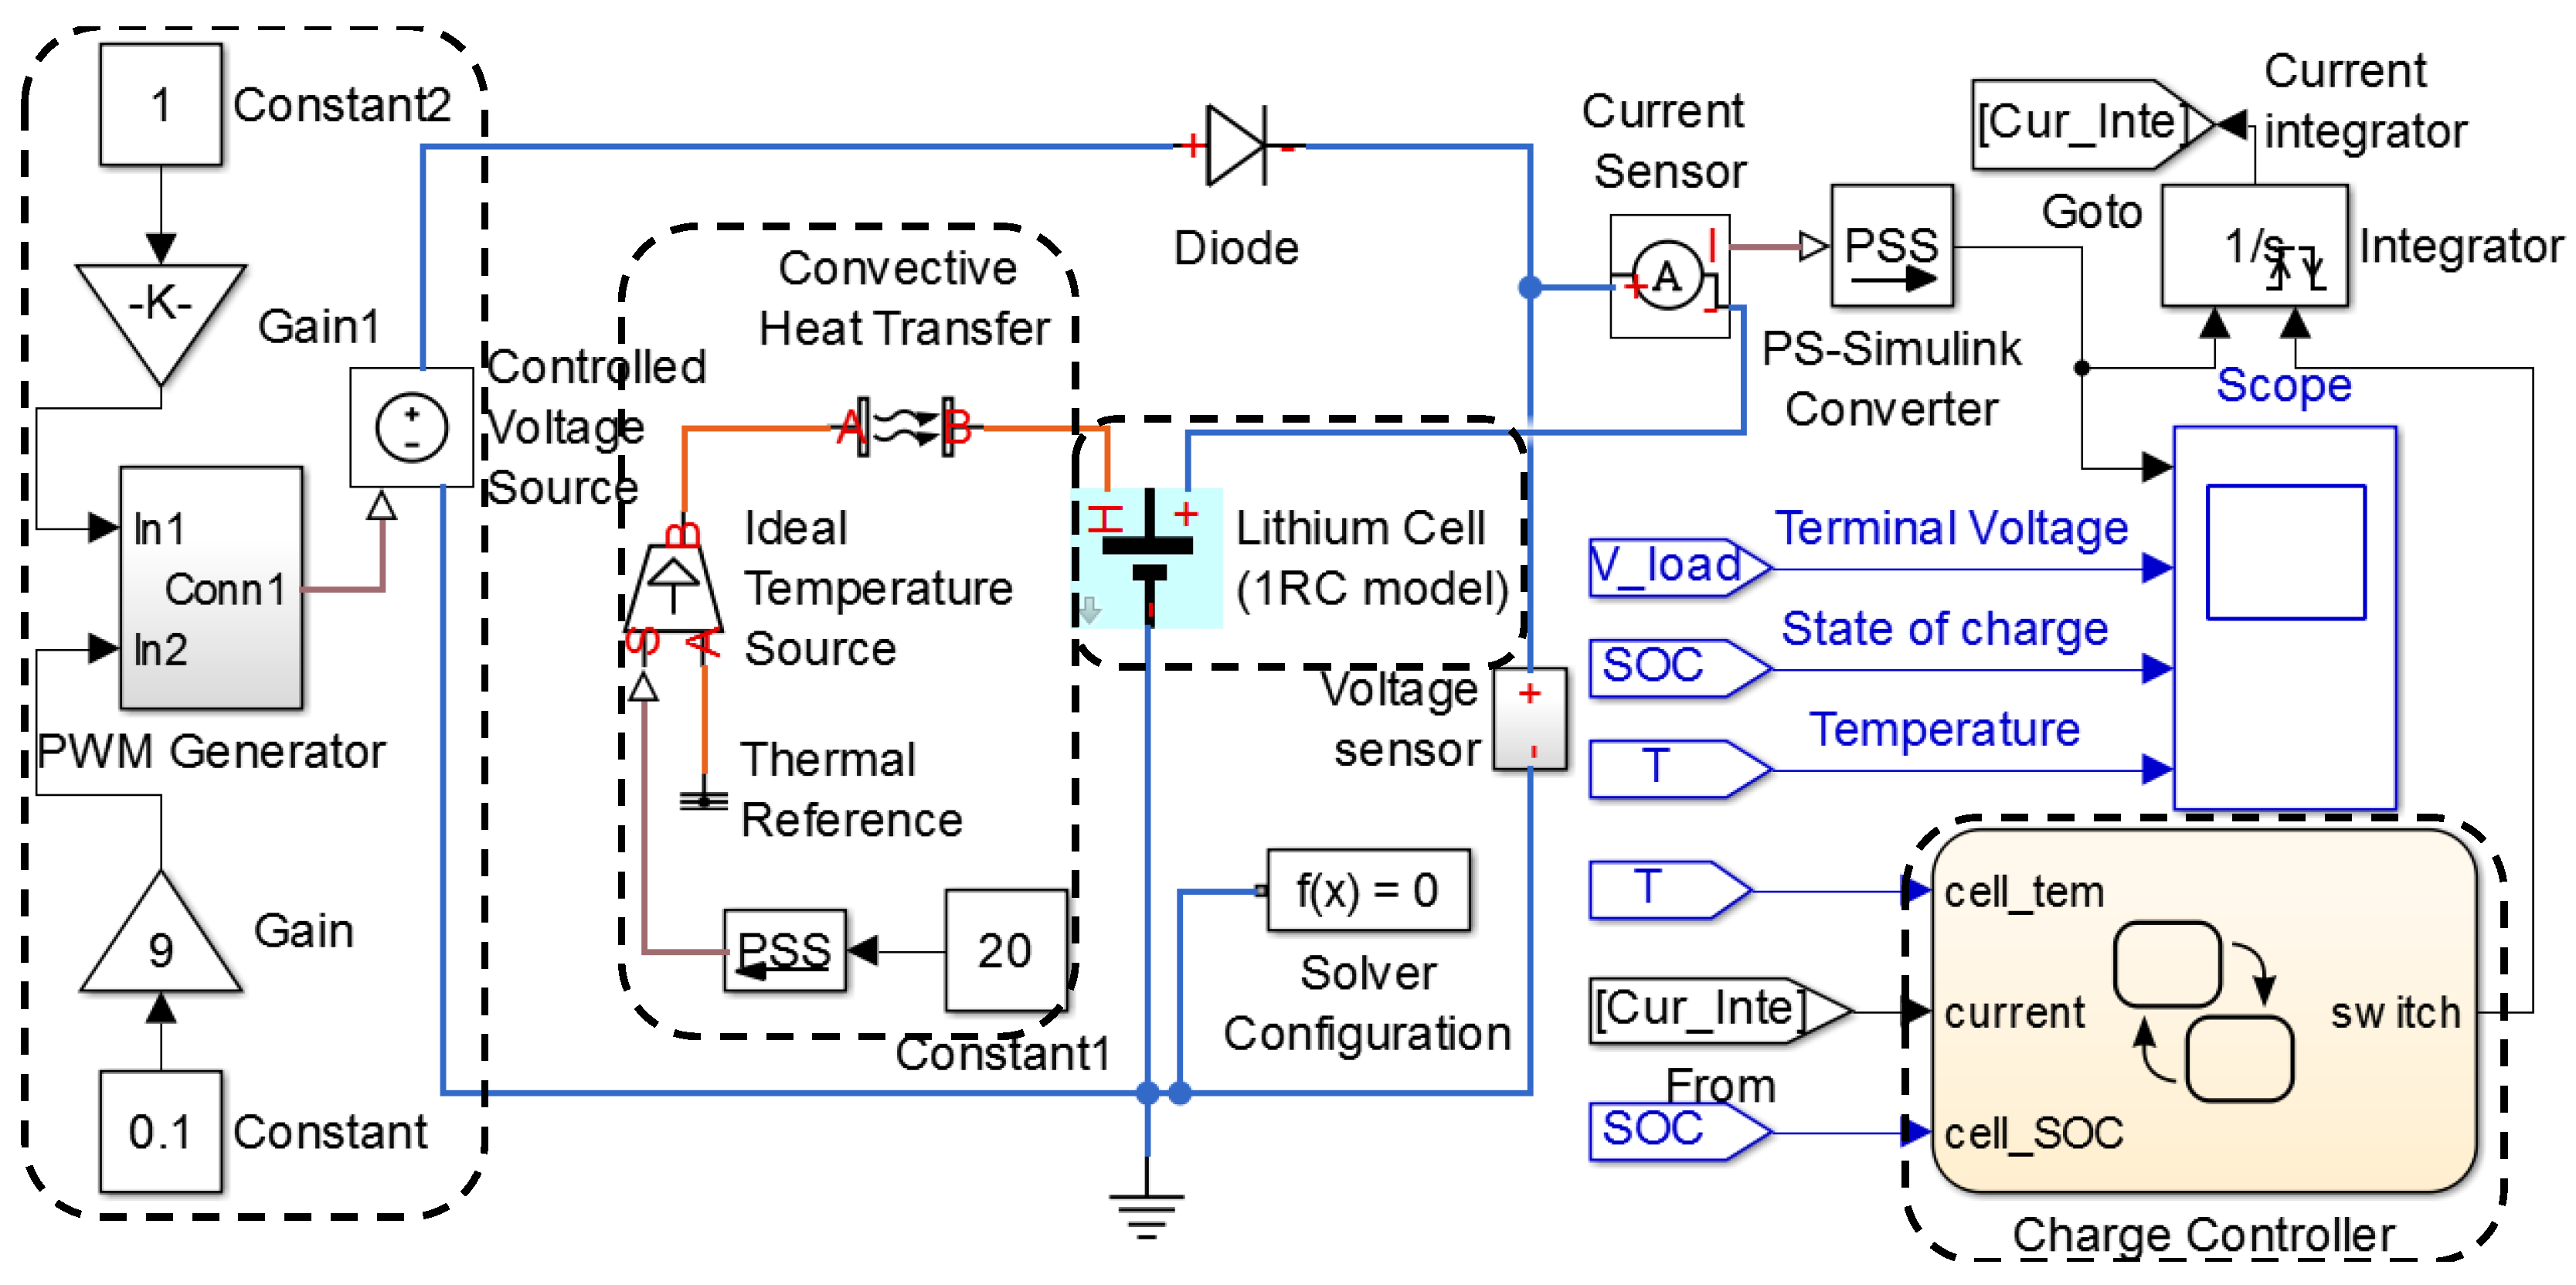
The dotted box on the left in Figure 14 indicates variable declaration for the controlled frequency and duty cycle value. The controlled voltage source block is selected from SimscapeTM to model pulse voltage for the charge process of the battery pack. Duty cycle and frequency, as the two input signals, can be adjusted by changing the gain coefficient of the gain blocks.
The convective heat transfer block offers a way to exchange the convective heat effect between the battery and the ambient environment. The second dotted box from the left shows that ambient temperature is set at 20 C, which can be adjusted as an input variable.
The third dashed line from the left shows the high-fidelity battery model provided by SimscapeTM. As a high-fidelity model design, we also consider SOC and the thermal effect on the modeled component. Each component of the equivalent circuit model will change with the SOC and temperature of the battery during the battery charging process. The amount of heat, which is generated on R 0 and R 1 as an output of the thermal model, is connected by convective heat transfer.
We designed a charge controller, described by a dashed line on the right. The charge controller decides whether to stop charging based on two input signals: the SOC and the temperature of the battery. The C u r _ I n t e signal is an accumulated value provided by the integrator block at the upper right corner to calculate the average current within seconds, so as to obtain the optimal frequency and duty cycle. The charge controller resets the integrator block with the c h a r g e _ s w i t c h signal every 5 s based on the design requirements.
Through observation and analysis of battery state parameters, such as charging current, terminal voltage, SOC, and temperature, we achieved the most efficient frequency and duty cycle for a fast pulse-based charging method. The charging time and temperature rise are due to two important parameters in the charging algorithm. The rise in temperature indicates heating in the internal resistance of the battery cells during the charge process.
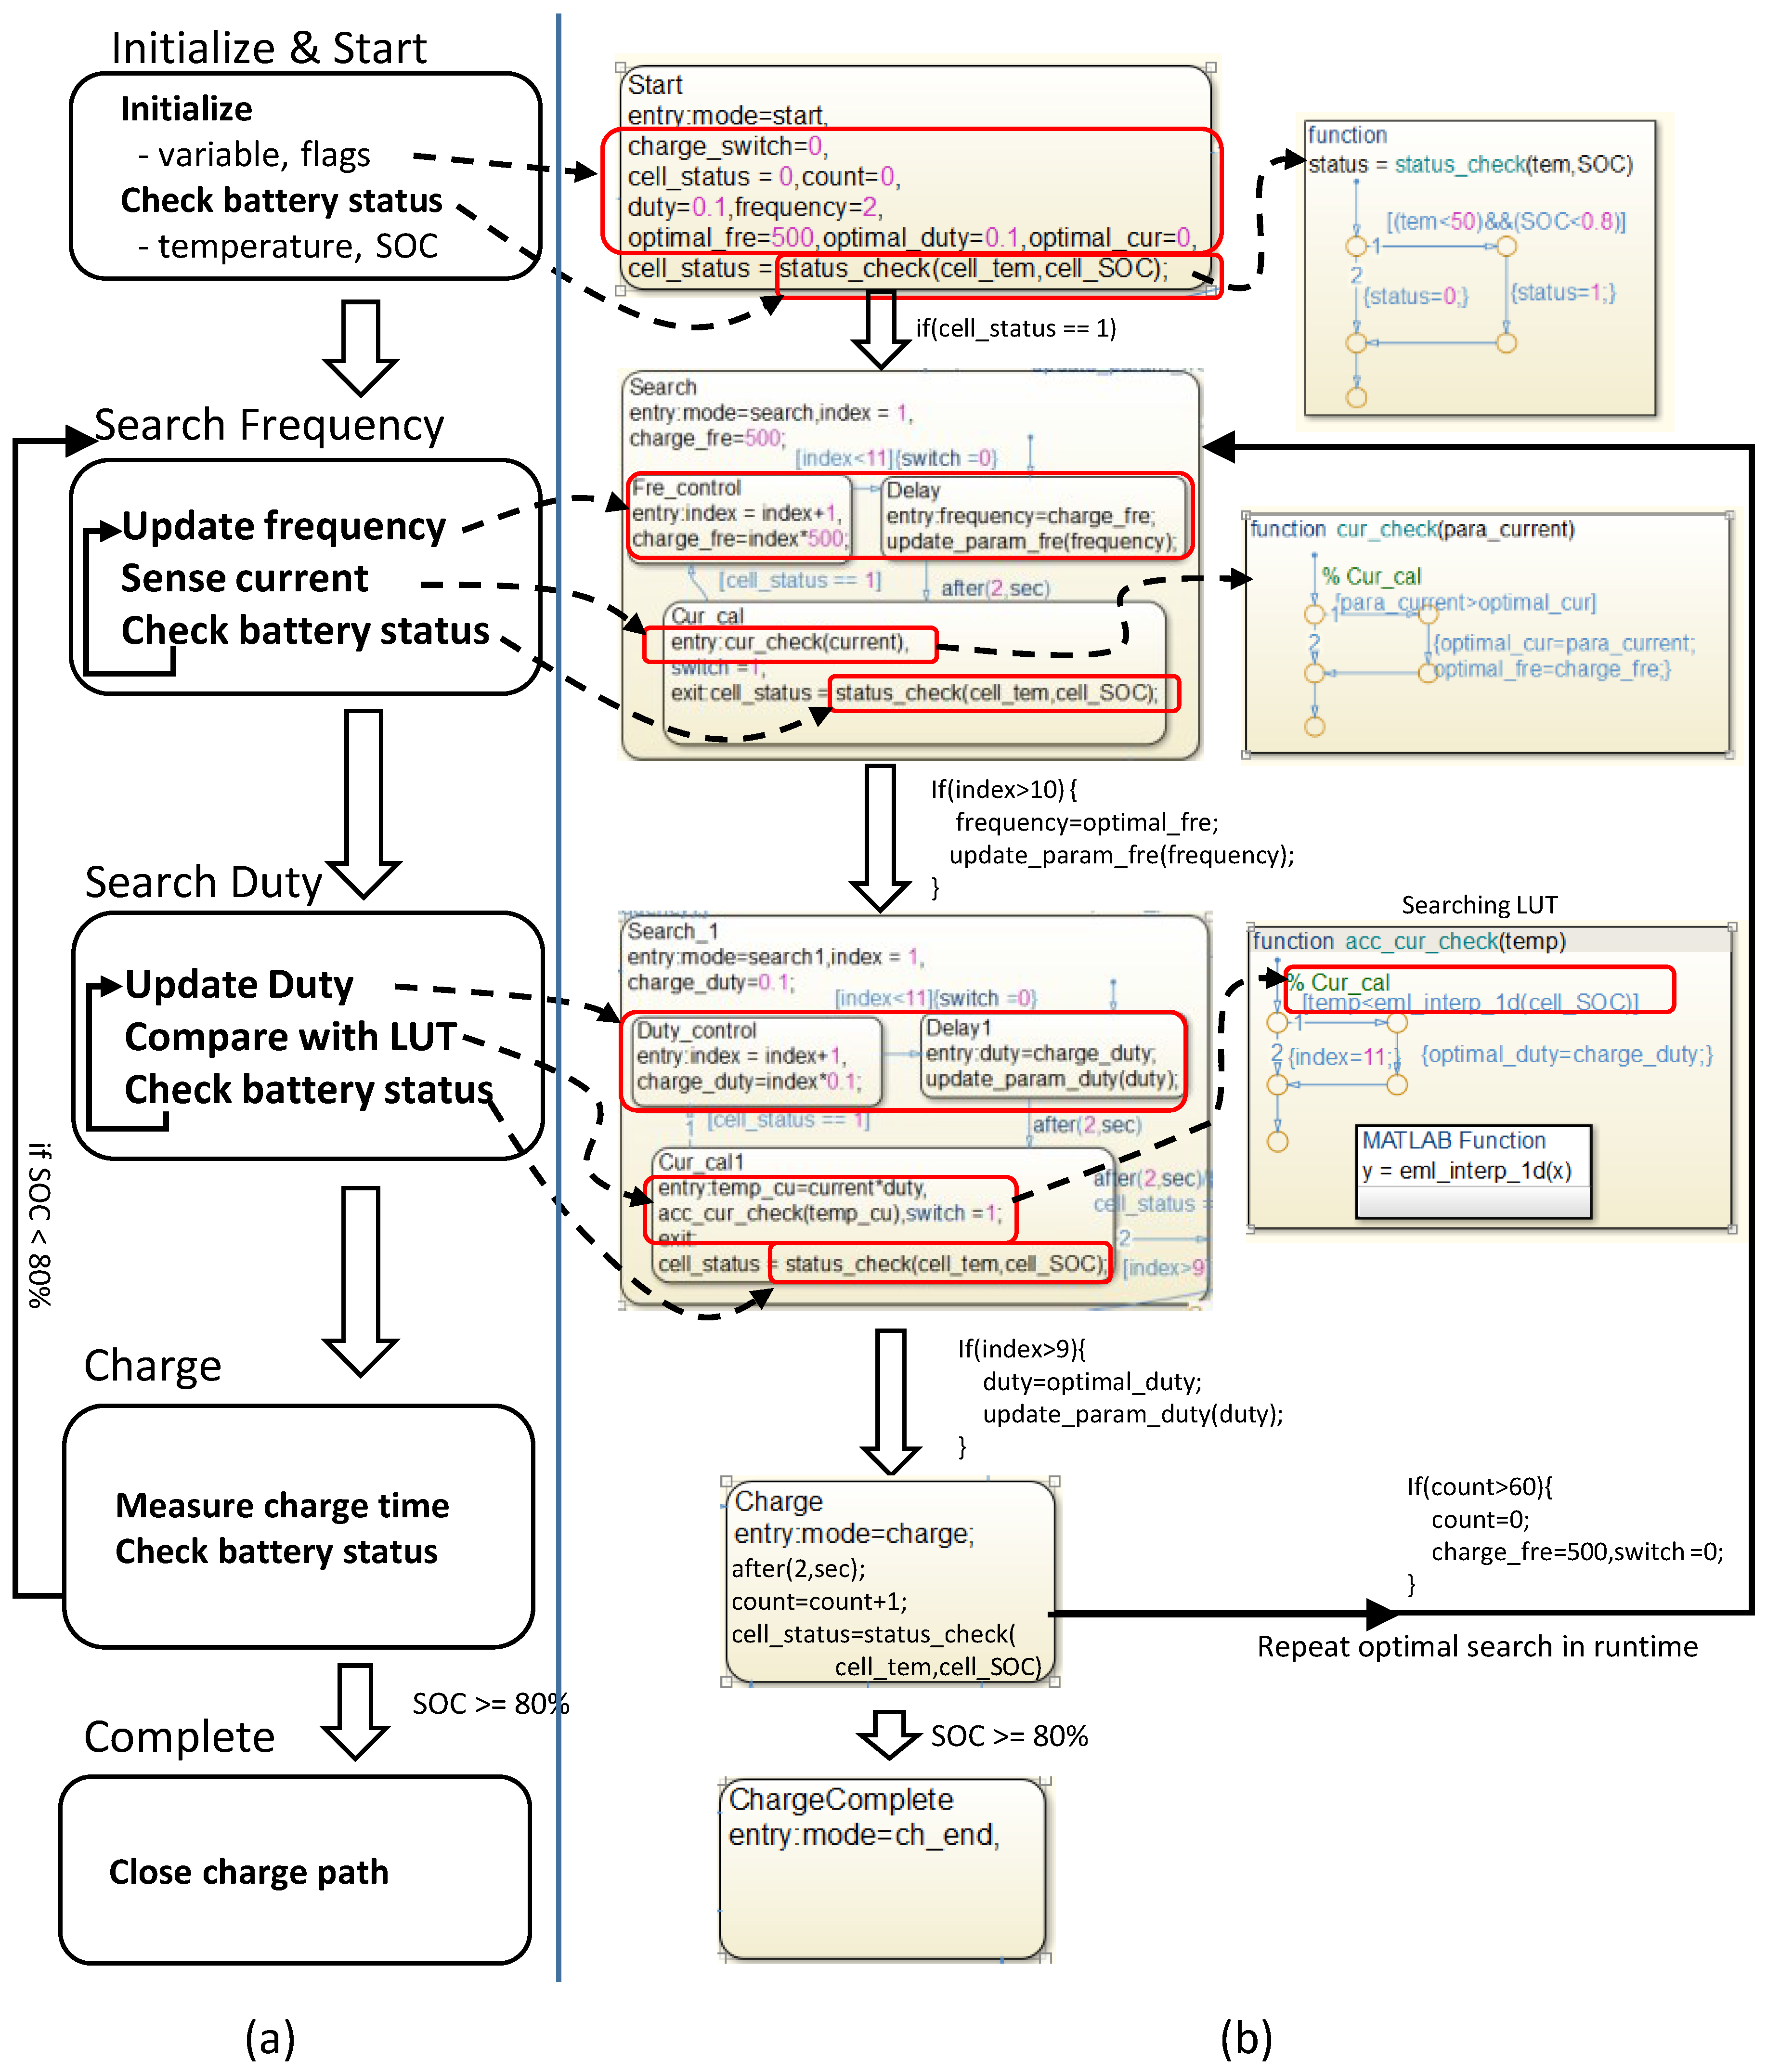
The implemented state flow of the proposed charger system is shown in Figure 15. We proposed five states, including the S t a r t , S e a r c h , S e a r c h _ 1 , C h a r g e and C h a r g e   C o m p l e t e states. The start state is a default state that initializes all the parameters and checks the battery status. The charger has to verify that the temperature and SOC of the battery are under the respective thresholds of 45 C and 0.8 by using the function of s t a t u s _ c h e c k at the lower left corner. Throughout the charge process, the battery status is checked at regular intervals.
The optimal frequency is obtained in the S e a r c h state by calling the c u r _ c h e c k function. In the S e a r c h _ 1 state, the duty cycle is adjusted to ensure that the charging current abides by the polarization curve. Through the LUT, we can check the polarization curve by calling the a c c _ c u r _ c h e c k function. We adopt the efficient pulse in the Charge state for two minutes, then cycle back to the Search state once again. Eventually, entering the Charge Complete state means that the charger process has ended.
The user-defined functions u p d a t e _ p a r a m _ f r e and u p d a t e _ p a r a m _ d u t y in the MATLAB/Simulink models are shown at the top left corner. In the function, g e t _ p a r a m and s e t _ p a r a m are used to get and change the gain coefficient of the gain blocks shown in Figure 14 during the emulation.
The BMS IC is attached to the board to measure the temperature, current flow, and voltage level of the target battery cells. The proposed fast-charge algorithm is simultaneously executed on the target BMS chip and the host-side software to provide optimized performance by integrating the on-cell extracted battery characteristics.
The Simulink state-flowTM implementation, which is described in Figure 15, is translated into the MCU firmware to interact with the interface (I/F) MCU as a charger chip and the client-side BMS chip. The control flow of the supervisor in PC is implemented as a host-side charging algorithm to perform the interoperation with I/F MCU. The I/F MCU serves as a bridge charger between the host-side supervisor and the client-side BMS, which is attached to the battery packs.
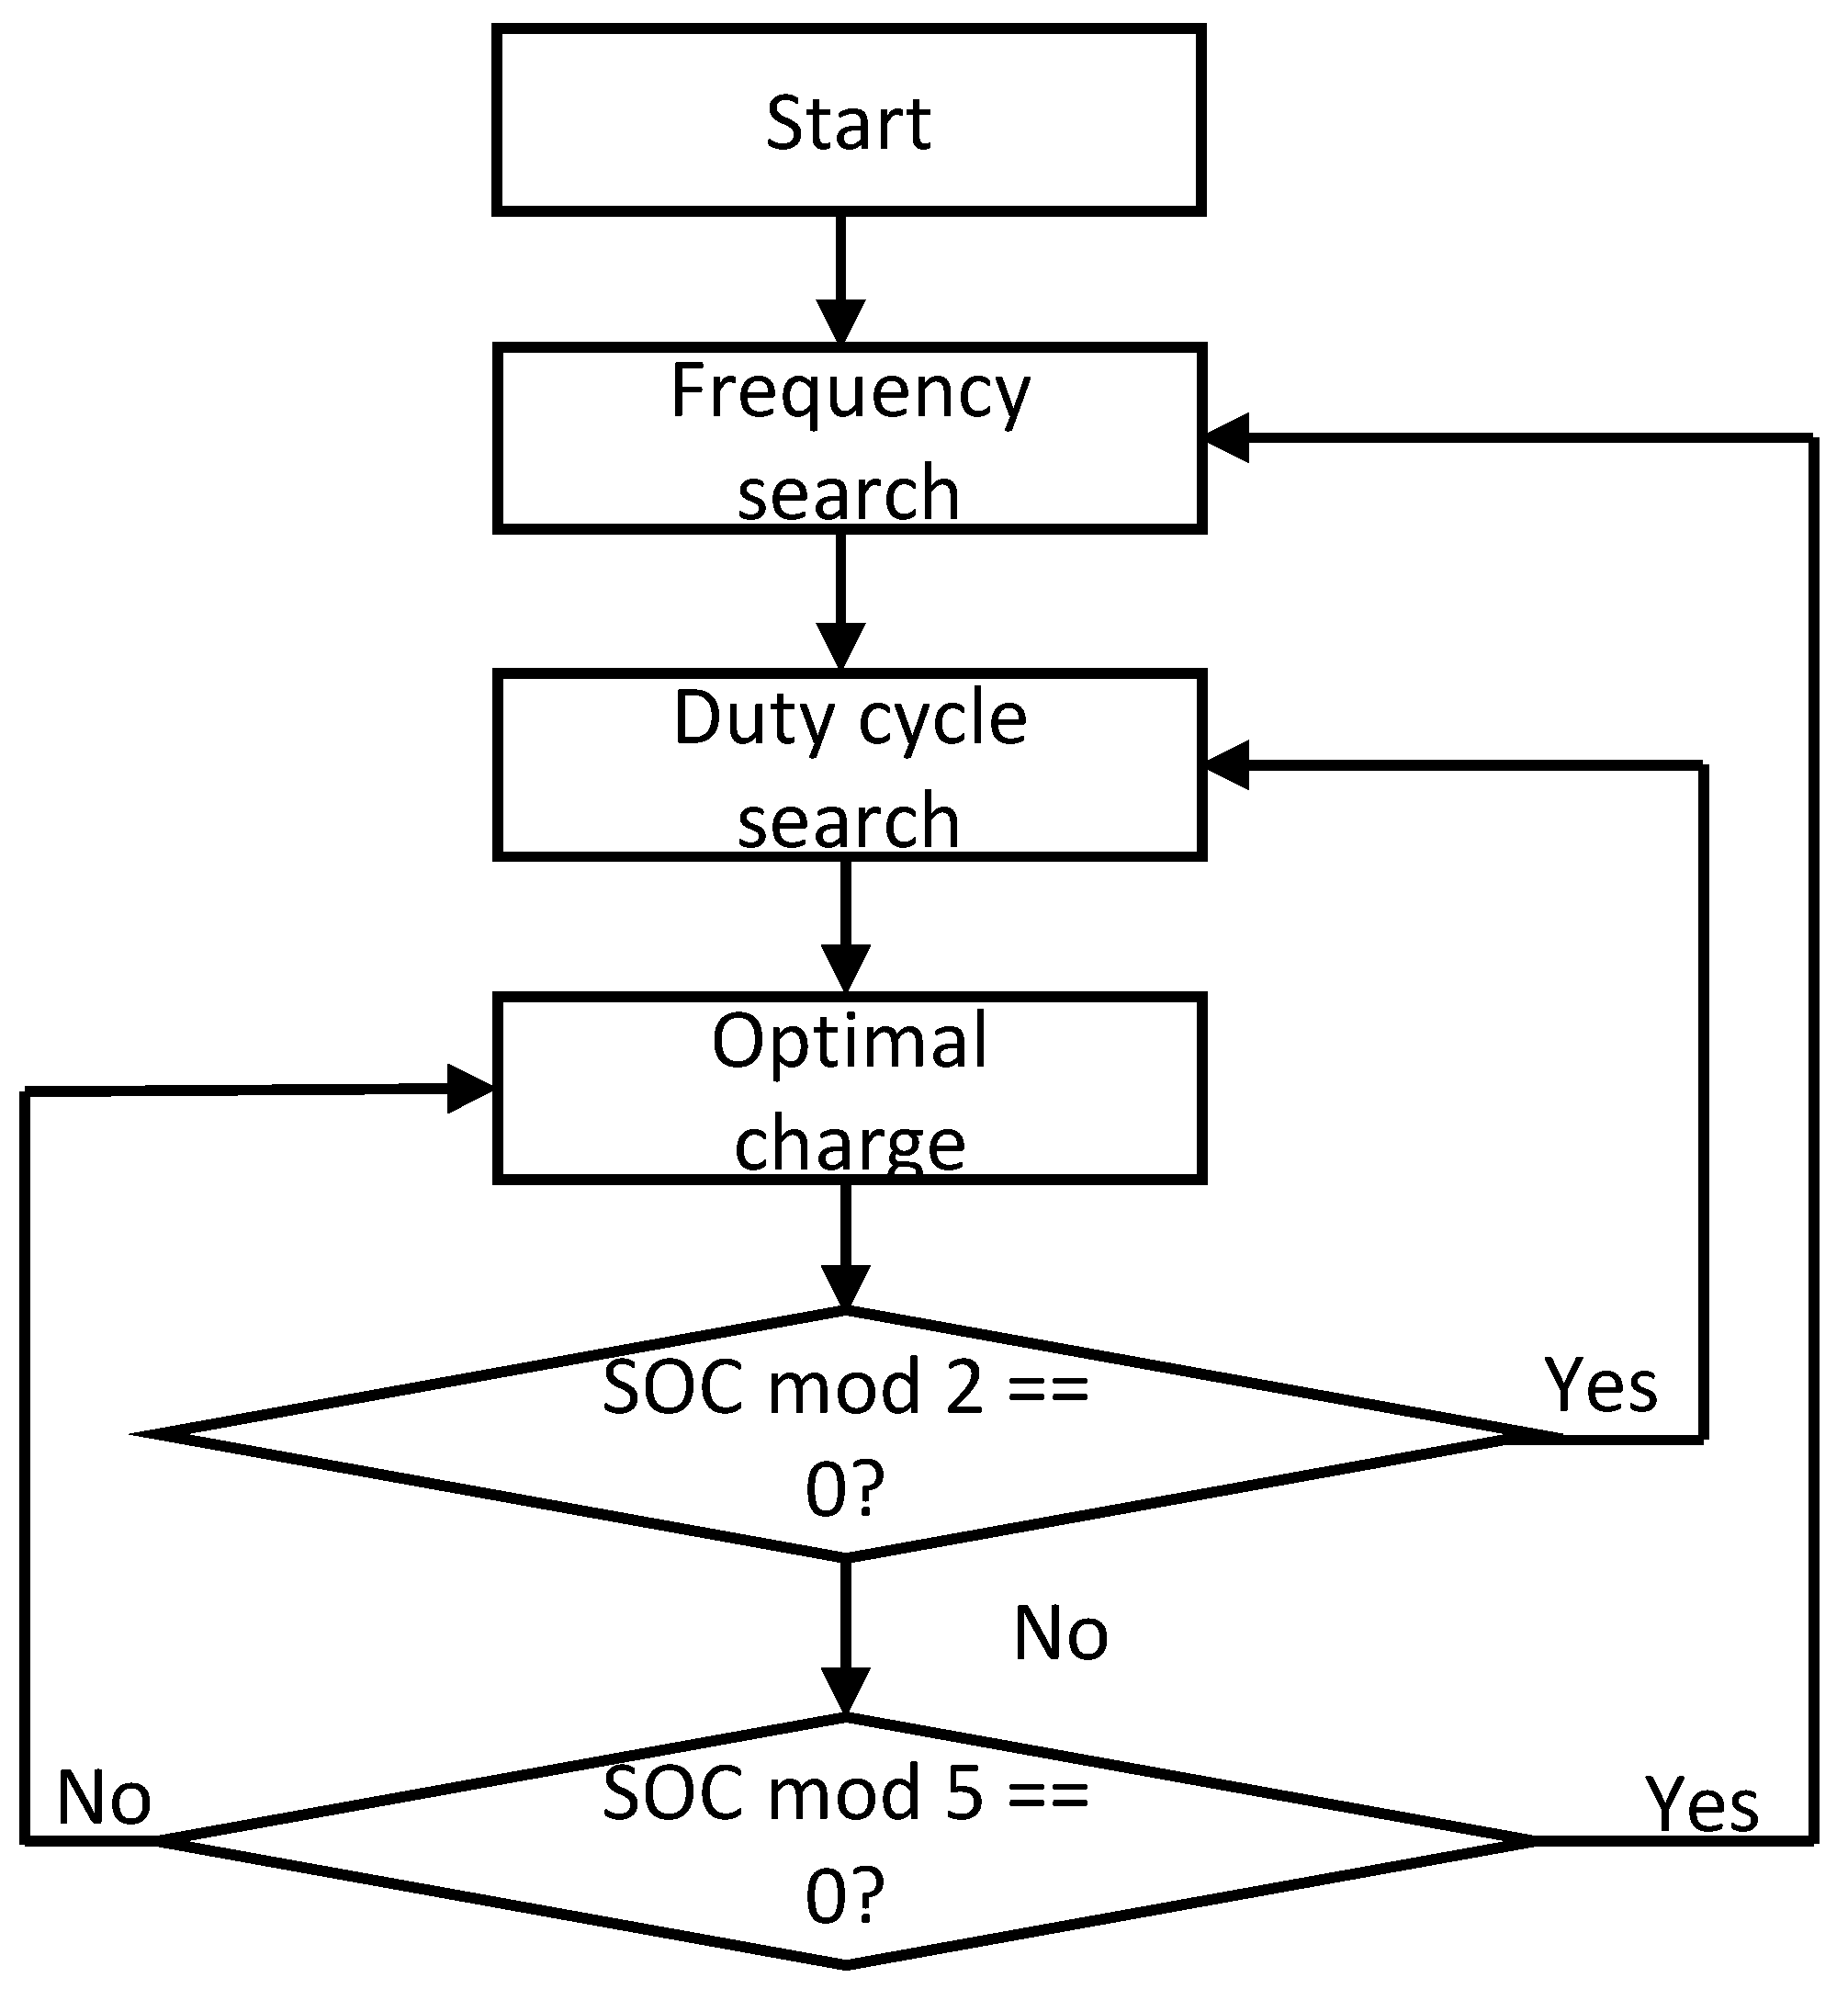
In the following C h a r g e state, the proposed system starts to charge the battery using the selected optimal pulse until the SOC is divisible by 2. These search and charge sequences, in runtime, will cycle until the completed state is achieved in terms of the battery capacity.

4.2. Charging Test for Lithium-Ion Battery

The LTC6802-2 battery monitoring IC can monitor the battery terminal voltage of not more than 12 cells connected in a series. The capacity of the INR18650-25R lithium ion battery, which is used in this work, is 2500 mAh . The maximum charge voltage and the minimum discharge voltage are 4.2 V and 2.5 V , respectively. The standard charge current and the fast charge current are 1250 mA and 4000 mA , as provided by the manufacturer.
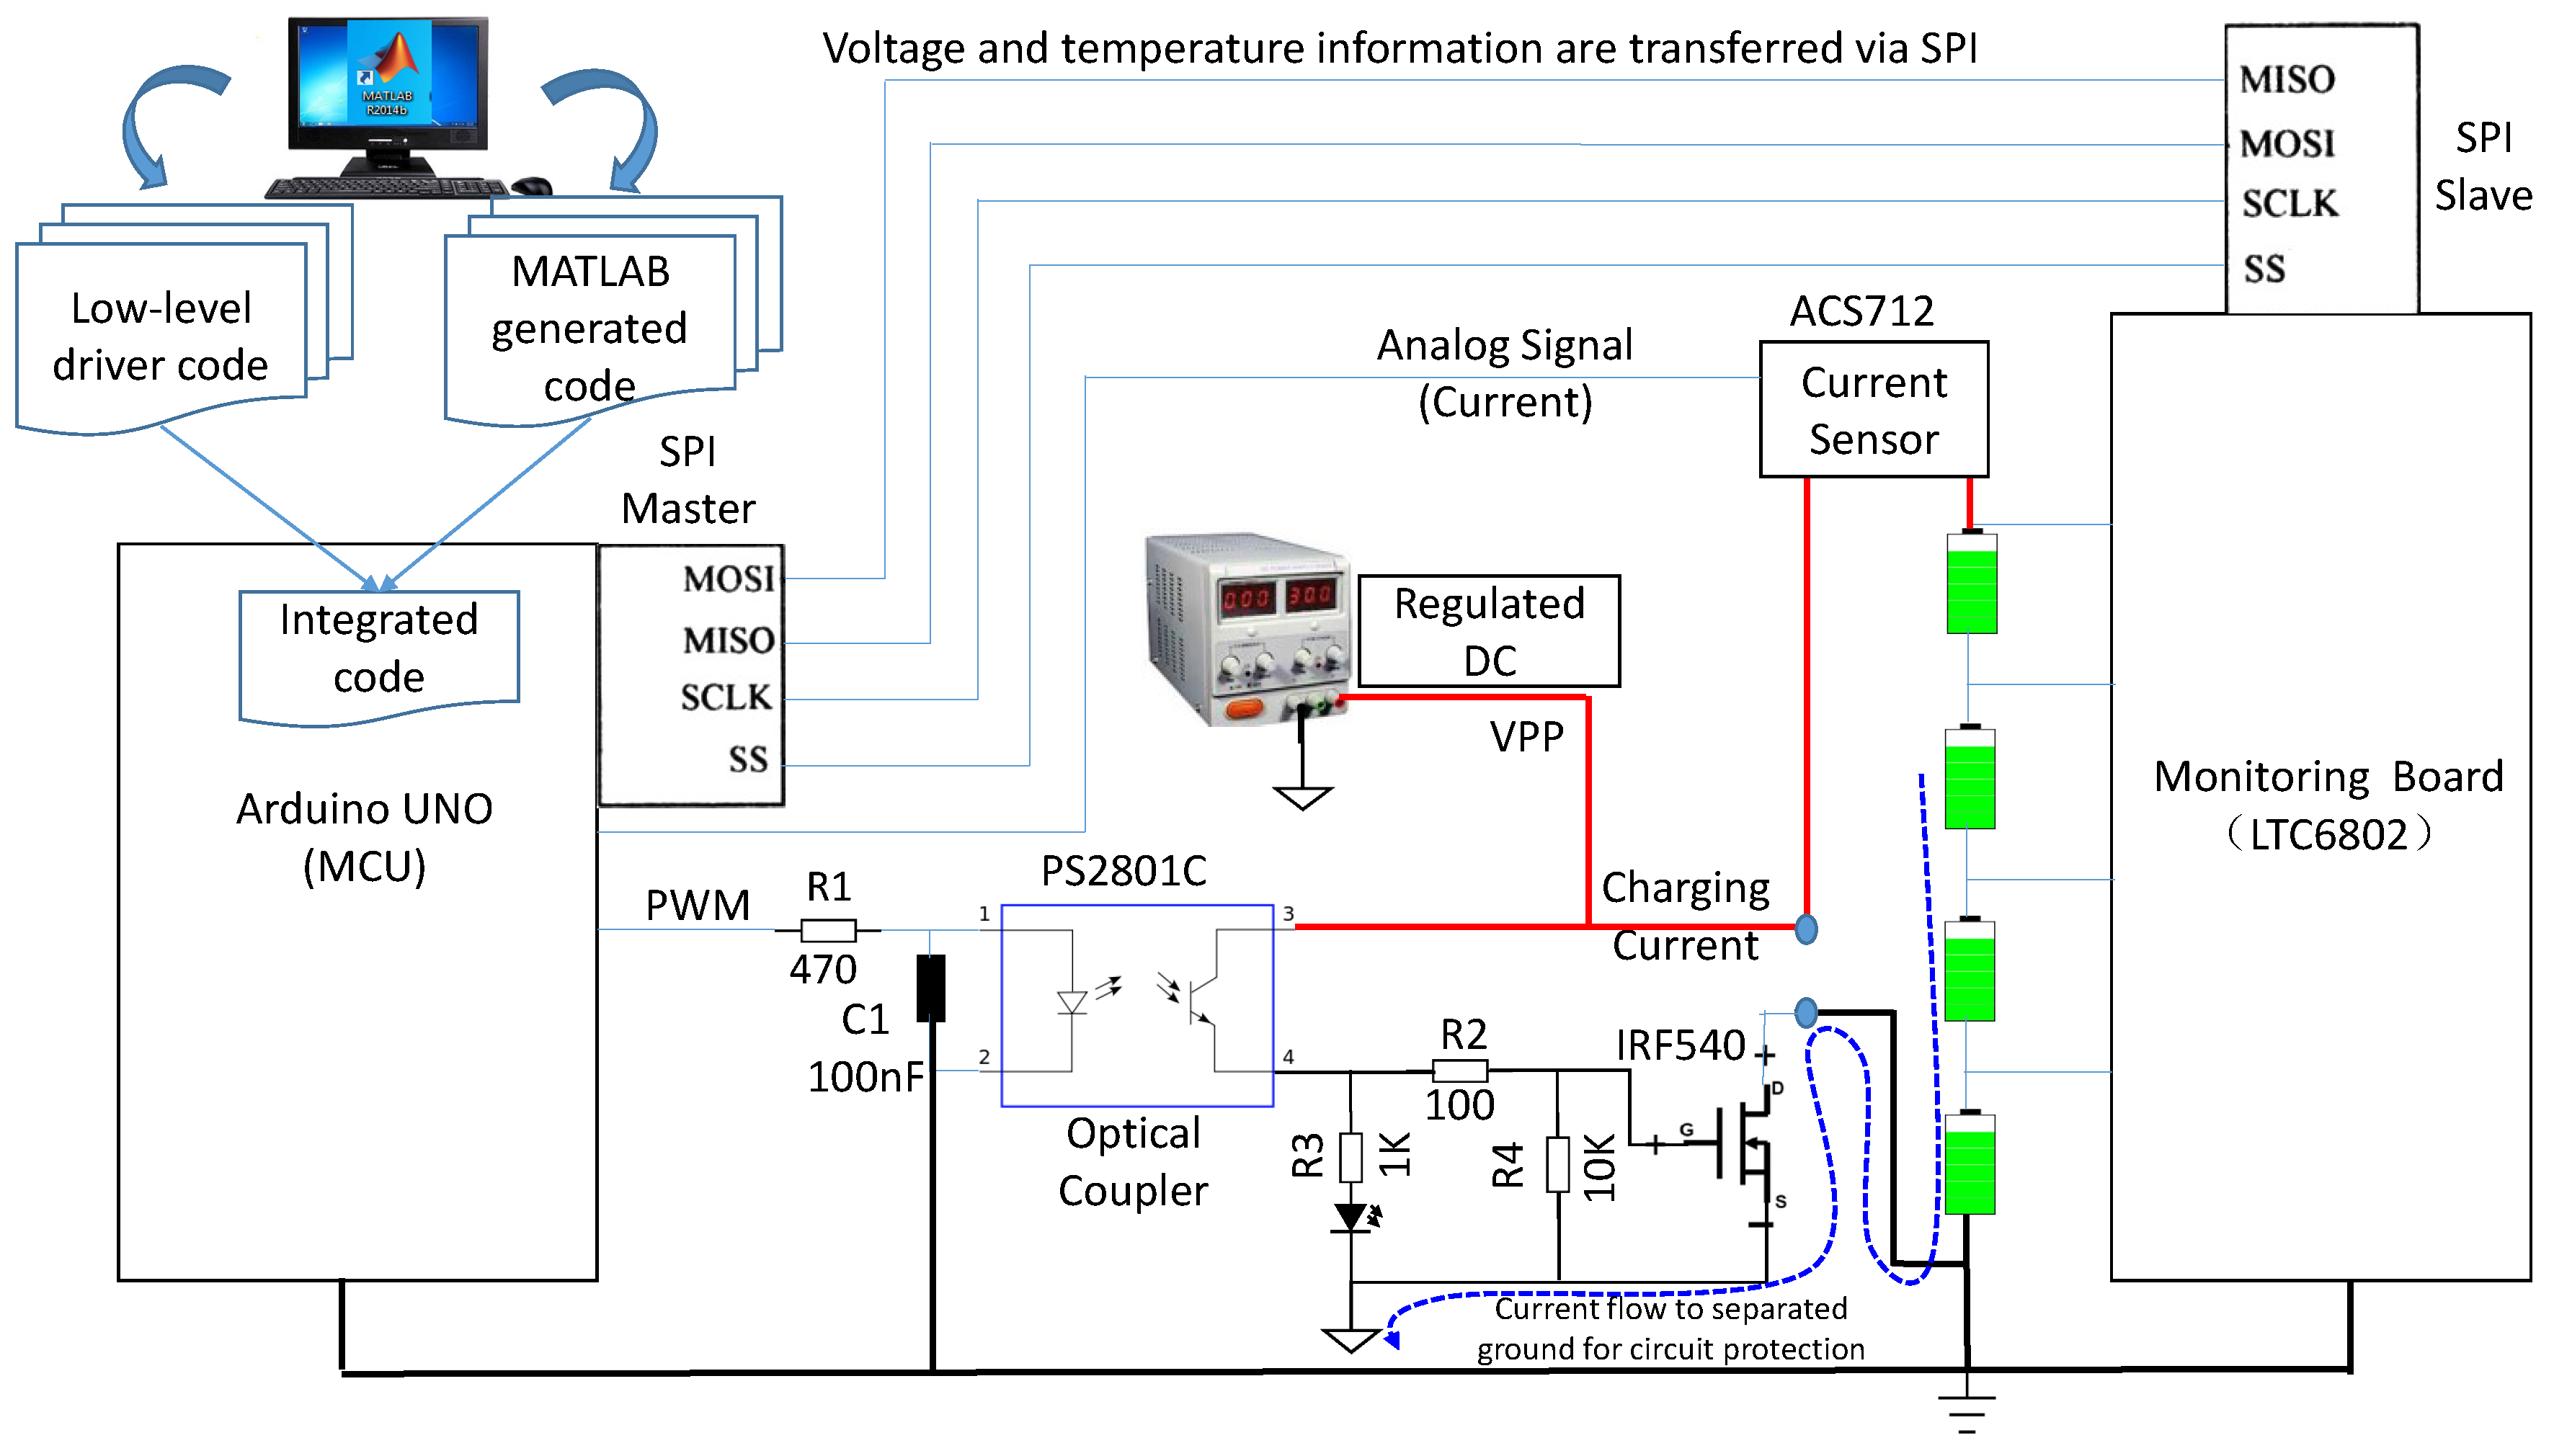
Considering the complexity and ease of development, this project adopted the Arduino UNO board as an MCU, as shown in Figure 16. The microcontroller can communicate with the LTC6802-2 monitoring chip via serial peripheral interface (SPI) interface. ACS712 is a hall effect-based linear current sensor with 1.2 mΩ internal resistance and bidirectional current measurement ability. In this paper, we used hall effect sensor to resolve the difficulties in implementing current-to-voltage conversion with small voltage drop. In addition, hall effect sensor separates the high current path with low-voltage operated MCU. When field effect transistor (FET) turns on, excessive load on the line and circuit accidentally happens due to high short current. The separated ground is used to redirect the high current from the battery, which is described as a blue-dotted line near the FET switch in Figure 16. It converts the sensing current into a 1.5 V to 3.5 V voltage as an output. The output voltage responds directly to the current magnitude. The charging current should be monitored throughout the charging process to calculate the battery’s SOC.
Using the state flow developed in the simulation process, we could obtain the corresponding C code, which is downloaded into MCU IC. All of the low-level drivers are developed using the Arduino IDE (integrated development environment), such as the current sensor acquisition, the temperature sensor acquisition, the SPI communication control, the pulse-width modulation (PWM) control, and the timer control code. We integrated the low-level driver code, the MATLAB-based generated firmware into a single MCU.
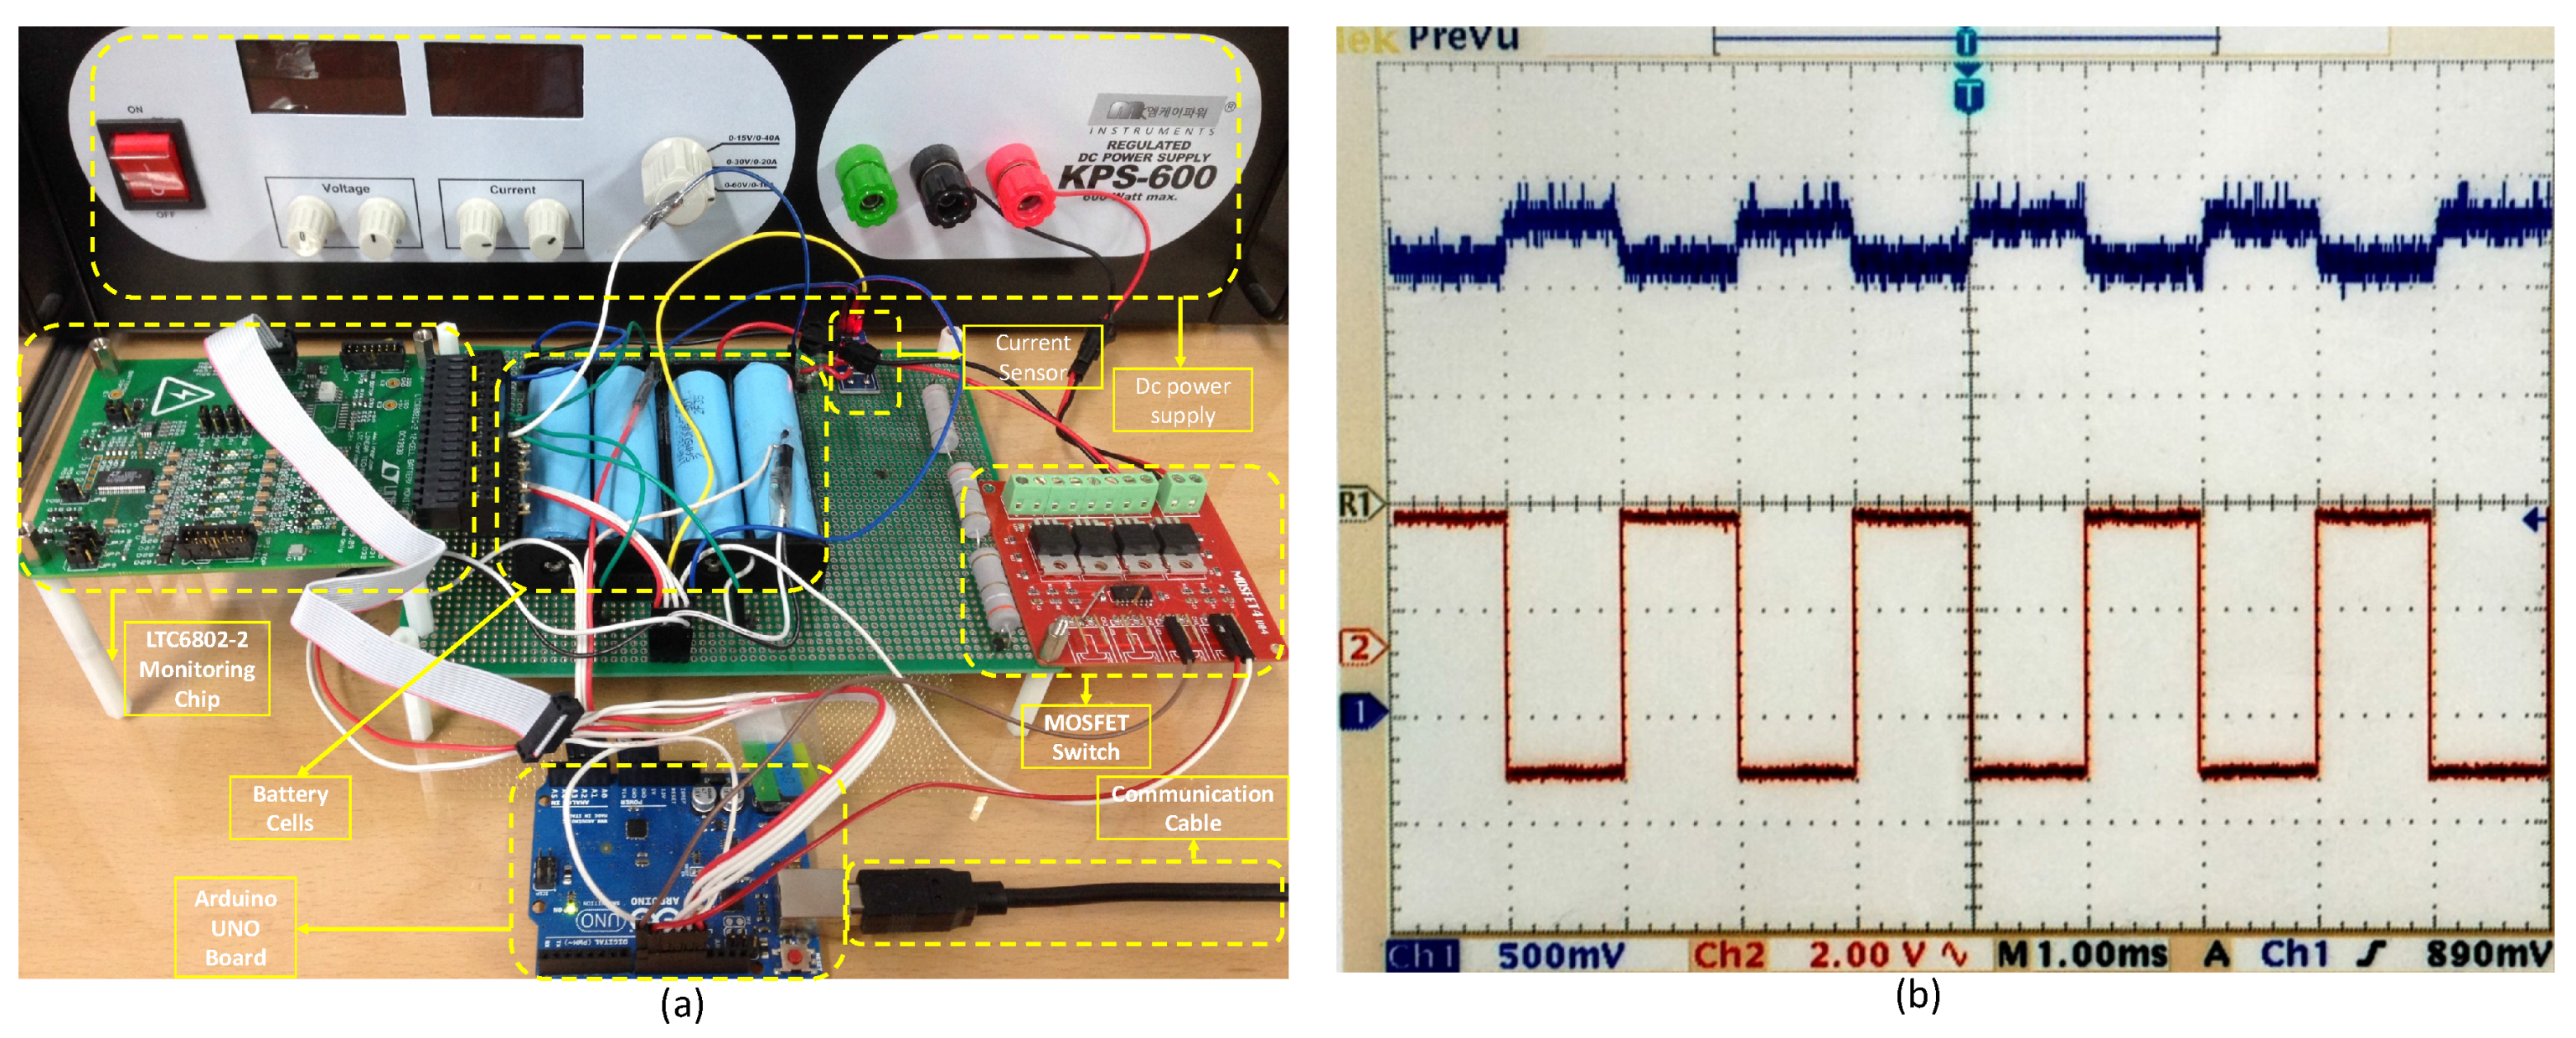
The pulse-width modulation, which is used for controlling the duty and frequency of the pulse charging method, is generated at a cycle-accurate level by MCU. The experiment environment setup is captured in Figure 17a. Through the communication channel, the MCU board can monitor the battery’s status from the host computer and collect the parameters, such as the charging current, the cell terminal voltage, the cell temperature, the pulse frequency, and the duty cycle, in order to perform the proposed pulse controlling algorithm.
As an example, the charge pulse of 500 Hz frequency and 50% duty cycle as an example is obtained from the output voltage signal of the current sensor (dark blue) and the corresponding PWM control signal, which is described in Figure 16, is measured as red-colored signal by oscilloscope as shown in Figure 17b. The input of the optocoupler is controlled by the PWM output, which is a digital pulse with the appropriate frequency (from 500 Hz to 5000 Hz) and duty width. One column means 1 ms , and the pulse period is 2 ms . There are two channels in this figure. One horizontal line of the first channel (blue line) means 500 mV , and the second channel (red line) means 2 V . The first channel, on behalf of the magnitude of the charging current, can be used to infer that the charging current is approximately 1.35 A (185 mV /A) because the current sensor output value is 2.5 V when the current is zero. The second channel on behalf of the PWM control signal has the same period and an amplitude of 5 V .
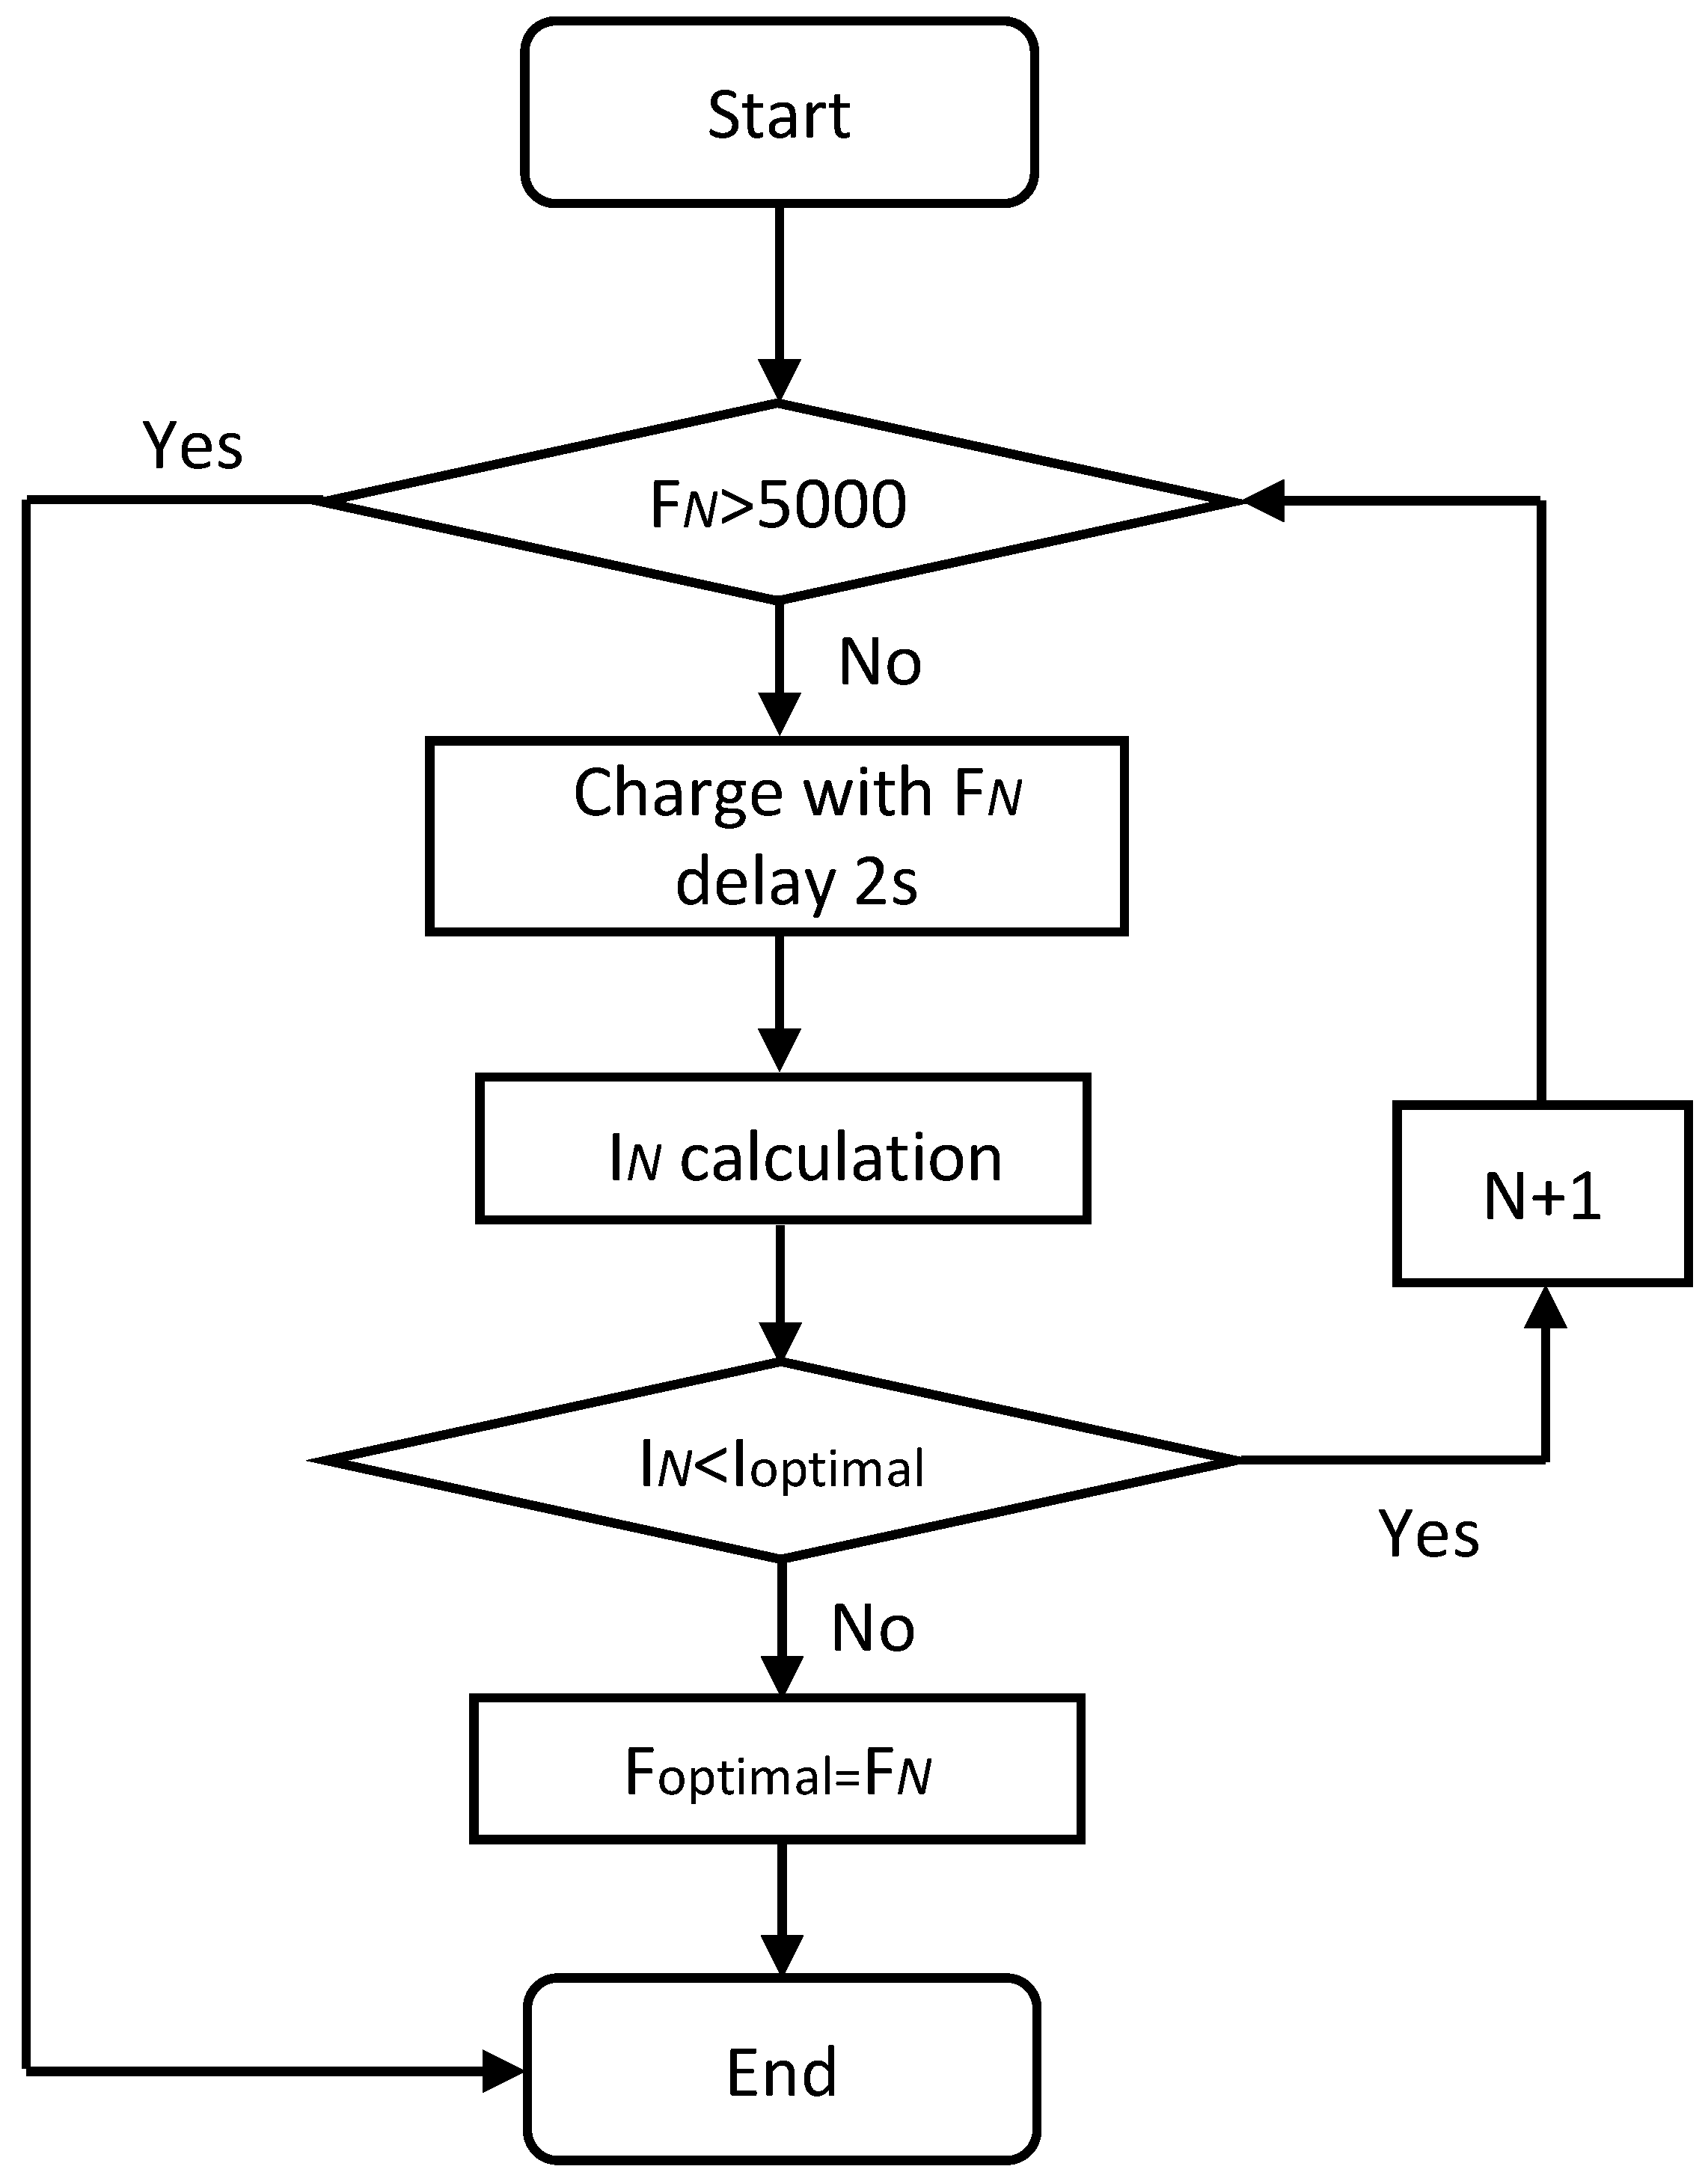
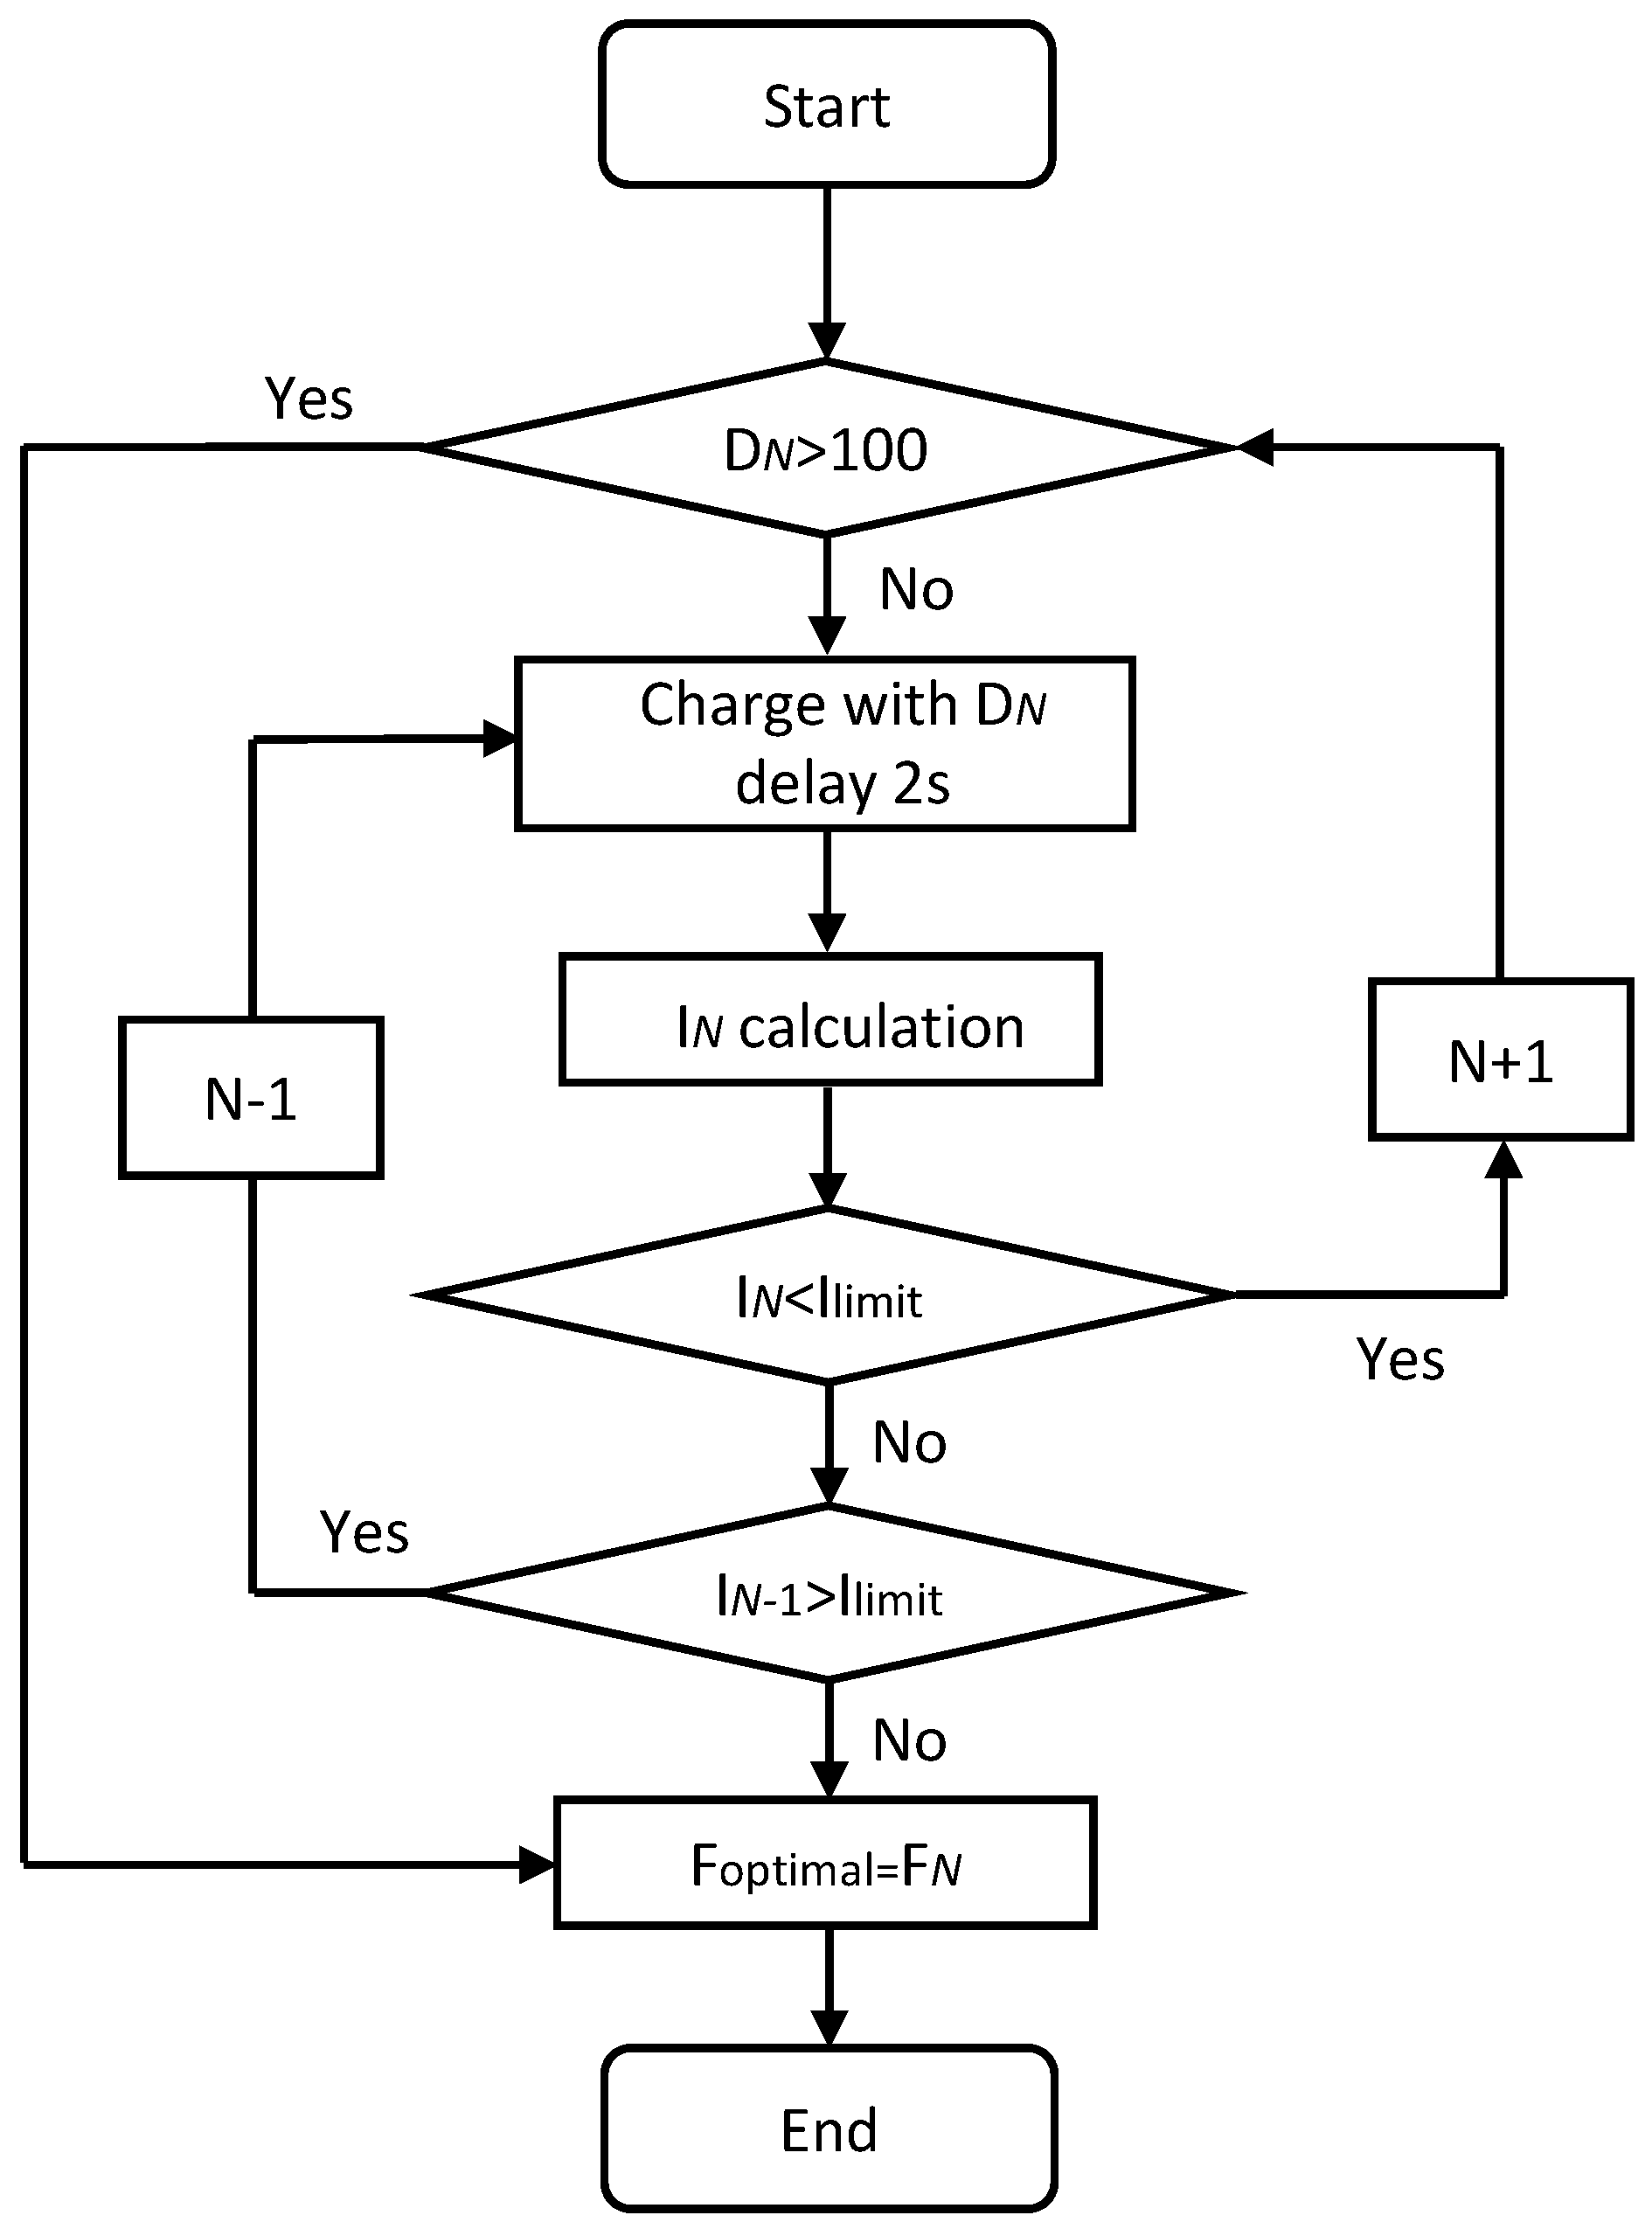
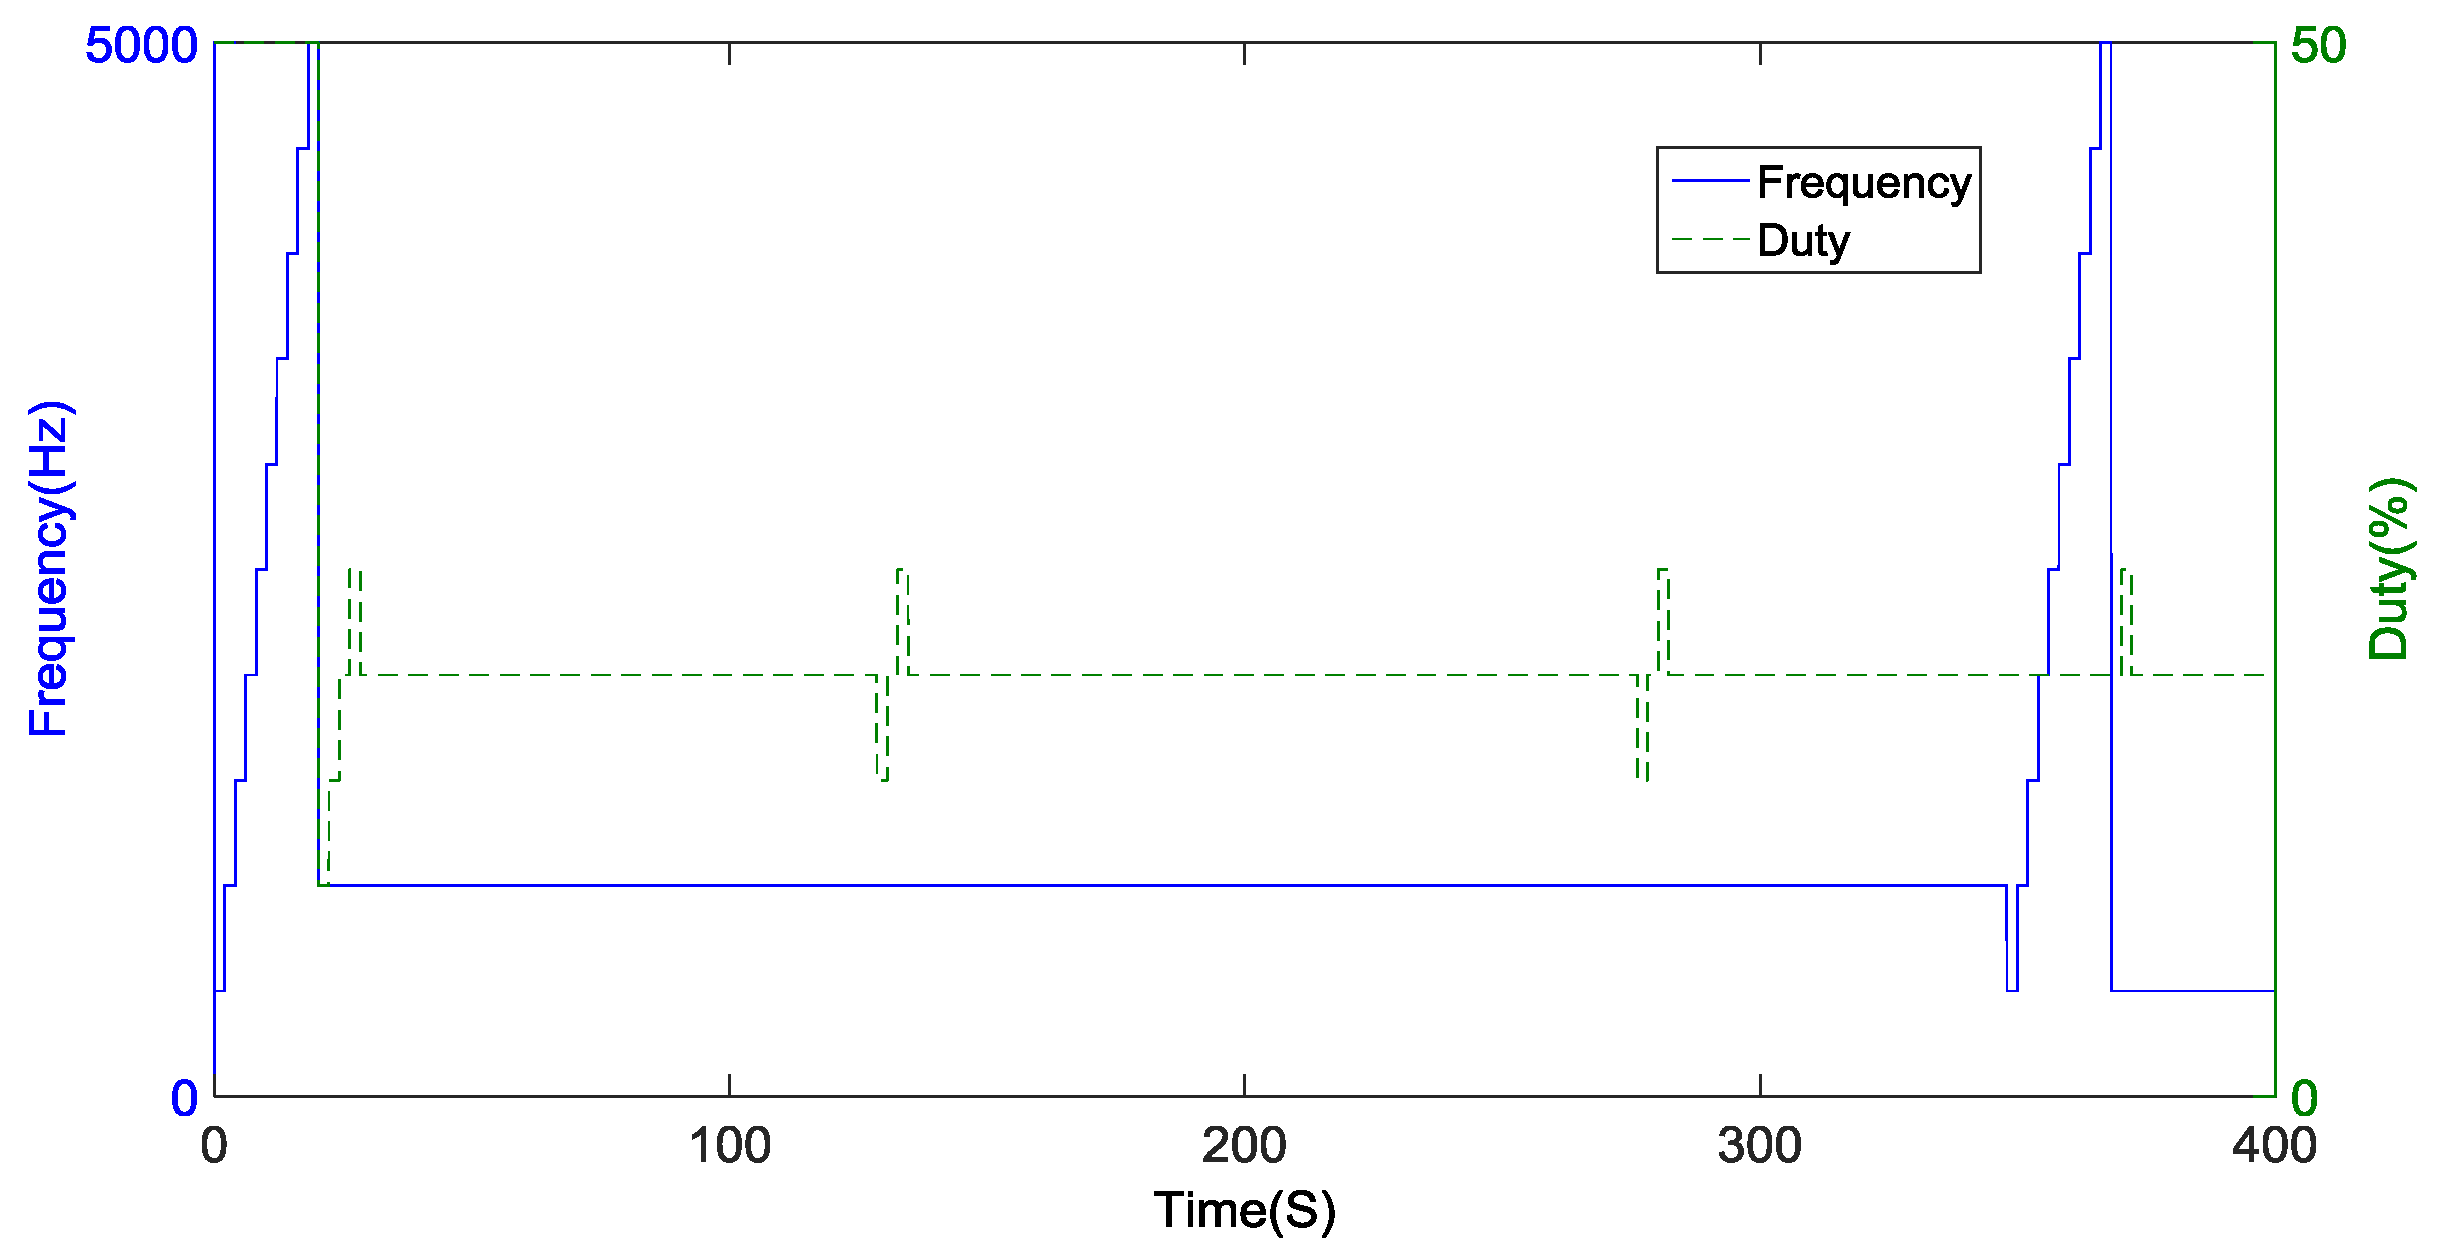
Figure 18 shows the measurement result of the proposed pulse-based charging operation using the frequency searching mode and duty searching mode, respectively, during one cycle. Using the MATLAB/Simulink, the PC-side model-driven supervisor could indirectly probe the electrical signal for the implemented hardware. The 1000 Hz frequency is obtained as the optimal charging frequency after changing the frequency from 500 Hz to 5000 Hz . Then, the following duty search mode tries to change the duty cycle from 10 to 25, from which the duty search algorithm determines that the optimal duty is 20%.
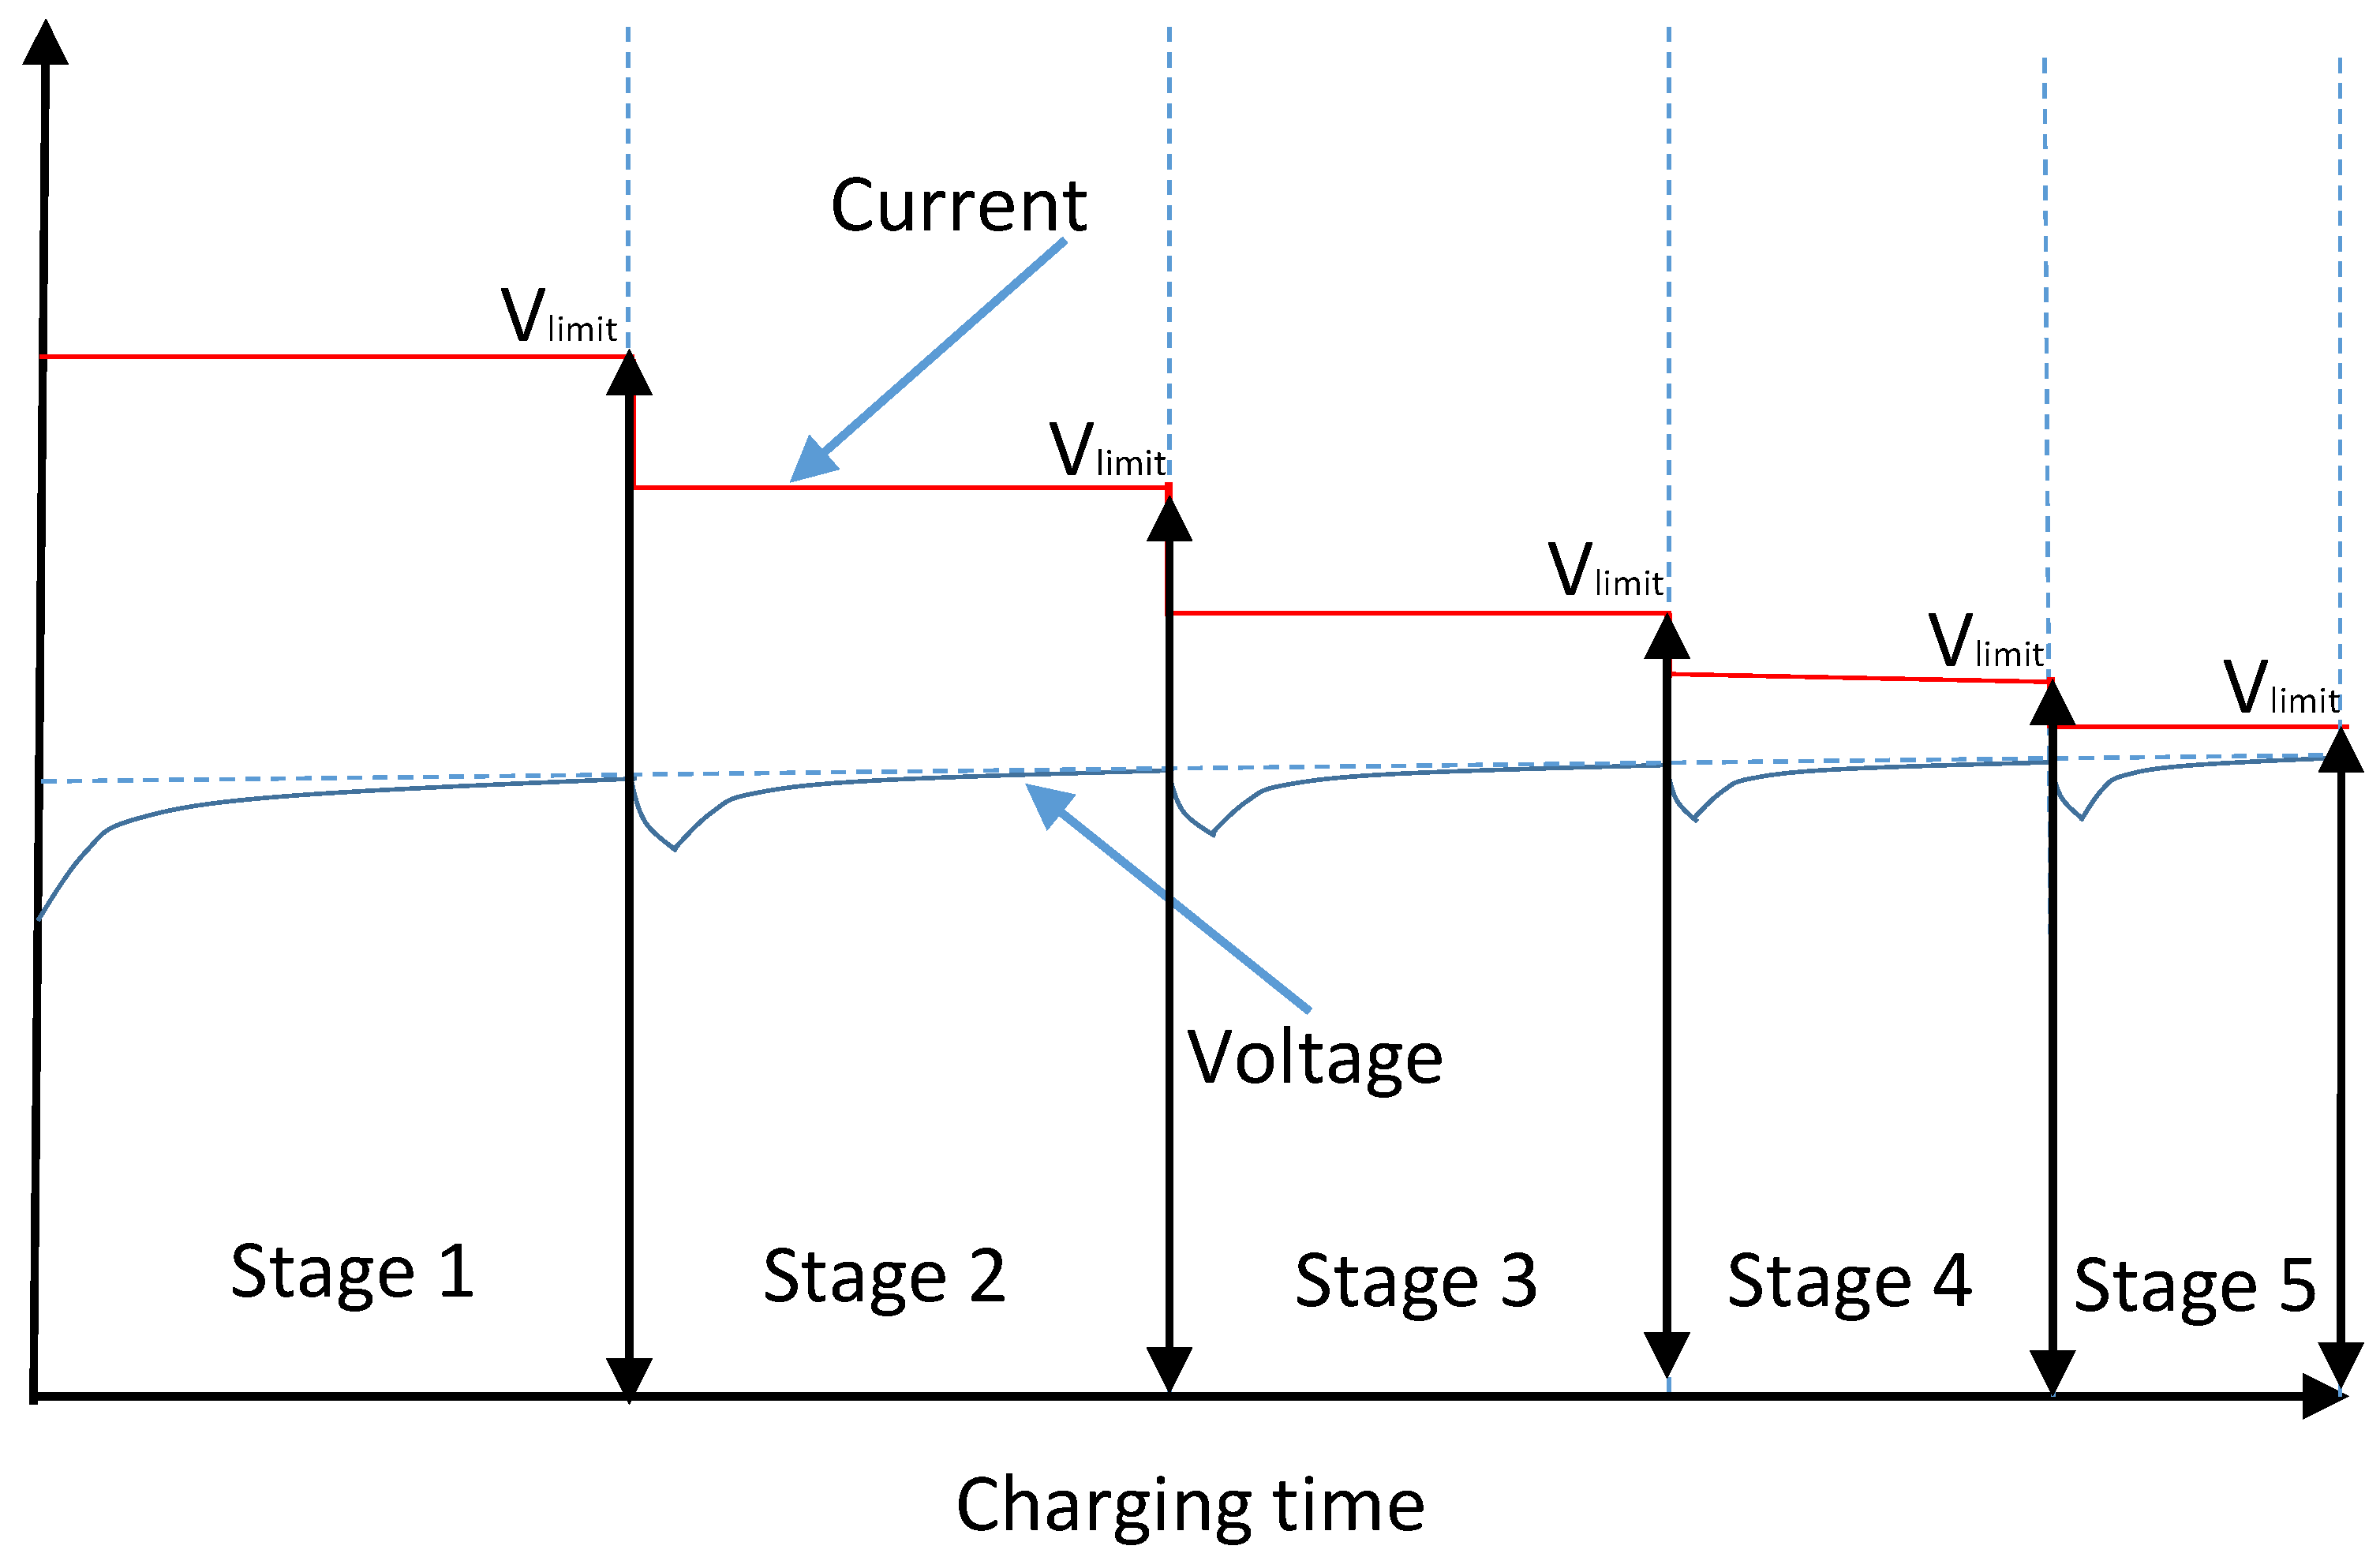
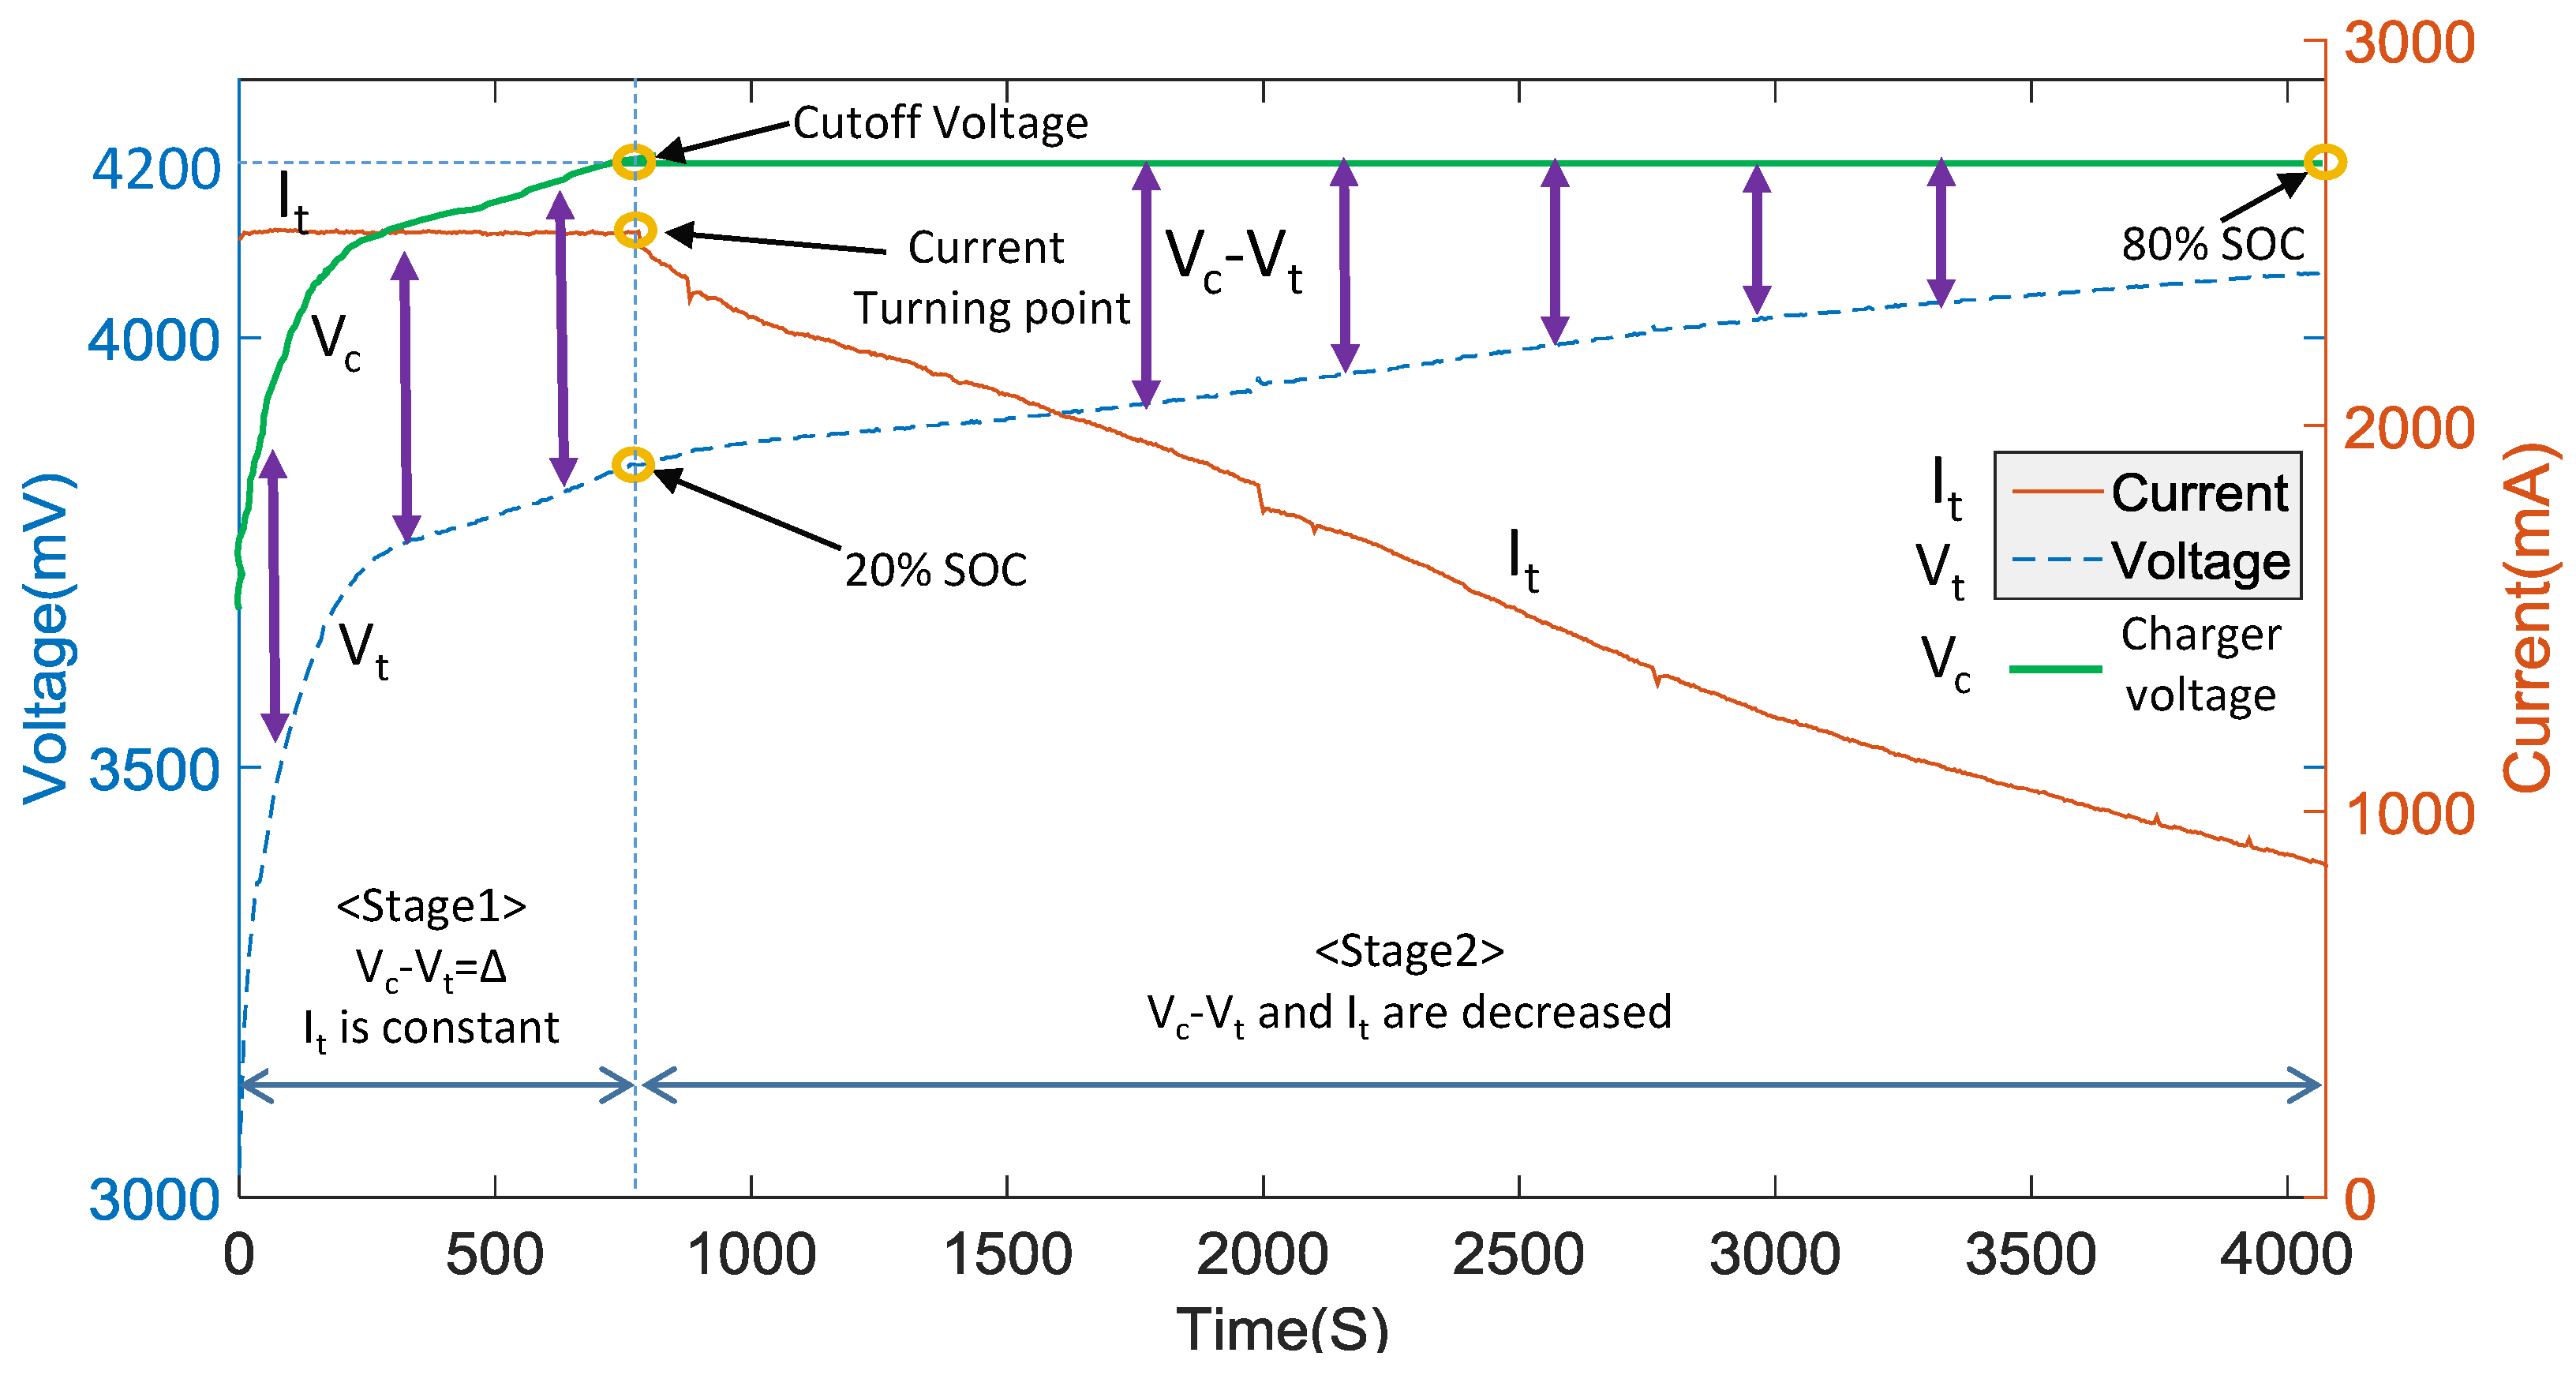
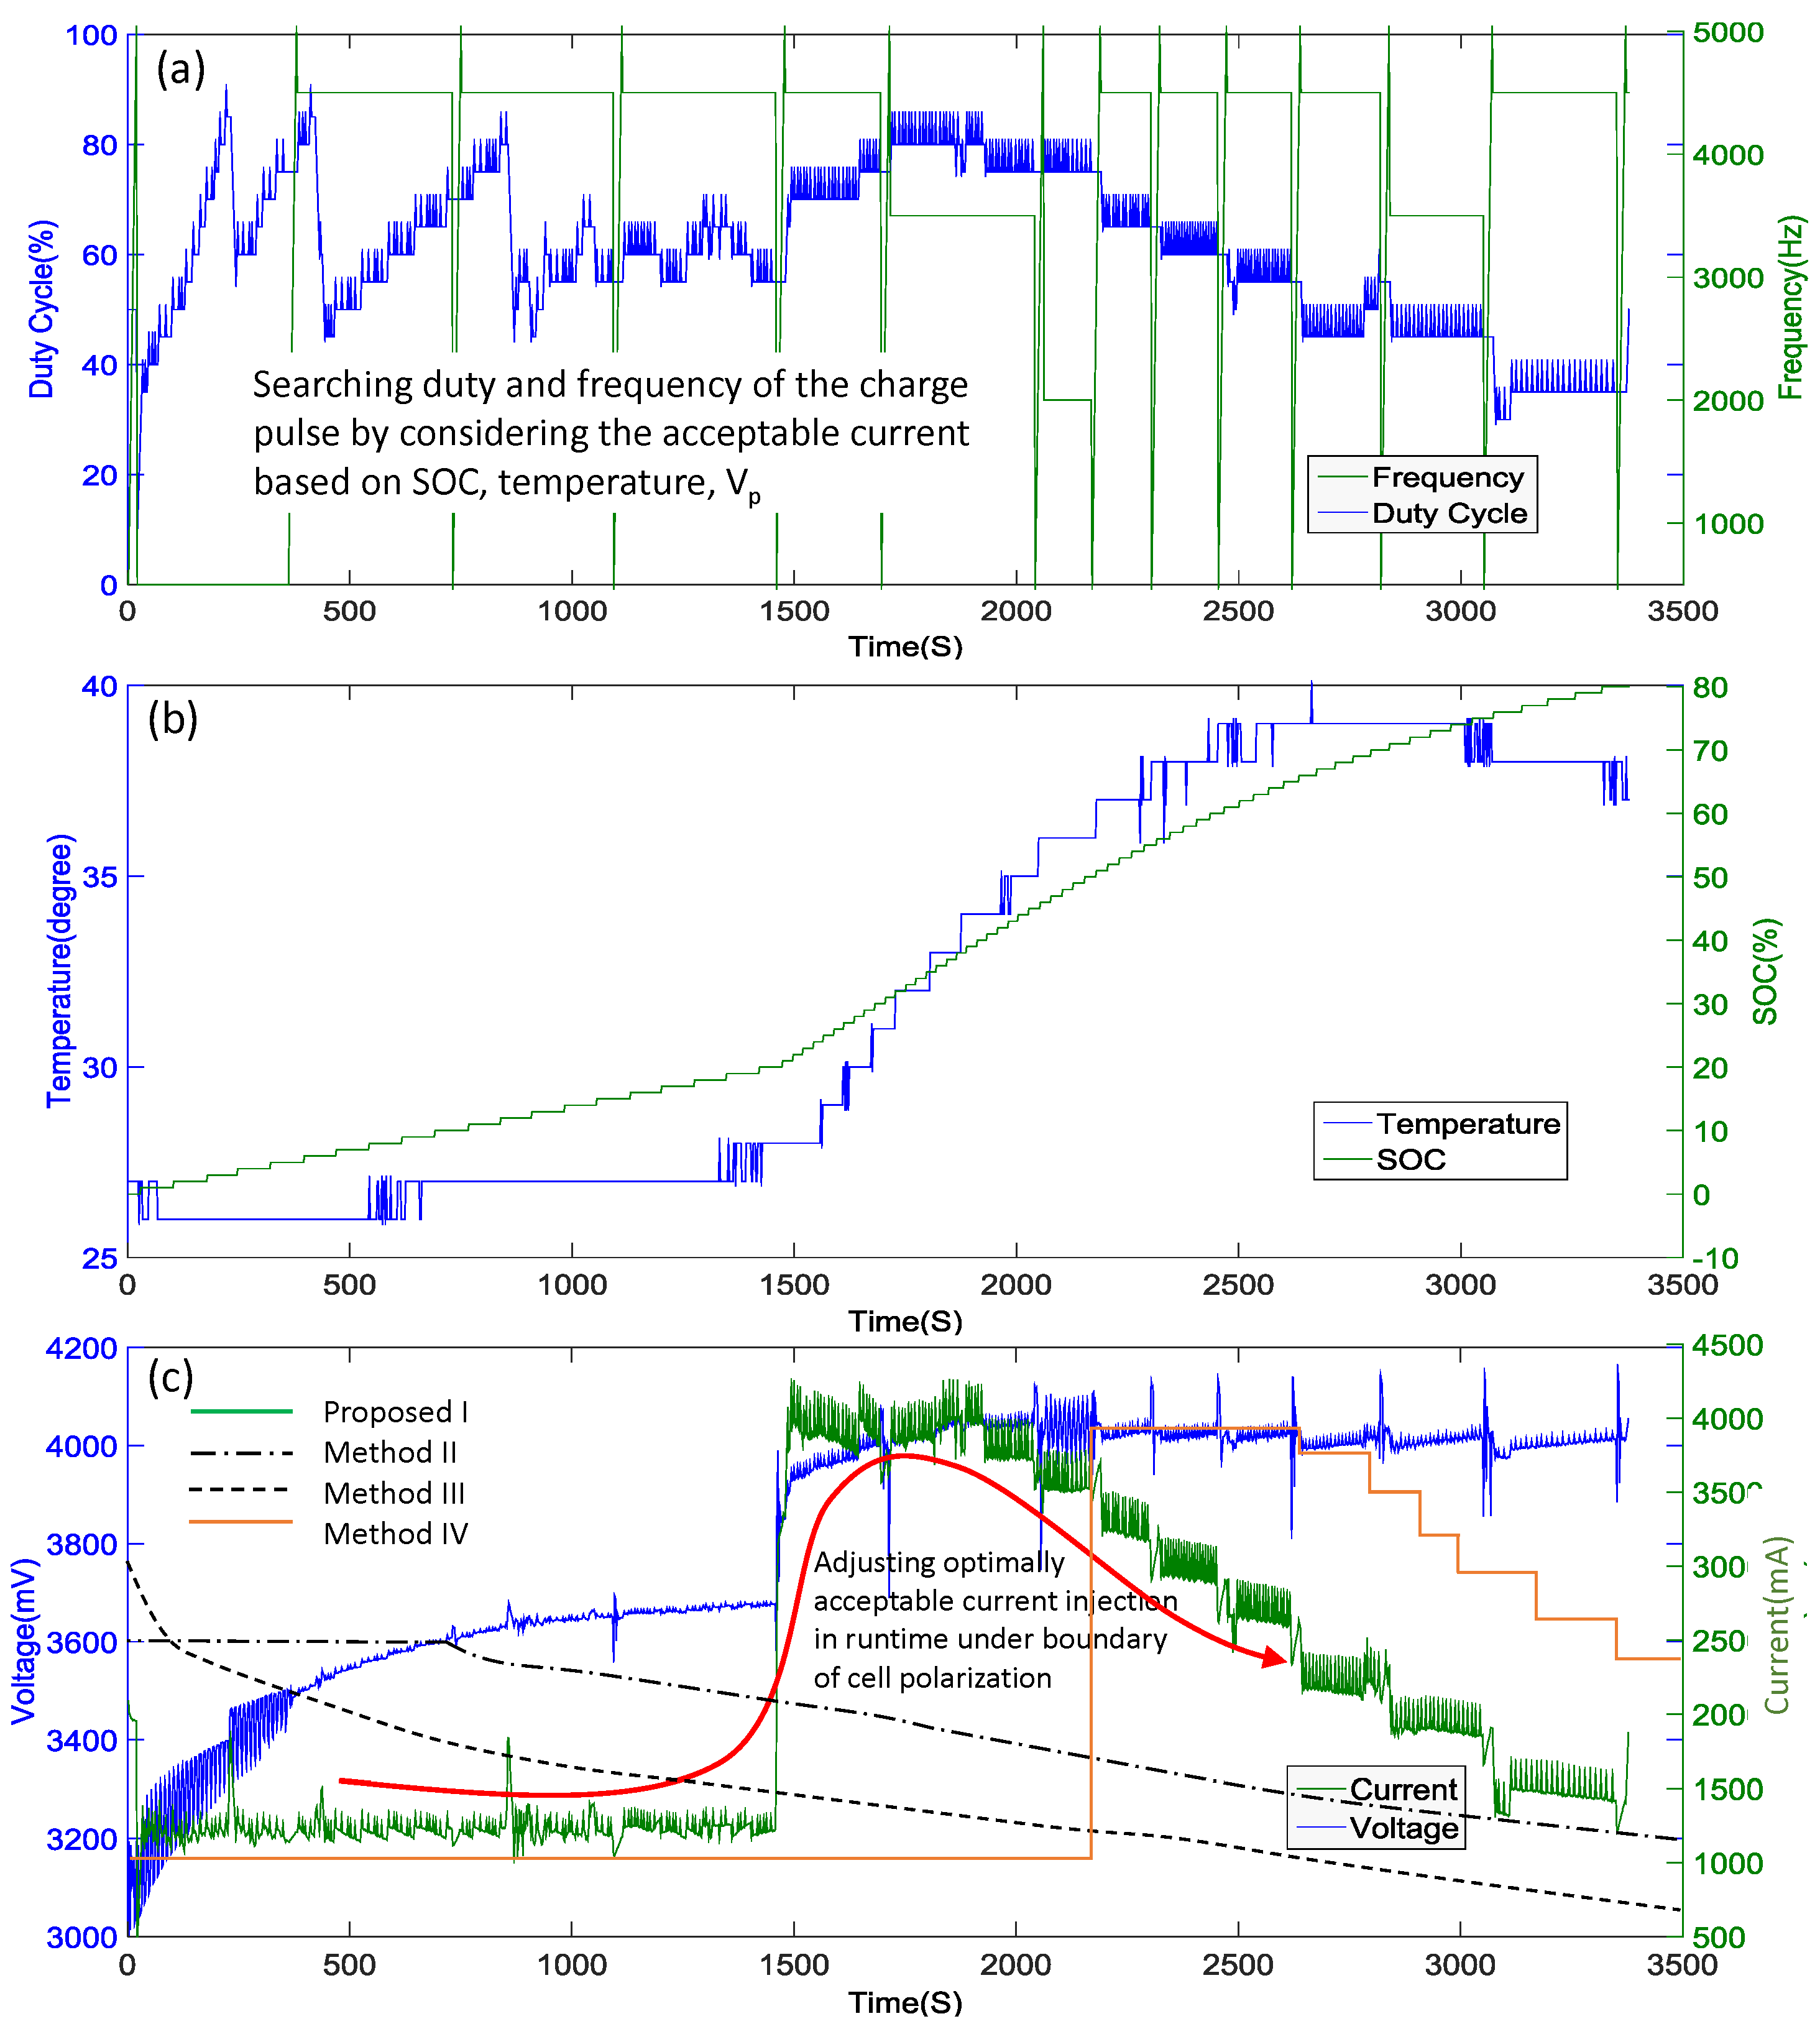
From 0% SOC to 20% SOC, the battery is charged at C/2 (standard charge current) as the polarization phenomenon is serious, as mentioned above. Then, the second stage tries to charge at 4 A (fast charge current) until the level reaches the polarization curve. The charger continues charging until SOC is 80%, as shown in Figure 19.
Optimal frequency is obtained at the beginning and regained with every 5% SOC increase in the charging process. The optimal duty cycle is continuously obtained with every 0.2% SOC increase. Figure 19 shows that the SOC and the temperature increase rapidly after 20% SOC and that the highest temperature rise is 12 C, from 26 C to 38 C. Charging time from 0% to 80% SOC is 3318 s and from 20% to 80% is 1896 s.
To maintain the duty cycle in a suitable range, the initial charging voltage is set to 13.6 V and adjusted four times when the SOC is 3%, 6%, 12%, and 20%, respectively, with a corresponding voltage of 14 V , 15 V , 15.4 V , and 16.8 V . It is a remarkable fact that the value of the duty cycle is in a periodic oscillation state using the proposed searching algorithm. At the same time, both the terminal voltage and the current also have some shocks. In the optimal frequency searching mode, the abrupt change in current and voltage can be observed in Figure 19. The experimental results show that the optimal pulse plays a critical role in the charging process.
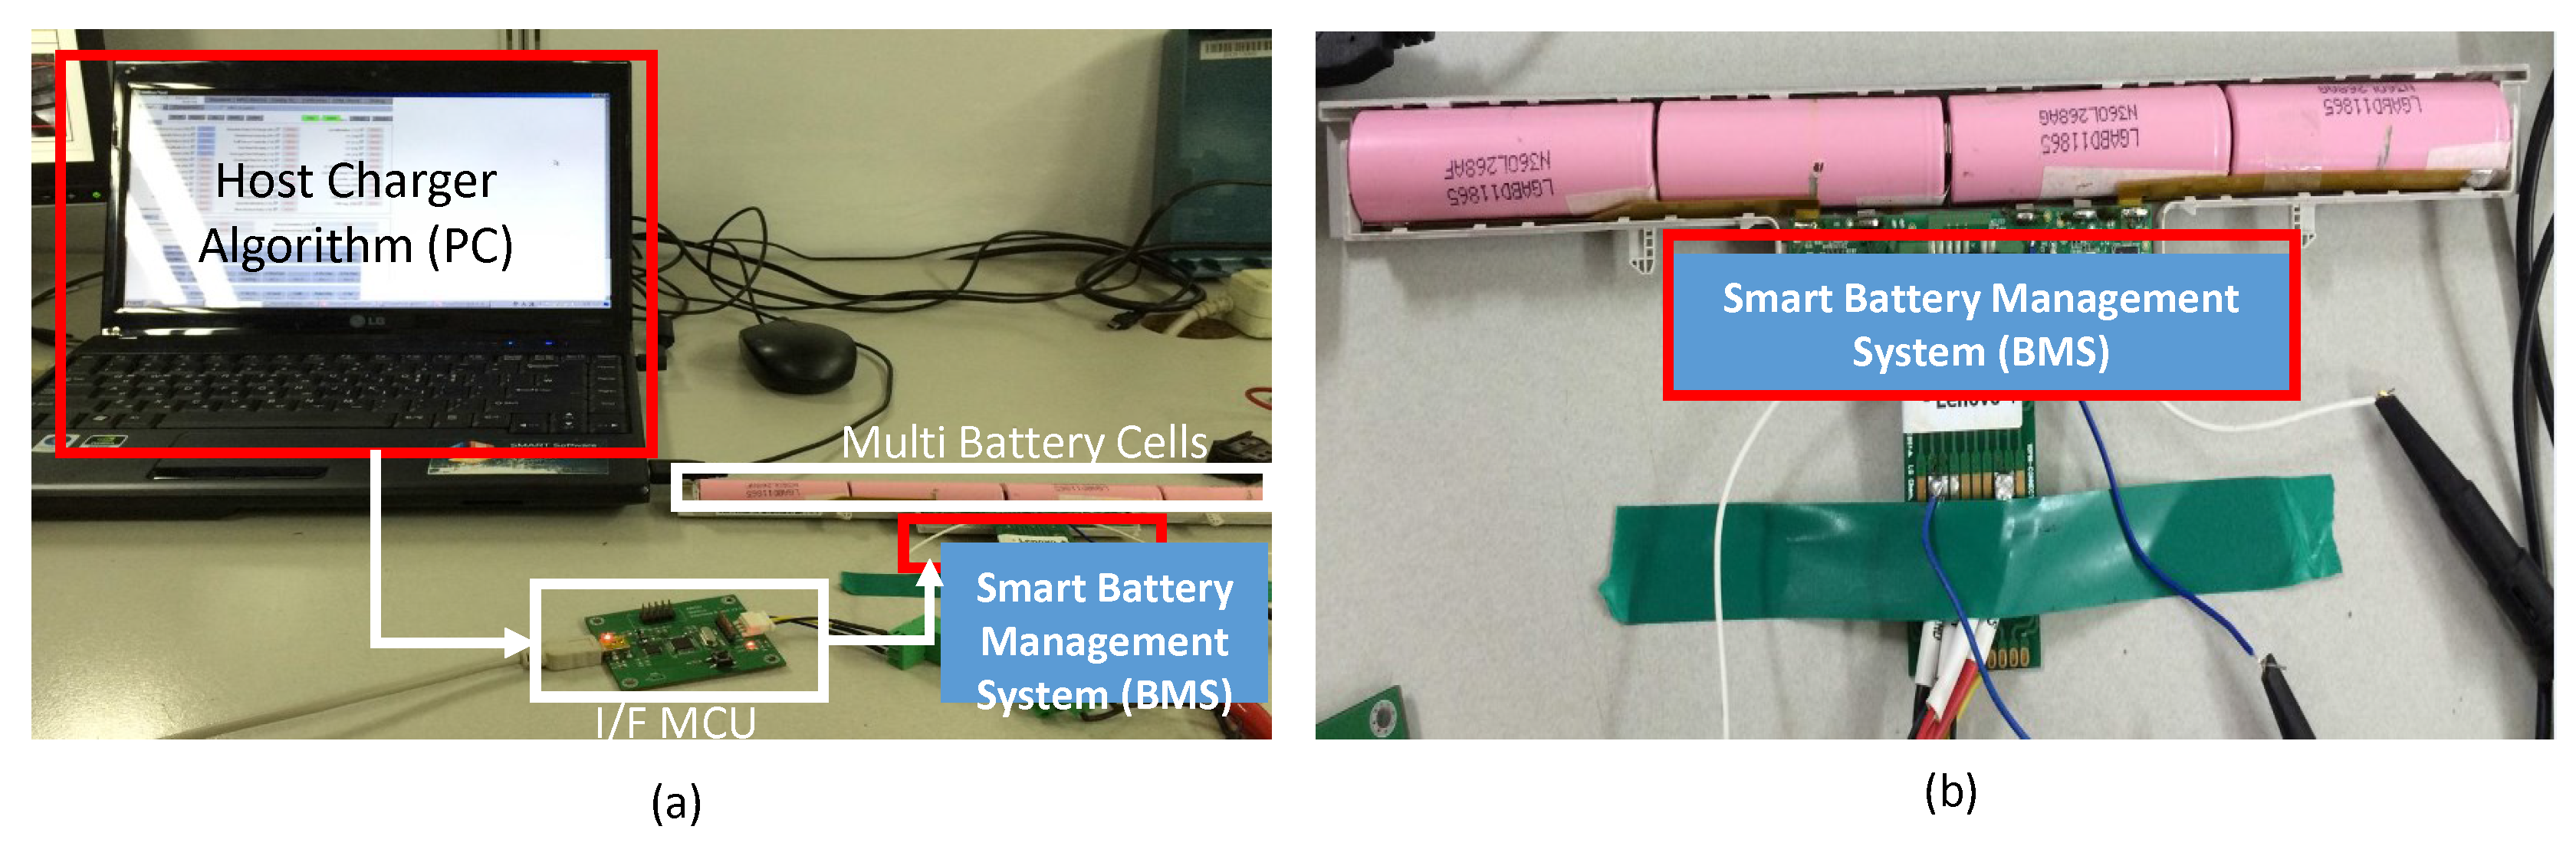
Figure 20a shows our system-on-chip implementation and evaluation environment, including the host-side controller and the slave-side BMS. The host-side controller executes the charge/discharge algorithm to control the slave-side BMS via the communication channel. The slave-side controller is implemented with an MCU-based algorithm executable chip to control the FET transistor, which is used to manage the current flow into the battery cells.
As shown in Figure 20b, the BMS IC is attached to the board to measure the temperature, the current flow, and the voltage level of the target battery cells. The proposed fast-charge algorithm is simultaneously executed in the target BMS chip and host-side software to provide optimized performance by integrating the on-cell extracted battery characteristics.

4.3. Comparison of the Proposed Method and the Existing Method

In this section, a comparison experiment is conducted for the CC-CV, the fixed pulse (frequency of 500 Hz , duty cycle of 50%), the polarization curve, and the proposed method. The CC-CV method adopts 2 C constant current charging lasting for 805 s, with a total charging time of 4075 s. This illustrates that increasing the current in the CC stage does not speed up the charging process. The fixed pulse method adopts 500 Hz , and a 50% duty fixed pulse, which has the longest charging time because the charging current is too high in the initial phase. As for the polarization curve method, it tries to charge the battery at C/2, which is the same as the proposed method, and then fails to charge the battery at 4 A . Therefore, the selected C/3 charging current, with a total charging time of 4079 s, is shown in Table 2.
The experiment results show that the proposed charge method achieves the fast charging speed within operating temperature. This is especially suitable for the charge for EV or PHEV from 20% SOC to 80% SOC.
We assumed the cell equalization is performed after the pulse-based charging is triggered during the singles charging period so that all battery cells have the same terminal voltage and SOC. From the evaluation using the proposed charger for four battery cells, further works are needed so that the fast charging is feasible for more large-scale batteries. The scalability issue using the proposed charging approach will be resolved after accurate cell equalization is performed by communicating and sharing the cell characteristics between the group of cells.
The implemented charger circuit is composed of the discrete components, including commercial chips. Our initial approach focuses on evaluating the charging speed acceleration using the proposed method in terms of feasibility. Further works have to be performed to optimize the charger circuit topology. For example, the hall effect sensor has to be replaced with the small resistor and dedicated analog voltage-to-digital converter, and opto-coupler can be replaced with the switch IC on high voltage protected circuit. The circuit using two grounds also has to be improved, still protecting the circuit due to the over current.

5. Conclusions

In this study, the proposed system is based on two modes of searching: the optimal frequency searching mode and the optimal duty cycle searching mode. By dynamic frequency control, the impedance can be minimized while achieving the highest charging current. The duty cycle is well controlled to keep the concentration of polarization at a relatively low level. This makes the charging current comply with the polarization curve in order to inject optimal charging currents into the battery cells, thereby ensuring the maximum charge speed without damaging the battery. The experimental results show that the proposed method can finish up to about 80% of its maximum capacity in approximately 56 min with battery temperature increase of approximately 13 C.
Compared with traditional methods, the proposed method adopts relatively complex algorithm and pulse control circuit. This can cause difficulties in terms of implementing. In particular, quickly switching between the charging period and the relaxation period can cause a great change in the charging current. Therefore, the impact of the charger on the power grid can not be ignored.
The implemented battery charger and BMS were evaluated for four cells of an INR18650-25R battery. The charging performance test for other types of lithium batteries will be performed in the future work. Furthermore, the impacts of the proposed charging algorithm in terms of reliability of the battery should be evaluated by measuring the remaining capacity of the battery after 1000 times cycle test.

Acknowledgments

This research was supported by the Basic Science Research Program through the National Research Foundation of Korea (NRF) funded by the Ministry of Education (2014R1A6A3A04059410).

Author Contributions

Daejin Park designed the entire core architecture and wrote the paper including the corresponding to the editor; Meng Di Yin performed the hardware/software implementation and experiments; Jeonghun Cho reviewed the feasibility of the proposed work.

Conflicts of Interest

The authors declare no conflict of interest. The founding sponsors had no role in the design of the study; in the collection, analyses, or interpretation of data; in the writing of the manuscript, and in the decision to publish the results.

References

  1. Situ, L. Electric Vehicle development: The past, present, future. In Proceedings of the 3rd International Conference on Power Electronics Systems and Applications, Hong Kong, 20–22 May 2009; pp. 1–3.
  2. Li, J. Design of a Li-Ion battery charger with CC-CV-CT regualtion loop. In Proceedings of the 2011 International Conference on Electric Information and Control Engineering, Wuhan, China, 15–17 April 2011; pp. 4088–4091.
  3. Electric Vehicle Charging Infrastructure. Available online: http://www.mpoweruk.com/infrastructure.htm (accessed on 10 October 2015).
  4. Yin, M.D.; Youn, J.; Park, D.; Cho, J. Efficient Frequency and Duty Cycle Control Method for Fast Pulse-Charging of Distributed Battery Packs by Sharing Cell Status. In Proceedings of the International Workshop on Ubiquitous Wireless Sensor, Beijing, China, 10–14 August 2015; pp. 40–45.
  5. Shen, W.; Vo, T.T.; Kapoor, A. Charging algorithms of lithium-ion batteries: An overview. In Proceedings of the 2012 7th IEEE Conference on Industrial Electronics and Applications, Singapore, 18–20 July 2012; pp. 1567–1572.
  6. Burke, A.; Miller, M. Fast Charging Tests (up to 6C) of Lithium Titanate Cells and Modules: Electrical and Thermal Response; Institute of Transportation Studies: Davis, CA, USA, 2012; pp. 1–11. [Google Scholar]
  7. Luo, Y.F.; Liu, Y.H.; Wang, S.C. Search for an optimal multistage charging pattern for lithium-ion batteries using the Taguchi approach. In Proceedings of the TENCON 2009—2009 IEEE Region 10 Conference, Singapore, 23–26 January 2009; pp. 1–5.
  8. Chen, L.R. A Design of an Optimal Battery Pulse Charge System by Frequency-Varied Technique. IEEE Trans. Ind. Electron. 2007, 54, 398–405. [Google Scholar] [CrossRef]
  9. Chen, L.R. Design of Duty-Varied Voltage Pulse Charger for Improving Li-Ion Battery-Charging Response. IEEE Trans. Ind. Electron. 2009, 56, 480–487. [Google Scholar] [CrossRef]
  10. Jiang, J.; Liu, Q.; Zhang, C.; Zhang, W. Evaluation of Acceptable Charging Current of Power Li-Ion Batteries Based on Polarization Characteristics. IEEE Trans. Ind. Electron. 2014, 61, 6844–6851. [Google Scholar] [CrossRef]
  11. Leong, C.; Gan, Y.; Gan, G.; Phuan, Z.; Yoong, M.; Cheah, B.; Chew, K. Ultra fast charging system on lithium ion battery. In Proceedings of the 2010 IEEE Conference on Sustainable Utilization and Development in Engineering and Technology, Petaling Jaya, Malaysia, 20–21 November 2010; pp. 37–39.
  12. Huria, T.; Ceraolo, M.; Gazzarri, J.; Jackey, R. High fidelity electrical model with thermal dependence for characterization and simulation of high power lithium battery cells. In Proceedings of the 2012 IEEE International Electric Vehicle Conference, Greenville, SC, USA, 4–8 March 2012; pp. 1–8.
  13. Chang, W.Y. The State of Charge Estimating Methods for Battery: A Review. ISRN Appl. Math. 2013, 2013. [Google Scholar] [CrossRef]
  14. Yin, M.D.; Youn, J.; Park, D.; Cho, J. Dynamic Frequency and Duty Cycle Control Method for Fast Pulse-Charging of Lithium Battery Based on Polarization Curve. In Proceedings of the 9th International Conference on Frontier of Computer Science and Technology, Dalian, China, 26–28 August 2015; pp. 40–45.
  15. Chen, H.C.; Chou, S.R.; Chen, H.C.; Wu, S.L.; Chen, L.R. Fast Estimation of State of Charge for Lithium-Ion Battery. In Proceedings of the 2014 International Symposium on Computer, Consumer and Control (IS3C), Taichung, Taiwan, 10–12 June 2014; pp. 284–287.
Figure 1. Large scale battery cells (internet of cell things) and battery management system (BMS). MCU: Microcontroller.
Energies 09 00209 g001
Figure 2. Charger voltage and cell terminal voltage.
Energies 09 00209 g002
Figure 3. The constant current, constant voltage (CC-CV) charging of Li-Ion batteries (model: Samsung INR18650-25R) (lithium type).
Energies 09 00209 g003
Figure 4. The profile of five stages of current charging algorithm.
Energies 09 00209 g004
Figure 5. Relaxation after charging pulse. (a) battery charging current under 4.2 volts of charging pulse; (b) text result of diffusion after pulse on INR18650-25R.
Energies 09 00209 g005
Figure 6. The open circuit voltage-state of charge (OCV-SOC) profiles of the INR18650-25R battery.
Energies 09 00209 g006
Figure 7. (a) Equivalent circuit model, and (b) lookup table (LUT) for statically sensed characteristics of the lithium battery cell (X axis: SOC).
Energies 09 00209 g007
Figure 8. Acceptable current based on polarization voltage. (a) Polarization voltage according to charging rate and SOC; (b) adjusting charging current based on polarization boundary (limit ) curve.
Energies 09 00209 g008
Figure 9. The sensed impedance of Z 1 varies with SOC and the pulse charging frequency at 20 C.
Energies 09 00209 g009
Figure 10. Proposed algorithm for controlling the optimal frequency and charging current.
Energies 09 00209 g010
Figure 11. Controlling the acceptable charging current using dynamic pulse duty cycle searching method based on cell polarization.
Energies 09 00209 g011
Figure 12. Proposed algorithm for the optimal duty search mode.
Energies 09 00209 g012
Figure 13. Flow chart of the efficient frequency and duty cycle control method.
Energies 09 00209 g013
Figure 14. MATLAB/Simulink-based model to evaluate the feasibility of the proposed charger system.
Energies 09 00209 g014
Figure 15. The overall control flow of the proposed charger system. (a) Conceptual flow; (b) an implementation using Matlab stateflowTM.
Energies 09 00209 g015
Figure 16. Schematic diagram for the charging test.
Energies 09 00209 g016
Figure 17. Experiment environment for the charging test. (a) Experiment environment for the charging text; (b) waveform captured by Oscilloscope.
Energies 09 00209 g017
Figure 18. Timed measurement result of the optimal pulse-based charging process during one cycle using the proposed frequency and duty searching mode.
Energies 09 00209 g018
Figure 19. Results of proposed charging algorithm. (a) duty and frequency search operation; (b) comparison of SOC and temperature rise; (c) dynamic adjustment result of voltage and current by the proposed method compared to conventional approaches.
Energies 09 00209 g019
Figure 20. Fabricated chip-based BMS Microcontroller and evaluation environment. (a) Evaluation environment of battery charge-algorithm and BMS; (b) fabricated BMS IC (stacked on multiple batteries).
Energies 09 00209 g020
Table 1. Calculated acceptable charging current for the INR18650-25R battery.
SOC range (%)Charging current (mA)
0–201250
20–404000
45–503858
50–553539
55–602979
60–652659
65–702319
70–751959
75–801500
Table 2. Comparison of evaluation results.
No.Charge modeTemperature rise (°C)0%–80% Charge time (s)20%–80% Charge time (s)
IProposed1333181896
IICC-CV(2C)1040753360
IIIFixed pulse1061505470
IVPolarization method1240791909

