
Monte Carlo Evaluation of the Impact of Subsequent Strokes on Backflashover Rate


Abstract
:1. Introduction
2. Basic Considerations
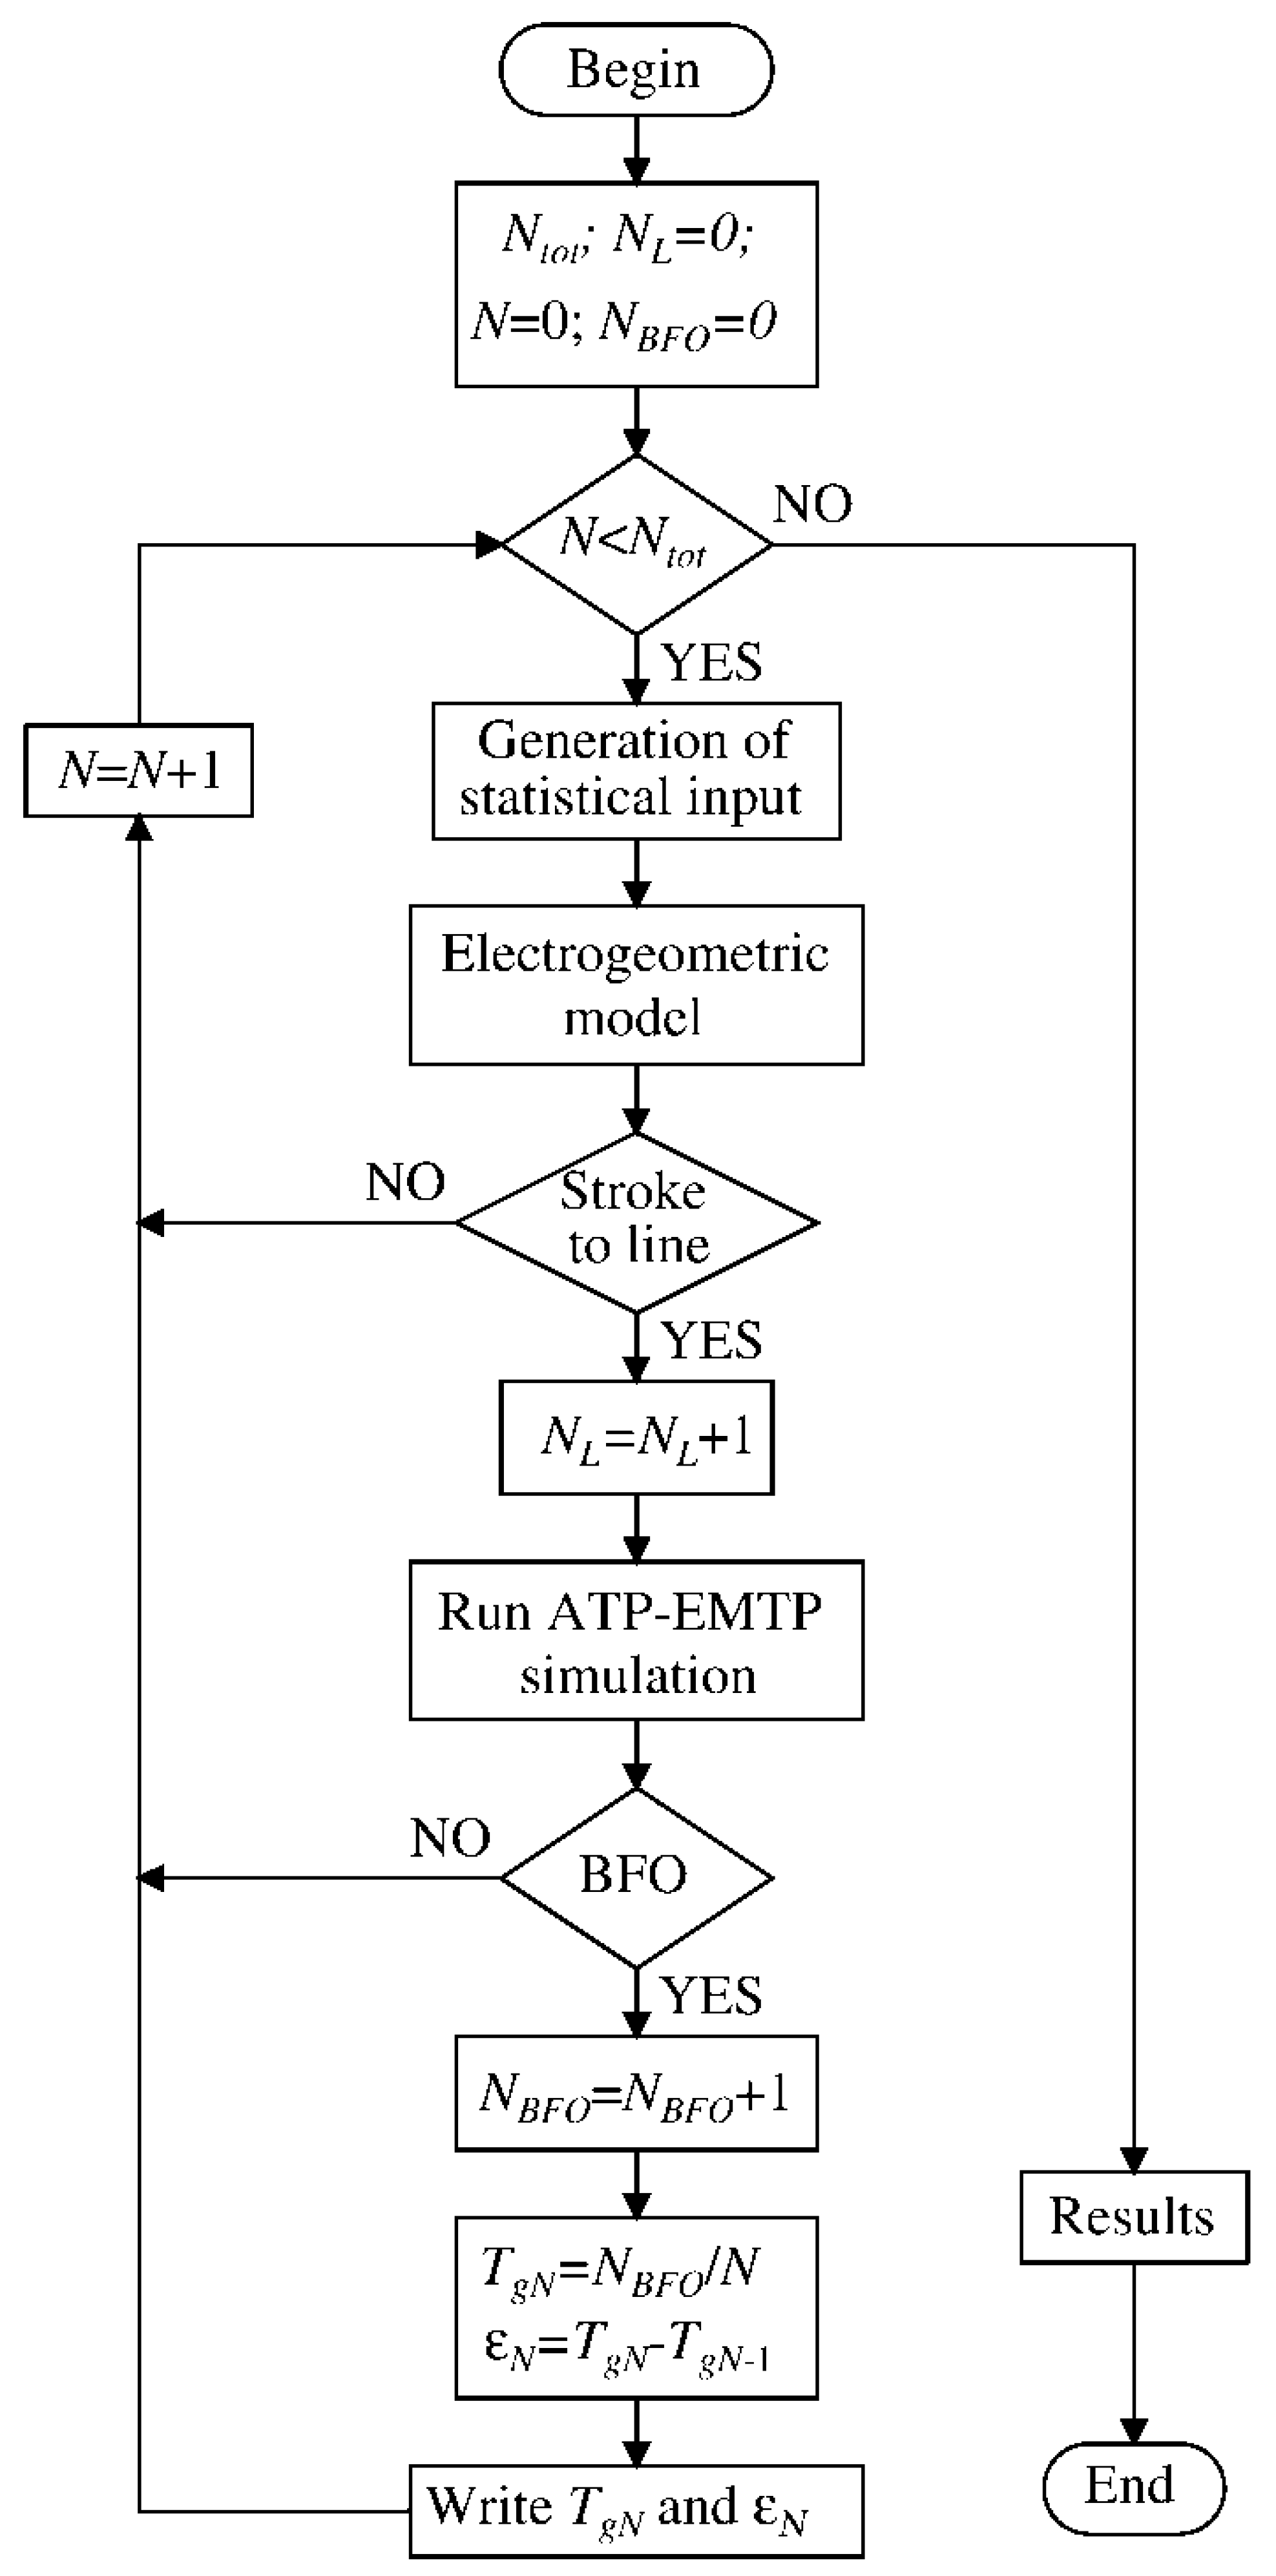
3. System Modeling
3.1. OHL Model
3.2. Line Insulation Model
3.3. Lightning Model
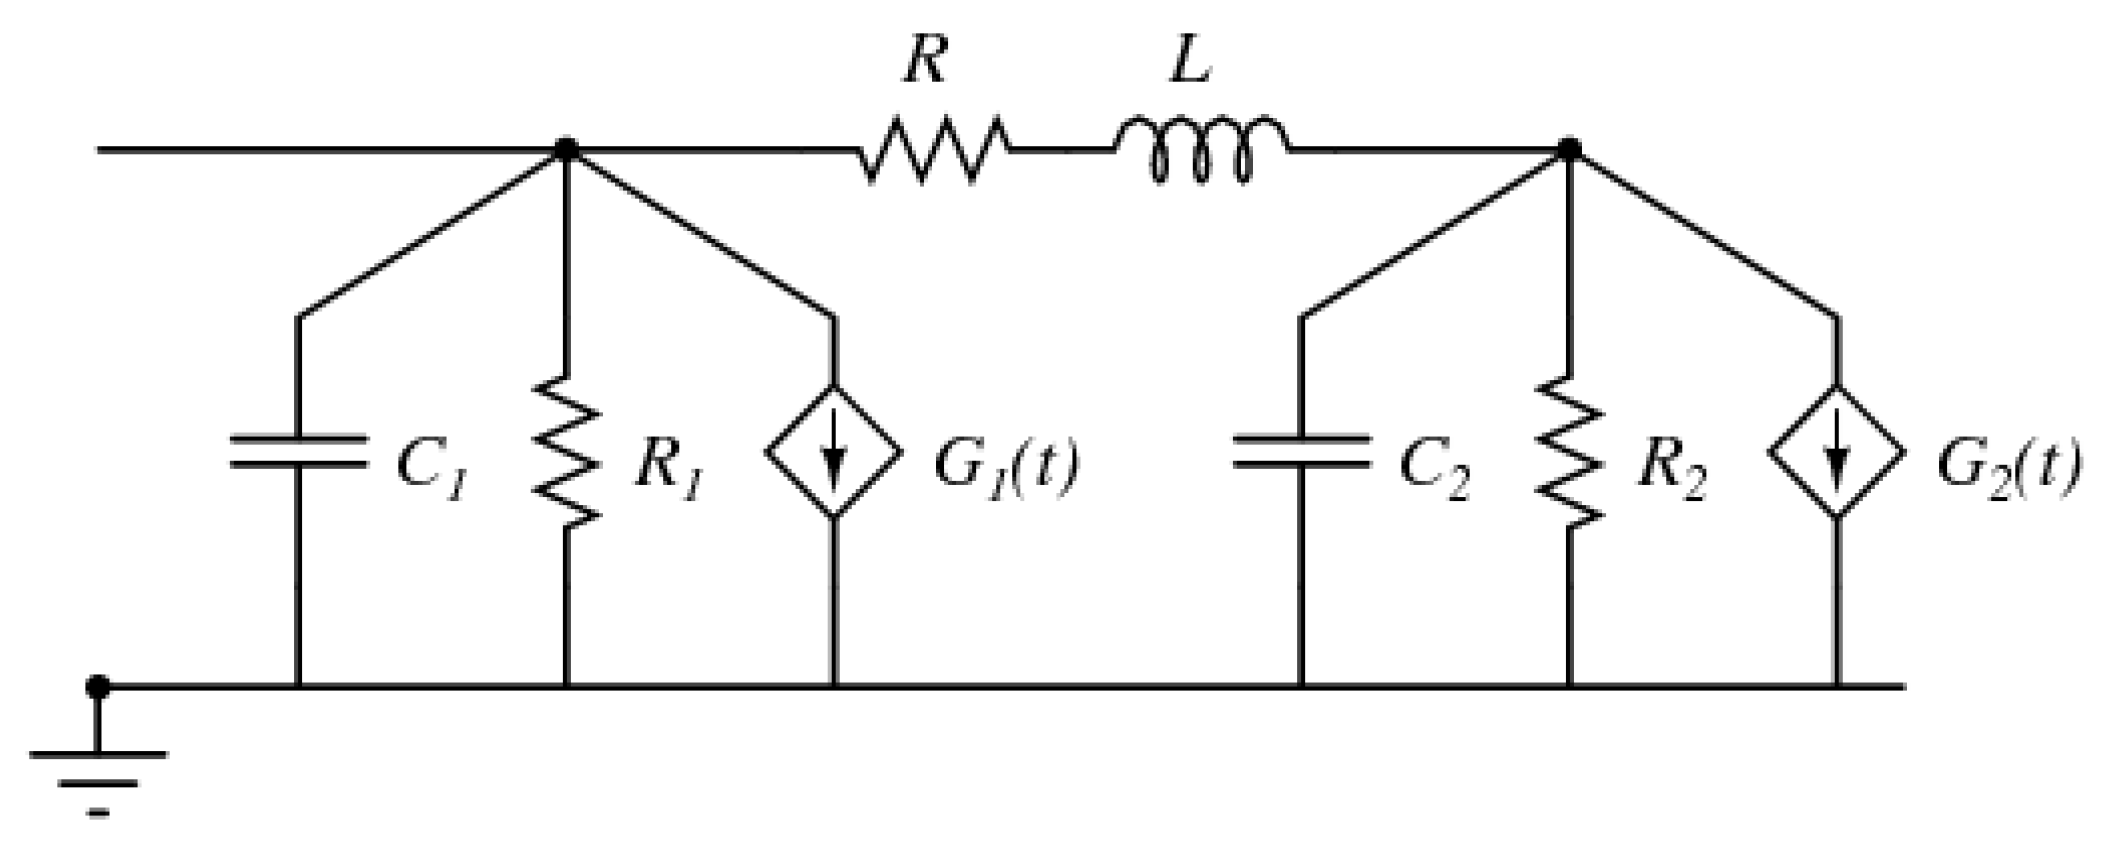
3.4. Grounding System Model
4. Statistical Inputs of the Procedure
4.1. Lightning Polarity
4.2. Lightning Parameters
4.3. Line Insulation Parameters
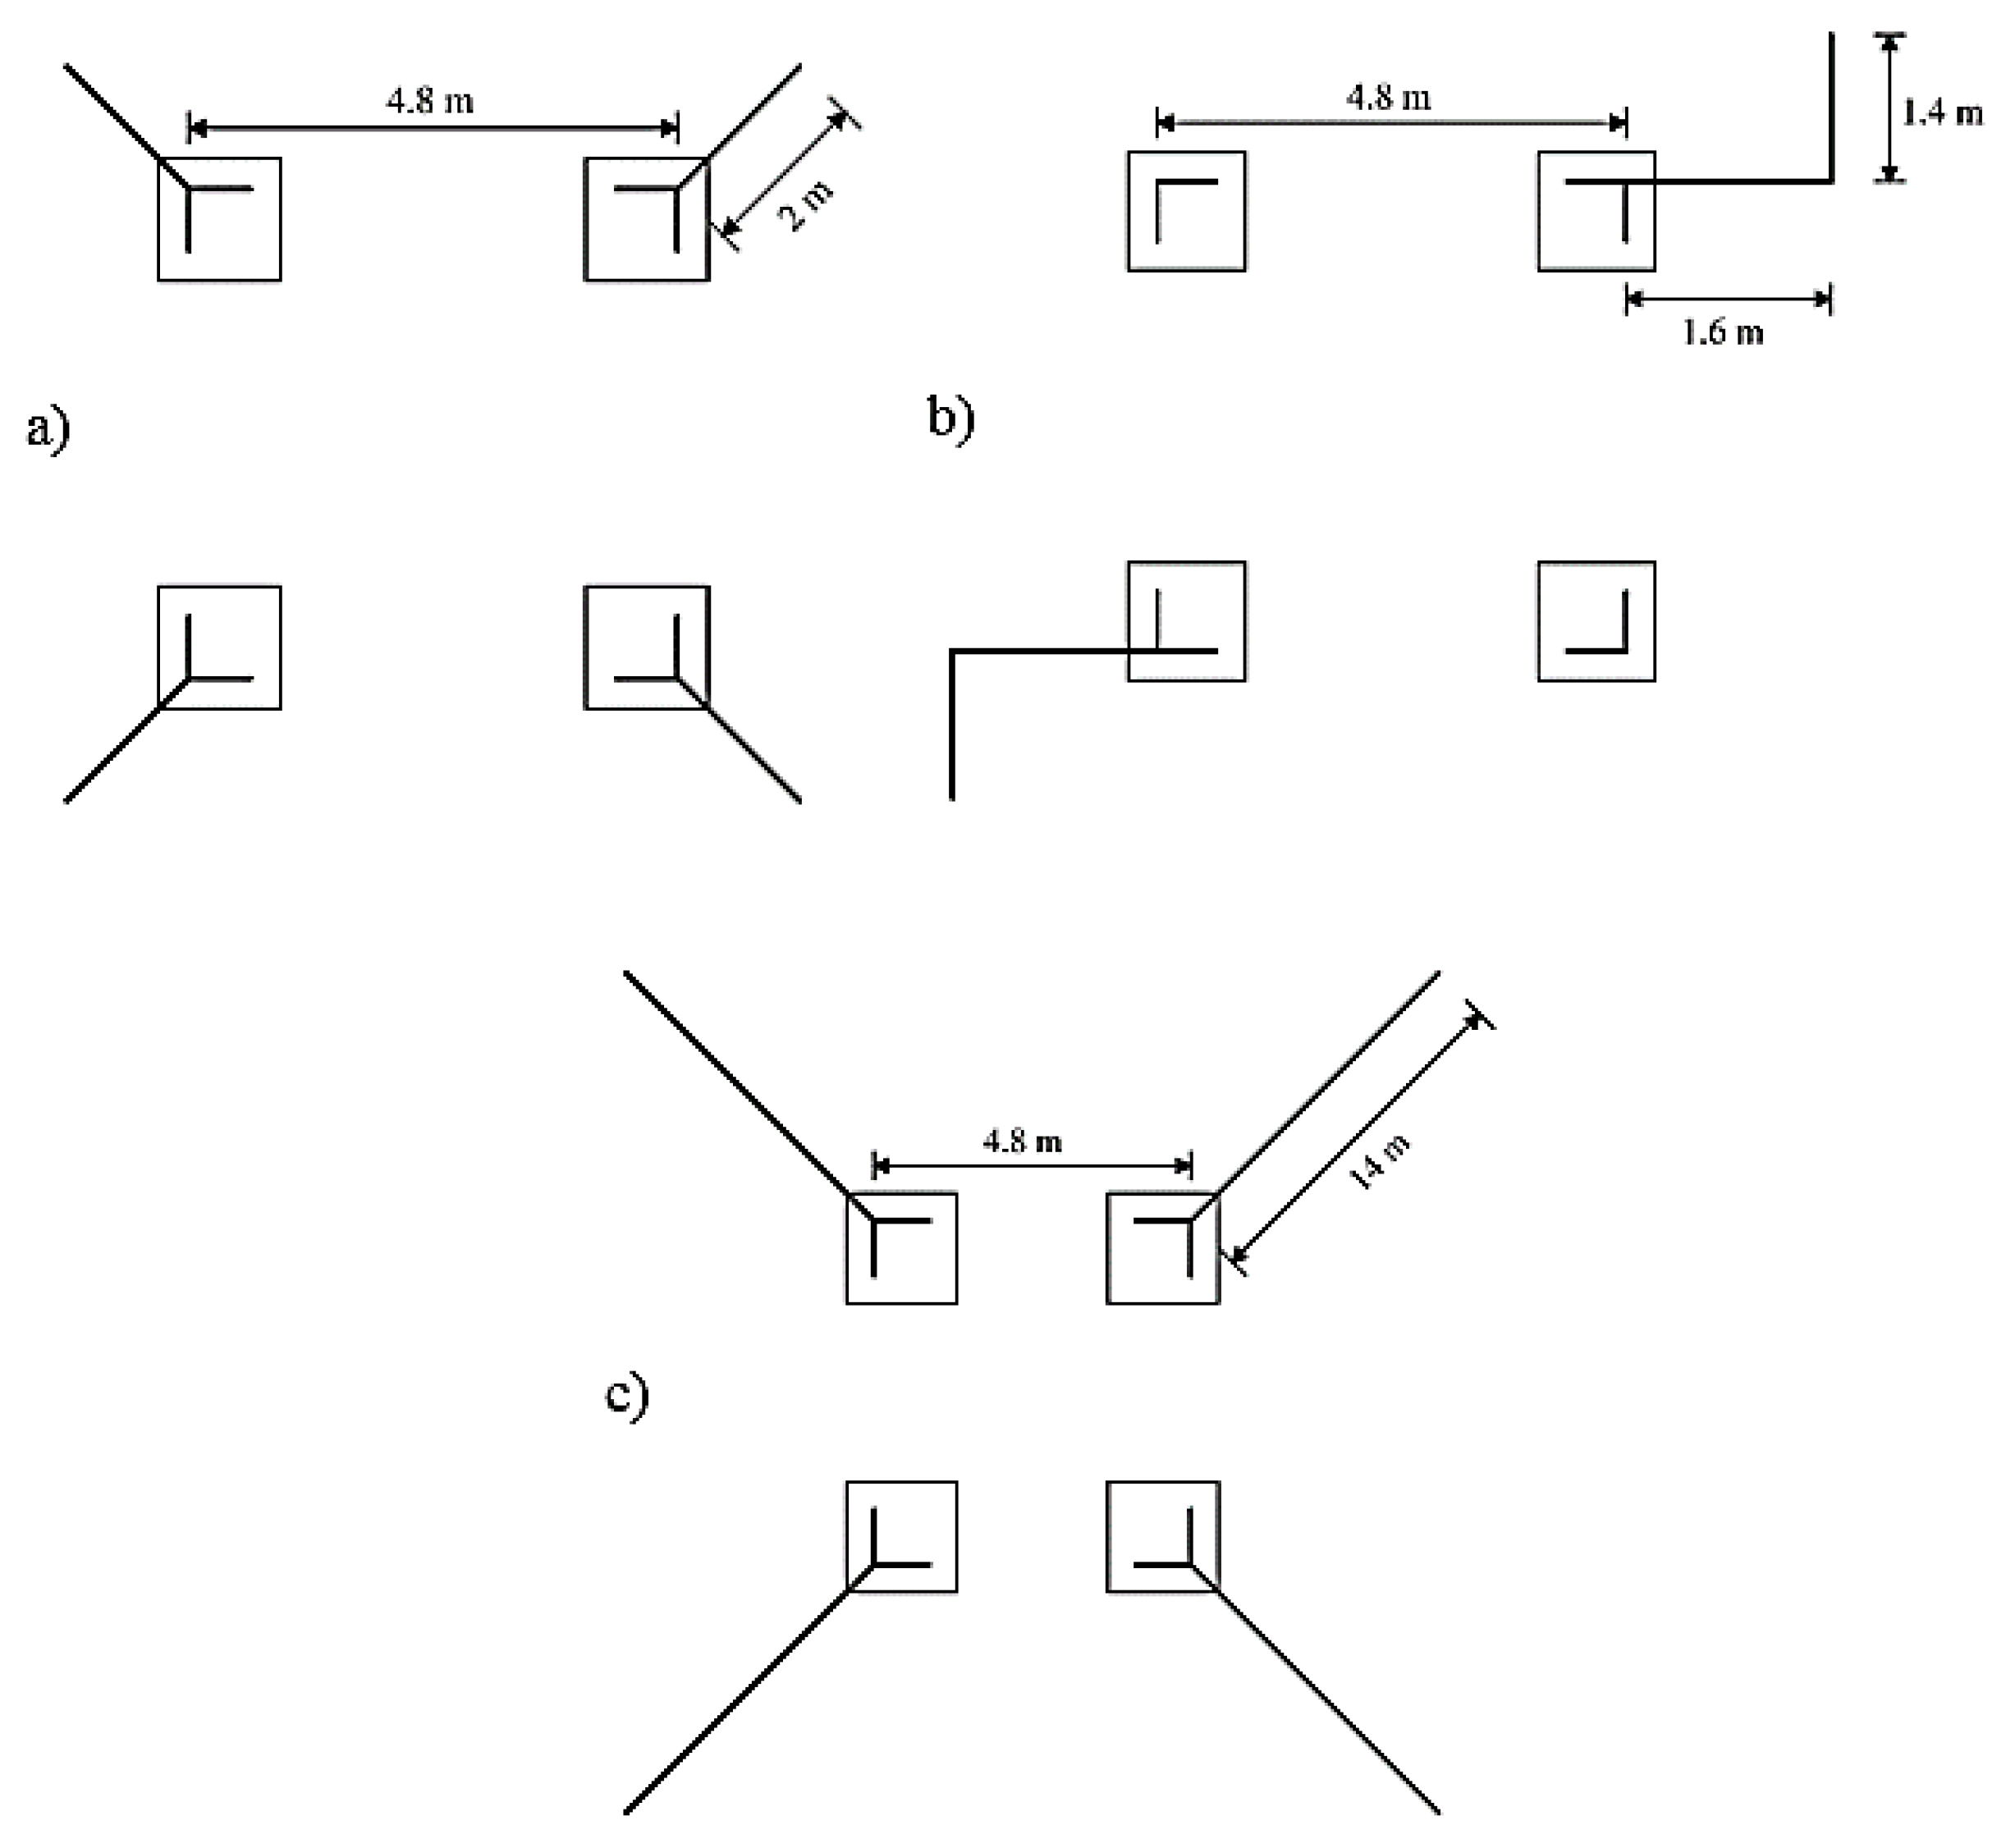
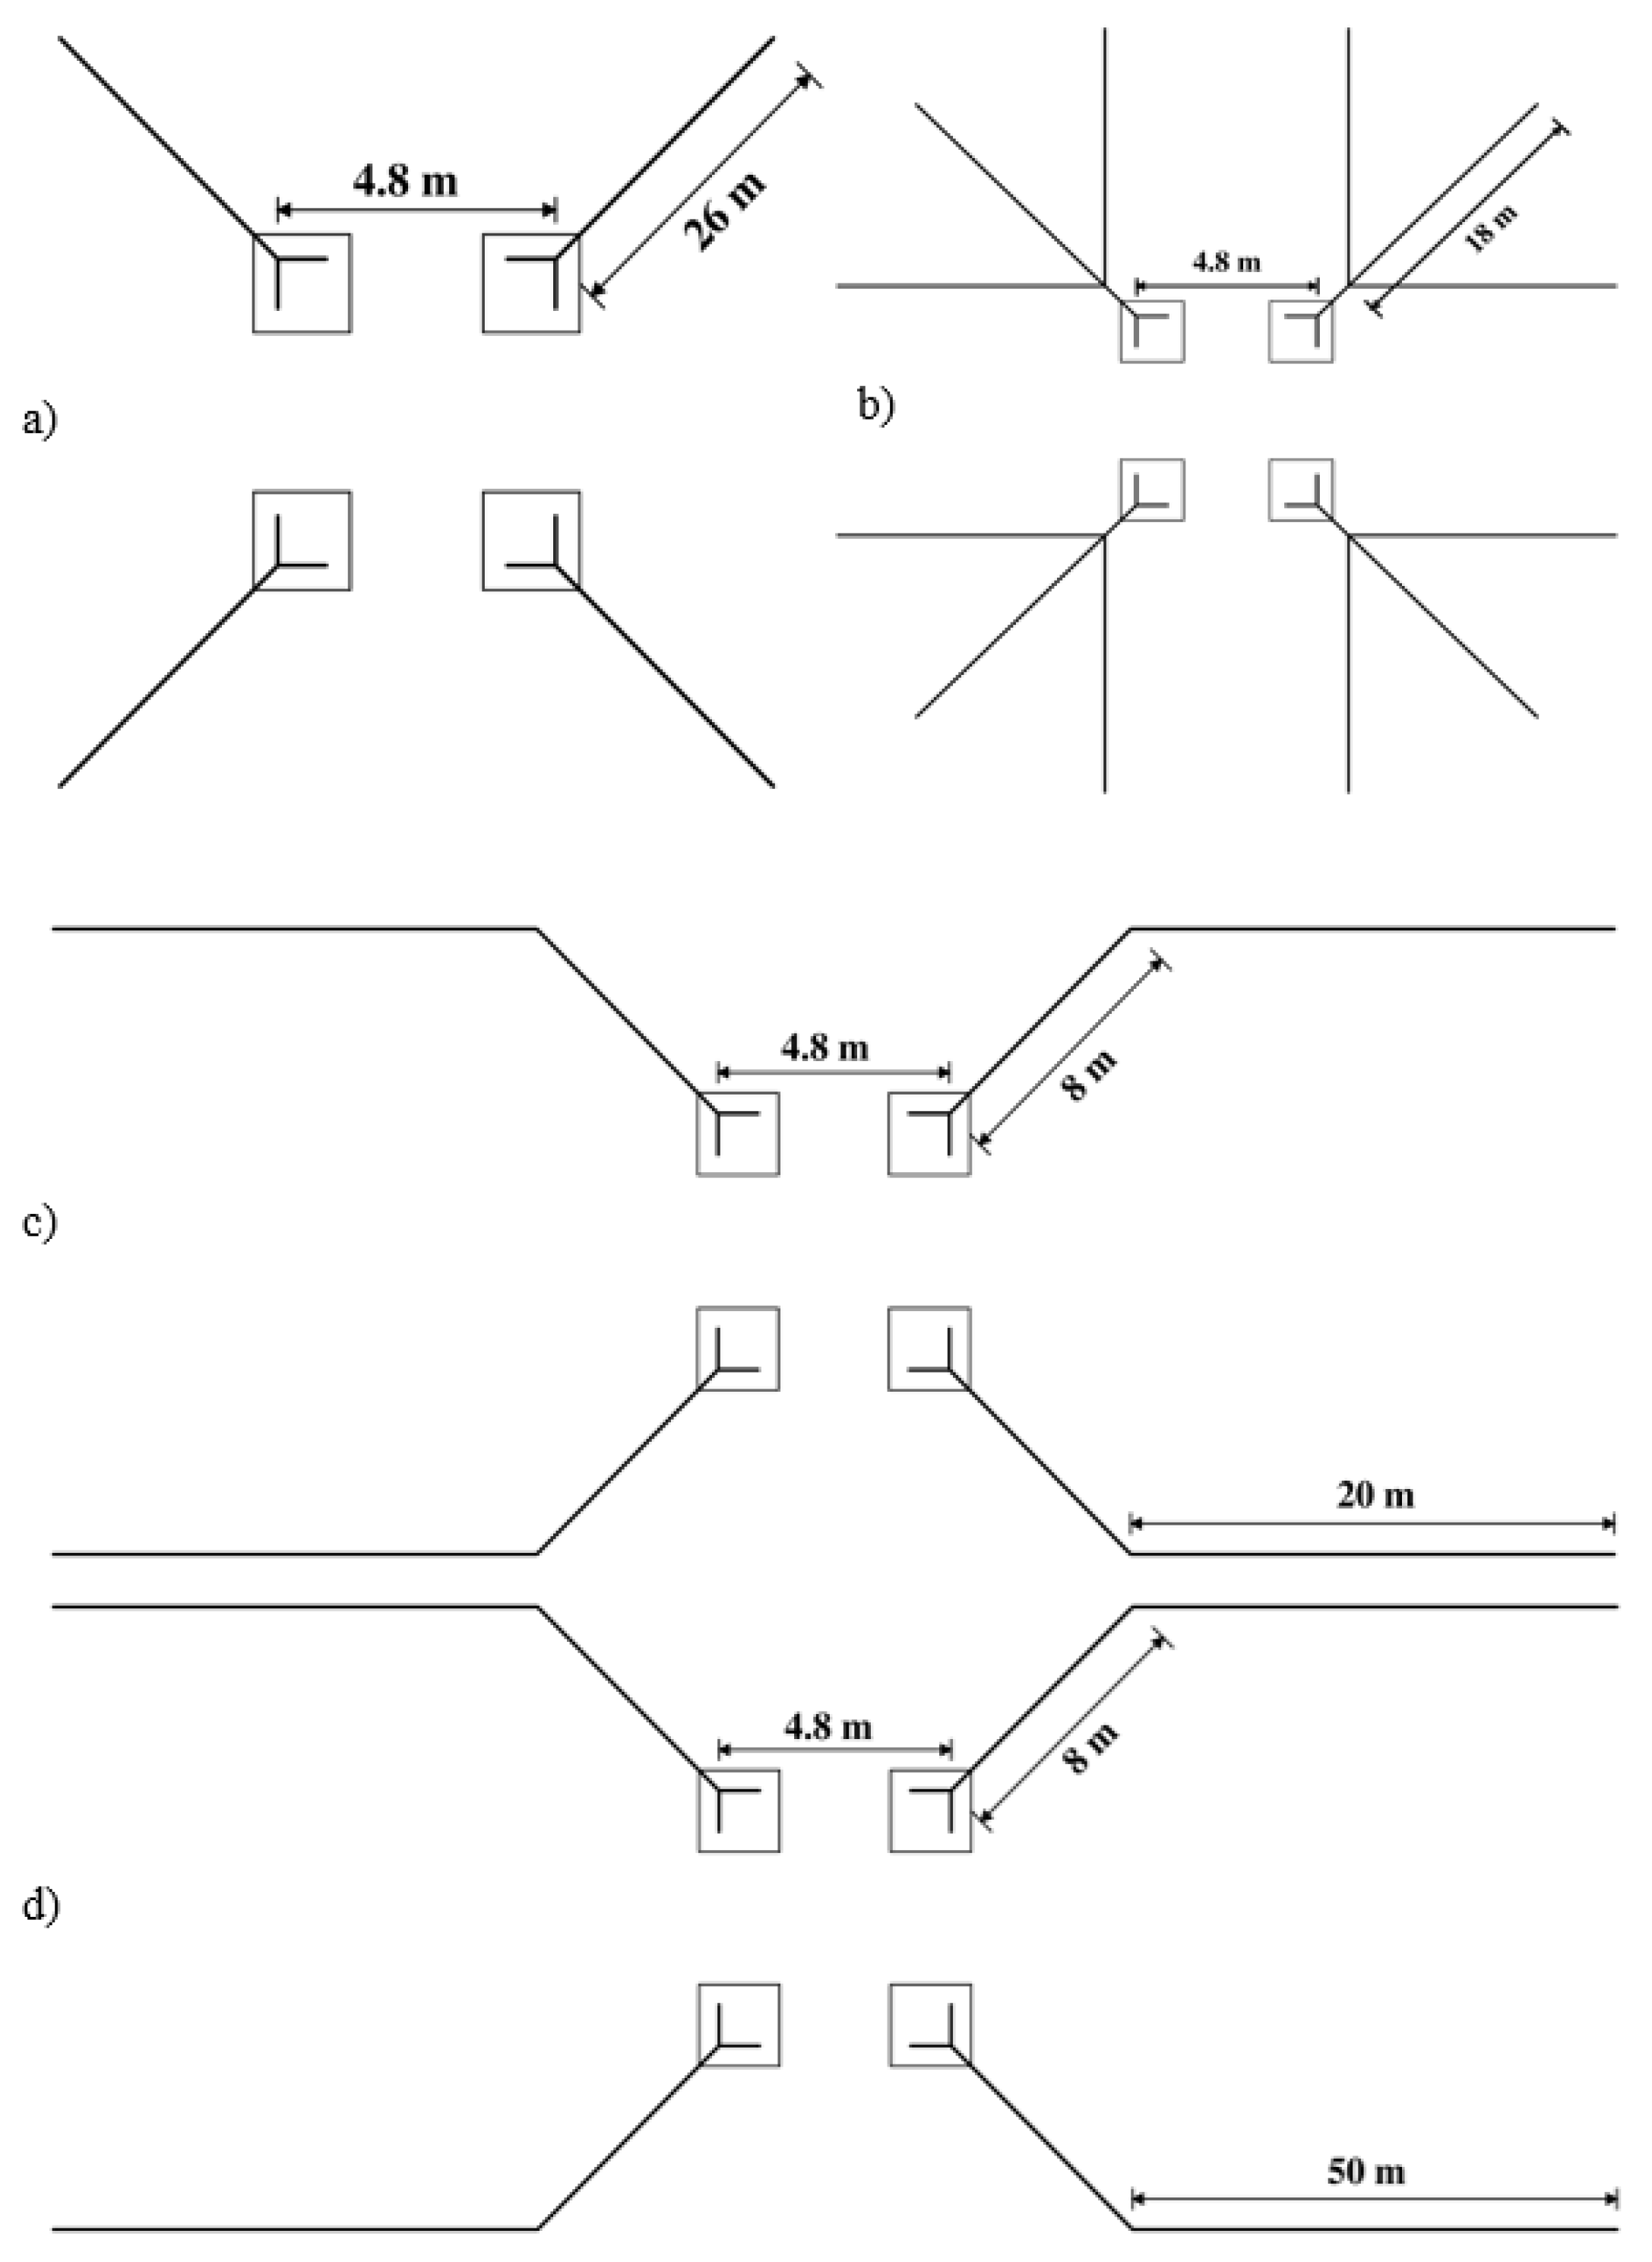
4.4. Lightning Location and Attachment
4.5. Phase Angle of the Power Frequency Voltage
5. Results
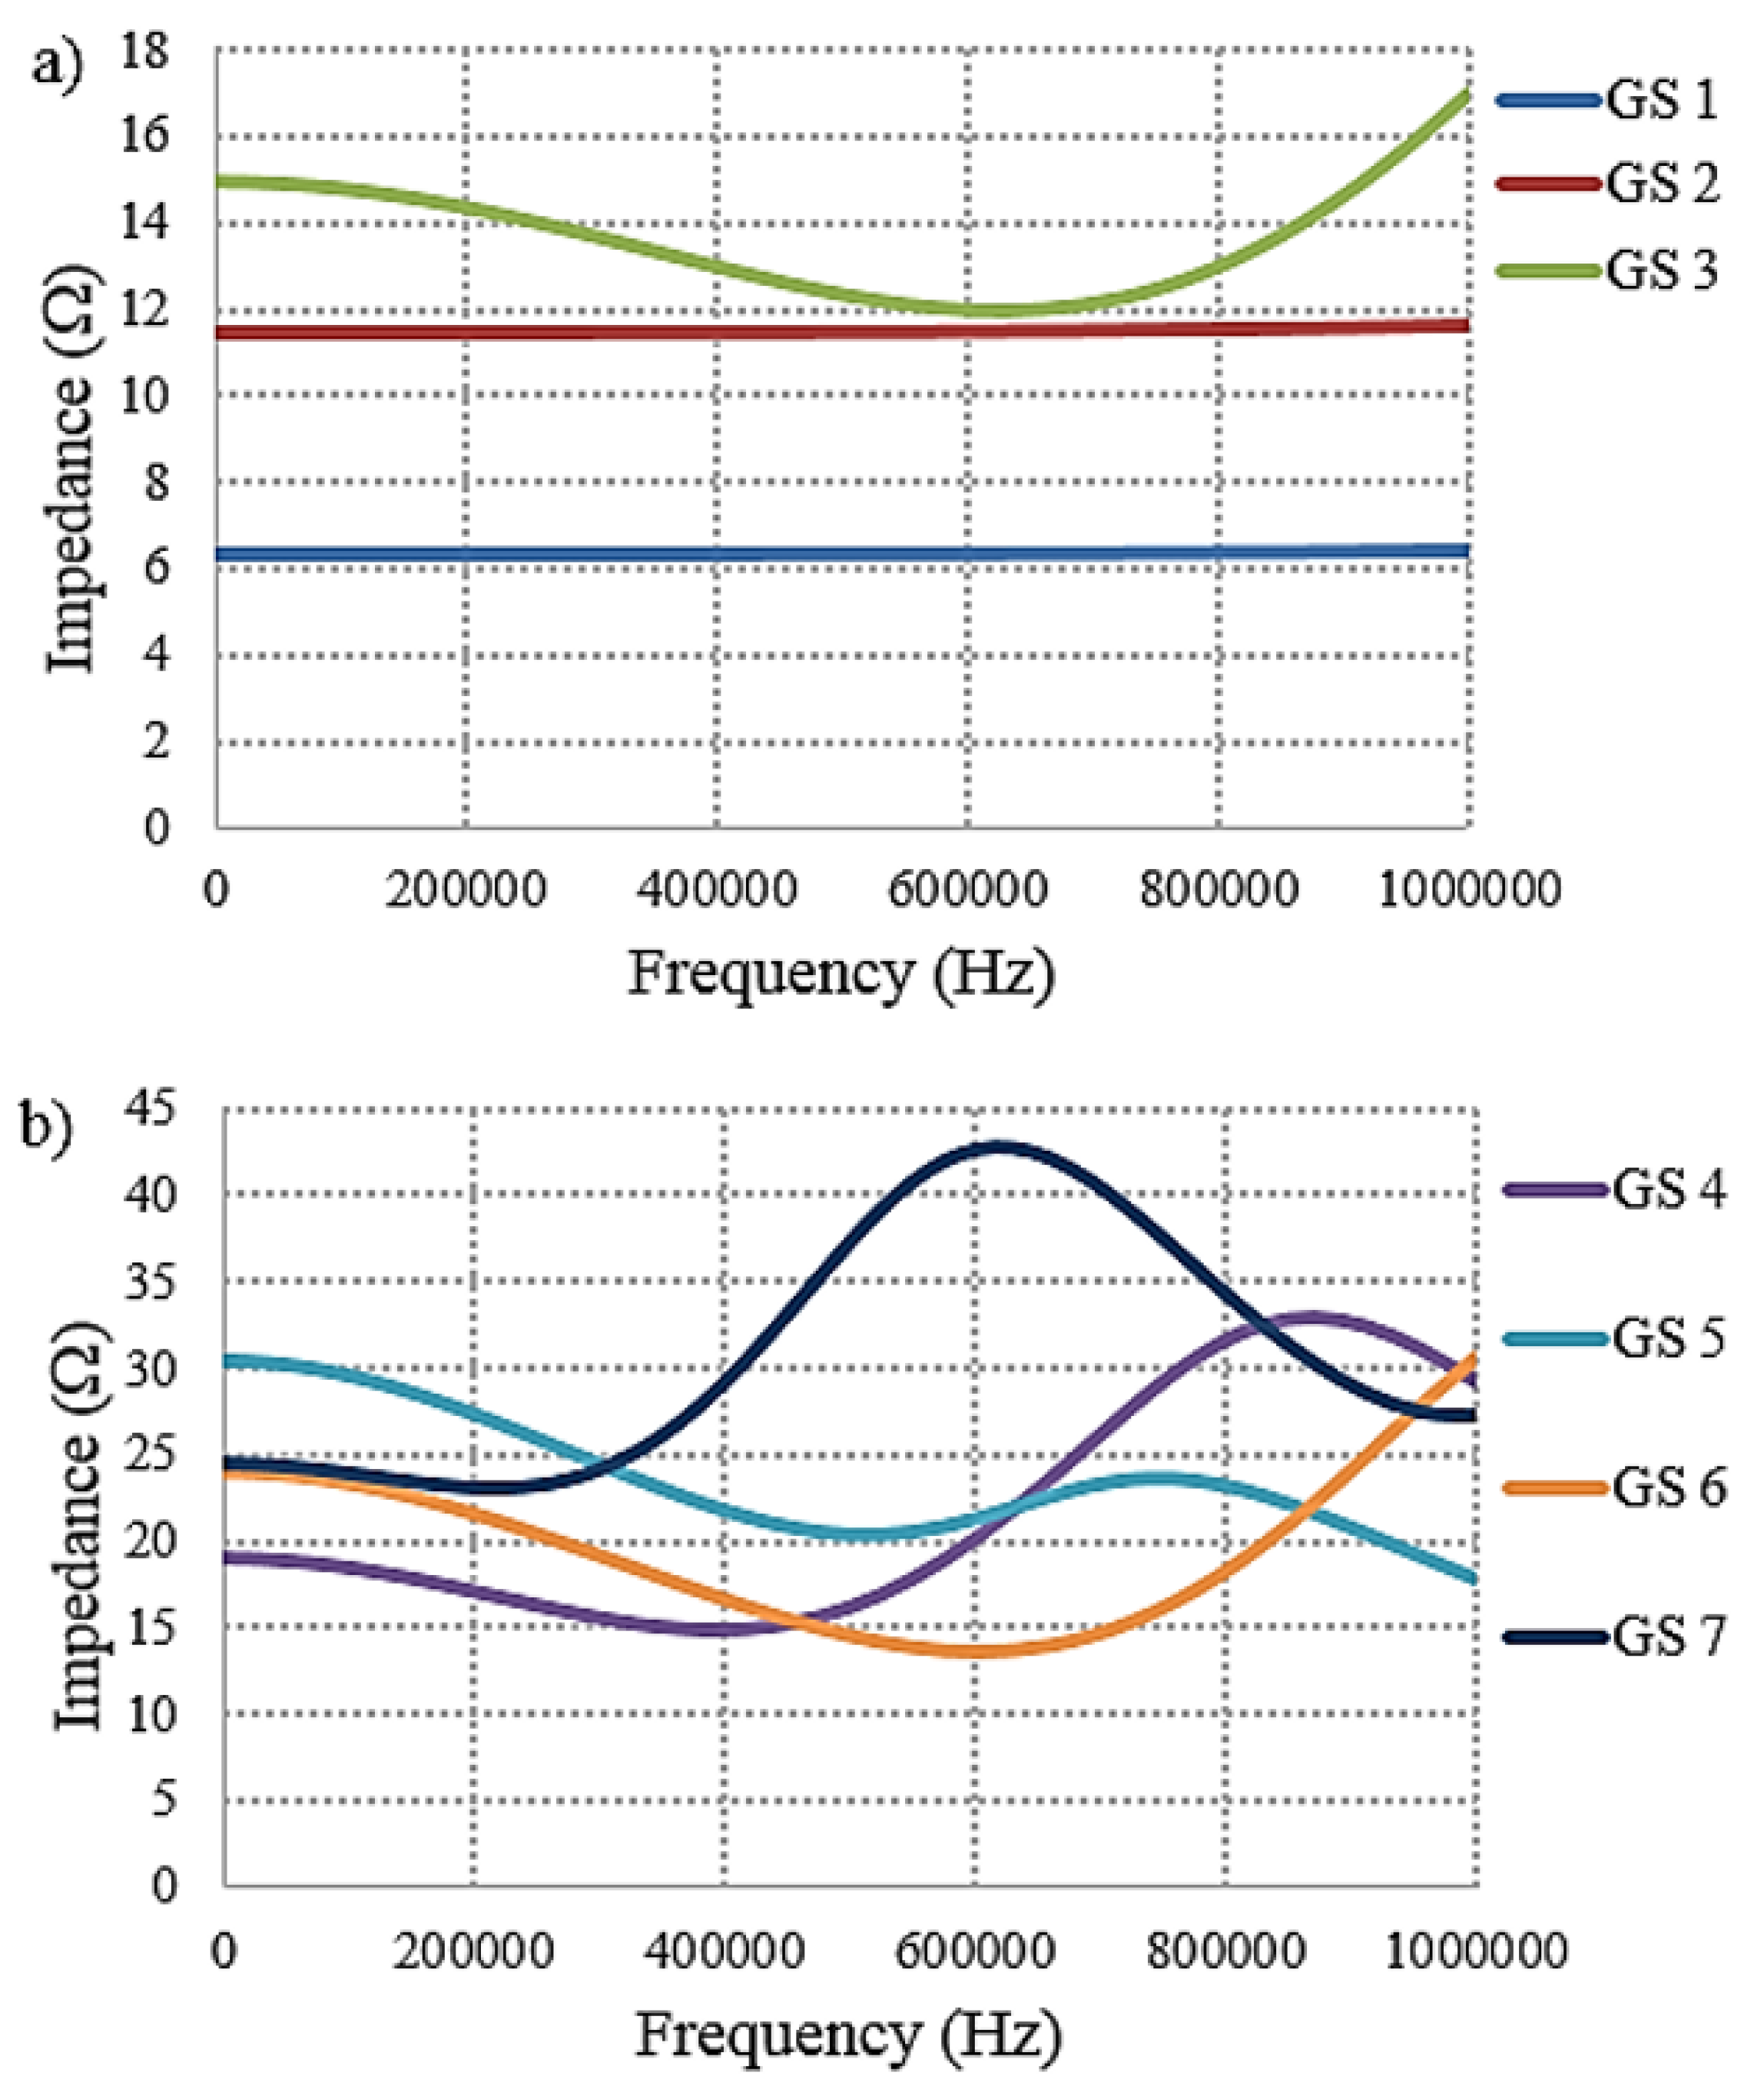
- the minimum current causing backflashover strictly depends on R@50Hz for concentrated grounding systems, decreasing as R@50Hz increases;
- for spatially extended grounding systems, the minimum current causing backflashover also depends on the their frequency behavior: for instance, GS 5 has a larger R@50Hz than GS 7, but even a larger minimum current causing backflashover, due to its capacitive behavior at high frequency with respect to the inductive behavior of GS 7.
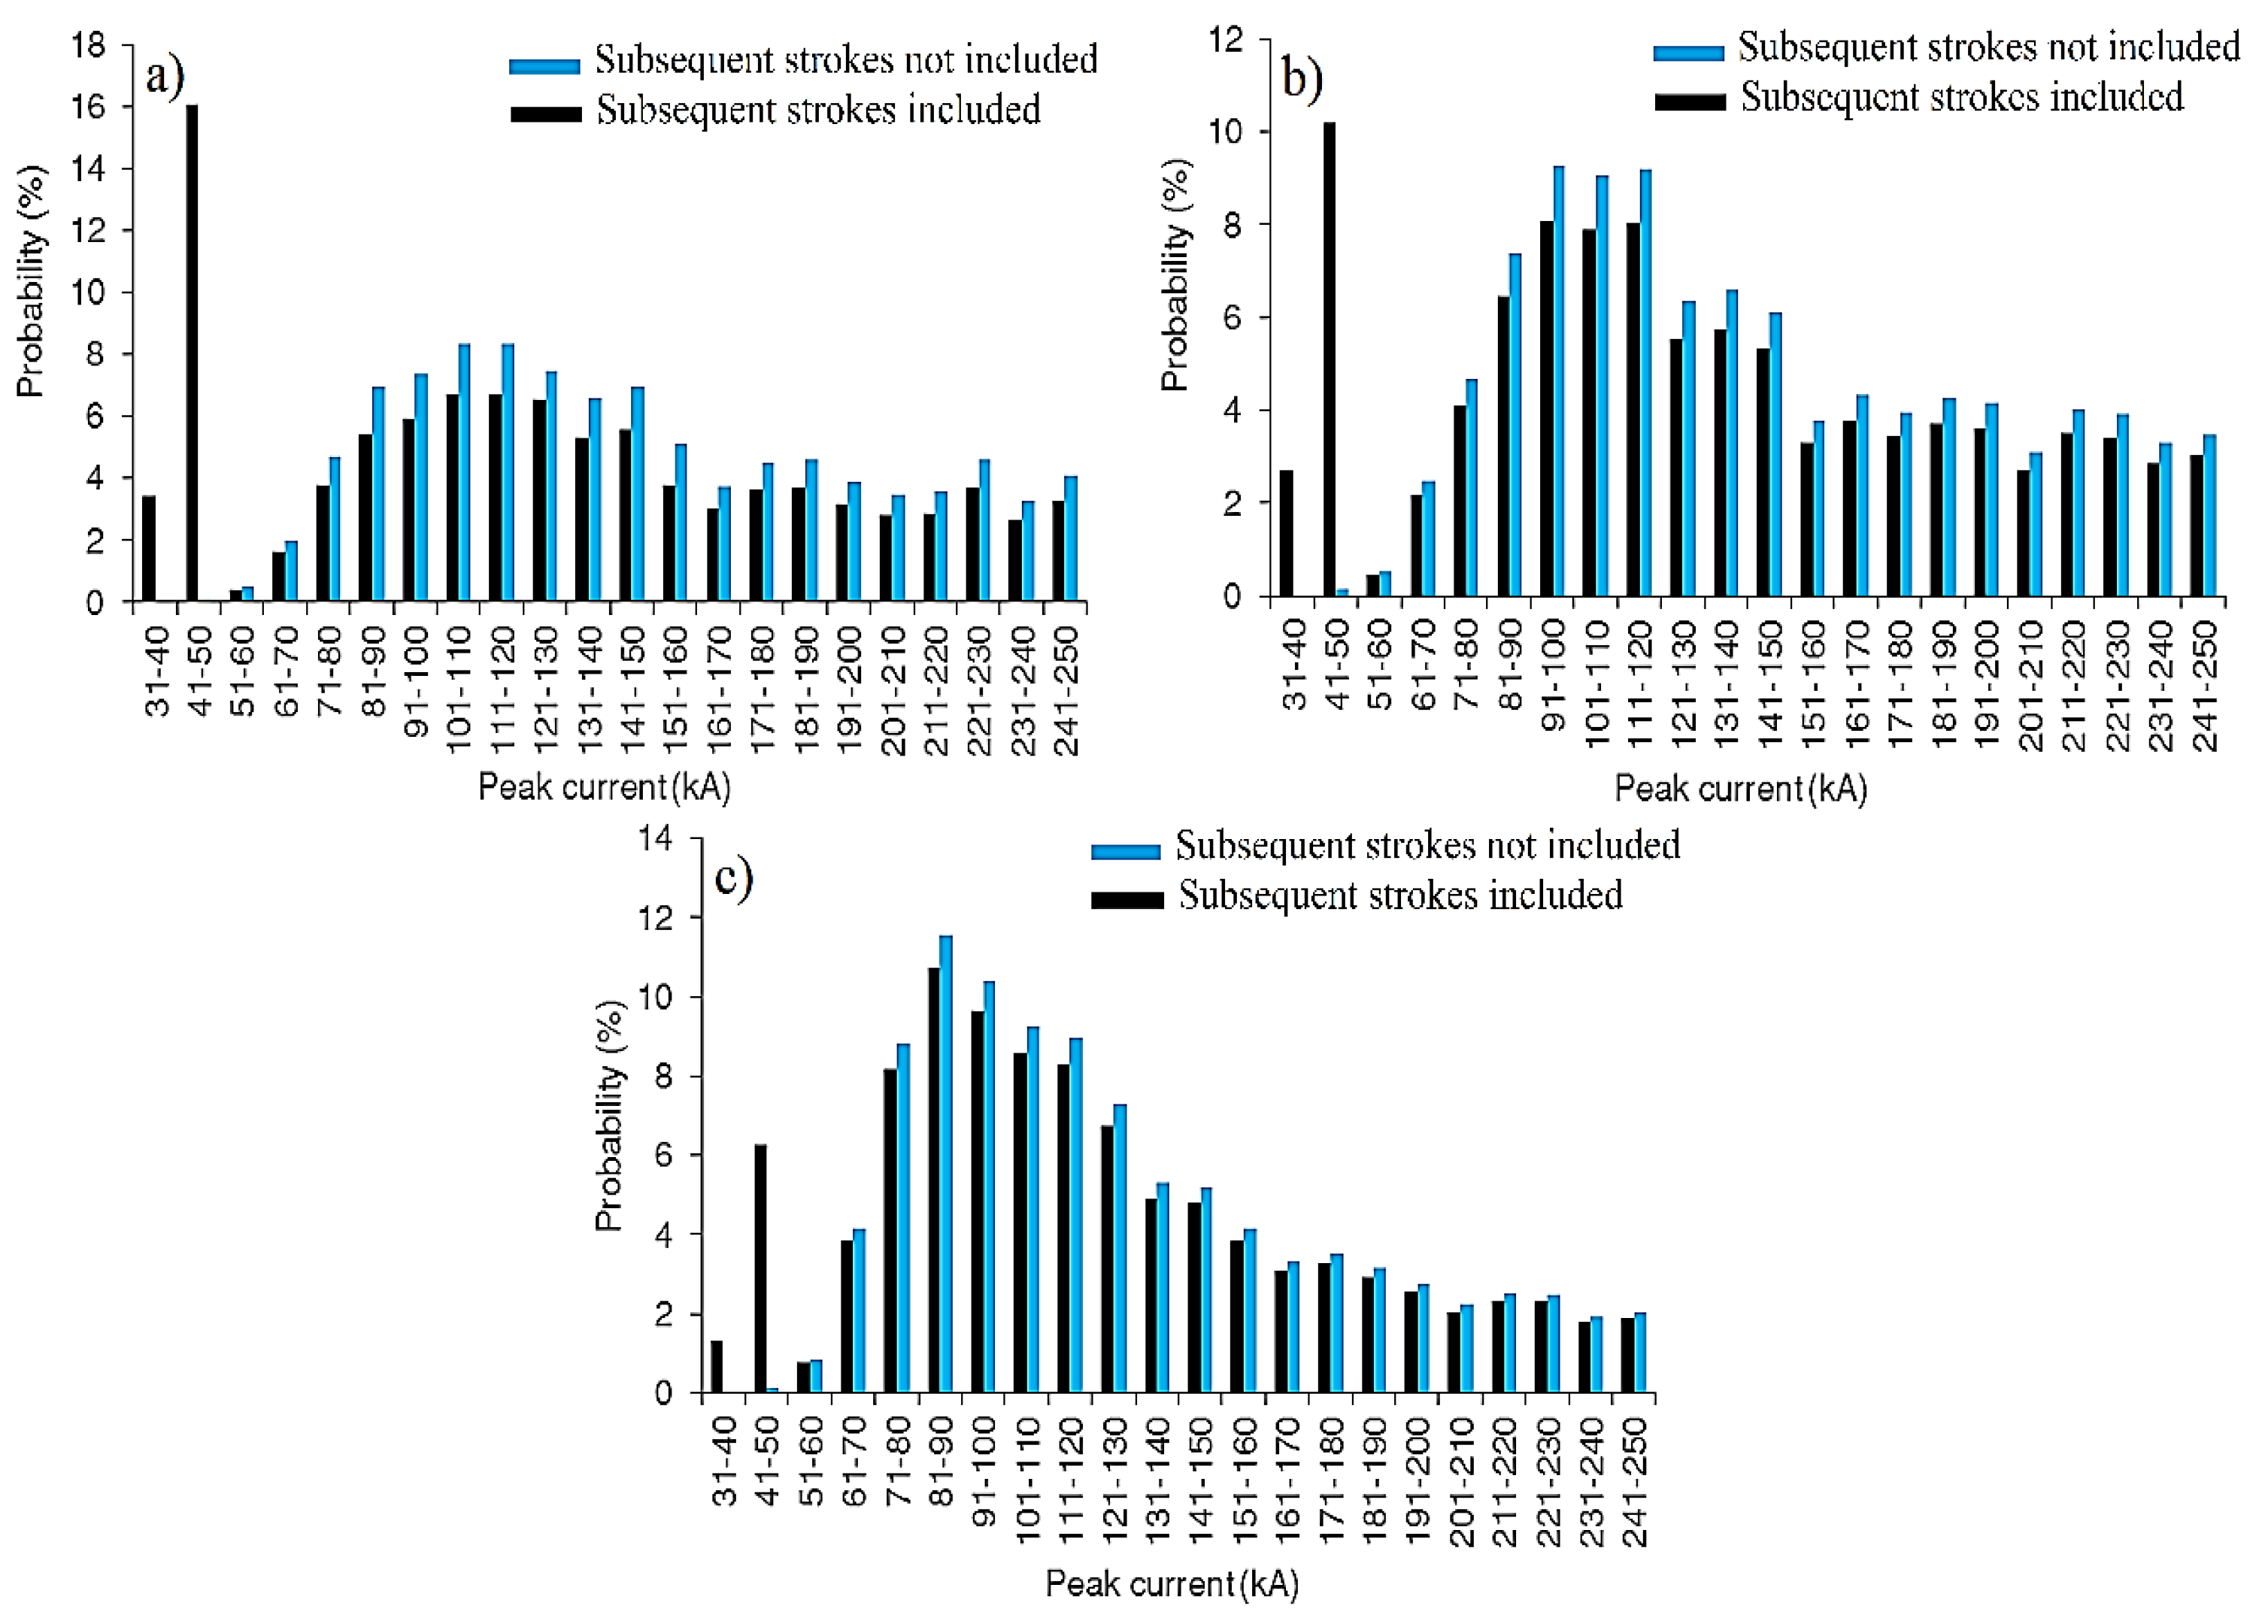
- for concentrated, predominantly resistive, grounding systems GS 1, GS 2 and GS 3, the incorporation of subsequent strokes into the Monte Carlo procedure causes a non-negligible increase of BFR values. A qualitative trend may be evidenced: the impact is noticeably higher (in relative terms) for lower values of low-frequency grounding resistance, as explained in [18];
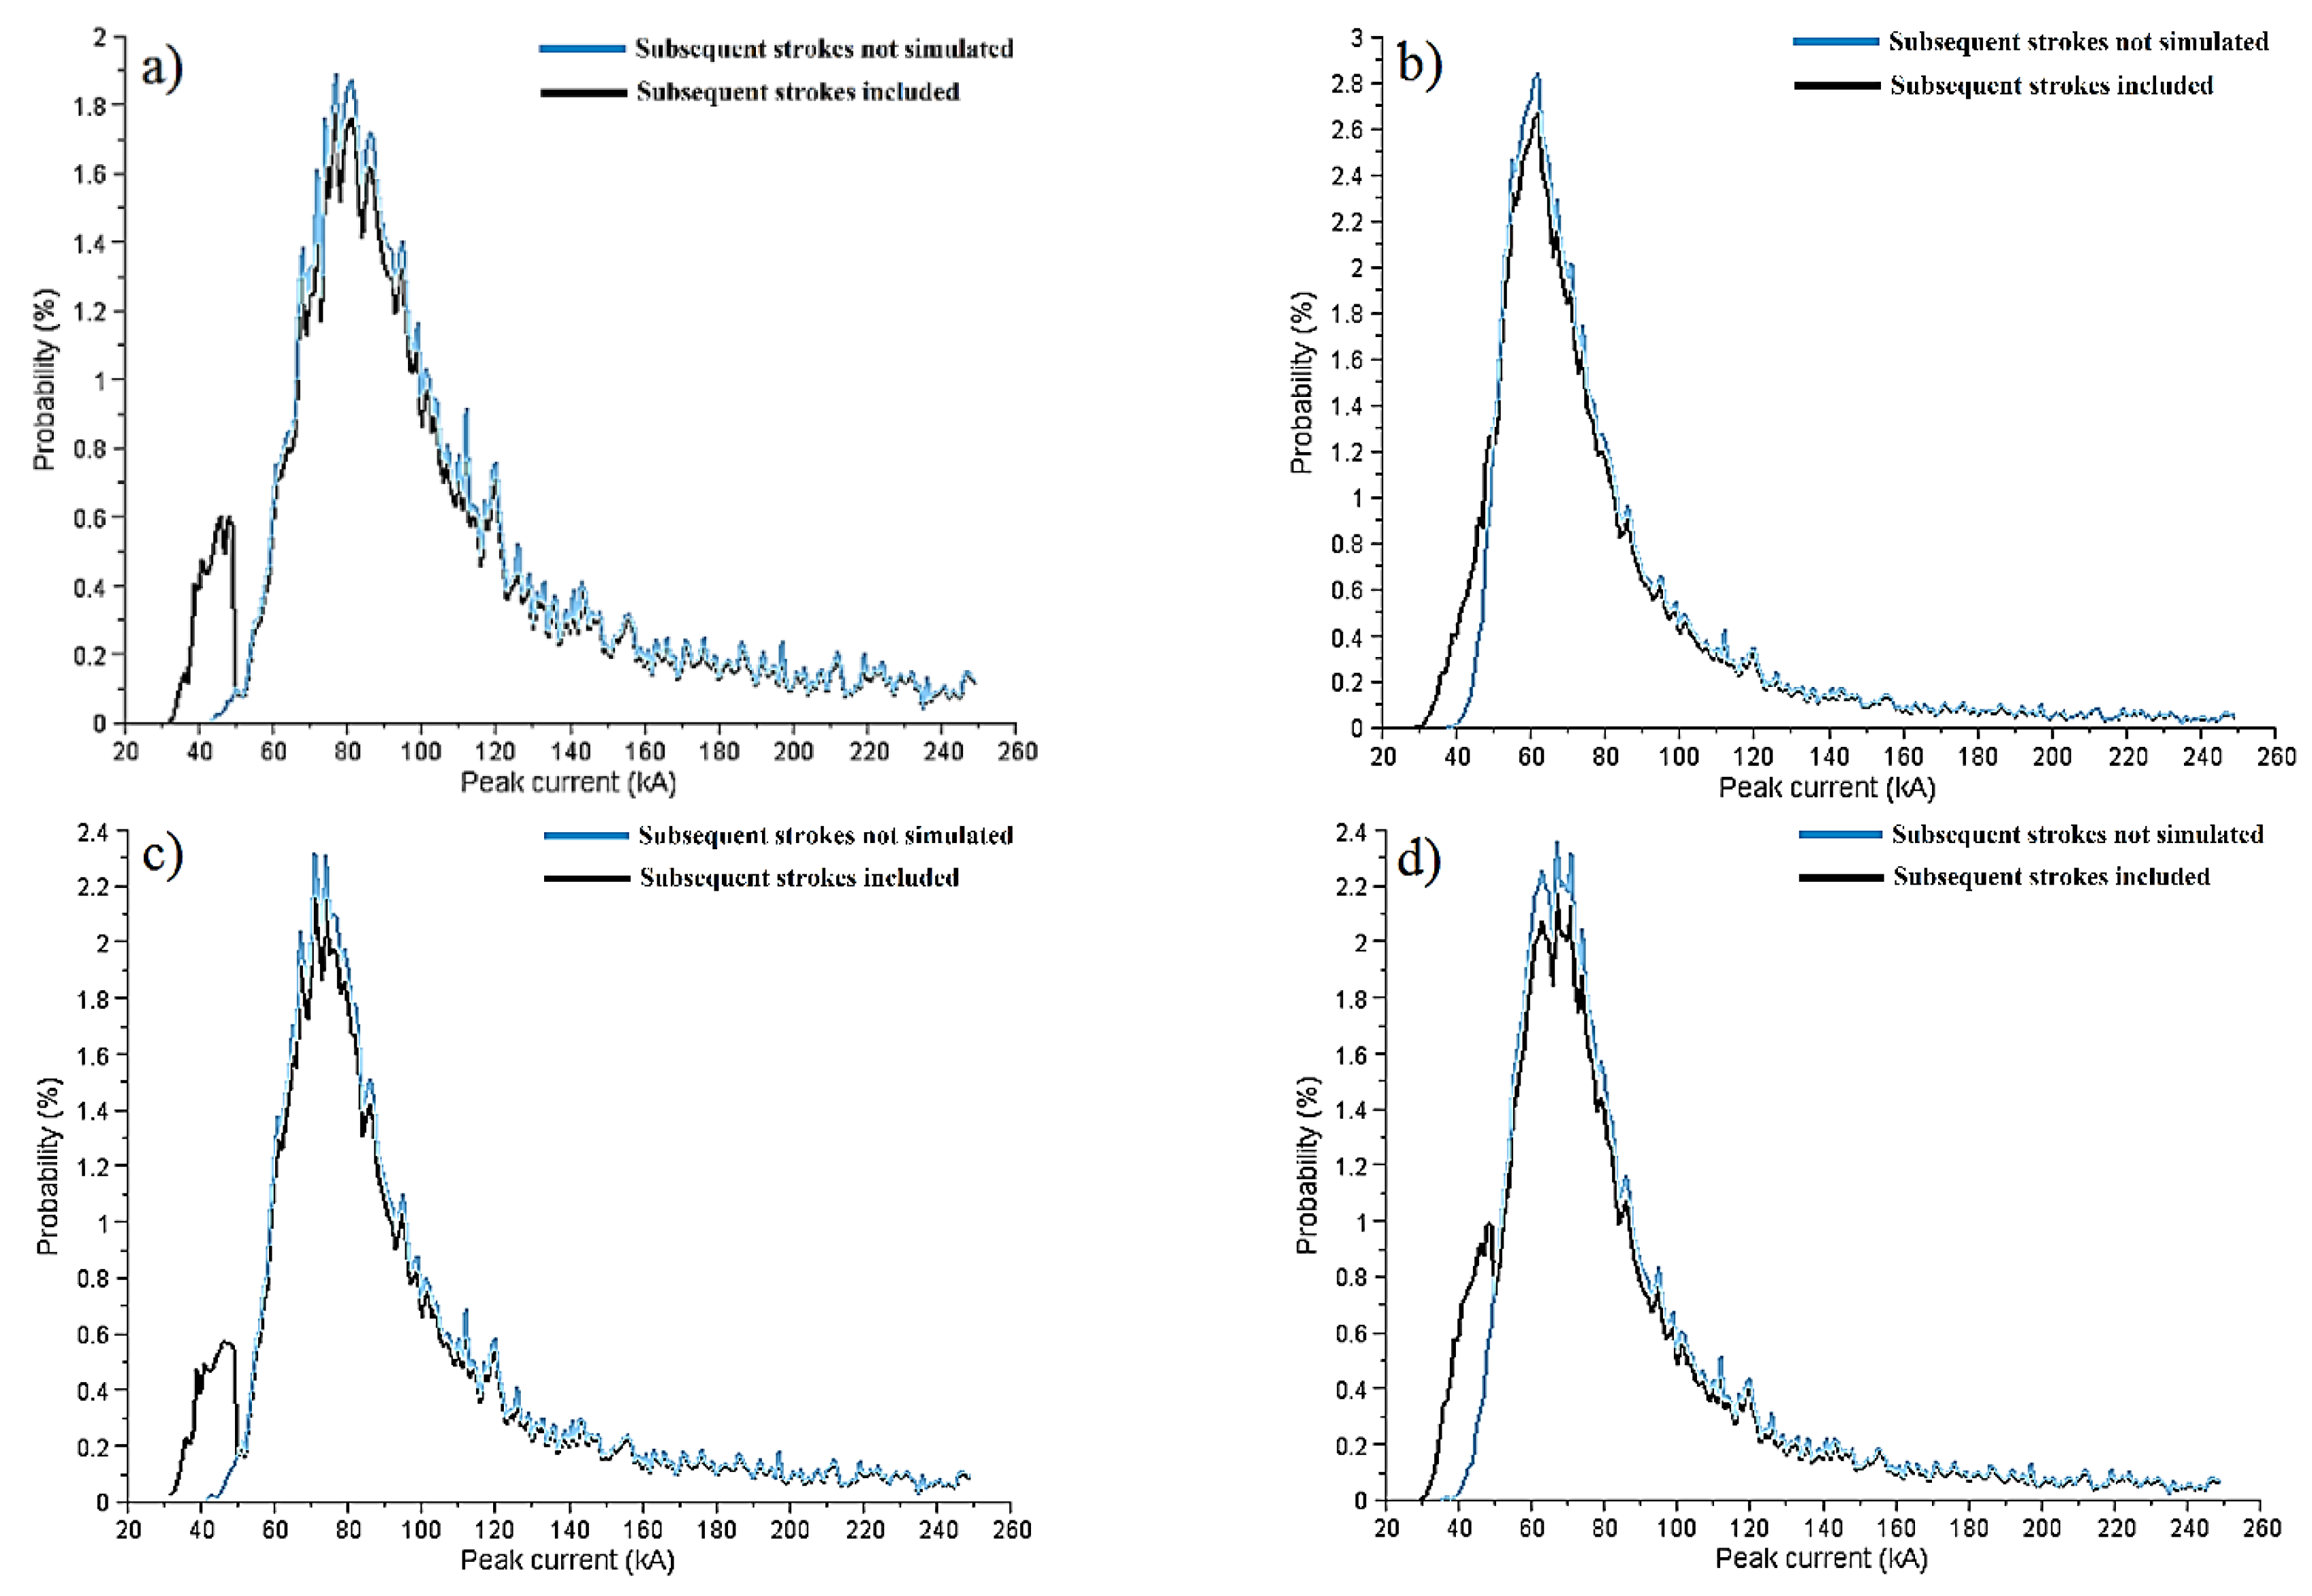
- for spatially extended grounding systems, the impact of subsequent strokes on BFR depends on the grounding system behavior at high frequencies and is not related to its R@50Hz value. Moreover, the qualitative trend found for concentrated grounding systems does not appear: the impact of subsequent strokes is generally smaller (in relative terms) than for concentrated ones, but not negligible. The largest BFR increase is found in conjunction with the predominantly inductive "counterpoise" grounding system GS 7, caused by the steeper subsequent stroke lightning waves with respect to first strokes, reflecting on a larger contribution to the ground potential rise.
6. Conclusions
Author Contributions
Conflicts of Interest
References
- Geri, A. Behaviour of grounding systems excited by high impulse currents: The model and its validation. IEEE Trans. Power Deliv. 1999, 14, 1008–1017. [Google Scholar] [CrossRef]
- Mentre, F.E.; Grcev, L. EMTP-based model for grounding system analysis. IEEE Trans. Power Deliv. 2005, 20, 2200–2210. [Google Scholar] [CrossRef]
- Cidras, J.; Otero, A.F.; Garrido, C. Nodal frequency analysis of grounding systems considering the soil ionization effect. IEEE Trans. Power Deliv. 2000, 15, 103–107. [Google Scholar] [CrossRef]
- Visacro, S.; Soares, A. HEM: A model for simulation of lightning-related engineering problems. IEEE Trans. Power Deliv. 2005, 20, 1206–1208. [Google Scholar] [CrossRef]
- CIGRE Working Group 01 of SC 33. Guide to Procedures for Estimating the Lightning Performance of Transmission Lines; International Council on Large Electric Systems: Paris, France, 1991. [Google Scholar]
- IEEE Working Group. A simplified method for estimating lightning performance of transmission lines. IEEE Trans. Power App. Syst. 1985, 104, 919–932. [Google Scholar]
- IEEE Working Group. Estimating lightning performance of transmission lines II—Updates to analytical models. IEEE Trans. Power Deliv. 1993, 8, 1254–1267. [Google Scholar]
- Anderson, J.G. Monte Carlo computer calculation of transmission line lightning performance. IEEE Trans. Power App. Syst. 1961, 80, 414–419. [Google Scholar] [CrossRef]
- Sargent, M.A.; Darveniza, M. The calculation of double circuit outage rate of transmission lines. IEEE Trans. Power App. Syst. 1967, 86, 665–678. [Google Scholar] [CrossRef]
- Darveniza, M.; Sargent, M.A.; Limbourn, G.J.; Liew, A.C.; Caldwell, R.O.; Currie, J.R.; Holcombe, B.C.; Stillman, R.H.; Frowd, R. Modeling for lightning performance calculations. IEEE Trans. Power App. Syst. 1979, 98, 1900–1908. [Google Scholar] [CrossRef]
- Ekonomou, L.; Gonos, I.F.; Stathopulos, I.A. An improved backflashover model for estimating the lightning performance of transmission lines. In Proceedings of the 38th International Universities Power Engineering Conference (UPEC), Thessaloniki, Greece, 1–3 September 2003; pp. 109–112.
- Ekonomou, L.; Gonos, I.F.; Stathopulos, I.A.; Dialynas, E.N. A backflashover model for calculating the transmission lines lightning performance. In Proceedings of the 12th International Symposium on High-Voltage Engineering (ISH), Bangalore, India, 20–24 August 2001.
- Martinez, J.A.; Castro-Aranda, F. Lightning performance analysis of overhead transmission lines using the EMTP. IEEE Trans. Power Deliv. 1994, 9, 1838–1849. [Google Scholar] [CrossRef]
- Gatta, F.M.; Geri, A.; Lauria, S.; Maccioni, M. Equivalent Lumped Parameter Π-Network of Typical Grounding Systems for Linear and Non-Linear Transient Analysis. In Proceedings of the 2009 IEEE Bucharest Powertech, Bucharest, Romania, 28 June–2 July 2009; pp. 1–6.
- Gatta, F.M.; Geri, A.; Lauria, S.; Maccioni, M. Simplified HV tower grounding system model for backflashover simulation. In Proceedings of the 30th International Conference on Lightning Protection (ICLP), Cagliari, Italy, 13–17 September 2010; Volume 85, pp. 16–23.
- Gatta, F.M.; Geri, A.; Lauria, S.; Maccioni, M. Simplified HV tower grounding system model for backflashover simulation. Electr. Power Syst. Res. 2012, 85, 16–23. [Google Scholar] [CrossRef]
- Gatta, F.M.; Geri, A.; Lauria, S.; Maccioni, M. Generalized pi-circuit tower grounding model for direct lightning response simulation. Electr. Power Syst. Res. 2014, 116, 330–337. [Google Scholar] [CrossRef]
- Silveira, F.H.; Visacro, S.; De Conti, A.; de Mesquita, C.R. Backflashovers of Transmission Lines Due to Subsequent Lightning Strokes. IEEE Trans. Electromagn. Compat. 2012, 54, 316–322. [Google Scholar] [CrossRef]
- Silveira, F.H.; Visacro, S.; de Souza, R.E.; De Conti, A. Assessing the Impact of Subsequent Strokes on the Lightning Performance of Transmission Lines of 138 kV. In Proceedings of the 2012 International Conference on Lightning Protection (ICLP), Vienna, Austria, 2–7 September 2012.
- Silveira, F.H.; Visacro, S.; De Conti, A. Lightning Performance of 138-kV Transmission Lines: The Relevance of Subsequent Strokes. IEEE Trans. Electromagn. Compat. 2013, 55, 1195–1200. [Google Scholar] [CrossRef]
- Gatta, F.M.; Geri, A.; Lauria, S.; Maccioni, M.; Santarpia, A. An ATP-EMTP Monte Carlo procedure for backflashover rate evaluation. In Proceedings of the 2012 International Conference on Lightning Protection (ICLP), Vienna, Austria, 2–7 September 2012.
- Gatta, F.M.; Geri, A.; Lauria, S.; Maccioni, M.; Santarpia, A. An ATP-EMTP Monte Carlo procedure for backflashover rate evaluation: A comparison with the CIGRE method. Electr. Power Syst. Res. 2014, 113, 134–140. [Google Scholar] [CrossRef]
- Gatta, F.M.; Geri, A.; Lauria, S.; Maccioni, M.; Palone, F. Tower grounding improvement vs. line surge arresters: comparison of remedial measures for high-BFOR subtransmission lines. IEEE Trans. Ind. Appl. 2015, 51, 4952–4960. [Google Scholar] [CrossRef]
- Chowdhuri, P.; Anderson, J.G.; Chisholm, W.A.; Field, T.E.; Ishii, M.; Martinez, J.A.; Marz, M.B.; McDaniel, J.; McDermott, T.R.; Mousa, A.M.; et al. Parameters of lightning strokes: A review. IEEE Trans. Power Deliv. 2005, 20, 346–358. [Google Scholar]
- Eriksson, A.J. An Improved Electrogeometric Model for Transmission-Line Shielding Analysis. IEEE Trans. Power Deliv. 1987, 2, 871–886. [Google Scholar] [CrossRef]
- Hileman, A.R. Insulation Coordination for Power Systems, 1st ed.; Marcel Dekker, Inc.: New York, NY, USA, 1999. [Google Scholar]
- Gatta, F.M.; Geri, A.; Lauria, S.; Maccioni, M. Backflashover simulation of HV transmission lines with enhanced counterpoise groundings. Electr. Power Syst. Res. 2009, 79, 1076–1084. [Google Scholar]
- Alternative Transients Program (ATP) Rule Book. Canadian/American EMTP User Group, Oregon, USA, 1995.
- Heidler, F.; Cvetić, J.M.; Stanić, B.V. Calculation of lightning current parameters. IEEE Trans. Power Deliv. 1999, 14, 399–404. [Google Scholar]
- Araneo, R.; Maccioni, M.; Lauria, S.; Geri, A.; Gatta, F.M.; Celozzi, S. Hybrid and Pi-Circuit Approaches for Grounding System Lightning Response. In Proceedings of the 2015 IEEE Eindhoven Powertech, Eindhoven, Netherlands, 29 June–2 July 2015; pp. 1–6.
- Anderson, R.B.; Eriksson, A.J. A Summary of Lightning Parameters for Engineering Applications. In Proceedings of the International Council on Large Electric Systems, Paris, France, August 1980.
- Gatta, F.M.; Geri, A.; Lauria, S.; Maccioni, M. Monte Carlo Evaluation of the Impact of Subsequent Strokes on Backflashover Rate. In Proceedings of the 2015 IEEE International Conference on Environment and Electrical Engineering (EEEIC), Rome, Italy, 10–13 June 2015; pp. 1210–1215.


| Grounding system configuration | Soil resistivity ρg (Ω·m) | Soil relative permittivity εr | Burying depth (m) | R@50Hz (Ω) |
|---|---|---|---|---|
| GS 1 | 100 | 50 | 0.8 | 6.3 |
| GS 2 | 100 | 50 | 0.8 | 11.42 |
| GS 3 | 500 | 43 | 0.8 | 14.95 |
| GS 4 | 1000 | 35 | 0.8 | 19.1 |
| GS 5 | 2000 | 19 | 0.8 | 30.4 |
| GS 6 | 1000 | 35 | 0.8 | 24.05 |
| GS 7 | 2000 | 19 | 0.8 | 24.5 |
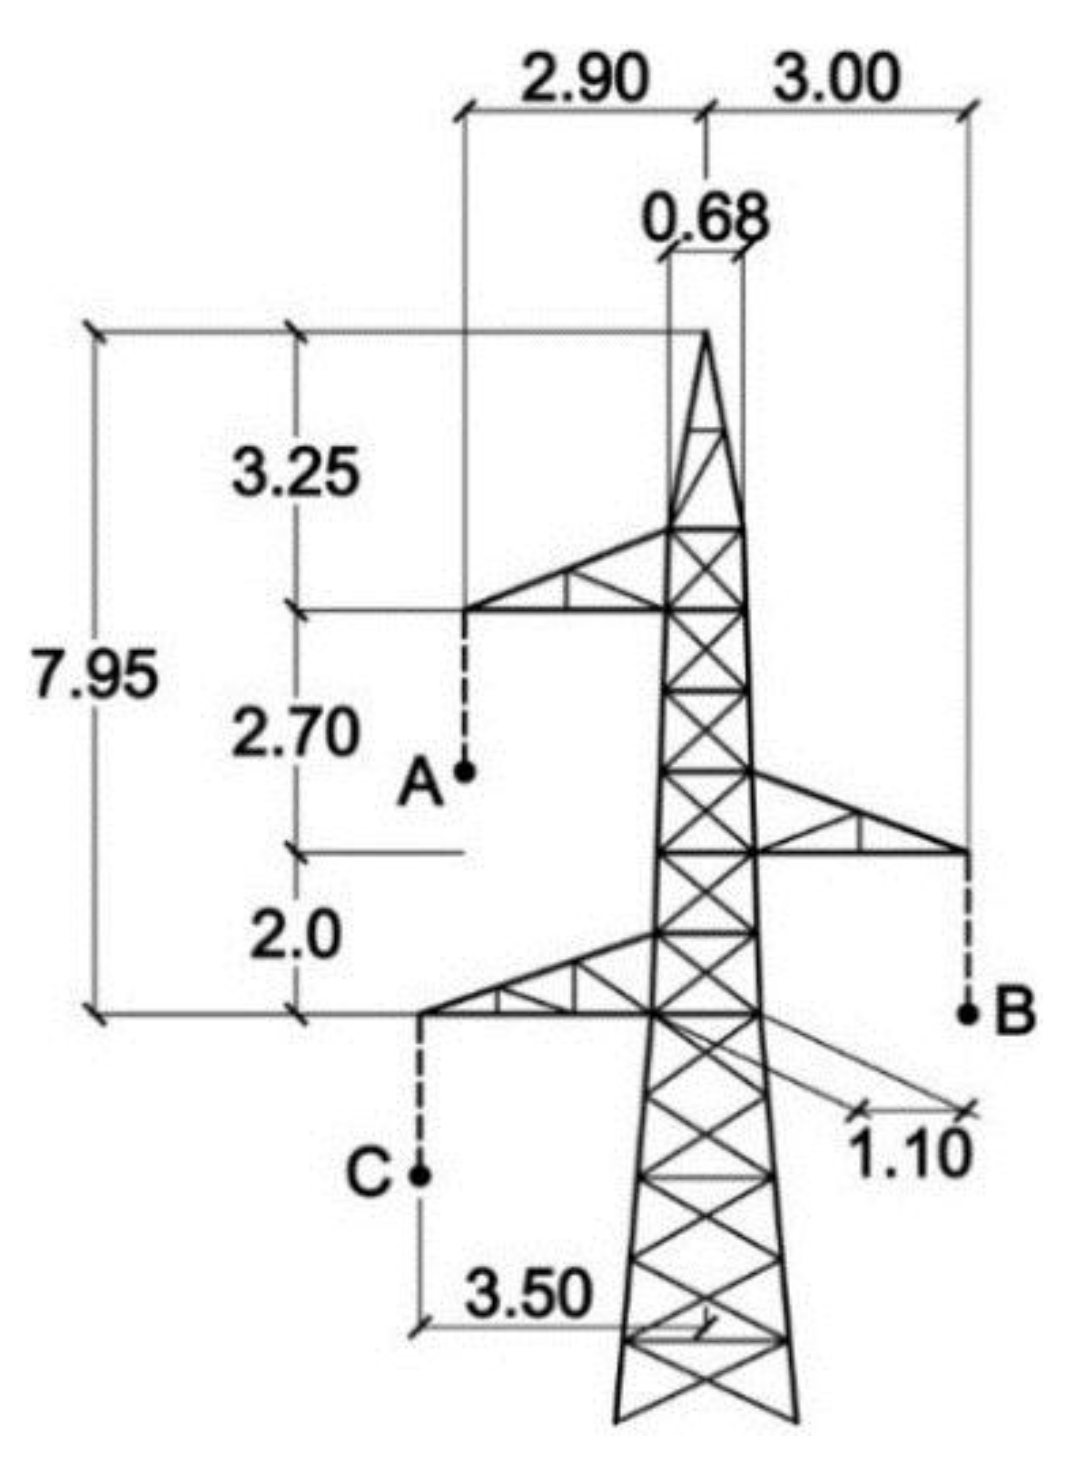
| Coordinate | A | B | C | SW |
|---|---|---|---|---|
| x (m) | −2.9 | 3 | −3.5 | 0 |
| y (m) | 25.4 | 23.4 | 21.4 | 31.1 |
| Grounding System | R1 (Ω) | R2 (Ω) | R (Ω) | L (μH) | C1 (nF) | C2 (nF) |
|---|---|---|---|---|---|---|
| GS 1 | 27.7 | 1.65 | 6.55 | 0.32 | 0.66 | 25 |
| GS 2 | 14.4 | 10.9 | 44.09 | 5.47 | 0.01 | 15.7 |
| GS 3 | 32.1 | 25.9 | 2.22 | 4.85 | 3.18 | 8.66 |
| GS 4 | 34.12 | 43.27 | 0 | 12.5 | 3.32 | 9 |
| GS 5 | 42.49 | 69.39 | 37.54 | 10.2 | 6.78 | 12.5 |
| GS 6 | 28.75 | 137.35 | 9.54 | 12.5 | 1.08 | 5.67 |
| GS 7 | 40.96 | 60.99 | 0.07 | 28.2 | 2.89 | 10.5 |
| Grounding System | α1 (Ω) | α2 (Ω) | β1 (A−1) | β2 (A−1) |
|---|---|---|---|---|
| GS 1 | 1.204 | 0.045 | 326.6 | 163.1 |
| GS 2 | 0.7 | 0.7 | 0.633 | 850.5 |
| GS 3 | 0.322 | 0.63 | 0.633 | 850.5 |
| GS 4 | 0.406 | 0.285 | 1654.9 | 931.0 |
| GS 5 | 0.005 | 3.142 | 1090.7 | 1847.6 |
| GS 6 | 0.419 | 4.915 | 3.685 | 172.9 |
| GS 7 | 0 | 2.832 | 200.1 | 0.074 |
| Parameter | Median Value | Standard Deviation | ||
|---|---|---|---|---|
| − | + | − | + | |
| IP | 31.1 kA | 35 kA | 0.48 | 1.21 |
| tF | 3.83 μs | 22 μs | 0.55 | 1.23 |
| tH | 77.5 μs | 230 μs | 0.58 | 1.33 |
| Parameter | Median Value | Standard deviation |
|---|---|---|
| IP | 12.3 kA | 0.5296 |
| tF | 0.67 μs | 1.0131 |
| tH | 30.2 μs | 0.93 |
| Number of Strokes per Flash | Frequency of Occurrence (%) | Number of Strokes per Flash | Frequency of Occurrence (%) |
|---|---|---|---|
| 1 | 45 | 6 | 4 |
| 2 | 14 | 7 | 3 |
| 3 | 9 | 8 | 3 |
| 4 | 8 | 9 | 2 |
| 5 | 8 | 10 or more | 4 |
| Polarity | Median Value (kV/m) | Standard Deviation (kV/m) |
|---|---|---|
| − | 605 | 18.15 |
| + | 560 | 16.80 |
| Grounding System Arrangement | R@50Hz (Ω) | Minimum Current Causing Backflashover Single Flash | Minimum Current Causing Backflashover Multiple Flash | ||
|---|---|---|---|---|---|
| IP (kA) | tF (μs) | IP (kA) | tF (μs) | ||
| GS 1 | 6.3 | 48.83 | 0.51 | 34.73 | 0.29 |
| GS 2 | 11.42 | 45.11 | 0.59 | 34.73 | 0.29 |
| GS 3 | 14.95 | 43.71 | 0.53 | 34.02 | 0.23 |
| GS 4 | 19.07 | 43.71 | 0.53 | 32.28 | 0.24 |
| GS 6 | 24.05 | 41.91 | 0.61 | 32.11 | 0.23 |
| GS 7 | 24.5 | 35.10 | 0.41 | 29.03 | 0.21 |
| GS 5 | 30.4 | 37.23 | 0.63 | 29.03 | 0.21 |
| Grounding System Arrangement | 100·(NBFO/Ntot) Single Flash | 100·(NBFO/Ntot) Multiple Flash | Δ (%) |
|---|---|---|---|
| GS 1 | 0.16 | 0.199 | +24.375 |
| GS 2 | 0.667 | 0.765 | +14.69 |
| GS 3 | 0.781 | 0.844 | +8.06 |
| GS 4 | 1.454 | 1.545 | +6.26 |
| GS 6 | 1.971 | 2.101 | +6.60 |
| GS 7 | 2.678 | 2.913 | +8.78 |
| GS 5 | 3.373 | 3.594 | +6.55 |
© 2016 by the authors; licensee MDPI, Basel, Switzerland. This article is an open access article distributed under the terms and conditions of the Creative Commons by Attribution (CC-BY) license (http://creativecommons.org/licenses/by/4.0/).
Share and Cite
Gatta, F.M.; Geri, A.; Lauria, S.; Maccioni, M. Monte Carlo Evaluation of the Impact of Subsequent Strokes on Backflashover Rate. Energies 2016, 9, 139. https://doi.org/10.3390/en9030139
Gatta FM, Geri A, Lauria S, Maccioni M. Monte Carlo Evaluation of the Impact of Subsequent Strokes on Backflashover Rate. Energies. 2016; 9(3):139. https://doi.org/10.3390/en9030139
Chicago/Turabian StyleGatta, Fabio Massimo, Alberto Geri, Stefano Lauria, and Marco Maccioni. 2016. "Monte Carlo Evaluation of the Impact of Subsequent Strokes on Backflashover Rate" Energies 9, no. 3: 139. https://doi.org/10.3390/en9030139
APA StyleGatta, F. M., Geri, A., Lauria, S., & Maccioni, M. (2016). Monte Carlo Evaluation of the Impact of Subsequent Strokes on Backflashover Rate. Energies, 9(3), 139. https://doi.org/10.3390/en9030139