
Economic Viability Study of an On-Road Wireless Charging System with a Generic Driving Range Estimation Method †


Abstract
:
1. Introduction
- Battery swapping [4,6]: the on-board battery is replaced at regular intervals at battery charging stations. The infrastructural costs and required battery capacity are high. While the transport efficiency is more due to a small on-board battery, the increase in required driving range leads to the increase in the number of battery swapping operations.
- Hybrid vehicles [6]: a combination of two or more energy sources are used. The design is complicated, and the vehicle cost is high. Transport efficiency decreases with the increase in on-board energy buffer weight.
2. Generic Methodology for Driving Range Estimation

| Parameter | Value | Unit |
|---|---|---|
| Empty mass | 13,300 | kg |
| Gross mass | 19,000 | kg |
| Frontal area | 8.568 | m |
| Coefficient of drag (assumed) | 0.7 | - |
| Coefficient of rolling resistance (assumed) | 0.01 | - |
| Battery capacity | 600 (200 × 3) | Ah |
| Energy capacity | 324 | kWh |
| Nominal voltage | 540 | V |
| Battery type | lithium ion | - |
| Initial state of charge (SoC) (assumed) | 95% | - |
| Allowed depth of discharge (assumed) | 80% | - |
- Aerodynamic drag () is the load due to resistance offered by the air. ρ is the density of air in kg/m; is the coefficient of drag; vis the instantaneous velocity; and is the frontal area of the vehicle.
- Rolling resistance () is the frictional resistance offered by the road due to the motion of wheels. is the coefficient of rolling resistance; M is the mass of the vehicle; g is the acceleration due to gravity; and θ is the angle of inclination.
- Inertial load () is the change in the stored energy of the vehicle due to dynamic motion (acceleration/braking). It is important to consider here that some energy is recoverable through the regenerative braking.
- Gravitational load () is due to the movement of the vehicle on an inclined road.
- The overall average efficiency of the motor-drive system is assumed to be 80%. A corrective factor corresponding to the ratio of assumed average efficiency to actual average efficiency can be multiplied with the mass and area constant derived in the subsequent section to improve the accuracy of the model.
- Sixty percent of energy is recovered during regenerative braking.
- The angle of inclination of the road is zero.
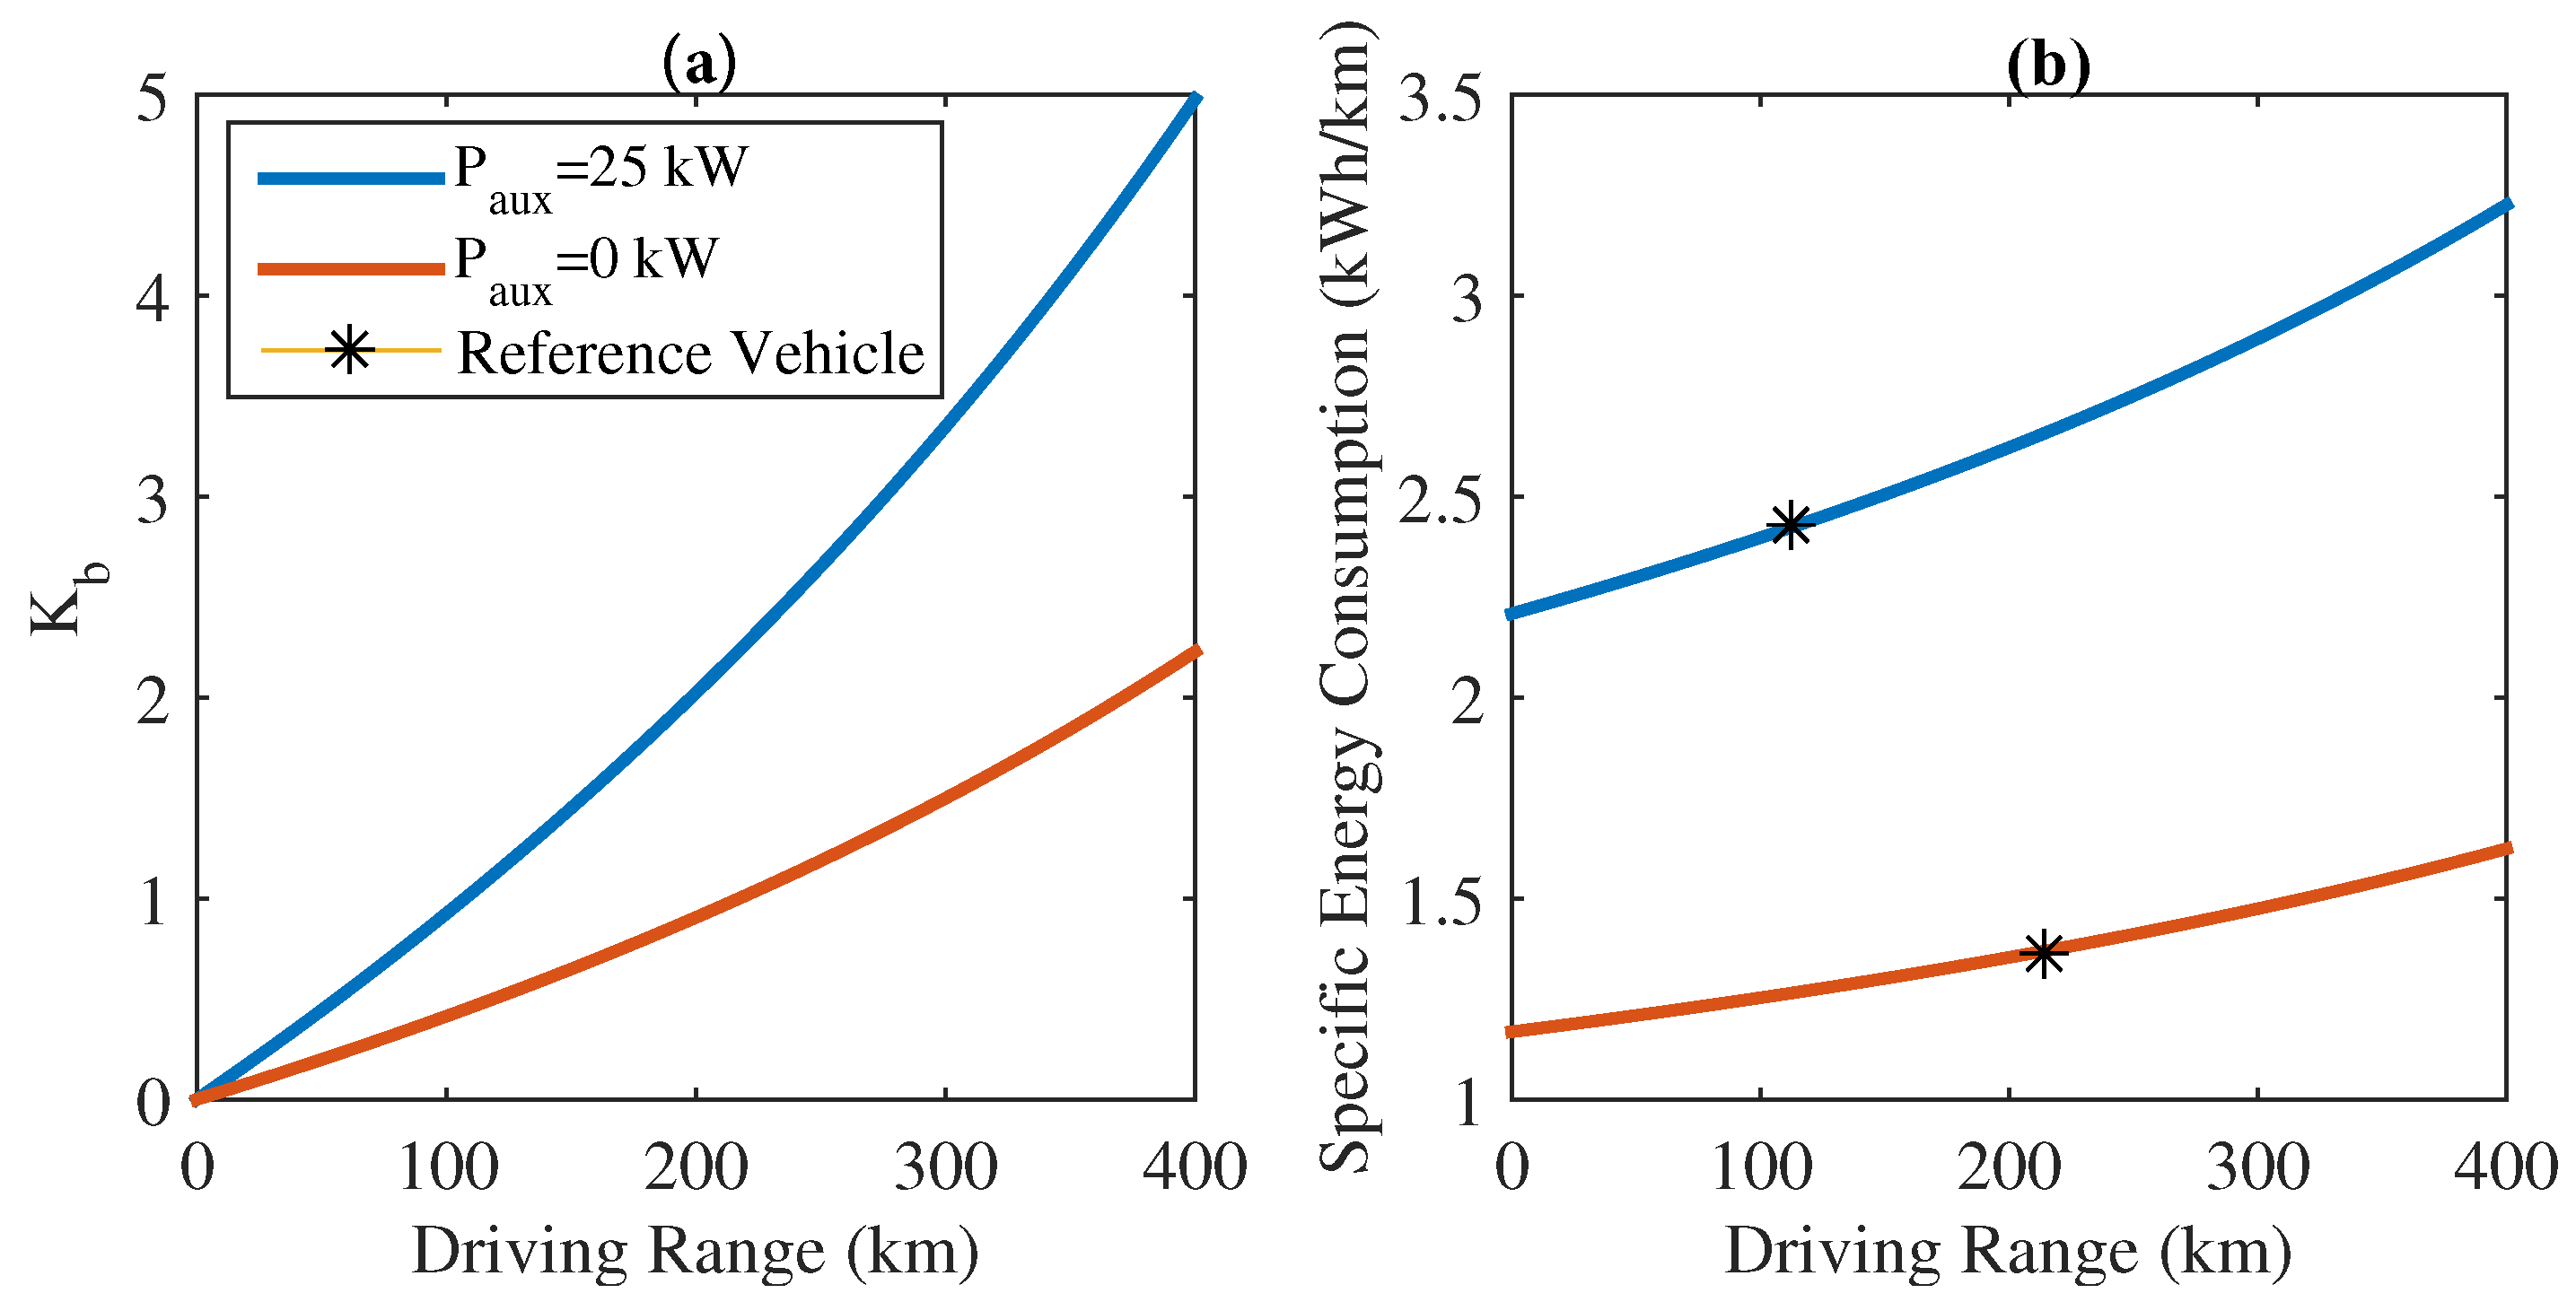
- The auxiliary power P will include heating, ventilation and air conditioning (HVAC), lighting, auxiliary services of vehicle, opening and closing of doors, route display screens, power steering and brakes. In the simulations to derive K and K, 0 kW is considered in order to eliminate the dependence of SoC on P.
- Actual measurements were taken for the 12 m bus with a 324 kWh battery for SORT 1, 2 and 3 cycles. The specific consumption was measured to be 1.2 kWh/km for SORT 3 as compared to 1.3 kWh/km obtained from the simulation of our dynamic power consumption model under similar conditions. This increased the confidence on relying on the developed model for the economic viability study.
2.1. State of Charge Estimation of the Battery-Alone System
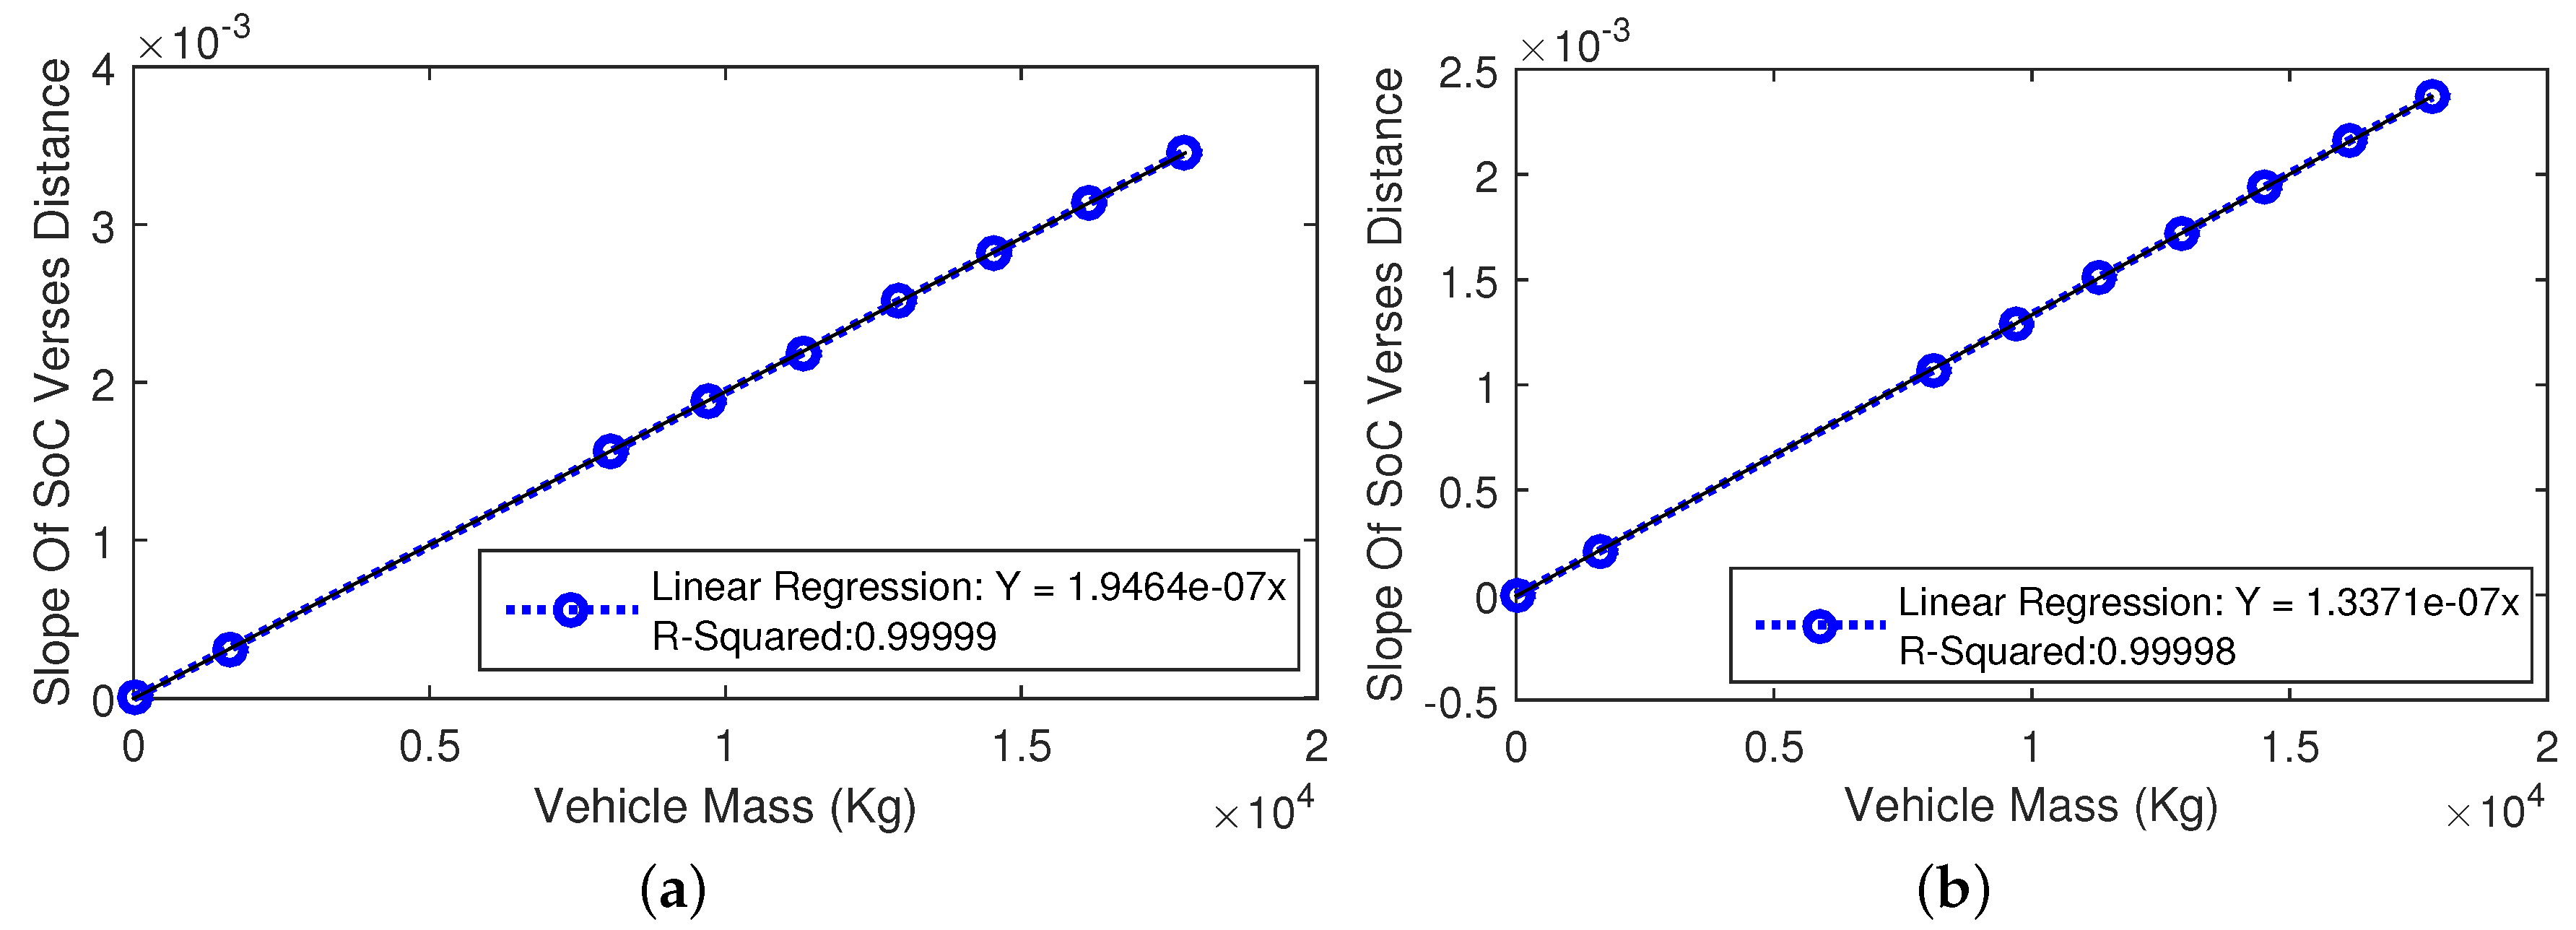
2.1.1. Mass Constant () of the Driving Cycle
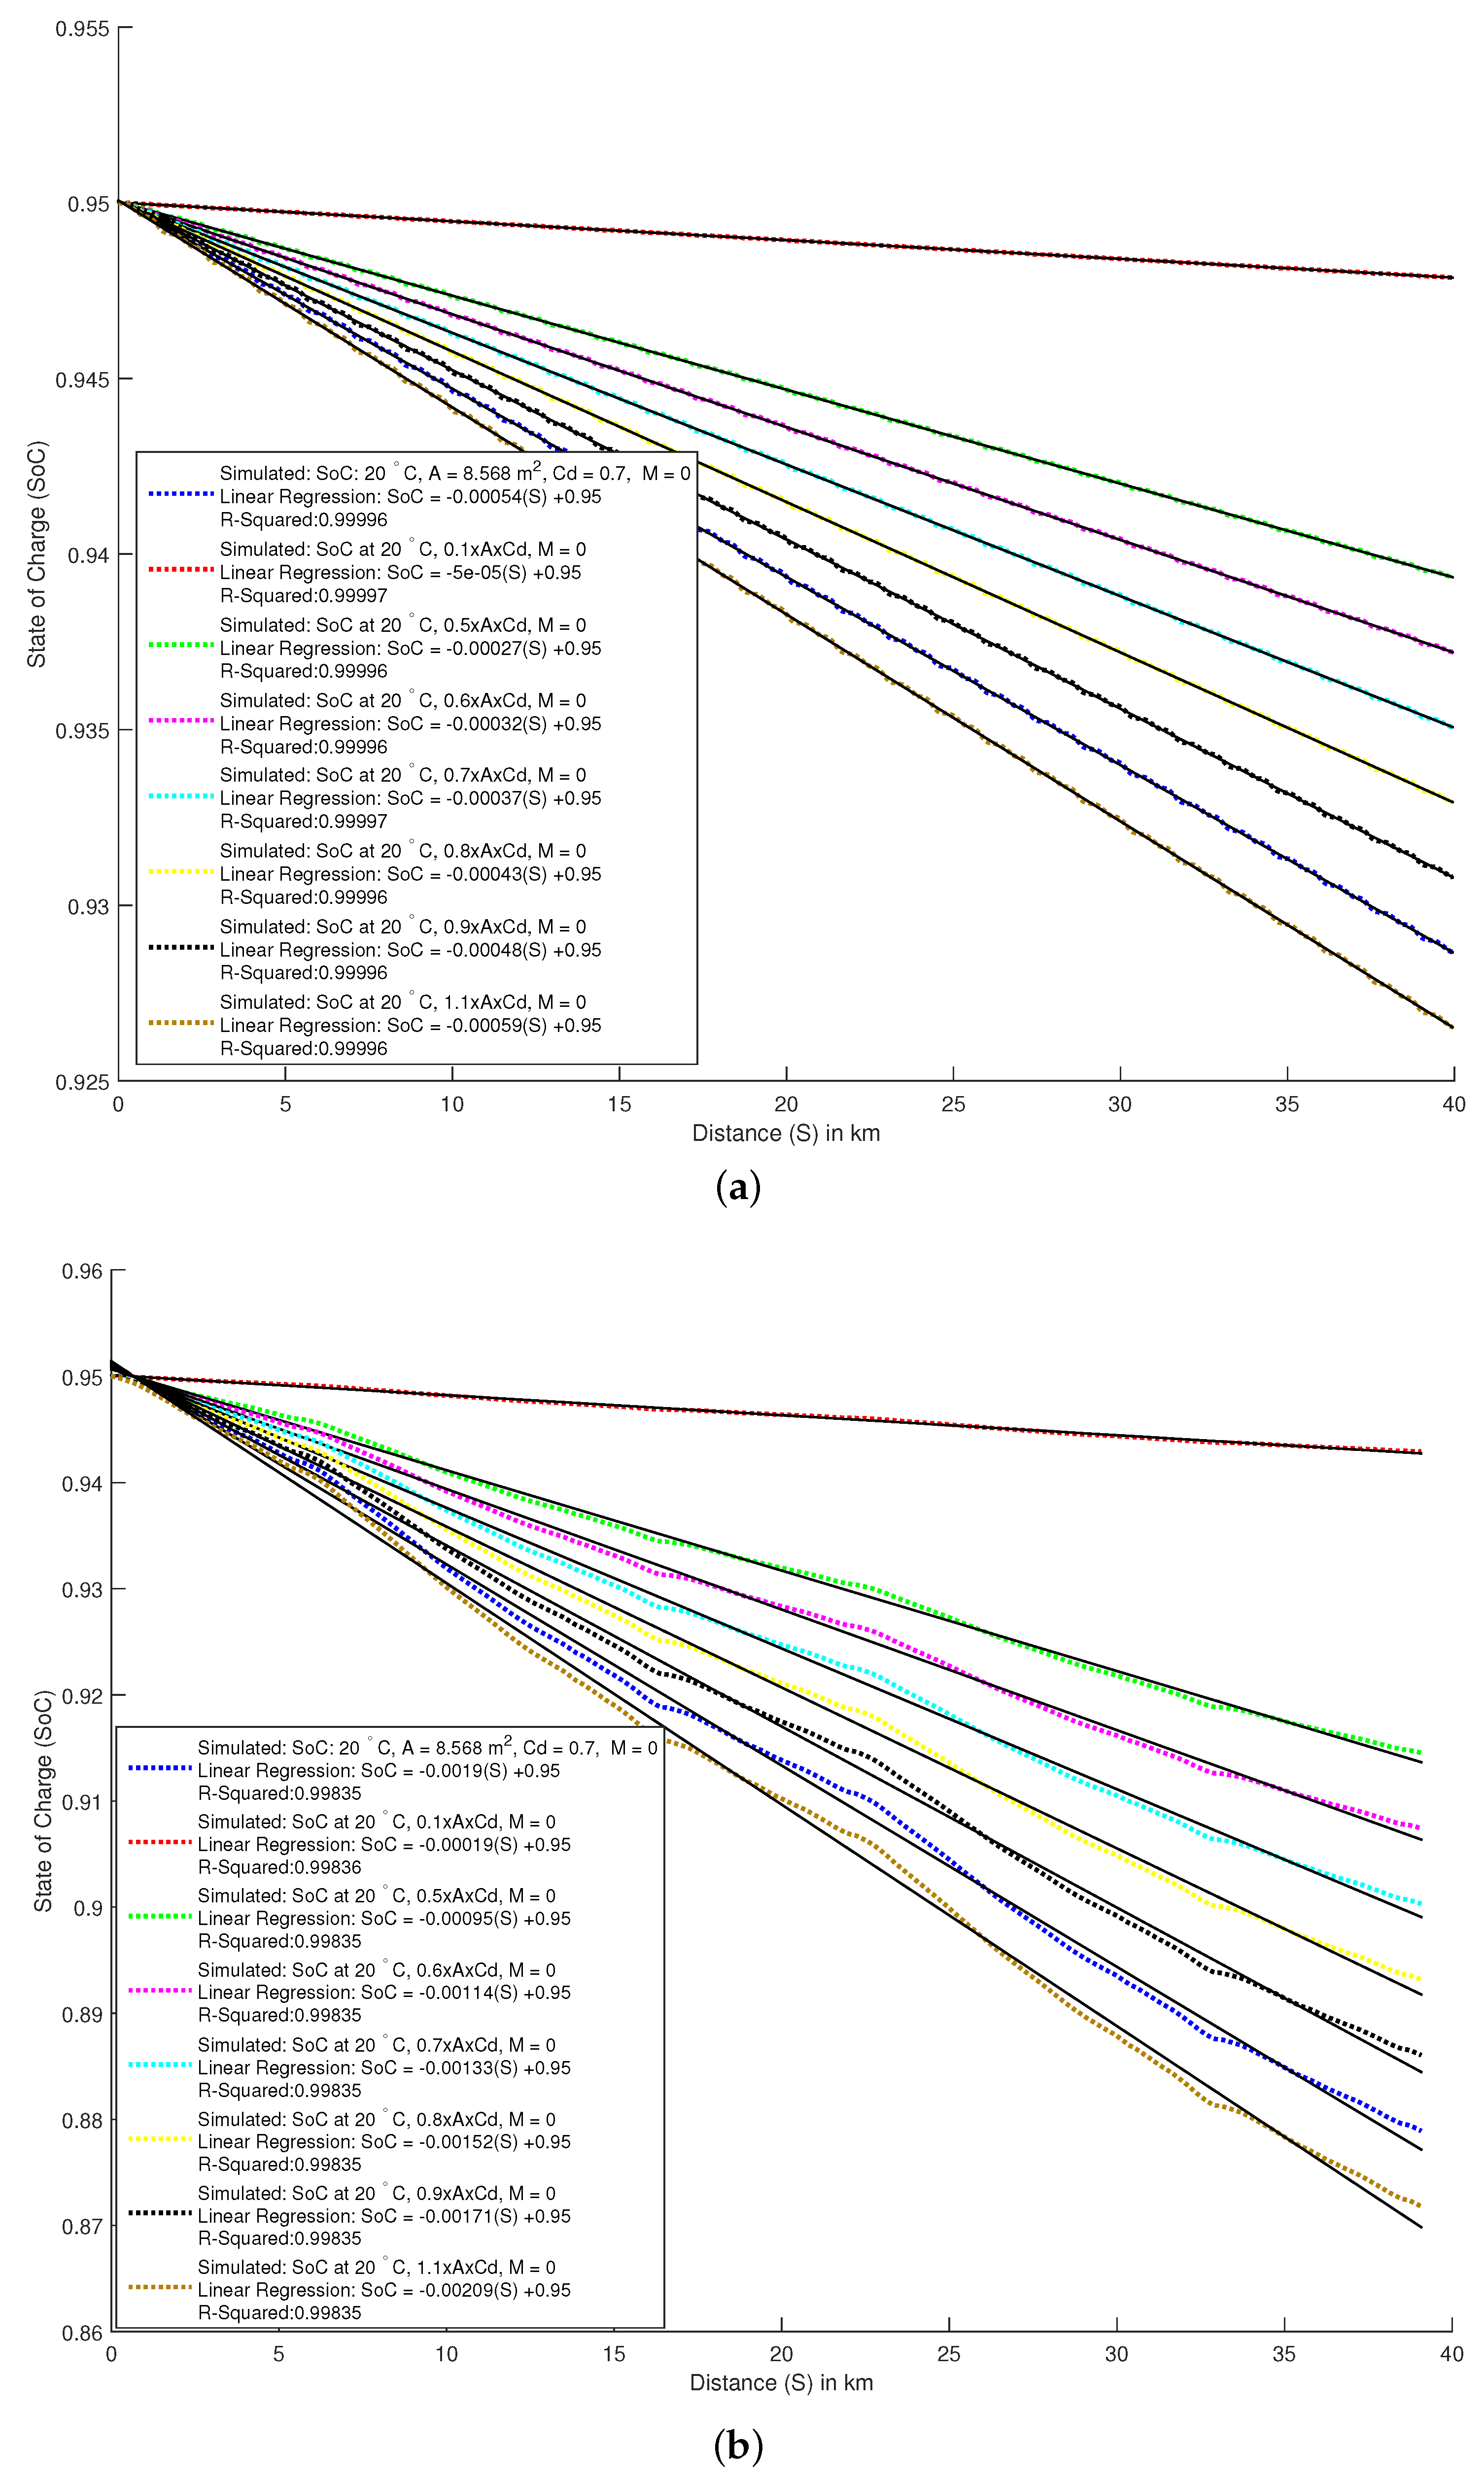
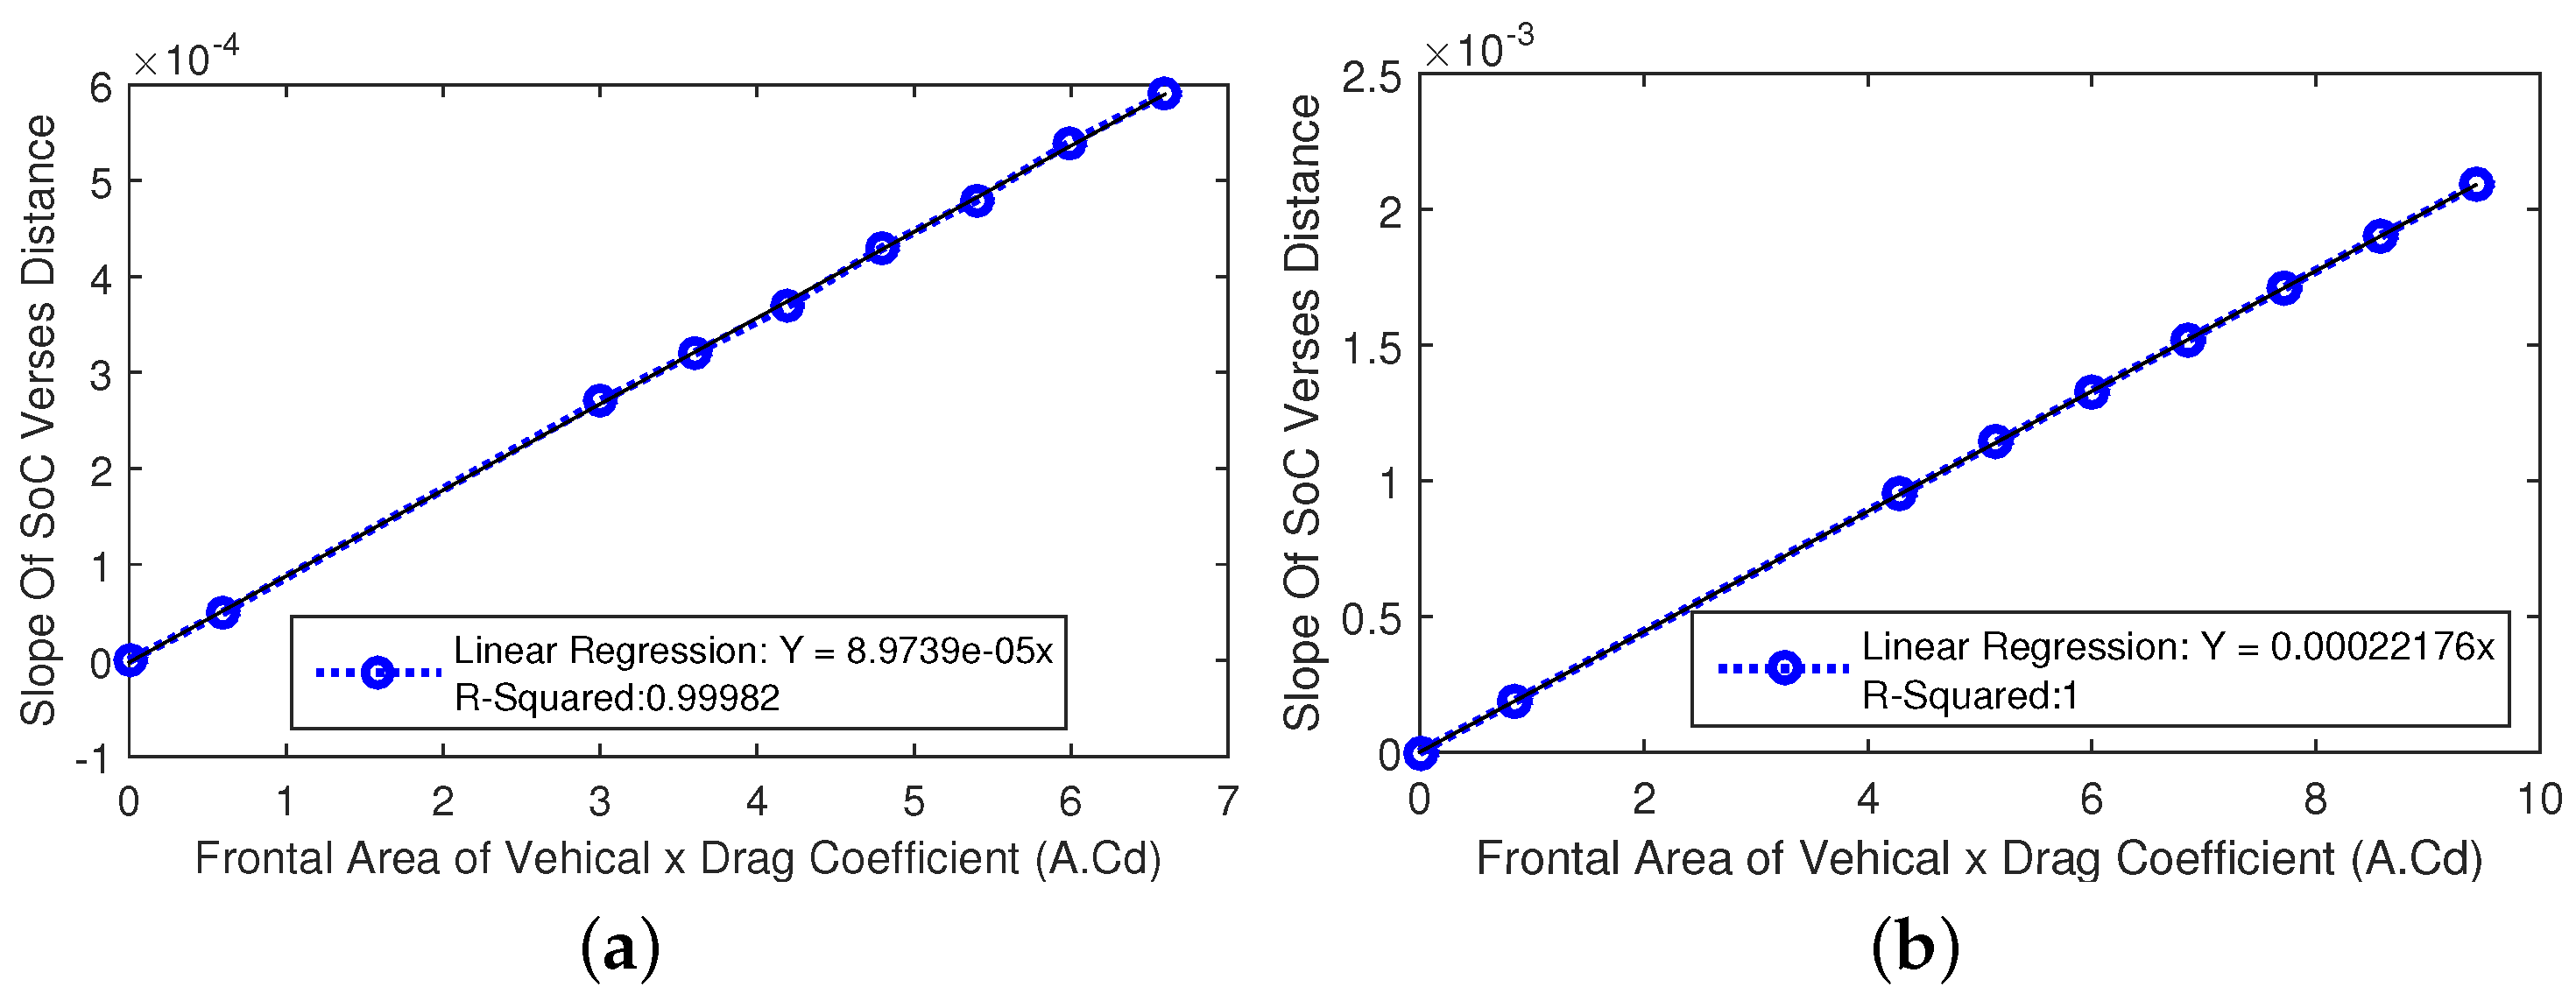
2.1.2. Area Constant () of the Driving Cycle
2.1.3. Equation for State of Charge Estimation of the Battery-Only System

| Driving cycle | () | () | (km/h) |
|---|---|---|---|
| SORT 1 | 2.09234 ×10 | 2.4684 × 10 | 12.1 |
| SORT 2 | 1.9604 ×10 | 4.9201 × 10 | 18 |
| Braunschweig | 2.1225 ×10 | 4.992 × 10 | 22.9 |
| SORT 3 | 1.9464 ×10 | 8.9739 × 10 | 25.3 |
| UDDS | 1.89 ×10 | 9.3371 × 10 | 31.53 |
| HWFET | 1.3371 ×10 | 2.2176 × 10 | 77.73 |
2.2. Driving Range Extension with the Static Inductive Power Transfer System

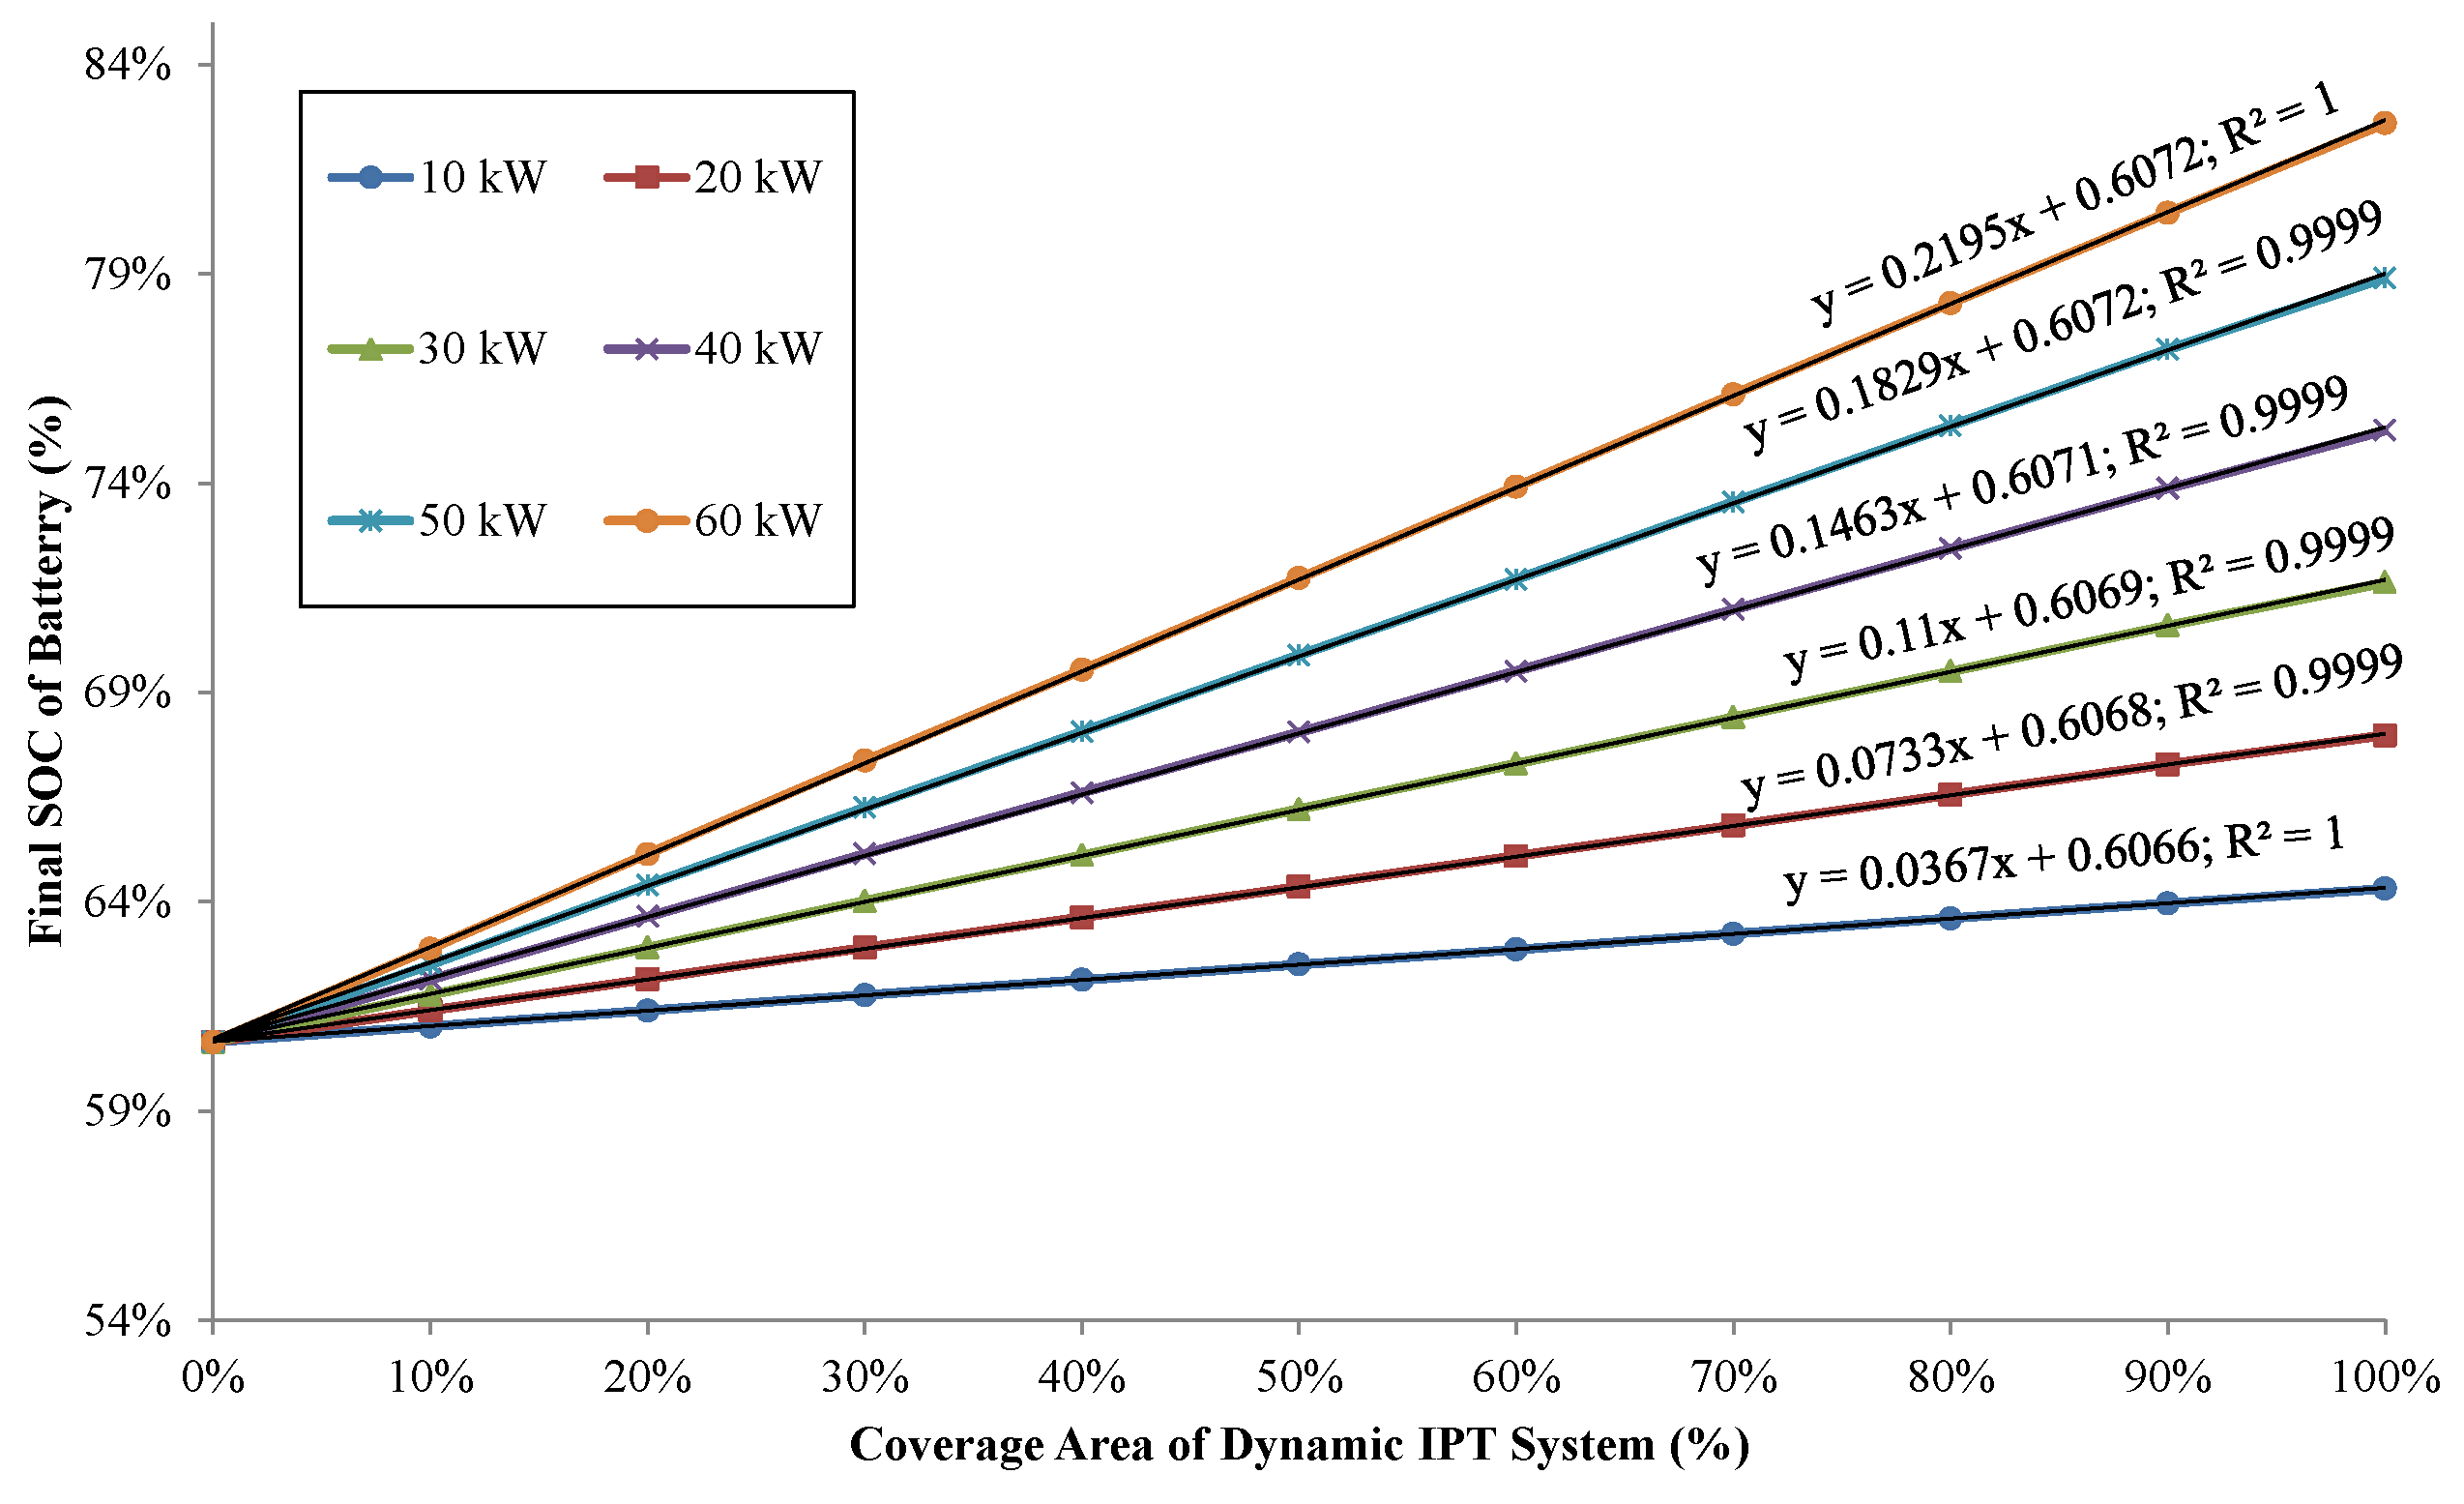
2.3. Driving Range Extension with the Dynamic Inductive Power Transfer System

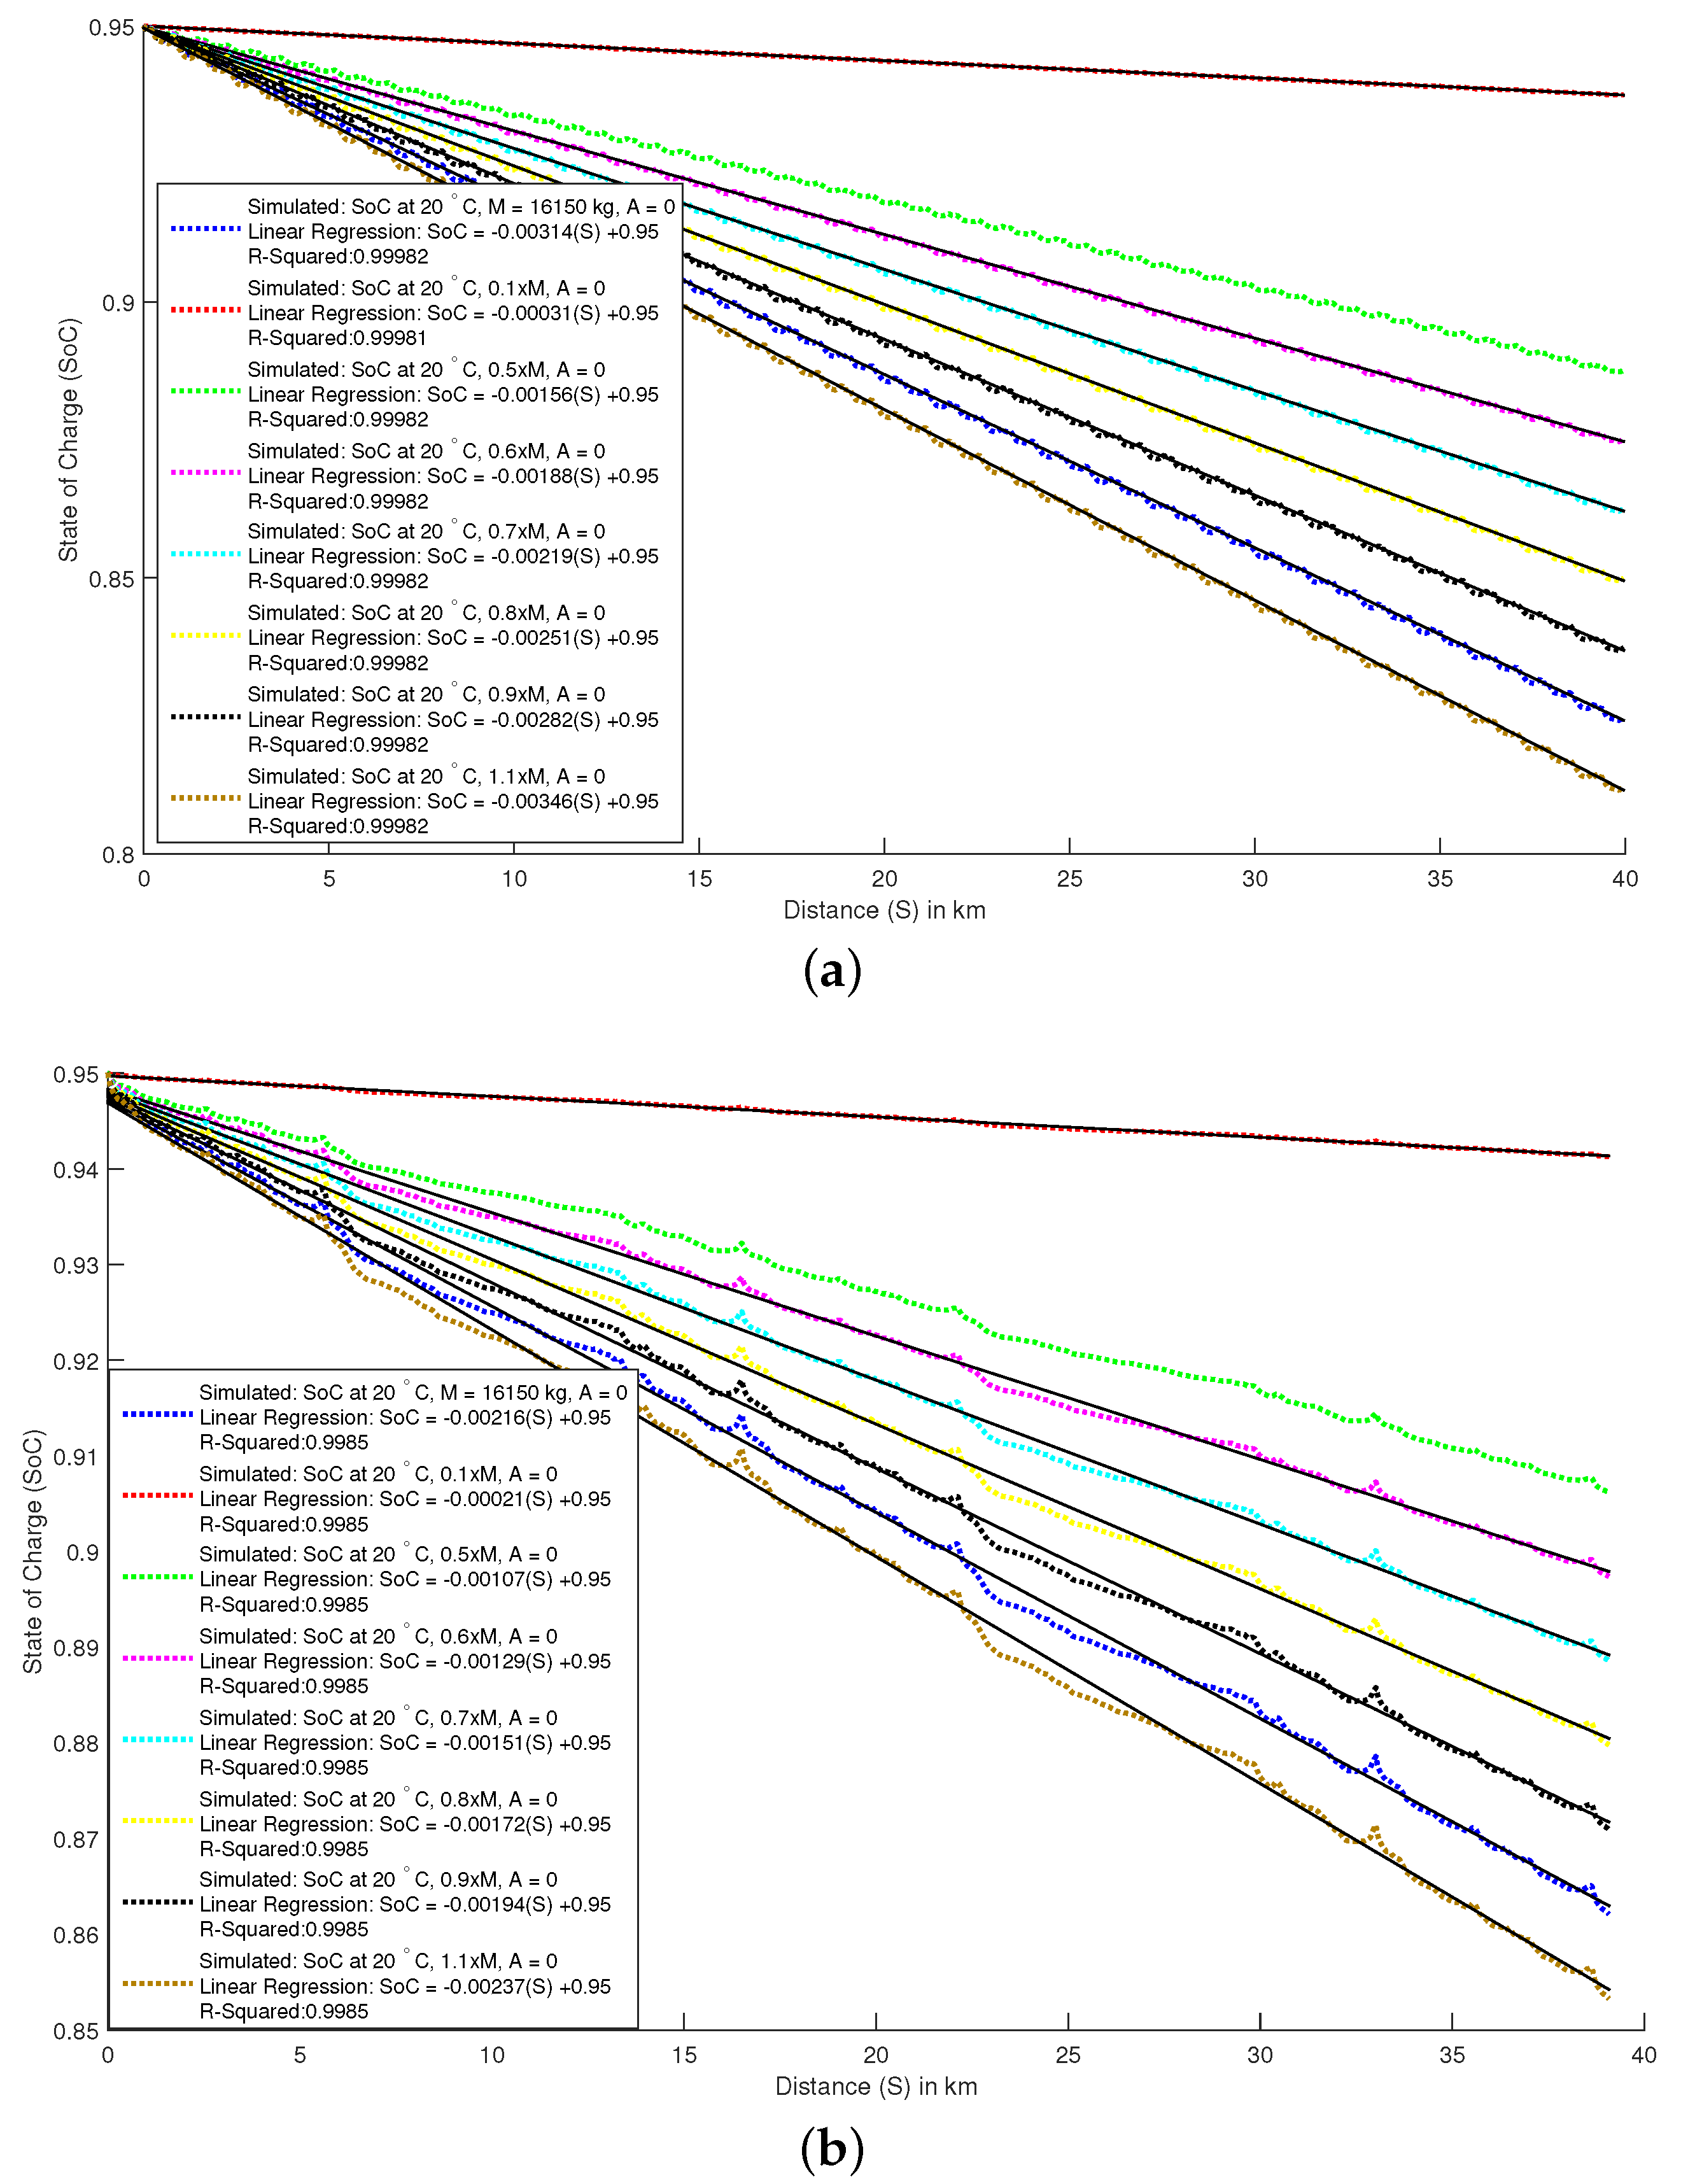
- The final SoC linearly increases with road coverage area despite the randomness in the velocity profile. This is because the IPT system is also randomly distributed on the road track. Regression analysis yields , which indicates a strong correlation.
- The slope is directly proportional to the charging power level of the IPT system.
2.4. Impact of Battery Weight
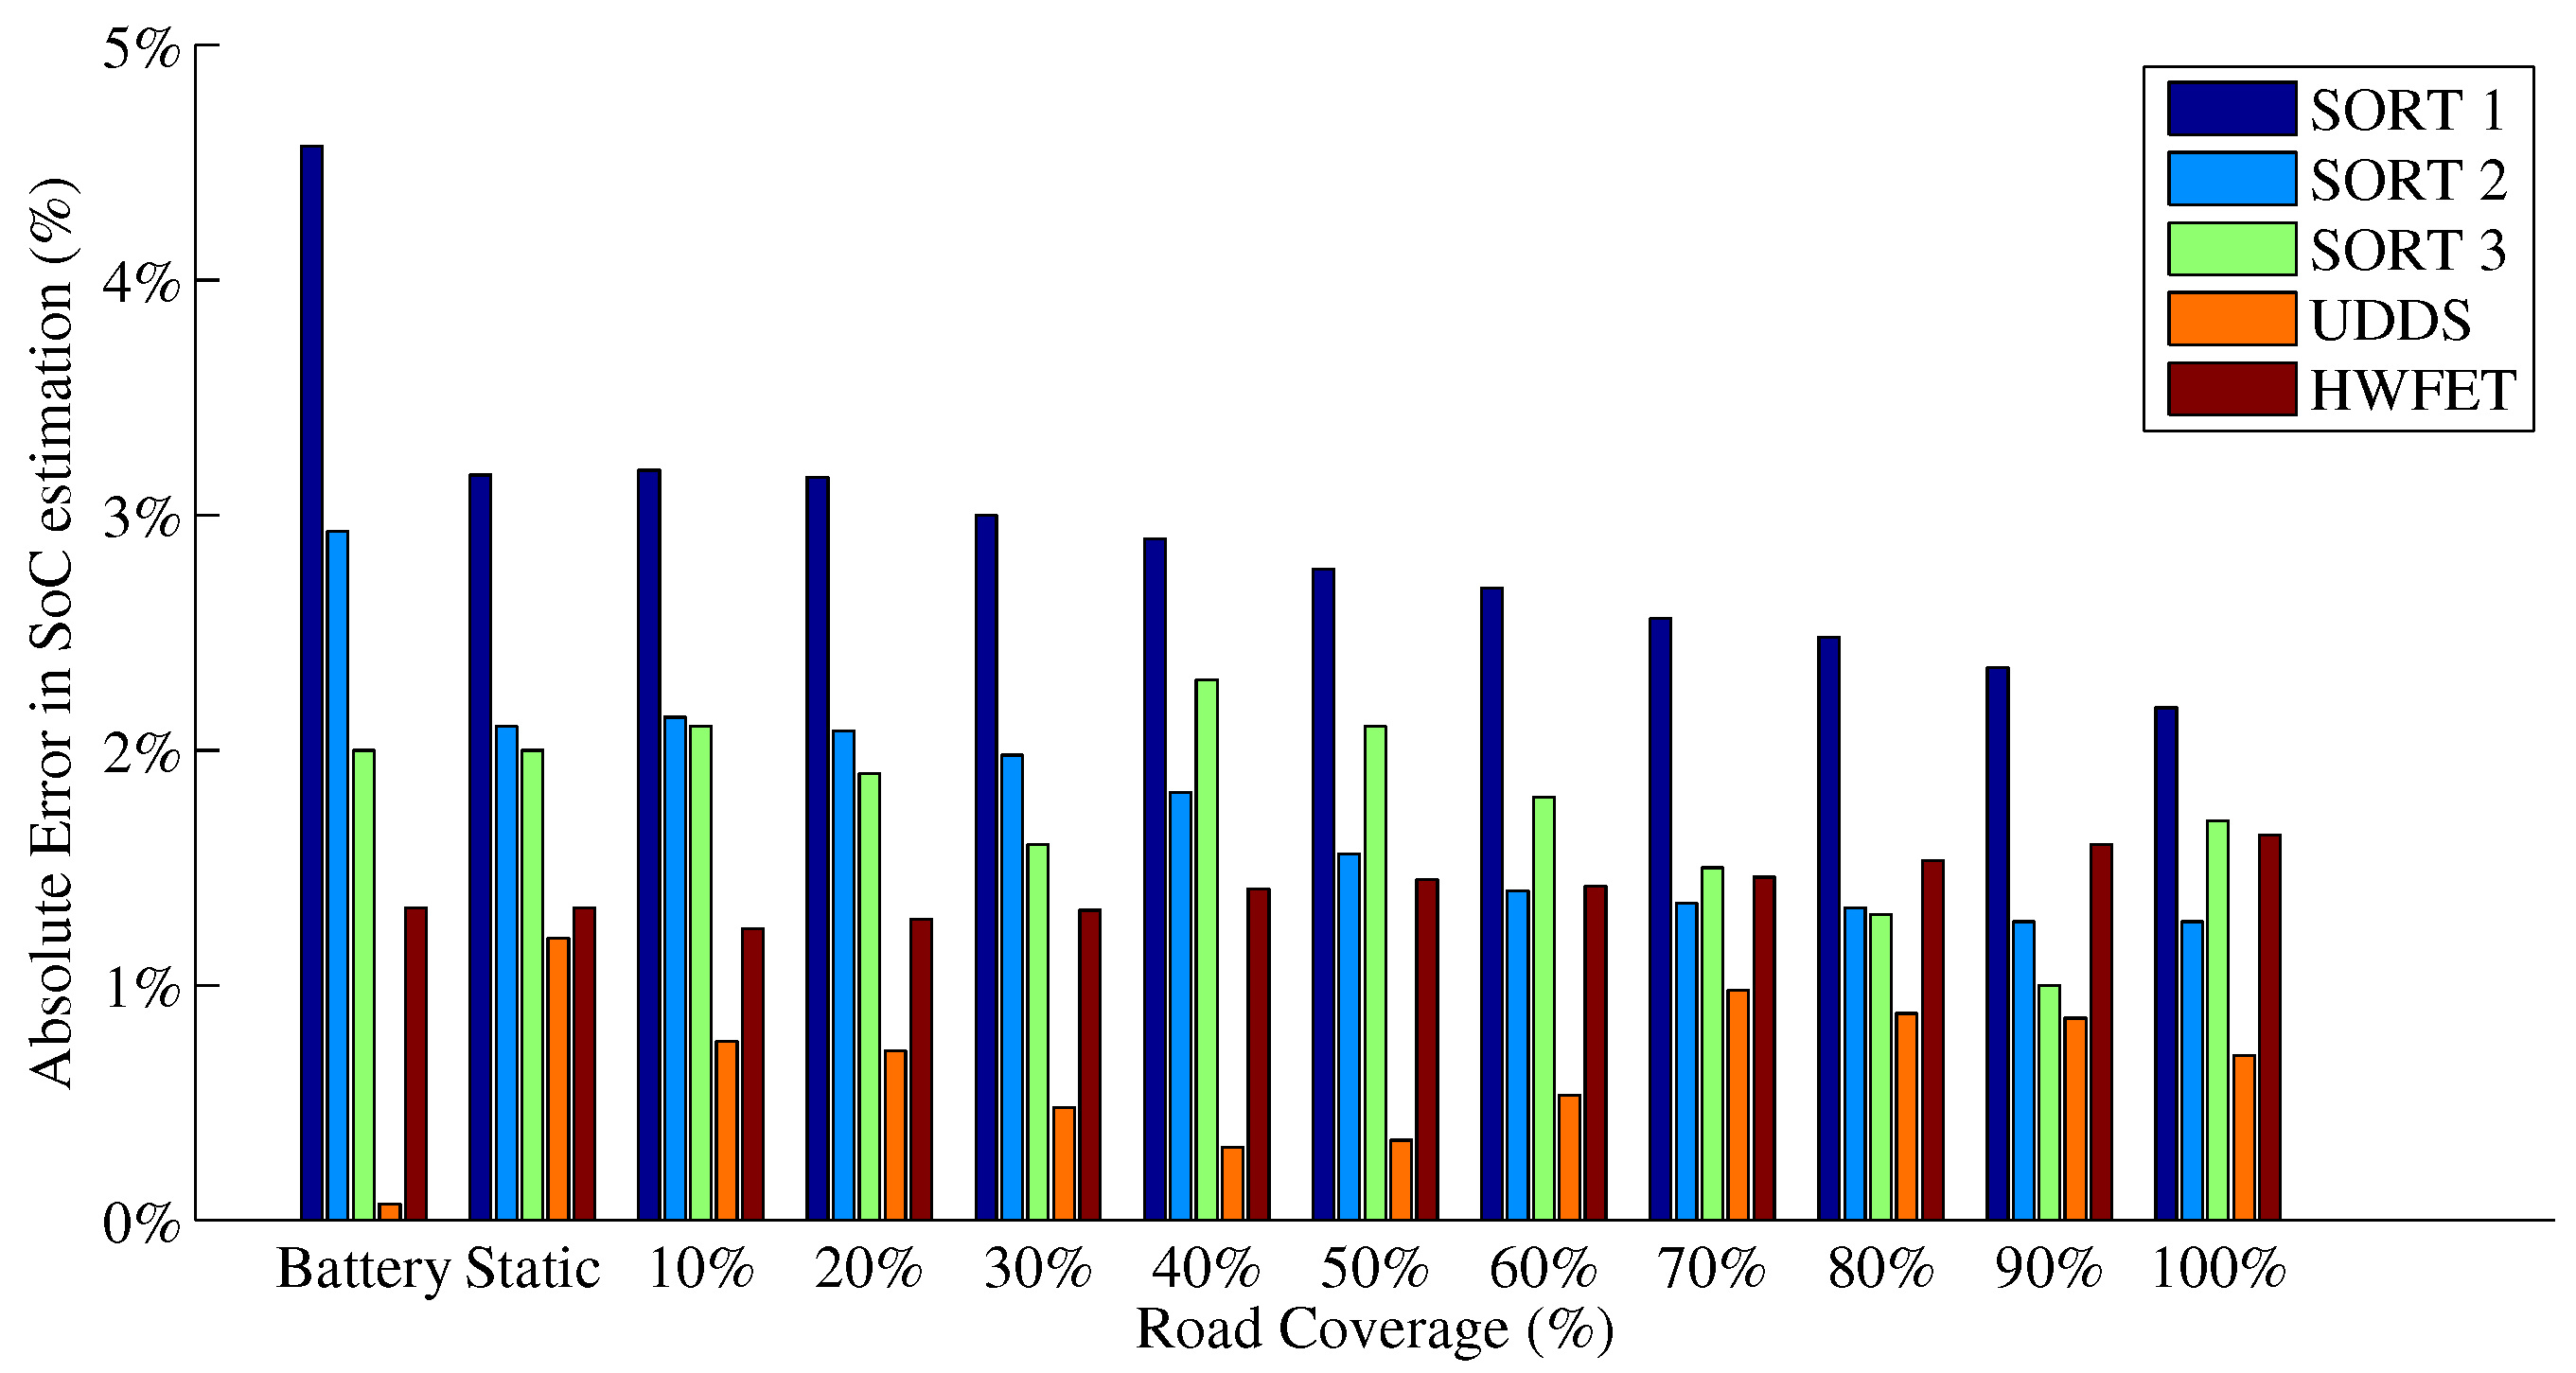
2.5. Estimation Error

3. Economic Analysis for the On-Road Inductive Power Transfer Charging System: Case Study
3.1. System Description
- The battery is charged to its full capacity during night hours when the bus is stationary.
- There are 24 scheduled stoppages of 20 s each and a 6 min stoppage at the start of each run.
- The required driving range is 400 km (10 trips of 40 km each) in the worst case scenario of −15 C, 100% occupancy.
- The climate model in [21] predicts that a normal bus would consume 167 kWh for HVAC in winter days for −7 C in Netherlands for a 20 h operation. An articulated bus of almost double the length would consume double this (334 kWh). Correspondingly, 433 kWh will be consumed if the ambient temperature is −15 C.The total energy consumption of the auxiliary system, including HVAC, lighting, auxiliary services of the vehicle, opening and closing of doors, route display screens, power steering and brakes, during the worst winter condition is assumed to be 500 kWh for a 20 h operation. Therefore, the average is assumed to be 25 kW.
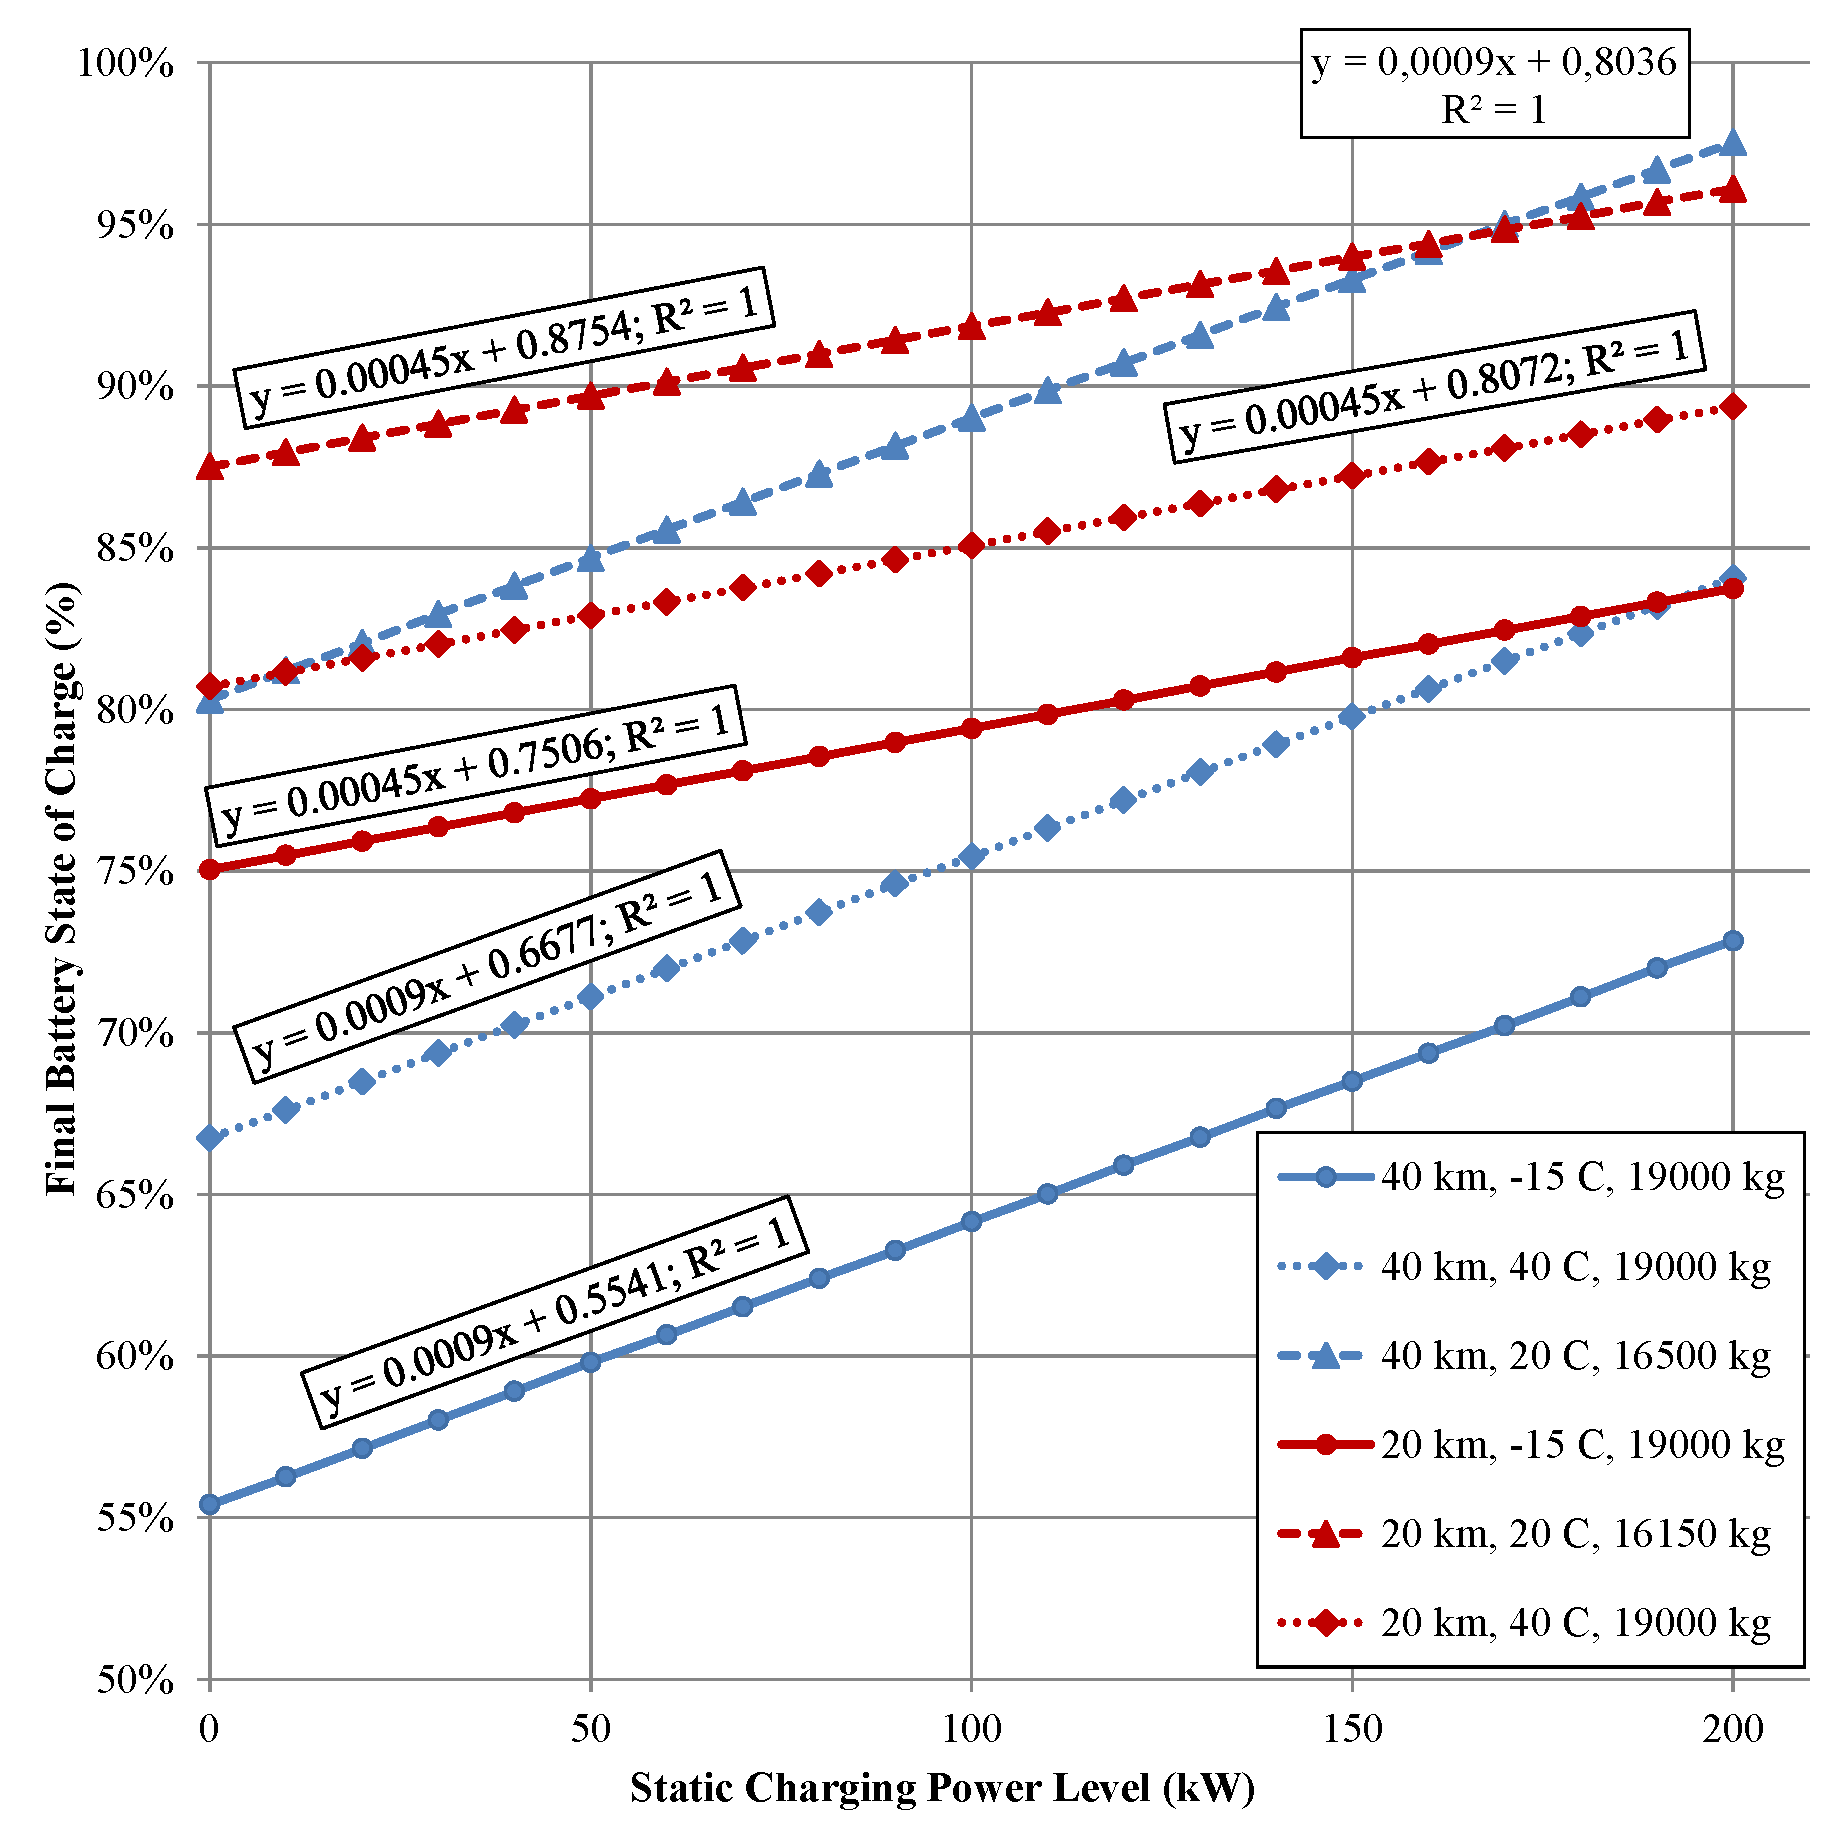
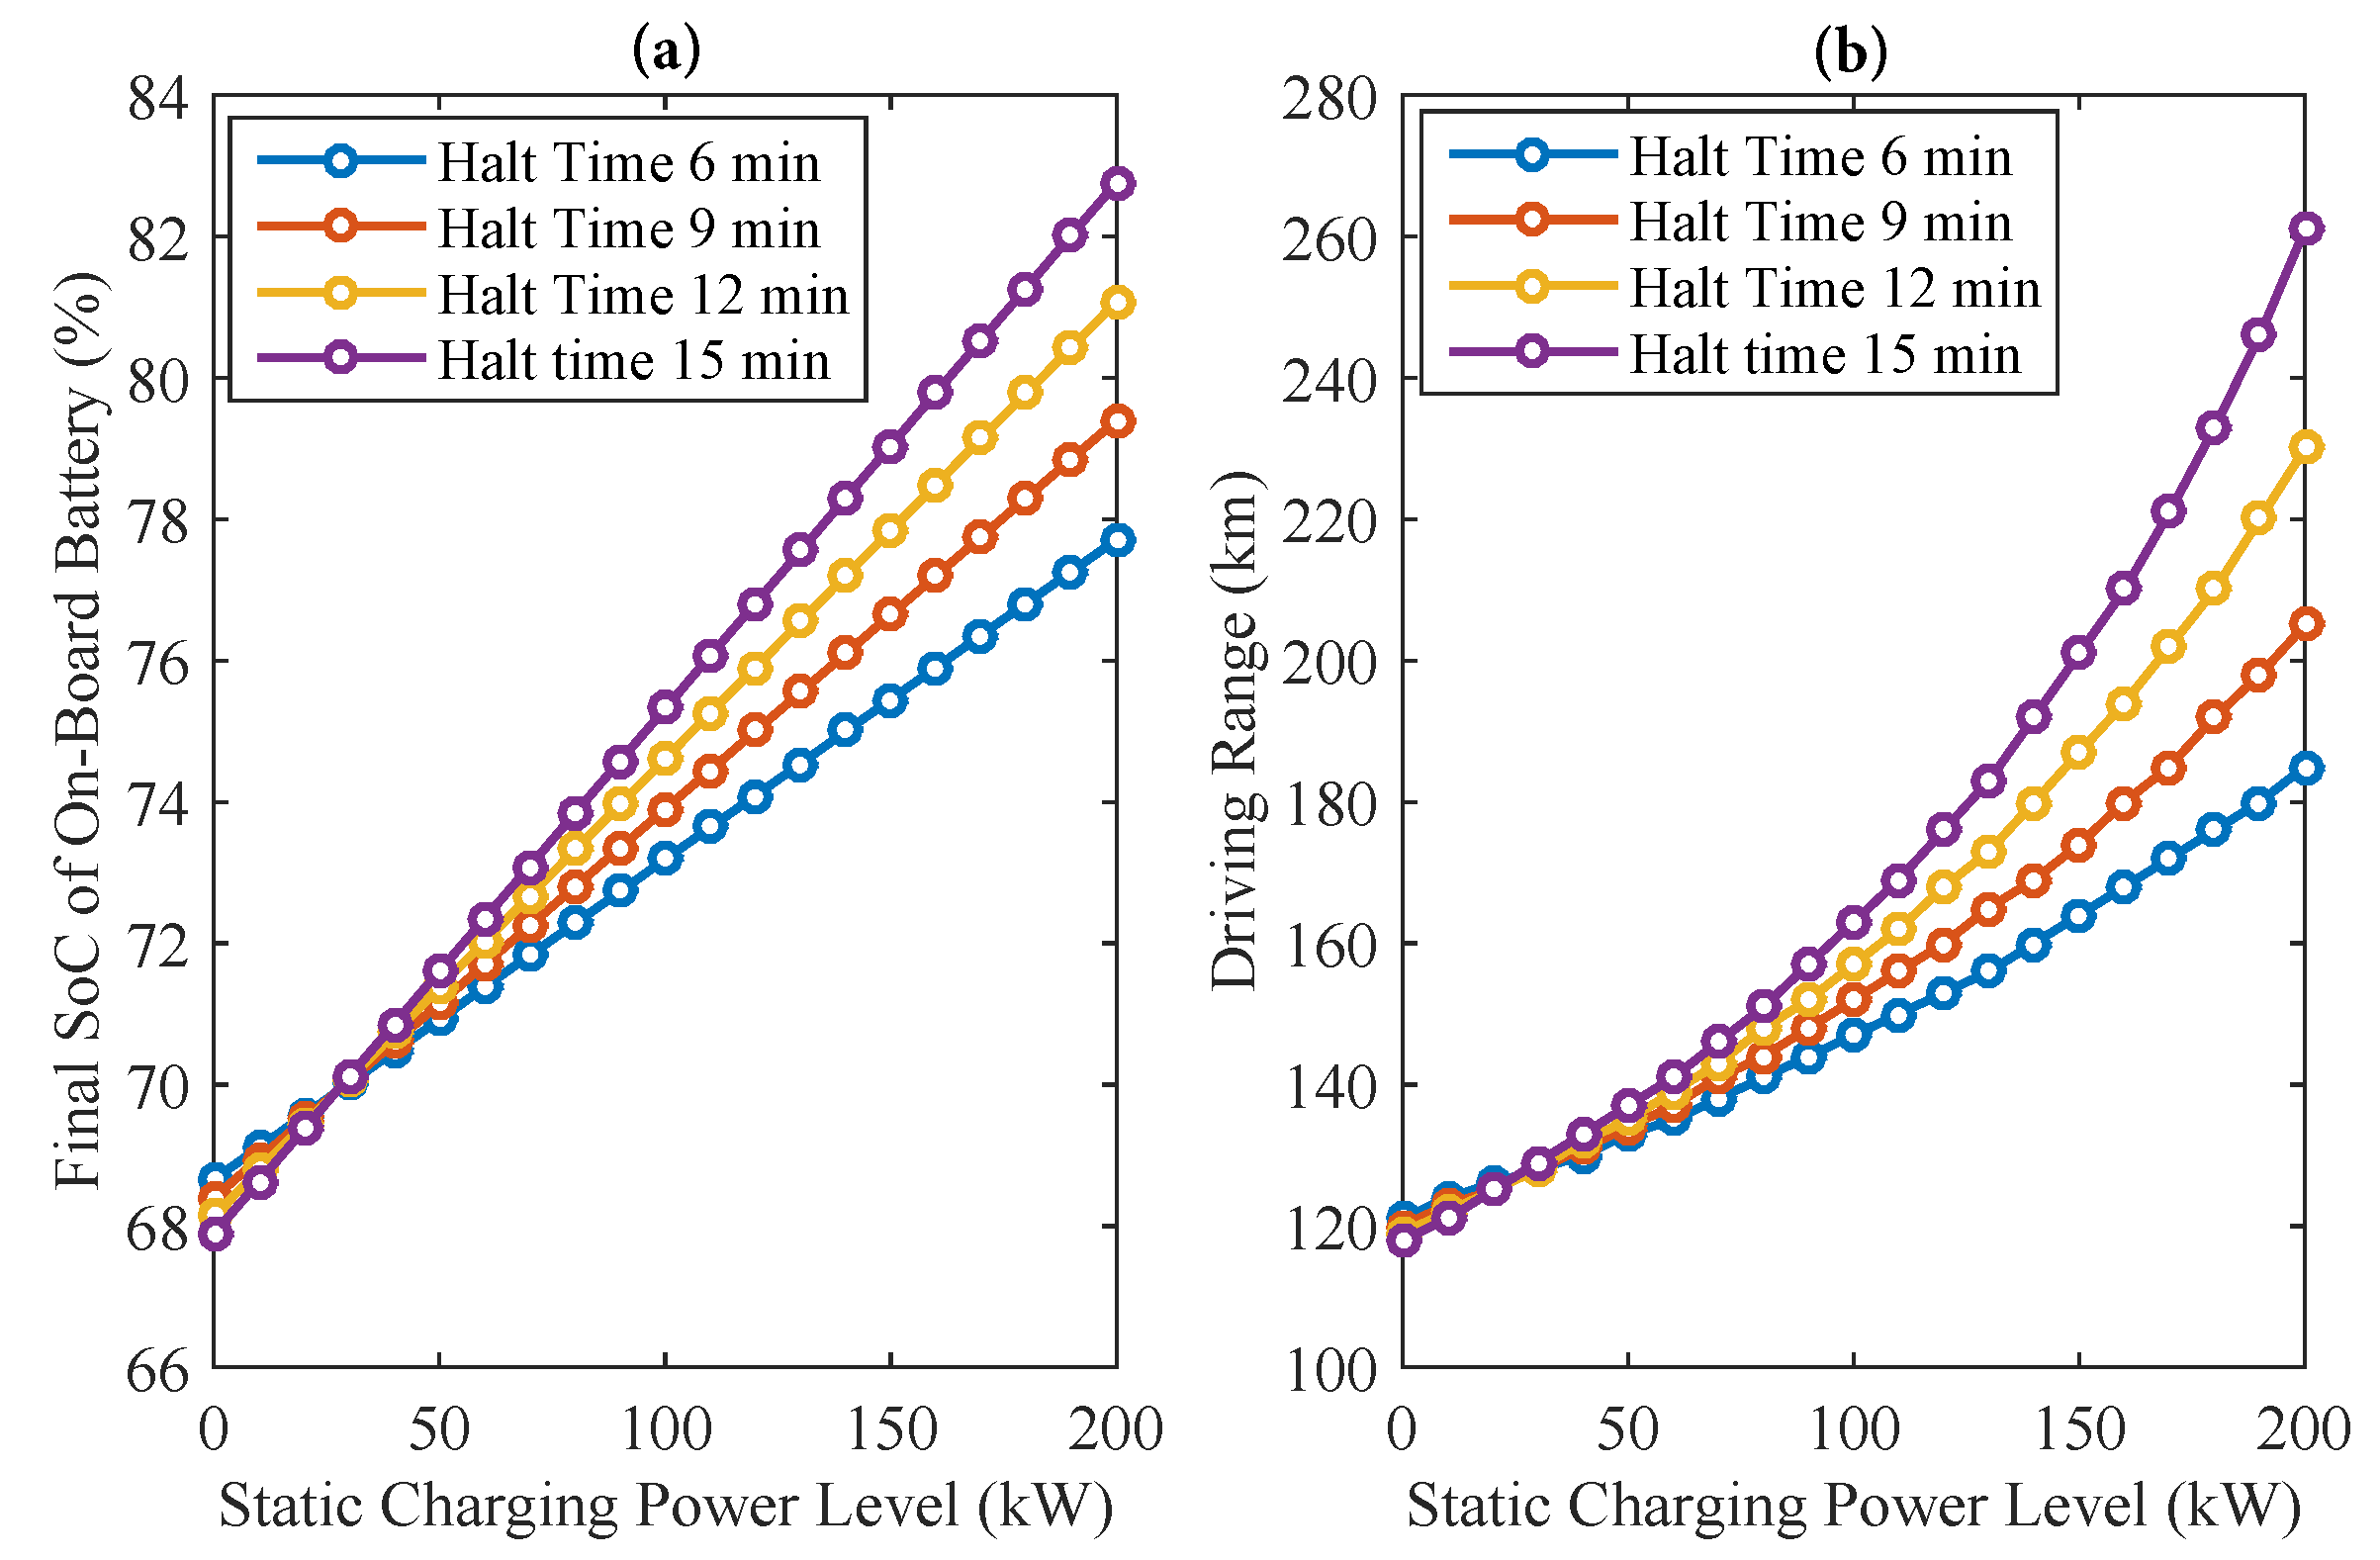
3.2. ΔSoC Deficit Removal with the Static Inductive Power Transfer Charging System
3.3. ΔSoC Deficit Removal with the Dynamic Inductive Power Transfer Charging System

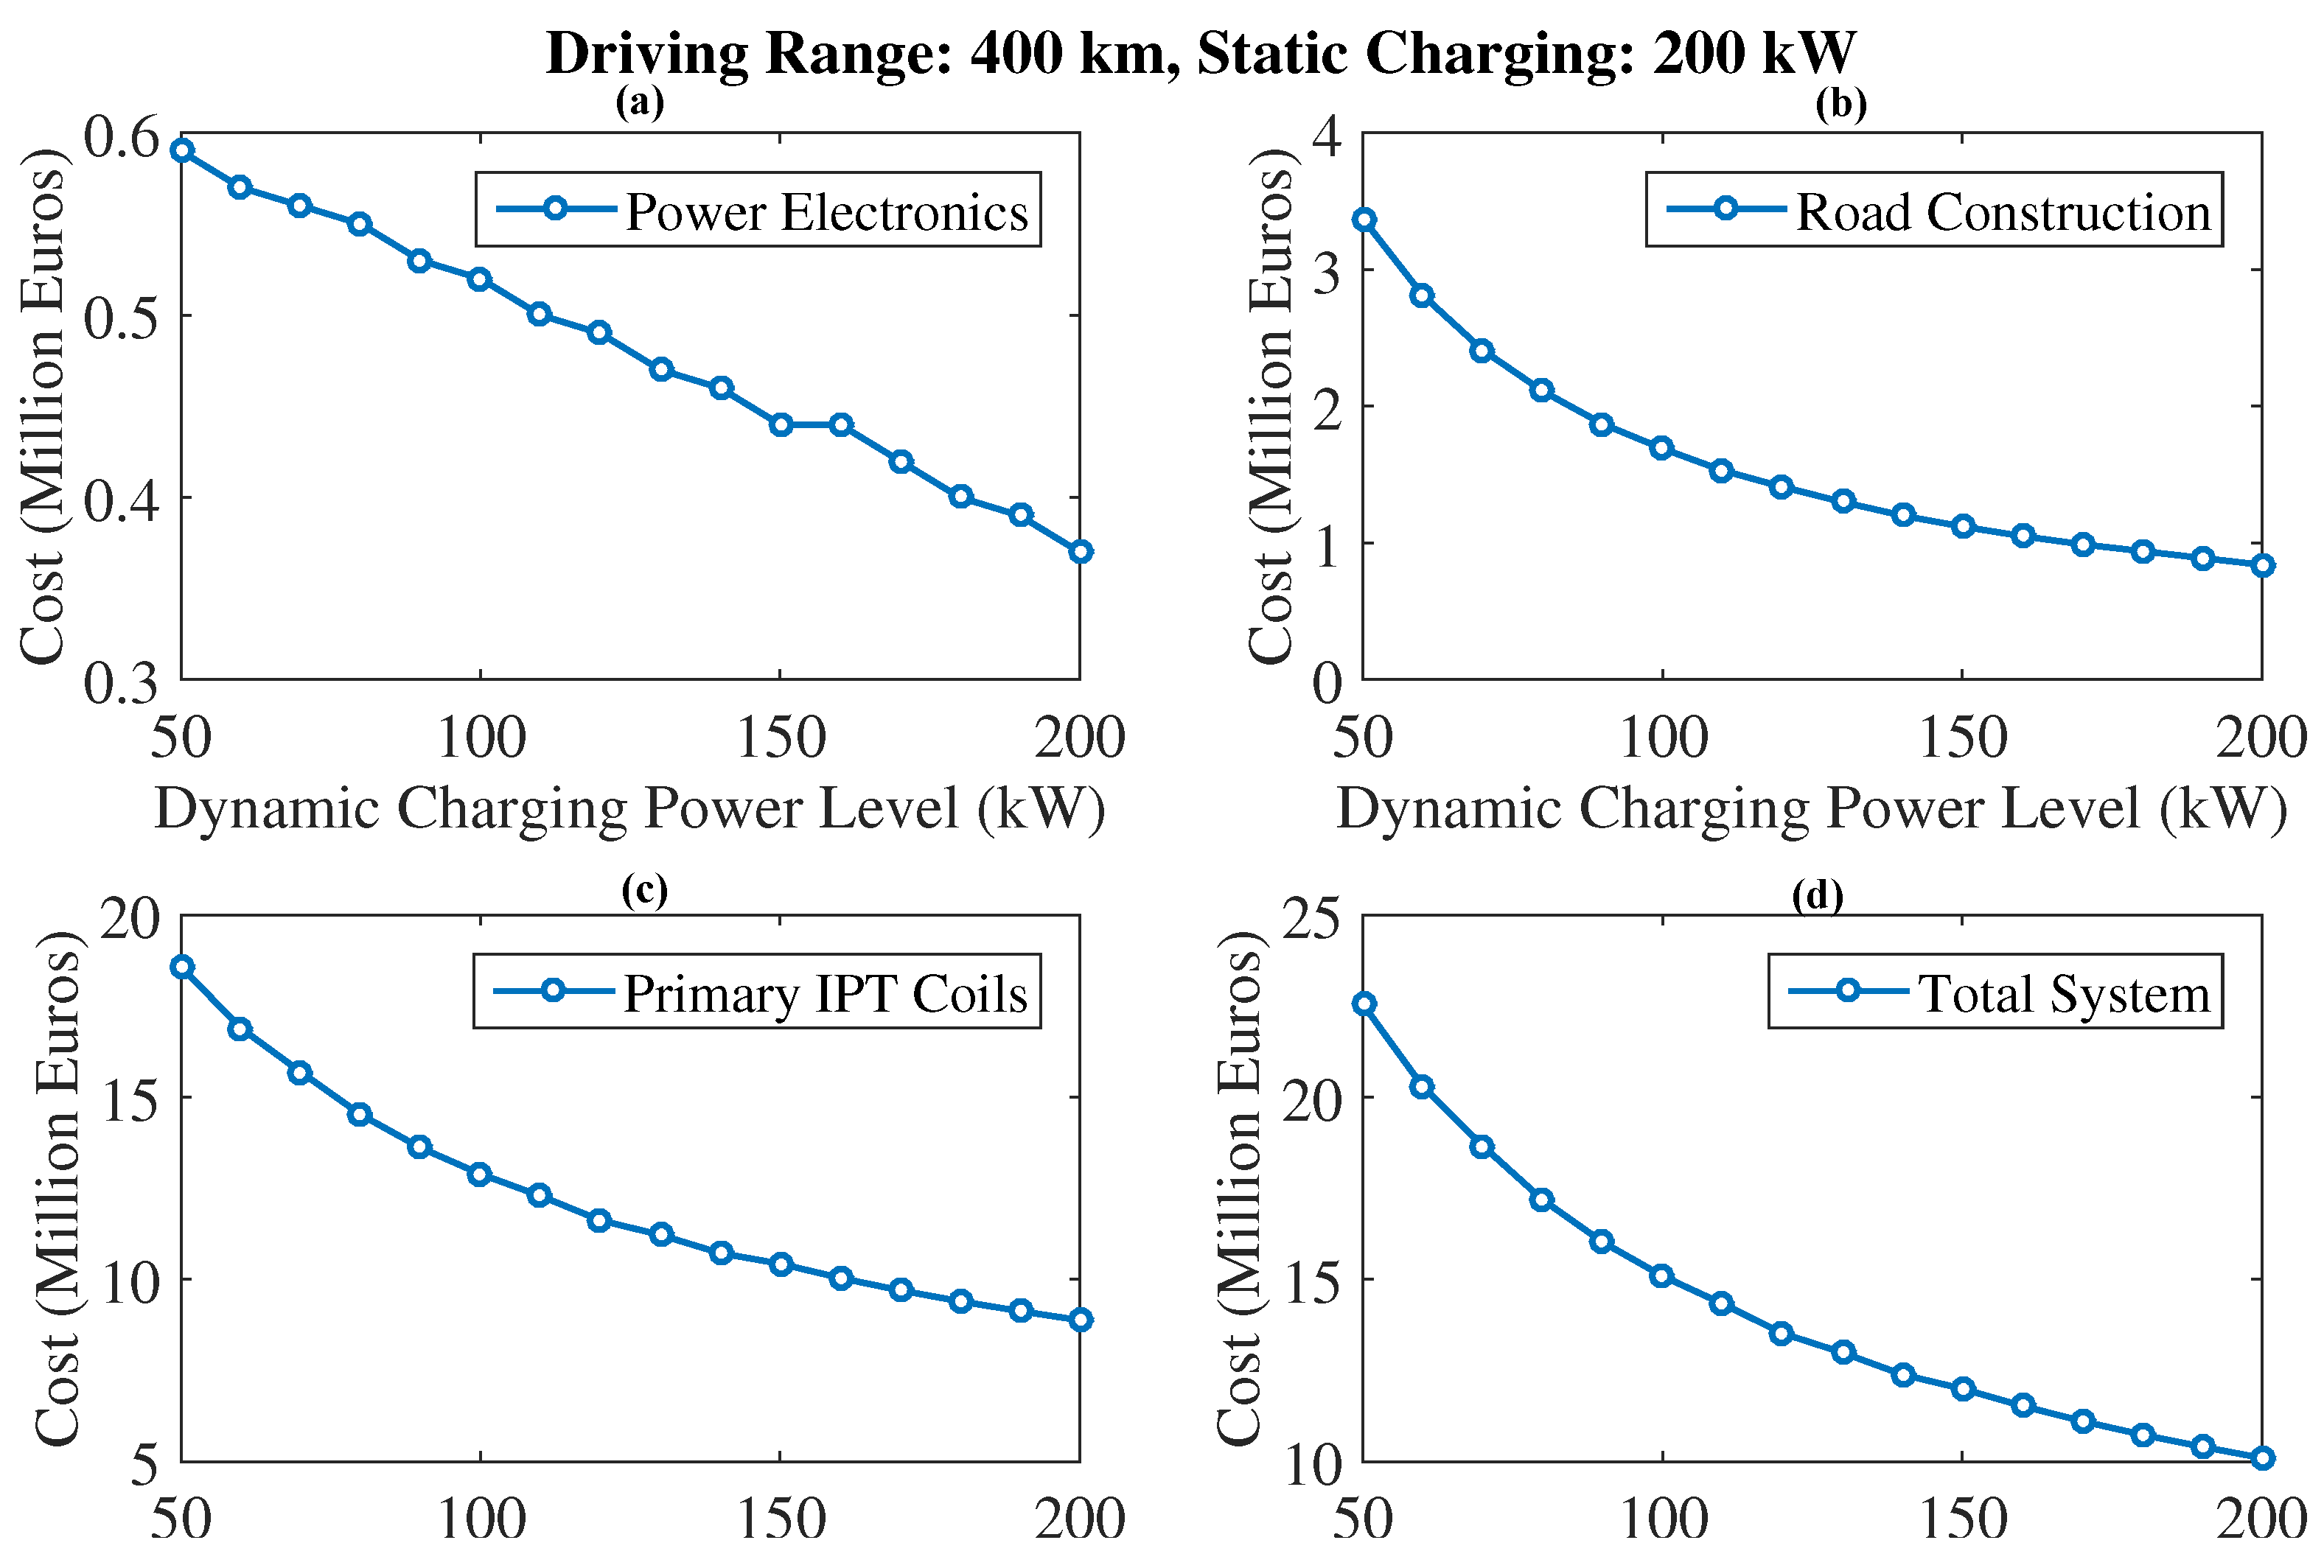
3.4. Cost of System Components
- The cost of the power electronics [26] involved in the IPT supply system is considered to be 50 €/kW. Additional maintenance charges of 10% have been included.
- Corresponding to the operating frequency of 100 kHz, a minimum of 4 inverters per km are installed [27].
- The road construction (digging, labor, installation of IPT system) costs of 0.1 M€/km for IPT road coverage are assumed.
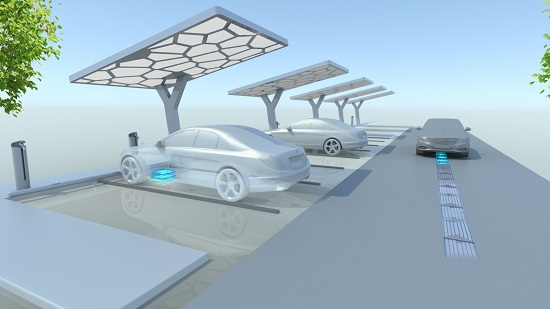
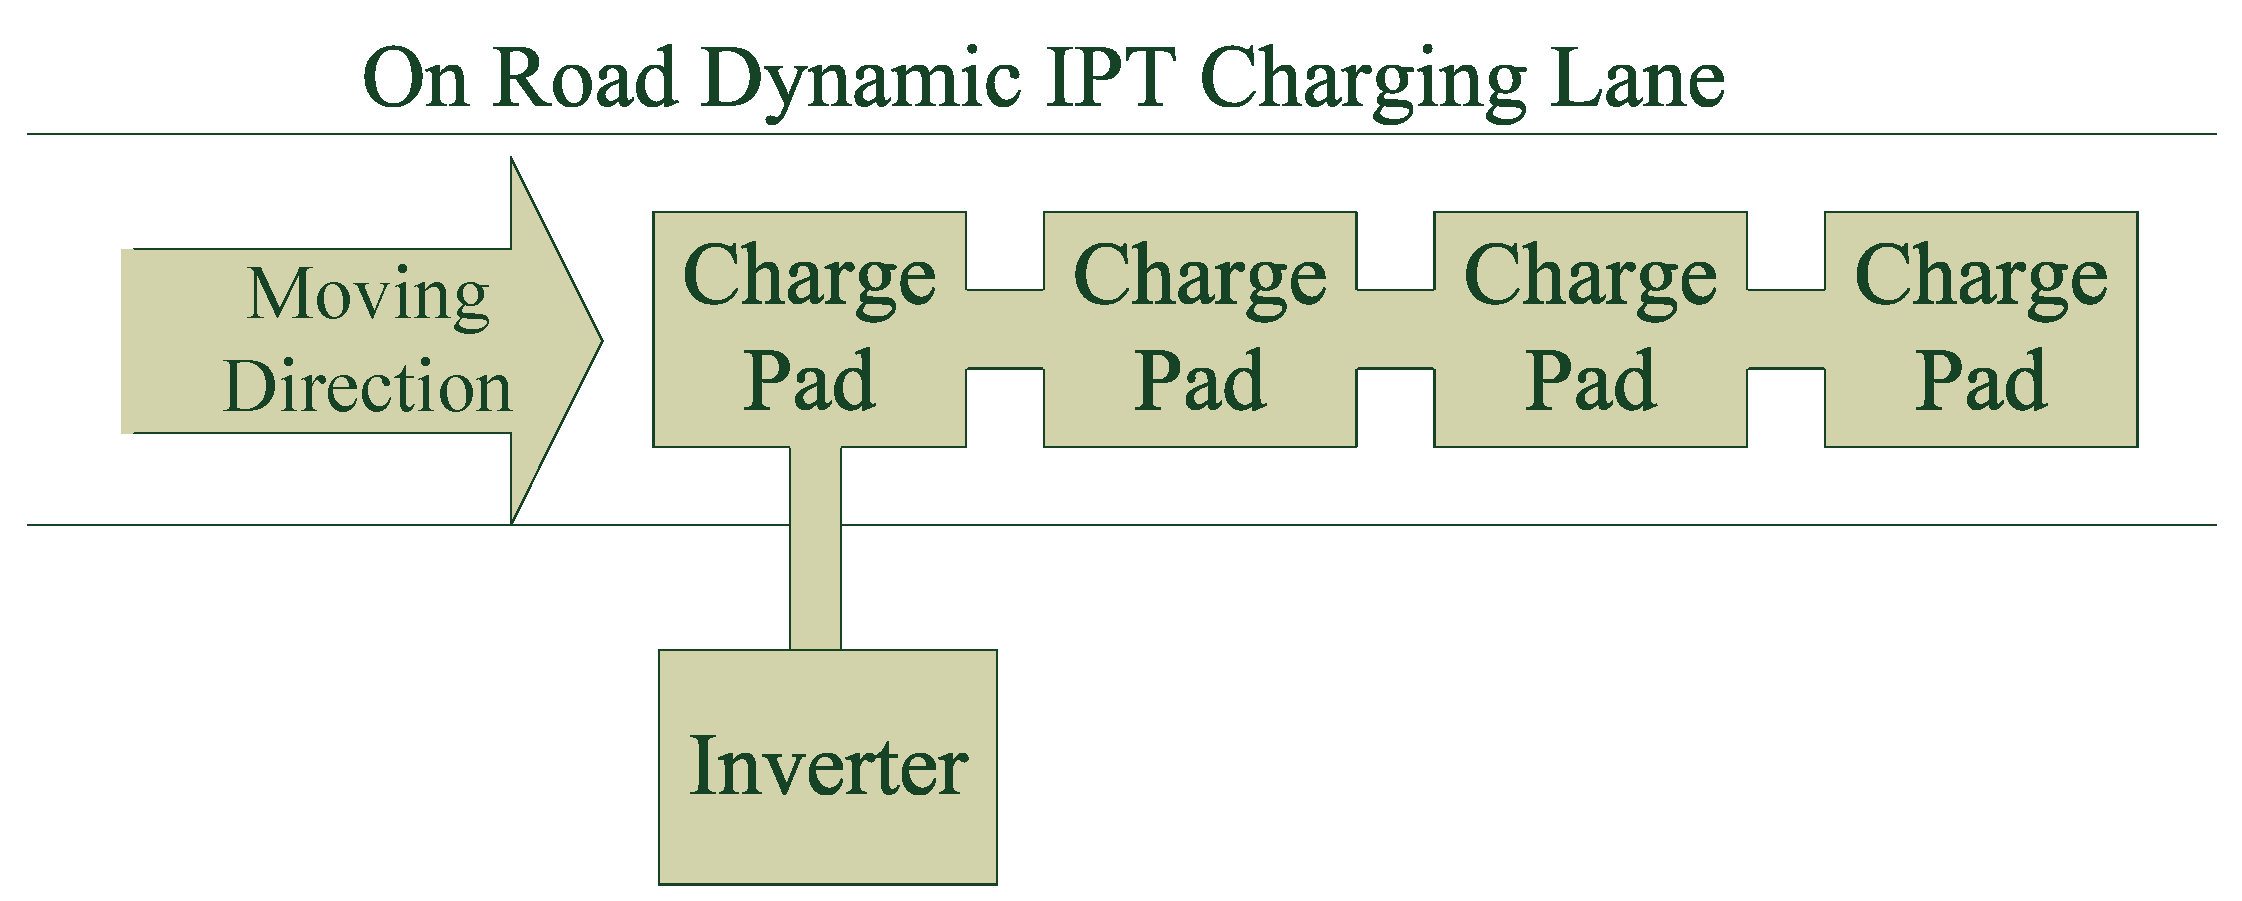
- Discrete charging pads of 1.05 m [24] in length each have been considered for dynamic on-road charging. The total number of dynamic charging pads have been estimated for total road coverage, and the corresponding cost of air cored primary winding is calculated. An illustration of the on-road dynamic charging system with discrete pads [28] is shown in Figure 11.

4. Second Order Economic Considerations
4.1. Running Schedule
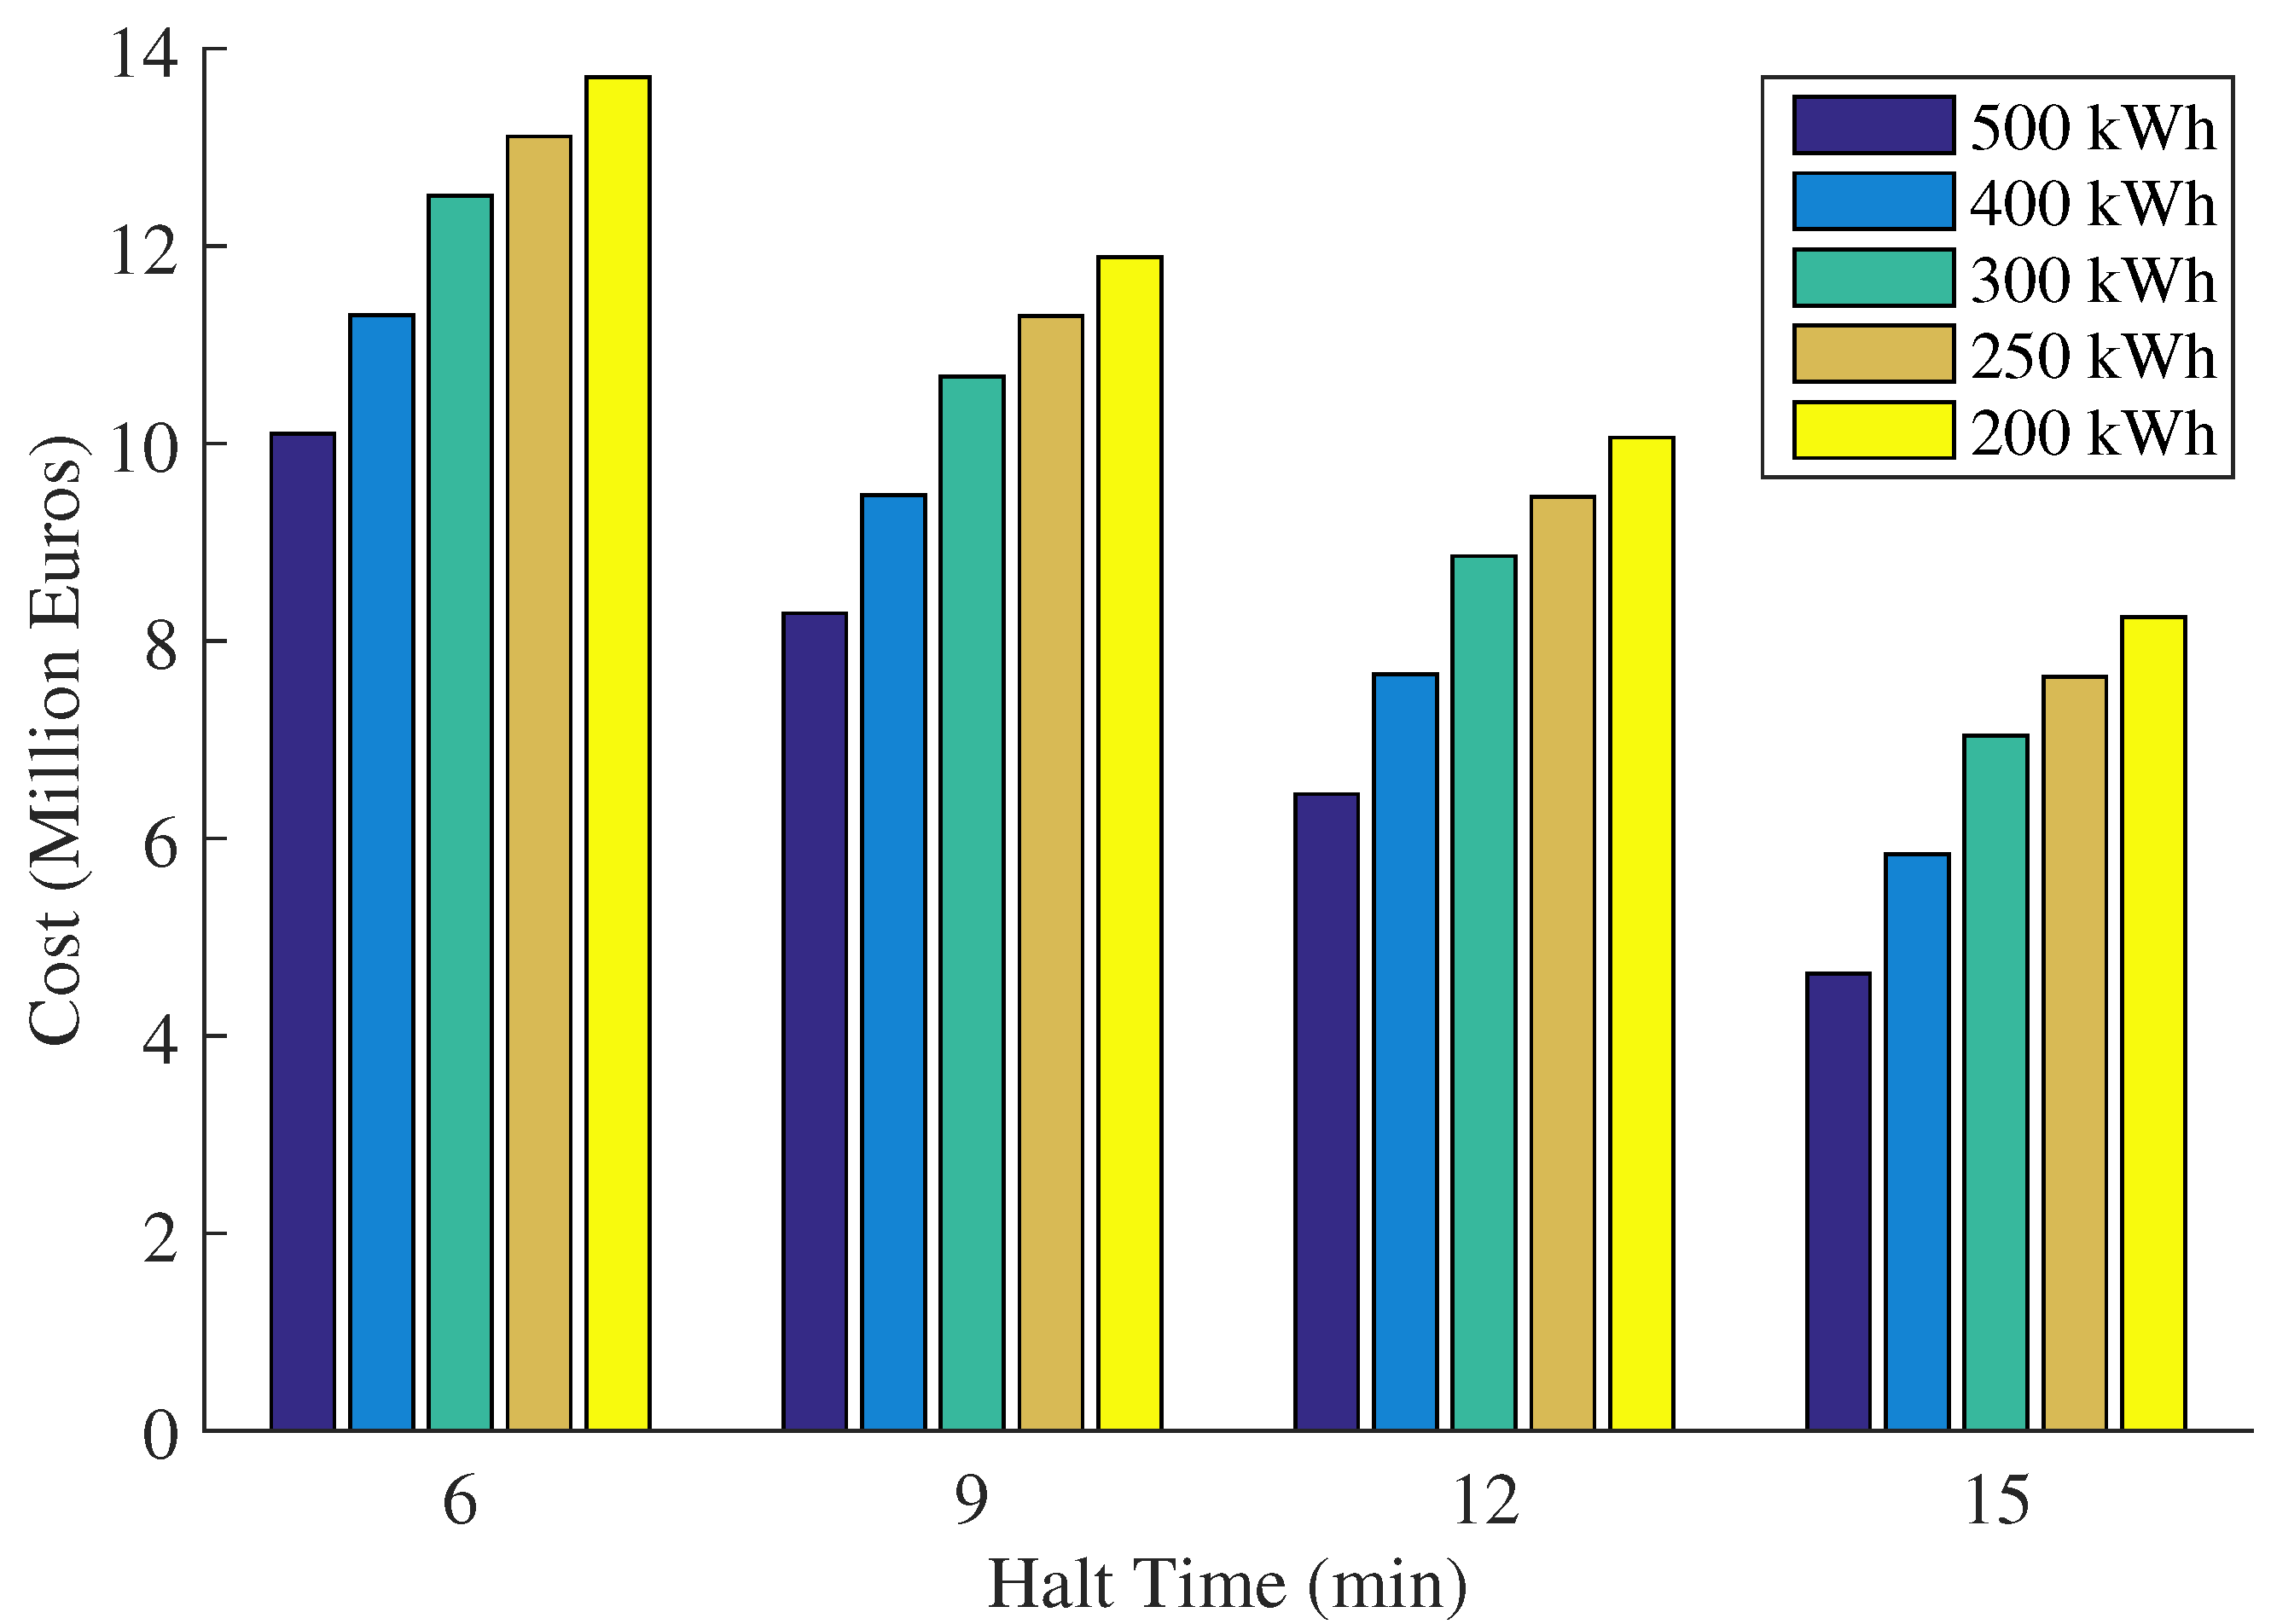
4.2. On-Board Battery Capacity
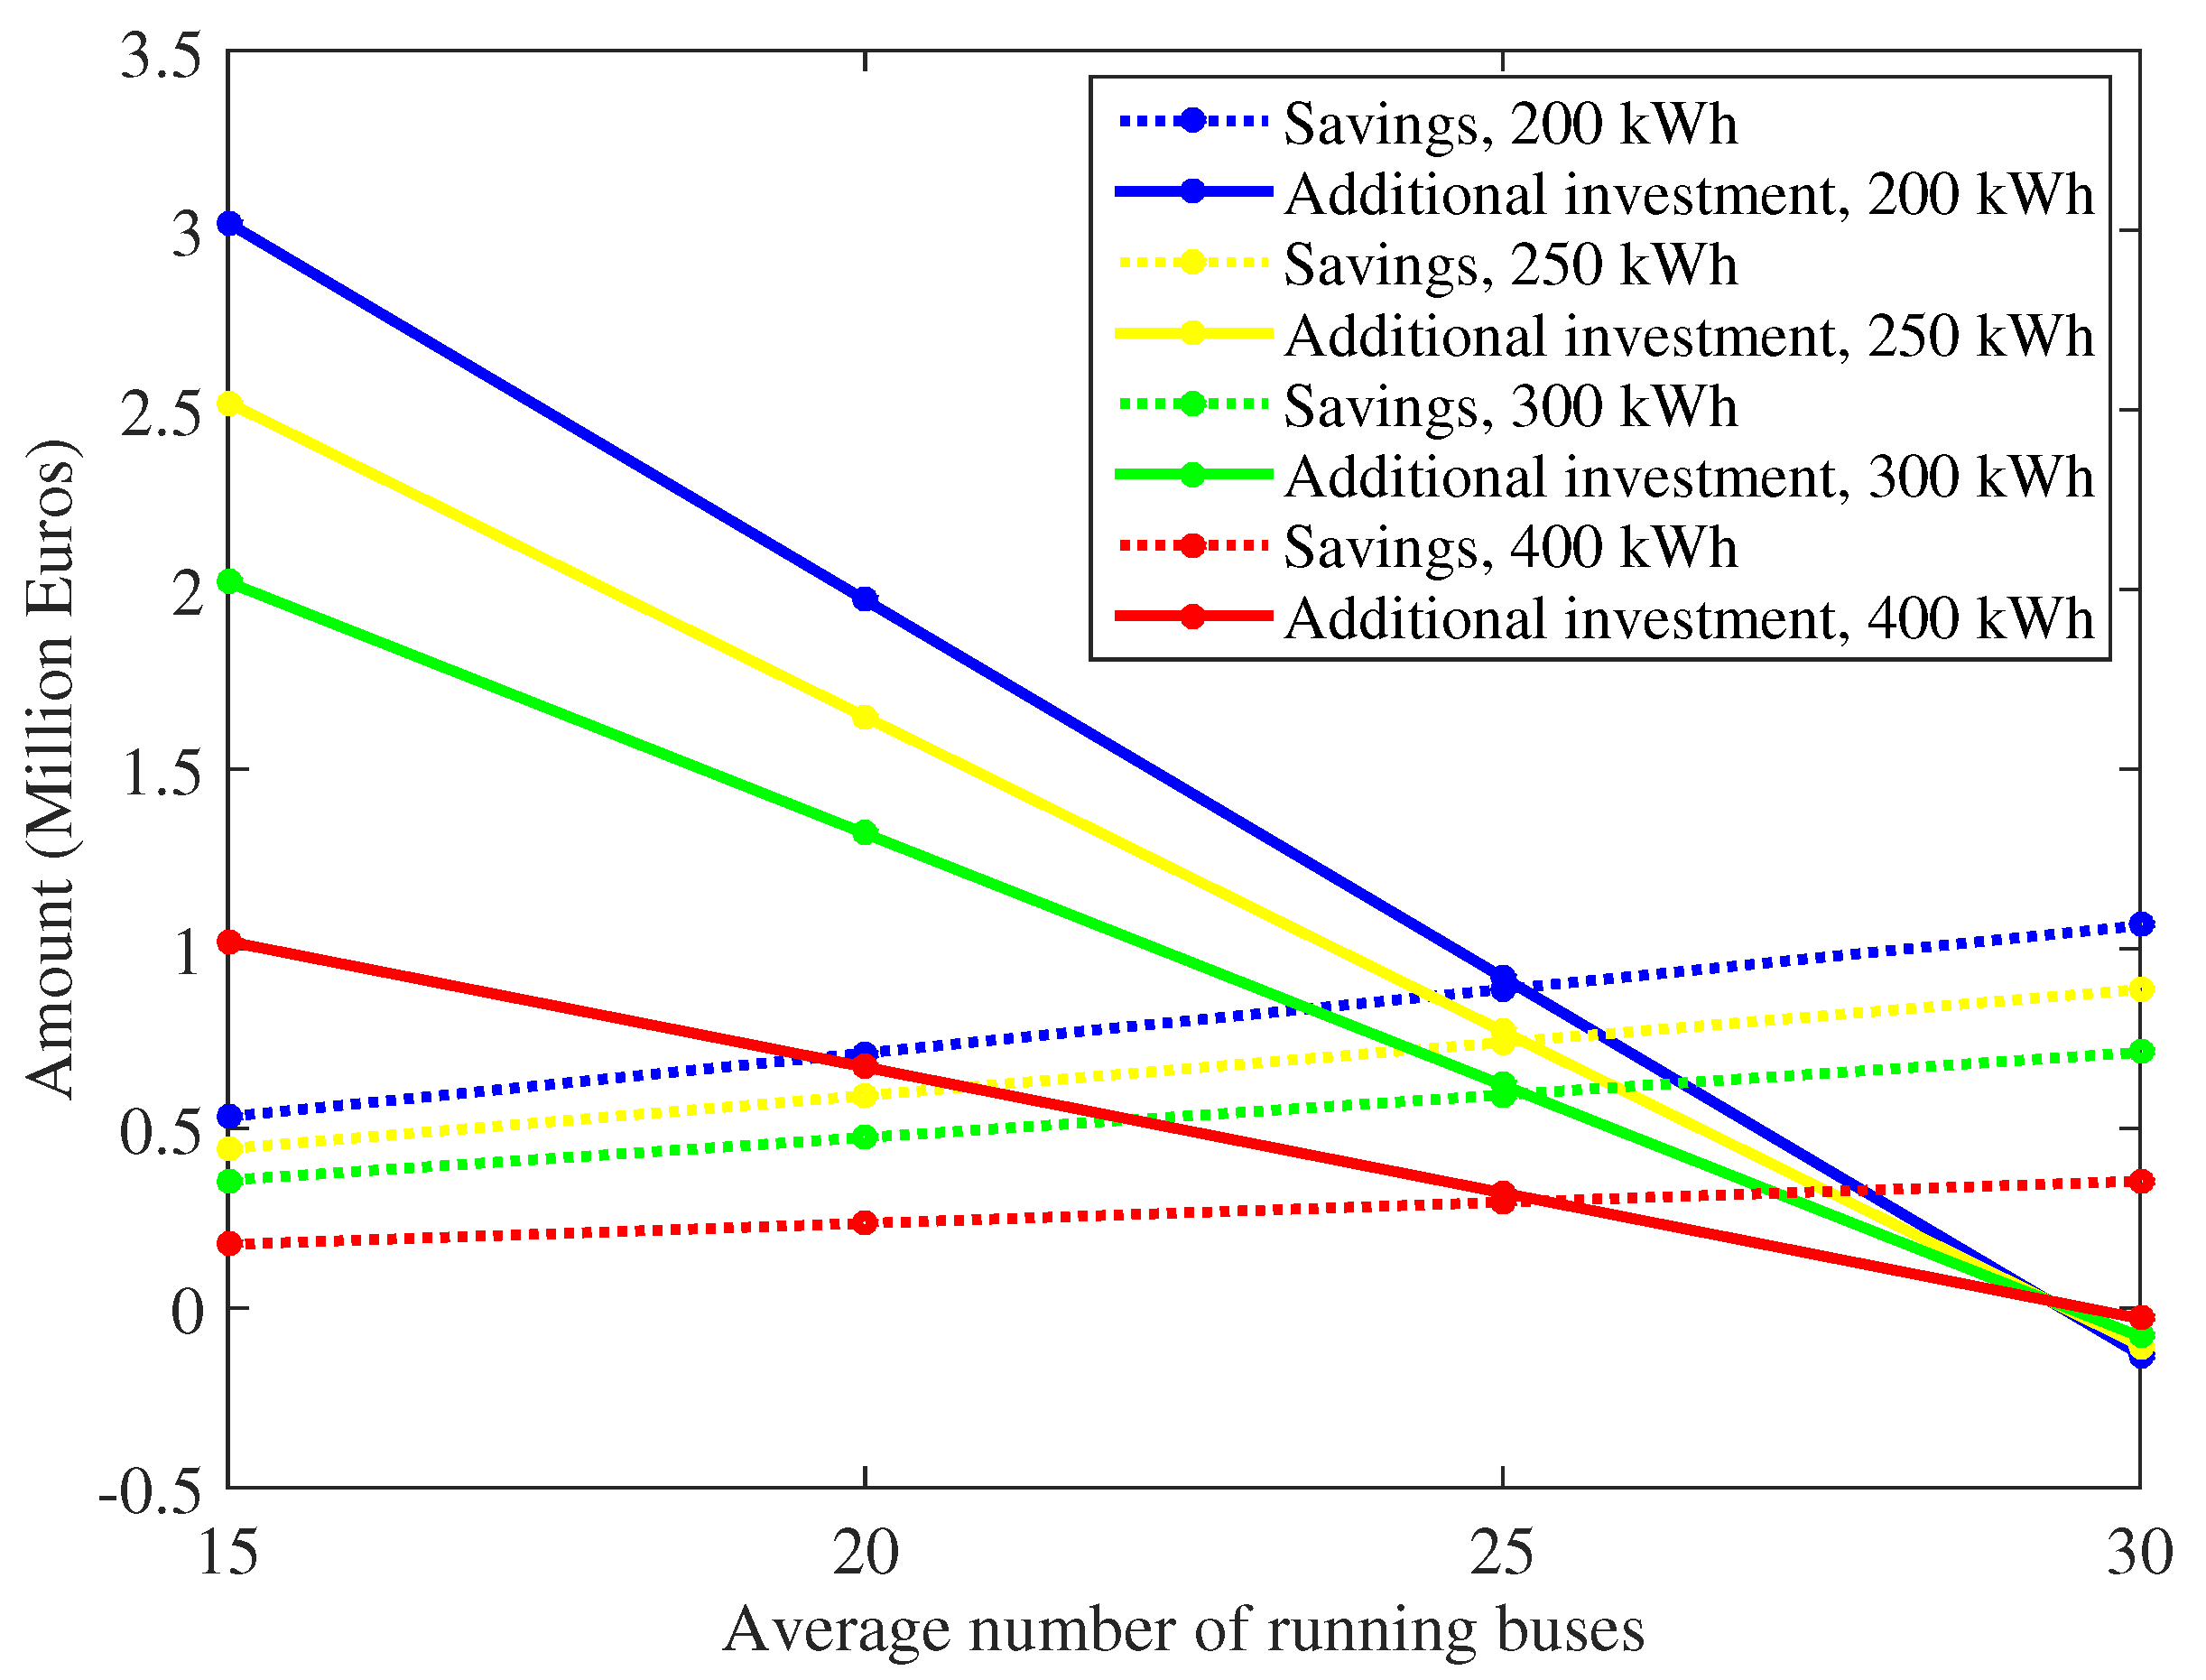
- The transport efficiency increases with decreasing battery capacity corresponding to the weight reduction. The energy savings becomes significant with a high lifetime travel distance and the number of running buses.
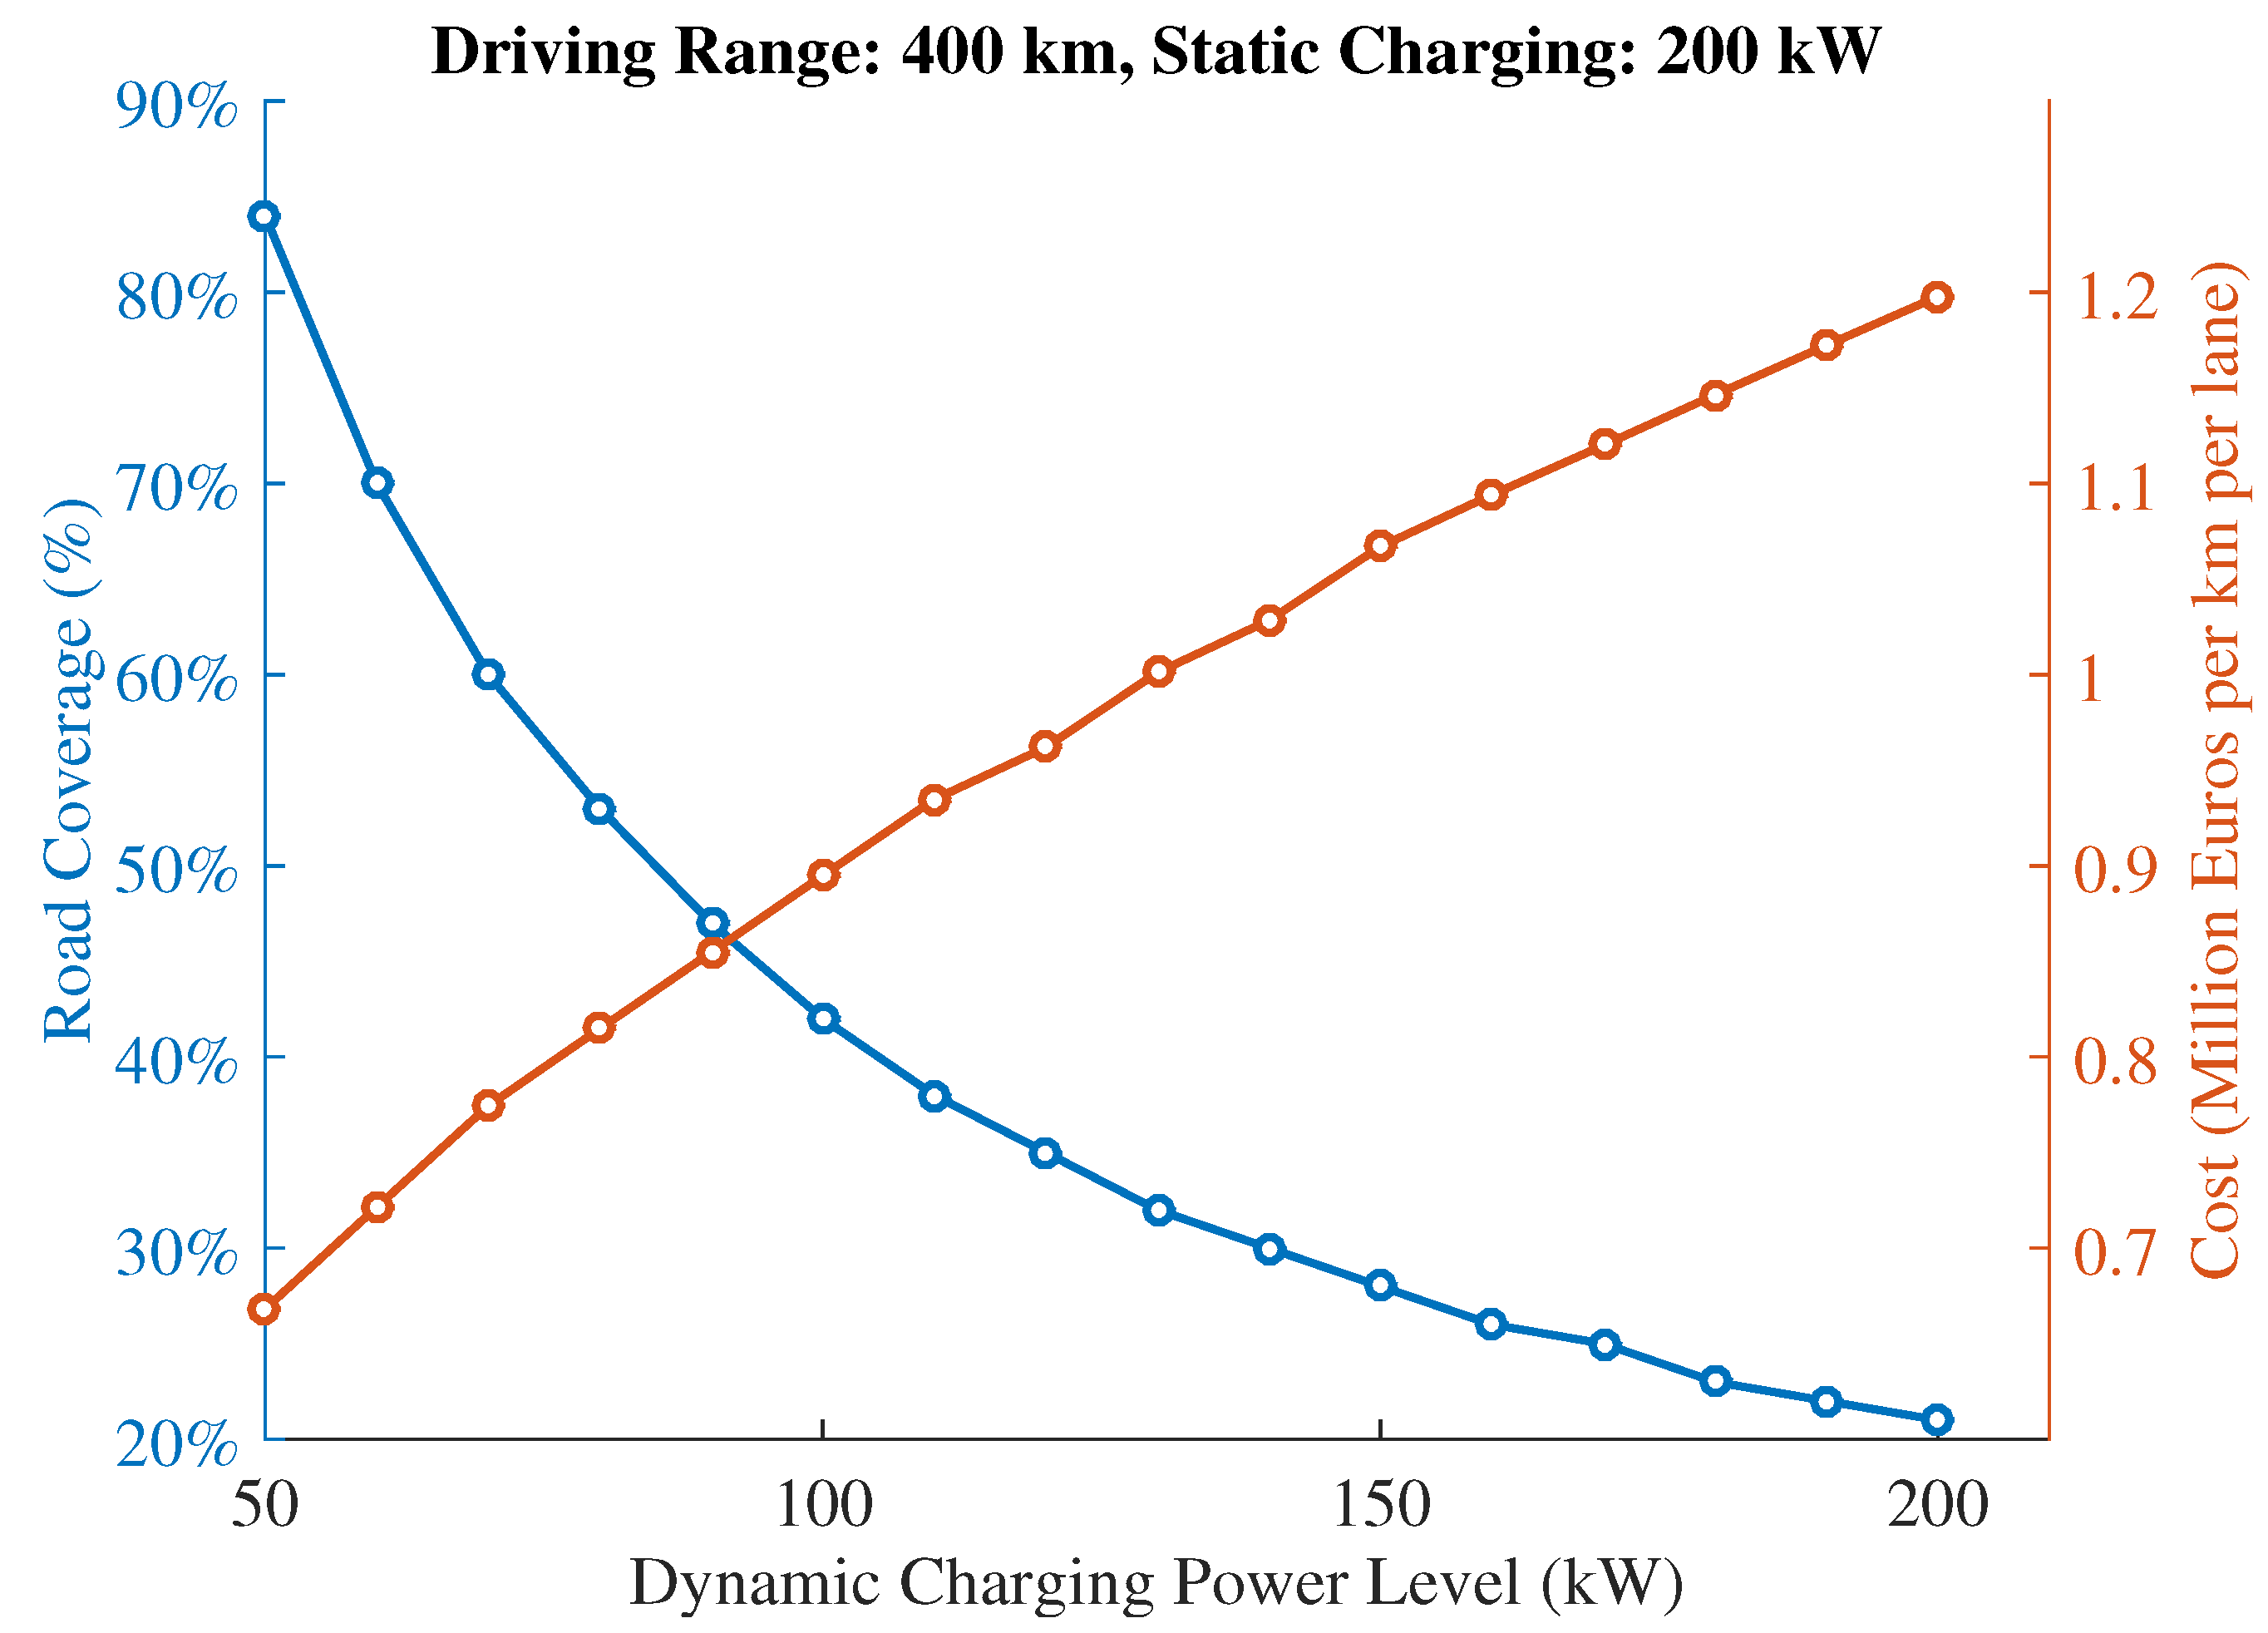
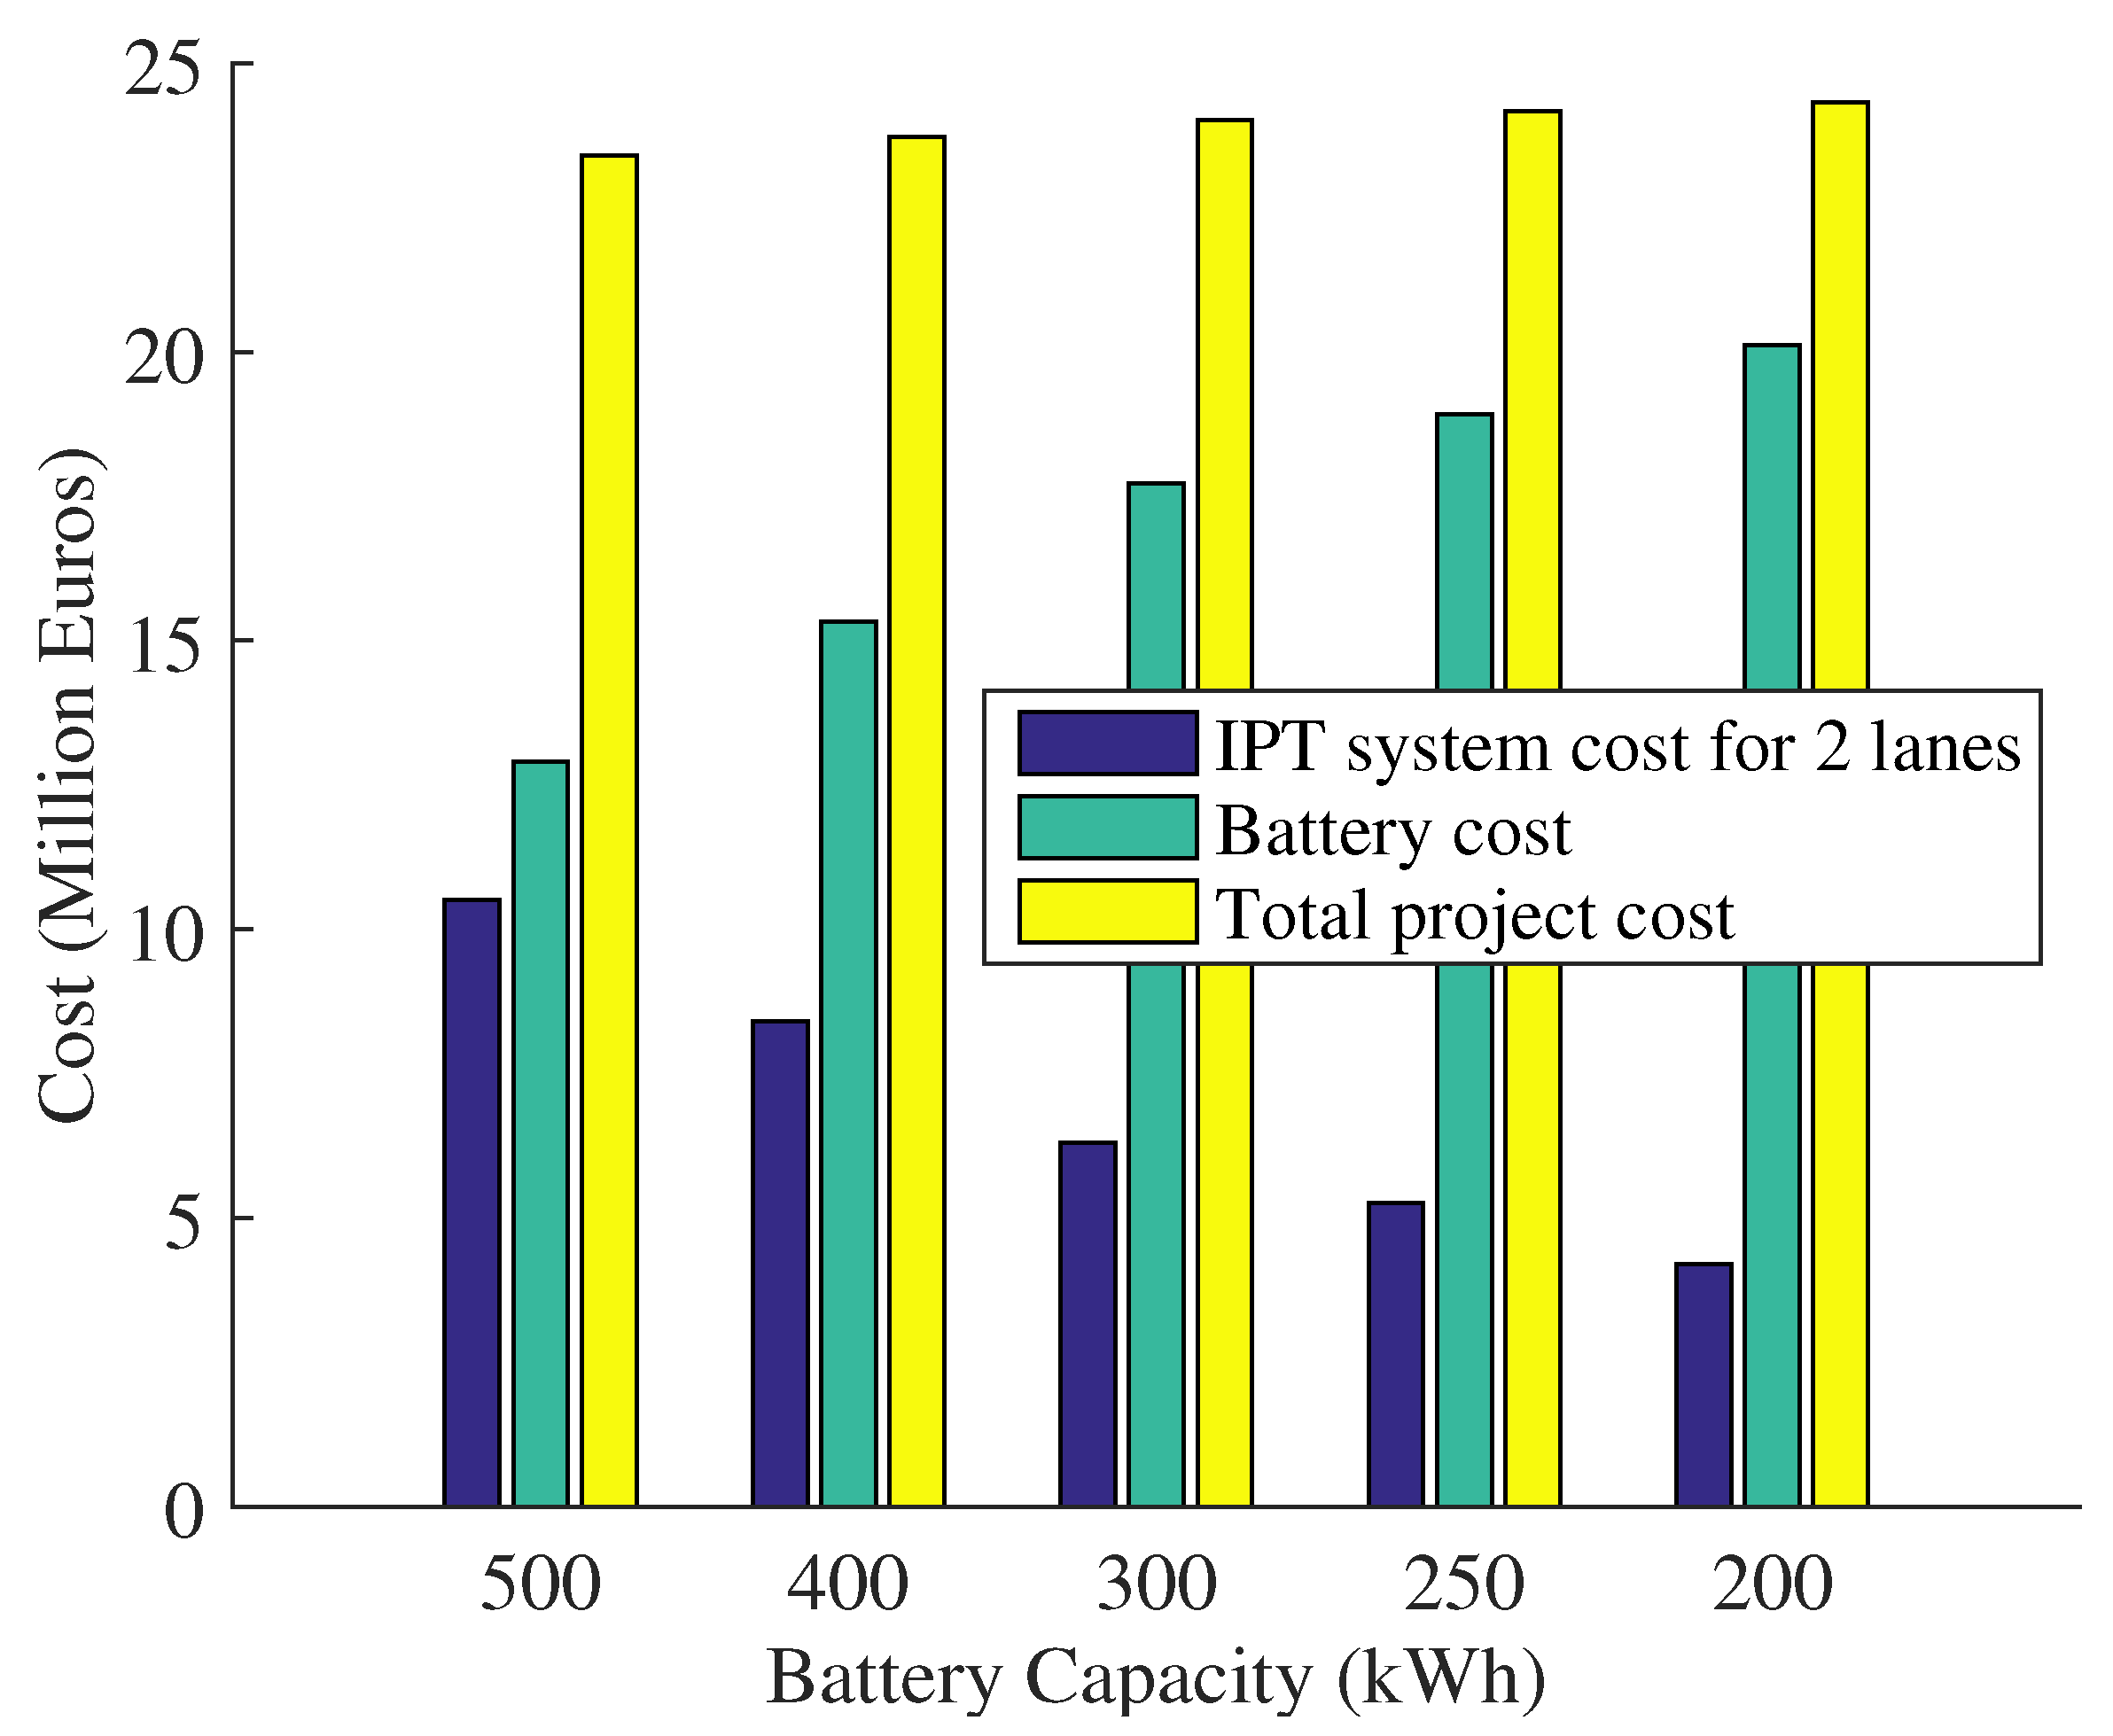
- IPT charging infrastructure cost increases with decreasing battery capacity due to the additional road coverage requirement of the dynamic IPT system. This is shown in Figure 13.
- The price of the installed on-board battery decreases with decreasing capacity. This can be a significant investment factor with increasing the number of e-buses.
5. Conclusions
| Parameter | Value | Unit |
|---|---|---|
| On-board battery capacity | 500 | kWh |
| Driving range in worst loading scenario | 400 | km |
| Driving range without on-road charging | 119 | km |
| Scheduled stoppage at start of each run (worst case) | 12 | min |
| Scheduled stoppage at start of each run (normal) | 6 | min |
| Number of buses (average running + spare) | 25 + 5 | - |
| Static charging power level | 200 | kW |
| Dynamic charging power level | 200 | kW |
| Dynamic IPT road coverage | 13% | - |
| Power rating of inverter | 200 | kW |
| Total number of inverters | 22 | - |
| Cost of primary winding | 5.67 | M€/lane |
| Cost of inverters | 0.24 | M€/lane |
| Total cost of IPT system | 6.45 | M€/lane |
| Specific cost | 1.2 | M€/km/lane |
| Battery cost for 30 buses | 10.5 | M€ |
| Total project cost (M€/2 lanes/30 buses) | 23.4 | - |
Acknowledgments
Author Contributions
Conflicts of Interest
Nomenclature
| SoC of battery at the end of the traveled distance | |
| Initial SoC of the battery | |
| S | Total distance traveled by the vehicle in km |
| Mass constant of the driving cycle in | |
| M | Gross mass of the vehicle in kg |
| Area constant of the driving cycle in | |
| Frontal area of the vehicle in m | |
| Coefficient of drag | |
| Power demand of the auxiliary system of the vehicle in kW | |
| Average velocity in km/h | |
| Discharge efficiency of the battery | |
| Energy capacity of vehicle battery in kWh | |
| Capacity factor defined as the ratio of the maximum energy that can be delivered by the EV battery to the maximum energy that can be delivered by the reference battery | |
| SoC of battery at the end of traveled distance with a static charging system | |
| Total scheduled stoppage time spent on the IPT charging system in hours | |
| Charging efficiency of the battery | |
| Static IPT charging power level in kW | |
| SoC at the end of the total traveled distance without any on-road charging | |
| State of the charge of the battery at the end of traveled distance | |
| Total travel time in hours | |
| Dynamic charging power level in kW | |
| % Road coverage of dynamic IPT | |
| DR | Driving range in km |
| Maximum allowed depth of discharge, assumed to be 80%. |
References
- Fox, G.H. Electric Vehicle Charging Stations: Are We Prepared? Ind. Appl. Mag. 2013, 19, 32–38. [Google Scholar] [CrossRef]
- Maheshwari, P.; Tambawala, Y.; Nunna, H.S.V.S.K.; Doolla, S. A review on plug-in electric vehicles charging: Standards and impact on distribution system. In Proceedings of the 2014 IEEE International Conference on Power Electronics, Drives and Energy Systems (PEDES), Mumbai, India, 16–19 December 2014; pp. 1–6.
- Mwasilu, F.; Justo, J.J.; Kim, E.-K.; Do, T.D.; Jung, J.-W. Electric vehicles and smart grid interaction: A review on vehicle to grid and renewable energy sources integration. Renew. Sustain. Energy Rev. 2014, 34, 501–516. [Google Scholar] [CrossRef]
- Choi, W.; Kim, J. Electrification of public transportation: Battery swappable smart electric bus with battery swapping station. In Proceedings of the 2014 IEEE Conference and Expo, Transportation Electrification Asia-Pacific (ITEC Asia-Pacific), Beijing, China, 31 August–3 September 2014; pp. 1–8.
- Performance of Electric Buses in Practice: Energy Consumption and Range; TNO Report 2013 R10212; The Netherlands Organisation for Applied Scientific Research (TNO): Delft, The Netherlands, 2013.
- E-Buses for SolaRoad; TNO Report for the Province of North Holland; The Netherlands Organisation for Applied Scientific Research (TNO): Delft, The Netherlands, 2014.
- Electric Buses for SolaRoad II; Internal TNO Document 2015 R10055; The Netherlands Organisation for Applied Scientific Research (TNO): Delft, The Netherlands, 2015.
- Wu, H.H.; Gilchrist, A.; Sealy, K.; Israelsen, P.; Muhs, J. A review on inductive charging for electric vehicles. In Proceedings of the 2011 IEEE International Electric Machines & Drives Conference (IEMDC), Niagara Falls, ON, Canada, 15–18 May 2011; pp. 143–147.
- Prasanth, V.; Bauer, P. Distributed IPT Systems for Dynamic Powering: Misalignment Analysis. IEEE Trans. Ind. Electron. 2014, 61, 6013–6021. [Google Scholar] [CrossRef]
- Bombardier PRIMOVE Website. Available online: http://primove.bombardier.com/media/news/ (accessed on 15 October 2015).
- Shekhar, A.; Prasanth, V.; Bauer, P.; Bolech, M. Generic methodology for driving range estimation of electric vehicle with on-road charging. In Proceedings of the 2015 IEEE Transportation Electrification Conference and Expo (ITEC), Dearborn, MI, USA, 14–17 June 2015; pp. 1–8.
- Shekhar, A.; Bolech, M.; Prasanth, V.; Bauer, P. Economic considerations for on-road wireless charging systems—A case study. In Proceedings of the 2015 IEEE PELS Workshop on Emerging Technologies: Wireless Power (WoW), Daejeon, Korea, 5–6 June 2015; pp. 1–5.
- Roadway Powered Electric Vehicle Project Parametric Studies: Phase 3D Final Report; California Partners for Advanced Transit and Highways Research Report; University of California: Berkeley, CA, USA, 1996.
- Jang, Y.J.; Suh, E.S.; Kim, J.W. System Architecture and Mathematical Models of Electric Transit Bus System Utilizing Wireless Power Transfer Technology. IEEE Syst. J. 2015. [Google Scholar] [CrossRef]
- Shin, J.; Shin, S.; Kim, Y.; Ahn, S.; Lee, S.; Jung, G.; Jeon, S.-J.; Cho, D.-H. Design and Implementation of Shaped Magnetic-Resonance-Based Wireless Power Transfer System for Roadway-Powered Moving Electric Vehicles. IEEE Trans. Ind. Electron. 2014, 61, 1179–1192. [Google Scholar] [CrossRef]
- Rim, C.T. The Development and Deployment of On-Line Electric Vehicle (OLEV). In Proceedings of the IEEE Energy Conversion Congress and Exposition (ECCE), Denver, CO, USA, 15–19 September 2013.
- Build Your Dreams (BYD) E-Bus. 2014. Available online: http://www.byd.com/la/auto/ebus.html (accessed on 13 September 2014).
- Standardised On-Road Test Cycles; International Association of Public Transport (UITP): Brussels, Belgium, 2009.
- United States Environmental Protection Agency. Dynamometer Drive Schedules. Available online: http://www.epa.gov (accessed on 13 September 2014).
- Van Assen, V. Physics of City Buses and Their Environment. Master Thesis, University of Groningen, Groningen, The Netherlands, 2013. [Google Scholar]
- Inzetbaarheid Van Zero Emissie Bussen In Nederland; Ministerie van Infrastructuur en Milieu, TNO, R10315; TNO: Den Hague, The Netherlands, 2015. (In Dutch)
- Wolterink, S.; Bauer, P. High range on-line electric vehicles powered by Inductive Power Transfer. In Proceedings of the 2014 IEEE Transportation Electrification Conference and Expo (ITEC), Dearborn, MI, USA, 15–18 June 2014; pp. 1–7.
- Jager, K.; Isabella, O.; Smets, A.H.M.; Van Swaaij, R.A.C.M.M.; Zeman, M. A Student Introduction to Solar Energy. Available online: https://courses.edx.org (accessed on 25 September 2014).
- Sallan, J.; Villa, J.L.; Llombart, A.; Sanz, J.F. Optimal Design of ICPT Systems Applied to Electric Vehicle Battery Charge. IEEE Trans. Ind. Electron. 2009, 56, 2140–2149. [Google Scholar] [CrossRef]
- Chopra, S.; Bauer, P. Driving Range Extension of EV with On-Road Contactless Power Transfer—A Case Study. IEEE Trans. Ind. Electron. 2013, 60, 329–338. [Google Scholar] [CrossRef]
- De Doncker, R.W. Power electronic technologies for flexible DC distribution grids. In Proceedings of the 2014 International Power Electronics Conference (IPEC-Hiroshima 2014—ECCE-ASIA), Hiroshima, Japan, 18–21 May 2014; pp. 736–743.
- Stamati, T.-E.; Bauer, P. On-road charging of electric vehicles. In Proceedings of the 2013 IEEE Transportation Electrification Conference and Expo (ITEC), Detroit, MI, USA, 16–19 June 2013; pp. 1–8.
- Covic, G.A.; Boys, J.T. Modern Trends in Inductive Power Transfer for Transportation Applications. IEEE J. Emerg. Sel. Top. Power Electron. 2013, 1, 28–41. [Google Scholar] [CrossRef]
- Schlick, T.; Hagemann, B.; Kramer, M.; Garrelfs, J.; Rassmann, A. Zukunftsfeld Energiespeicher; Roland Berger: Munich, Germany, 2012. (In German) [Google Scholar]
- Ko, Y.D.; Jang, Y.J. The Optimal System Design of the Online Electric Vehicle Utilizing Wireless Power Transmission Technology. IEEE Trans. Intell. Transp. Syst. 2013, 14, 1255–1265. [Google Scholar] [CrossRef]
- Pantic, Z.; Bai, S.; Lukic, S.M. Inductively coupled power transfer for continuously powered electric vehicles. In Proceedings of the Vehicle Power and Propulsion Conference, VPPC ‘09, Dearborn, MI, USA, 7–10 September 2009; pp. 1271–1278.
- Verbeek, I.R.P.; Bolech, M.; Van Gijlswijk, R.N.; Spreen, I.J. TNO 2015 R10386. Energie en Milieu Aspecten Van Elektrische Personenvoertuigen. Available online: http://www.rvo.nl/actueel/nieuws/tno-elektrisch-rijden-tot-70-zuiniger (accessed on 15 October 2015). (In Dutch)
© 2016 by the authors; licensee MDPI, Basel, Switzerland. This article is an open access article distributed under the terms and conditions of the Creative Commons by Attribution (CC-BY) license (http://creativecommons.org/licenses/by/4.0/).
Share and Cite
Shekhar, A.; Prasanth, V.; Bauer, P.; Bolech, M. Economic Viability Study of an On-Road Wireless Charging System with a Generic Driving Range Estimation Method. Energies 2016, 9, 76. https://doi.org/10.3390/en9020076
Shekhar A, Prasanth V, Bauer P, Bolech M. Economic Viability Study of an On-Road Wireless Charging System with a Generic Driving Range Estimation Method. Energies. 2016; 9(2):76. https://doi.org/10.3390/en9020076
Chicago/Turabian StyleShekhar, Aditya, Venugopal Prasanth, Pavol Bauer, and Mark Bolech. 2016. "Economic Viability Study of an On-Road Wireless Charging System with a Generic Driving Range Estimation Method" Energies 9, no. 2: 76. https://doi.org/10.3390/en9020076
APA StyleShekhar, A., Prasanth, V., Bauer, P., & Bolech, M. (2016). Economic Viability Study of an On-Road Wireless Charging System with a Generic Driving Range Estimation Method. Energies, 9(2), 76. https://doi.org/10.3390/en9020076