Article

Financing Innovations for the Renewable Energy Transition in Europe

1
Institute of Energy Systems and Electric Drives, Energy Economics Group, Vienna University of Technology, Gusshausstrasse 25-29/370-3, 1040 Vienna, Austria
2
e-think Energy Research, Argentinierstrasse 18/10, 1040 Vienna, Austria
3
Institute for Renewable Energy, European Academy of Bozen/Bolzano (EURAC Research), Viale Druso 1, 39100 Bolzano, Italy
*
Author to whom correspondence should be addressed.
Energies 2016, 9(12), 990; https://doi.org/10.3390/en9120990
Submission received: 21 September 2016 / Revised: 8 November 2016 / Accepted: 16 November 2016 / Published: 25 November 2016
(This article belongs to the Special Issue Energy Time Series Forecasting)

Abstract

:
Renewable energy sources are vital to achieving Europe’s 2030 energy transition goals. Technological innovation, driven by public expenditures on research and development, is a major driver for this change. Thus, an extensive dataset on these expenditures of the European Member States and the European Commission, dating back to the early 1970s, was created. This paper creates predictive scenarios of public investment in renewable energy research and development in Europe based on this historical dataset and current trends. Funding from both, European Member States and the European Commission, between today and 2030 are used in the analysis. The impact on the cumulative knowledge stock is also estimated. Two projection scenarios are presented: (1) business as usual; and (2) an advanced scenario, based on the assumption that the Mission Innovation initiative causes public expenditures to increase in the coming years. Both scenarios are compared to the European 2030 climate and energy framework target sets. Results indicate that Member States in Europe currently tend to fund renewables more than the European Commission, but funding from both sources is expected to increase in the future. Furthermore, the European Commission distributes its funding more equally across the various renewable energy sources than Member States.

1. Introduction

After World War II, many European countries agreed it was necessary to reconstruct their economies and establish a long-term peace. One major challenge was reducing competition among European countries over natural resources. To facilitate this, the European Coal and Steel Community (ECSC) was created in 1951. The ECSC was an international organization creating a common market for coal and steel among the member countries. The original members were Belgium, France, Italy, the Federal Republic of Germany, The Netherlands, and Luxembourg. This was the first step toward the creation of the European Union (EU) [1]. Six years later, the European countries continued toward integration by creating a second international energy collaboration, the European Atomic Energy Community (EURATOM) [2]. Energy was a primary issue in the development of the EU [3]. The EU can only provide half of its gross inland energy consumption (~47% in 2013) [4]. Despite significant efforts to transition towards a low-carbon economy, the EU is highly dependent on non-renewable (primarily fossil fuels) imports. Most of the imports come from Africa, Russia, and OPEC (Organization of Petroleum Exporting Countries), which are fragile markets due to current conflicts. The International Energy Agency (IEA) predicts that Europe’s energy import dependence will increase in the future, reaching 90% in 2035.
To overcome the significant climate and fossil energy dependency the EU is currently facing specific goals for 2020 and 2030.
The EU aims to reduce greenhouse gas (GHG) emissions by 20% compared to 1990 levels by 2020. Energy from renewable energy sources (RES) is to reach 20% of total energy production in the same time period. A 20% increase in energy efficiency is also anticipated, significantly reducing the total primary energy consumption. Further efforts, particularly in regards to energy efficiency, will be required to achieve the 2020 and 2030 targets [5].
An integrated policy regulation is necessary. It will help meet the 2030 targets by facilitating collaboration between the EU Member States (MS), and ensuring long-term regulatory certainty for investors. The GHG goal is to reduce emissions by 40%, relative to 1990 levels, by 2030. Production from renewable energy sources is expected to rise to 27% of the total, and national policy measures have been created to encourage permanent energy efficiency increases [6].
Recently, scientific literature emphasizes the importance of public Research and Development (R&D) in energy technologies (especially RES) to achieve the cited targets. Highly relevant publications include the Energy Roadmap 2050 [7], and the European Strategic Energy Technology Plan (SET-Plan) [8]. While these documents stress the importance of supporting R&D efforts in energy, they don’t indicate the levels of funding necessary to achieve the goals. Totals of spending on energy R&D are difficult to acquire, especially at the EU level. This means it is not entirely clear how these goals of energy policy influence R&D expenditures and vice versa. The cumulative energy knowledge stock induced by R&D expenditures helps to overcome this problem. The cumulative knowledge stock is not entirely independent from fluctuations of R&D expenditures but more stable and resilient. Therefore, we investigate the development of R&D expenditures and the cumulative knowledge stock in the following sections.
As starting point, many documents regarding EU R&D programmes have been scrutinized to identify the R&D spending from the European Commission (EC). The so-called Framework Programmes (FPs) were considered particularly relevant. In addition, the R&D expenditures of the EU Member States were collected from an IEA database. We created a consistent database of research and development expenditures for renewable energy sources for both, the European Commission and the European Member States, starting in 1974.
Based on our comprehensive database, economic factors, e.g., gross domestic product, and preferred technologies, different scenarios of future expenditures were produced. The provided scenarios estimate both the annual and the resulting cumulative knowledge stock. Interestingly, the priorities of R&D expenditures of the EU Member States are not always in line with the European Commission’s priorities. Moreover, priorities have also changed over time. For this reason all subsequent findings are shown for the EU Member State and the European Commission separately. The presented work uses the described analysis to answer the following research questions:
  • How much energy R&D funding will be provided by the EU MS, and the EC between the present and 2030?
  • Are RES sources funded equally?
  • Are the EU MS and EC energy knowledge stocks different?
Section 2 describes the materials and methods. Results are presented in Section 3 and are discussed in Section 4. Both Section 3 and Section 4 attempt to answer the previously indicated questions.
Results show that, though annual R&D funding fluctuates over time, the cumulative knowledge stock is gradually increasing. The cumulative knowledge stock is only marginally sensitive to yearly variations, making it significantly different from annual spending. For this reason, it is considered a robust tool for estimating the long-term impacts of R&D spending on energy.

2. Materials and Methods

2.1. Energy R&D of the EU MS and the EC

The IEA R&D database contains easily accessible data on energy expenditures from the EU MS [9]. It provides annual public energy R&D expenditure data for each IEA MS since 1974. Eight sections have been defined to guarantee consistency between European [10] and national expenditures. They are: photovoltaics (PV), wind energy, bioenergy, ocean energy, hydroelectricity, geothermal energy, concentrated solar power (CSP), solar heating and cooling—including renewable heating and cooling (RHC), as well as the final category other and unallocated RES. The analysis considers IEA and EU member states, as shown in Table 1. There are no data for EU MS that are not in the IEA. This analysis only considers European MS that are part of the IEA. The implications of this limitation will be discussed in Section 2.4.
The European Framework Programmes (FP1-Horizon 2020) from 1984 to 2020 are the largest sources of R&D funding from the EC [11,12,13,14,15,16,17,18]. Analysis of the historic R&D expenditures of the EC are in annex I of the World Economic Council (WEC) and Di Valdalbero [19], along with a study by the EC [7], which also included raw data on FP1-Horizon 2020 (H2020). Further data describing European R&D funding has been obtained from the EC [7,12,13,20,21,22] and Di Valdalbero [19]. Consistently, RES have gained importance since the inception of EU R&D activities. An extensive database was created to quantify the public energy R&D expenditures of the EC and the EU MS and seems to be the only of its kind with time series since the 1970s.
For FP6, FP7, and H2020, the database contains information at the project level. Therefore, all RES projects funded by the EC, have been analyzed and individually assigned to their sector. The most recent data set is from 2016.
All R&D expenditures were converted to 2014 real prices using Eurostat [4] and Organisation for Economic Co-operation and Development (OECD) [23] time-based annual inflation rates.
Finally, note that private R&D funding is proprietary, and could not be acquired and included in the analysis. This study considers solely public funding.

2.2. Scenarios of Public R&D Expenditures until 2030

Annual R&D spending from the EU MS has historically fluctuated significantly; cf. inter alia Baccini and Urpelainen [24]. We developed both business-as-usual (BAU) and advanced scenarios, assuming that this trend continues until 2030. Both scenarios are coupled with forecasts of the gross domestic product (GDP) for each EU MS. Gross domestic product growth for each country, between 2014 and 2030, was derived from the OECD [23]. Table 2 shows the GDP for each IEA/EU MS from 2014–2030. The BAU and advanced scenarios both assume the same OCED GDP development.
Formulae from Bointner et al. [25] were rearranged for the data analysis. For the BAU case (R&DBAU), the funding estimate is based on the GDP growth of country i and the floating average of the R&D expenditures for the last five years in RES technology group k according to Equation (1). t denotes the time in years:
R & D BAU   ( t ,   i ,   k ) =   i = 1 n k = 1 8 t 5 t 1 R & D   t , i ,   k ¯ * GDP t ,   i GDP t 1 ,   i [ EUR ]
The BAU scenario assumes that the status quo of R&D expenditures is maintained for each of the countries that are also both IEA and EU MS. It assumes that there will be no major changes, such as turnaround of energy policy, which would tremendously impact the results. The purpose of the BAU scenario is to predict potential future developments based on current R&D expenditures, thus implicitly considering the current macro-economic situation in Europe. Providing a BAU scenario is important as it is highly unlikely that all countries change their energy R&D policy in the next five or ten years at once. Even if a single country radically changes their R&D policy, the global effect may be negligible due to consistency in the other countries. Directional movement of energy R&D policy in Europe is assumed in the advanced scenario below.
The advanced scenario assumes increasing funding in the EU MS and the EC due to the Mission Innovation initiative (MI). In addition to the European Union as a whole, Denmark, France, Germany, Italy, Sweden, and the United Kingdom signed the initiative [27]. Mission Innovation began in November 2015 and aims to double present governmental and/or state-directed R&D investment in clean energy over five years (by 2021) [28]. Anyway, it seems far from being realistic to double the public R&D investments in such a short time-span. Thus, the advanced scenario assumes a doubling of the indicated average R&D expenditures from 2013–2015 due to MI by 2030, which is—under the current macro-economic situation—ambitious but more realistic. Given that, the advanced scenario can be seen as the highest possible commitment to invest in RES R&D. Without taking the GDP development into consideration, a simple doubling of R&D expenditures would not double the efforts. Thus, the research intensity (R&D per GDP) is included and the resulting R&D expenditures in 2030 are somewhat larger than the present levels. Values from 2016 to 2029 are interpolated. New investments will be focused on transnational clean energy innovations, which can be scaled to varying economic and energy market conditions in participating countries. See Equation (2):
R & D Advanced   ( 2030 ,   i ,   k ) =   i = 1 n k = 1 8 2013 2015 R & D   i ,   k ¯ GDP 2030 ,   i 2013 2015 G D P i ¯   [ EUR ]

2.3. Cumulative RES Knowledge Stock

The cumulative knowledge stock (KS) for each RES for 1974 to 2030 in Europe has been calculated using the annual R&D expenditures of each EU MS and the EC. It has been broken into eight groups (k) based on the IEA classification of RES. This includes both the depreciated cumulative knowledge stock from the previous period (1 − δ) × KS (t − 1), and the EC and EU MS R&D expenditures in period t − x. The cumulative knowledge stock in monetary values of eight (k) RES and n countries is as shown in Equation (3):
KS   MS ( t , i ,   k )   R & D   =   i = 1 n k = 1 8 ( 1     δ )   ×   KS MS ( t 1 ) ,   i ,   k   +   R & D ( t x ) MS , i ,   k   [ EUR ]
The depreciation rate (δ) describes the loss of knowledge each year when certain technology know-how is not in use. For example, if rapid innovation occurs or if there is significant staff turnover. This implies that past R&D knowledge always becomes less relevant over time. Additionally, the time lag x assumes a time-dependency between R&D spending and a gain of related knowledge. For instance, the energy R&D expenditures of 2027 account for the knowledge stock in 2030, with a given time lag x of three years with δ = 10%. Klaassen et al. [29] and Kobos et al. [30] offer a comprehensive overview of the methodology. Other sources of information are available in the literature review conducted by Bointner [31]. This approach, which is used in both the BAU and advanced scenarios, is presented in Equation (4):
KS   EC ( t ,   k )   R & D   =   k = 1 8 ( 1     δ )   ×   KS EC ( t 1 ) ,   k   +   R & D ( t x ) EC ,   k   [ EUR ]

2.4. Literature Review and Discussion of the Method

There are some limitations of the applied method. While the IEA database is considered to be the best source of data on energy R&D expenditures, it is not exhaustive. Some members do not provide annual data. Additionally, the accounting methodology and geographical range changed over time [32]. For example, the Czech Republic, Hungary, Poland, and Slovakia all became IEA members during the period from 1995–2000. Furthermore, some countries, such as Germany, do not provide regional R&D funding data. Finally, as stated in Chapter 2.1 not all EU MS are also members of the IEA. According to Wiesenthal et al. [33] these states account for 99% of the EU MS R&D expenditures and, the energy R&D expenditures of the non-IEA MS can safely be neglected. More information about IEA dataset limitations are available in Wiesenthal et al. [33] and IEA [9]. Di Valdalbero [19] provides pros and cons of the method used to derive R&D scenarios.
No R&D expenditures by the EC are available before 1987. More detailed data becomes available over time.
The cumulative knowledge stock calculation is based on public R&D investment. In reality, the relationship between R&D expenditures and technological outcomes, including knowledge stock, is highly uncertain. Other factors, such as learning-by-doing, private R&D expenditures, and knowledge spillovers from other sectors, are also significant. Fluctuating R&D programmes can be ineffective [24] because the supply of trained scientists and engineers is inelastic in the short run [34]. Critically, returns on R&D investment may decrease over time [35]. However, public energy R&D expenditures are important to avoid market failure [35,36]. A detailed discussion of implications and limitations of the analysis of cumulative knowledge stock can be found in Bointner [31].
Research and development expenditures have a time lag, instead of causing an instantaneous knowledge gain. Most scholars found delays of two to five years [29,30,37,38]. Thus, we assumed a time lag, x, of three years, which is similar to the average RES project duration of 2.8 years in FP6, FP7, and H2020. The sensitivity of knowledge stock to depreciation rate has been studied previously [31], so we treated depreciation rate as a constant 10%.
Furthermore, the level of R&D expenditures reflects the market potential, availability of a specific energy source in a certain country, and also the maturity of a technology. For instance, hydropower is a mature technology, and receives low public R&D expenditures. Immature technologies are significantly more dependent on public support. Finally, the lack of private energy R&D data is a significant limitation. Private energy R&D data are rarely available, and either fragmented or for a specific technology. The term “company” is very critical in this regard, as they often consist of various legal entities and the structure can be unclear. Such bottom-up collection of private R&D data faces many obstacles, limitations and assumptions. Conducting a similar analysis at the European scale for several decades is beyond the scope of this study.

3. Results

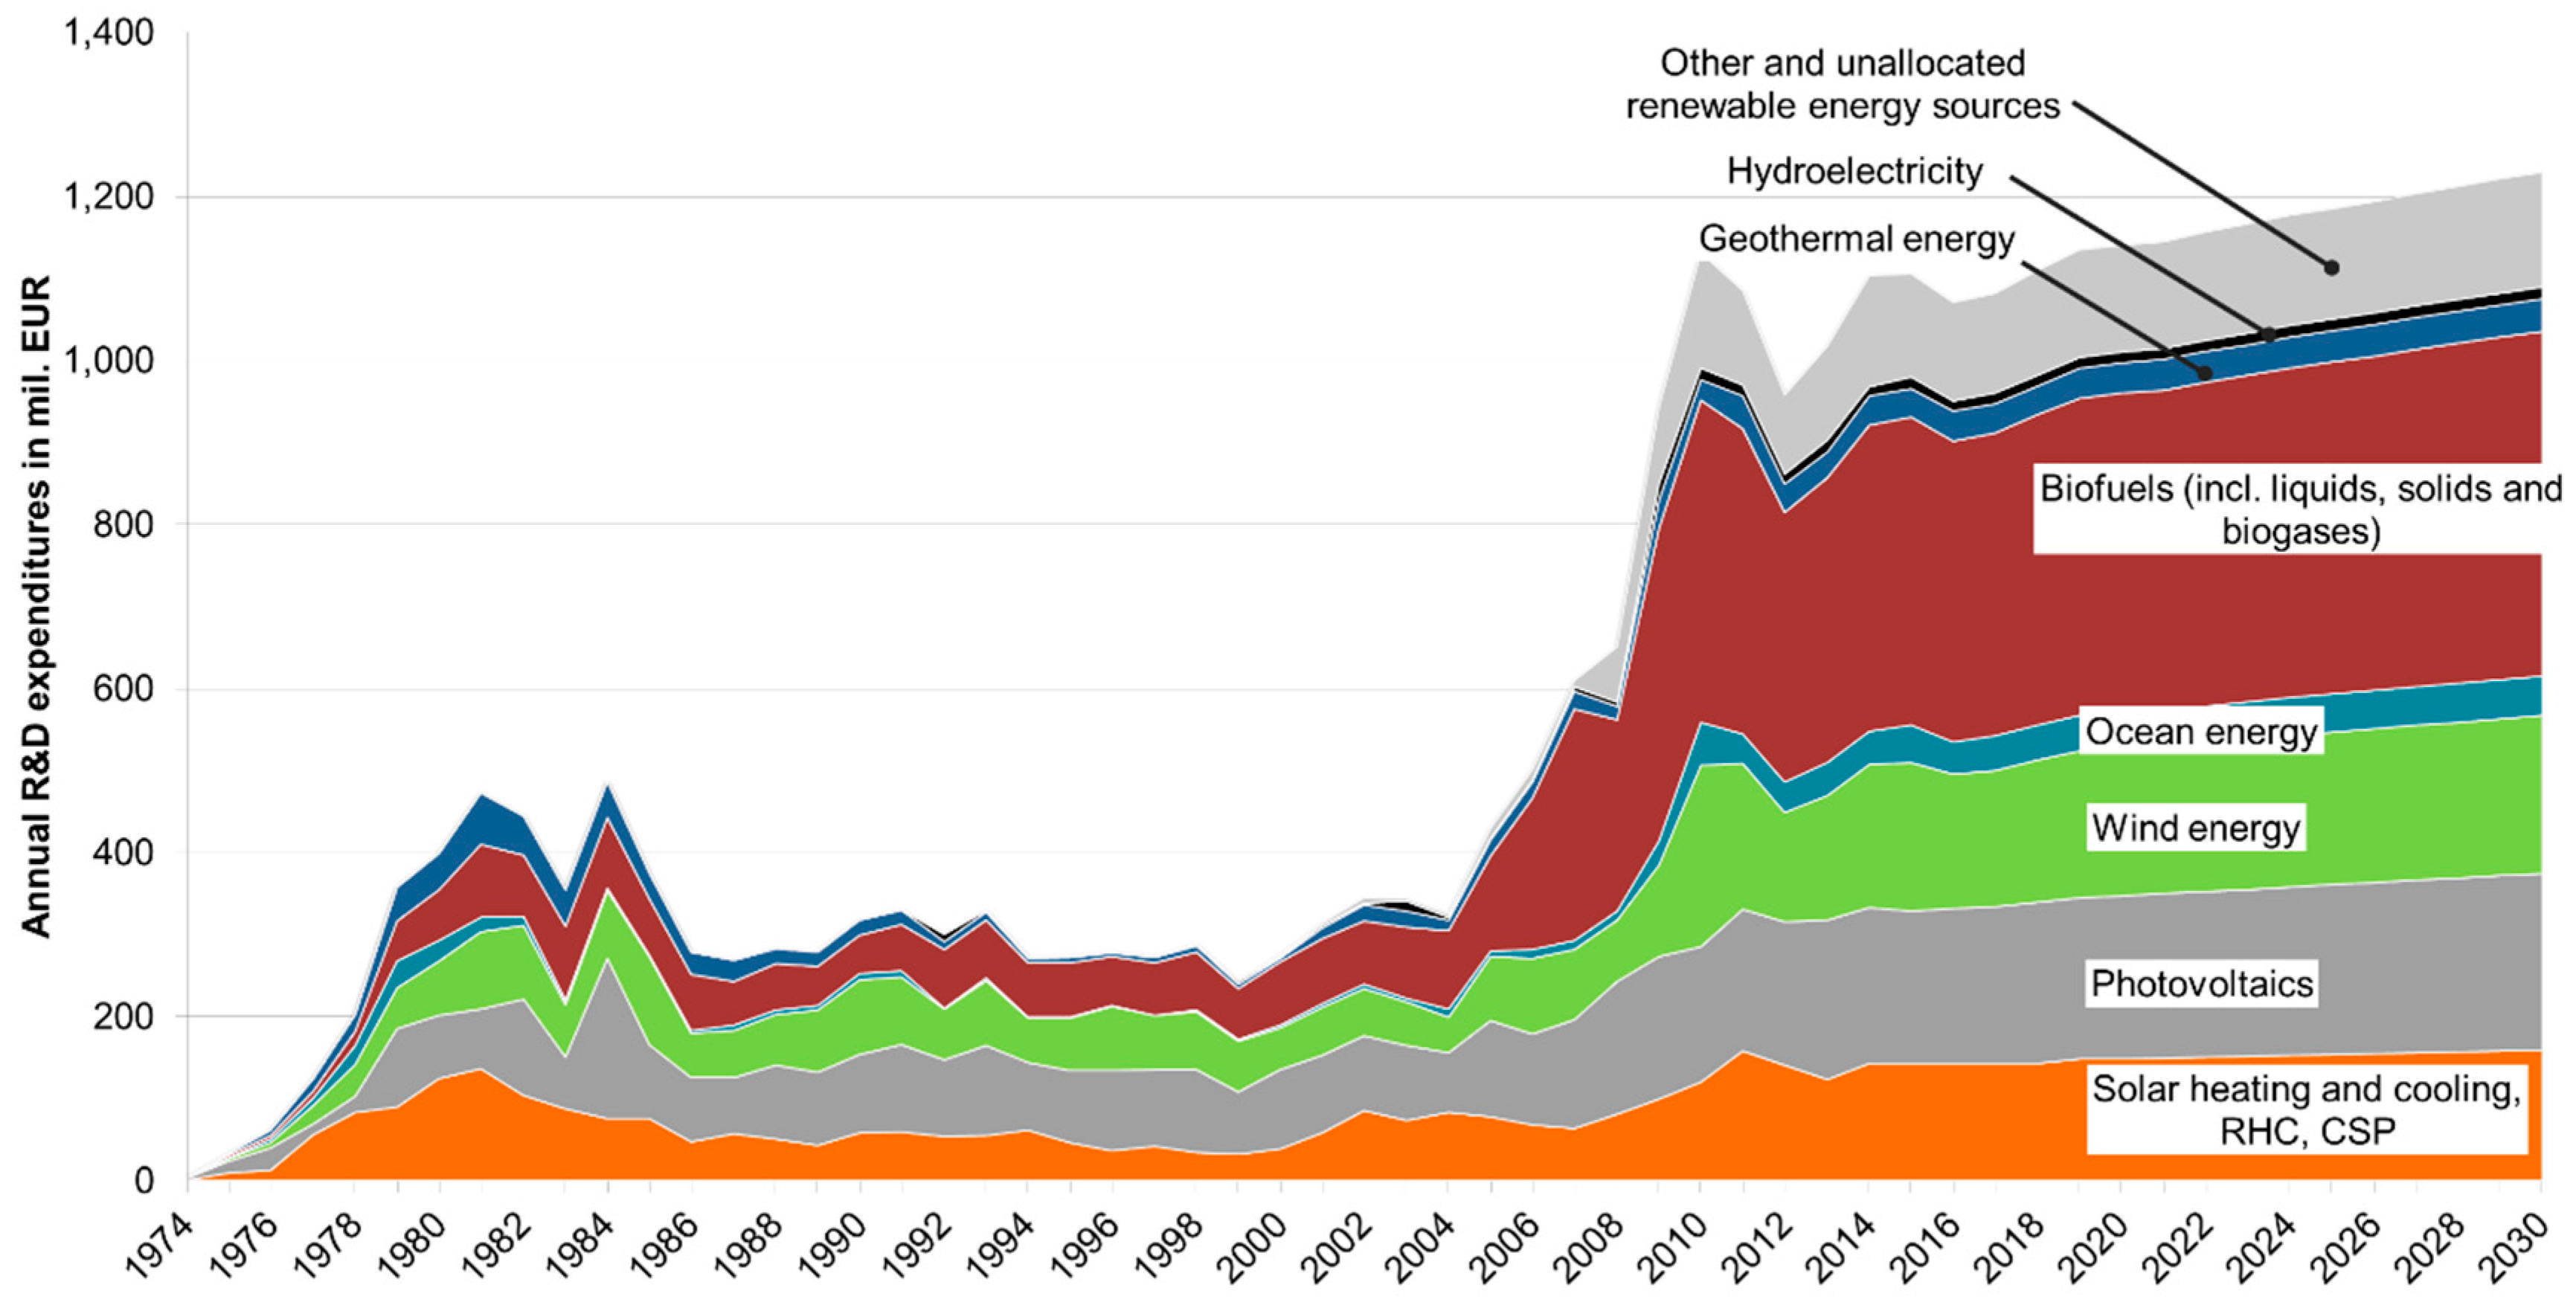
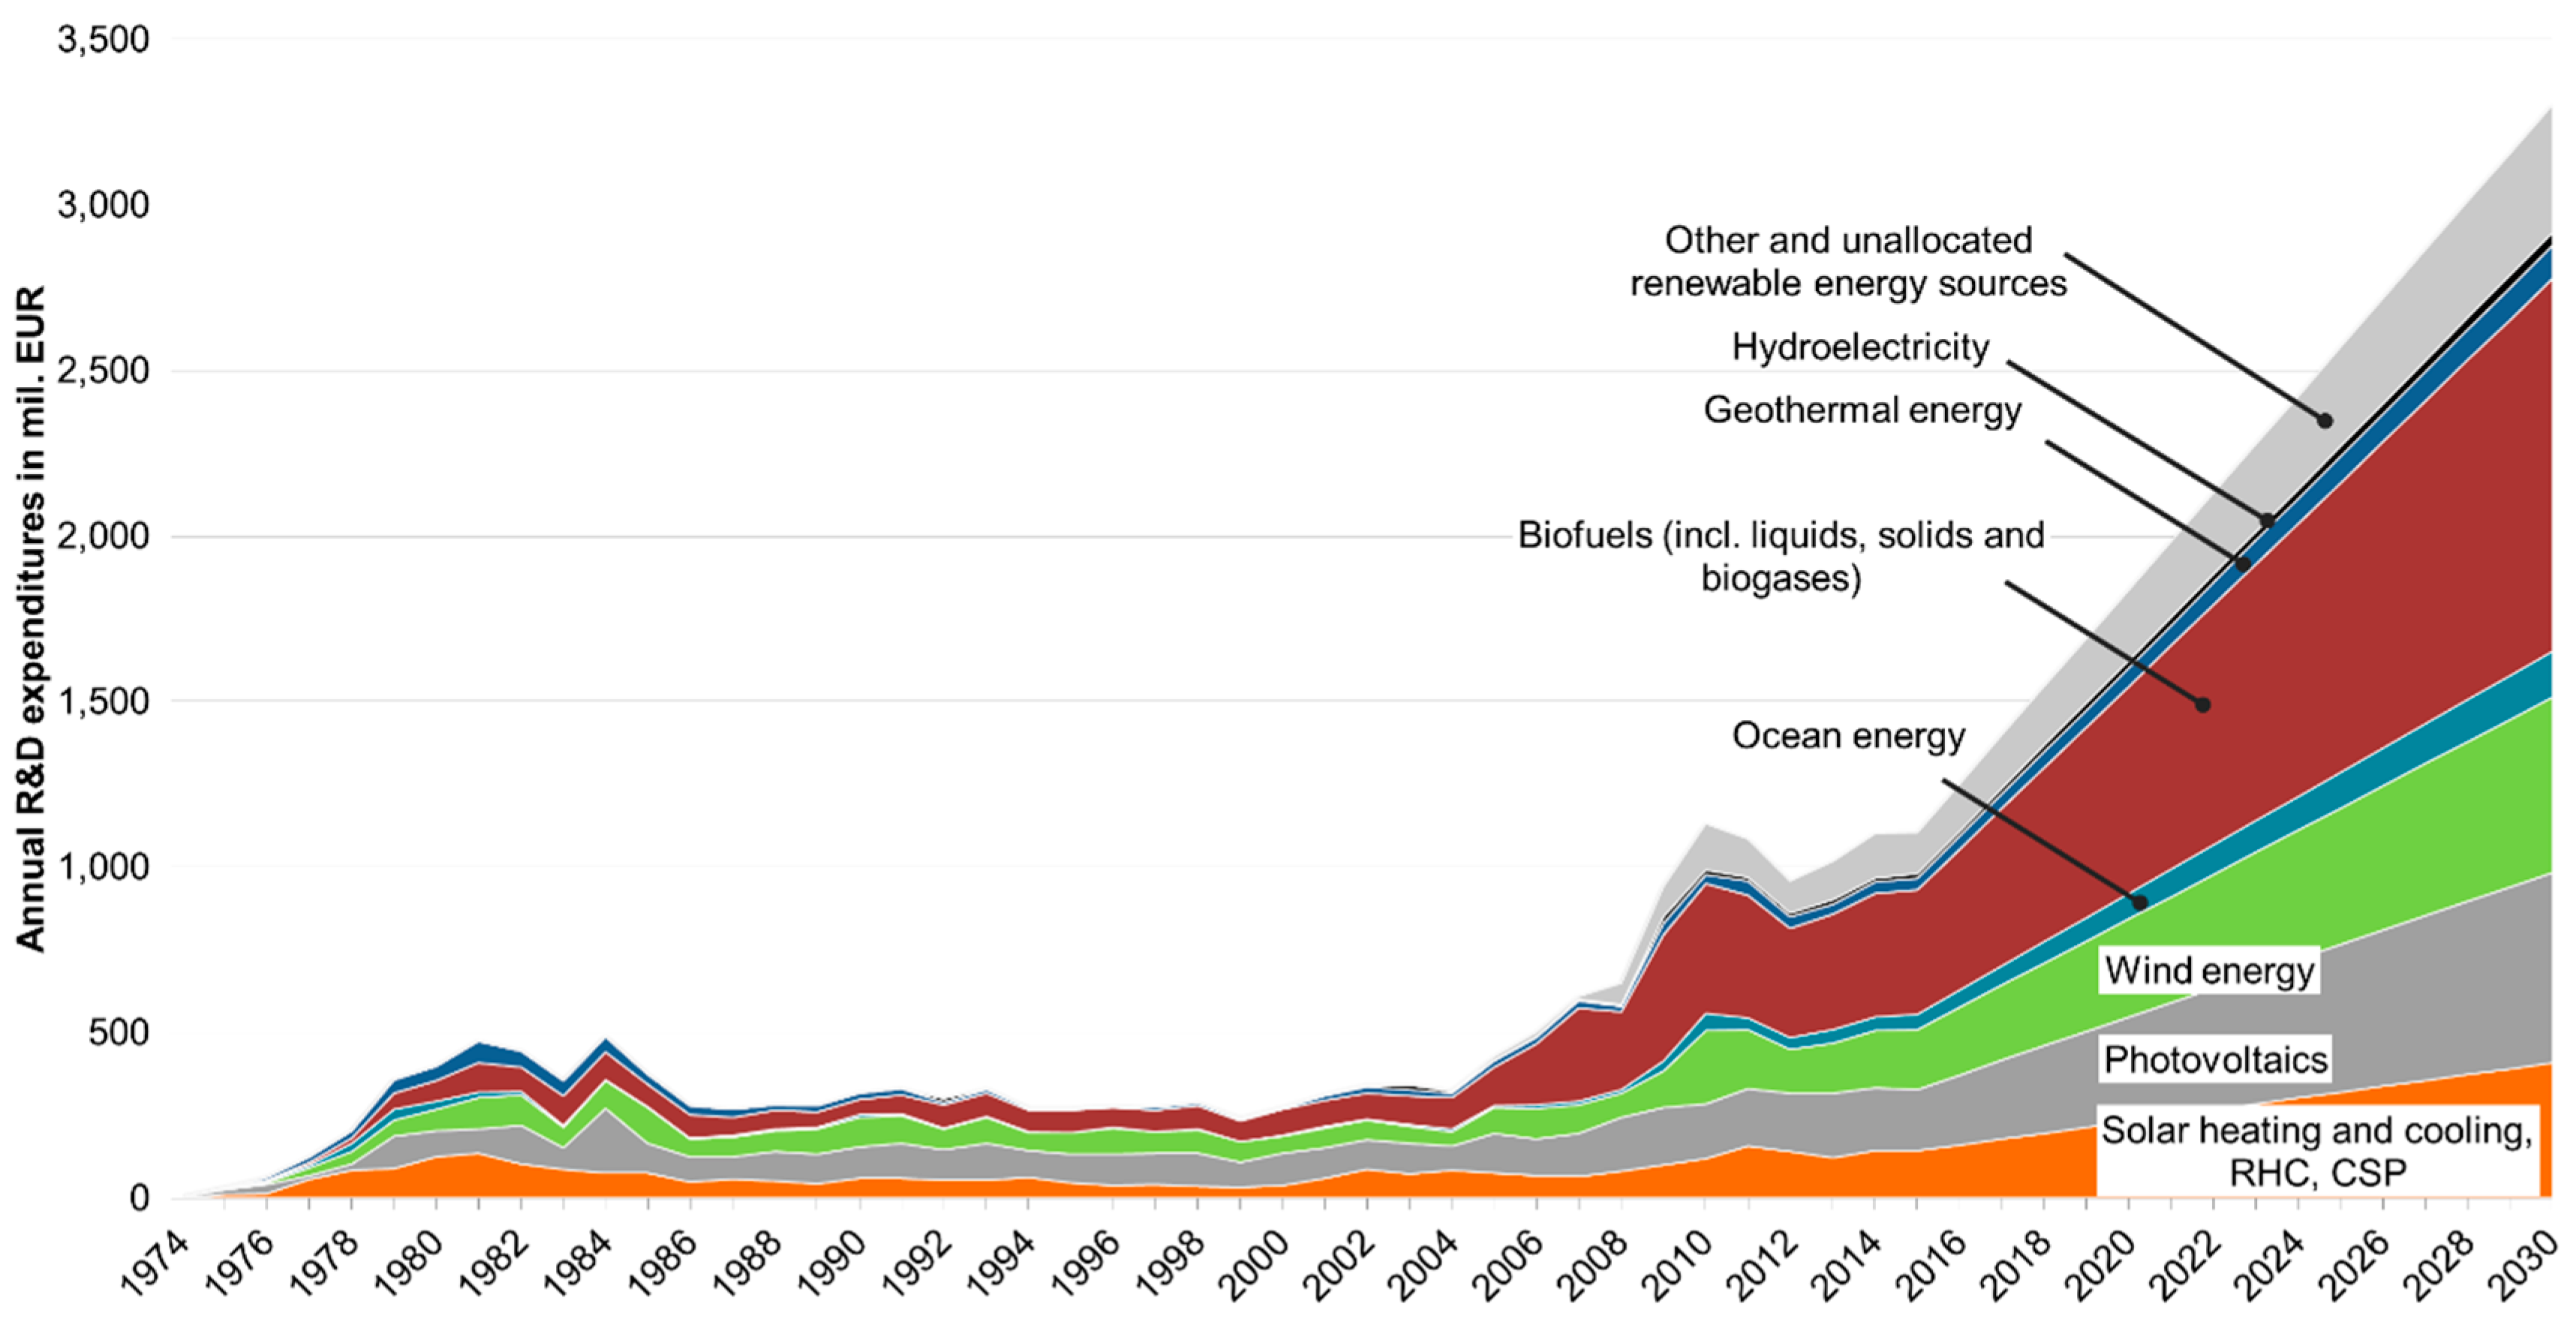
3.1. Annual Energy R&D Expenditures

3.1.1. European Union MS

The following Figure 1 and Figure 2 show the annual RES R&D expenditures of the European MS from 1974 to 2015 (the latest available data) and the two different scenarios, representing forecasts from 2016 to 2030.
In the early 1970s, during the Arab-Israeli War, OPEC imposed an oil embargo and oil prices drastically increased in Europe. From this moment on, the challenge was to find alternative energy sources to fossil fuels and reduce Europe’s dependence on energy imports. Figure 1 shows clearly the effects of the oil crises of 1973 and 1979 with constantly rising RES R&D expenditures and two peaks of total annual budgets of almost half a billion EUR in 1981 and 1984. However, the main alternative these days was nuclear energy as shown by Bointner et al. [25]. The decreasing R&D funding in the second half of the 1980s and minor R&D budgets during the 1990s are an effect of the low-level oil prices at that time. A new push for RES occurred in the late 1990s, after the objectives set by the Kyoto protocol in 1997. In fact, after that date, funding to RES sharply increased and almost quadrupled in 2008. After 2008, numbers fluctuate due to effects of the economic crisis that struck European countries. An interesting evidence derived from this time series is that, while in the past RES such as biofuels, wind energy, PV and solar heating and cooling, RHC, and CSP were funded nearly homogenously, after 2000 it is possible to see important differences. Biofuels, all solid, liquid and gaseous, were funded extensively and nowadays occupy the biggest portion (the IEA classification of R&D expenditures may be misleading: biofuels subsume not only liquid biofuels for transportation but solid biofuels, such as pellets and wood chips, gaseous biofuels, and applications for heat and electricity [39]. Thus, “biofuels” is subsequently used in figures to be consistent with the IEA nomenclature but “bioenergy” in the text to avoid misunderstanding). Hydroelectricity was poorly financed across years. This can be explained by the fact that the hydroelectricity potential had been already exploited in many parts of Europe and, thus, the possibility to increase its share is rather low [40] and the maturity of the technology, which makes public funding obsolete. Future projections, derived from our data analysis, show a slight increase in R&D funding for a number of RES, with the exception concerning Solar heating and cooling, RHC, and CSP, to be almost constant until 2030. Interestingly, scenarios produced seem to indicate an increase of funding for geothermal and ocean energy, of course at low levels compared to the dominant RES technologies. Such sources have been poorly exploited so far [41,42]. Renewable energy sources culminated in 2010 with an all-time maximum of more than 1.1 billion EUR. According to our BAU analysis, RES are expected to rise until 2030, exceeding 1.2 billion EUR. With regard to the latter mentioned years: bioenergy is ranked first, with approximately 400 million EUR. This is justified taking into consideration that more than 90% of renewable energy in Europe derives from bioenergy [43]. Moreover, bioenergy is considered as a RES form being capable of balancing environmental, social, and economic objectives [44]. Nevertheless, it is important to note that biofuels for transportation—in our analysis, a subsector of bioenergy—are discussed controversially in the EU. It is likely that future public R&D investments in this field may decline as the 10% biofuels target in transportation is coming under scrutiny [45]. Photovoltaics and wind energy follow with both about half of Bioenergy’s R&D budget. Solar heating and cooling, RHC, CSP, and other and unallocated RES come next with around 100 million EUR each. Ocean and geothermal energy are found in the second-to-last position with less than 50 million EUR. Hydroelectricity is allocated at last position with nearly 15 million EUR.
It has to be pointed out that around the year 2010 R&D expenditures reached a previously unforeseen level of 1.2 billion EUR, which, afterwards, remains rather constant until 2020, and rises as far as 2030, demonstrating the MS efforts in contributing to the 2020 target of a 20% increase in energy consumption derived from RES compared to 1990 levels and the respective challenge set until 2030 (27%).
In contrast to Figure 1, Figure 2 visualizes the development of MS expenditures assuming MI budgets for RES R&D would be respected from 2015 onwards and last until 2030. Unlike the previous BAU scenario, R&D funding for solar heating and cooling, RHC, and CSP are supposed to rise, even if at a lower rate compared to other RES. The increase of wind energy and PV funding is similar, while once again the share of bioenergy is much higher of other sources.
Furthermore, RES funding in 2030 would reach almost 3.5 billion EUR—almost three times the level provided by the BAU analysis in the previous chart.

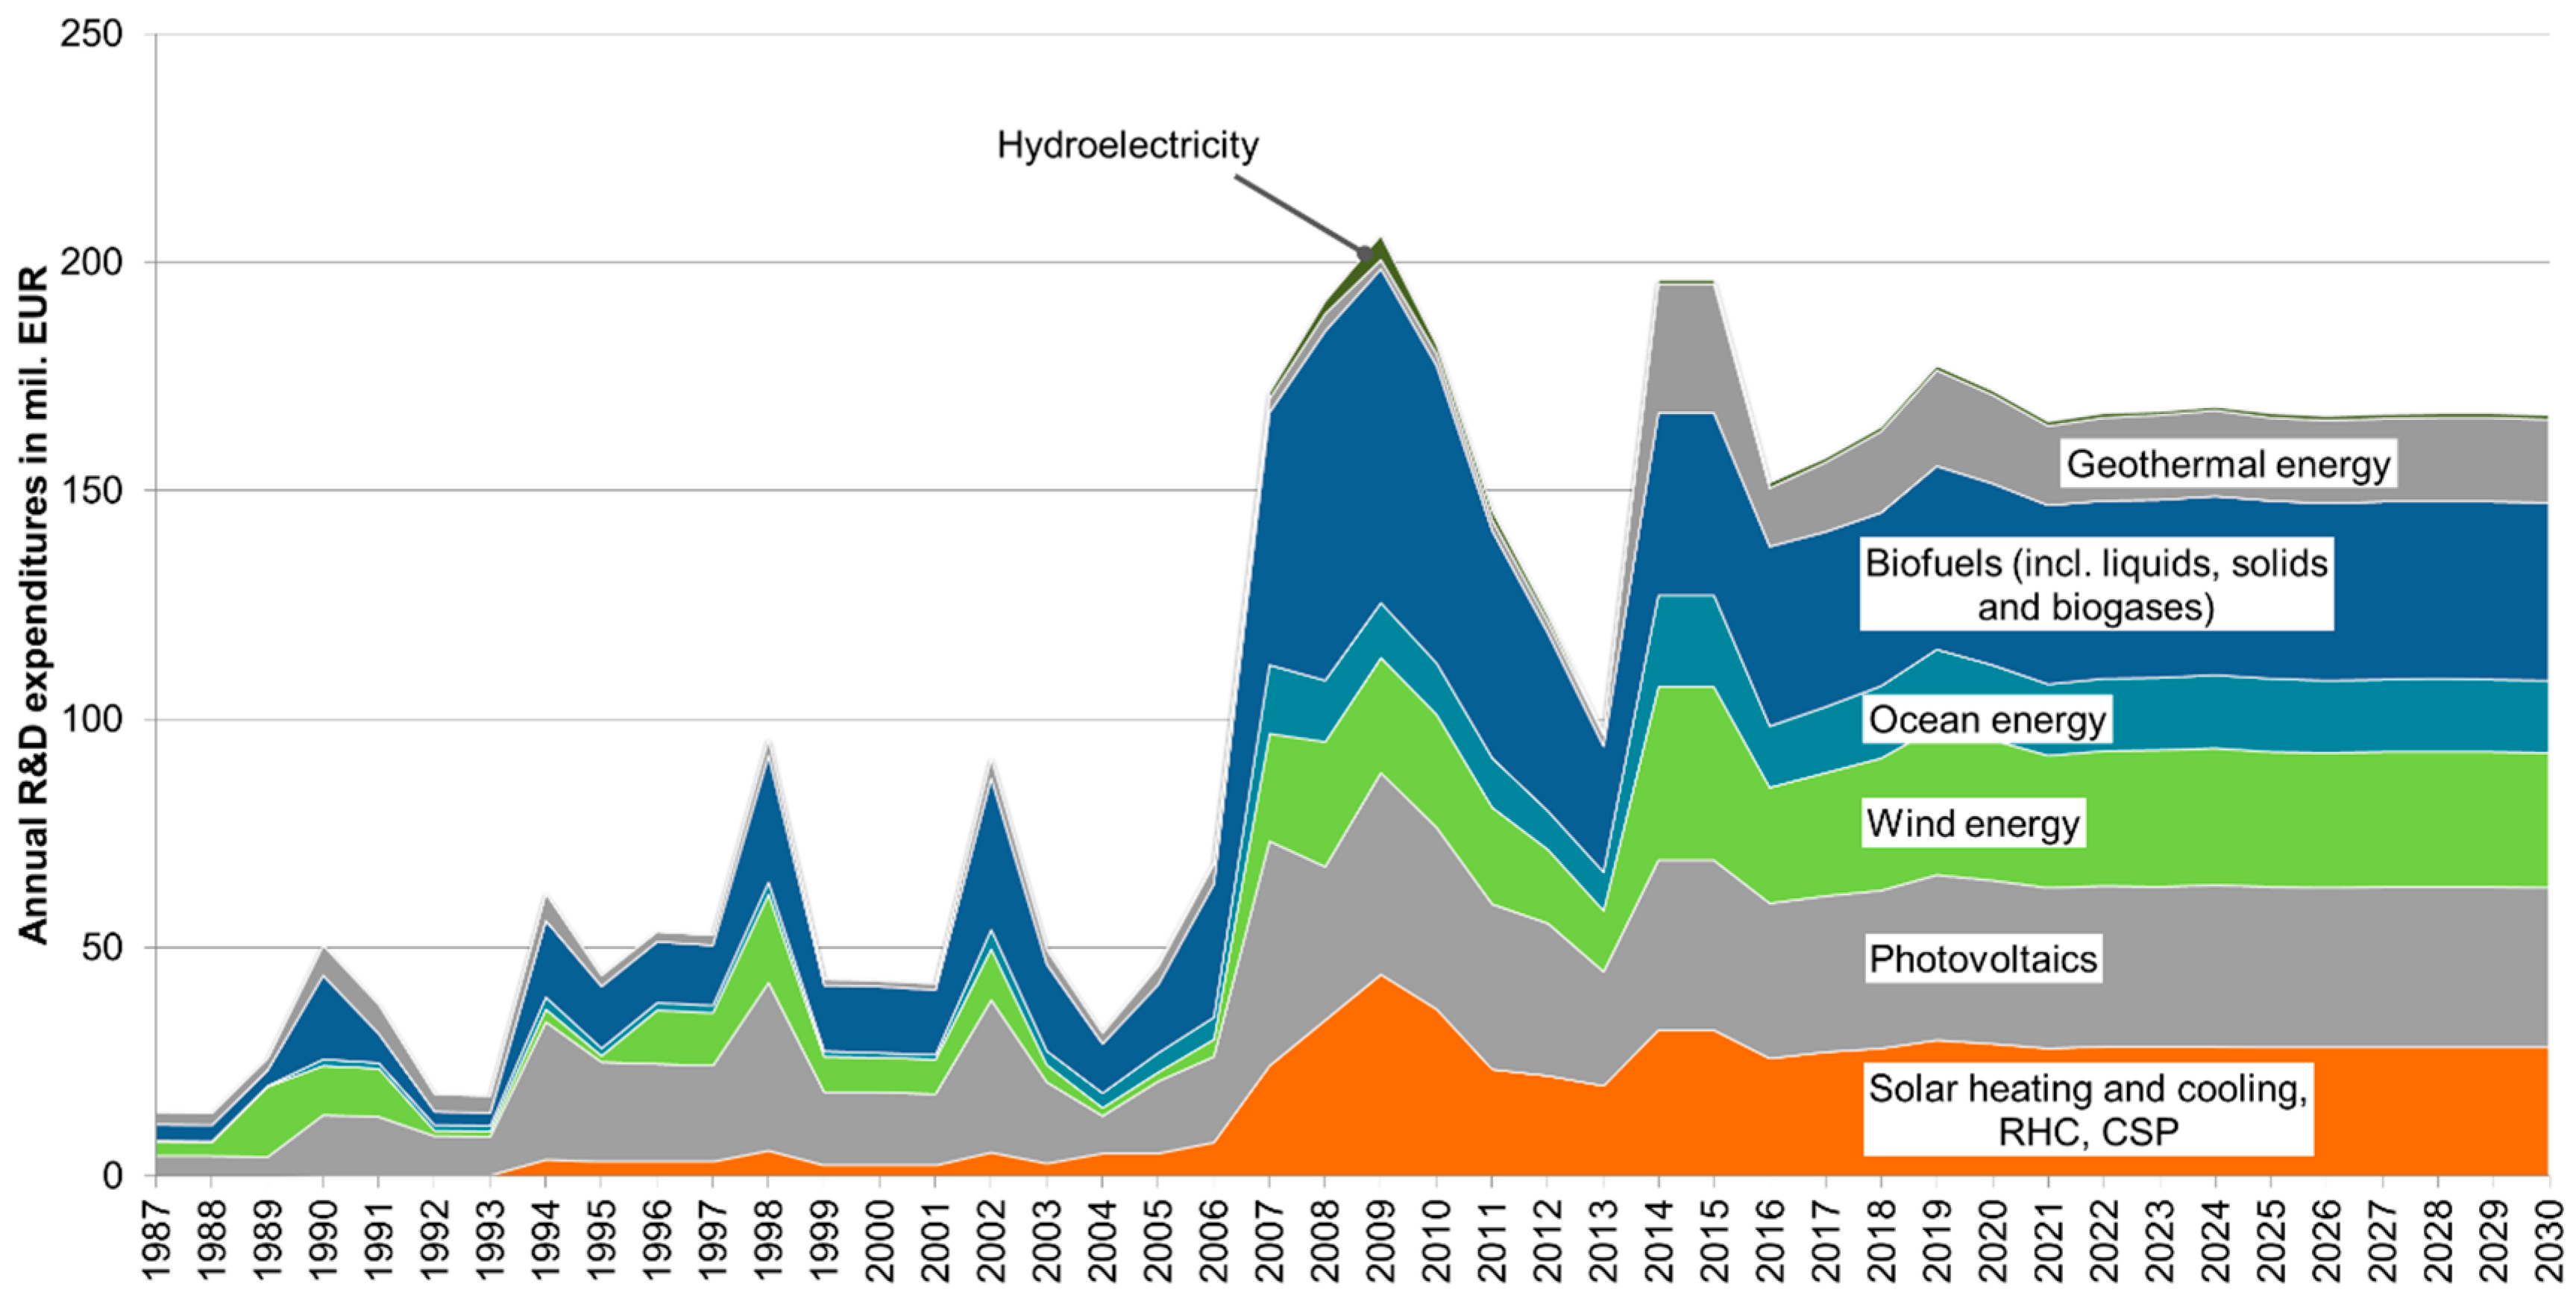
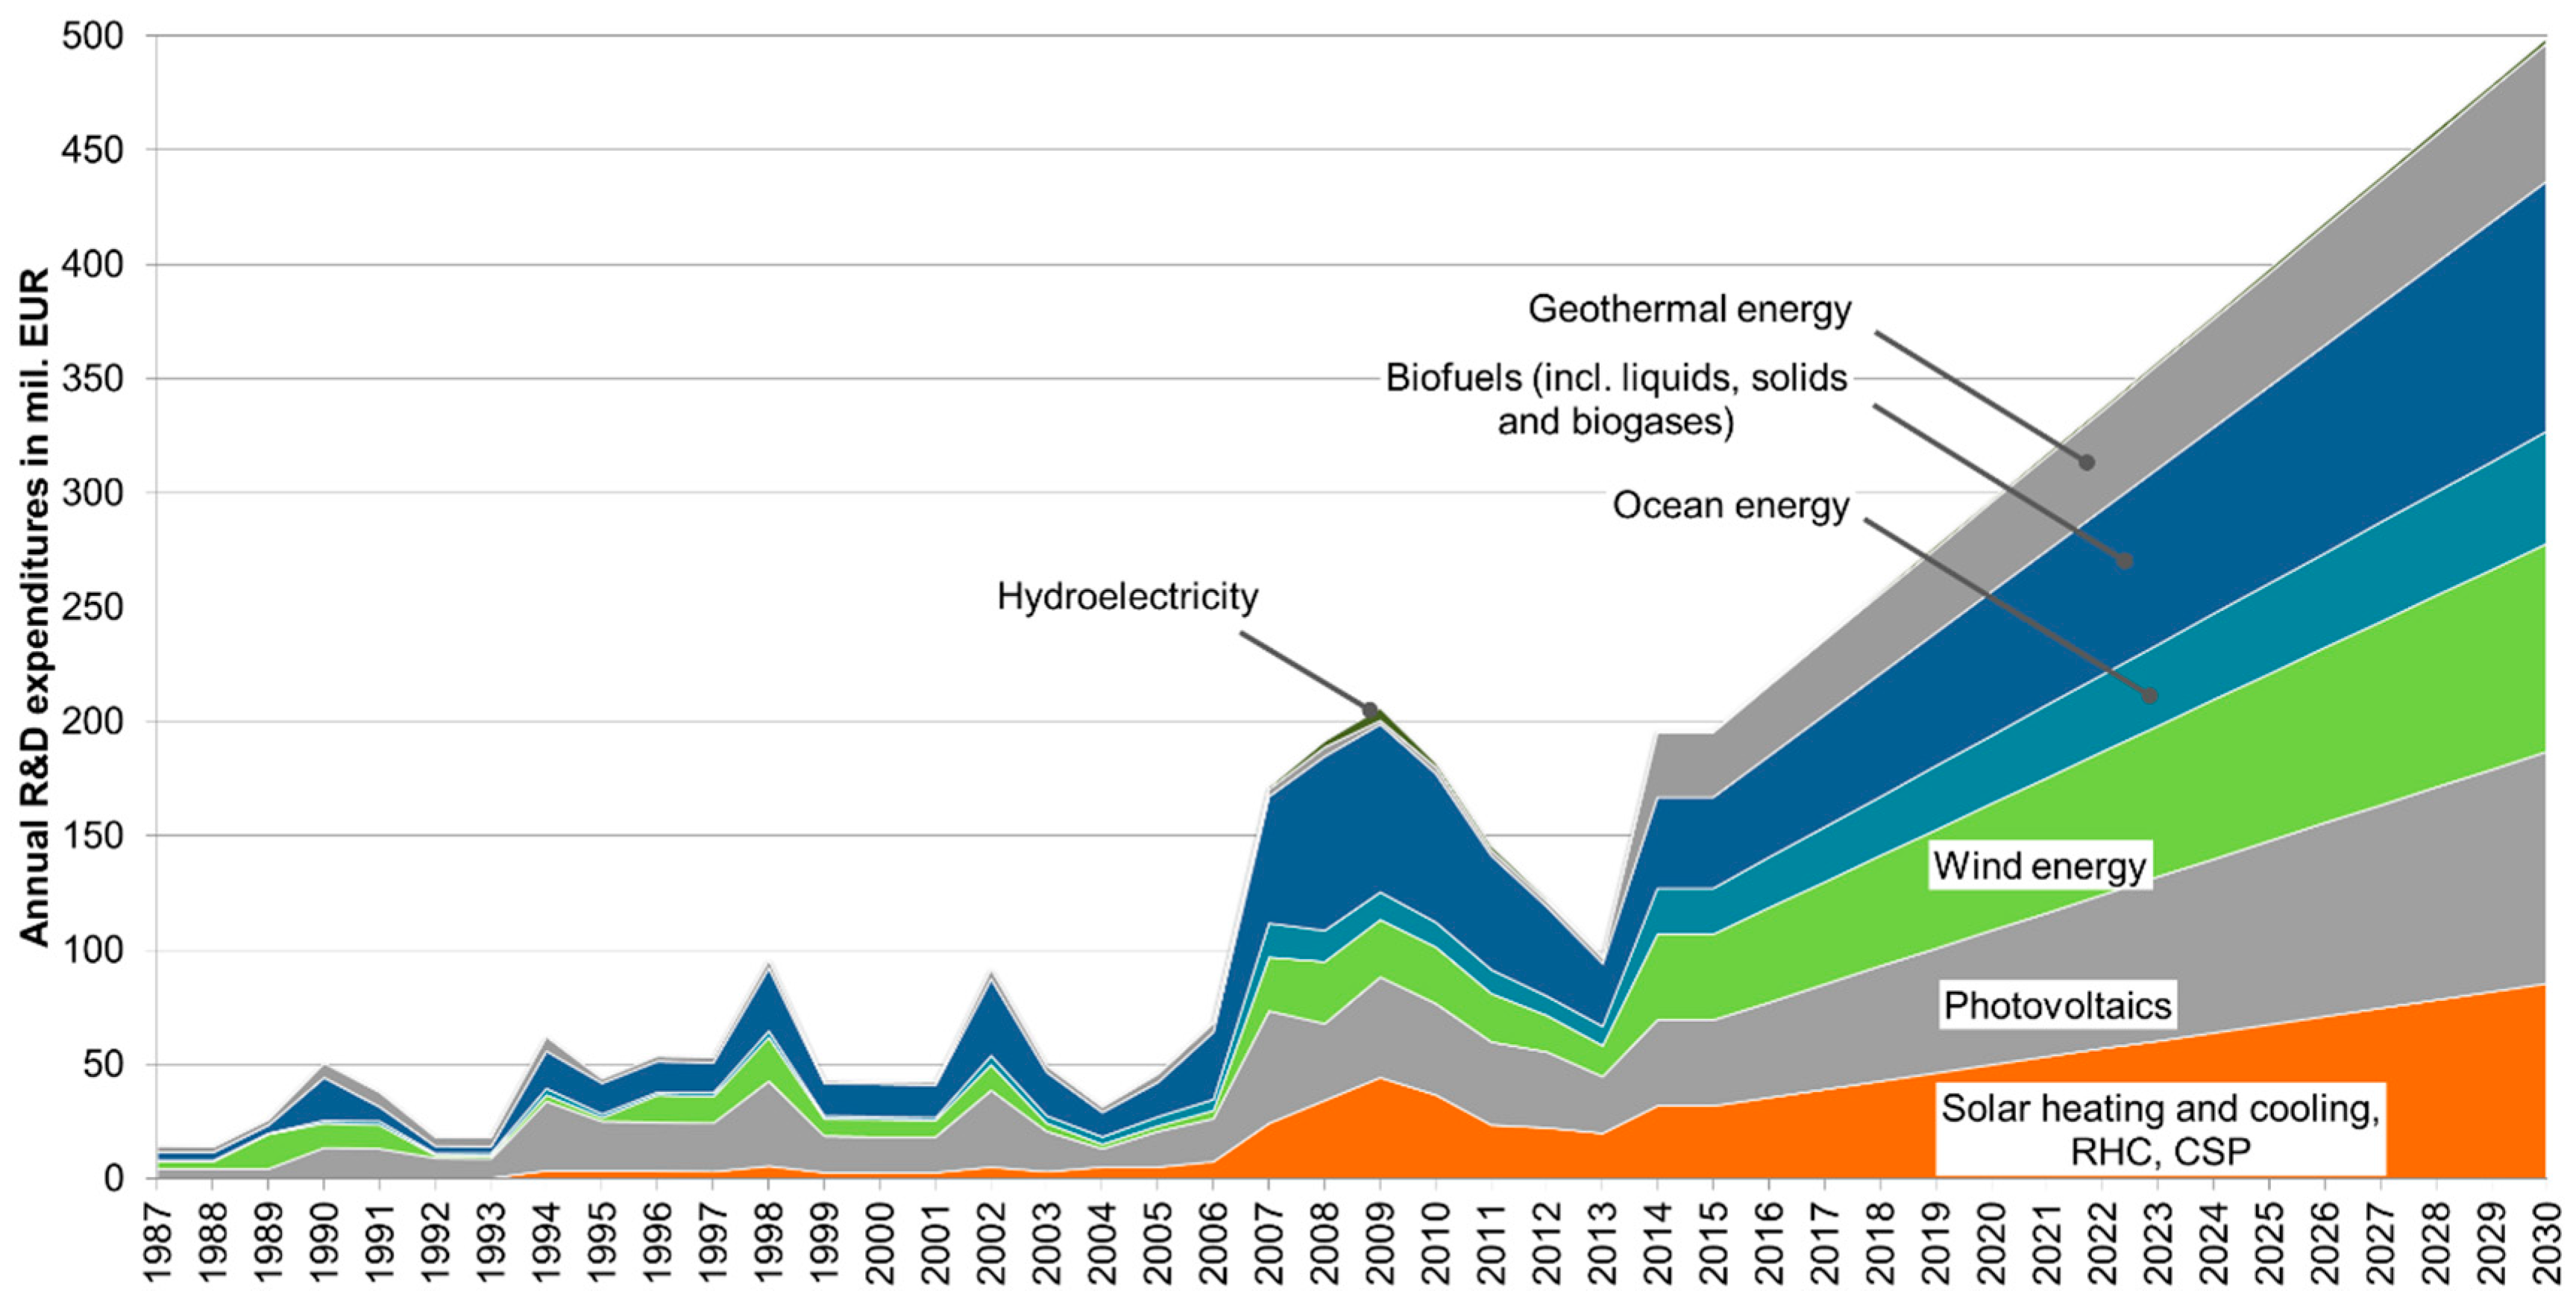
3.1.2. European Commission

In contrast to Figure 1 and Figure 2, Figure 3 and Figure 4 provide insights concerning the EU R&D expenditures from late 1980s until 2030. A comparison between budget levels indicated in Figure 1 and Figure 3 (both BAU investigation) for the year 2030 show that MS are about six times higher than those of the EC with values around 1200 and 200 million EUR respectively.
At first sight, in Figure 3 and Figure 4 the trend is much more fluctuating during the years compared to previous Figure 1 and Figure 2. The peaks visible in Figure 3 correspond to the end of the single framework programmes (FP1–H2020). Indeed, the EC funding scheme during FPs follows a progression from the first to final year of each programme leading to the highest funding release in the last year.
Despite the cited fluctuations occurring in the past decades, EU Rand D funding are expected to be, on average, constant until 2030, at the levels of 2015–2016. Similarly, to the trend experienced by MS, in 2008–2009 funding to bioenergy was much higher than for other RES; later the difference gets reduced and, at present, funding for bioenergy is comparable to those given to the other major RES (i.e., wind energy, PV, and solar heating and cooling, RHC, and CSP). In terms of future projections, EU R&D funding is expected to remain nearly constant. With regard to R&D funding for geothermal and ocean energy, the amount of expenditures provided by the EU is comparable to the one given by MS, but the relative importance of these RES seems to be much higher. The EU appears to provide funding in a more homogeneous way than MS.
Similarly to Figure 1 (MS expenditures), in this case (EC spending) from around 2010 until the present, an unseen level of R&D budget was reached, which then stays nearly constant until 2030. Hence, in this case the efforts of the EC are shown in reaching the 2020 and 2030 RES targets. In contrast to MS efforts, here a moderate reduction of funds is registered between 2010 and 2030 indicting, once more, higher R&D funding efforts by MS.
Looking at the advanced scenario, it can be seen that the increase in future EU R&D investments follow a similar trend compared to MS, but single RES are funded in a more even way. Funding for ocean and geothermal energy are expected to increase their share by 2030, while solar heating and cooling, RHC and CSP, PV, wind energy, and bioenergy are expected to be funded with a smaller increase.
Similarly to the comparison of Figure 1 and Figure 2 (MS), in the case of Figure 3 and Figure 4 (EC) an extremely significant increase of funding is registered from 2015 until 2030. In this case, the expenditures level of the advanced scenario reaches more than three times the level of the related BAU scenario with approximately 500 and 150 million EUR, respectively.

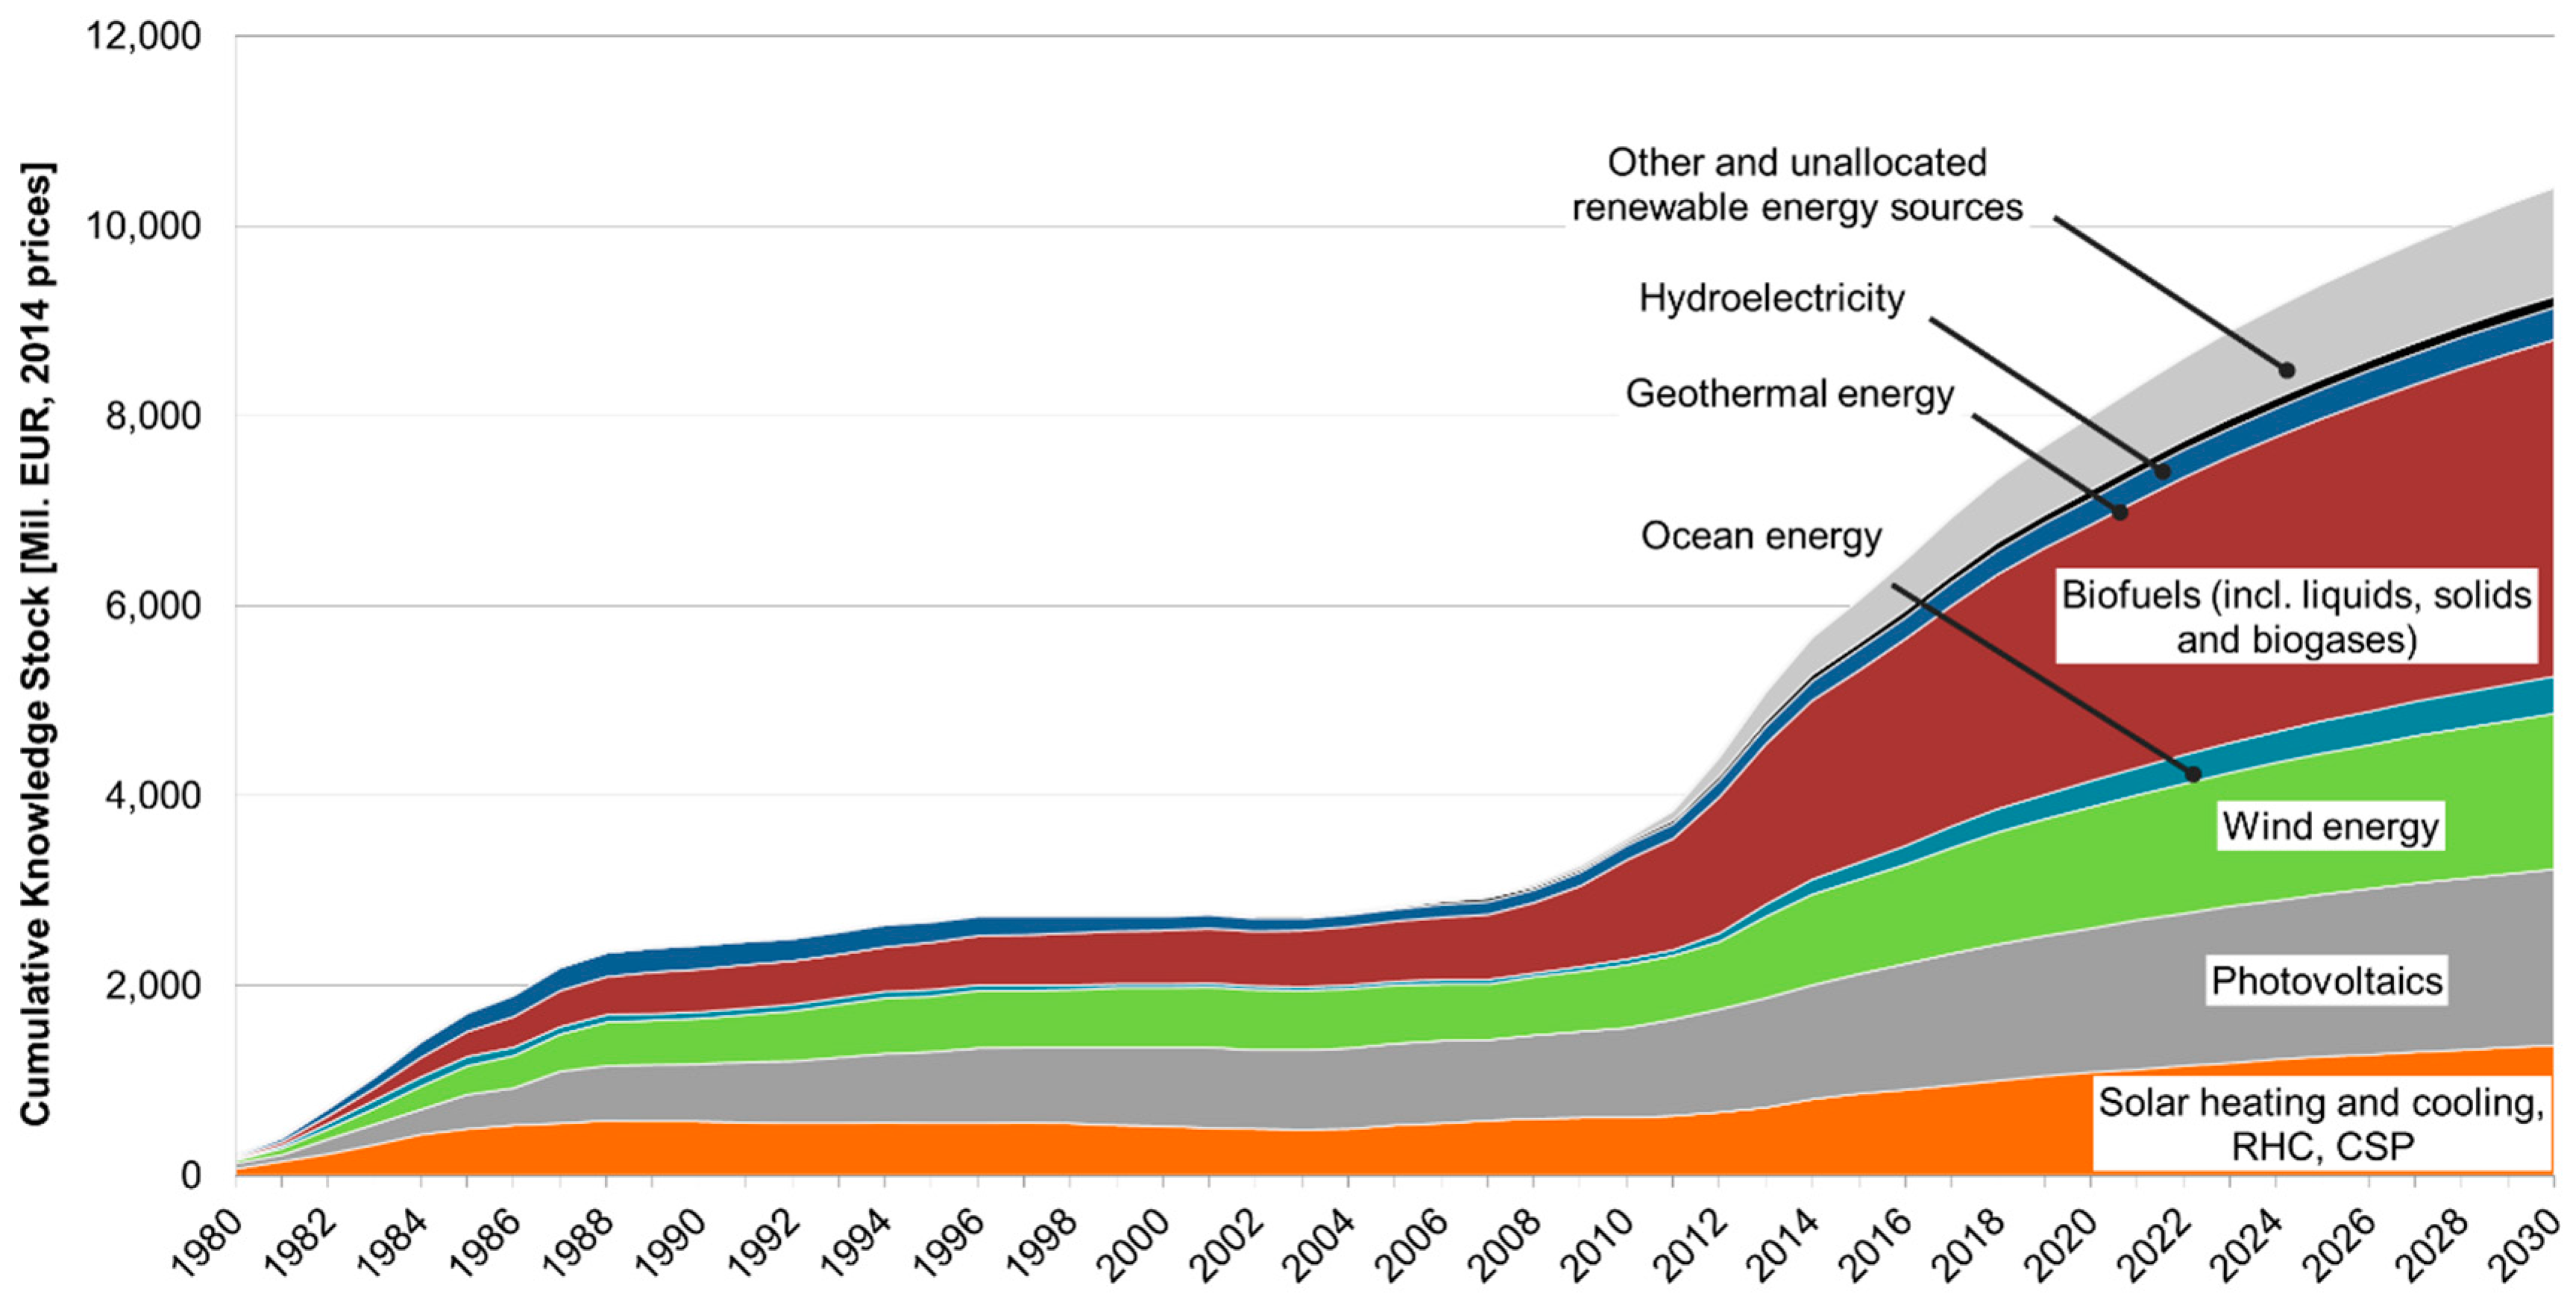
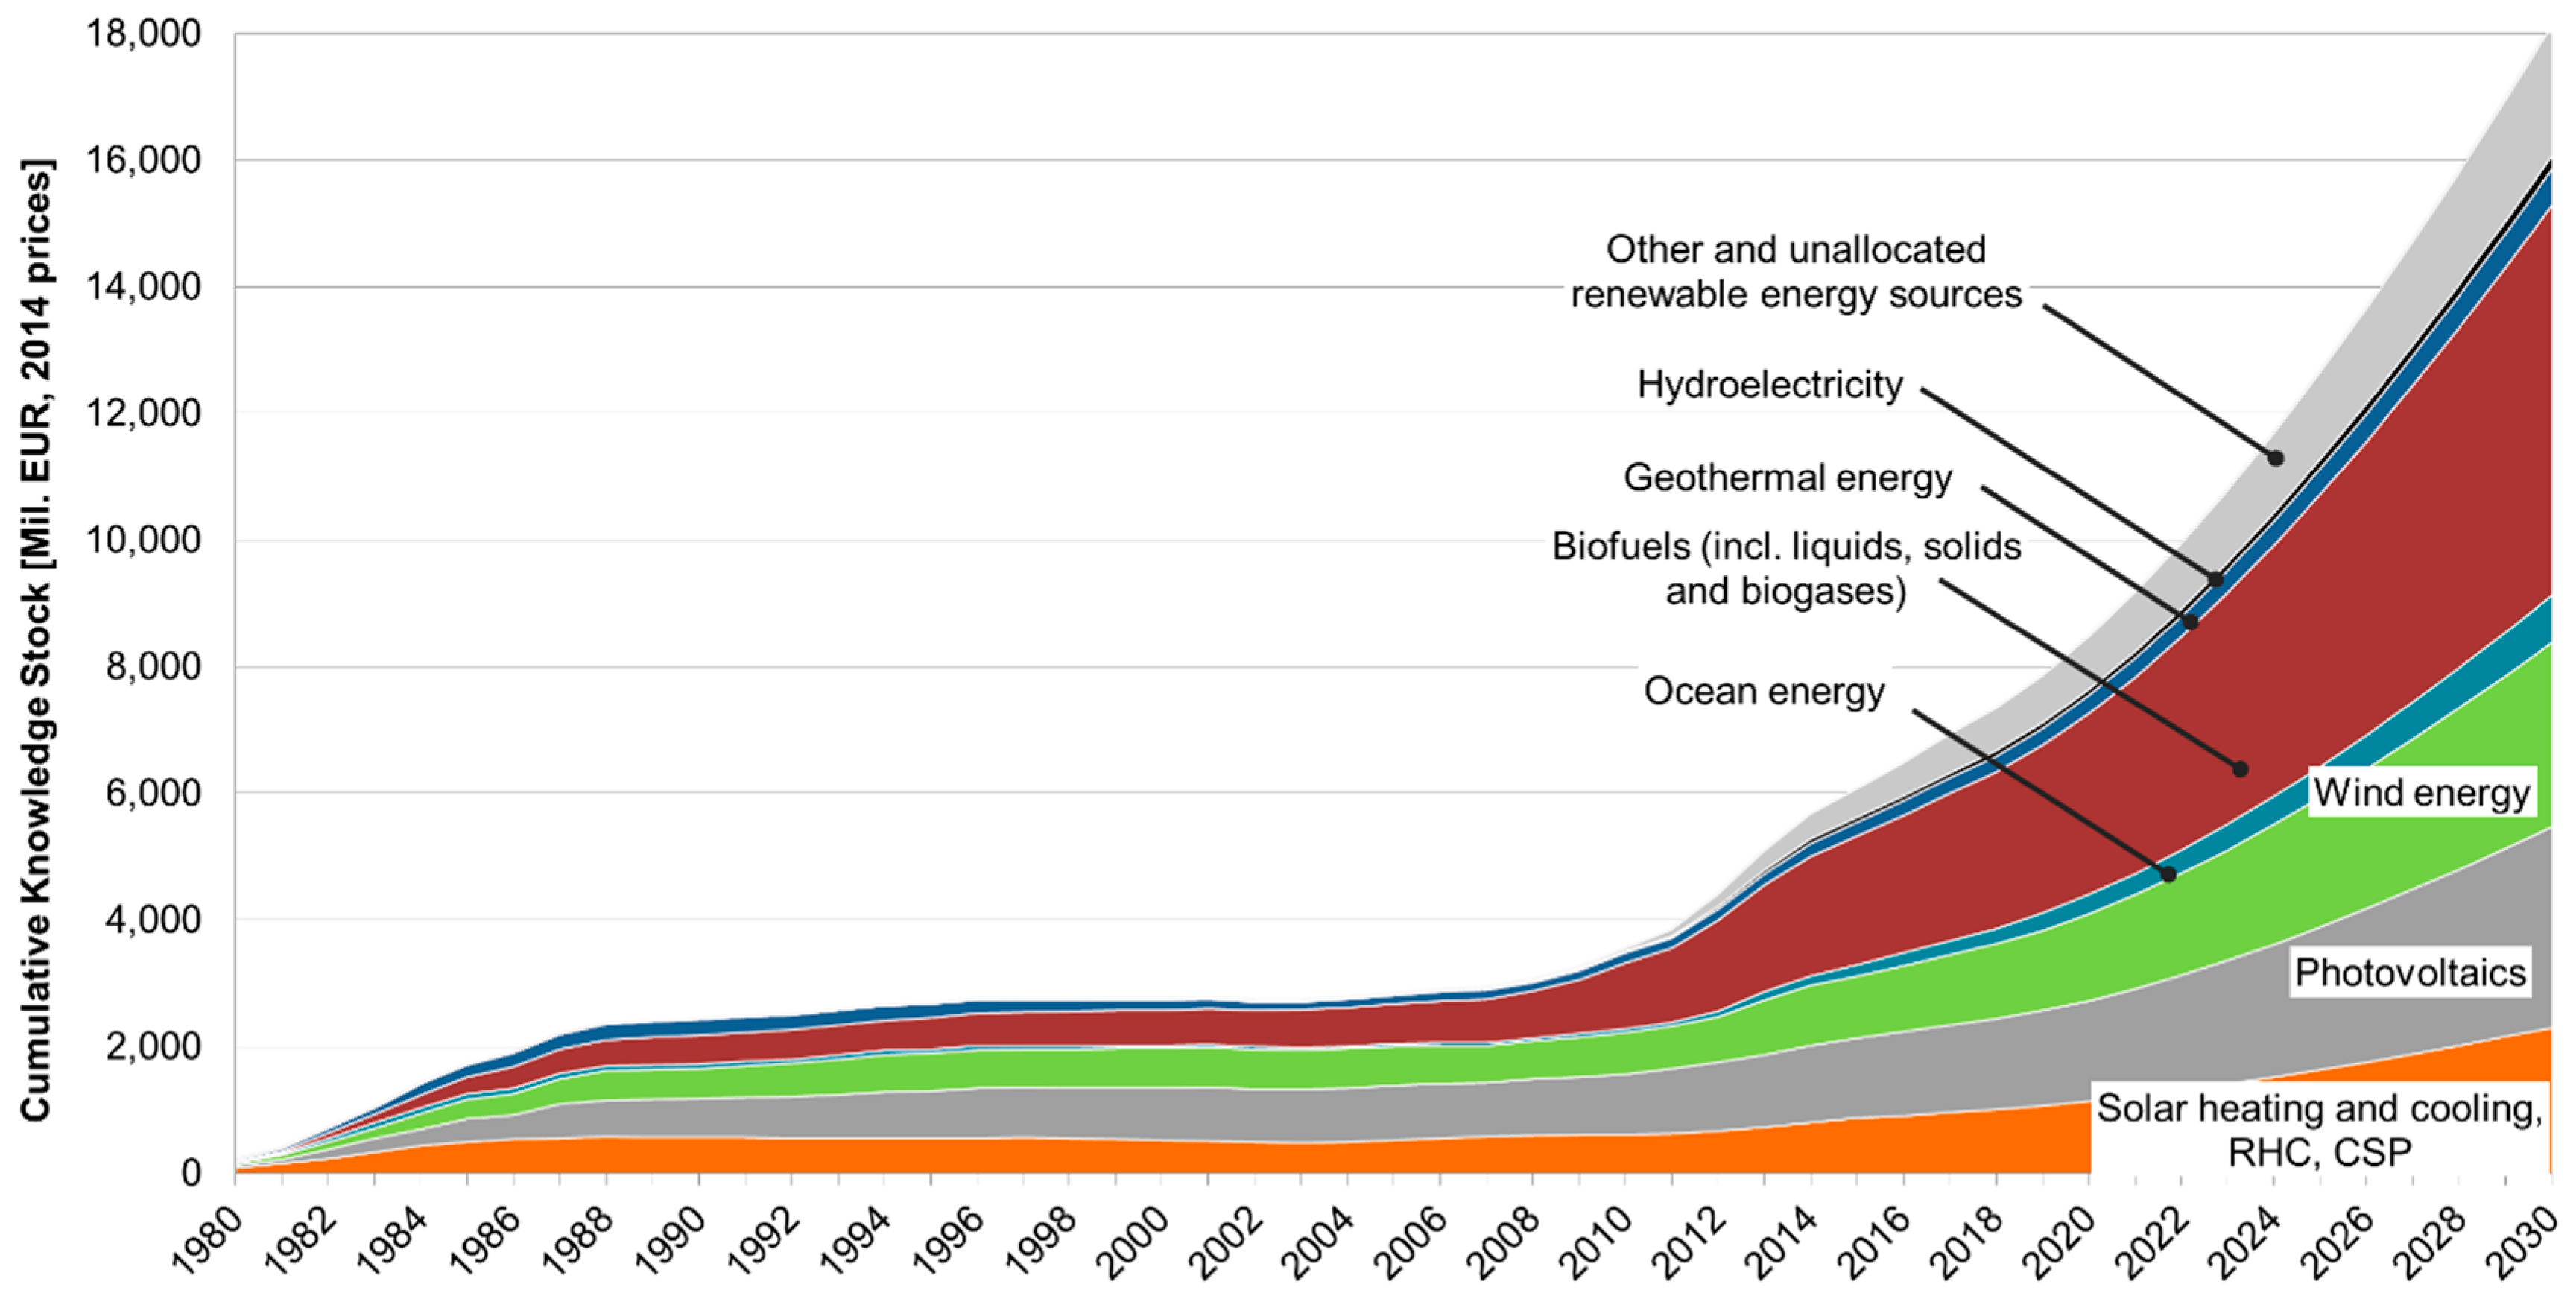
3.2. The Cumulative RES Knowledge Stock

3.2.1. European Union MS

Concerning the cumulative knowledge stock, results for the BAU and advanced scenario are provided in Figure 5 and Figure 6. Since 1980, the cumulative knowledge stock raised for a few years and then remained mildly constant until 2008. This trend partially reflects the annual investments in R&D, which raised in the same years and later remained constant. From 2008–2016, a considerable increase in the cumulative knowledge stock is visible—given by the increase in annual investments in R&D. Scenarios for the BAU foresee an even more consistent increase of the cumulative knowledge stock, until reaching more than 10 billion EUR by 2030.
If the values reached in 2030 are set against each other between Figure 5 and Figure 6, the last named chart (advanced scenario) shows almost double the amount of budget with approximately 10 and 18 billion EUR, respectively.

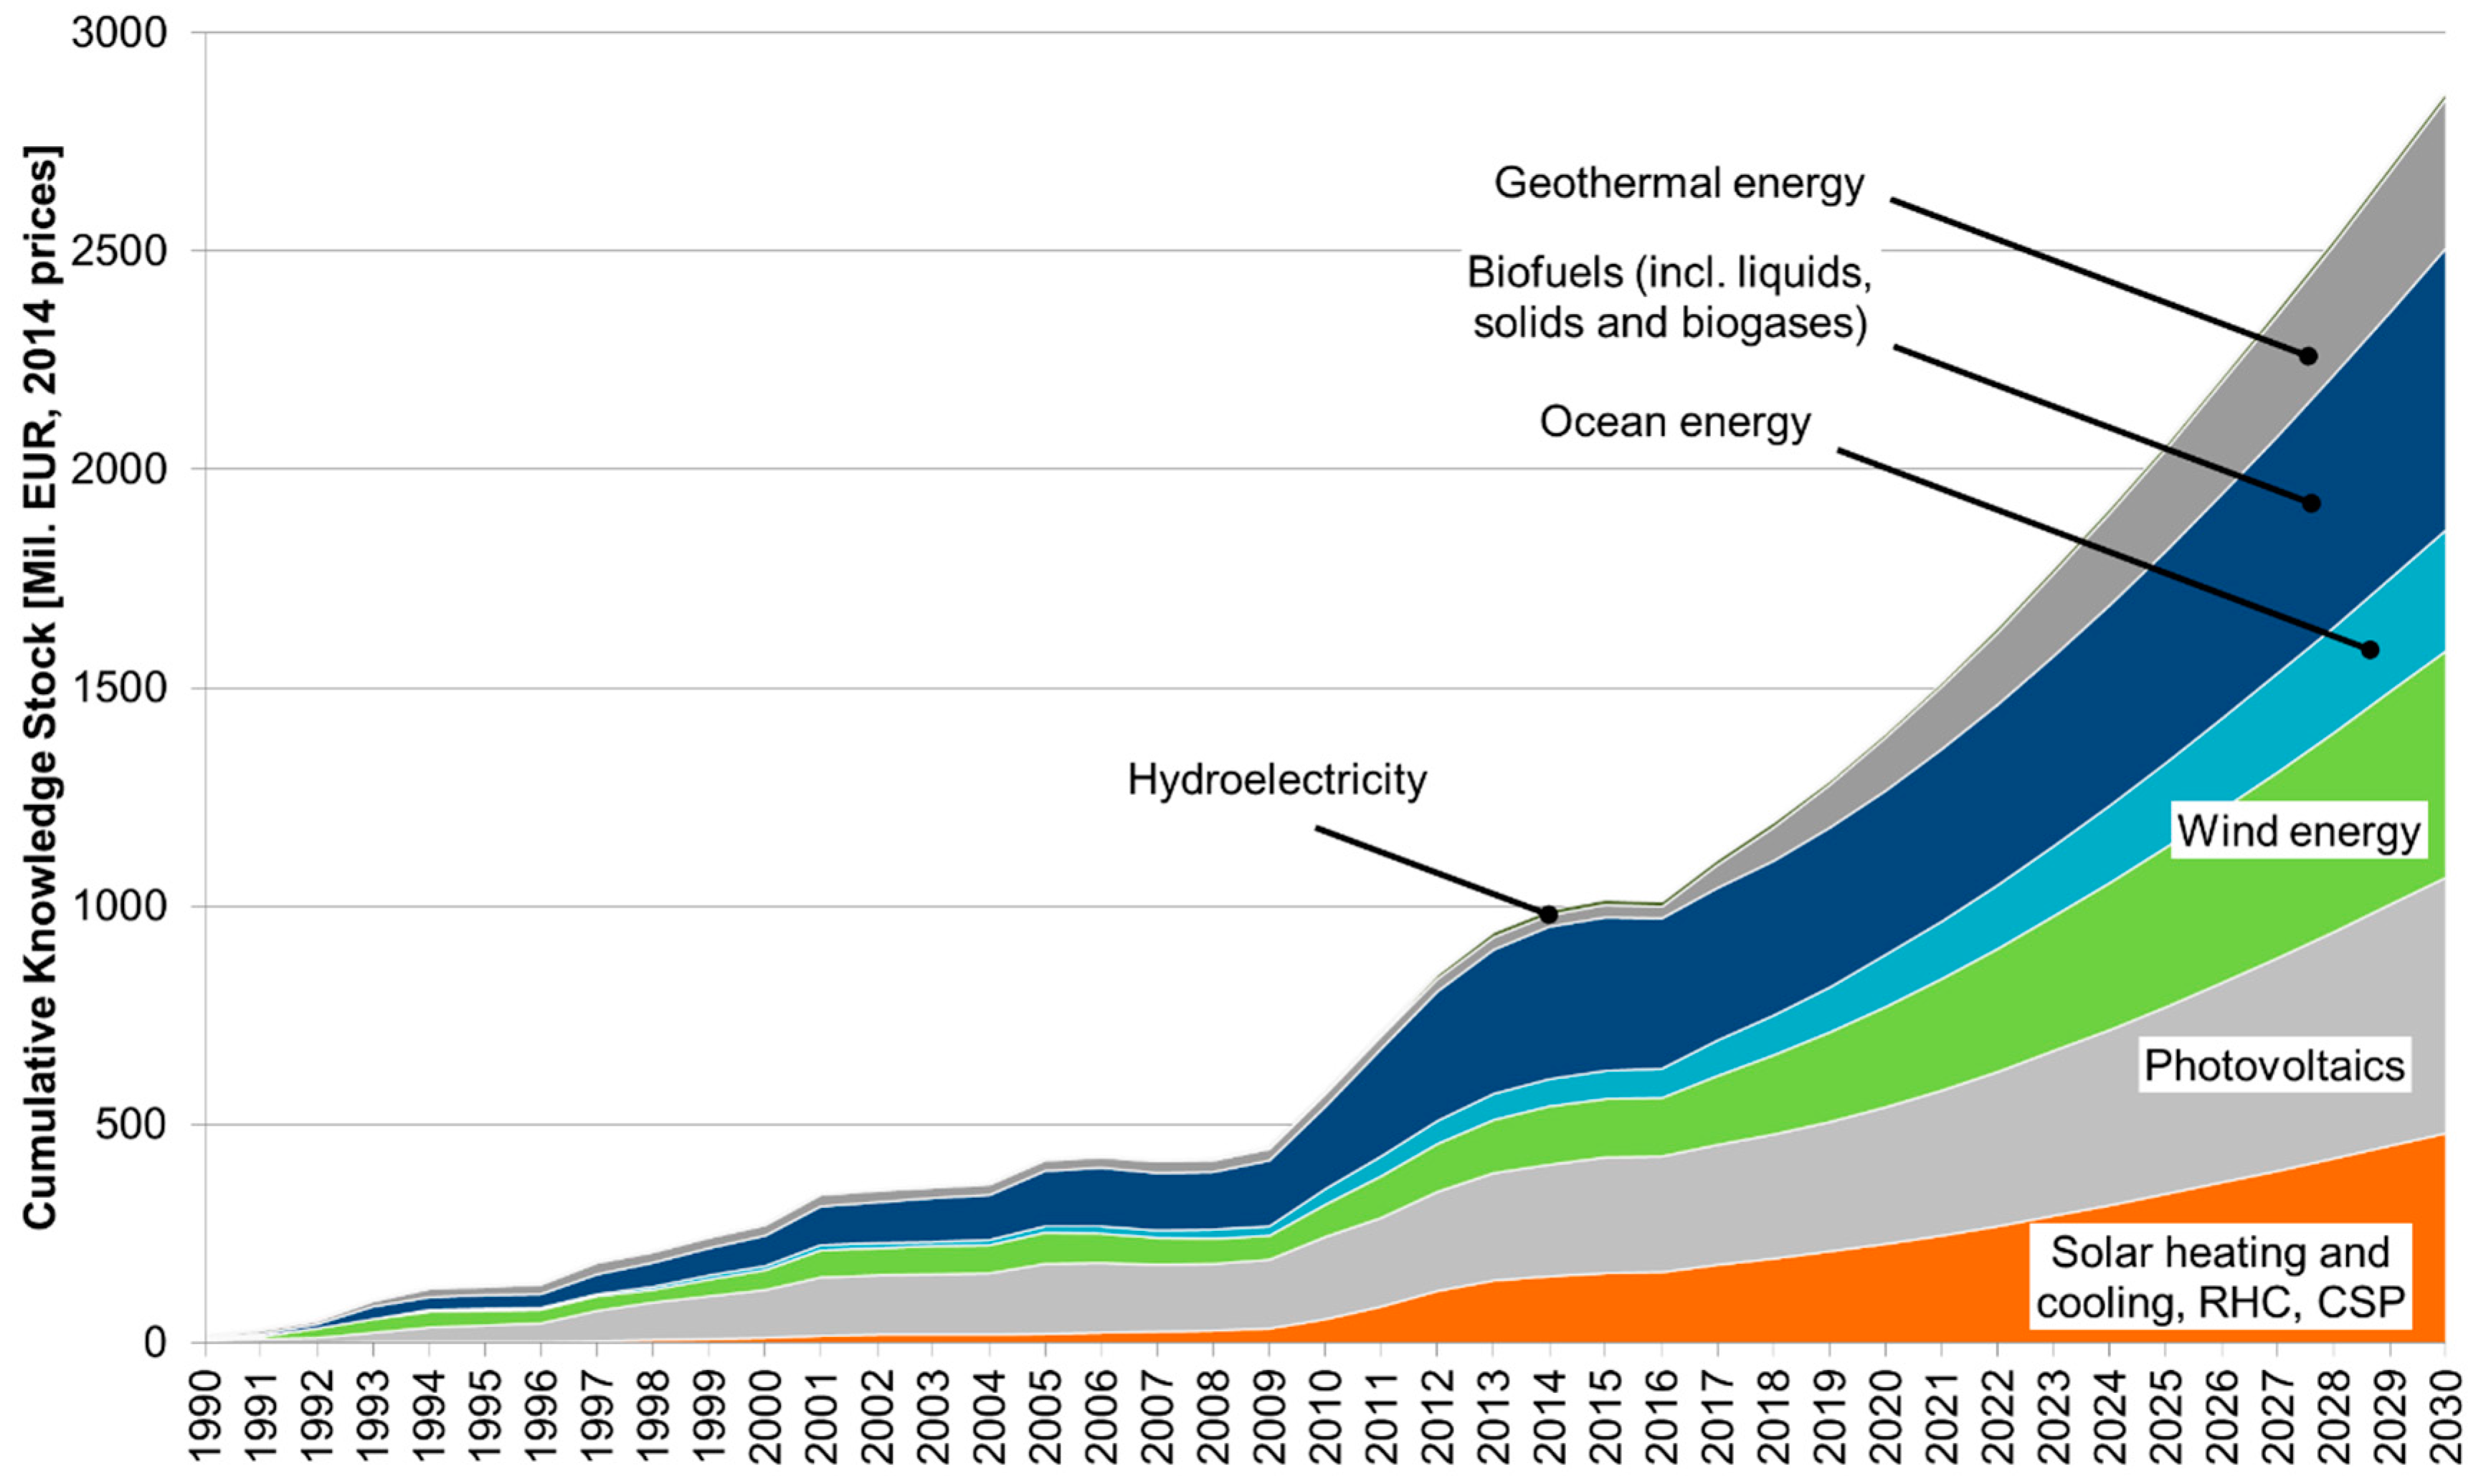
3.2.2. European Commission

The cumulative knowledge stock provided by EU R&D funding shows a different trend, compared to the one created by MS. In particular, the knowledge stock has a positive increment since the very beginning of the time series. The positive trend is mainly given by investments in R&D for PV, together with funding for bioenergy. The stock grows approximately at a constant rate until 2008–2009 and then it stirs up exponentially, reaching a level of around 1.0 billion EUR in 2016. In the future, the cumulative knowledge stock provided by EU investments is expected to grow, in the BAU scenario, until reaching around 1.5 billion EUR in 2030. The growth in the stock is, however, at negative rates. This is an indication that the knowledge stock might hit a maximum level in future, above which is not possible to achieve with the current level of funding. Conversely, in the advanced scenario, it is possible to assist to an exponential growth of the stock until 2030, reaching the level of almost 3.0 billion EUR.
Once again, differences between funding of MS and EU might be appreciated in the break-down of funds to the different sources of RES. In particular, the EU funds more evenly each RES, while a single MS tends to give precedence to bioenergy, wind energy, and PV. This attitude is also reflected in the cumulative knowledge stock, in which for the EU the contribution for bioenergy, wind, and solar heating and cooling, RHC, and CSP is almost the same.
Comparing Figure 7 and Figure 8 it gets visible that the advanced Scenario (Figure 8) shows approximately double the amount of R&D expenditures with about 1.5 and 3.0 billion EUR.

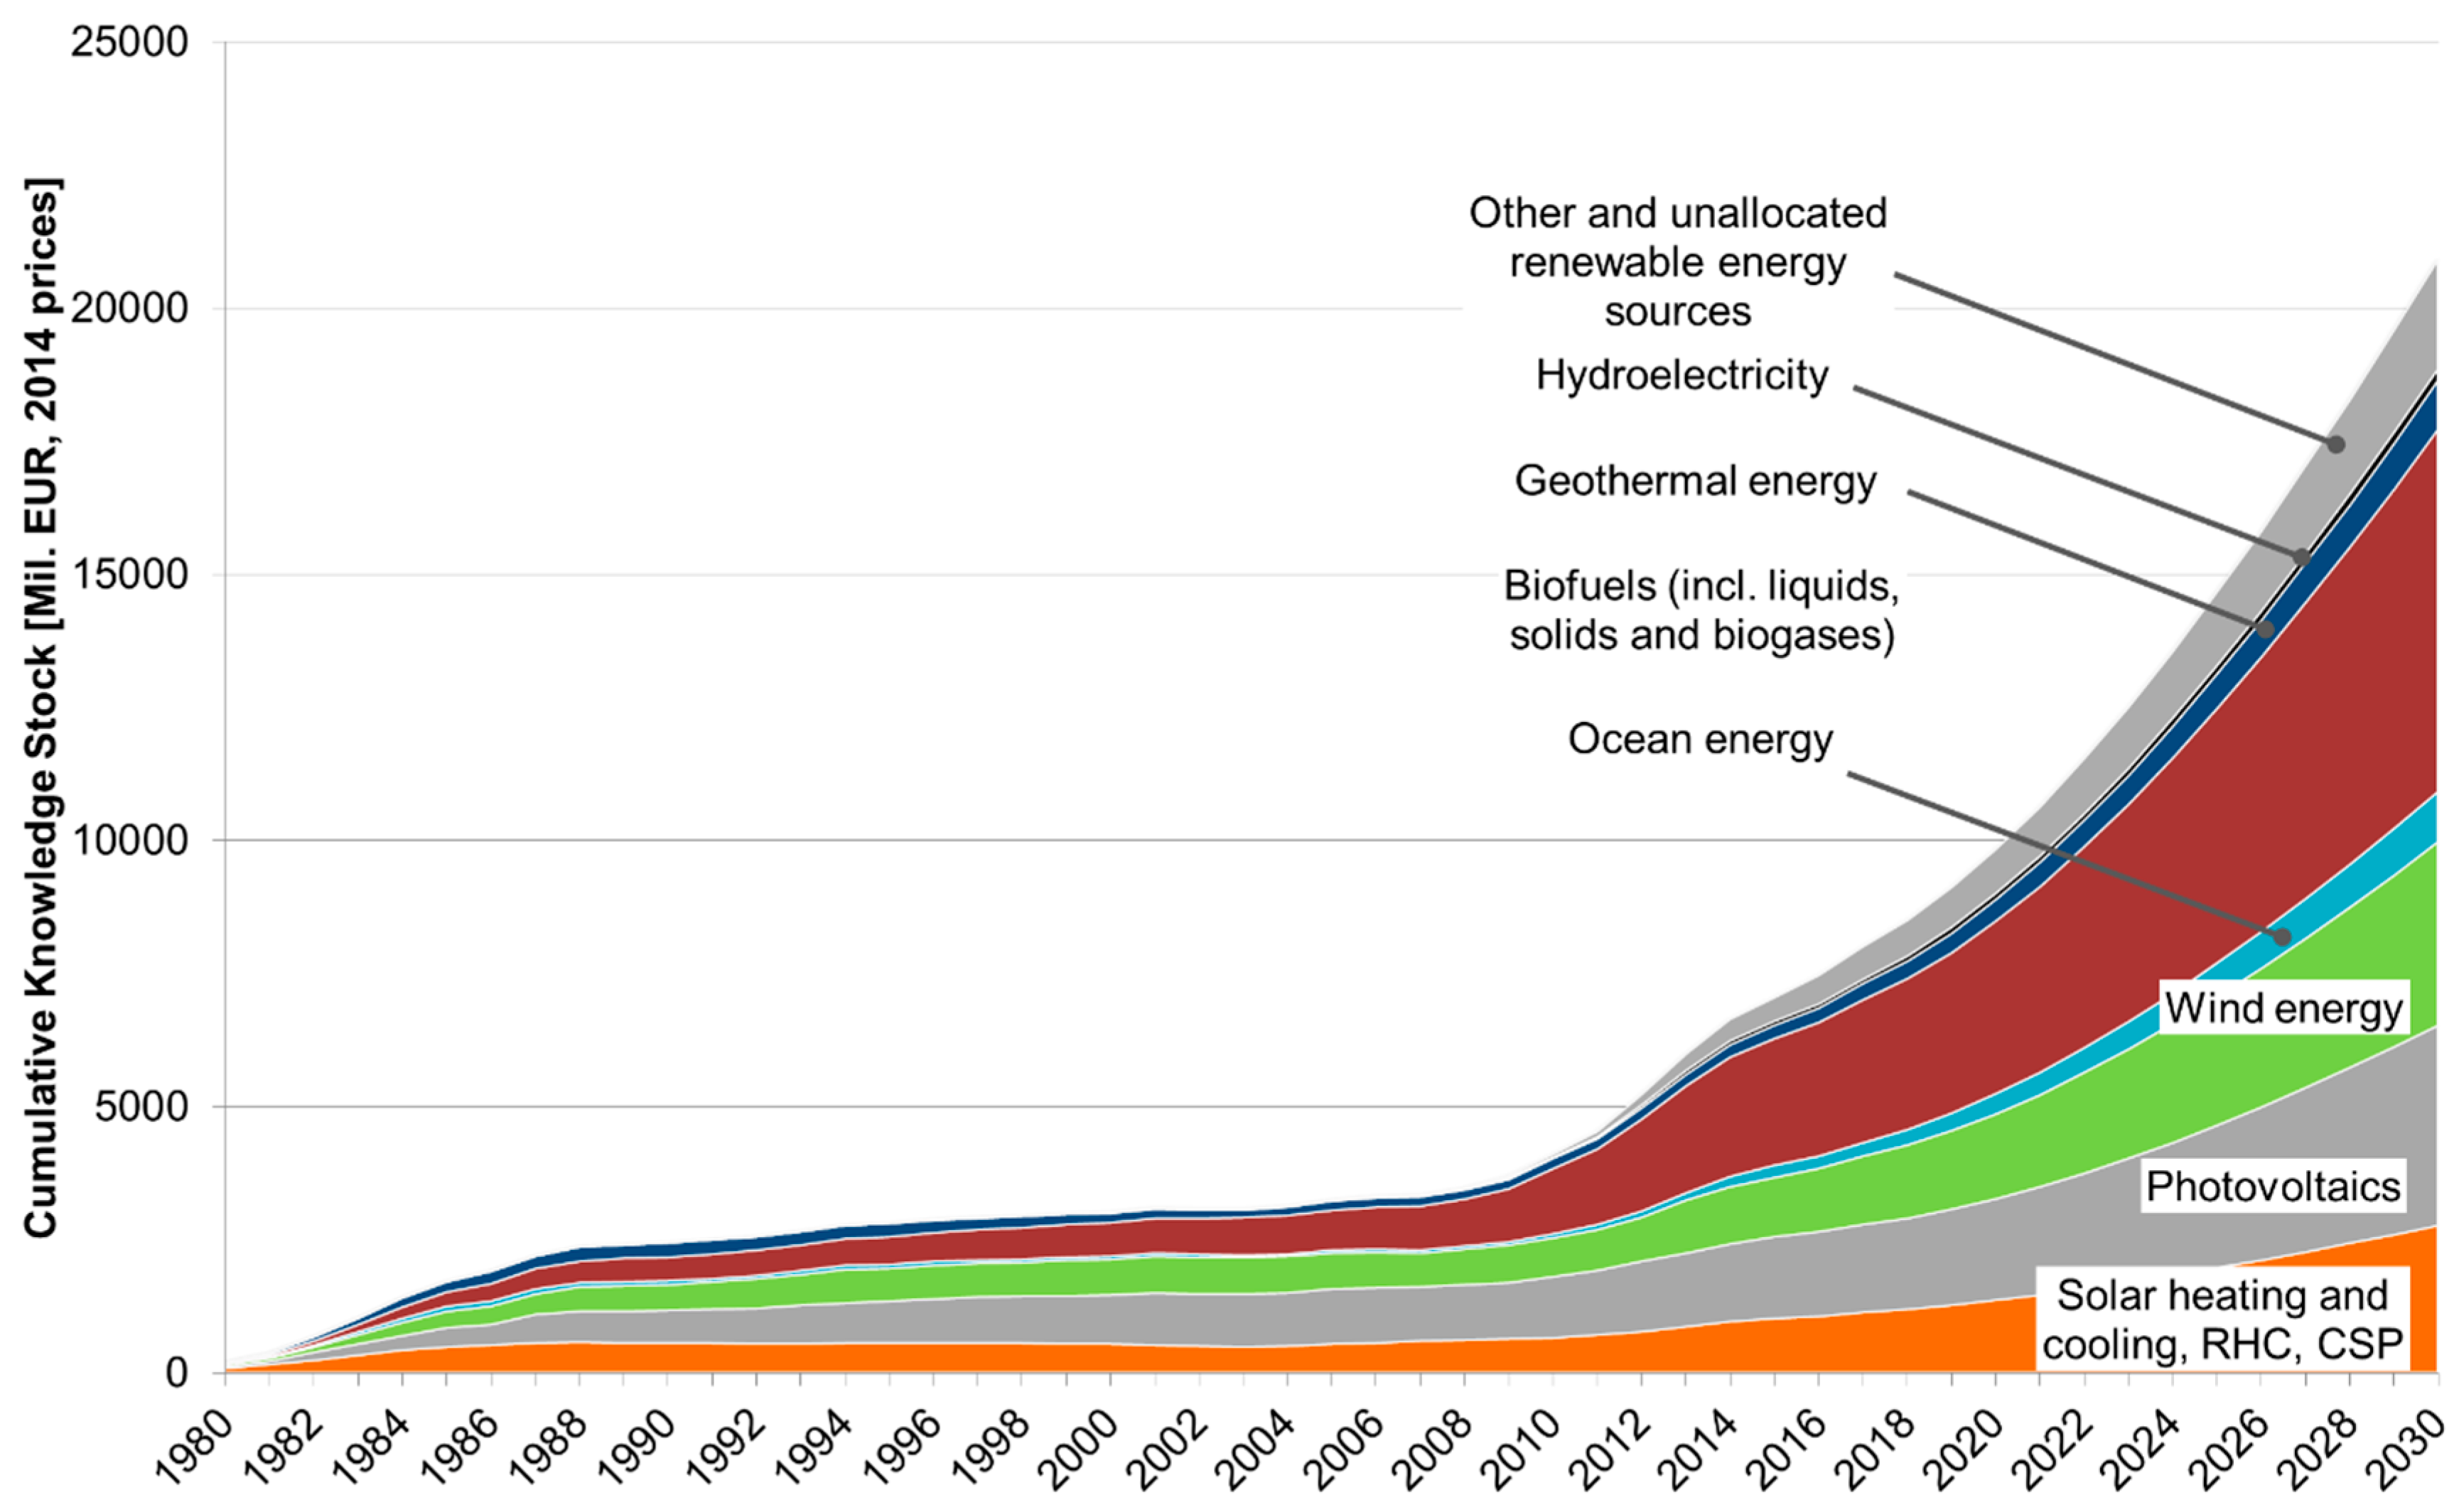
3.2.3. Cumulative Knowledge Stock (Considering Both EU and MS)

Figure 9 and Figure 10 introduce the cumulative knowledge stock given by the sum of investments in R&D by single MS and the EU. The general trend of these graphs is similar to the ones of the MS. This is because the largest portion of funding for RES is given by MS rather than the EU. Thus, their weight in the sum is higher.
Setting against each other Figure 9 and Figure 10, the last named graph shows approximately two times the expenditures level of Figure 9 in 2030 with nearly 12 and 20 billion EUR each.

4. Discussion and Conclusions

Results show that the research and development expenditures for renewable energy sources provided by the European Union Member States differ from those of the European Commission. The European Commission more equally finances research and development in the various renewable energy technology fields than the Member States.
Motivated by the energy crisis of 1973, European Union policy has been designed to reduce European dependence on energy imports, particularly of fossil fuels. Historically, the primary motivation has been achieving energy security [46]. For this reason financing focused—besides other energy technologies—specifically on renewable energy sources, especially bioenergy, wind energy, and photovoltaics.
Investments in research and development for renewable energy sources will probably increase in the future, largely driven by the European Union 2020 climate targets, and the European Union 2030 framework for climate and energy policies. Renewable energy sources are expected to grow more important for the European Union Member States and the European Commission, creating an expected knowledge stock for renewable energy sources of 12–21 billion EUR in 2030.
It could be argued that reduction in renewable energy sources research and development funding from the 1990s to 2010 caused a decay in the knowledge stock, and put the European Union a decade behind in terms of technology-based mitigation of climate change. This becomes more pronounced when considering the economic and political development since the 1970s. Funding for research and development in renewable energy sources from the European Union Member States peaked in in the early 1980s, largely because of the oil crises in the 1970s. The oil price shocks created a broad political commitment to focus on research and development preventing future crises by developing alternatives to fossil fuels. However, the 1980s and 1990s were decades of low energy prices and reduced political will to develop alternatives. At the same time, the world experienced a dramatic change in political thinking, particularly around economic theory. For instance, “Reagan’s administration (1981–1989) cut the United States public energy research and development expenditures by 50%.” [31]. Recently, the European political scheme has once again become favorable to financing research and development in renewable energy sources. The strengthening efforts of the European Commission and the European Union Member States to reach the climate and energy goals set for 2020 and 2030 led to an increase in funding for research and development for renewable energy sources. This fact is particularly important in light of the recent economic crisis striking Europe for the last few years, and the impact it has had reducing governmental budgets. Further challenges and threats for Europe, such as the possibility that the UK may leave the EU, are ahead but the impact on future RES R&D expenditures and the cumulative knowledge stock is highly speculative from today’s perspective.
Anyway, the increases in spending from both Member States and the European Commission, demonstrate the importance of achieving energy independence, which could bring several advantages to European society in terms of declining energy costs, job creation, etc.
This paper presents the first analysis of research and development expenditures for renewable energy sources, and the knowledge stock of both the European Commission and the European Member States over a time-span of more than 40 years. The results have been compared in a harmonized scheme. As of 2014, the cumulative knowledge stock in renewable energy sources created by public research and development expenditures was 6 billion EUR for the European Union Member States and 1 billion EUR for the European Commission. The largest share of the knowledge stock is in bioenergy, with an estimated value of 3 billion EUR. This is reasonable as more than 90% of renewable energy in Europe is in the form of bioenergy [42]. Moreover, bioenergy is a renewable energy source capable of balancing environmental, social, and economic goals [43]. Photovoltaics follow with approximately half of the research and development budget of Bioenergy. Solar heating and cooling, wind energy, concentrated solar power, and renewable heating and cooling, are all tied for third with around 1 billion EUR. Other and unallocated renewable energy sources have a knowledge stock of around 400 million EUR. Ocean and geothermal energy are second to last, with approximately 200 million EUR. Hydroelectricity is last with less than 100 million EUR. As precondition to fully exploit these mentioned results an effective EU policy on knowledge transfer and joint initiatives to avoid double research efforts are needed. This also requires an active culture of technology transfer and the promotion of open source publications.
Scenarios indicating the future research and development expenditures for renewable energy sources from both the European Union Member States and European Commission created an estimate of the knowledge stock for renewable energy technology for the next decade. An improvement of this contribution could include connections between energy expenditures and technological breakthroughs as technological changes play a key role in the quantification of future flows; however, the authors acknowledge it is a very difficult objective to detect technological shocks. Another potential development could be including data for non-International Energy Agency European Member States as demonstrated by Brutschin and Fleig [47].
Nevertheless, these scenarios demonstrate the current shift of priorities in favour of public support for renewable energy technologies and may serve as starting point for further investigations on the RES knowledge stock. In combination with an analysis of the R&D output (e.g., patents, utility models, etc.), the effectiveness of public R&D programs could be estimated and recommendations for future prioritization of R&D expenditures derived. Though very challenging, the inclusion of private R&D inputs and outputs would enhance such analysis.

Acknowledgments

We are thankful to Greg Arrowsmith (The Association of European Renewable Energy Research Centres) for his helpful input on the outlook of the R&D expenditures provided by the EC.

Author Contributions

Raphael Bointner collected the data needed to perform the calculations concerning the EU MS expenditures, created the graphs shown in the present work and edited the final version of the paper. Simon Pezzutto retrieved the necessary information to calculate the scenarios regarding the EC spending and contributed to the interpretation of the generated figures. Gianluca Grilli helped concerning the interpretation of figures and was involved in the writing phase of the entire paper. Wolfram Sparber reviewed the manuscript and added various specifications.

Conflicts of Interest

The authors declare no conflict of interest.

References

  1. Dinan, D. Europe Recast: A History of European Union; Lynne Rienner Publishers: Boulder, CO, USA, 2015. [Google Scholar]
  2. Research & Innovation. Energy. Available online: http://ec.europa.eu/research/energy/euratom/index_en.cfm?pg=fission&section=history (accessed on 7 September 2016).
  3. El-Agraa, A.M. The European Union: Economics and Policies; Cambridge University Press: Cambridge, UK, 2011. [Google Scholar]
  4. Energy Production and Imports. Available online: http://ec.europa.eu/eurostat/statistics-explained/index.php?title=Energy_production_and_imports&oldid=299321 (accessed on 8 September 2016).
  5. EU Member States Not Reaching 2020 Energy Efficiency Goals. Commission Says. Available online: http://www.euractiv.com/section/energy/news/eu-member-states-not-reaching-2020-energy-efficiency-goals-commission-says/ (accessed on 8 September 2016).
  6. Energy. 2030 Energy Strategy. Available online: https://ec.europa.eu/energy/en/topics/energy-strategy/2030-energy-strategy (accessed on 19 September 2016).
  7. Energy Roadmap 2050. Available online: https://ec.europa.eu/energy/sites/ener/files/documents/2012_energy_roadmap_2050_en_0.pdf (accessed on 10 September 2016).
  8. What Is the SET-Plan? Available online: https://setis.ec.europa.eu/about-setis/set-plan-governance (accessed on 11 September 2016).
  9. Data Services. Available online: http://wds.iea.org/WDS/Common/Login/login.aspx (accessed on 1 June 2016).
  10. Research & Innovation. Energy. Available online: http://ec.europa.eu/research/energy/eu/index_en.cfm?pg=projects#projects (accessed on 1 June 2016).
  11. Fifth Framework Programme. Available online: http://cordis.europa.eu/fp5/src/budget.htm. (accessed on 2 June 2016).
  12. Research & Innovation. Sixth Framework Programme 2002–2006. Available online: https://ec.europa.eu/research/fp6/index_en.cfm (accessed on 2 June 2016).
  13. Research & Innovation. FP7. Available online: https://ec.europa.eu/research/fp7/index_en.cfm (accessed on 4 June 2016).
  14. Research & Innovation. FP7 in Brief. Available online: http://ec.europa.eu/research/fp7/understanding/fp7inbrief/home_en.html (accessed on 4 June 2016).
  15. Horizon 2020. The EU Framework Programme for Research and Innovation. Available online: https://ec.europa.eu/programmes/horizon2020/ (accessed on 6 June 2016).
  16. R&D Expenditure. Available online: http://ec.europa.eu/eurostat/statistics-explained/index.php/R_%26_D_expenditure (accessed on 7 June 2016).
  17. Community Research and Development Information Service (CORDIS). Available online: http://cordis.europa.eu/projects/home_en.html (accessed on 8 June 2016).
  18. European Commission. Council Decision of 25 January 1999 adopting a specific programme for research, technological development and demonstration on energy environment and sustainable development (1998 to 2002). Off. J. Eur. Communities 1999, 12, 20–64. [Google Scholar]
  19. Divaldalbero, D. The Power of Science: Economic Research and European Decision-Making: The Case of Energy and Environment Policies; Peter Lang Publishing: New York, NY, USA, 2010. [Google Scholar]
  20. Europe 2020 Indicators—Research and Development. Available online: http://ec.europa.eu/eurostat/statistics-explained/index.php/Europe_2020_indicators_-_research_and_development (accessed on 8 June 2016).
  21. What Is the Sixth Framework Programme? Available online: https://ec.europa.eu/research/fp6/index_en.cfm (accessed on 9 June 2016).
  22. Overview of EU Funds for Research and Innovation. Available online: http://www.europarl.europa.eu/RegData/etudes/BRIE/2015/568327/EPRS_BRI(2015)568327_EN.pdf (accessed on 10 June 2016).
  23. GDP Long-Term Forecast. Available online: https://data.oecd.org/gdp/gdp-long-term-forecast.htm (accessed on 13 June 2016).
  24. Baccini, L.; Urpelainen, J. Legislative fractionalization and partisan shifts to the left increase the volatility of public energy R&D expenditures. Energy Policy 2012, 46, 49–57. [Google Scholar] [Green Version]
  25. Bointner, R.; Pezzutto, S.; Sparber, W. Scenarios of public energy research and development expenditures: Financing energy innovation in Europe. WIREs Energy Environ. 2016, 5, 470–488. [Google Scholar] [CrossRef]
  26. Exchange Rates. Available online: http://ec.europa.eu/eurostat/web/exchange-rates (accessed on 15 June 2016).
  27. Member Participation. Available online: http://mission-innovation.net/participating-countries/#EuropeanUnion (accessed on 16 June 2016).
  28. Mission Innovation. Accelerating the Clean Energy Revolution. Available online: http://mission-innovation.net/ (accessed on 16 June 2016).
  29. Klaassen, G.; Miketa, A.; Larsen, K.; Sundqvist, T. The impact of R&D on innovation for wind energy in Denmark, Germany and the United Kingdom. Ecol. Econ. 2005, 54, 227–240. [Google Scholar]
  30. Kobos, P.H.; Erickson, J.D.; Drennen, T.E. Technological learning and renewable energy costs: Implications for US renewable energy policy. Energy Policy 2006, 34, 1645–1658. [Google Scholar] [CrossRef]
  31. Bointner, R. Innovation in the energy sector: Lessons learnt from R&D expenditures and patents in selected IEA countries. Energy Policy 2014, 73, 733–747. [Google Scholar]
  32. Energieforschungserhebung 2011—Ausgaben der öffentlichen Hand in Österreich. Erhebung für die IEA im Auftrag des Bundesministeriums für Verkehr, Innovation und Technologie. Available online: https://nachhaltigwirtschaften.at/resources/iea_pdf/1255_energieforschungserhebung_2011.pdf?m=1469660095/ (accessed on 20 September 2016).
  33. Wiesenthal, T.; Leduc, G.; Haegeman, K.; Schwarz, H. Bottom-up estimation of industrial and public R&D investment by technology in support of policymaking: The case of selected low-carbon energy technologies. Res. Policy 2012, 41, 116–131. [Google Scholar]
  34. Johnstone, N.; Haščič, I.; Popp, D. Renewable Energy Policies and Technological Innovation: Evidence Based on Patent Counts. Environ. Resour. Econ. 2009, 45, 133–155. [Google Scholar] [CrossRef]
  35. Popp, D. Innovation in climate policy models: Implementing lessons from the economics of R&D. Energy Econ. 2006, 28, 596–609. [Google Scholar]
  36. Gallaher, M.P.; Link, A.N.; O’Connor, A. Public Investments in Energy Technology; Edward Elgar Publishing: Northampton, MA, USA, 2012. [Google Scholar]
  37. Watanabe, C.; Wakabayashi, K. Industrial dynamism and the creation of a ‘virtuous cycle’ between R&D, market growth and price reduction: The case of photovoltaic power generation (PV) development in Japan. Technovation 2000, 20, 299–312. [Google Scholar]
  38. Miketa, A.; Schrattenholzer, L. Experiments with a methodology to model the role of R&D expenditures in energy technology learning processes; first results. Energy Policy 2004, 32, 1679–1692. [Google Scholar]
  39. IEA Guide to Reporting Energy RD&D Budget/Expenditure Statistics. Available online: www.iea.org/stats/RDD%20Manual.pdf (accessed on 5 November 2016).
  40. Kusre, B.C.; Baruah, D.C.; Bordoloi, P.K.; Patra, S.C. Assessment of hydropower potential using GIS and hydrological modeling technique in Kopili River basin in Assam (India). Appl. Energy 2010, 87, 298–309. [Google Scholar] [CrossRef]
  41. Barbier, E. Geothermal energy technology and current status: An overview. Renew. Sustain. Energy Rev. 2002, 6, 3–65. [Google Scholar] [CrossRef]
  42. Simas, T.; O’Hagan, A.M.; O’Callaghan, J.; Hamawi, S.; Magagna, D.; Bailey, I.; Greaves, D.; Saulnier, J.-B.; Marina, D.; Bald, J.; et al. Review of consenting processes for ocean energy in selected European Union Member States. Int. J. Mar. Energy 2015, 9, 41–59. [Google Scholar] [CrossRef]
  43. Development of a Tool to Model European Biomass Trade Report for IEA Bioenergy Task 40. Available online: http://www.bioenergytrade.org/downloads/development-of-a-tool-to-model-european-biomas.pdf (accessed on 17 September 2016).
  44. Grilli, G.; De Meo, I.; Garegnani, G.; Paletto, A. A multi-criteria framework to assess the sustainability of renewable energy development in the Alps. J. Environ. Plan. Manag. 2016. [Google Scholar] [CrossRef]
  45. Sharman, A.; Holmes, J. Evidence-based policy or policy-based evidence gathering? Biofuels, the EU and the 10% target. Environ. Policy Gov. 2010, 20, 309–321. [Google Scholar] [CrossRef]
  46. Belkin, P. The European Union’s Energy Security Challenges; Congressional Research Service: Washington, DC, USA, 2008.
  47. Brutschin, E.; Fleig, A. Innovation in the energy sector—The role of fossil fuels and developing economies. Energy Policy 2016, 97, 27–38. [Google Scholar] [CrossRef]
Figure 1. Renewable energy sources R&D expenditures of the EU MS from 1974 to 2015 and estimated until 2030 (Mil. EUR, BAU scenario) (2014 prices and exc. rates).
Energies 09 00990 g001
Figure 2. Renewable energy sources R&D expenditures of the EU MS from 1974 to 2015 and estimated until 2030 (Mil. EUR, Advanced scenario) (2014 prices and exc. rates).
Energies 09 00990 g002
Figure 3. Renewable energy sources R&D expenditures of the EC from 1987 to 2013 and estimated until 2030 (Mil. EUR, BAU scenario) (2014 prices and exc. rates).
Energies 09 00990 g003
Figure 4. Renewable energy sources R&D expenditures of the EC from 1987 to 2013 and estimated until 2030 (Mil. EUR, advanced scenario) (2014 prices and exc. rates).
Energies 09 00990 g004
Figure 5. Cumulative RES knowledge stock by public R&D expenditures of the EU MS (Mil. EUR, BAU scenario) (2014 prices and exc. rates; knowledge depreciation, 10%; time lag, three years).
Energies 09 00990 g005
Figure 6. Cumulative RES knowledge stock by public R&D expenditures of the EU MS (Mil. EUR, Advanced scenario) (2014 prices and exc. rates; knowledge depreciation, 10%; time lag, three years).
Energies 09 00990 g006
Figure 7. Cumulative RES knowledge stock induced by public R&D expenditures of the EC (Mil. EUR, BAU scenario) (2014 prices and exc. rates; knowledge depreciation, 10%; time lag, three years).
Energies 09 00990 g007
Figure 8. Cumulative RES knowledge stock induced by public R&D expenditures of the EC (Mil. EUR, advanced scenario) (2014 prices and exc. rates; knowledge depreciation, 10%; time lag, three years).
Energies 09 00990 g008
Figure 9. Cumulative RES knowledge stock induced by public R&D expenditures of the EC (Mil. EUR, BAU scenario) (2014 prices and exc. rates; knowledge depreciation, 10%; time lag, three years).
Energies 09 00990 g009
Figure 10. Cumulative RES knowledge stock induced by public R&D expenditures of the EU MS and the EC (Mil. EUR, Advanced scenario) (2014 prices and exc. rates; knowledge depreciation, 10%; time lag, three years).
Energies 09 00990 g010
Table 1. EU and IEA MS in 2016 (based on IEA [9]).
EU and IEA MembersNon-IEA EU MS
Austria, Belgium, Czech Republic, Denmark, Estonia, Finland, France, Germany, Greece, Hungary, Ireland, Italy, Luxemburg, Netherlands, Poland, Portugal, Slovakia, Spain, Sweden and United KingdomBulgaria, Croatia, Cyprus, Latvia, Lithuania, Malta, Romania and Slovenia
Table 2. The expected development of IEA/EU member countries’ GDP in billion EUR by 2030 is based on OECD [23]; exchange rates of non-Eurozone countries are based on Eurostat [26].
20102015202020252030
Austria294.6337.2389.1436.2480.0
Belgium365.1409.8466.1525.2587.7
Czech Republic156.4164.0182.2216.6247.8
Denmark241.5266.1320.9375.6430.5
Estonia14.720.527.131.234.9
Finland187.1207.0239.4266.0293.9
France1998.52182.32474.82831.03176.9
Germany2580.13025.93493.63962.84431.7
Greece226.0176.0205.7231.3263.1
Hungary98.2108.7133.7152.2167.9
Ireland166.2214.6272.7336.3386.2
Italy1604.51636.41809.92045.72274.7
Luxembourg39.551.866.080.094.3
Netherlands631.5665.5781.1904.91008.4
Poland361.7427.8533.5617.6670.1
Portugal179.9179.4205.5229.3253.2
Slovakia67.478.197.8127.5141.6
Spain1080.91081.21265.11372.01517.2
Sweden369.1444.2550.7647.8726.4
United Kingdom1813.32568.12812.33347.03795.8

