1. Introduction
Traditionally, the energy system has been developed to meet the needs of local communities [
1,
2]. The energy demand of the cities and communities increased rapidly with the increasing number of activities. Due to economies of scale, increasing demand as well as resource complementarity, the energy systems quickly took present, centralized and networked form. The large centralized power plants produce electricity which is transferred unidirectional to the households, industry and commercial buildings through transmission and distribution networks [
3]. At present, built environment accounts for two-thirds of primary energy demand and 70% of global CO
2 emissions [
1]. Despite performing well in terms of techno-economics, social and environmental values could not be adequately considered in the centralized energy system. Moreover, the role of local communities and cities so far has been largely limited to the passive consumers. These issues demand the energy system transformation efforts to focus on cities and local communities.
The recent energy system transformation, together with technological changes, are opening several ways for a large number of distributed energy resources (DERs) to be part of the energy system. Several recent researches focus on system integration of these DERs in the energy system [
4,
5,
6,
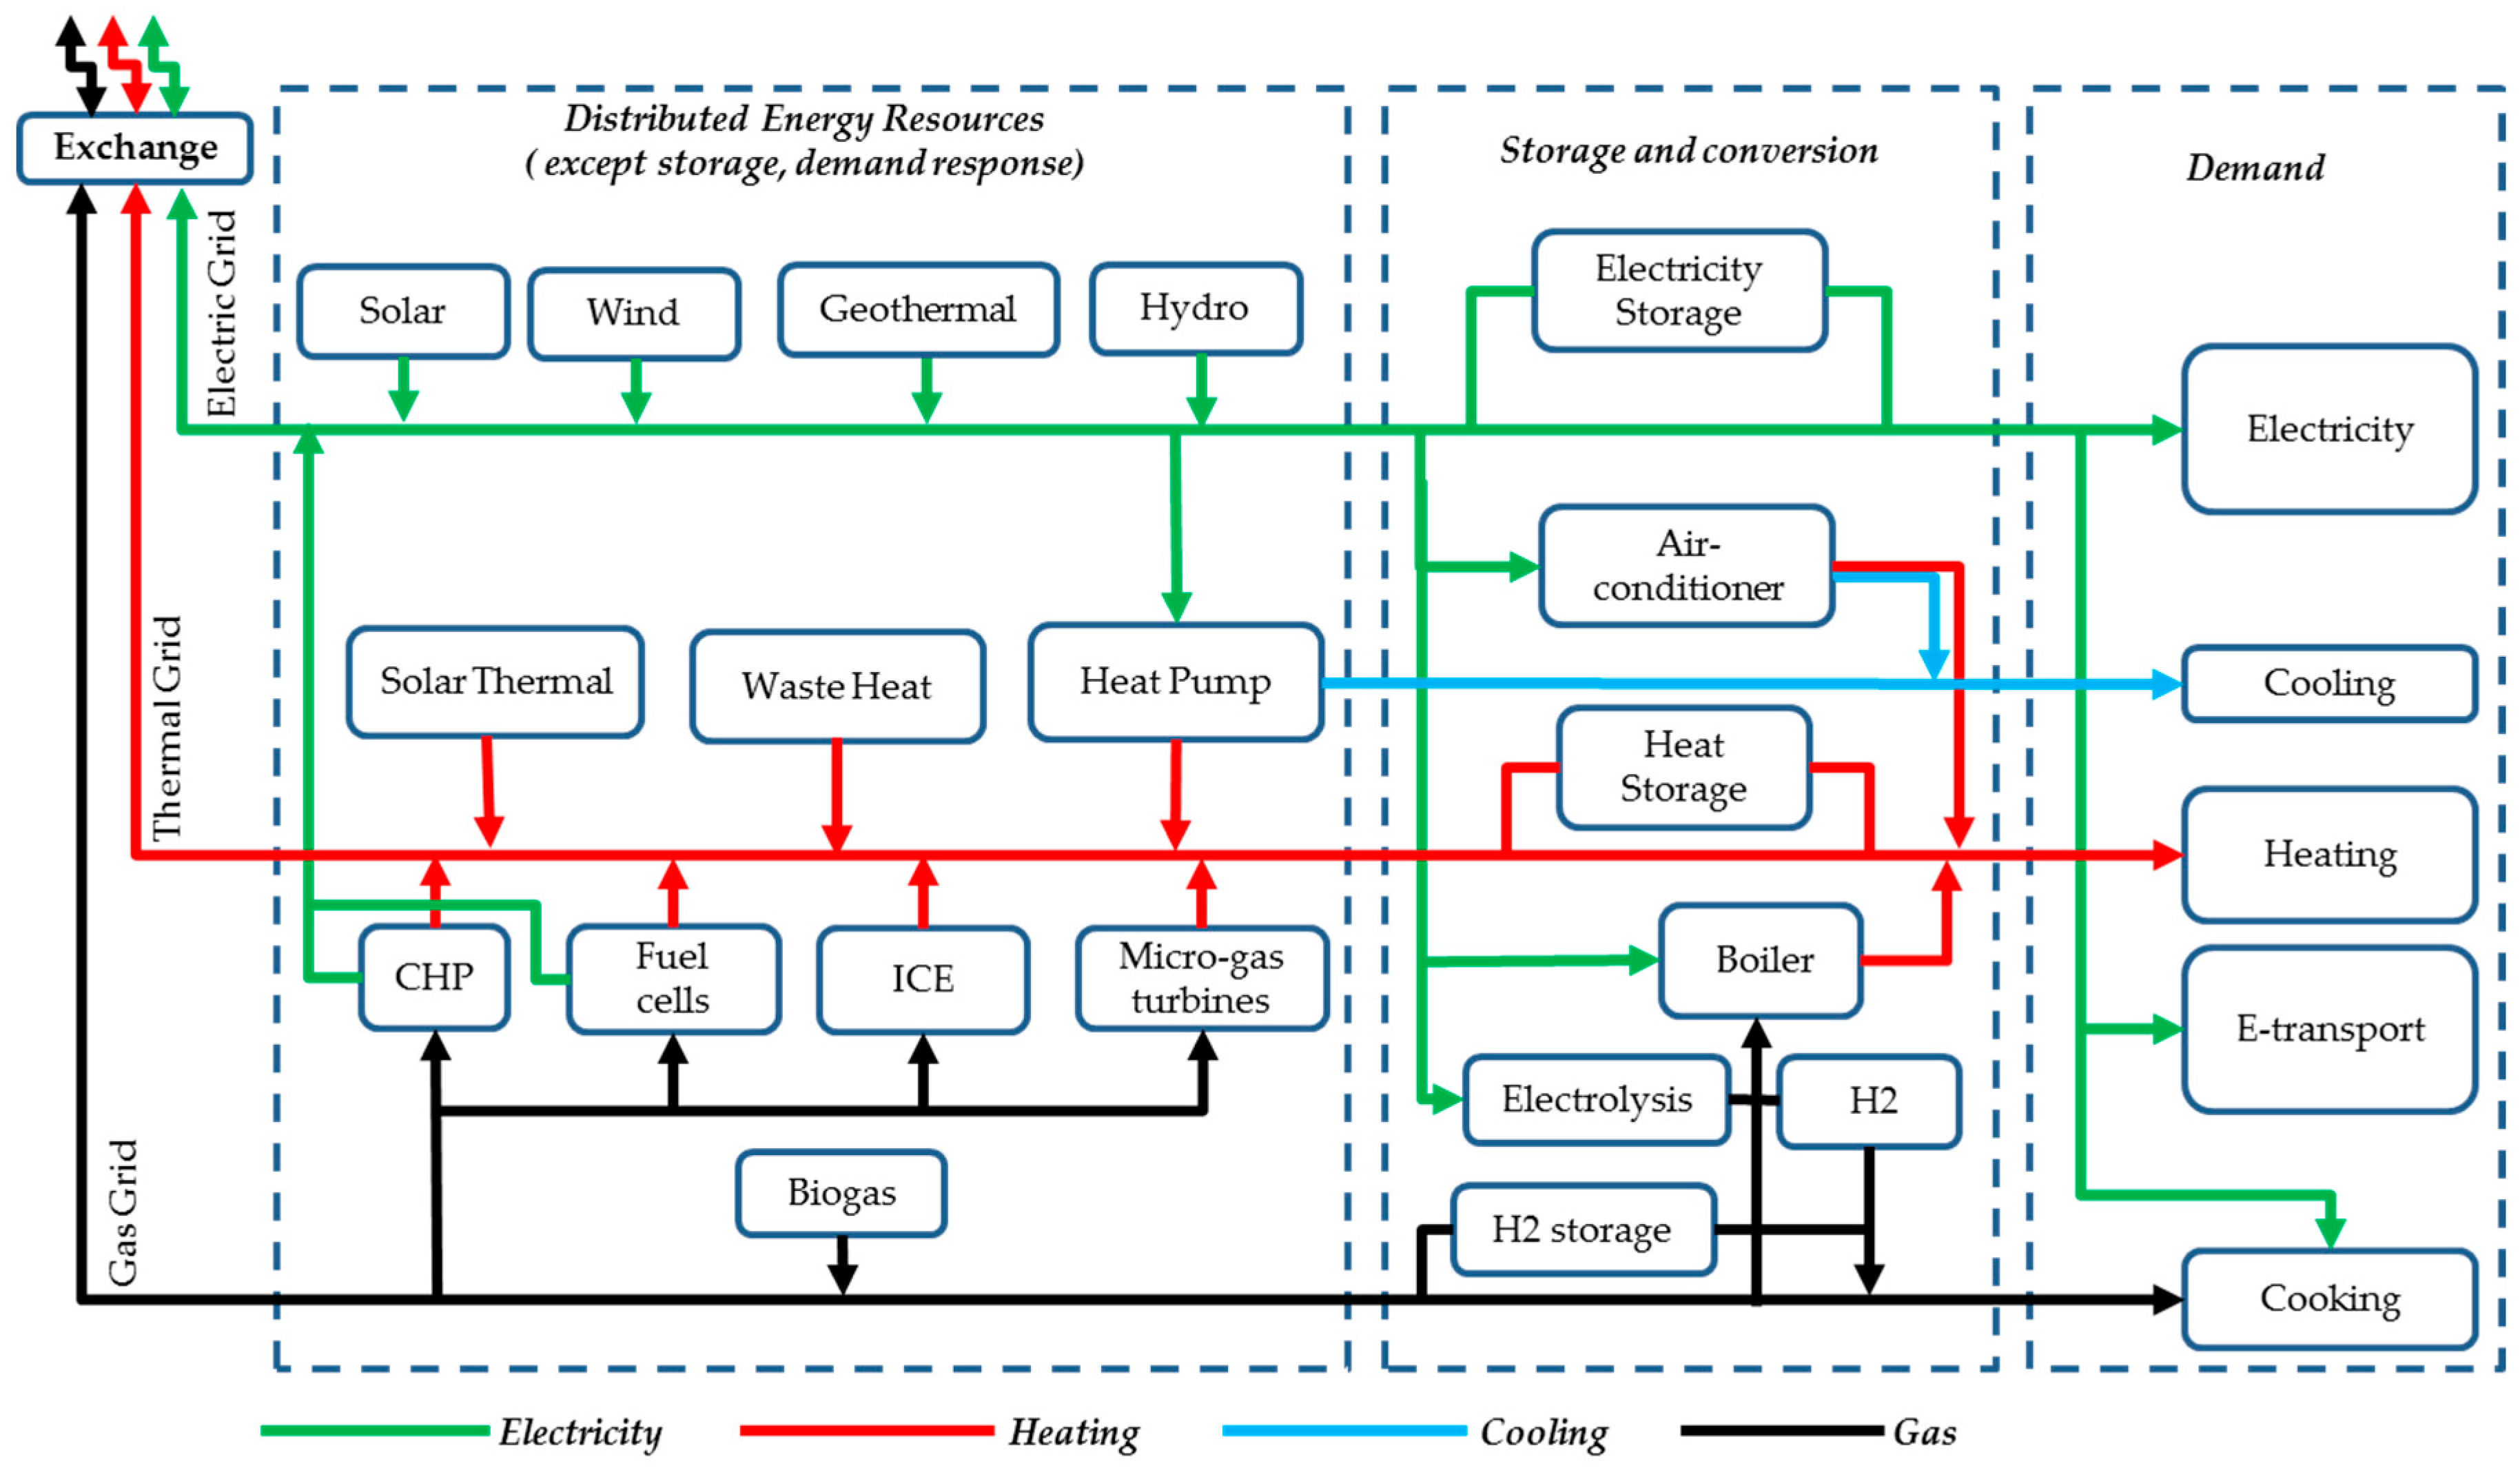
7]. Moreover, the traditional energy supply systems consisting of separate networks for electricity, gas and district heating designed to operate independently are changing with increasing interaction and complementarities between the different energy carriers, see
Figure 1 [
8,
9,
10]. In this context, different energy carriers can work in synergies leading to a more sustainable and integrated energy system [
8,
9,
11,
12,
13]. For example, currently available DERs, such as combined heat and power (CHP), heat and electricity storage as well as advancement in information and communication (ICTs) and smart grid technologies enable integrated operation of a smart energy system [
8,
13,
14]. At the same time, the decarbonization efforts on traditionally centralized energy systems will have a significant impact on current energy networks and will lead to new forms of energy systems where DERs will play more important roles in energy supply. One such impact is increasing electrification of different sectors as depicted in
Figure 1. Almost all types of local energy demand can now be met with electricity.
Household and community level energy generation, storage and energy management systems are expected to gain more importance in the integrated energy system [
15]. Moreover, consumers will not only consume but also actively invest in DERs as well as respond to price signals and provide services to the system [
16,
17,
18]. The rapid fall in prices of DERs indicates the possibility of locally-owned, independent power systems [
19]. As a result, the technological and institutional arrangements of the current energy systems at crossroads also need to change and new business models need to emerge [
20,
21].
In this context, integrated community energy systems (ICESs) are multifaceted smart energy systems to optimize the use of all local DERs, dealing effectively with a changing local energy landscape and local communities. ICESs are significantly different from individual households installing DERs due to the possibility of co-operation and local exchange. ICESs represent a comprehensive and integrated approach for community energy systems where local communities can manage their energy system capturing benefits of energy system integration options. The concept of ICESs is further elaborated in detail in [
22,
23,
24].
The grid so far has always been an enabler for the system integration of DERs [
20]. This has positively impacted the penetration of DERs all around the world. For example, the excess energy from DERs can be sold through the electricity grid and the local bio-gas can be mixed to the natural gas grid. However, current high retail prices and charges for energy as well as improving economics of DERs, are encouraging alternative organizations, such as ICESs where local consumers can take back the control of their energy system. With increasing penetration of DERs, ICESs can either be integrated to the grid or defected from the grid [
25,
26]. In the grid-integrated operation, the deficit can be purchased and the surplus can be sold to the grid. In other words, the grid acts as storage for the ICES. On the other hand, the grid-defected system has to meet all the demand locally. The rising regulated cost in the energy bills and decreasing DERs cost, are creating an enabling environment for customers to get disconnected from the grid and manage their own local grid [
19,
27,
28,
29,
30].
The alternative organization of ICESs as grid connected or grid-defected system has both benefits and challenges. While it is technically possible to have both grid-integrated and grid-defected ICESs, the economic and environmental assessment and evaluation of such ICESs operation is still lacking. Specifically, the value of a group of households being organized as a single entity, such as an ICES, to the local community as well as to the whole energy system is yet to be determined. The main aim of this paper is to develop the assessment framework for the grid-integrated and grid-defected ICESs and present a model-based analysis on the value of both systems.
This paper begins with the conceptualizing of ICESs as a local alternative for energy supply, followed by a problem statement in
Section 3. In
Section 4, the research design in terms of modelling framework and the model-structure as well as formulation are presented.
Section 5 introduces the case study from the Netherlands. In
Section 6, different results on investment and operation as well as economic and environmental performance of both grid-integrated and grid-defected Dutch case studies are presented. Finally,
Section 7 concludes and provides policy recommendations.
2. Integrated Community Energy Systems as Local Alternative for Energy Supply
Local communities are well-placed to identify local energy needs, and bring people together to achieve common goals such as self-sufficiency, resiliency and autonomy [
31,
32,
33,
34,
35]. Commons-based energy systems such as ICESs are implemented with the aim of reducing energy cost, CO
2 emissions and dependency on traditional incumbent utilities.
Although local energy initiatives are rapidly emerging, the motivations have been mainly economic incentives. For example, the lucrative feed-in-tariffs in Germany attracted local investment in DERs through energy co-operatives and individual households. As a result, more than half of renewables installed in Germany are owned by local citizens and communities [
36]. However, the market conditions and support incentives in terms of feed-in tariffs have changed resulting in stagnation of the growth of energy co-operatives in Germany [
37]. These co-operatives are now in a dilemma on how to make the most out of the locally generated energy. This means household and community generation have to compete with centralized generation with economies of scale, highlighting further the need of higher local balancing within ICESs. Alternative business models such as local balancing and ancillary services for the whole energy system, as characterized also in the ICESs, are expected to continue their growth. The association of German energy co-operatives already recognizes such needs [
37]. Other challenges include split-incentives problems, collective financing, fair cost-benefits allocation, operation and complexity in decision-making [
22]. Moreover, ICESs might encourage opportunistic behavior by avoiding contribution towards network and policy costs, widely known as spill-over effects.
ICESs consist of variety of options for local generation of heat and electricity, flexible demand, e-mobility as well as energy storage. Such an integrated approach at the local level helps the efficient matching of local supply and demand. At the same time, advancement in smart-grid technologies not only increase reliability and efficiency of such local energy systems but may also affect the existing system architecture and influence the way ICESs will evolve.
Increasing numbers of local communities around the world have resources and willingness to implement the ICES. For example, there are more than 2800 energy co-operatives in Europe, of which 900 in Germany and 500 in the Netherlands alone, showing a huge potential for the emergence of ICESs [
38,
39]. Several houses in the local communities cooperate for collective purchasing or community level investment further reducing the initial cost. ICESs also lead to local job creation and local economic growth, foster the transition to a low-carbon energy system, build consumer engagement and trust as well as providing valuable flexibility to the market [
22].
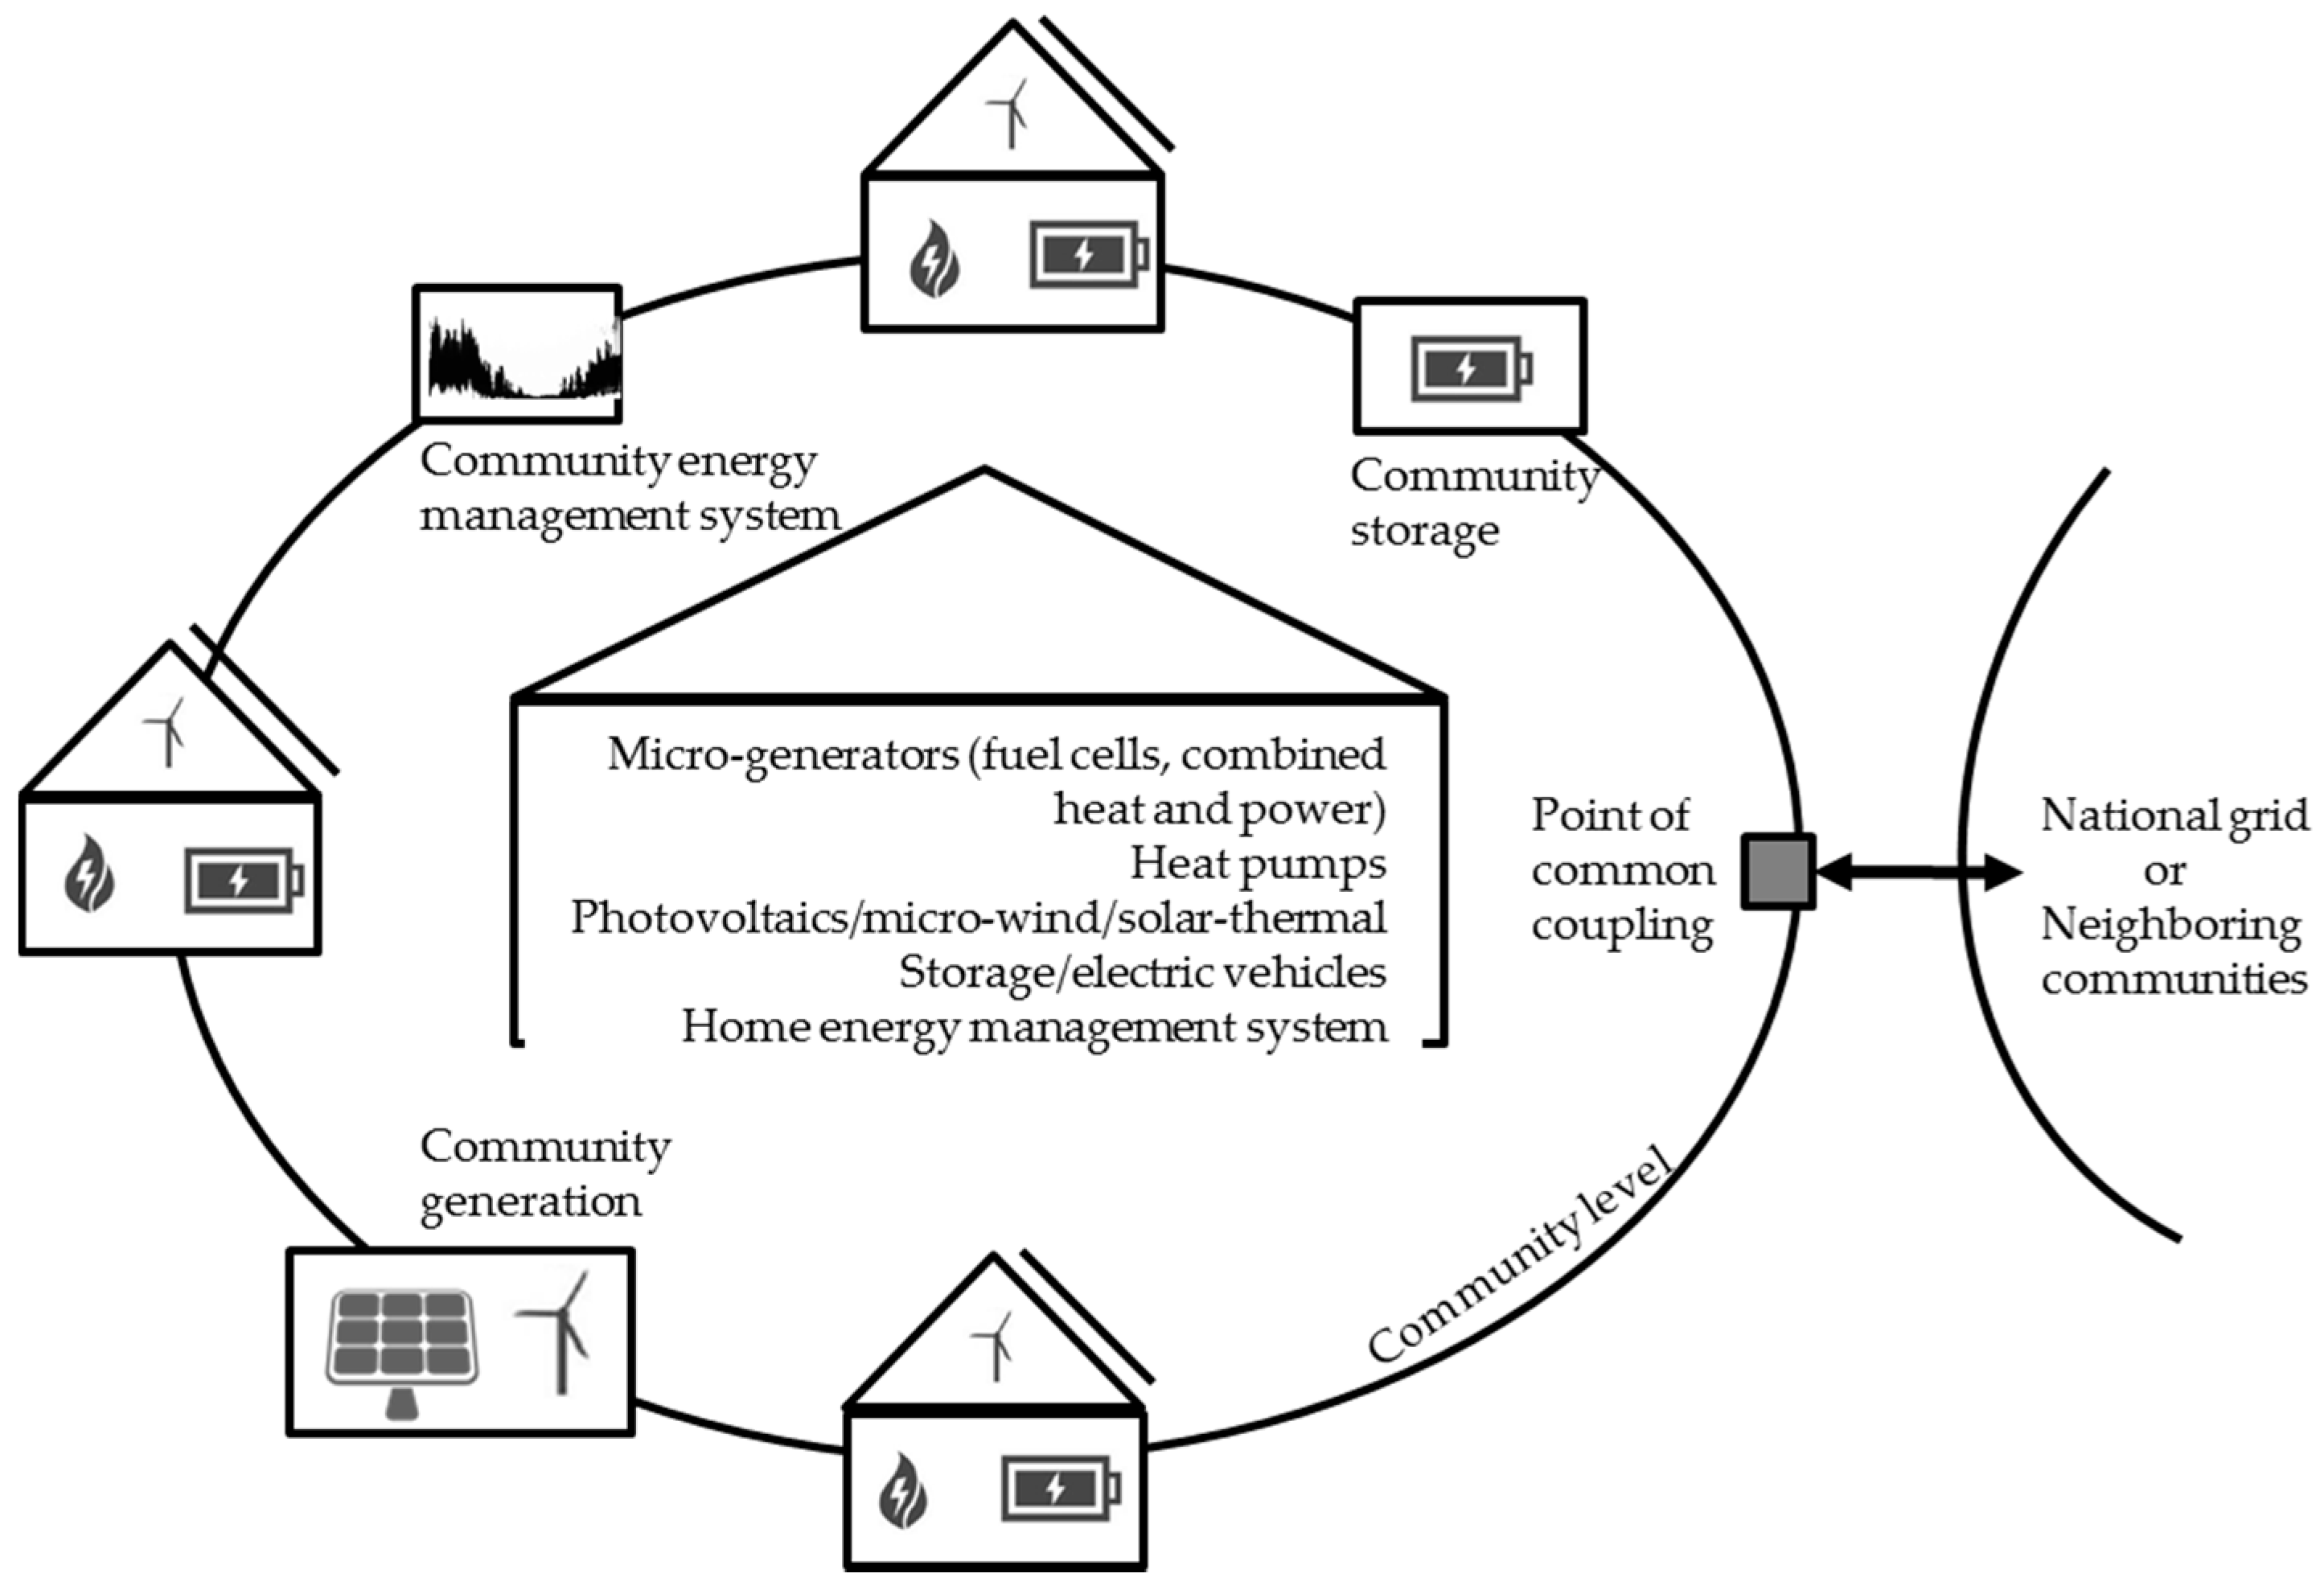
As illustrated in
Figure 2, the households are the basic units of the ICES. In the changing local energy landscape, these households can invest in local generation technologies such as solar photovoltaics (PV), solar thermal, CHP, fuel cells, electric and thermal storage, electric cars and heat pumps (HPs) as well as home energy management systems to ensure effective energy balance and smart operation at household level.
A group of consumers may join and cooperate together in the form of ICESs, implying some advantages and challenges. The advantages include larger economies of scale due to common installations; multi-carrier efficiency gains from bundling different energy sources (e.g., electricity, heating, cooling); increasing reliability at lower costs; community engagement and fulfillment of community visions, such as autarky or energy independence where consumers are willing to pay higher costs for self-provided electricity within a community. Further investments are possible in community level technologies, if the local community supply is not enough or it is cheaper compared to the household investment or grid-supply in the case of grid-connected systems. On the other hand, the challenges include collective decision making on investment and operation of the local network and energy management systems; mismatch between life cycles of DERs and the local network; a complex decision making process as well as split-incentive issues. Based on these advantages and challenges, the local communities can decide to operate their energy system integrated to the grid or defect completely.
Surplus of local generation from the households is pooled in the community energy exchange platform. The household can also purchase deficit energy from the platform. Different options exist for operating the local energy exchange platform such as peer to peer exchange, marginal or average cost-based local energy markets [
40]. Due to the system perspective in this study, the transactions between the members are considered but not priced, and the energy exchanges among households are free of charge. As cost allocation of the local exchange is very important for the success of the ICES, the design of the system of prices and charges within the ICES definitely should be a future research agenda. For grid-integrated ICESs, energy deficits or surpluses at the community level can be purchased or sold to other communities or market agents through the national grid. The grid-integrated ICES can also provide different energy services for the system operators, such as balancing and flexibility, however this is beyond the scope of this research. The grid-defected ICES, on the other hand, has to maintain the energy balance locally.
3. Problem Statement
It is technically possible to have both grid-integrated and grid-defected operation at household level and the economic and environmental assessment and evaluation of the former system is promising [
19,
27,
28,
29]. Despite falling prices of DERs, the grid-defected system for individual households, on the other hand, is not yet economically attractive. Assuming the technical possibility, the aggregation of group of local consumers in the form of ICESs might further improve these results. For this, economic and environmental assessment and evaluation of such local aggregation is needed.
ICESs are expected to have technical, economic and environmental potential for improving local energy systems. Yet, the modelling of complex socio-technical systems under the changing energy landscape is a tedious task. Several technological, socio-economic, environmental and institutional issues as well as emerging trends at the energy landscape shape the emergence of ICESs [
22]. As the benefits and costs are understood, the added value of ICESs could also can be assessed. The local aggregation in the form of ICESs may improve the economics of DERs. The interaction and complementarities among multiple-energy carriers might also have significant value in the energy system. Critical empirical assessment of the economic and environmental value of alternative energy system organization, such as an ICES, is needed [
41].
4. Materials and Methods
4.1. Modelling Framework
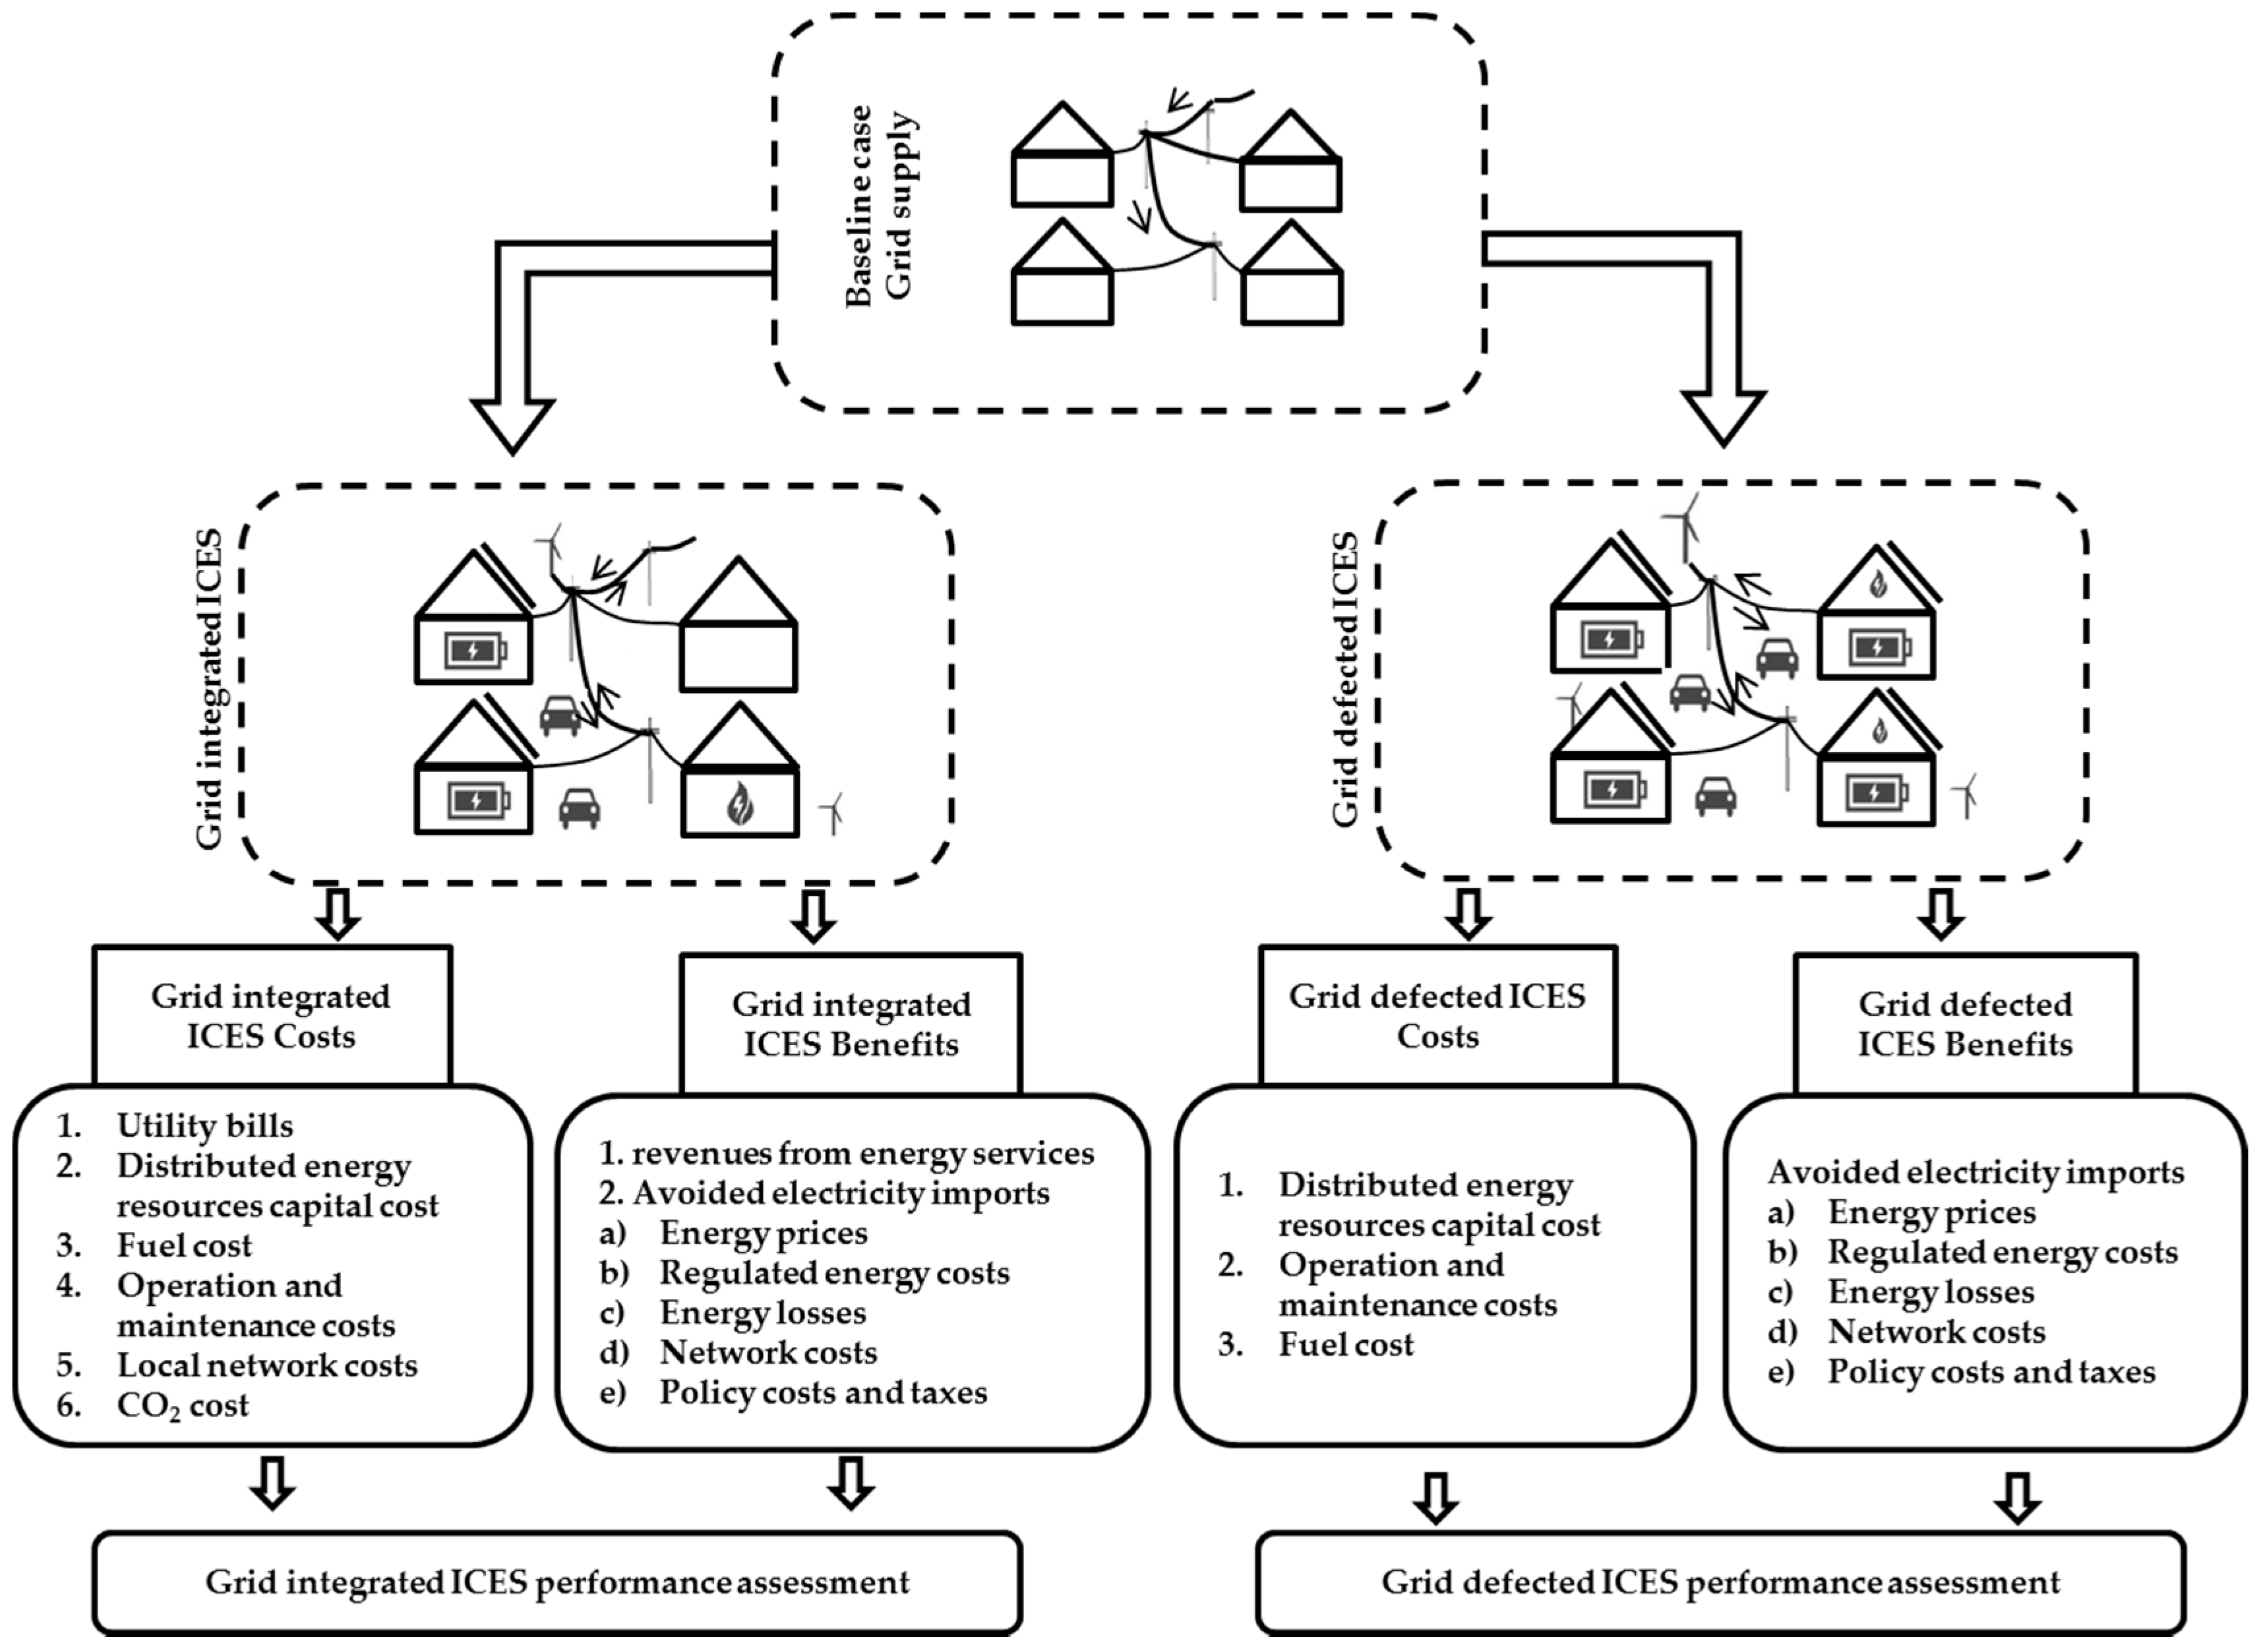
The general modelling framework for ICESs is presented in
Figure 3. Households are the basic units of ICESs with different energy demand profiles. For the base case, it is assumed that households are passive consumers and do not invest in DERs. A number of households cooperate to form ICESs which can operate either in grid-integrated or in grid-defected mode. The investment and operation of DERs, as well as associated cost and benefits are different for each case which in turn impact its economic and environmental performance.
Grid-integrated ICES costs involve utility energy bills, capital costs for DERs and the energy management system, fuel costs, operation and maintenance costs as well as network costs to interconnect households. There are many benefits of the ICES as result of the several services provided to their members and to the system. Some of these benefits create efficiency in the whole energy system, such as energy sales, avoided energy imports at lower costs than the one provided by the external system and corresponding energy losses, whereas other benefits such as saving in network charges, or policy costs and taxes might be opportunistic; for further details on efficient and opportunistic benefits of aggregation strategies in the power system please refer to [
26]. In addition, the ICES may present system benefits, such as reduced network usage due to local balancing which can defer the need for network reinforcement. When assessing the grid-integrated and grid-defected ICES profitability, these avoided costs should be accounted properly. Grid-defected ICES’s cost mainly comprises of DER capital cost, operation and maintenance expenditure as well as fuel costs for the back-up system.
4.2. Integrated Community Energy System Model
Problems in energy systems related to efficient planning and operation are nowadays very complex and very often a large data set is associated. Optimization techniques such as linear and non-linear programming has played important roles in economic, secure and reliable operation of present energy system. The rise of DERs and bottom-up local energy initiatives further complicates the planning and operation of the present energy system as well as the associated economic and environmental implications [
42]. In this context, DERs investment and scheduling problems have been addressed by several studies [
43,
44,
45,
46,
47]. Many of these studies present sophisticated optimization techniques to solve DER investment and scheduling problems. In this process, several tools such as hybrid optimization model for electric renewables (HOMER) and distributed energy resources-consumer adoption model (DER-CAM) have been developed [
43,
47]. In HOMER, investment and operation costs as well as techno-economic and emission constraints are considered for the optimal sizing of hybrid renewable energy systems [
47]. A recent study on grid-integrated and grid-defected operation of DERs at household level using HOMER is presented in [
19]. DER-CAM is a mixed-integer linear programming model developed at the Lawrence Berkeley Laboratory [
43,
48]. DER-CAM is being widely used to solve DER investment and scheduling problems as well as for economic and environmental analysis of DERs [
43,
48]. Recently, a web-based version of DER-CAM, called DERs Web Optimization Service (WebOpt), as well as DER-CAM+, is also available [
48].
Despite these developments, little has been done regarding DER investment and scheduling considering a collective and co-operative action of a group of households in local communities. The aggregation of DERs is proven to be beneficial even for relatively small groups of prosumers in comparison with individual configurations [
6]. This work advances the study on the ICESs where a group of customers cooperates to efficiently manage their local energy systems, including DERs at individual premises as well as in common spaces. DER investment and scheduling problems as presented in [
43], are taken to one level higher from a one-node building level to the multi-node community level. DER-CAM is used as the modelling basis due to its validated use as well as inbuilt capability to conduct economic and environmental analysis of DERs.
In this study, we adapted the previously one-node DER-CAM model to the multi-node DER-CAM based ICES model incorporating aggregated investment and operations of DERs at several household and community levels. The main highlights of the model over DER-CAM are:
- (1)
A new set for households (H) has been added to each equation;
- (2)
Different electricity, hot-water, space-heating and cooling demand profiles for each household are considered;
- (3)
The simulation and optimization of DER investment and scheduling in several households simultaneously are possible;
- (4)
In addition to individual investment in DERs, the community can also decide to invest in community-level technologies provided there are economies of scale;
- (5)
The local exchange between the households is enabled;
- (6)
The DER installed capacity and exchanges are constrained by the maximum line capacities;
- (7)
Grid connected and grid-defected operation options are available.
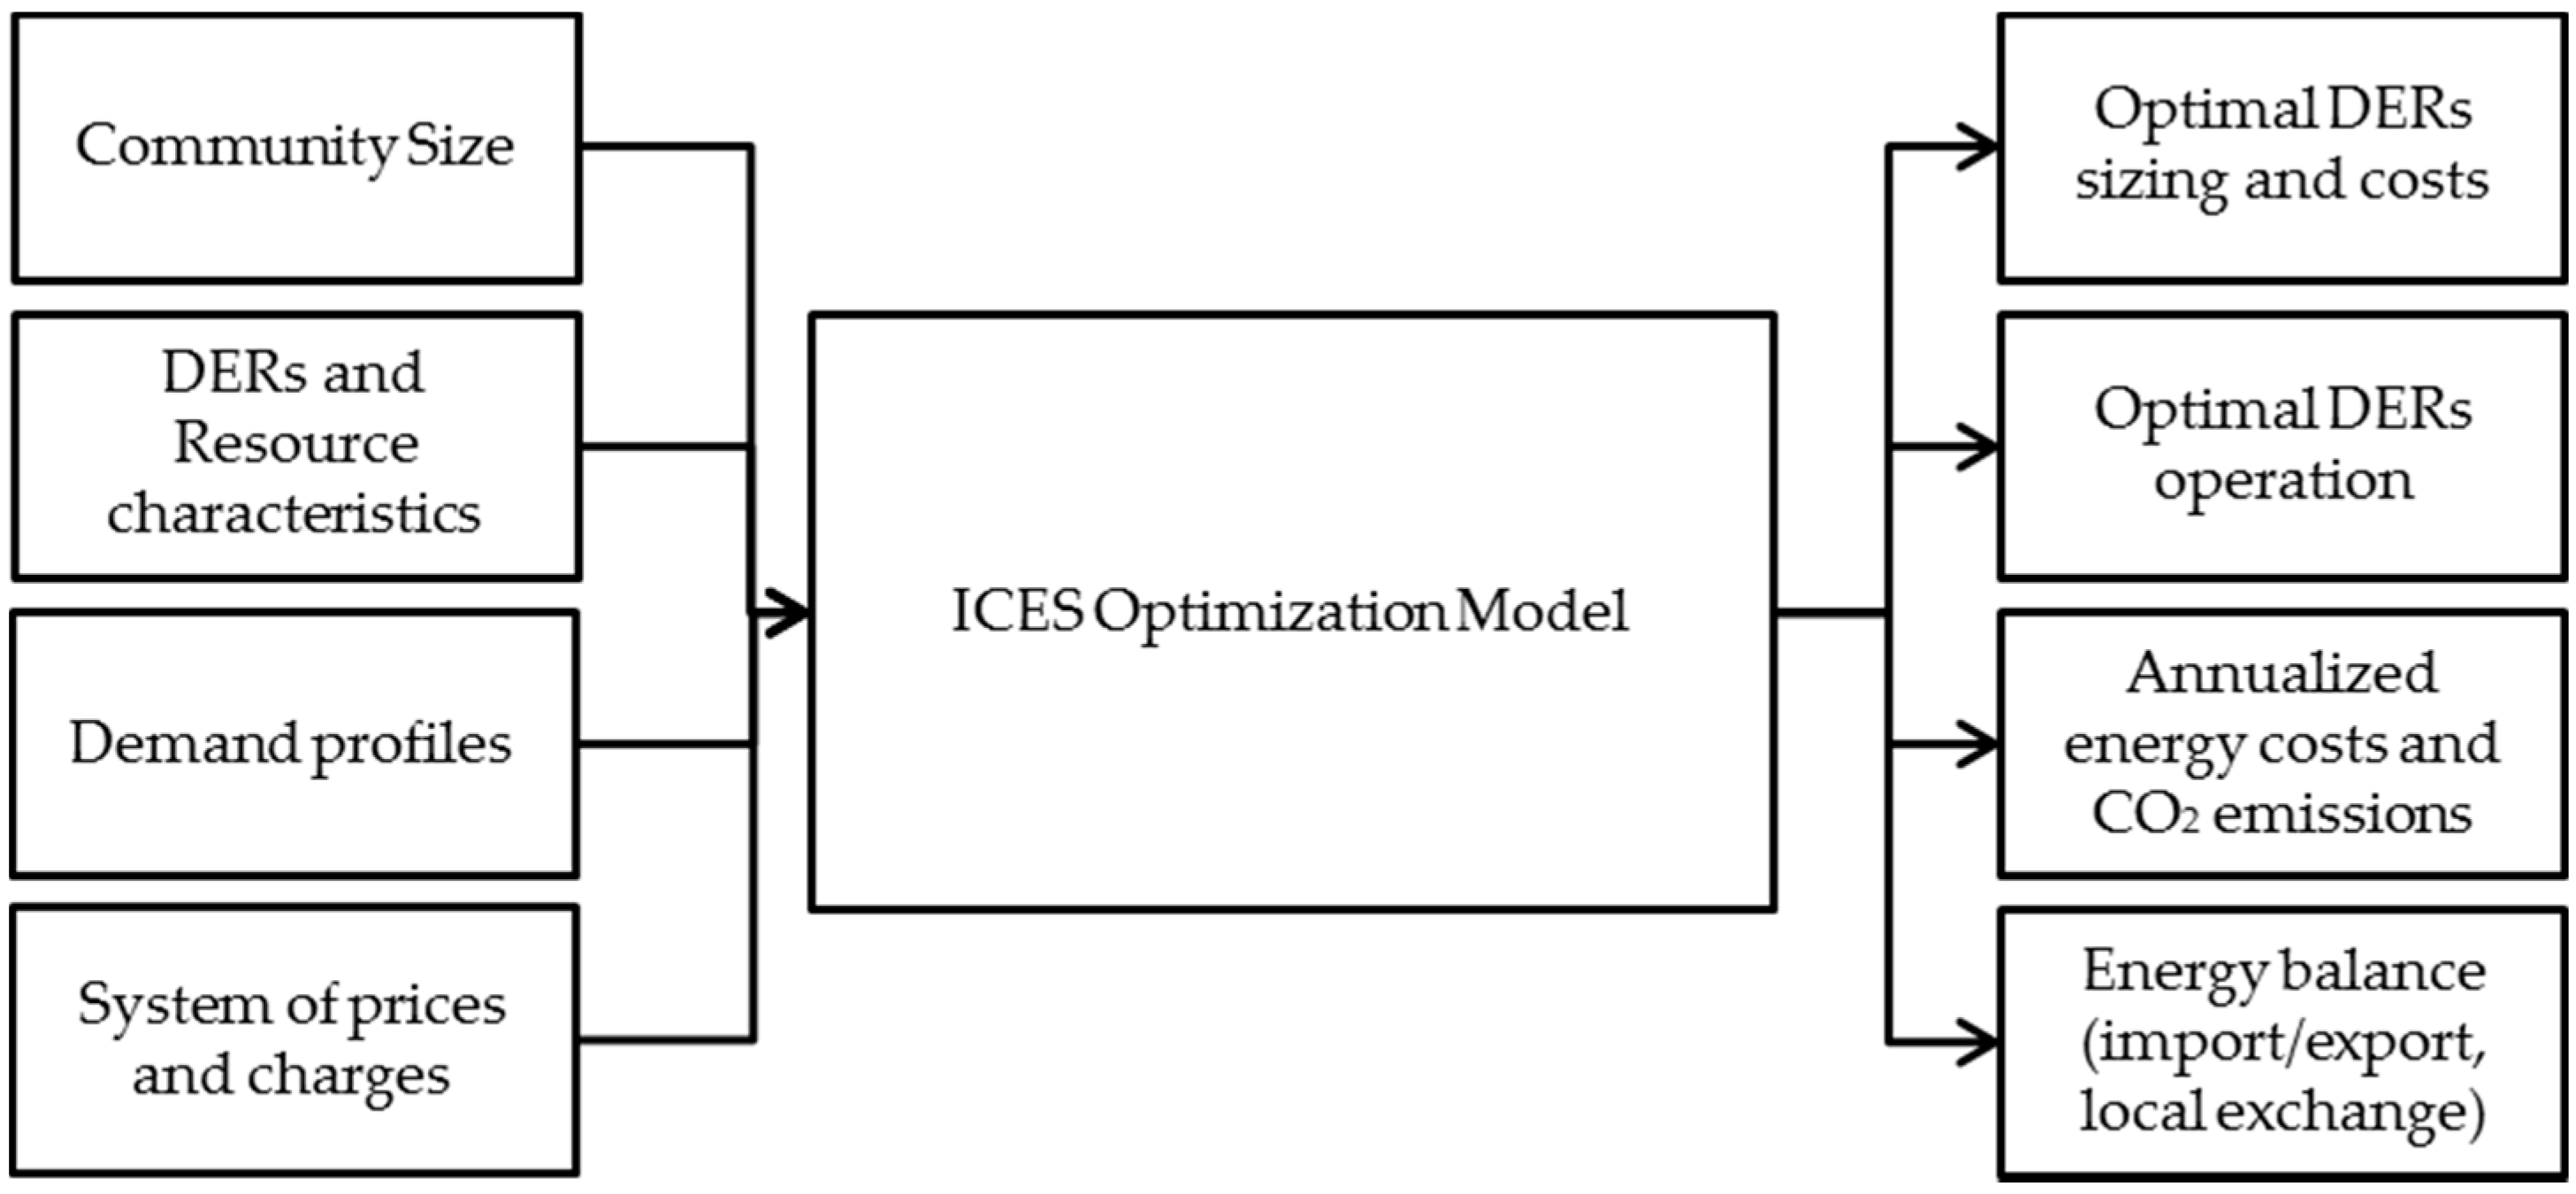
Figure 4 presents the input and output block diagram for the ICES model. In demand profiles, different energy carriers and end-uses are considered: electricity, hot-water, and space-heating and cooling demands for each individual household. Provided there is demand profile available, the community size can be chosen accordingly. The techno-economic data of the available household and community level DERs is also the input for the ICES model. The system of prices and charges varies according to the region or country and should be provided as an input. The resource data, such as temperature and solar irradiation, is also the key input to the model. Consumers have the possibility to invest in DERs and perform local exchanges in order to reduce their energy bills as well as carbon footprint. Optimal investment options are considered for both households and communities as more DERs become technologically and economically available.
The outputs of the model are optimal for DER sizing and operational for both household and community level. The annualized energy costs and CO2 emissions are used as performance metrics for economic and environmental analysis. In addition, detailed data on energy balance at household and community level such local exchange, unused or curtailed energy, import and export is also available as output.
4.3. Integrated Community Energy System Model Formulation
Similar to DER-CAM, the ICES optimization model is a mixed integer linear programming. It has been solved in the general algebraic modelling system (GAMS) environment [
49].
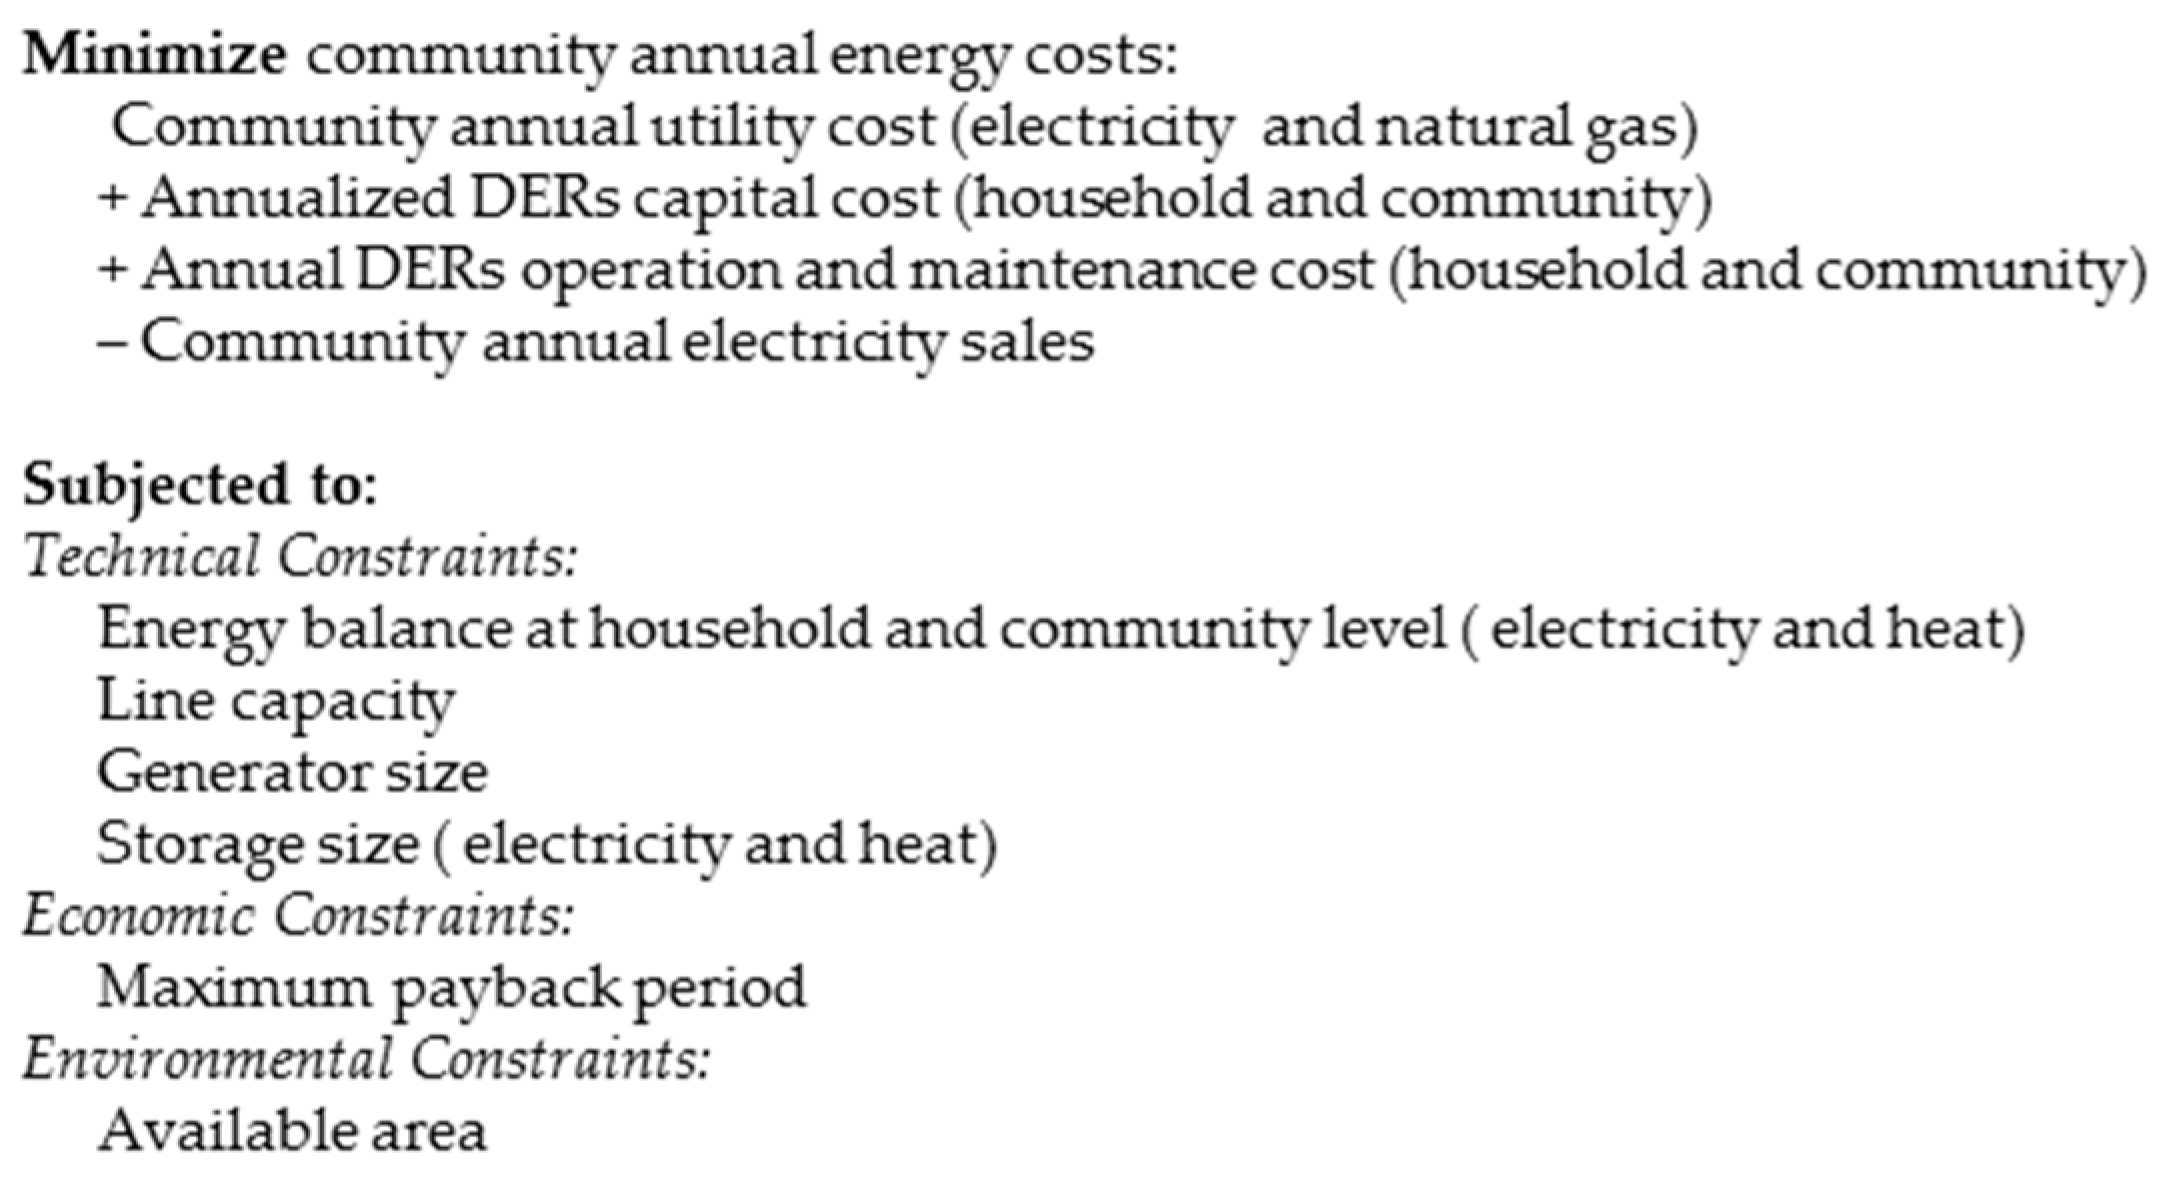
Figure 5 presents the structure of the DER-CAM based ICES model, including the main objective function as well as the key constraints. The main objective of the model is to minimize annualized total energy costs for the community. The community annual energy costs consist of annual utility costs for electricity and gas of each household; annualized DER capital; operation and maintenance costs, as well as revenues from the annual electricity sales outside of the community.
The operation of ICESs is subjected to several techno-economic, and environmental constraints. Technical constraints mainly include the operational constraints. The energy balance of both heat and electricity at household and community level should be ensured such that local generation and imports always exceed the demand. Energy imports and exports capacity are constrained by the thermal limit of the conductor. The maximum generation is limited by the installed capacity. The operation of storage is constrained by several storage parameters, such as size, charging and discharging efficiency. Economic constraints include a maximum payback period allowed to get a return on investment in ICESs. The size of DERs, such as solar PV, is also constrained by the available area for installation whereas generation from solar PV is also constrained by resource availability in terms of solar insolation. The detailed model formulation is presented in
Appendix A.
5. Case Study: Integrated Community Energy System in The Netherlands
The described ICES model has been tested in a 77 household virtual energy community in the Netherlands. This community size has been chosen as per the availability of the open access smart meter data set Zonnedael from Liander on household electricity and natural gas consumption in the Netherlands [
50]. The annual electricity, space heating, hot-water, and cooling community demands are 327 MWh, 781 MWh, 310 MWh and 0 MWh, respectively. The annual gas consumption is 133,618 m
3. The total annual energy cost is 152,372 € and total annual CO
2 emissions are 390 tons.
5.1. Energy Demand Profiles and Weather Data
The individual hourly metered data for both electricity and gas are obtained from the Liander open data platform [
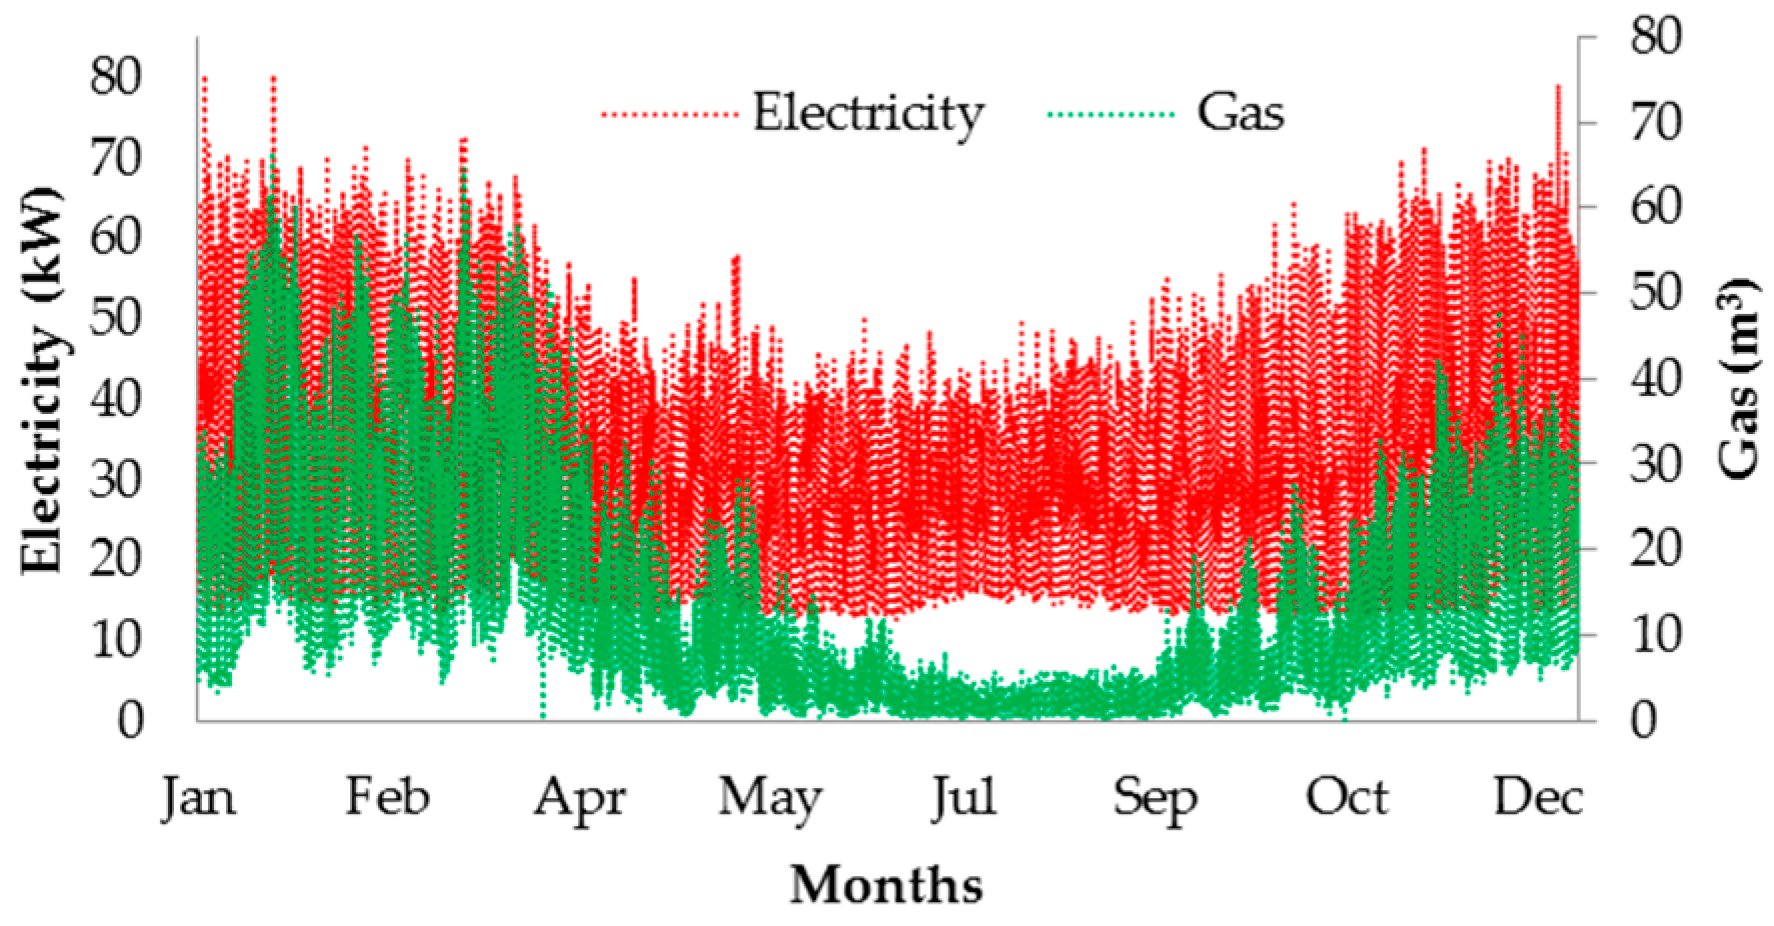
50]. The aggregated hourly demand profiles of the 77 households for electricity and gas are presented in
Figure 6. The demand profile varies depending on household types, occupants and their behavior. Furthermore, the seasonal variation on the natural gas demand is significant whereas electricity demand has a slight seasonal variation. The annual electricity demand among households ranges from 1000 to 11,173 kWh whereas the natural gas demand varies between 69 and 790 m
3. These profiles are further processed to represent the three typical demand profiles namely week, peak and weekend, for each month and for each household, in order to make them suitable for the ICES model input. The hourly solar irradiance, wind speed and temperature data are obtained from [
51].
5.2. System of Prices and Charges
The Dutch electricity and gas prices and charges for 2015 are presented in
Table 1. The Netherlands uses a mix of volumetric and fixed charges for the electricity and gas supply services. The network tariffs and suppliers’ margins are a fixed cost per month per household; wholesale energy prices are passed-through and sustainable energy surcharges (SDE) as well as regulated energy taxes are volumetric (€/MWh). Although, the Netherlands has a net metering policy (
saldering) in place for annual energy balance, we do not consider it in this study. According to the Postcoderoos regulation to promote DER penetration and local balancing, renewable electricity could be generated and sold to consumers in the same postcode area. Participants get discount in energy tax which is financed by increasing the energy prices to the rest of the consumers. This regulation allows implementation of ICESs. Furthermore, for household electricity, consumers’ annual tax reduction is applied. ICESs as entities with higher consumption are subjected to lower tax regimes as presented in
Table 1. Therefore, it is assumed that ICESs consumers do not benefit from annual tax reduction.
5.3. Distributed Energy Resources Techno-Economic Data
Table 2 presents the techno-economic data of the household and community level DERs used in this study. In addition, fixed costs of 2000 € and 10,000 € per storage unit is assumed for household and community storage units respectively, for the cost associated to the battery management systems and bi-directional inverters. The fixed costs for charging infrastructure for electric vehicles is assumed to be 1071 € per vehicle [
52]. Similarly, the fixed costs for absolute chillers, ground source HP and heat storage is assumed to be 1000 €, 2286 € and 1000 € respectively. The economies of scale effect is evident in case of community investment. The cost of capital is 5% and the maximum payback period for the investment is limited to 10 years. The CO
2 emissions from natural gas is 0.18 kg CO
2/kWh. The emissions per kWh of electricity consumed through the Dutch grid is 0.44 kg CO
2/kWh [
53]. The CO
2 tax is assumed to be 8 €/ton.
6. Results
6.1. Baseline Case
The current energy system in which consumers purchase all their energy demand from the grid is considered as the baseline for the assessment of the ICES. To reduce computational time, for most of the study, a group of the first 20 households out of the available data of 77 households is considered. These households cooperate to have a more efficient local energy system in the form of an ICES. However, all 77 households are considered to simulate the effect of the community size. The reference year is 2015 and input data are from the Netherlands. For 20 households’ ICES, the annual electricity, hot-water, space heating and cooling demand are 71.2 MWh, 167.4 MWh, 67.7 MWh and 0 MWh, respectively. The total annualized energy cost is 33,459 € and total annual CO2 emissions is 84.5 tons.
6.2. Individual Distributed Energy Resources Investment
The households are assumed to be economically rational profit-maximizers. In the current liberalized market, households can invest in DERs and trade the surplus to the energy market through the aggregators. Most of these households can optimize their energy systems based on onsite conditions, energy prices, and available DER technologies. The economic benefits include, among other, avoided energy purchase costs and revenues from selling energy surplus. However, these households operate as independent individual units and do not contribute towards local energy exchange.
In this case, the investment takes place mainly in roof-top solar PV and heat-pumps, see
Table 3. As presented in
Table 4, significant cost savings are achieved due to installation of DERs at households. Savings in total energy costs and total CO
2 emissions are 15% and 48% lower than the solely grid supplied option (baseline), respectively.
6.3. Grid-Integrated Integrated Community Energy System
An increasing number of energy communities are willing to take control of the energy system and prefer to optimize the local energy system based on total energy costs or CO
2 emissions. The model assumes that households within an ICES are energy cautious, co-operative and economically rational utility-maximizers. The households within ICESs perform similarly to the case of individual DER investment but also contribute towards local energy exchange. Hence, the prosumer households can optimize their self-consumption and feed electricity into the community pool based on techno-economic and environmental criteria. The economic benefits include, among others, avoided energy purchase costs and revenues from selling energy surplus at community level. The community can also collectively decide to invest in community DERs, such as community PV and storage. In the latter case, further cost savings are foreseen in capital costs as well as in operation and maintenance costs of DERs as presented in
Table 2. Based on this distinction, we identify two cases of ICES, namely an ICES with individual investment and ICESs with individual and community investment.
6.3.1. Investment and Operation
We assume that in the base case, there is no investment in DERs. The investment results based on objectives to reduce total energy costs are presented in
Table 1 for the individual DER investment, the ICES with individual investment and the ICES with individual plus community investment cases. For the given system of prices and charges, resource availability, techno-economics of DERs and demand, the investment takes places in solar PV and air source heat pumps (ASHP). As the heat demand is balanced within the households, the installation size of the HPs does not differ between cases whereas due to the possibility for local exchange and community investment, the amount of PV investment varies in all three cases. The possibility of local energy exchange enables further investment of 33 kW of solar PV from the individual DER investment case to the ICES with the individual investment case.
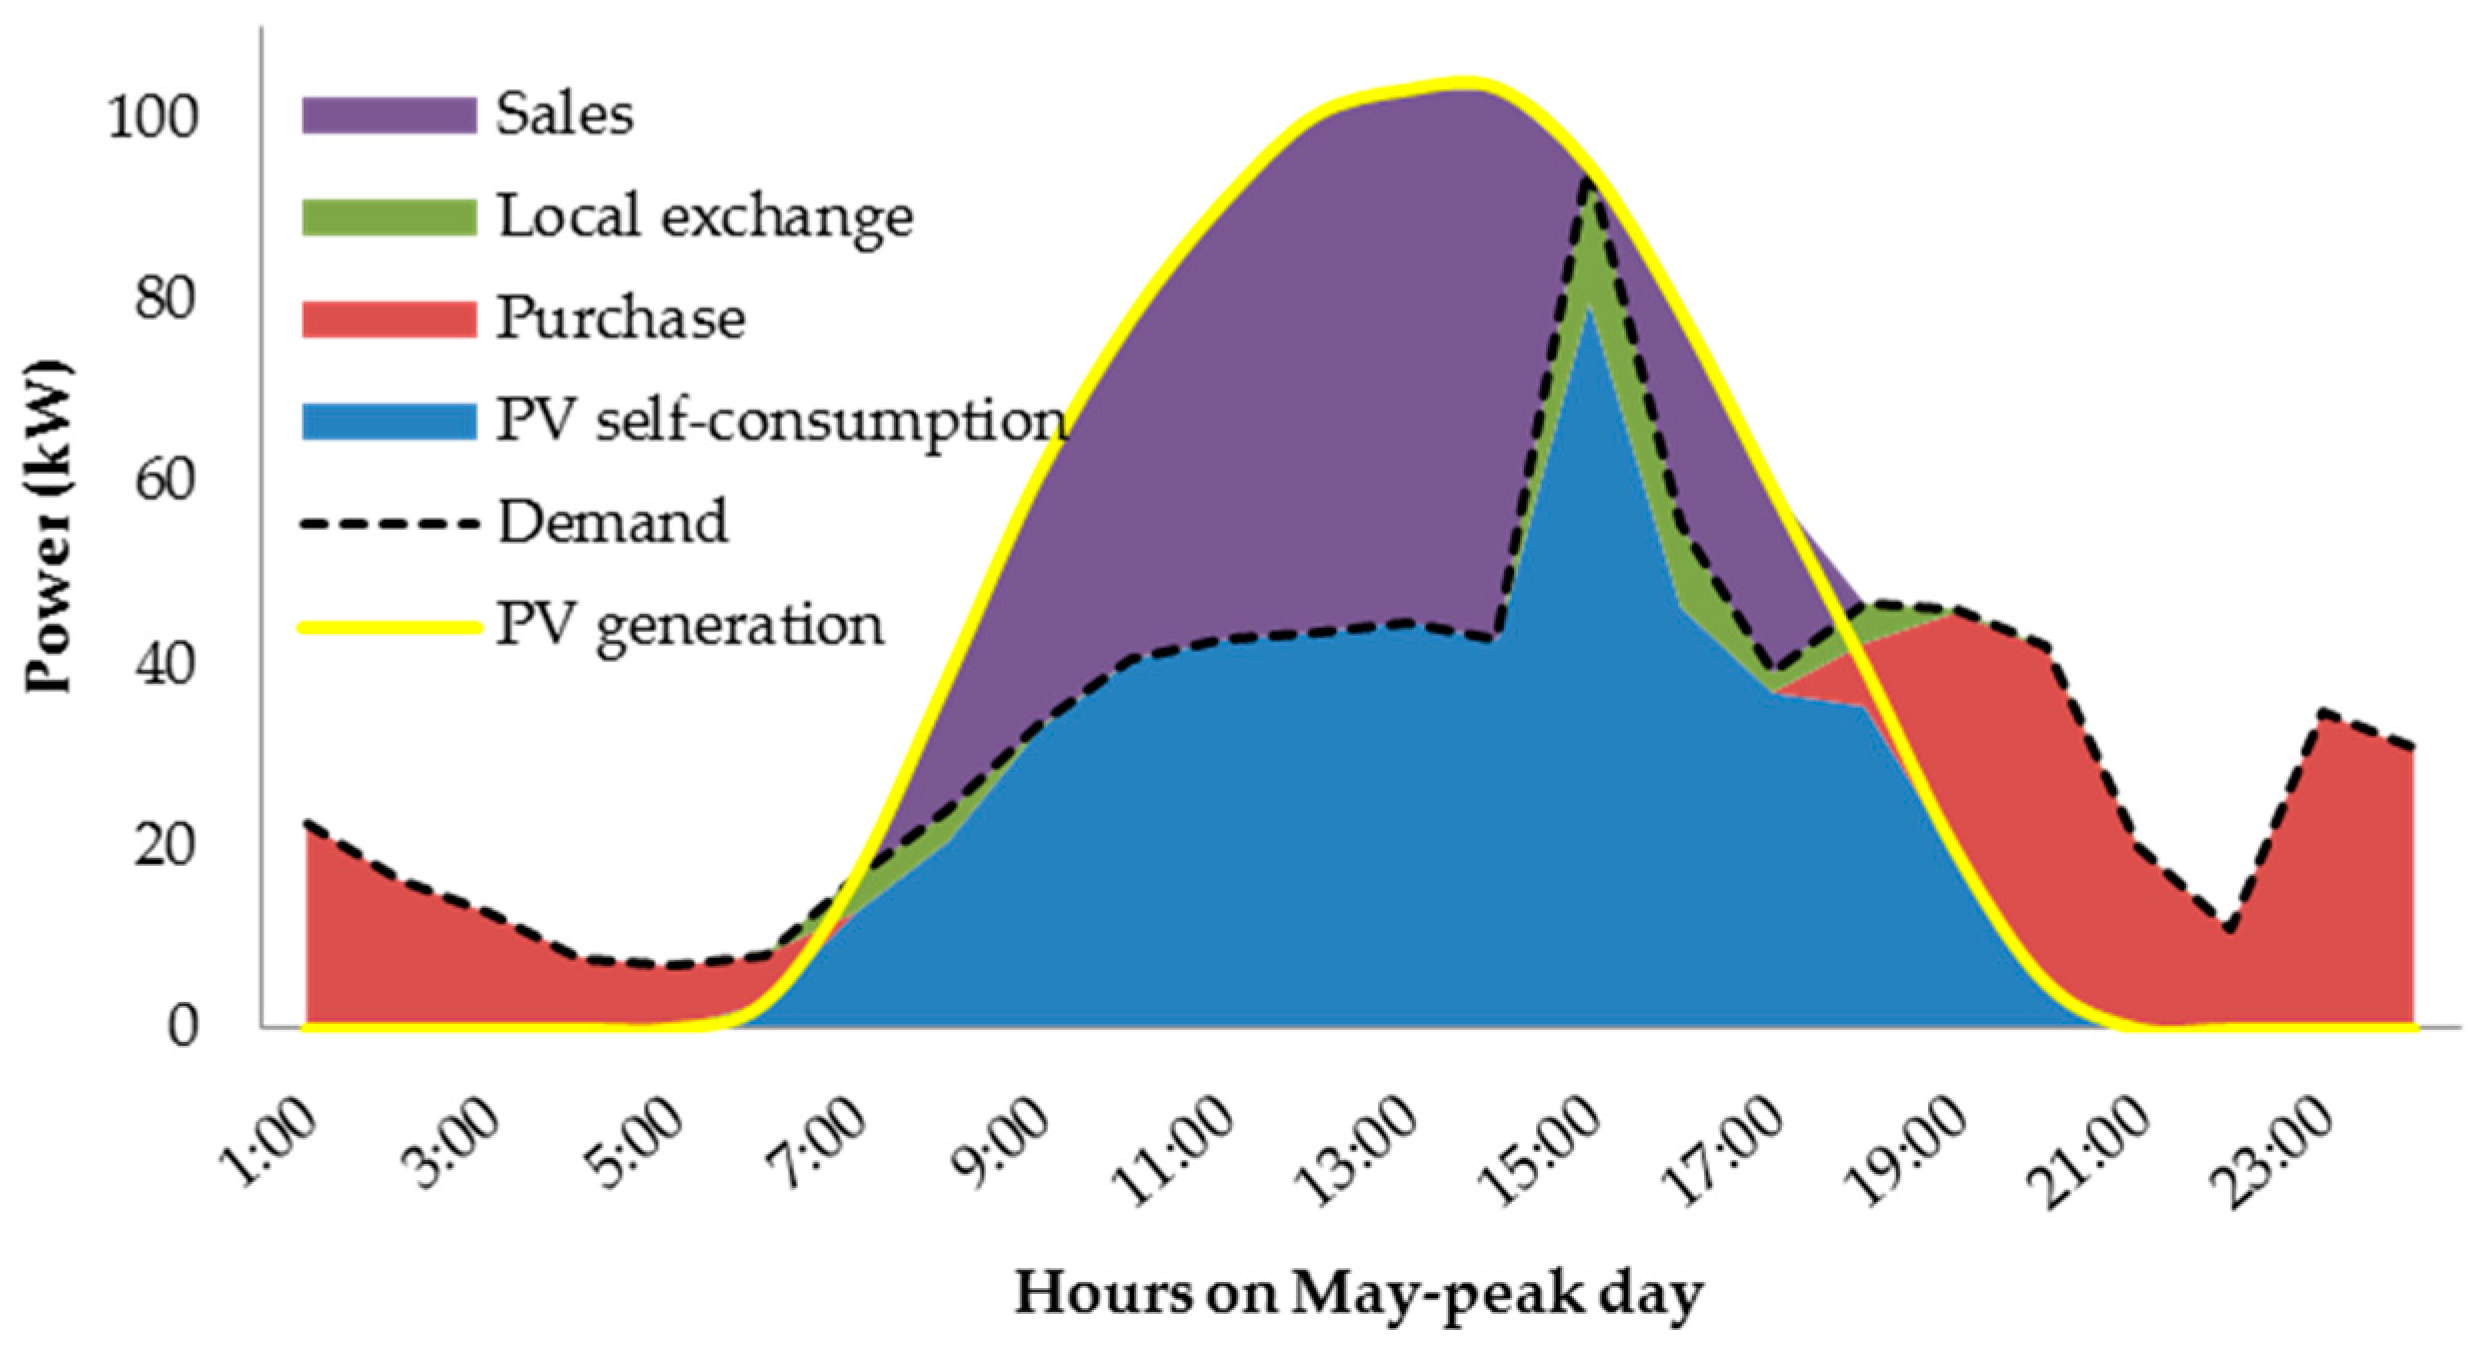
Figure 7 illustrates the energy balance at the ICES with the individual investment case. PV generation refers to aggregated profiles of 20 households whereas PV self-consumption represents aggregated self-consumption of PV generation at each household. The surplus from each household is first pooled to manage the local deficit. As PV is the only generation and each household has Solar PV installed, the local exchange on this day has a small share (37 kWh) but it is expected to increase with the diversification of DERs. Ultimately, the remaining surplus is traded to the energy market directly or through intermediaries.
6.3.2. The Economics of Grid-Integrated Integrated Community Energy Systems
The results based on objectives to reduce total energy costs are presented in
Table 4 for the baseline, the individual DER investment, the ICES with individual investment and the ICES with individual plus community investment case studies. ICES implementation leads to further savings in terms of total energy costs as well as CO
2 emissions due to local energy exchange, community engagement through load shifting, and lower tax regimes for larger consumers and economies of scale. We assume that ICES member households are more conscious and are capable of load shifting by 15%. For the ICES with the individual plus community investment case, further cost reductions of 16% are achieved compared to individual DER investment, thanks to economies of scale of community PV. In terms of CO
2 emissions, a further 11 (25%) tons of CO
2 is avoided in the respective ICES cases compared to the individual DER investment case.
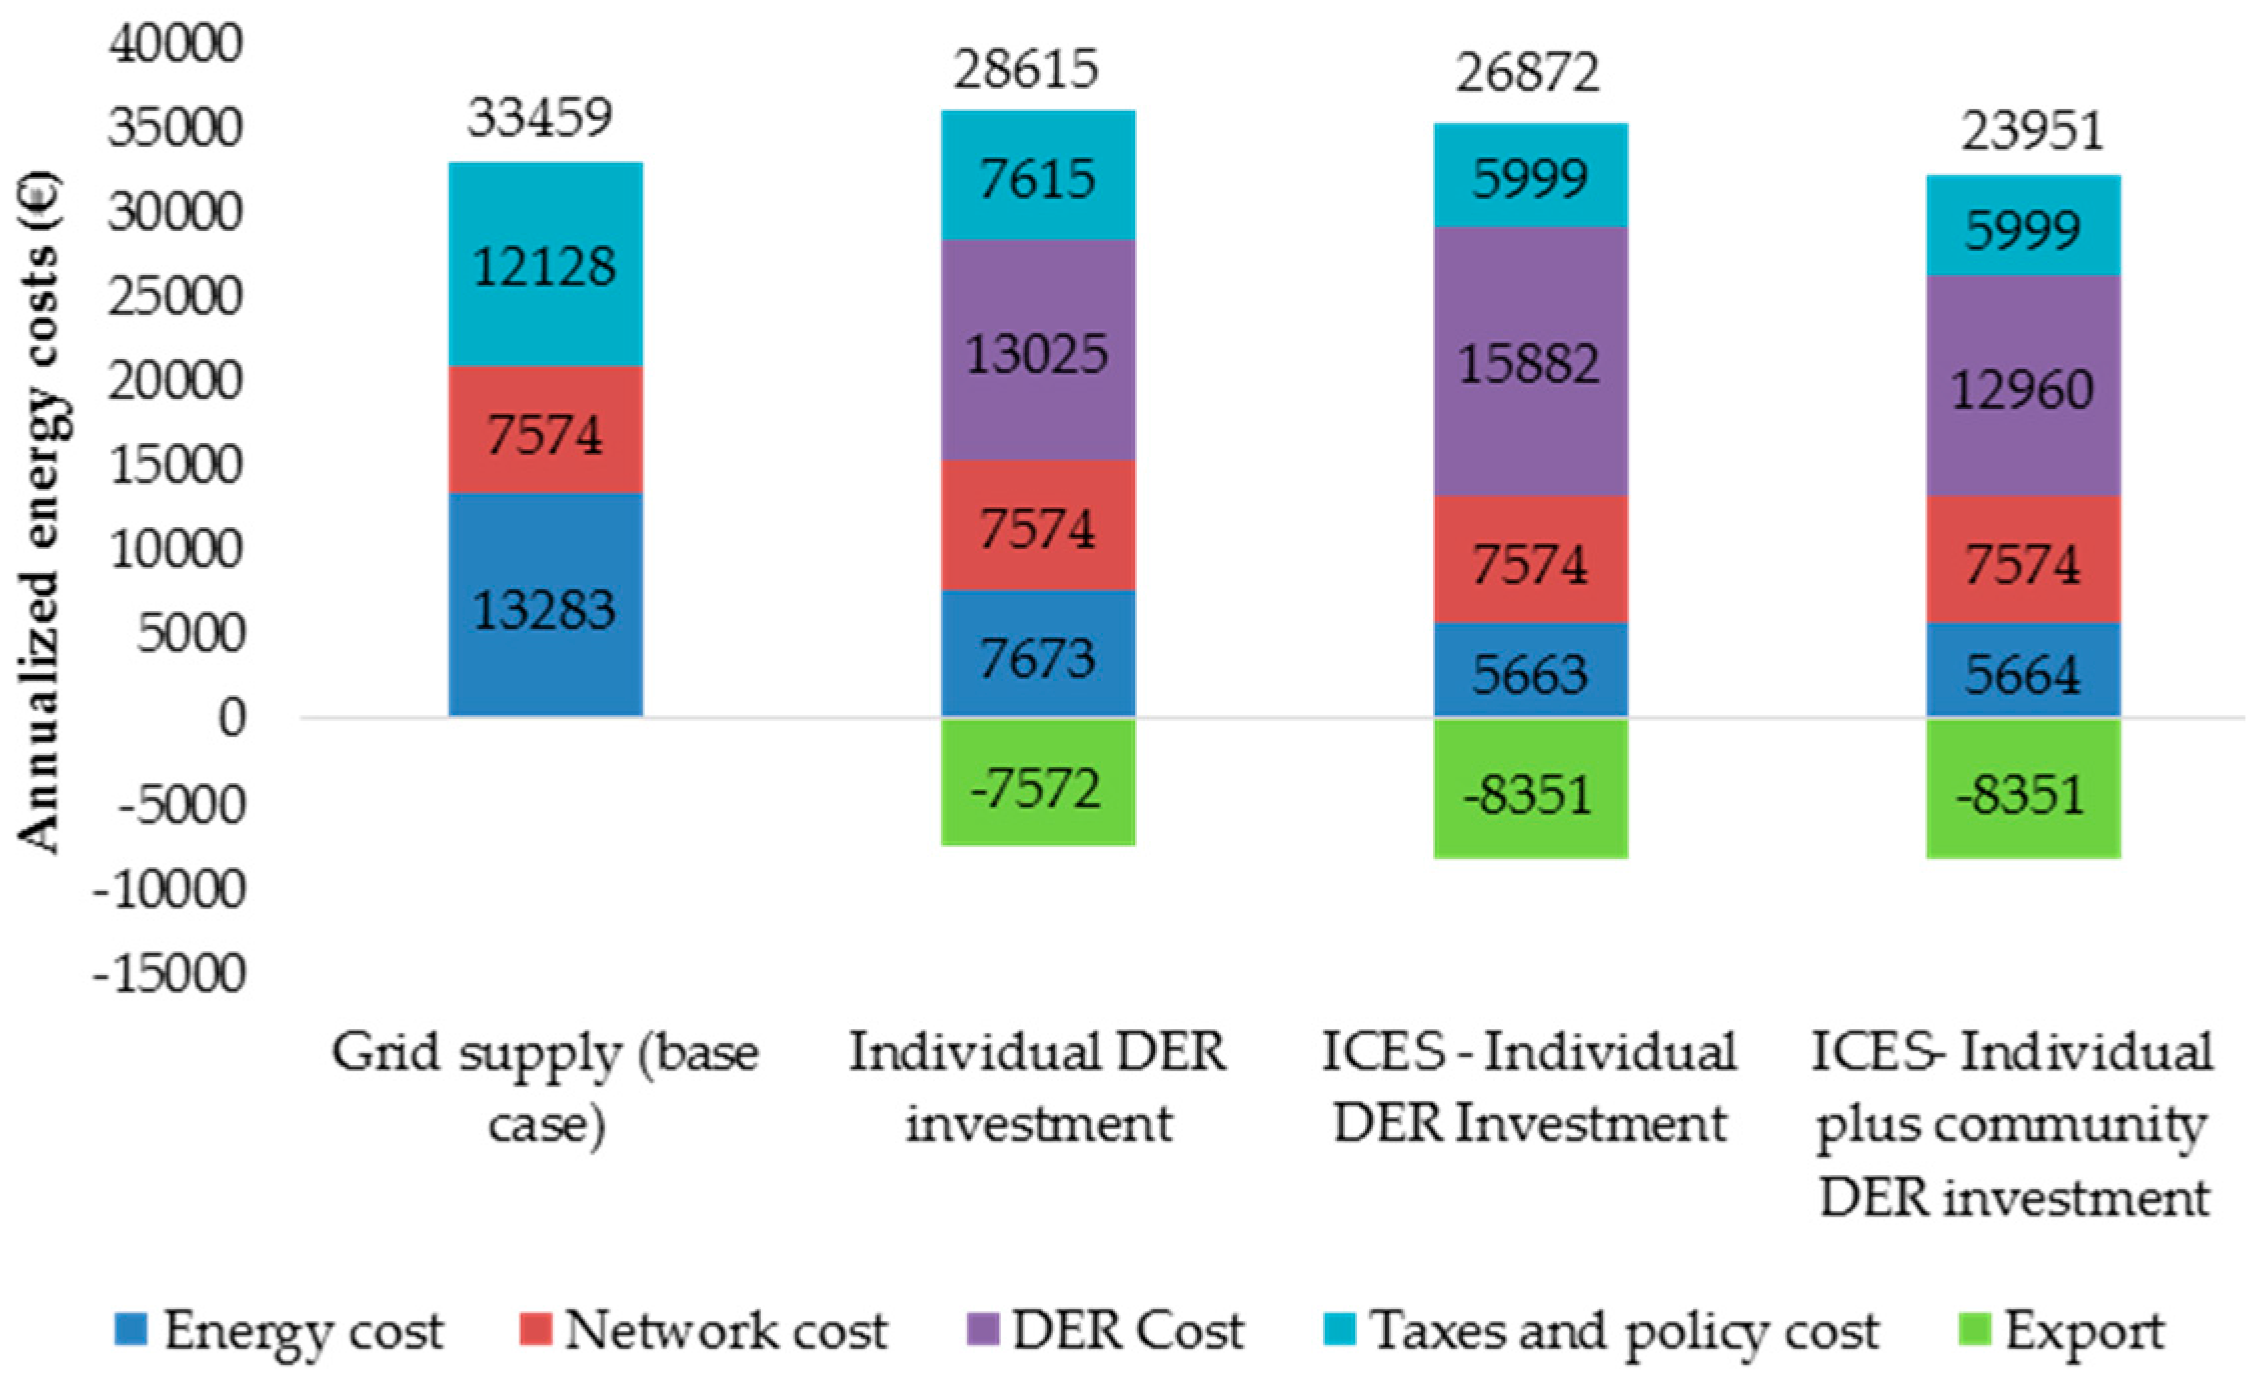
Figure 8 represents detailed results of all four grid-integrated case studies. Although the major energy cost saving comes from technological change from natural gas-based heating systems to HPs and self-consumption, savings in policy costs and taxes are also significant. As the Dutch system of prices and charges uses fixed costs for network costs and suppliers’ margins as presented in
Table 1, no savings are possible in these categories through implementation of a grid-integrated ICES. The DER costs are a major component in a grid-integrated ICES.
6.3.3. Effect of Community Size
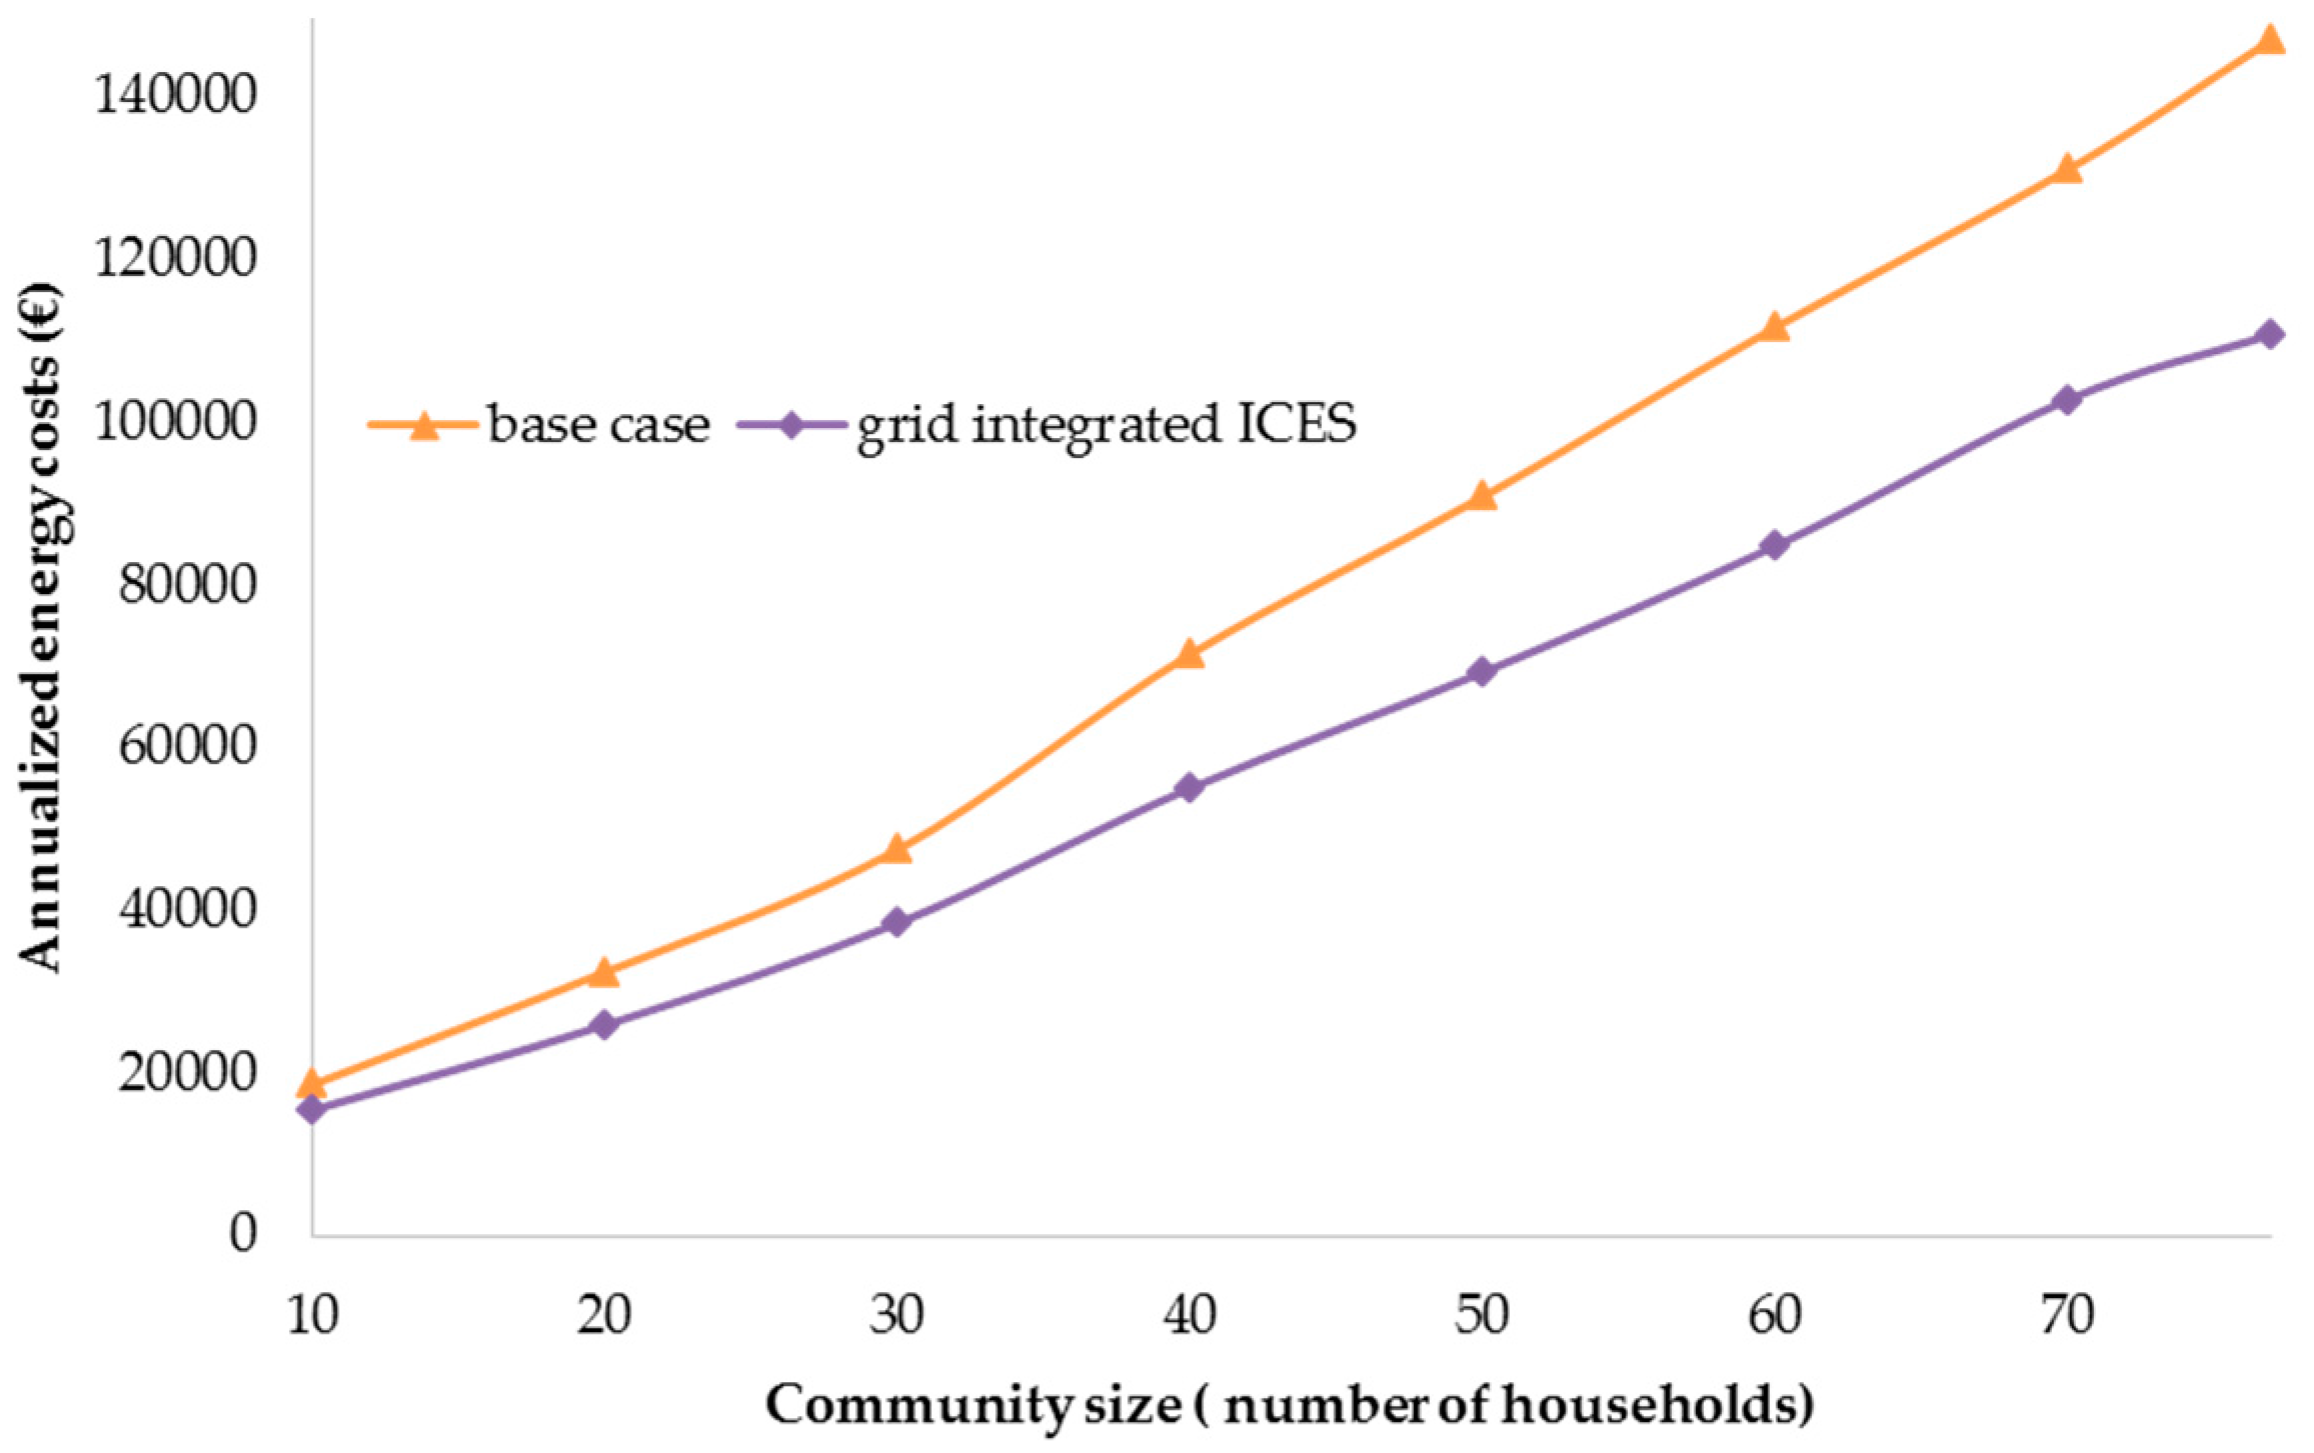
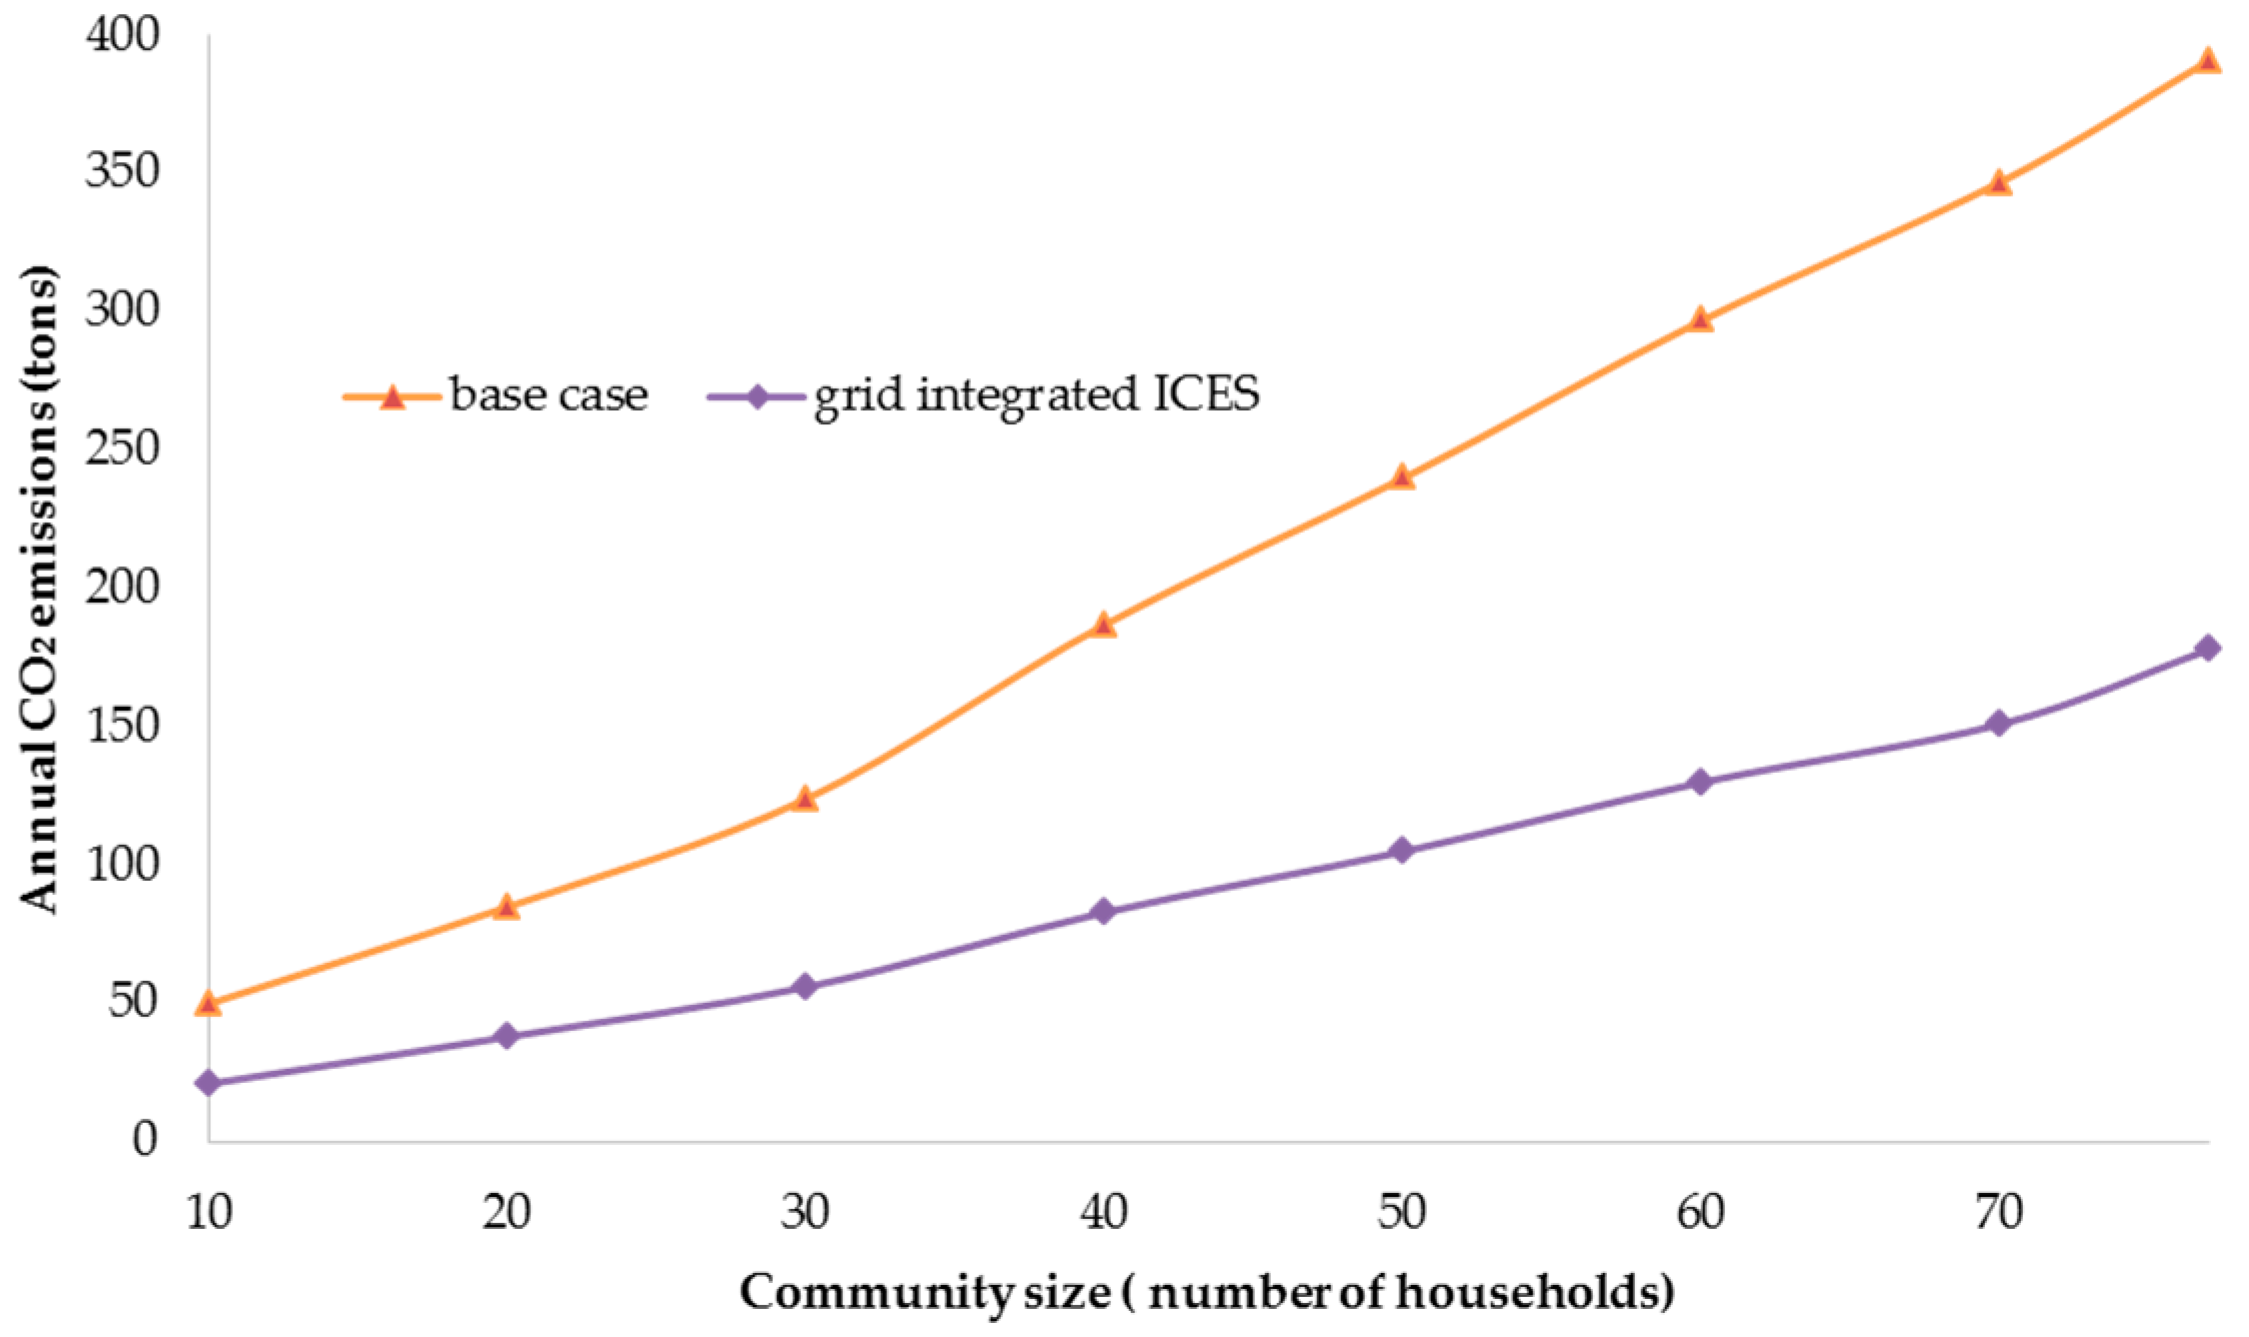
The household DER investment depends on household demand as well as the possibility of local exchange within ICESs. For the grid supply baseline and the grid-integrated ICES with individual DER investment, the annualized total energy costs and CO
2 emissions evolutions with increasing community size are presented in
Figure 9 and
Figure 10, respectively. The derivative of total energy costs and CO
2 emissions decreases more rapidly with increasing community size. The CO
2 emission reduction is much more significant compared to the reduction in the total energy costs. However, this is highly subjected to the invested technology-mix of solar PV and HPs. As various DERs such as energy storage, fuel cells and micro-wind with diverse generation hours are invested, higher local exchange is expected. This can significantly impact the trend on total energy costs and CO
2 emissions.
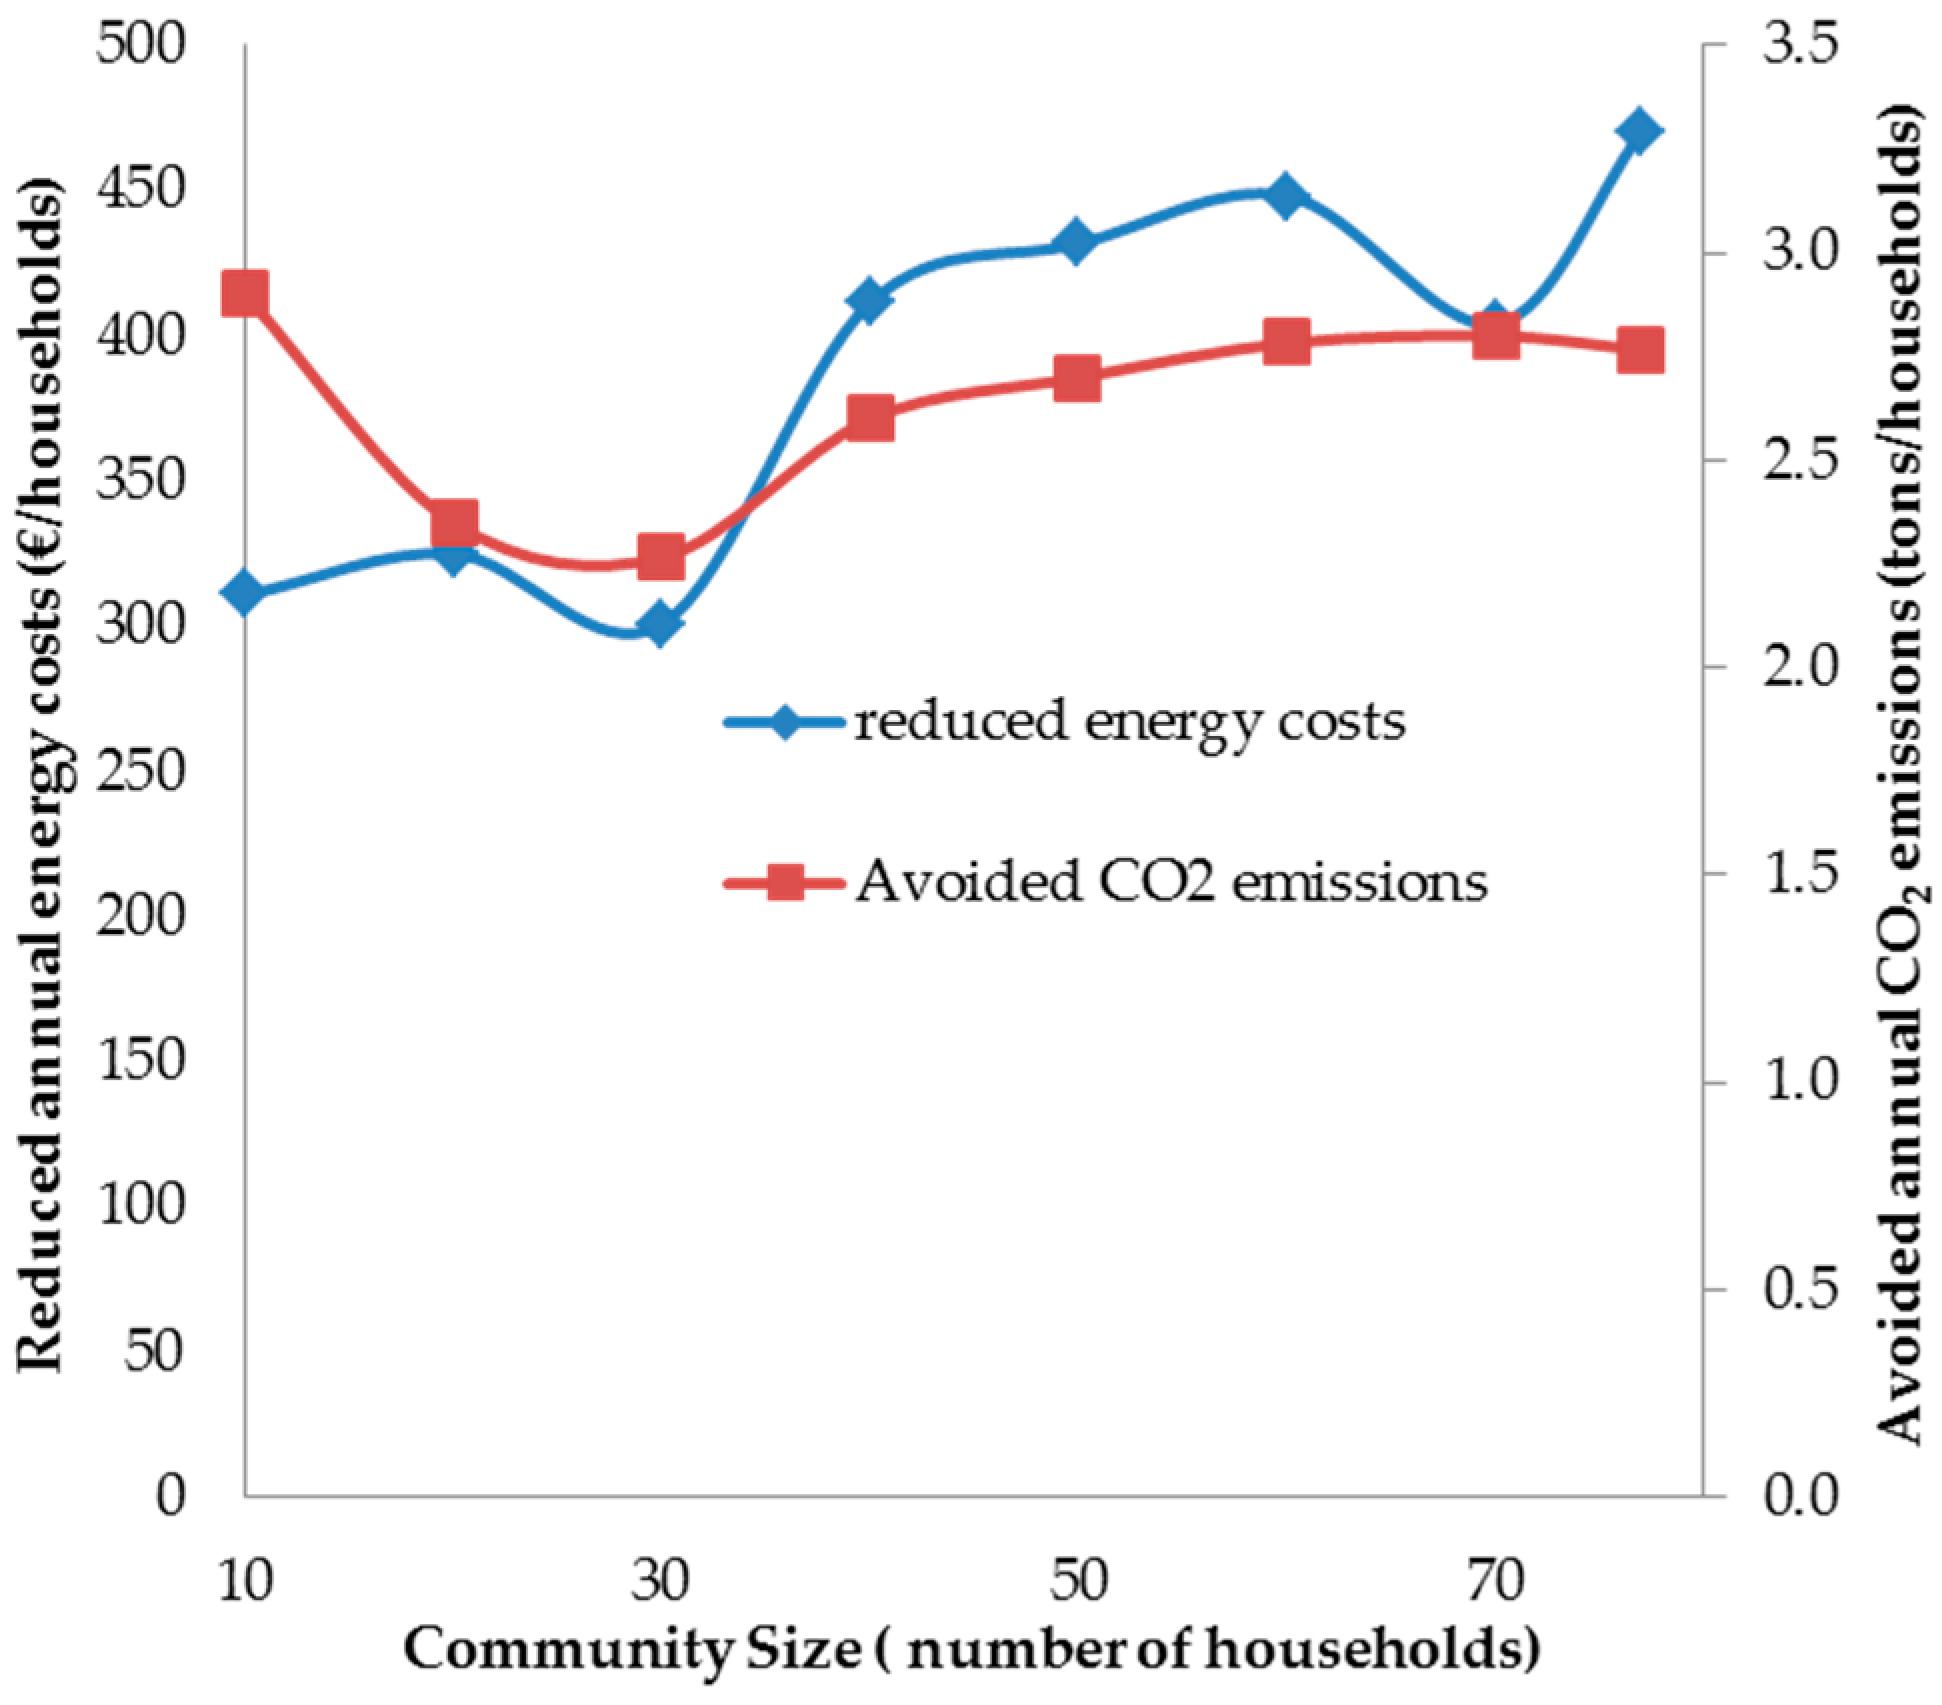
In
Figure 11, the reduced annual energy costs and avoided annual CO
2 emissions are the difference between the base case and the grid-integrated ICES with the individual DER investment case divided by the number of households. Unlike
Figure 9 and
Figure 10, the non-linearities in reduction in total energy costs and CO
2 emissions per households with increasing community size is observed. In general, the total benefit per household increases with increasing community size whereas the avoided CO
2 emission per household also increases slightly. These non-linear trends can be explained as follows. The household demand profiles considered in this study are measured data and therefore are not homogeneous. In addition, the investment in roof-top PV constrained by space availability introduces further non-linearity. As only individual household investments are considered in this particular case, the economies of scale are limited. Due to the small area, the stochasticity in generation and demand profiles are also limited. To conclude, the economic and environmental benefits of the increasing community size is not evenly distributed and cost and benefit allocation should be designed based on local conditions.
6.3.4. Sensitivity Analysis
The present energy landscape is changing [
19,
22,
61]. The customers are expected to be more flexible in the future [
62,
63,
64]. The capital costs of DERs, especially solar PV and electric storage are falling more rapidly [
19,
65]. The CO
2 prices are expected to increase [
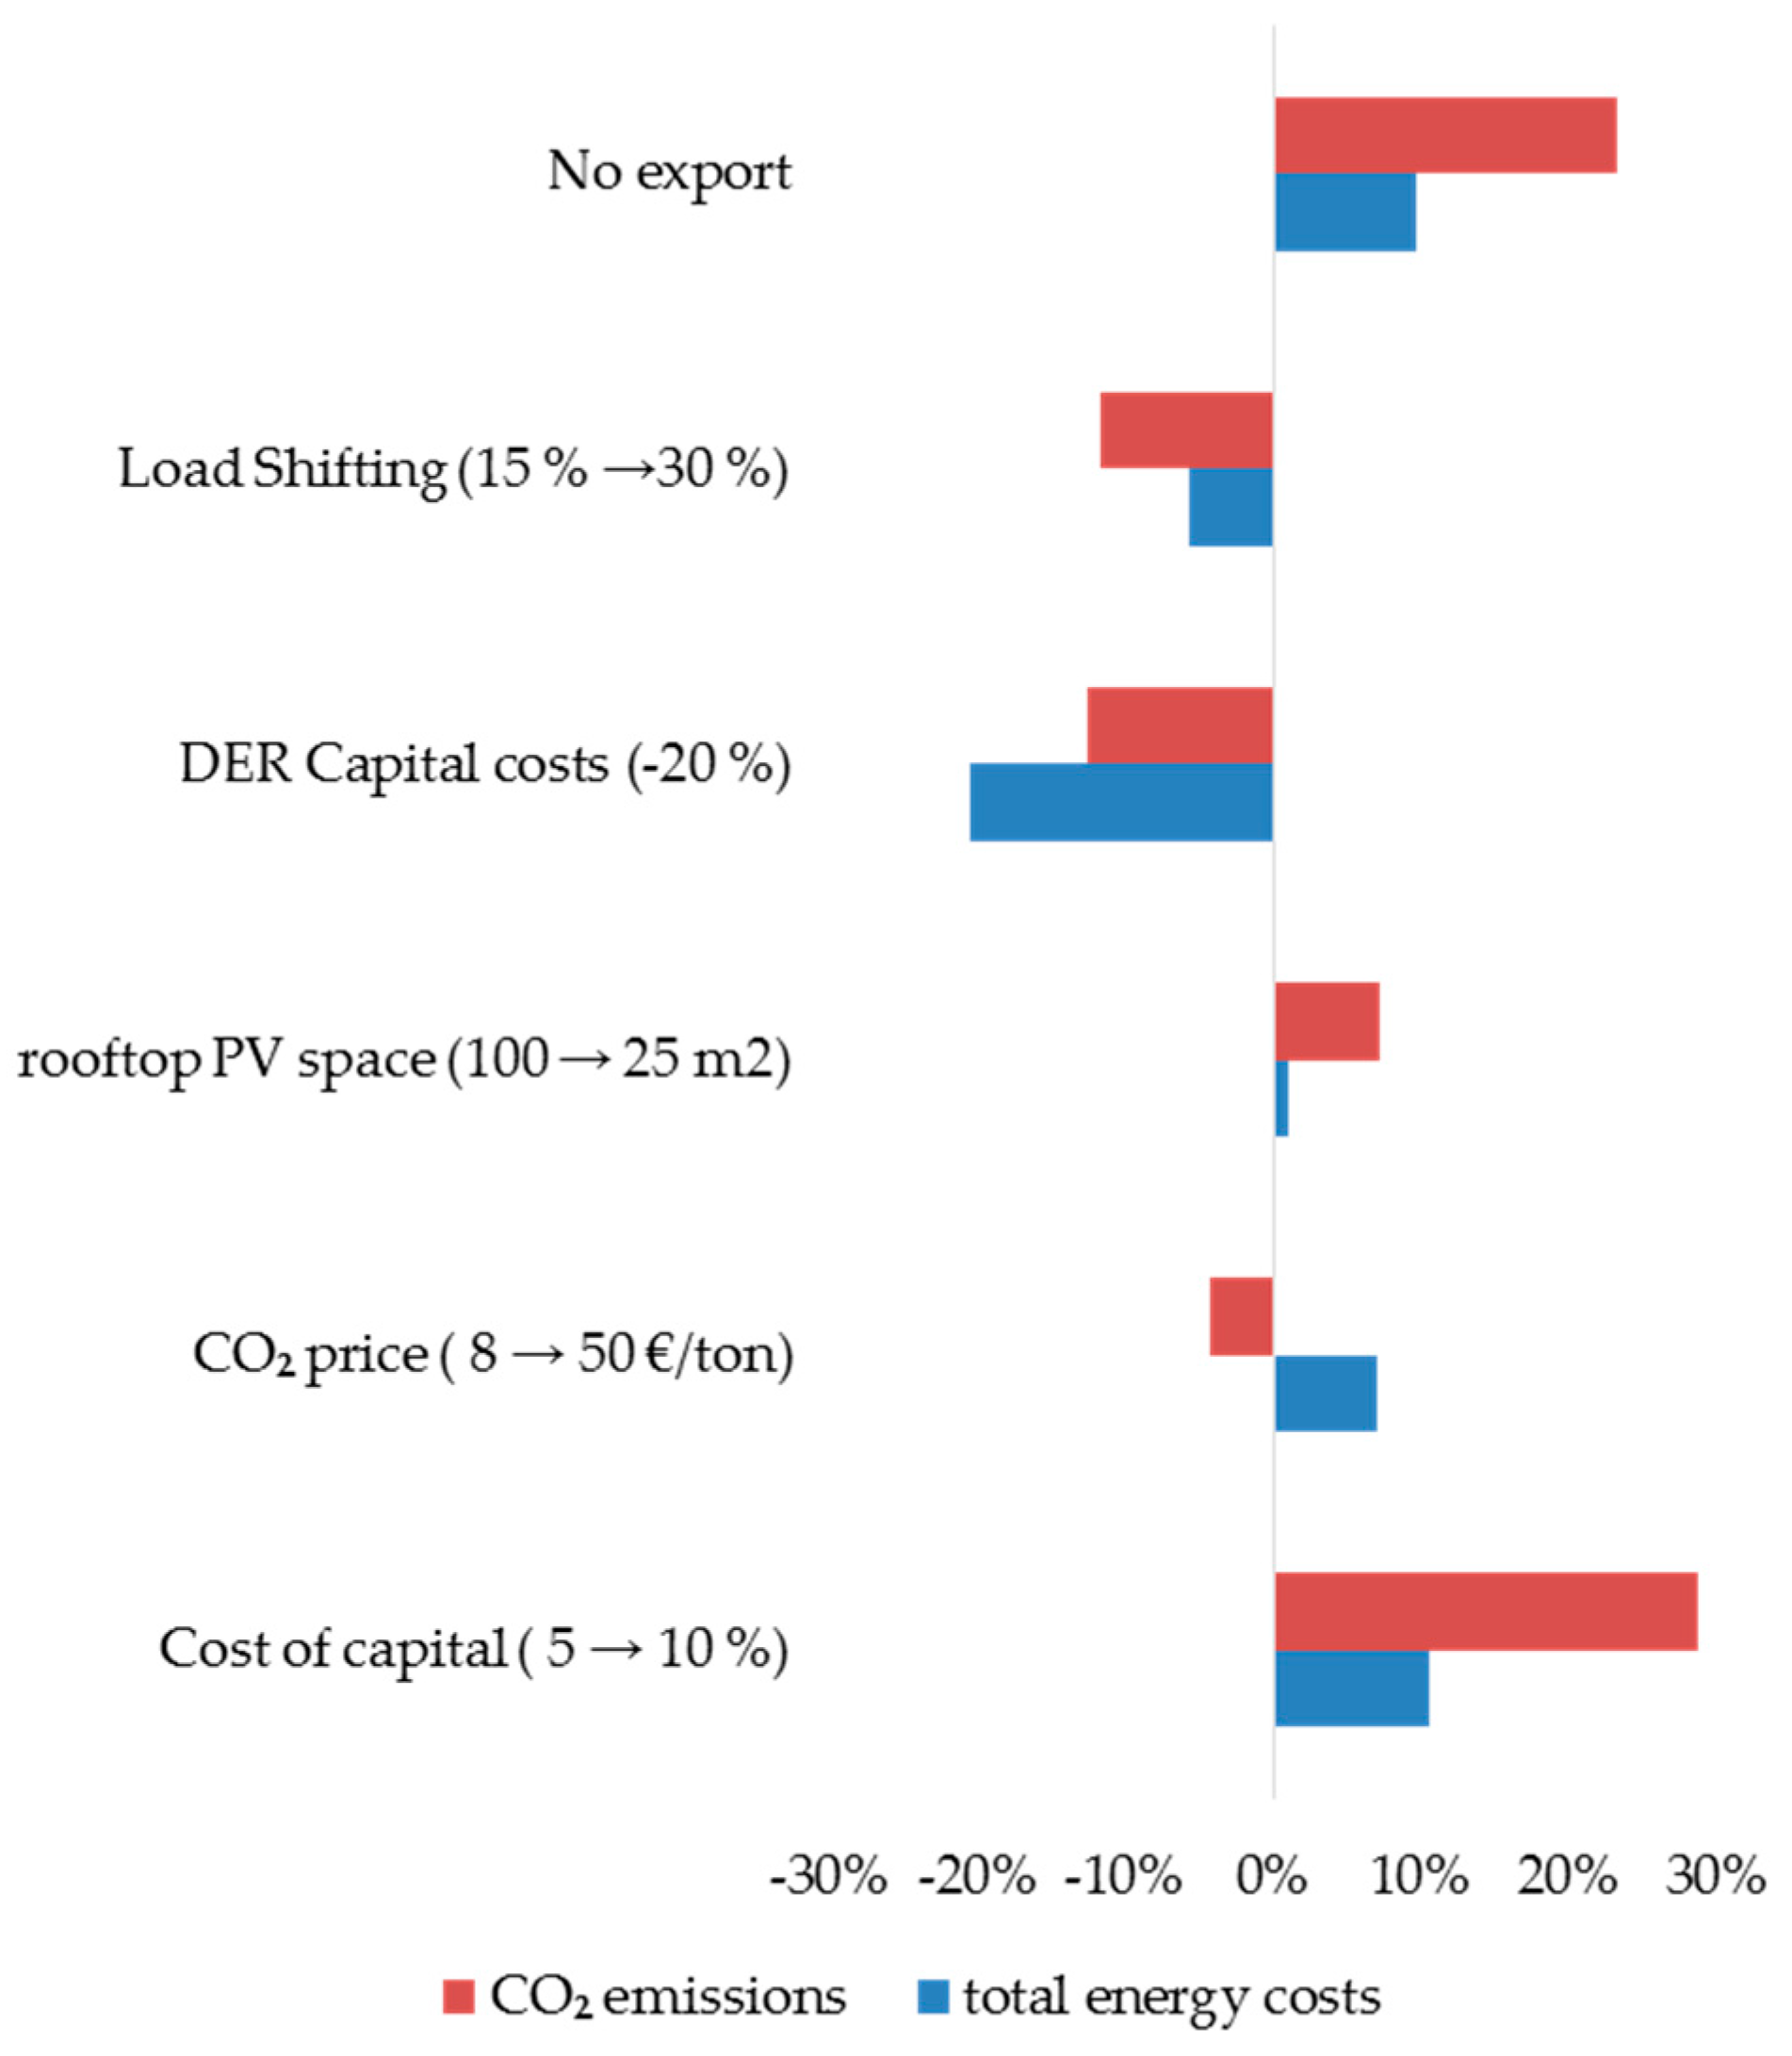
66]. Moreover, in urban areas, limited space is available for the DERs installation. To address the changing energy landscape, a sensitivity analysis for some of the parameters assumed in this research is performed.
For illustration, a grid-integrated ICES with individual DER investments case with annualized total energy cost of 26,872 € and total annual CO
2 emissions of 32.9 tons is further analyzed.
Figure 12 shows the result of a sensitivity analysis in terms of percentage deviations in annualized energy costs and CO
2 emissions. For example, increasing the cost of capital by 5% will increase the total energy costs and the total CO
2 emissions by 10% and 29%, respectively. The higher cost of capital leads to higher investment costs and the lower investment in DERs. Accordingly, the import from the grid will be higher and the export to the grid will be lower, leading to the higher total energy costs and CO
2 emissions. If exporting the excess energy to the market or neighboring energy communities via the grid is not an option, the ICES loses the revenues from the export. This leads again to the lower investment in DERs, increasing the total energy costs and CO
2 emissions by 9% and 23%, respectively. There is widespread consensus that in order to have a significant contribution to the climate policy, the CO
2 price or tax should be very high. Increasing CO
2 tax from 8 €/ton to 50 €/ton will increase total energy costs by 6% and reduce CO
2 emissions by 4%. This can be explained by higher investment in low-carbon DERs leading to the higher energy costs and the lower CO
2 emissions. The decrease in capital cost makes investment in DERs more attractive. For example, 20% decrease in capital costs of DERs will reduce total energy costs and CO
2 emissions by 19% and 13%, respectively. This can be attributed to the avoided energy costs for import from the grid and the higher revenues through export of the excess energy. At the same time, the ICESs members are considered to be more energy conscious due to their engagement in the development and operation of the local energy system. The possibility of further 15% load shifting within the ICES will reduce the total energy costs and CO
2 emissions by 5% and 12%, respectively. This can be explained by flexibility within ICESs leading to the higher local exchange and lower import during peak hours.
The decrease in capital costs has more impact than performing the load shifting, as the former reduces both the import and increases the export of energy whereas the latter only reduces the energy cost by less import during peak hours and more local energy exchange. Moreover, among the considered parameters in this analysis, the performance metrics are more sensitive to input parameters such as DER capital costs, cost of capital and export options as these parameters can directly impact the amount of DERs invested in the ICES.
6.4. Grid-Defected Integrated Community Energy System
More communities are willing to take complete control of their energy systems. Some of these energy communities might decide to defect from the grid for non-economic reasons such as energy independence, higher CO2 emissions reductions than the centralized system, self-governance and other local preferences. For further analysis, we use a grid-defected ICES with an individual plus community DER investment case.
6.4.1. Investment and Operation
In the case of grid defection, all the community energy demand has to be met locally. Therefore, more and diverse technologies are invested in the grid-defected ICES compared to the grid-integrated ICES case. In the grid-integrated case the DERs invested are community PV (168 kW) and air-source HPs (0.24–1.1 kWe) whereas in the case of the grid defection, the DERs invested are community PV (1274 kW), household and community storage (1660 kWh), air-source HPs (0.4–1.5 kWe) as well as electric vehicles (16–38 kWh), for details see
Table 3 and
Table 5 respectively. The electric vehicles are used in this case as an alternative form of energy storage and the driving behavior is not considered. For environmental reasons, we do not consider the option of a back-up diesel generator either.
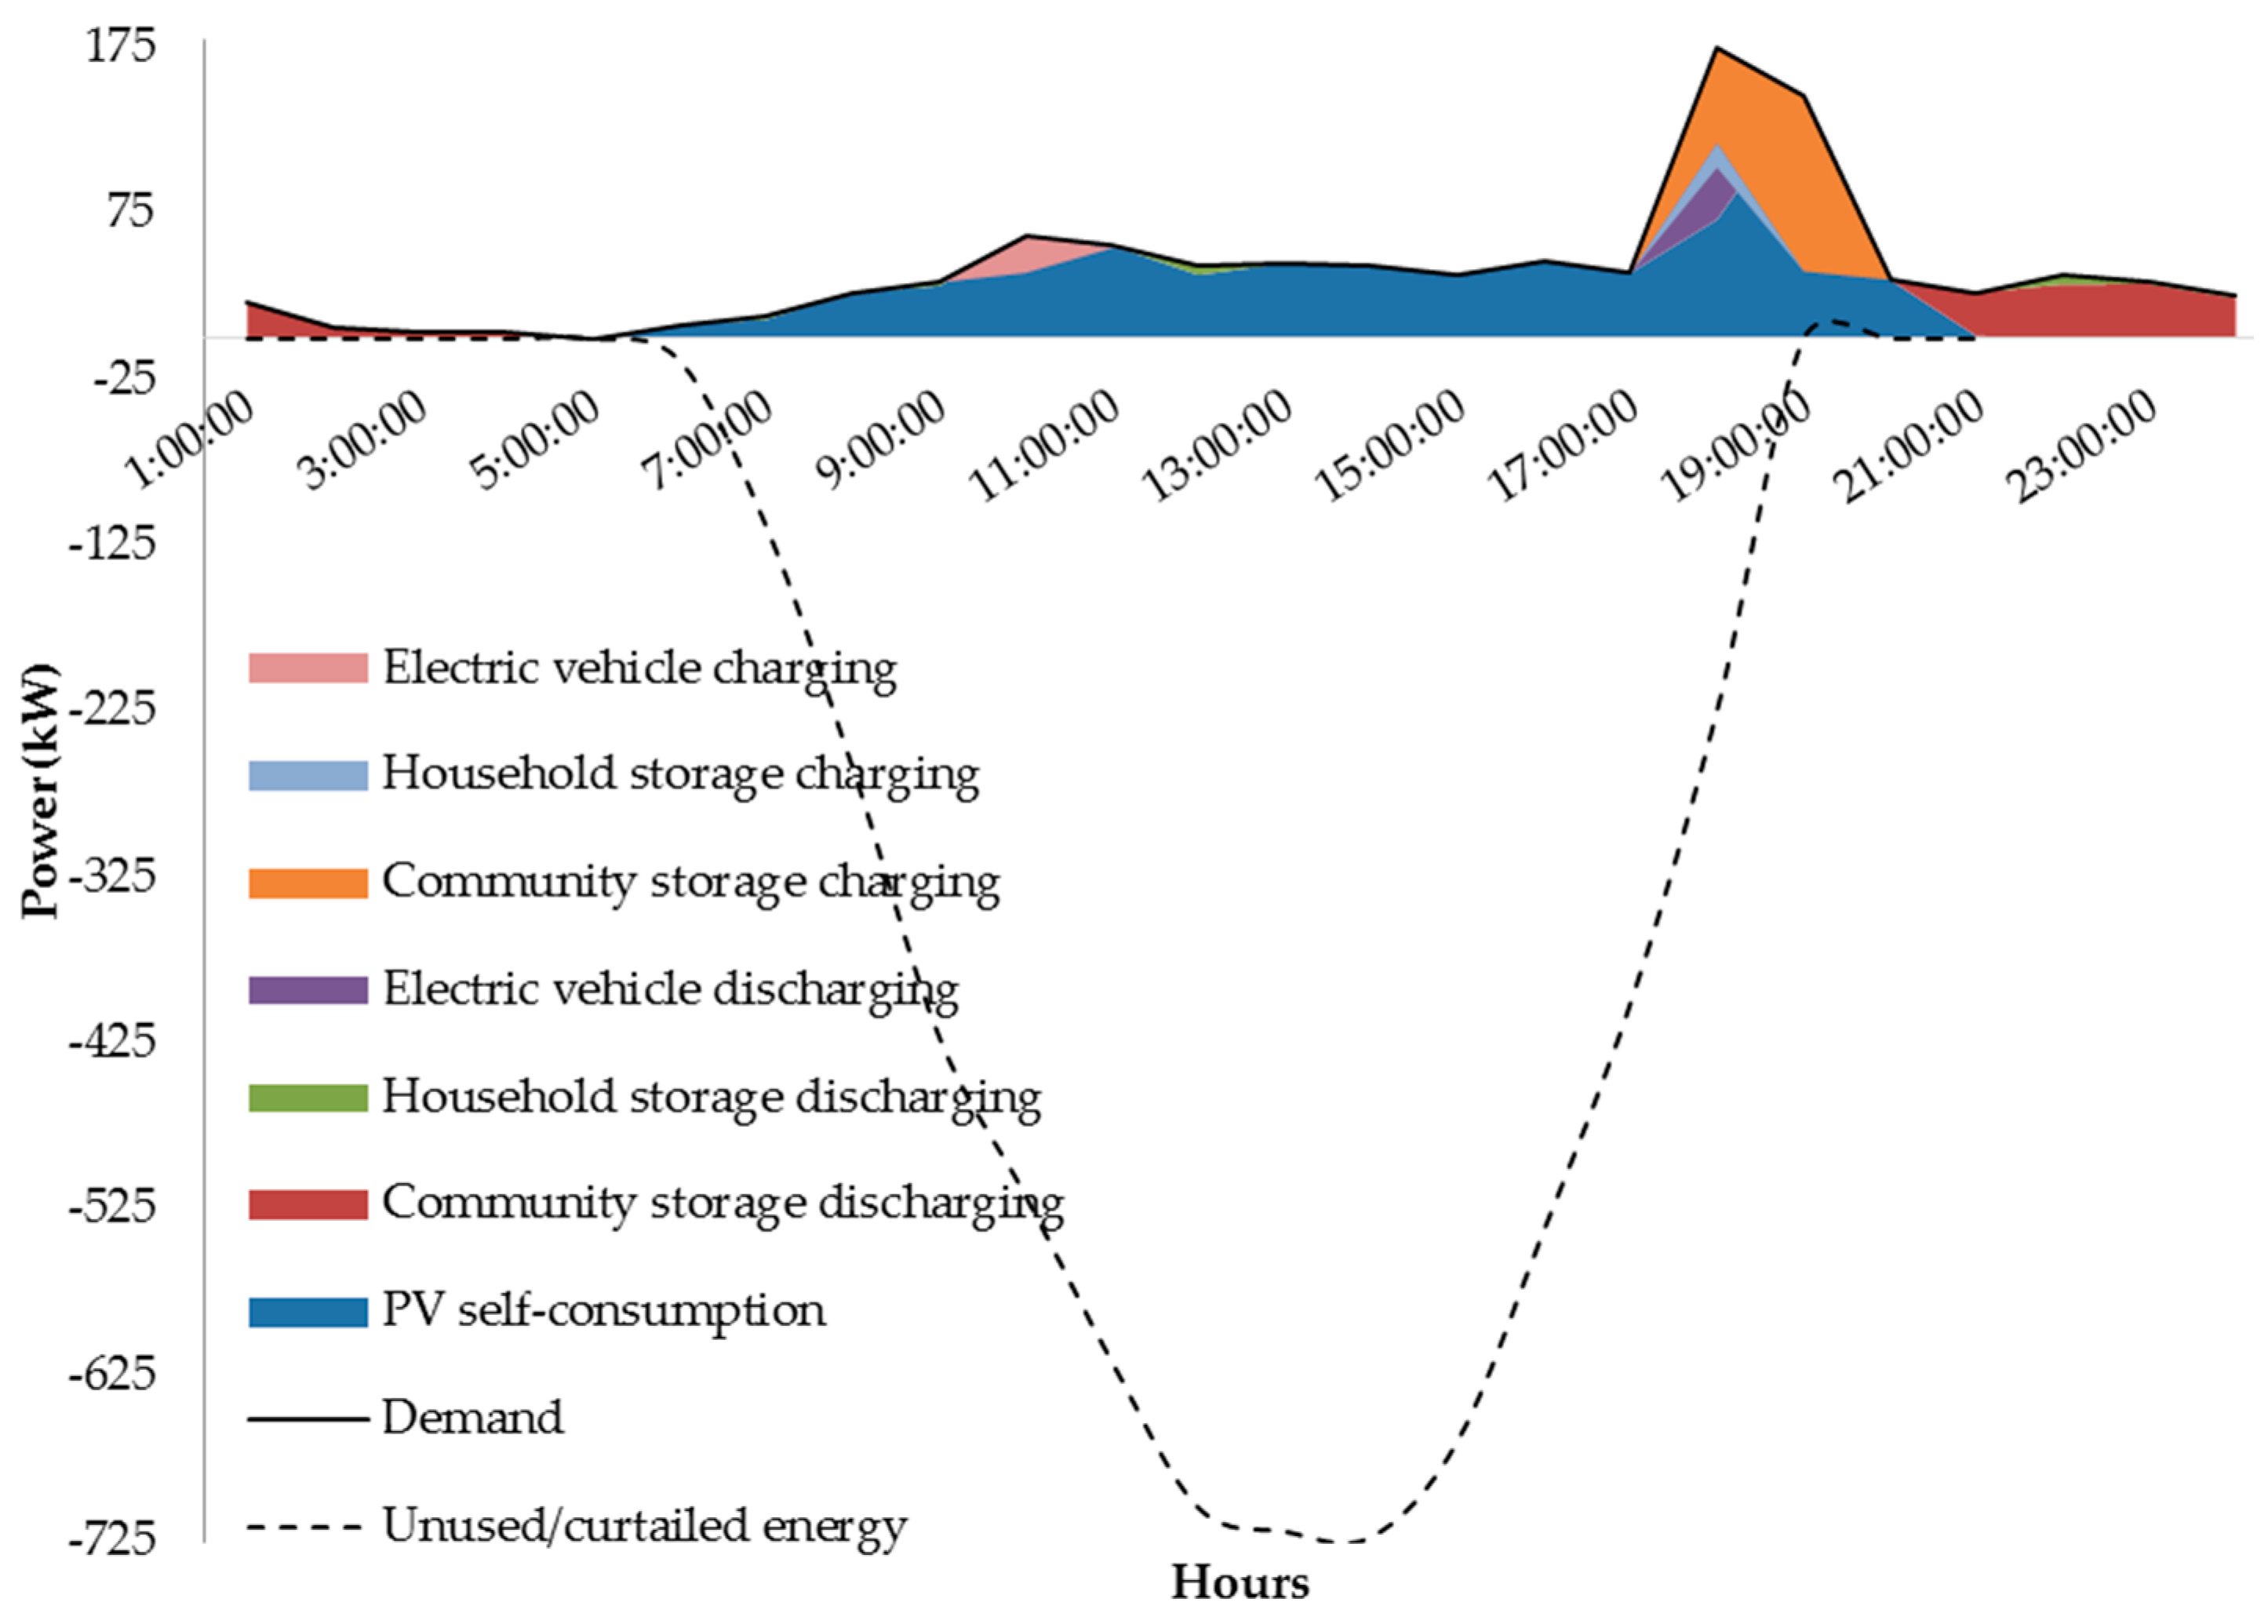
The reliability is defined as the ratio of supplied energy to the total demand. Lower energy costs are expected for the grid-defected system with lower reliability but consumers have to compromise with the comfort of having electricity around the clock. Non-served energy refers to the amount of energy demand not met by the ICESs whereas unused energy refers to surplus energy not absorbed within ICESs and which has to be curtailed, as exporting to neighboring communities or the national grid is not an option due to the absence of a physical connection. In the case of grid defection, the amount of unused energy is significant. For example, in this particular case, 400,298 kWh of unused electricity has to be curtailed annually which is 6.6 times higher than the annual electricity demand for the whole community. This can be attributed to the oversized DERs in comparison to the grid-integrated case. The grid-defected ICES implies an oversized and rather expensive local energy system with long periods of unused energy from renewable sources to be curtailed, as emphasized in
Figure 13. However, this situation can change with a more diverse technology-mix.
6.4.2. The Economics of Grid-Defected Integrated Community Energy Systems
Table 6 presents total energy costs and CO
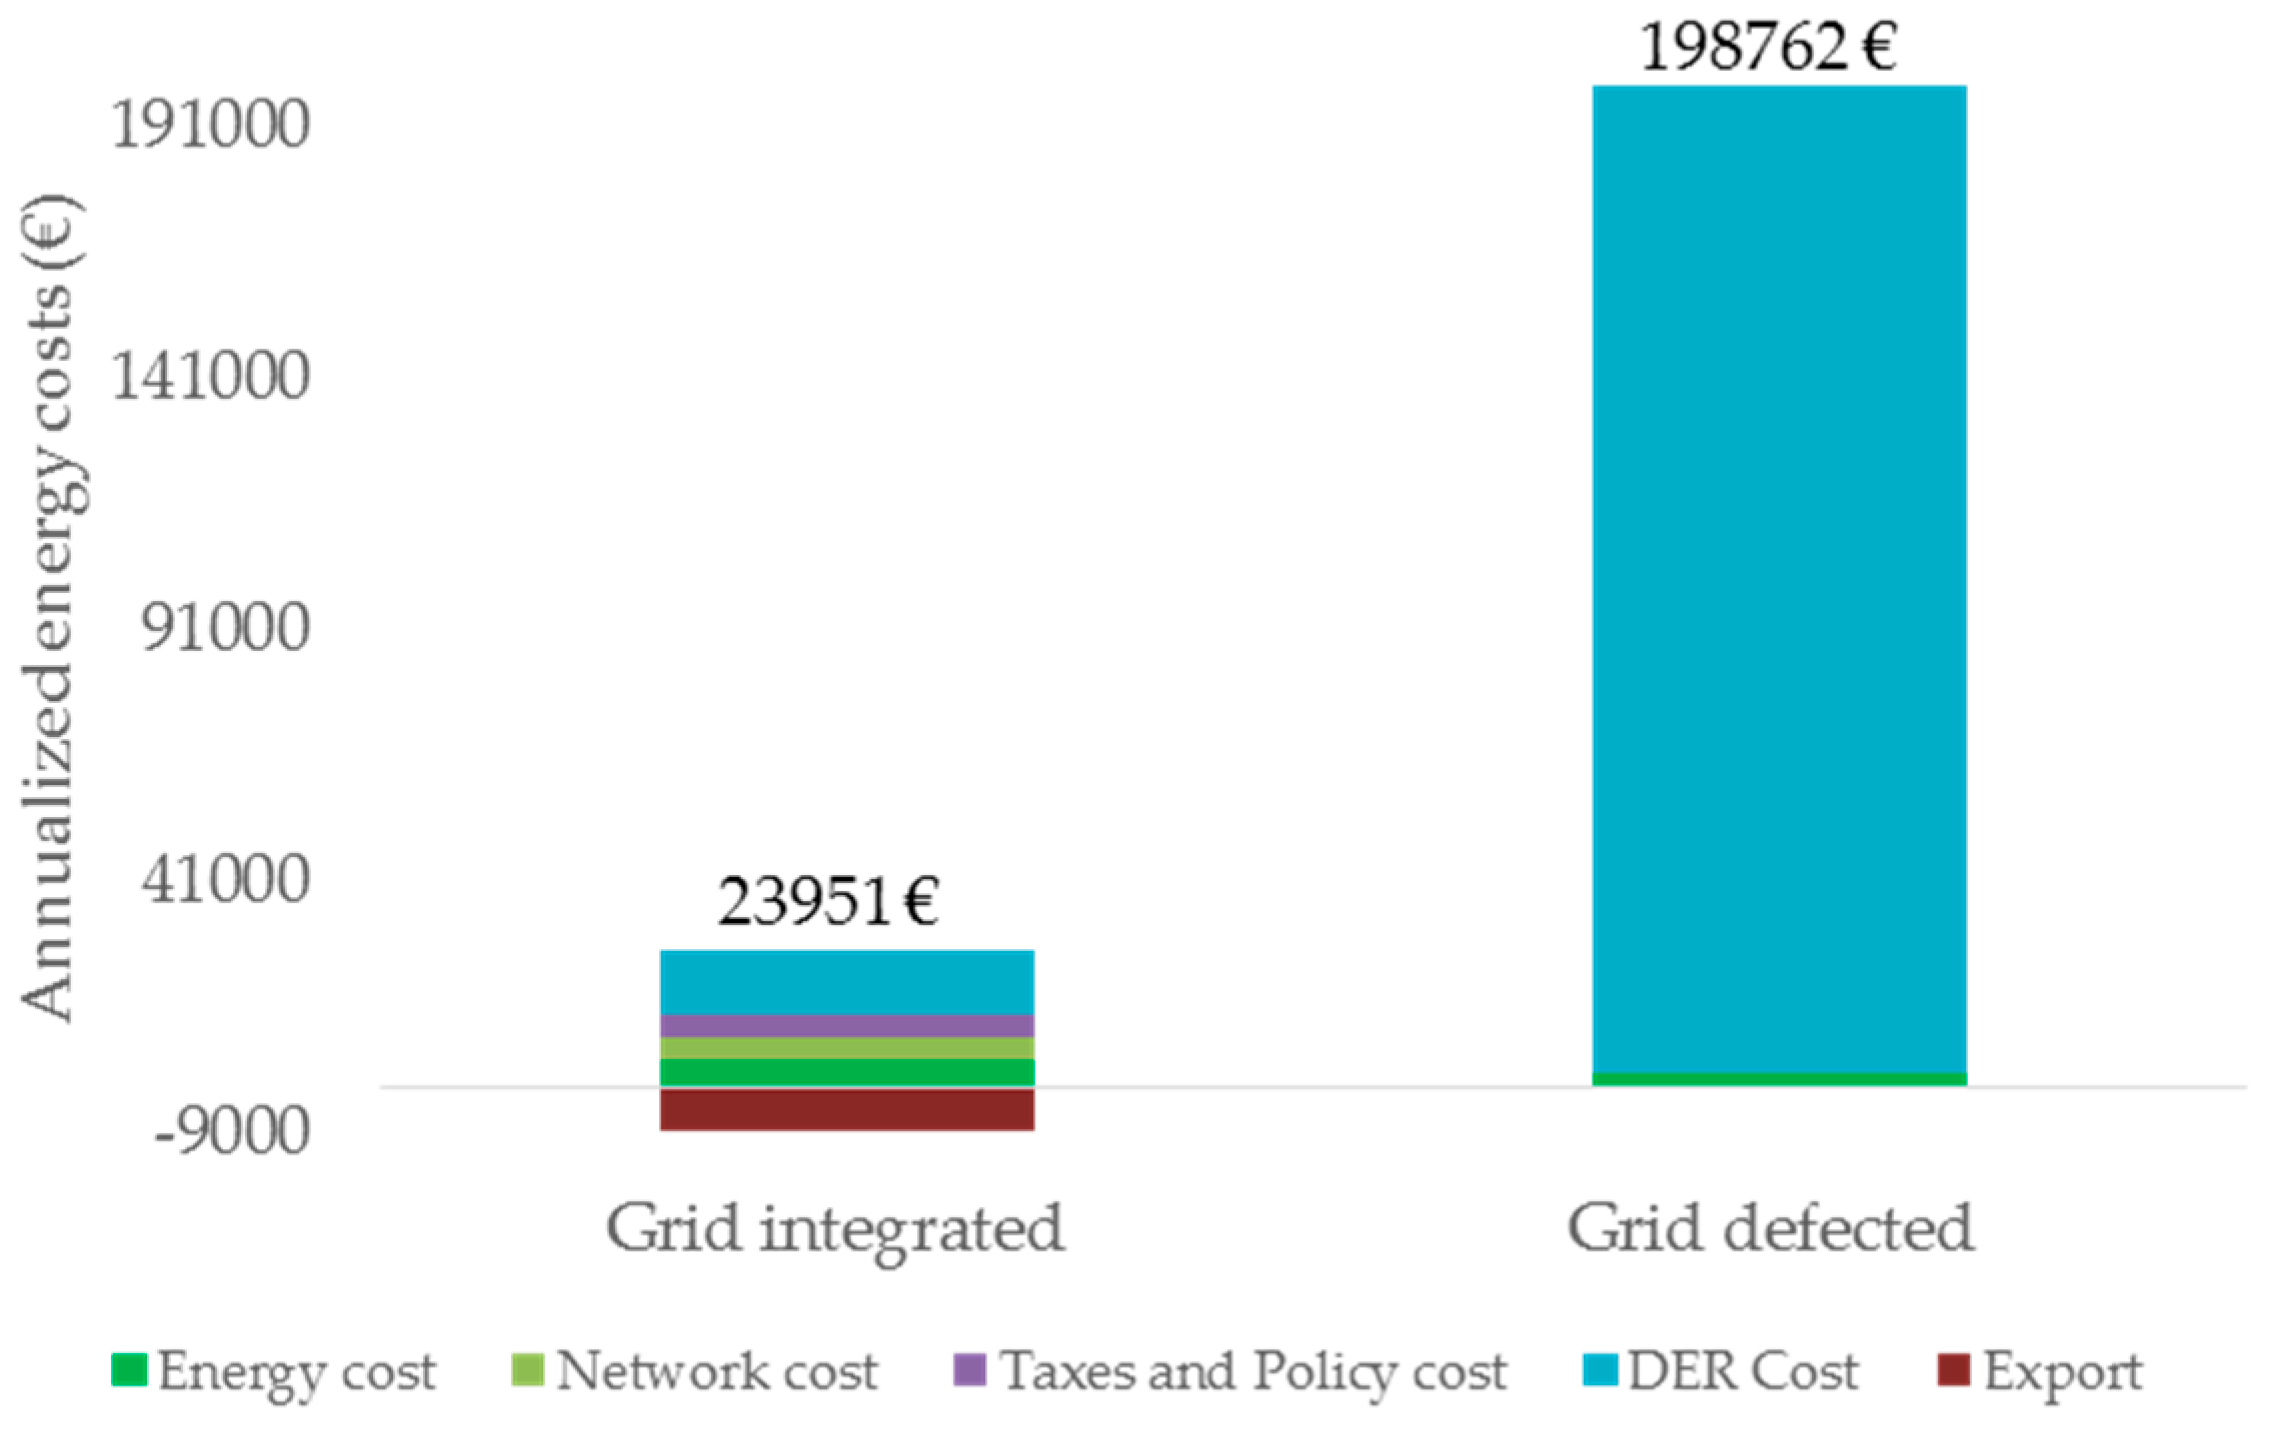
2 emissions for the grid-integrated and the grid-defected ICES case with individual plus community DER investment. Under current DER economics, the grid-defected case is 8.3 times more expensive than the grid-integrated case. However, further CO
2 emission reduction of 58% is achieved in the grid-defected case compared to the grid connected case.
Figure 14 presents a detailed cost breakdown for both the grid-integrated and the grid-defected cases for the ICES with individual plus community DER investments.
As seen in
Figure 14, grid-defected ICESs are not yet economically rationale. The grid defection might still make economic sense if there is a huge network connection or reinforcement costs and lower investment costs for energy storage. For grid-defected ICESs to be economically feasible, they might have to be connected back to the grid so that the unused or curtailed energy can be marketed to the neighboring communities and the energy markets or used to provide system services for the whole energy system [
19]. In this case, the system will be self-sufficient on the demand side but will still depend on the network to transfer the surplus energy. The energy community in Feldheim, Germany is the prime example for this case. The Feldheim energy community is self-sufficient in terms of demand and only consumes 1% of total generated energy, selling 99% of the energy to other market parties [
67].
7. Conclusions
In this research, ICESs are conceptualized and assessed as an alternative for local energy supply. ICESs can operate in a grid-connected and grid-defected mode based on community objectives. Local communities can optimize their energy system based on onsite conditions, energy prices, and available DER technologies. A model-based framework considering benefits and costs to assess the value of grid-integrated and grid-defected ICESs is presented. The proposed modelling framework can establish the value of ICESs in the changing local energy landscape. The study focuses on economic and environmental benefits from the community perspective and proposes the community annualized energy cost and the annual CO2 emission metrics as main performance indicators.
Under current Dutch energy prices and charges, grid-integrated ICESs are already an attractive option over solely grid-supplied alternatives, both in terms of reducing energy costs and CO2 emissions. The total energy costs and CO2 emissions are found to be more sensitive to input parameters which directly impact the optimal size of the DERs installed in the ICES, such as DERs capital costs, cost of capital and possibility to sell excess energy. Diversity of demand, as well as generation profiles among the households within the ICES, leads to the increased local exchanges reducing energy losses in comparison to importing energy from the system. An analysis on effect of community size reveals that the benefits of ICESs in terms of costs and emissions are highly dependent on demand profiles of the households in the community size considered.
Moreover, there could be a spill-over effect of the ICES savings on the remaining customers of the whole energy system, such as paying less taxes and policy surcharges. At the same time, these communities already contribute toward energy policy goals through local investment. The growth of DERs in general and the ICES in particular might affect all actors of the energy system alike. It is important to prevent opportunistic aggregation and free rider behaviours that avoid paying system costs which otherwise should be recovered through other market agents. Moreover, the benefits of the grid-integrated ICES are highly subjected to the system of prices and charges as well as institutional settings available for their operation.
With respect to grid defection, it is far from being economically rationale over grid-integrated options. Reliability and permanent local energy balance need leads to more diverse but over-sized grid-defected renewable systems with a very high unused energy to be curtailed. At the same time, if the unused energy in the grid-defected case can be marketed to the neighboring communities and the energy markets or used to provide system services for the whole energy system, the economics of the ICES might improve as well. In this case, the system could be self-sufficient on the demand side but will still depend on the network to transfer the surplus energy. The energy community in Feldheim, Germany is a very good example for this particular case.
Under current energy prices and charges, it is more likely to have grid-integrated communities than grid-defected communities. Future research should establish a system of prices and charges for the efficient local exchange in ICESs. An assessment on a grid defection alternative should be performed for cases requiring significant network connection or re-enforcement costs. To prevent inefficient grid defection, network and sunk system costs recovery should be carefully addressed.
In future, with an increasing need for flexibility in the whole energy system, surplus energy from both grid-integrated or grid-defected ICESs might be traded in different energy markets or used in providing different energy services. This is expected to positively affect the economics of both grid-integrated and grid-defected ICESs. This emphasizes the important role of the grid in enabling future energy systems, such as ICESs. Further improvement in the economics of the ICES can be expected, as the energy storage costs decrease, more storage technologies become available, and their different energy services is utilized.
Integrating multiple local generation, storage, energy efficiency and demand management systems not only provides higher economic benefits for ICESs but also would enable them to play a more active role in achieving low-carbon growth. An ICES offers more than the low-carbon transition; it improves efficiency, strengthens security of supply and empowers local customers. Moreover, due to challenges in ICESs operation such as joint investment, joint decision making, and fair allocation of costs and benefits among members, it might be challenging to capture all the benefits of ICESs demanding an appropriate institutional design of such systems. This research will certainly help in understanding the role of ICESs in the future energy systems which can be useful in decision support as it can help to ensure necessary precautions as well as arranging suitable institutions for low-carbon transformation of the local energy systems.


 ,
, 

